The Restructuring and Privatisation of the Electricity...
40
1 The Restructuring and Privatisation of the Electricity Distribution and Supply Businesses in England and Wales: A Social Cost Benefit Analysis. 1 Preetum Domah Queens’ College University of Cambridge CB3 9ET, UK E-mail: [email protected] and Michael G.Pollitt Judge Institute of Management Studies University of Cambridge CB2 1AG, UK E-mail: [email protected] July 2000 1. Introduction 2 The electricity supply industry (ESI) in the United Kingdom can be broadly separated into generation, transmission, distribution and supply. Prior to privatisation in England and Wales (E&W), the Central Electricity Generating Board (CEGB) was responsible for generation and transmission, and the 12 regional electricity Area Boards (ABs) for distribution and supply. At privatisation the 12 Regional Electricity Companies (RECs) replaced the 12 ABs. Transmission became the responsibility of the National Grid Company (NGC), a company fully owned by the RECs. Distribution and supply were uncoupled to some extent, as a REC can supply electricity outside its franchise area on a payment of a charge for distribution over another REC’s network. Each REC owns and operates the electricity distribution network in its authorised area. 11 The authors wish to thank the twelve regional electricity companies and participants at the ‘regulation’ seminar in Cambridge. We acknowledge detailed comments from Alex Henney, Geoff Horton, Stephen Littlechild and David Newbery. Financial support of ESRC ‘Developing Competition in British Energy Markets’ Project No.R000236828 is acknowledged. Usual caveats apply.
Transcript of The Restructuring and Privatisation of the Electricity...

1
The Restructuring and Privatisation of the Electricity Distribution andSupply Businesses in England and Wales: A Social Cost Benefit
Analysis.1
Preetum DomahQueens’ College
University of CambridgeCB3 9ET, UK
E-mail: [email protected]
and
Michael G.PollittJudge Institute of Management Studies
University of CambridgeCB2 1AG, UK
E-mail: [email protected]
July 2000
1. Introduction2
The electricity supply industry (ESI) in the United Kingdom can be broadly separated
into generation, transmission, distribution and supply. Prior to privatisation in England
and Wales (E&W), the Central Electricity Generating Board (CEGB) was responsible
for generation and transmission, and the 12 regional electricity Area Boards (ABs) for
distribution and supply.
At privatisation the 12 Regional Electricity Companies (RECs) replaced the 12 ABs.
Transmission became the responsibility of the National Grid Company (NGC), a
company fully owned by the RECs. Distribution and supply were uncoupled to some
extent, as a REC can supply electricity outside its franchise area on a payment of a
charge for distribution over another REC’s network.
Each REC owns and operates the electricity distribution network in its authorised area.
11 The authors wish to thank the twelve regional electricity companies and participants at the‘regulation’ seminar in Cambridge. We acknowledge detailed comments from Alex Henney, GeoffHorton, Stephen Littlechild and David Newbery. Financial support of ESRC ‘Developing Competitionin British Energy Markets’ Project No.R000236828 is acknowledged. Usual caveats apply.

2
The distribution systems consist of overhead lines, cables, switchgear, transformers,
control systems and meters to enable the transfer of electricity from the transmission
system to customers’ premises. Supply businesses are engaged in the bulk purchase of
electricity and its sale to customers. Compared to the supply business of, basically,
metering and billing, the distribution business is highly capital-intensive.
The distribution of electricity is an important business activity of the RECs and
typically contributes the majority of their operating cash flow and profits. In 1998
distribution and supply charges accounted for approximately 32% and 13%,
respectively, of a domestic customer’s bill, and distribution has a significant influence
on the overall quality of supply to customers. Analysing the impact of changes in
ownership and the regulatory framework makes economic sense owing to the
potentially large influence that electricity distribution may have on final prices, and the
distribution of gains of losses from these changes.
At the time of restructuring, the Government put in place initial price controls on the
distribution businesses for a period of five years (1990-1 to 1994-5), which typically
allowed for increases in total distribution charges in real terms. Over the period of
these initial controls RECs increased their profits significantly, which were soon to
become a major source of controversy, as it became apparent that the initial price caps
that were set by the Department of Energy were somewhat ‘too’ generous to the
companies. The most important review was in August 1994 when OFFER (the Office
of Electricity Regulation) announced reductions averaging 14% in final electricity
prices to take effect in April 1995.
By 1994 the majority of customers had seen no price benefit from the privatisation
(Henney, 1994). Tariff customers effectively financed the privatisation, while the large
customers lost the benefit of their special agreements. Only the medium-sized 1-5MW
(megawatt) customers had benefited because they avoided having to subsidise British
Coal. Additionally, domestic prices of electricity initially increased, relative to
industrial prices, by about 5% more than expected, with the increase being
2 A glossary of terms is provided at the end of our main conclusions.

3
concentrated in the early years of privatisation and restructuring (Yarrow, 1992).
Newbery and Pollitt (1997) found that taxpayers and shareholders were the
beneficiaries of the restructuring and privatisation (R&P) of the CEGB. They,
however, cautioned on using this result to judge the whole privatisation of the ESI
until the distribution business itself is analysed.
Pollitt performed a social cost benefit analysis (SCBA) for the Northern Ireland ESI
(1997b) and the Scottish ESI (1999) along the lines of Newbery and Pollitt (1997) and
Jones et al. (1994). Green and McDaniel (1998) also used a SCBA framework to
analyse the impact of competition on the ESI in E&W. This paper seeks to review the
performance of the regulated supply and distribution businesses of the RECs in the
E&W ESI since privatisation and evaluates the gains (or losses) from R&P. It also
assesses the distribution of these gains (or losses) to consumers, producers and the
government. A SCBA approach is used to achieve these objectives. The paper is in 7
sections. Section 2 reviews the theoretical perspectives on R&P and provides some
empirical basis to the arguments. Section 3 sets out the historical background. Section
4 discusses the SCBA methodology. Section 5 details the data used for the SCBA.
Section 6 contains the results and Section 7 concludes.
2. Theoretical Background and Empirical Work
The ideological beliefs underlying restructuring of the ESI in E&W were that private
ownership and the profit motive gave far better incentives than the most benevolent
kind of state control (let alone the state interference which seemed to be the best that
British governments could achieve), and that competitive private industries gave better
results than monopolies (Green, 1998). Efficiency gains following cost reductions,
depending on the severity of competition and the quality of regulatory framework in
place, are assumed to benefit consumers through price reductions and improvements in
the quality of service.
The privatisation of utilities is a complex affair, often involving three separate, not
necessarily connected elements. The first is clearly a shift in ownership from the state

4
to private hands. The second is a corporate restructuring leading to the creation of new
or radically re-shaped companies. The third is a change in procedures by which the
sector operates, usually involving an injection of competitive procedures (Thomas,
1996). New regulatory policies, standards and practices often accompany these
changes. Depending on the combination of these factors, liberalisation (R&P) will tend
to cause significant changes in the way businesses are conducted. Pollitt (1997a)
identifies five theoretical arguments relating to the efficiency effects of liberalisation.
First, liberalisation can improve incentives by reallocating property rights from public
to private sector (Alchian, 1965). Second, liberalisation may change the objective
functions of managers being faced with private sector initiatives (following Niskanen,
1968). Third, there may be rent-seeking on the part of firms faced with some type of
regulation (like the rate of return regulation) shifting these firms away from the
efficiency frontier (following Averch and Johnson, 1962). Fourth, liberalisation may
cause influence activities within the industry (such as empire building) which may
cause a divergence from efficiency (Milgrom and Roberts, 1990). Fifth, theories of
policy commitment suggest that the government can effectively reduce interventions
and the costs that accompany these interventions (such as in Willig, 1994).
E&W is a developed market economy, with an electricity sector that has developed
strong linkages with the rest of the economy. This means that the theoretical
predictions weakly argue for R&P in the case of property rights, bureaucracy and
commitment theories; and is uncertain about the sign and magnitude of changes when
it comes to incentives under regulation and influence activities. Poorly constructed
incentive regulation could negate all positive effects from other sources. The results of
any individual R&P process in a given industry and in a given country have the
potential to be highly variable (Pollitt, 1999).
There are two broad methods to analyse the impact of liberalisation (Pollitt, 1997a).
One deals with assessing the impact from actual occurrences. The other tries to predict
or simulate the potential impact based on some historic trends. Any overall evaluation
of the efficiency effects of privatisation and restructuring will need to take into account
a wide range of impacts. The methodologies used to assess the impact of liberalisation
based on price or cost comparisons, such as Yarrow (1992) and Bishop and Thompson

5
(1992); using simulation or frontier methodologies, such as Burns and Weyman-Jones
(1994), have been subjected to a uniform and strong criticism: that they do not attempt
to directly address the issue of whether liberalisation is likely to be socially beneficial.
None consider the distributional consequences of liberalisation and most neglect the
environmental costs of liberalisation. A more comprehensive approach would be a
Computational General Equilibrium Approach (CGE) such as the one used by Chisari
et al. (1999), where the macroeconomic and distributional impacts of privatisation and
regulation are assessed. Nevertheless, they do not possess the power of an overall
social-cost-benefit analysis that we discuss below, and are themselves based on
numerous assumptions as to specification of objectives and constraints.
SCBA studies such as Galal et al. (1994) and others (Green and McDaniel, 1998;
Newbery and Pollitt, 1997; Pollitt 1997b; and Pollitt, 1999) have addressed the failures
of the other methodologies. In this study, we use a SCBA framework to analyse the
effect of liberalising the RECs’ regulated first-tier3 supply and distribution businesses in
E&W. The method is discussed in Section 4 below.
3. Historical Background
3.1 Public Ownership
The electricity supply industry (ESI) had been in public ownership since 1948. In
England and Wales (E&W), the Central Electricity Generating Board (CEGB) was
responsible for generation and transmission; it sold electricity to twelve Area Boards
(ABs) under the terms of the Bulk Supply Tariff, based upon its marginal costs. The
ABs were responsible for distribution and selling electricity to consumers. In Scotland
there were two vertically integrated Boards, while in Northern Ireland the NIE was
responsible for the small vertically integrated, largely isolated, system in that province
(Green, 1996).
During the course of 1982 the government’s ultimate intention to introduce legislation
3 The first-tier supply business of the RECs is the supply of electricity within their own franchise area.

6
to allow private companies to set up to provide electricity to consumers became clear
(Electricity Consumers’ Council, 1982).
3.2 Privatisation and Restructuring (R&P)
Privatisation of the ABs took place in stages. The White Paper ‘Privatising Electricity’
in which the Government laid out its plans for the industry was published in February
1988, followed by the Electricity Bill in November of the same year. Vesting day,
when the transfer of the property of the ABs to the newly established RECs took
place, was 31 March 1990. The RECs (with their share of NGC) were sold to the
public in December 1990.
The R&P in different regional markets varied. In Northern Ireland the smallness of the
system has limited the options for R&P (Pollitt, 1997b). In Scotland, the assets of the
two vertically integrated electricity boards were vested in three new companies. There
has been a possibility to disintegrate the industry as compared to Northern Ireland and
this is now under active consideration. Tables 6, 7 and 8 summarise some of the facts
relating to the R&P of the ESI in the UK. We present these tables to understand the
significance of the RECs in the programme of R&P in the UK, and also set the base for
analysing the contributions that distribution and supply make to explaining overall
prices and cost changes within the industry.
3.3. Importance of the RECs
The 12 ABs who between them served 22.2 million customers in 1989, ranged in size
from South Wales (Customers: 0.91m; Sales: 11.5 TWh; Maximum Demand: 2,111
MW) to Eastern Board (Customers: 2.86m; Sales: 27.2 TWh; Maximum Demand:
5665 MW) (Henney, 1994). The size of the turnover of the RECs (distribution and
supply activities) was about £3.8bn by 1997-8 (at 1995 prices), representing about
30% of total turnover of the ESI in the UK.

7
3.4. Immediate Concerns after R&P
In earlier years there had been public concerns about profits and prices; later more
concerns were expressed with regard to increased dividends and the ability of
distribution companies to finance share buybacks4, and about the high prices which
bidders have been willing to pay to acquire RECs.
From 1994/95 to 1998-9, average distribution charges have fallen by about 25 per cent
in real terms (see Figure 2 for the path of controllable costs), and average electricity
prices to domestic customers by about 15 per cent in real terms. An account of these
price changes can be found in Green (1998).
3.5. Price Controls and Reviews
Each REC’s distribution business constitutes an effective regional monopoly. In order
to protect customers from the potential abuse of monopoly power, each distribution
business is subject to controls on the prices it can charge and the quality of service it
must provide (OFFER, 1999). Supply businesses, on the other hand, have been
progressively liberalised, and with increasing degrees of competition, regulation has
become less significant. Large customers were given the freedom to switch suppliers in
1990, medium customers from 1994 and all domestic customers from 1998.
The final price of electricity consists of a number of components. While transmission,
supply and generation price components fell during the second Price Control Review,
the distribution component of prices increased since privatisation. The initial
distribution price controls on the RECs put in place by the Government at Vesting in
1990 permitted price increases ranging up to 2.5% above inflation rate (OFFER,
1994).
OFFER started operation on 1 September 1989, five months after the first price
4 Henney (1997) gives a clear indication on this concern relating to the RECs. He also explains theother regulatory problems surrounding the electricity sector during the early years of R&P, especiallyrelating to the distribution businesses.

8
controls on the RECs became into force. Henney (1997) explains the rise in prices and
profits after privatisation as a regulatory failure, in terms of the lax setting of the initial
price control for wires. Also, the government could not substantiate the claims for
potential productivity gains at the time of vesting, although we record a unit
productivity growth of 2% per annum from 1970 to 1987. The regulatory failure
reflected itself into an initial price rise that was well above the inflation rate. We note
that during the period 1981-82 to 1988-9, electricity prices in E&W rose at less than
the rate of inflation and the two diverged over time.
OFFER introduced revised distribution price controls for England and Wales in 1995,
which required cuts in real terms of 11 to 17 per cent in distribution charges in
1995/96 and further reductions in real terms of between 10 and 13 per cent in 1996/97.
Thereafter, distribution charges were required to fall by 3 per cent per year in real
terms for the duration of the price control (until March 2000). These price controls
were then modified in 1998 to allow RECs to make certain additional charges for
services to facilitate competition in supply. These distribution price controls have been
revised from 1 April 2000. Based on Ofgem’s predictions of costs and revenues, the
RECs will be faced with price controls on distribution businesses averaging 3% for the
next five years, with an initial cut in PESs’ distribution revenue by about 23.4% (see
Ofgem, 1999b). Controllable costs for the RECs are projected to fall by 2.3% per
annum over the period 1998 to 2005.
Price controls on the REC’s supply business limited average revenue to rise by no
more than inflation, during the period 1990-1 to 1994-5 and then regulation was
tightened to RPI-2 for the supply business of all the RECs until March 1998. In April
1998 further revised controls set real reductions in prices between around 3 and 12 per
cent followed by a real reduction of 3% in 1999. Price controls to apply in 2000-2002
have been set on standard domestic and Economy-7 customers with price reductions of
5.7% p.a. and 2.1% respectively, on the final prices. It is expected that controls will no
longer be necessary after this period following the expected degree of competition in
supply (although a revision is planned after these two years).

9
3.6. New Developments
After the demerger of the NGC from the RECs in 1995 many changes occurred within
the industry, changing the nature of business of the RECs. The lifting of the ‘Golden
Share’ meant that mergers and acquisitions could take place after 1995. By March
1996, four RECs had been taken over and three others were the subject of take-over
bids, including bids from PowerGen and National Power (Green, 1996). A summary of
some selected take-over activities that involve the RECs is provided in Appendix 2.
RECs are a more diverse group today than was the case five years ago. Of the twelve
RECs in England and Wales, eight (Eastern, East Midlands, London, Midlands,
Northern, SEEBOARD, South Western and Yorkshire) were taken over by US
electricity companies; two (NORWEB and SWALEC) by UK-based water companies;
and one (Manweb) by Scottish Power; and Southern Electric merged with Scottish
Hydro. Some have changed ownership a second time (e.g. London Electricity and East
Midlands Electricity).
There have also been significant changes in the way that many of the RECs structure
their business, and the range of activities in which they are involved. For example,
several RECs have developed very active second-tier5 supply businesses. Eastern now
has substantial generation interests, and is in fact one of the largest generators in
England and Wales.
Most RECs are now active in the supply of gas as well as electricity. This provides
opportunities for joint marketing of the two fuels. Some PESs also have
telecommunications licences. Recently, major changes have occurred through the sale
of some RECs’ (Midlands Electricity, SWALEC, and Western Power Distribution
(previously SWEB)) supply businesses. Further sale of the other RECs’ supply
businesses are expected especially following the proposed Utilities Bill (Ofgem,
1999a). Ofgem is planning to lay tighter restrictions to ensure that each regional
monopoly electricity distribution business is held in a separate corporate entity,
5 The supply of electricity outside the REC’s authorised area.

10
ringfenced from all other activities carried on within the licensee’s group. It is expected
that this ringfencing arrangement will protect capital providers as well as consumers. It
is also expected that savings from mergers and acquisitions will eventually have to pass
over to consumers.
3.6. Windfall Taxes
The UK government imposed taxes on windfall gains of the utilities. In 1997 the
amount announced to be raised from such taxes was a total sum of £5.2bn and
included 24 utilities (electricity, water and others). Such levies were initially planned in
1992. The large profits of the privatised utilities attracted this new tax.
The electric utilities were to contribute £2.1bn of the £5.2bn. The RECs’ share of the
£2.1bn amounted to £1.25bn.6 The Electricity Association, on behalf of the Industry,
welcomed the chancellor’s confirmation that the windfall tax ‘will be a one-off’ levy,
and that provision could be made to ‘pay in two instalments’7. Table 8 summarises the
amount of windfall tax paid by the electric utilities, on a present value basis and at
1995 prices.
4. Methodology: The Social Cost-Benefit Framework
4.1. Preliminaries
The White Paper, which announced privatisation, clearly stated that the main
beneficiaries would be the consumers. Competition would ‘create downward pressures
on costs and prices, and ensure that the customer ... comes first’ (MacKerron and
Watson, 1996, p.186). Our main objective is to find out whether consumers benefited
from R&P of the RECs in E&W.
6 Extracted from: Inside Energy, (1997), ‘The lucky few escape Brown’s windfall net’, Inside Energy,vol.8, no.3, 11 July 1997. It should be noted that the NGC and British Energy did not have to pay anywindfall tax, because the former was demerged from the RECs (as opposed to being floated in its ownright) and the latter realised no profit since it was privatised.7 Financial Times, (1997), ‘Brown’s first budget - windfall tax: two tranche tax is welcomed’,Financial Times, 3 July 1997. Tax liability for Manweb and Norweb are extracted from this source.

11
4.2. The Methodology
Galal, Jones, Tandon and Vogelsang (GJTV, 1994) identify three main groups in
society, viz., consumers, private producers and government. GJTV use their
framework to assess whether privatisation is beneficial to the economy as a whole. A
full SCBA should, in theory, be able to address the impact on economic efficiency and
equity. Our first objective is to answer the question: ‘Does the fall in costs resulting
from R&P warrant the cost of R&P?’ Then we shall address the distributional aspect
of the problem: ‘Who gained and who lost (if anyone) in the process of R&P?’ The
first question considers the productive efficiency impact of R&P while the latter issue
relates to equity. We are ignoring the allocative efficiency aspect for simplicity8.
The GJTV method looks at costs, prices, profits, taxes, and consumer surplus. For
simplicity, we shall follow Newbery and Pollitt (1997), such that
∆W = Vsp - Vsg + (λg - λp) Z.
Vsp = social value under private operation
Vsg = social value under continued government operation
λg = shadow multiplier on government revenue
λp = shadow multiplier on private funds
Z = actual price at which sale is executed
Privatisation will be socially worthwhile if ∆W > 0. Assuming that in a developed
market economy we would expect no big difference in shadow multipliers, we set λg =
8 The calculation of dead-weight losses (DWL), following a price reduction of about 4% p.a. (based ona 2% counterfactual cost fall in the public sector, and a future reduction in controllable cost at 2.3%p.a.), and a total revenue of £4.6bn p.a. yields a value of £1.7m for an electricity demand elasticity of0.2; and a value of about £2.6m for an elasticity of 0.3. This calculation is based on the followingformula: DWL=0.5*ε*τ2 as a proportion of total revenue (where ε is the electricity demand elasticityand τ is the proportional difference between actual and counterfactual per unit revenue). As we cansee, these values are essentially negligible.

12
λp = 1. The calculation of ∆W involves the calculation of the difference in actual and
predicted costs under private ownership and a counterfactual cost that we could have
under public ownership. We evaluate the cost reductions due to efficiency gains and
deduct from it the R&P costs, to arrive at the value of ∆W. This ∆W will then be
allocated to our three groups in order to find out who gained, who lost and by how
much?
4.2.1. Comparing Costs With and Without Privatisation
To compare the costs with and without R&P, we need to establish proper
counterfactual of what would have happened to costs had the industry been left in
public hands. Since it is impossible to know exactly what would have happened under
public ownership, we construct possible counterfactuals (scenarios). Here we use 4
possible scenarios9, 0%, 1%, 2%, 3%, counterfactual cost decline. Another possible
counterfactual that we may use is privatisation with a different regulatory framework.
The latter is not performed in the present paper.
To arrive at the counterfactual costs, we calculate 3-year moving averages (3-ma) of
the controllable costs until 1988-89. We do not use the privatisation year given that
they may not be representative of the business-as-usual operation of the industry under
public ownership. We project a 3-ma at the various counterfactual cost declines. For
example, the 1% counterfactual cost decline per annum will yield a series that takes the
3-ma as the first value and then generates a series at the common multiplying factor of
0.99 on a successive yearly basis.
Similarly, counterfactual operating profit was calculated using a rate of return on the
gross value of assets10 and projected at the rate of return in 1989-90. Although the rate
of return was politically fixed during the period before privatisation, it was stable until
1988-9. There is reason to believe that the net rate of return on net assets in 1989-90
9 It would be rational at this stage to consider a 2% per annum counterfactual cost fall as the mostlikely counterfactual given the productivity growth from 1970 to 1987 averaging 2% p.a. We providemore support for a 2% counterfactual cost fall per annum in Section 6.2. We also performed theSCBA using a 5% counterfactual cost fall and the results are only presented in Table 2.10 Gross value of assets is used as compared to net assets, given its relative stability over the latter.

13
(equal to 4.75%) was far above what would have occurred under normal conditions
and had the design to make the sector more attractive to investors (Electricity
Consumers’ Council, 1988). Taxes and counterfactual taxes were calculated by
projecting a tax rate. This tax rate was the ratio of tax to operating profit. The change
in tax (actual less counterfactual) is calculated by applying the counterfactual tax rate
to the calculated counterfactual operating profit. R&P cost figures were also
aggregated on a present value basis. All R&P costs were assumed to be zero under
public-sector counterfactual (and after 1998 for the RECs, although Ofgem has made
allowances for further R&P as a result of the separation of supply and distribution
businesses).
The benefits (or losses) to consumers have been calculated from actual and projected
counterfactual per unit revenue of the RECs. To project the counterfactual per unit
revenue, we compute the sum of counterfactual profit, counterfactual cost, and
counterfactual ‘other costs’. We, therefore, derived counterfactual per unit revenues
for the six counterfactual cost declines.
Once the counterfactual cost declines are calculated it is easy to find the difference
between Cp and Cg (costs under private sector11 and government sectors respectively).
These differences define cost savings potential following privatisation and these values
can be aggregated on a present value basis using some discount rates. We used
discount rates varying from as low as 5% to as high as 12%. We note that discount
rate of 6% was the Treasury’s preferred discount rate in the 1980s, 8% is the current
rate and 10% is a typical private sector discount rate (Newbery and Pollitt, 1997).
To distribute the gains in efficiency (cost savings net of R&P costs), we deduct from
the cost savings (net of R&P) the change in tax and the benefits (or losses) to
consumers, at the appropriate counterfactual cost reduction. The residual12 represents
the benefits (or losses) to producers.
11 Note that the costs under private sector (RECs) have incorporated Ofgem’s projections of futurecost declines from 1998-9 to 2004-5 (see Section 4.4.2 for details).12 Green and McDaniel (1998) used a top-down approach. They calculate electricity price changes andthen calculate the benefits (or losses) to consumers. We use a bottom-up approach, identifying thecost-driver to the price change and then explain why prices have not fallen as much as costs.

14
To achieve these objectives, we constructed consolidated accounts of the 12 RECs for
the period 1986-7 to 1997-8. For a detailed account of the numbers used and
adjustments made for the pre- and post-privatisation periods refer to Appendix 1 and
Table 1.
4.2.2. Incorporating Future Price Control Proposals
OFFER (the Office of Electricity Regulation) proposed distribution price reductions to
the order of 3% from 1997-8 to 1999-00. Further reductions of about 3% p.a., after a
one-off cut in PES distribution revenue by 23.4%13 by March 2001 (equivalent to
£509m at 1995 Prices for the RECs), for the period April 2000 to 2005 are proposed
by Ofgem. We incorporate this information into our SCBA, by projecting revenue
reductions as if they actually occurred. Operating profits are projected on the basis of
the difference between projected revenue and projected costs14.
4.2.3. The Efficiency Gains from Privatisation
The most expected result from R&P is the potential competitive pressure from the
product and capital markets and the greater incentives to cut costs (for managerial,
incentives or other reasons discussed above). Unfortunately, for the distribution
businesses in E&W, competition is not much of an issue. Benefits from R&P would
accrue mostly from productive efficiency gains.
The value of efficiency gains from R&P is the present value of (Cp - Cg) taking into
account a demand growth rate of 1.3% per annum (NGC, 1999).
13 Ofgem, (1999), ‘PESs signal acceptance of price reviews’, Press Release no. R/63, UK: Office ofGas and Electricity Markets, 21 December 1999.14 Costs are projected based on Ofgem’s projections of 2.3% fall p.a. over the period 1997-8 to 2004-5. NGC charges were allowed to fall by an average of 2% p.a. based on the latest Ofgem’sTransmission Price Control Proposals (Ofgem, 2000).

15
4.2.4. The Investment Savings
In 1993, the RECs made forecasts of total capital expenditure of £1.64bn per year for
the period 1994-5 to 1999-00. OFFER (1999c) scaled back their forecasts of total
capital expenditure made by companies to £1.45bn p.a. Ofgem’s (1999b)15 updated
forecast for 1999 and 2000 is £1.25bn per annum.
We incorporate these estimates of the investment savings (the difference between
£1.45bn and £1.25bn) into our SCBA. This is achieved by considering that these
additional investments of £200m p.a. would have been undertaken under the public
sector, and hence inflating the capital expenditure needs of the sector for 1995-6 to
2004-5. We project changes in assets, operating profit and depreciation, and build the
counterfactual per unit revenue (as discussed in 4.2.1 above) to incorporate these
changes.
4.3. Assumptions
While there are many similarities between the distribution systems that RECs operate,
there are also some differences. For example, companies vary in size (in terms of area
or the number of customers or the quantity of electricity distributed), in the degree to
which their customers are scattered in rural or concentrated in urban areas, in the
extent to which they have larger customers who may take supply at higher voltages
rather than requiring to be transformed to a lower voltage, as well as in other ways
(OFFER, 1998a). We shall assume that these differences between RECs are not of
major significance. These are simplifying assumptions that we need to make for the
SCBA, otherwise weights on physical characteristics expressing these differences
would have been required to assess the final distribution of gains in efficiency from
R&P. A detailed REC-by-REC study would be needed to assess the locational
implications of divergences in physical and other characteristics between RECs.
Equal social weights are also assumed. That is, the value of one unit of currency to
15 Figures presented here are at 1997-8 prices.
16
consumers is equal to the value placed on it by either the government or the producer.
Furthermore, the setting up of counterfactual cost reductions for RECs assumes that
the rate of fall in cost is constant under each possible scenario, such that a 1% p.a. cost
fall counterfactual, implies that costs will fall at 1% p.a. until the end period (2005).
Thereafter, any divergences between actual and counterfactual costs are locked.
5. Data
To undertake the SCBA, data on turnover, operating costs, controllable operating
costs, taxation, operating profit, dividends, costs of R&P, employment, output, and
retail price indices (among others) are required for the whole period 1985-6 to 1997-8.
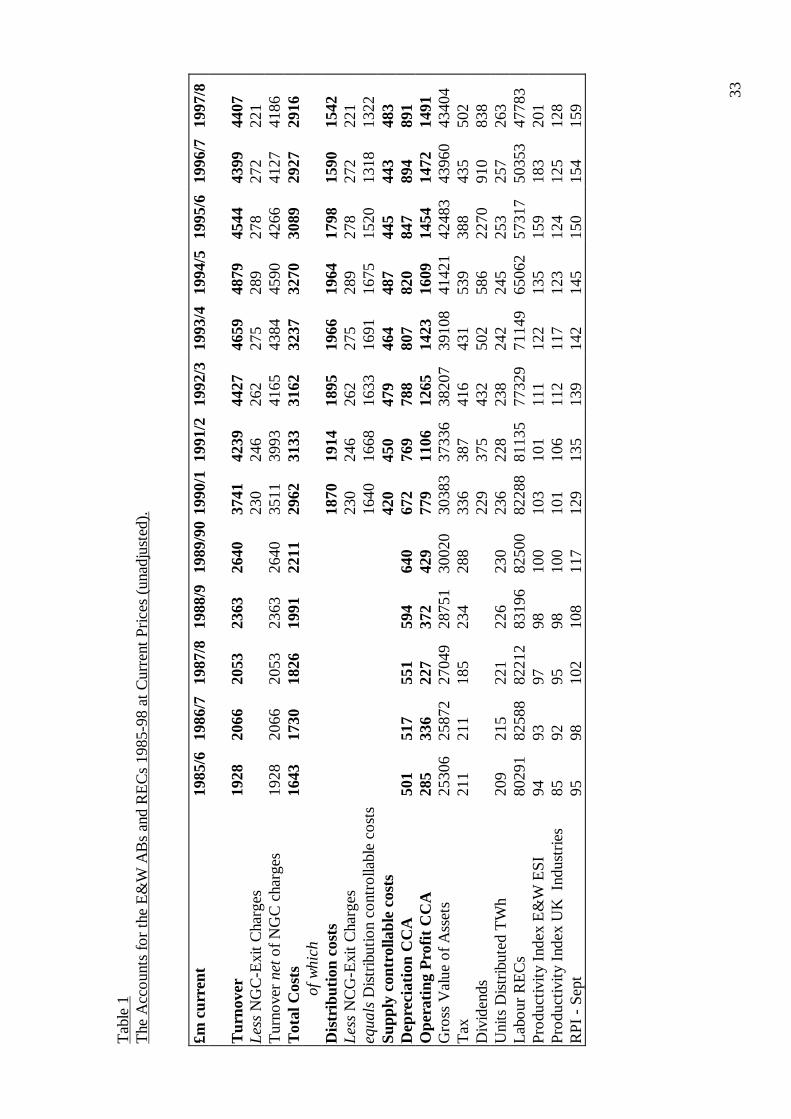
A list of the items is given in Appendix 1. Table 1 shows the data used. The
composition of turnover is depicted in Figure 1. Using the actual data on controllable
costs, ‘other’ costs, tax and operating profit, we are able to compute counterfactual
values for the public sector.
Operating costs cover the day to day costs of running the network, such as repairs and
maintenance, planning and control, overhead costs, NGC exit charges and distribution
system business rates.16 Around one-third of operating costs can be considered to be
largely outside the control of the companies (including the NGC exit charges and
depreciation). Price controls will have a tendency to reduce the proportion of
controllable to total costs. Our objective is to evaluate for the ABs and RECs, the
present value associated with the change in controllable costs.
6. The Results
6.1. Efficiency Gains
Table 2 provides estimates of the discounted efficiency gains of the RECs in E&W. We
16 In what follows we consider rates to be a controllable cost. There is no evidence for distributionrates (and rents) to have increased following privatisation.

17
use a 1.3% demand growth rate.17 All other assumptions made in section 4.3 are
maintained.
With a discount rate of 6%, efficiency gains through cost reduction and investment
savings amount to £3.2bn with a counterfactual cost fall of 2% per annum and a future
controllable cost fall of 2.3% p.a. This efficiency gain is partly offset by R&P costs (of
£1.1bn), yielding efficiency gains net of R&P costs of £2.1bn. Table 2 describes the
R&P costs discounted at the different rates. The totals in Tables 4-1 through 4-4 are
the efficiency gains net of R&P costs at the different discount rates.
6.2. Pro-Public Scenario
Table 4-4 details the pro-public ownership scenario. This scenario is one with a high
expected rate of cost decline in the public sector that beats a private sector cost
decline, and also saves on the costs of R&P. With a counterfactual cost decline of 3%
p.a. public sector ownership is a more desirable option since an efficiency loss of
£1.4bn would have been added to the £1.1bn of R&P costs.
At 1985-6 prices, total costs per unit sold for the RECs rose by 2.3% over the period
1980 to 1986. Added costs (p/kWh) over the same period declined by 3.4% per annum
and distribution costs (p/kWh) declined by 1.5%.18 Staff employed per GWh was on a
continuous decline from 0.39 in 1979-80 to 0.33 in 1985-86 and labour productivity
growth has been about 2% p.a. between 1970 to 1987. RECs’ costs declined at a
slower rate over the period 1985-86 to 1988-89 by an average of 0.8% per annum and
net controllable costs declined at a rate of 0.3% p.a.
17 Note that cost savings are sensitive to changes in the demand growth rate. For instance, at a 2%counterfactual cost fall and using a 6% discount rate, cost savings amount to £2.9bn at 1% demandgrowth rate; £3.2bn for 1.3% and £3.9bn for a rate of 2% demand growth.18 Added cost equals total electricity supply cost less electricity purchase costs less non-CEGB fuelcosts less profit from non-electric business. Distribution cost is net of income arising from statutoryand other non-profit earning rechargeable work (Refer to Electricity Council’s Annual Reports and‘Indicators of Performance’ for more details on the definitions and on the figures used here). Note thatalthough total cost per unit may be rising, distribution and added costs have been generally falling. A2% counterfactual cost fall is not impossible or unlikely, given the experiences of the Scottish ESI(Pollitt, 1999) and Northern Ireland ESI (Pollitt, 1997) indicating these orders of cost reductionsduring the first few years after RECs' privatisation. And the public sector Nuclear Electric,experienced reduction in operating costs (net of fuel costs and provisions) of 3.2% per annum over the

18
On the front of electricity prices, by April 1987, they had fallen by 15% in real terms
over the previous five years as a result of electricity sales, improved efficiency, and
most importantly, significant falls in world fuel prices culminating in a £300m cut in the
CEGB’s coal bill in 1986-87 (Electricity Council, 1988).
Using these trends in costs and prices until 1988-89, a counterfactual cost fall of 2%
p.a. under public ownership would seem achievable. And this yields large losses to
consumers following R&P.
6.3. Pro-Privatisation Scenario
If unit controllable costs were to fall at the rate at which it was falling between 1985-6
to 1988-9, then we would certainly choose a counterfactual of between 0% p.a. to 1%
p.a. cost decline for the continued public ownership regime. This would yield high
efficiency gains net of R&P costs (at as high a discount rate as 12%) as depicted in
Tables 4-1 and 4-2.
At 0% p.a. counterfactual cost fall and with a 6% discount rate, the net benefit of R&P
is £13.7bn; at a 1% p.a. counterfactual cost fall, it is £7.3bn. With the labour
productivity growth after 1995 as shown in Figure 5 (likely to have been unparalleled
by the public sector) and the drastic overall cost reduction after 1996-7, we expect that
the benefits of privatisation and restructuring will be maintained at a high level after
1997-8.
Table 4-1 gives a definite case for privatisation and restructuring. Consumers benefit
£14.8bn at 6% discount at a counterfactual cost fall of 0% p.a. and £8.4bn at a
counterfactual cost decline of 1% p.a. This positive benefit owes itself partly to the
drastic cost and price falls with Price Controls after 1995 and the recently announced
set of price controls. Producers gain £3.3bn (relative to the counterfactual) at 0%
counterfactual cost fall (unadjusted for windfall tax. At 1% p.a. counterfactual cost fall
period 1989-90 to 1994-95.

19
and 6% discount rate, the net gains are £7.3bn.
6.4. The Central Case Scenario.
We present a central case in Table 4-3. Assuming a counterfactual cost fall of 2% p.a.
in the public sector and a discount rate of 6%, and accompanied by a 2.3% p.a.
reduction in controllable costs, efficiency gains net of R&P amount to £2.1bn and
become negative at discount rates at or above 10%. With this central case we shall
now investigate the distribution of benefits to the three groups that we described in
section 4.2 above, viz., consumers, producers and the government. We vary the rate of
future fall in controllable costs to 2005 in Table 5 for the central case. This shows that
faster falls in controllable costs than the rate which Ofgem predicts would yield
benefits to society, however basic patterns of the results are unchanged.
6.5. The Distribution of Benefits based on the Central Case Scenario
We have found that if ∆W > 0, assuming equal social weights, then R&P is a success in
raising social value. This is the case for the ‘privatisation scenarios’ and the ‘central
case scenario’ described above. An investigation into the distribution of those gains
will indicate whether that allocation achieved ‘fairness’.
Our results are in line with previous studies such as Newbery and Pollitt (1997) who
found that even if unit costs have fallen since privatisation, it has primarily been due to
fuel cost decreases. Rising profitability and government revenues have meant that
consumers were the least to benefit during the first five years after privatisation.19 A
summary of the distribution of gains (or losses) from R&P in the UK is given in Tables
6 and 7. Table 8 summarises the windfall tax liabilities and the sales proceeds from
privatisation of the UK ESI. Figure 3 illustrates the trend in distribution and supply
prices, actual and counterfactual. We can observe that there was a significant hike in
prices in the initial 5 years after privatisation. It was only with the Price Control
19 The ESI’s landscape has changed considerably since 1995. We see significant changes in controlsthat benefit consumers or reduce the initial adverse impacts on them, even at the expense of producersand their incentives.

20
Reviews that prices fell drastically. Figure 4 illustrates the distribution of gains from
R&P on an annual basis. It is only after 1999-00 that benefits started accruing to
customers (relative to the central case counterfactual). The jumps in the distribution of
benefits to consumers corroborate with the Price Control Reviews after 1995.
Table 4-3 gives the distribution of the gains (or losses) from R&P under the central
case (a 2% counterfactual cost fall, a 2.3% p.a. future controllable cost reduction). We
note that consumers benefit by £3.3bn (at 6%) under private ownership. The producers
gained about £3.3bn and the government received £4.4bn less in taxes (or gained
£5.1bn after accounting for windfall tax revenues and sale proceeds from
privatisation). Higher counterfactual cost falls or higher discount rates would mean
that consumers suffer from the R&P. Consumers only benefit in the Privatisation
Scenarios, and at discount rates not exceeding 8% under the central case scenario.
We note an additional benefit to consumers not yet accounted for in the above results.
The flotation of the NGC allowed the RECs to offer exceptional rebates of about £50
per customer, for the period 1996-7. This one-off exceptional rebate to consumers on
their bills also led companies to benefit from rebates on their fossil fuel levies. The net
benefit that was finally transferred to consumers amounts to£890m at 1995 prices and
discounted at 6%. At 10% discount rate it amounts to £857m.
We find a potential danger to producers’ profits and the possible adverse impact that
this may have on future level of investment and quality of supply. The tough
regulation, which brought about significant reductions in prices, and the imposition of
windfall levies in 1997, leads to sharp falls in profits by 2005 (to pre-tax profit rates
below those in 1989-90).
6.6. A Discussion of the Results
Setting out the factual record of the winners and losers for the first eight years of
privatisation is fairly straightforward. What is more difficult is to interpret the record.
There are inevitably problems of assessing the results that have occurred against what
might have happened if the old public sector regime had continued. Another result of
21
the simultaneous changes in ownership, structure and regulation is that even where it is
possible to determine outcomes, it is difficult to know how to interpret their causes
(MacKerron and Watson, 1996).
Figure 2 illustrates actual versus counterfactual net controllable cost on an annual basis
from 1985-6 to 2004-5 (the costs from 1998-2005 are taken as if they actually
occurred, and are based on a 2.3% p.a. reduction in controllable costs, and 2%p.a.
reduction in NGC charges). It is easy to understand how actual cost changes impact on
the results of our SCBA. The question that we initially asked was: Does the benefit of
having an eventually lower actual cost worth the initial rise in costs after R&P?
Per unit net controllable costs rose by about 18% during the first two years after
privatisation. It was only after 1994-5 that per unit net controllable costs fell to reach
the pre-privatisation level. The reduction was more drastic after 1996-7 when actual
cost reductions beat counterfactual cost reductions of even 3% p.a. While Green
(1998) found that final electricity prices for many customers to have fallen by 30% in
real terms since 1990, he also pointed out that these do not necessarily mean that costs
and prices have been minimised, or that distribution and supply prices have also fallen.
While parts of the industry are clearly now competitive, others are not. Our assessment
of the distribution and supply businesses allows us to explain the relatively slow
reductions in overall average electricity prices in E&W between 1990-1 to 1994-5,
even when generation and transmission costs declined in real terms during this period.
It would seem that the large number of structural changes that occurred after 1995
explain some of the rapid reduction in costs. Regulatory reviews have helped greatly
after 1994-95. But the natural question that comes to mind is: How much of the cost
decline is explained by the regulatory price control reviews and how much is explained
by the structural changes that started taking place after 1995? Answering this question
would take us beyond the objective of the present work.
Possible explanations to the initial cost increases include, a rise in materials and
services costs due to sub-contracting to subsidiaries to shift costs out of regulated
businesses; wage costs inflated by privatisation; discontinuities between the ABs and

22
the RECs; lax regulatory controls; and/or a rise in institutional costs. The eventual cost
reductions and efficiency improvements could be explained by the regulatory success
of the price control reviews after 1994-5, and the significant restructuring that took
place after 1995 with the sale of NGC and the lifting of the ‘Golden Share’, leading to
major acquisitions and merger activities. If price reviews after 1994-5 contributed to
most of the fall in costs then the initial cost increases was largely due to regulatory
failure.
Figure 4 depicts the distribution of net efficiency gains to consumers, producers and
the government. It was only after 1999-00 that positive material benefits started to
accrue to consumers, relative to the central case public ownership. This would suggest
that the choice of our discount rate in computing the net present values of costs and
benefits is crucial to yielding the kind of results that we expect.
“The regulator’s proposals for deep cost cutting in electricity distribution businesses
represent a tough challenge for the industry. In addition, businesses are being faced
with new and very demanding performance targets”20 The future costs to producers,
the gains to consumers and the large gains to the government from R&P (at the
Ofgem’s projected 2.3% p.a. future cost fall) implies that the tougher regulation
imposed on the RECs may possibly constitute another serious regulatory failure; failing
to judge the incentive effects on the RECs and the long-term stability of the industry as
a whole.
7. Conclusions
Our aim has been to assess the costs and benefits of the process of R&P of the RECs
in the UK ESI. We adopt an innovation, including the regulator’s price reviews for the
years until 2004-5. A social cost benefit analysis is used to achieve our aim.
1. We find a rapid increase in controllable costs of the distribution and supply
businesses, leaving costs at an average of 11% above the pre-privatisation period
20 Electricity Association, (1999), ‘Regulator’s price controls – electricity association response’, Press

23
during the first price control period.
2. We infer a R&P cost (at 1995 prices) equal to £1.1bn at a 6% discount rate. These
costs reduce the benefits of R&P of the ESI in the UK and in the distribution and
supply businesses of the RECs.
3. From the experience of ESIs in Northern Ireland, Scotland, Nuclear Electric, and
the performance of the ABs during the period 1981 to 1989, a 2% p.a.
counterfactual cost fall is considered reasonable.
4. Net efficiency gains from R&P, which started accruing to consumers after 1999
(relative to our central case), amount to about £2.1bn.
5. Labour productivity more than doubled in 1997-8 over its 1990-1 level, and is
unparalleled by the Industrial Productivity Index. Productivity growth during the
period 1970 to 1987, of 2% per annum does not match the growth experienced
after 1994-95.
6. The regulatory structure (set before the creation of OFFER) that defined the initial
price controls during the early years of privatisation did not contribute to cost
decline. We found that the benefits of restructuring and privatisation came about
mostly from institutional changes after 1995, and from distribution and supply
Price Control Reviews of OFFER, and Ofgem. The costs of the RECs fell by an
unprecedented rate of 30% during 1994 to 1998.
7. As a base case, we found that consumers would have paid about £3.3bn (at 2%
counterfactual cost fall and 6% discount rate) less than what they would have paid
under public ownership of the RECs. With the NGC rebates they were offered in
1995-6, total benefits to consumers would be about £4.2bn.
8. The government would have gained about £5.1bn (sale proceeds and total tax
including windfall levies) from the R&P of the RECs.
We find rapid increases in profits during the first few years after privatisation, but the
tough regulatory structures put in place have eroded these profits, accompanied by
windfall taxes in 1997. With the more stringent regulation, we await to see more
benefits to accrue to consumers to cover the loss in the initial periods after
Release, PR/55/99, London: Electricity Association, 2 December 1999.

24
privatisation. But tougher regulation designed to achieve greater levels of ‘efficiency’,
can also significantly alter the distribution of those gains against producers, inducing
perverse effects on long-run efficiency, incentives, quality of supply and service
reliability.

25
Glossary of Terms
Term DefinitionABs Area Boards, formerly the 12 Boards involved in distribution
and supply of electricity to consumersCEGB Central Electricity Generating Board, formerly incorporating
all the electricity businesses in the UKE&W England and WalesESI Electricity Supply IndustryFirst-Tier Supply The supply of electricity by a PES to customers in its own areaGJTV Galal-Jones-Tandon-Vogelsang framework of SCBANGC National Grid Company, the Company which owns the
Transmission NetworkNIE Northern Ireland ElectricityOFFER Office of Electricity Regulation, the office regulating electricity
businesses in the UKOfgem Office of Gas and Electricity Markets, replacing the OFFER,
and incorporating the market for gas regulation (OFGAS)PES Public Electricity Supplier, a company providing services in the
ESI, and also consists of other companies than the RECsR&P Restructuring and Privatisation, also referred to as
liberalisationREC Regional Electricity Company, replacing the ABs after R&PR&P Restructuring and PrivatisationSCBA Social Cost Benefit Analysis, the method of analysis used in
this studySecond-Tier Supply Supply of electricity outside a PES’s own areaSESI Scottish Electricity Supply Industry
26
Bibliography
Alchian, A.A. (1965), ‘Some economics of property rights’, Il Politico, Vol.30,pp.816-29.
Averch, H. and Johnson, L.L. (1962), ‘Behaviour of the firm under regulatoryconstraint’, American Economic Review, Vol.52, pp.1052-69.
Bunn, D. and Vlahos, K. (1989), ‘Evaluation of the long-term effects on electricityprices following privatisation’, Fiscal Studies, Vol.10/4, pp.104-16.
Burns, P. and Weyman-Jones, T. (1994), ‘Productive efficiency and the regulatoryreview of regional electricity companies in the UK’, Regulatory PolicyResearch Centre, Discussion Paper no.1.
Chisari, O., Estache, A. and Romero, C. (1999), ‘Winners and losers from theprivatisation and regulation of utilities: lessons from a general equilibriummodel of Argentina’, World Bank Economic Review, Vol.13/2, May 1999,World Bank, pp. 357-78.
CRI, (1999), ‘The UK electricity industry: financial and operating review 1997/8’,London: CIPFA, Statistics Series.
____, (1998), ‘The UK electricity industry: financial and operating review 1996/7’,London: CIPFA, Statistics Series.
Electricity Consumers’ Council, (1982), ‘Annual report and accounts’, London:Electricity Consumers’ Council.
Electricity Council, (1989), ‘Annual report and accounts’, London: Electricity Council.Galal, A., Jones, L.P., Tandon, P. and Vogelsang, I. (1994), Welfare Consequences of
Selling Public Enterprises - An Empirical Analysis, Oxford: OUP.Green, R. (1998). ‘England and Wales: a competitive electricity market?’, POWER,
UCEI, Berkeley: Working Paper Series no.pwp-60.____ and McDaniel, T. (1998). Competition in electricity supply: will “1998” be worth
it?, Fiscal Studies, vol.19/3, pp.273-293.____. (1996), ‘Reform of the electricity supply industry in the UK’, Journal of Energy
Literature, II. I.____ and Waddams-Price, C. (1995), ‘Liberalisation and divestiture in the UK Energy
sector’, Fiscal Studies, Vol.16/1, pp75-89.Henney, A. (1997), ‘Trade and Industry Committee: energy regulation, first report,
vol.2, published by The Stationery Office as ‘Memorandum submitted by AlexHenney, EEE Ltd’, ordered by The House of Commons, 11 March 1997.
____.(1994), A Study of the Privatisation of the Electricity Supply Industry in Englandand Wales, London: EEE Limited.
Jones, L.P., Tandon, P. and Vogelsang, I. (1990), Selling Public Enterprise: A Cost-Benefit Methodology, Cambridge, Mass : MIT Press.
MacKerron, G. and Watson, J. (1996), ‘The winners and losers so far’, in J. Surrey(ed.) The British Electricity Experiment: Privatisation, the Record, the Issues,the Lessons, London: Earthscan Publications Ltd.
Milgrom, P. and Roberts, J. (1990), ‘Bargaining activity, influence costs, and theorganisation of economic activity’, in J.E. Alt and K.A. Sheple (eds),Perspectives on Positive Political Economy, Cambridge, CUP.
Newbery, D.M.G. and Pollitt, M.G. (1997), ‘The restructuring and privatisation ofBritain’s CEGB: was it worth it?’, Journal of Industrial Economics, Vol.45/3,pp.269-303.
NGC, (1999), ‘NGC seven year statement for 1998/9 to 2005/6’, UK: National Grid

27
Company.Niskanen, W.A. (1968), ‘The peculiar economics of bureaucracy’, American Economic
Review, Papers and Proceedings, Vol.58, pp.298-305.OFFER, (1999), ‘Review of public electricity suppliers 1998-2000, distribution price
control review: consultation paper’, UK: Office of Electricity Regulation, May1999.
____, (1998a), ‘Reviews of public electricity suppliers 1998-2000, REC businessplans: consultation paper’, UK: Office of Electricity Regulation, December1998.
____, (1998b), ‘Reviews of public electricity suppliers 1998-2000, price controls andcompetition consultation paper’, UK, Office of Electricity Regulation, July1998.
____, (1994), ‘The distribution price control: proposals’, UK: Office of ElectricityRegulation, August 1994.
Ofgem, (2000), ‘The transmission price control: review of the National Grid Companyfrom 2001, initial thoughts consultation document’, UK: Office of Gas andElectricity Markets, March 2000.
____, (1999a), ‘Electricity distribution licences: initial proposals on standardconditions for the financial ‘ringfence’: a consultation paper’, UK: Office ofGas and Electricity Markets, December 1999.
____, (1999b), ‘Review of public electricity suppliers 1998-2000, distribution pricecontrol review: Final Draft’, UK: Office of Gas and Electricity Markets,December 1999.
Pollitt, M.G. (1999). ‘The restructuring and privatisation of electricity supply industryin Scotland’, mimeo.
____, (1997a), ‘The impact of liberalisation on the performance of the electricitysupply industry: an international survey’, Journal of Energy Literature, Vol.3/2,pp.3-31.
____, (1997b), ‘The restructuring and privatisation of the electricity supply industry inNorthern Ireland - will it be worth it?’, Department of Applied Economics,University of Cambridge DAE, Working Papers, Amalgamated Series no.9701.
Thomas, S. (1996), ‘The privatisation of the electricity supply industry’, in J. Surrey(ed.) The British Electricity Experiment: Privatisation, the Record, the Issues,the Lessons, London: Earthscan Publications Ltd.
Yarrow, G. (1992), ‘British electricity prices since privatisation’, Studies inRegulation, Oxford: Regulatory Policy Institute, paper no.1.
Willig, R.D. (1994), ‘Public versus regulated private enterprise’, Proceedings of theWorld Bank Conference on Development Economics, World Bank, pp.155-80.

28
Company Accounts and Reports21
Eastern Annual Reports and Accounts 1985-6 to 1997-8Regulatory Accounts from 1990-1 to 1997-8
East Midlands Annual Reports and Accounts 1985-6 to 1997-8Regulatory Accounts from 1990-1 to 1997-8
London Annual Reports and Accounts 1985-6 to 1997-8Regulatory Accounts from 1990-1 to 1997-8
Manweb Annual Reports and Accounts 1985-6 to 1997-8Regulatory Accounts from 1990-1 to 1997-8
Midlands Annual Reports and Accounts 1985-6 to 1997-8Regulatory Accounts from 1990-1 to 1997-8
Northern Annual Reports and Accounts 1985-6 to 1997-8Regulatory Accounts from 1990-1 to 1997-9
NORWEB Annual Reports and Accounts 1985-6 to 1997-8Regulatory Accounts from 1990-1 to 1997-8
Seeboard Annual Reports and Accounts 1985-6 to 1997-8Regulatory Accounts from 1990-1 to 1997-8
Southern Annual Reports and Accounts 1985-6 to 1997-8Regulatory Accounts from 1990-1 to 1997-8
Swalec Annual Reports and Accounts 1985-6 to 1997-8Regulatory Accounts from 1990-1 to 1997-8
SWEB Annual Reports and Accounts 1985-6 to 1997-8Regulatory Accounts from 1990-1 to 1997-8
Yorkshire Annual Reports and Accounts 1985-6 to 1997-8Regulatory Accounts from 1990-1 to 1997-8
Other Accounts and Reports
Electricity Consumers’ Council,(London)
Annual Reports1980 to 1988.
Electricity Council,(London)
Indicators of ESI Performance1985-88
Electricity Council,(London)
Annual Report and Accounts 1988-9
21 Other data have been gratefully received direct from the RECs themselves.

29
App
endi
x1
Con
stru
ctin
gA
ccou
nts
for
Reg
iona
lEle
ctri
city
Com
pani
es19
85-6
to19
97-8
inE
&W
:Sou
rces
and
Met
hods
The
pre-
priv
atis
atio
nin
form
atio
nfo
rth
e12
RE
Cs
(i.e
.,th
eA
Bs)
isdr
awn
from
thei
rre
spec
tive
Ann
ual
Rep
orts
and
Acc
ount
san
dth
eM
ain
Pro
spec
tus.
For
the
post
-pri
vatis
atio
ner
a,bo
thA
nnua
lR
epor
tsan
dA
ccou
nts
ofth
eR
EC
san
dth
eir
publ
ishe
dR
egul
ator
yA
ccou
nts
have
been
used
.T
heph
ysic
alda
taof
the
RE
Cs
are
also
draw
nla
rgel
yfr
omth
eir
annu
alre
port
s.H
owev
er,
repo
rtin
gbe
twee
nco
mpa
nies
diff
eran
dso
me
data
are
not
publ
ishe
d.W
ere
sort
edto
com
pany
repo
rts
sent
tous
dire
ctfr
omth
eco
mpa
nies
.In
the
peri
od19
94-8
,alo
tof
thes
eda
taha
vebe
enex
trac
ted
from
OFF
ER
’s‘R
evie
ws
ofS
uppl
yB
usin
esse
s’,‘
Pric
eC
ontr
olR
evie
ws’
and
‘Dra
ftP
aper
son
Com
petit
ion’
whi
char
epu
blis
hed
onth
eO
fgem
’sw
eb-s
ite.E
very
effo
rtha
sbe
enm
ade
toco
rrec
tfo
rdi
scre
panc
ies.
Her
eis
abr
ief
desc
ript
ion
ofth
eite
ms,
the
vari
atio
nsbe
twee
nth
eco
mpa
nysp
read
shee
tsan
dth
ead
just
men
tsm
ade.
ITE
MS
22S
ourc
ean
dD
etai
lsE
lect
rici
tyT
urno
ver23
All
thes
eite
ms
have
been
take
nfr
omth
eM
ain
Pro
spec
tus.
Are
aB
oard
s’A
nnua
lRep
orts
and
Acc
ount
sha
vebe
enus
edfo
rcr
ossc
heck
ing
and
for
corr
ectio
nof
anom
alie
s.Fo
rD
istr
ibut
ion
and
Supp
lyB
usin
esse
s,T
urno
ver
for
1986
-90
are
net
ofPu
rcha
ses
ofE
lect
rici
ty.F
orth
epe
riod
1990
-1to
1997
-8to
talt
urno
ver
isca
lcul
ated
byad
ding
Dis
trib
utio
nT
urno
ver
(net
ofex
cept
iona
land
extr
aord
inar
yite
ms)
with
the
valu
e-ad
ded
inth
eSu
pply
Bus
ines
s(e
qual
sto
oper
atin
gpr
ofit
plus
impl
ied
oper
atin
gco
sts)
.Pos
tpr
ivat
isat
ion
data
are
obta
ined
from
the
RE
Cs
Ann
ualR
epor
tsan
dA
ccou
nts.
Ope
ratin
gco
sts
For
the
year
s19
86-9
0,th
ein
form
atio
nha
sbe
enta
ken
from
the
Mai
nPr
ospe
ctus
.For
the
year
saf
ter
1991
,the
item
isa
sum
ofth
edi
stri
butio
nan
dsu
pply
busi
ness
es’
oper
atin
gco
sts.
The
item
has
been
adju
sted
for
depr
ecia
tion
follo
win
gC
CA
,exc
eptio
nala
ndex
trao
rdin
ary
item
s.It
has
not
been
,how
ever
,adj
uste
dto
take
into
acco
unt
the
NG
Cex
itch
arge
ssi
nce
we
dono
tha
veth
efu
llse
ries
ofN
GC
-Exi
tch
arge
sfo
rea
chco
mpa
ny,b
ut
22E
lect
rici
tyT
urno
ver,
oper
atin
gco
sts,
etc.
,are
net
ofin
com
efr
omor
cost
sin
curr
edin
non-
elec
tric
ity
busi
ness
es(s
uch
asap
plia
nce
reta
ilin
g).T
hese
valu
esar
eal
sone
tof
extr
aord
inar
yan
dex
cept
iona
lite
ms.
23T
hetu
rnov
erfo
rsu
pply
busi
ness
esin
clud
ein
tern
altu
rnov
er.T
his
mig
htin
flat
eth
eop
erat
ing
cost
sfo
llow
ing
thes
ein
ter-
segm
ents
ales
butw
eha
vem
ade
noad
just
men
tsfo
rth
em.

30
we
have
the
tota
lsth
atw
eob
tain
edfr
omO
FFE
Rdo
cum
ents
(hen
ceth
ead
just
men
tis
atte
mpt
edla
ter
toar
rive
atth
ene
tco
ntro
llabl
eco
sts)
.Sup
ply
oper
atin
gco
sts
are
mad
eup
ofdi
stri
butio
nco
sts
and
adm
inis
trat
ive
expe
nses
.U
nits
Dis
trib
uted
(TW
h)M
ost
data
com
efr
omA
nnua
lRep
orts
.For
1997
-8,d
ata
for
som
eco
mpa
nies
are
mis
sing
and
the
figur
esw
ere
extr
acte
dfr
omSu
pply
Pri
ceC
ontr
olR
evie
ws
ofO
FFE
R(s
ever
alvo
lum
es).
Tot
algr
oss
valu
eof
asse
ts(e
xc.
cons
cont
ribu
tions
)Fo
rth
epr
e-pr
ivat
isat
ion
peri
odth
isis
give
nas
the
diff
eren
cebe
twee
nth
eco
stof
the
asse
tat
31M
arch
and
the
valu
eof
cons
umer
cont
ribu
tions
at31
Mar
ch.T
hepo
st-p
riva
tisat
ion
equa
tion
isth
esu
mof
the
dist
ribu
tion
and
supp
lyas
sets
.Thi
spr
ovid
edth
em
ost
stab
leba
sis
for
proj
ectin
gco
unte
rfac
tual
prof
it.N
GC
Exi
tC
harg
esFi
gure
sar
eav
aila
ble
for
1993
-4to
1997
-8in
OFF
ER
‘Dis
trib
utio
nPr
ice
Con
trol
Prop
osal
s’an
dfo
rot
her
year
sth
eyar
epu
blis
hed
inO
FFE
RD
ocum
ents
.The
sear
eno
n-co
ntro
llabl
eco
sts
toth
eR
EC
s..
RP
I-
Sep
t.T
heR
PI
refe
rsto
Sep
tem
ber
ofth
efin
anci
alye
ar.
Itha
sbe
enta
ken
from
the
Mon
thly
Dig
est
ofS
tatis
tics.
RE
Cs
Con
trol
labl
eC
osts
The
sear
eth
eco
ntro
llabl
eco
sts
ofbo
thth
esu
pply
and
dist
ribu
tion
busi
ness
esag
greg
ated
(tot
alop
erat
ing
cost
sle
ssN
GC
exit
char
ges,
depr
ecia
tion,
and
exce
ptio
nalc
osts
).L
abou
rE
mpl
oyed
Ext
ract
edfr
omth
eA
nnua
lRep
orts
and
Acc
ount
san
dfr
omva
lues
sent
dire
ctby
the
com
pani
es.
Prod
uctiv
ityIn
dex
Indu
stri
esT
his
isex
trac
ted
from
ET
AS
(Eco
nom
icT
rend
san
dA
nnua
lSup
plem
ent)
and
repr
esen
tsth
eO
utpu
tpe
rem
ploy
men
tin
Indu
stri
es.
R&
PC
osts
Res
truc
turi
ngan
dP
riva
tisat
ion
cost
sar
eex
trac
ted
from
annu
alre
port
san
dac
coun
ts(b
asic
ally
from
the
rest
ruct
urin
gco
sts
ofpr
ivat
isat
ion
com
pone
ntof
exce
ptio
nali
tem
s).R
&P
excl
udes
flota
tion
cost
san
dth
eco
sts
asso
ciat
edw
ithO
FFE
R.R
&P
cost
sar
eas
sum
edto
beze
roaf
ter
1998
-99.
Tax
and
divi
dend
sE
xtra
cted
from
Ann
ualR
epor
tsan
dA
ccou
nts.
Pri
orto
priv
atis
atio
nta
xw
asth
eco
ntri
butio
nsto
Ele
ctri
city
Cou
ncil.
Tax
figur
esfr
omth
eM
ain
Pro
spec
tus
give
the
tax
liabi
lity
base
don
the
assu
mpt
ion
that
each
AB
was
anin
depe
nden
ten
tity
for
this
purp
ose.
For
late
rye
ars,
for
the
RE
Cs,
tax
liabi
lity
was
calc
ulat
edon
the
sam
eba
sis.
Tax
rate
isca
lcul
ated
asta
xa
prop
ortio
nof
oper
atin
gpr
ofit
befo
reta
x.D
ivid
ends
wer
eex
trac
ted
from
Ann
ual
Acc
ount
san
dun
adju
sted
for
exce
ptio
nald
ivid
ends
.

31
Appendix 2Take-Over Activity in UK ESI24
Target Company Bidder Date of CompletionSWEB plc Southern Group (US) 18.09.95Eastern Group Plc Hanson plc 18.09.95Manweb plc Scottish Power plc 12.10.95Norweb plc North West Water plc 08.11.95SEEBOARD plc Central & South West
Corporation (US)11.01.96
SWALEC Welsh Water plc 29.01.96Midlands Electricity Avon Energy 07.06.96Northern Electric plc CE Electric UK plc 24.12.96East Midlands Electricity plc DR Investments (UK) plc 10.01.97London Electricity plc Entergy Power (UK) plc 07.02.97Yorkshire Electricity plc Yorkshire Holdings 01.04.97The Energy Group plc(Eastern)
Texas Utilities Company 19.05.98
East Midlands Electricity plc PowerGen 27.07.98Southern Electric Scottish Hydro-Electric 14.12.98London Electricity plc Electricité de France 27.01.99Midlands Electricity SupplyBusiness
National Power 19.04.99
SWEB Supply Business London Electricity (EDF) 06.99SWALEC British Energy 06.99
24 This table is adapted from CRI’s Financial and Operating Reviews 1996-7 (Table A; xviii) and 1997-8(Table B; pxxi). We provide only those take-overs that have been completed and have excluded those thatwere rejected or withdrawn.

32
Appendix 3Summary of Distribution and Supply Price Controls for RECs in E&W
Period Rate of Price (cost) Decrease (%)
Distribution Businesses1990-1 to 1994-5 Variable up to 2.5% above the inflation rate1995 to 1995-6 11 to 17% (average of 14%)1996 to 1996-7 10 to 13%1997 to April 2000 Average of 3% p.a.2000 to 2004-5 One-off cut in distribution revenue by 23.4% in
2000-1 and then a 3% p.a. fall until 2005.
Supply Businesses1990-1 to 1994-5 0%1995 to 1997-8 2% p.a. fall in costs1998 to 1999 3 to 7% fall in costs2000 to 2002 Price reductions of 5.7% p.a. for Standard Domestic
Customers and 2.1% for Economy-7 Customers
33
Tab
le1
The
Acc
ount
sfo
rth
eE
&W
AB
san
dR
EC
s19
85-9
8at
Cur
rent
Pric
es(u
nadj
uste
d).
£mcu
rren
t19
85/6
1986
/719
87/8
1988
/919
89/9
019
90/1
1991
/219
92/3
1993
/419
94/5
1995
/619
96/7
1997
/8
Tur
nove
r19
2820
6620
5323
6326
4037
4142
3944
2746
5948
7945
4443
9944
07L
ess
NG
C-E
xit
Cha
rges
230
246
262
275
289
278
272
221
Tur
nove
rne
tof
NG
Cch
arge
s19
2820
6620
5323
6326
4035
1139
9341
6543
8445
9042
6641
2741
86T
otal
Cos
ts16
4317
3018
2619
9122
1129
6231
3331
6232
3732
7030
8929
2729
16of
whi
chD
istr
ibut
ion
cost
s18
7019
1418
9519
6619
6417
9815
9015
42L
ess
NC
G-E
xit
Cha
rges
230
246
262
275
289
278
272
221
equa
lsD
istr
ibut
ion
cont
rolla
ble
cost
s16
4016
6816
3316
9116
7515
2013
1813
22Su
pply
cont
rolla
ble
cost
s42
045
047
946
448
744
544
348
3D
epre
ciat
ion
CC
A50
151
755
159
464
067
276
978
880
782
084
789
489
1O
pera
ting
Pro
fit
CC
A28
533
622
737
242
977
911
0612
6514
2316
0914
5414
7214
91G
ross
Val
ueof
Ass
ets
2530
625
872
2704
928
751
3002
030
383
3733
638
207
3910
841
421
4248
343
960
4340
4T
ax21
121
118
523
428
833
638
741
643
153
938
843
550
2D
ivid
ends
229
375
432
502
586
2270
910
838
Uni
tsD
istr
ibut
edT
Wh
209
215
221
226
230
236
228
238
242
245
253
257
263
Lab
our
RE
Cs
8029
182
588
8221
283
196
8250
082
288
8113
577
329
7114
965
062
5731
750
353
4778
3Pr
oduc
tivity
Inde
xE
&W
ES
I94
9397
9810
010
310
111
112
213
515
918
320
1Pr
oduc
tivity
Inde
xU
KIn
dust
ries
8592
9598
100
101
106
112
117
123
124
125
128
RP
I-
Sep
t95
9810
210
811
712
913
513
914
214
515
015
415
9

34
Table 2:The Efficiency Savings
Discount Rate 5% 6% 8% 10% 12%
Counterfactual cost fall 0% 19.7 14.7 9.3 6.3 4.5£bn (1995 Prices) 1% 11.5 8.3 4.8 2.9 1.7
2% 4.9 3.2 1.2 0.2 -0.53% -0.9 -1.4 -1.9 -2.3 -2.64% -6.0 -5.4 -4.8 -4.5 -4.45% -10.5 -8.9 -7.3 -6.5 -6.0
Levelised p/kWh starting in 1994-5Counterfactual cost fall 0% 0.28 0.27 0.24 0.20 0.18
1% 0.17 0.15 0.12 0.09 0.072% 0.07 0.06 0.03 0.01 -0.023% -0.01 -0.02 -0.05 -0.07 -0.104% -0.09 -0.10 -0.12 -0.15 -0.175% -0.15 -0.16 -0.19 -0.21 -0.24
% cost/kWhCounterfactual cost fall 0% 21% 20% 18% 15% 13%
1% 12% 11% 9% 7% 5%2% 5% 4% 2% 0% -2%3% -1% -2% -4% -6% -8%4% -6% -7% -9% -11% -13%5% -11% -12% -14% -16% -18%

35
Tab
le3
Res
truc
turi
ngan
dP
riva
tisat
ion
Cos
tsof
the
RE
Cs.
Yea
r19
88/9
1989
/019
90/1
1991
/219
92/3
1993
/419
94/5
1995
/619
96/7
1997
/8£m
Act
ualR
&P
7.4
55.5
83.6
35.4
89.6
153.
615
3.9
224.
710
4.4
112.
7
R&
P19
95P
rice
s9.
969
.093
.838
.193
.215
7.0
153.
921
7.1
98.5
102.
9R
&P
p/kW
h0.
000.
030.
040.
020.
040.
060.
060.
090.
040.
04
Dis
coun
tRat
e5%
6%8%
10%
12%
Tot
al£m
1066
1074
1092
1112
1134

36
Table 4Net Efficiency Gains from R&P and its Distribution at Various Discount Rates
Discount Rate 5% 6% 8% 10% 12%
Table 4-1: Strong Pro-Privatisation Scenario (c.f. Cost Fall 0% pa)Producers 3.2 3.3 3.4 3.4 3.4Government -6.0 -4.4 -2.8 -1.9 -1.3Consumers 21.4 14.8 7.6 3.7 1.3Total 18.6 13.7 8.2 5.2 3.4
Table 4-2: Pro-Privatisation Scenario (c.f. Cost Fall 1%)Producers 3.2 3.3 3.4 3.4 3.4Government -6.0 -4.4 -2.8 -1.9 -1.3Consumers 13.2 8.4 3.1 0.3 -1.5Total 10.4 7.3 3.7 1.8 0.6
Table 4-3: Central Case Scenario (c.f. Cost Fall 2%)Producers 3.2 3.3 3.4 3.4 3.4Government -6.0 -4.4 -2.8 -1.9 -1.3Consumers 6.7 3.3 -0.5 -2.5 -3.7Total 3.9 2.1 0.2 -1.0 -1.7
Table 4-4:Pro-Public Scenario (c.f. Cost Fall 3%)Producers 3.2 3.3 3.4 3.4 3.4Government -6.0 -4.4 -2.8 -1.9 -1.3Consumers 0.9 -1.3 -3.7 -4.9 -5.7Total -1.9 -2.4 -3.0 -3.4 -3.7

37
Table 5:The Central Case Scenario Under Different Levels of Future Cost Reductions
Discount Rate 5% 6% 8% 10% 12%
Table 5-1: Central Case with 2% p.a. Future Cost Fall (C.f. Cost Fall 2%)Producers 2.8 3.0 3.2 3.3 3.3Government -6.2 -4.6 -2.9 -1.9 -1.4Consumers 6.7 3.3 -0.5 -2.5 -3.7Total 3.3 1.7 -0.1 -1.1 -1.8
Table 5-2: Central Case with 2.3% p.a. Future Cost Fall (C.f. Cost Fall 2%)Producers 3.2 3.3 3.4 3.4 3.4Government -6.0 -4.4 -2.8 -1.9 -1.3Consumers 6.7 3.3 -0.5 -2.5 -3.7Total 3.9 2.1 0.2 -1.0 -1.7
Table 5-3: Central Case with 3% p.a. Future Cost Fall (C.f. Cost Fall 2%)Producers 4.1 4.0 3.8 3.7 3.6Government -5.5 -4.1 -2.5 -1.7 -1.2Consumers 6.7 3.3 -0.5 -2.5 -3.7Total 5.2 3.1 0.8 -0.5 -1.4
Table 5-4: Central Case with 3.3% p.a. Future Cost Fall (C.f. Cost Fall 2%)Producers 4.5 4.3 4.0 3.8 3.7Government -5.3 -4.0 -2.5 -1.7 -1.2Consumers 6.7 3.3 -0.5 -2.5 3.7Total 5.8 3.5 1.1 -0.3 -1.2

38
Figure 1The Composition of Turnover in RECs and ABs 1985-6 to 1997-8
Figure 2Actual and Counterfactual Controllable Costs of RECs (1995 Prices)
Actual and Counterfactual Controllable Costs of the RECs (p/kWh 1995 Prices)
0.4
0.5
0.6
0.7
0.8
0.9
1
1.1
1985
/6
1986
/7
1987
/8
1988
/9
1989
/0
1990
/1
1991
/2
1992
/3
1993
/4
1994
/5
1995
/6
1996
/7
1997
/8
1998
/9
1999
/0
2000
/1
2001
/2
2002
/3
2003
/4
2004
/5
Year
p/kW
h
Net Controllable costs 3yr ma 0pa 3yr ma 2pa 3yr ma 4pa
Composition of Turnover (p/kWh 1995 Prices)
0.00
0.50
1.00
1.50
2.00
2.50
1985/6 1986/7 1987/8 1988/9 1989/0 1990/1 1991/2 1992/3 1993/4 1994/5 1995/6 1996/7 1997/8
Year
p/kW
h
Controllable costs Operating Profit Others NGC Charges

39
Figure 3Actual and Counterfactual Price
Figure 4The (Annual) Distribution of Efficiency Gains from R&P of the RECs in E&W
Actual and Counterfactual Average Price p/kWh at 1995 Prices
0.8
1
1.2
1.4
1.6
1.8
2
1985
/6
1986
/7
1987
/8
1988
/9
1989
/0
1990
/1
1991
/2
1992
/3
1993
/4
1994
/5
1995
/6
1996
/7
1997
/8
1998
/9
1999
/0
2000
/1
2001
/2
2002
/3
2003
/4
2004
/5
Year
p/kW
h
Average Revenue - NGC costs Counterfactual AR (2% )
Distribution of Net Gains p/kWh
-0.5
-0.4
-0.3
-0.2
-0.1
0
0.1
0.2
0.3
1990/1 1991/2 1992/3 1993/4 1994/5 1995/6 1996/7 1997/8 1998/9 1999/0 2000/1 2001/2 2002/3 2003/4 2004/5
p/kW
h19
95P
rice
s
Consumers Government Producers

40
Figure 5Labour Productivity in E&W ESI and UK Industries 1985-6 to 1997-8
Productivity Index (1989-90 = 100)
80100120140160180200220
1985/6
1986/7
1987/8
1988/9
1989/0
1990/1
1991/2
1992/3
1993/4
1994/5
1995/6
1996/7
1997/8
Year
Pro
duct
ivit
yIn
dex
Product ivity Index E&W ESI Productivity Index UK Industries