The response of nitrous oxide emissions to different...
13
The response of nitrous oxide emissions to different operating conditions in activated sludge wastewater treatment plants in Southeastern Brazil Renato P. Ribeiro, Rodrigo F. Bueno, Roque P. Piveli, Débora C. Kligerman, William Z. de Mello and Jaime L. M. Oliveira ABSTRACT The continuous measurements of N 2 O emissions from the aeration tanks of three activated sludge wastewater treatment plants (WWTPs) operated with biological nitrogen removal (BNR) and non-BNR were performed during the different operating conditions of several parameters, such as aeration, dissolved oxygen (DO) profiling and organic shock loading (with landfill leachate). The nitrification process is the main driving force behind N 2 O emission peaks. There are indications that the variation of the air flow rate influenced N 2 O emissions; high N 2 O emissions denote over-aeration conditions or incomplete nitrification, with accumulation of NO 2 concentrations. Thus, continuous measurements of N 2 O emissions can provide information on aeration adequacy and the efficiency of complete nitrification, with major focus on DO control, in order to reduce N 2 O emissions. An additional concern is the observed propensity of WWTPs in developing countries to receive landfill leachates in their wastewater systems. This practice could have adverse effects on climate change, since wastewater treatment during periods of organic shock loading emitted significantly higher amounts of N 2 O than without organic shock loading. In short, non-BNR WWTPs are subject to high N 2 O emissions, in contrast to BNR WWTP with controlled nitrification and denitrification processes. Renato P. Ribeiro William Z. de Mello Departamento de Geoquímica, Instituto de Química, Universidade Federal Fluminense, Outeiro São João Batista, s/n, Niterói, RJ 24020-141, Brazil Rodrigo F. Bueno Roque P. Piveli Departamento de Engenharia Hidráulica e Ambiental, Escola Politécnica, Universidade de São Paulo, Avenida Professor Almeida Prado, 271, São Paulo, SP 05508-900, Brazil Débora C. Kligerman Jaime L. M. Oliveira (corresponding author) Departamento de Saneamento e Saúde Ambiental, Escola Nacional de Saúde Pública, Fundação Oswaldo Cruz, Rua Leopoldo Bulhões, 1480, Rio de Janeiro, RJ 21041-210, Brazil E-mail: jaimel@ensp.fiocruz.br Key words | aeration rate, dissolved oxygen, nitrite accumulation, nitrous oxide emission, organic shock loading, wastewater treatment plant INTRODUCTION One of the major challenges for wastewater treatment plants (WWTPs) with biological nitrogen removal (BNR) is the adequate control of operating parameters responsible for complete nitrification and denitrification processes and, consequently, undesirable nitrous oxide (N 2 O) emissions. BNR WWTPs are important to minimize the release of oxi- dized nitrogen (N) forms into water bodies (Strokal & Kroeze ) and the emissions of N 2 O to the atmosphere (Foley et al. ). On the other hand, N 2 O can be emitted in large amounts from BNR WWTPs with incomplete deni- trification processes (Foley et al. ), contributing as additional anthropogenic sources of this gas to the atmos- phere. N 2 O is a powerful greenhouse gas (IPCC ) and a stratospheric source of nitric oxide (NO), one of the gases responsible for the depletion of stratospheric ozone (Crutzen ; Ravishankara et al. ), therefore, any contribution other than those from natural processes is undesirable. According to Law et al. (), global N 2 O emis- sions from wastewater treatments are projected to increase by 13% during 2005–2020. N 2 O production from WWTPs commonly comprises three pathways: (1) nitrification of ammonium (NH þ 4 ) or a hydroxylamine (NH 2 OH) oxidation step (releasing N 2 O as a by-product); (2) heterotrophic denitrification by nitrite (NO 2 ) or nitrate (NO 3 ) reduction (with N 2 O as an intermedi- ate); (3) nitrifier denitrification by NH þ 4 oxidation followed by NO 2 reduction in a single step, under limited dissolved oxygen (DO) conditions: NH 4 þ !NO 2 !NO!N 2 O (as an inter- mediate)!N 2 (Wrage et al. ; Wunderlin et al. ). N 2 O emissions from WWTPs depend on certain operating par- ameters, such as organic matter (biochemical and chemical oxygen demand (BOD and COD)) and total N (TN) loads, 2337 © IWA Publishing 2017 Water Science & Technology | 76.9 | 2017 doi: 10.2166/wst.2017.399
Transcript of The response of nitrous oxide emissions to different...
2337 © IWA Publishing 2017 Water Science & Technology | 76.9 | 2017
The response of nitrous oxide emissions to different
operating conditions in activated sludge wastewater
treatment plants in Southeastern Brazil
Renato P. Ribeiro, Rodrigo F. Bueno, Roque P. Piveli, Débora C. Kligerman,
William Z. de Mello and Jaime L. M. Oliveira
ABSTRACT
The continuous measurements of N2O emissions from the aeration tanks of three activated sludge
wastewater treatment plants (WWTPs) operated with biological nitrogen removal (BNR) and non-BNR
were performed during the different operating conditions of several parameters, such as aeration,
dissolved oxygen (DO) profiling and organic shock loading (with landfill leachate). The nitrification
process is the main driving force behind N2O emission peaks. There are indications that the variation
of the air flow rate influenced N2O emissions; high N2O emissions denote over-aeration conditions or
incomplete nitrification, with accumulation of NO2� concentrations. Thus, continuous measurements
of N2O emissions can provide information on aeration adequacy and the efficiency of complete
nitrification, with major focus on DO control, in order to reduce N2O emissions. An additional concern
is the observed propensity of WWTPs in developing countries to receive landfill leachates in their
wastewater systems. This practice could have adverse effects on climate change, since wastewater
treatment during periods of organic shock loading emitted significantly higher amounts of N2O than
without organic shock loading. In short, non-BNR WWTPs are subject to high N2O emissions, in
contrast to BNR WWTP with controlled nitrification and denitrification processes.
doi: 10.2166/wst.2017.399
Renato P. RibeiroWilliam Z. de MelloDepartamento de Geoquímica,Instituto de Química, Universidade Federal
Fluminense,Outeiro São João Batista, s/n,Niterói,RJ 24020-141,Brazil
Rodrigo F. BuenoRoque P. PiveliDepartamento de Engenharia Hidráulica e
Ambiental, Escola Politécnica,Universidade de São Paulo,Avenida Professor Almeida Prado, 271,São Paulo,SP 05508-900,Brazil
Débora C. KligermanJaime L. M. Oliveira (corresponding author)Departamento de Saneamento e Saúde Ambiental,
Escola Nacional de Saúde Pública,Fundação Oswaldo Cruz,Rua Leopoldo Bulhões, 1480,Rio de Janeiro,RJ 21041-210,BrazilE-mail: [email protected]
Key words | aeration rate, dissolved oxygen, nitrite accumulation, nitrous oxide emission, organic
shock loading, wastewater treatment plant
INTRODUCTION
One of the major challenges for wastewater treatment plants(WWTPs) with biological nitrogen removal (BNR) is theadequate control of operating parameters responsible for
complete nitrification and denitrification processes and,consequently, undesirable nitrous oxide (N2O) emissions.BNR WWTPs are important to minimize the release of oxi-
dized nitrogen (N) forms into water bodies (Strokal &Kroeze ) and the emissions of N2O to the atmosphere(Foley et al. ). On the other hand, N2O can be emitted
in large amounts from BNR WWTPs with incomplete deni-trification processes (Foley et al. ), contributing asadditional anthropogenic sources of this gas to the atmos-phere. N2O is a powerful greenhouse gas (IPCC ) and
a stratospheric source of nitric oxide (NO), one of thegases responsible for the depletion of stratospheric ozone(Crutzen ; Ravishankara et al. ), therefore, any
contribution other than those from natural processes isundesirable. According to Law et al. (), global N2O emis-sions from wastewater treatments are projected to increase
by 13% during 2005–2020.N2O production from WWTPs commonly comprises
three pathways: (1) nitrification of ammonium (NHþ4 ) or a
hydroxylamine (NH2OH) oxidation step (releasing N2O as aby-product); (2) heterotrophic denitrification by nitrite(NO�
2 ) or nitrate (NO�3 ) reduction (with N2O as an intermedi-
ate); (3) nitrifier denitrification by NHþ4 oxidation followed by
NO�2 reduction in a single step, under limited dissolvedoxygen
(DO) conditions: NH4þ!NO2
�!NO!N2O (as an inter-mediate)!N2 (Wrage et al. ; Wunderlin et al. ). N2O
emissions from WWTPs depend on certain operating par-ameters, such as organic matter (biochemical and chemicaloxygen demand (BOD and COD)) and total N (TN) loads,

2338 R. P. Ribeiro et al. | N2O emissions from BNR and non-BNR WWTPs Water Science & Technology | 76.9 | 2017
DO concentrations, aeration rates, hydraulic retention time
(HRT) and sludge retention time (SRT), among others (Kamps-chreur et al. ; Law et al. ). Few studies regarding thedirect relationship between N2O emissions and operating par-
ameters in full-scale WWTPs are available (Ahn et al. ;Law et al. ; Aboobakar et al. ; Rodriguez-Caballeroet al. ; Daelman et al. ), especially in tropical countries(Brotto et al. , ; de Mello et al. ; Ribeiro et al. ,). These reports have shown a significant variability of theN load emitted as N2O, ranging from 0 to 25.4%, attributed todifferences inWWTP designs or in the applied sampling strat-
egies (Daelman et al. ).The Intergovernmental Panel on Climate Change (IPCC)
suggests an emission factor (EF) of 3.2 g N2O person�1
year�1 for WWTPs with controlled nitrification and denitrifi-cation processes (IPCC ). However, this N2O EF comesfrom a single study carried out in a small town in NewHamp-shire (USA)withweekly grab samples obtained in themorning
from an activated sludge WWTP (Czepiel et al. ). Otherstudies conducted in other parts of theworld have found differ-ent N2O EFs, especially when determined during different
times of the day (Ahn et al. ; Rodriguez-Caballero et al.; Daelman et al. ). Rodriguez-Caballero et al. ()andDaelman et al. () reported a 24-h online sampling strat-
egy showing diel variability of N2O emissions. Moreover, ashort-term sampling strategy can demonstrate relationshipsbetween N2O emissions and the operating parameters of
full-scale WWTPs (Ahn et al. ; Aboobakar et al. ;Rodriguez-Caballero et al. ). Therefore, the temporal pat-tern of the dynamics of N2O emissions and their majorcontrol factors in activated sludgeWWTPs are ofmajor impor-
tance (Rodriguez-Caballero et al. ) in order to apply theresponse of N2O emissions to aeration adequacy and evaluatethe efficiency of complete nitrification.
In this context, the main goal of this studywas to quantifyN2O emissions from activated sludge WWTPs operated withBNR and non-BNR, with different aeration systems, DO pro-
filing and organic shock loading, with major focus on DOcontrol, a key factor in the process performance, operationaland maintenance costs, and mitigation of N2O emissions.
MATERIAL AND METHODS
WWTP characteristics
The first evaluated WWTP (WWTP-1) is located at a
research institution in the city of Rio de Janeiro, Brazil,and serves about 2,500 population equivalents (PE). This
plant treats an average daily raw wastewater flow of
44 m3 h�1 (consisting of a mixture of laboratory and dom-estic wastewaters). The raw wastewater flow is linked tothe research institution’s work regime, so it is not continu-
ous throughout the day. During the 24-h study period, theflows were provided by the plant operators and no rawwastewater entered the WWTP-1 aeration tank from 2 to 4PM and from 6 PM to 8 AM. The process applied in this
WWTP is extended aeration activated sludge with non-BNR. The volume and surface area of the aeration tankare 440 m3 and 110 m2, respectively. The HRT and SRT
were 12 h and 25 days, respectively. During the studyperiod, variations in the air flow rate of 135, 205 and450 m3 h�1 were applied by manual regulation of the air
blower, without a DO-controlling system.The second evaluatedWWTP (WWTP-2) is located in the
city of Presidente Prudente, São Paulo State, Brazil, andtreats domestic wastewater of 200,000 PE, generating an
average daily raw wastewater flow of 1,700 m3 h�1. The rawwastewater flow was continuous during the 24-h studyperiod, with higher values from 5 AM to 4 PM. WWTP-2
operates with extended aeration activated sludge with BNR.This plant carries out BNR by simultaneous nitrificationand denitrification (SND) processes. The volume and surface
area of the aeration tank (three aeration tanks in total) are6,940 m3 and 1,734 m2, respectively. HRT and SRT were of16 h and 12 days, respectively. The plant operates with an
aeration automatic system controlled by DO concentrationsto promote SND. Continuous DO probes are installed atthree sites (inlet, middle and outlet regions) of the aerationtank. The air flow rate per tank is automatically maintained
in the range of 6,120 to 10,200 m3 h�1, in order to keep DOconcentrations within 0.3–1.0 mg L�1.
The third WWTP (WWTP-3) is located in the metropoli-
tan region of the city of Rio de Janeiro. This WWTP usuallytreats domestic wastewater of 470,000 PE, with an averagedaily raw wastewater flow of 6,100 m3 h�1 (Ribeiro et al.). However, during the study period, WWTP-3 alsoreceived a contribution of a landfill leachate (only in themorning), corresponding to about 1% of the daily raw waste-
water flow. This input of landfill leachate causes increases inthe organic matter loading (organic shock loading). The pro-cess used at this WWTP is conventional activated sludgewith non-BNR. The volume and surface area of the aeration
tank (four aeration tanks in total) are 11,550 m3 and2,175 m2, respectively. The HRT and SRT were 9 h and10 days, respectively. The aeration tanks are divided into
six interlinked aeration zones (ZNs), with different amountsof diffusers. The largest number of diffusers is installed in

2339 R. P. Ribeiro et al. | N2O emissions from BNR and non-BNR WWTPs Water Science & Technology | 76.9 | 2017
ZN 2 and ZN 5. The magnitude of the air flow rate is con-
trolled by the number of diffusers per zone. The air flowrate per tank is 10,000 m3 h�1, with 3,350 and 1,980 m3
h�1 at ZN 2 and ZN 5, respectively.
Sampling and analysis
Measurements of N2O emissions at the WWTP-1 aerationtank were performed for 24 h on July 8th and 24th and
August 9th, 2014, at the same spot, under different experimen-tal aeration conditions (AC) (Figure 1(a)). Chronologically, theair flow rateswere set to 135 m3 h�1 (AC1), 205 m3 h�1 (AC2)and 450 m3 h�1 (AC 3). The stabilization period for each
experimental AC was two weeks. In all conditions, the pH
Figure 1 | Designs and sampling locations of the aeration tanks at (a) WWTP-1, (b) WWTP-2, (c)
and DO concentrations were logged every minute using an
HI9828 multiparameter portable meter (Hanna).AtWWTP-2, N2O emissions were continuously measured
for 24 h on January 22nd, 2015 at a location close to the outlet
end of the aeration tank near the continuous DO probe(Figure 1(b)). The aeration control system was automaticallytriggered in this aeration tank whenever DO dropped below0.3 mg L�1, and was suspended automatically when DO con-
centrations reached levels higher than 1.0 mg L�1. During thestudy period, DOconcentrationswere logged every hour usinga Luminescent DO sensor (Hach).
At WWTP-3, N2O emissions were measured at ZN 5from 9 to 12 AM on June 30th, 2014 (Figure 1(c)). ZN 5has the second highest number of diffusers, as well as air
WWTP-3. The infrared (IR) N2O analyzer was linked to PVC gas collection floating chambers.

2340 R. P. Ribeiro et al. | N2O emissions from BNR and non-BNR WWTPs Water Science & Technology | 76.9 | 2017
flow rate, and was chosen as a function of the DO levels pro-
vided by a previous study (Ribeiro et al. ). This zoneexhibits the highest DO concentrations, since most of theorganic matter is oxidized as the sewage flows between
ZN 1 and ZN 4. N2O emission measurements performedonly in the morning were due to input of landfill leachatewhich took place only at this time of the day. In addition,WWTP-3 is surrounded by marginalized populations, so
no safe conditions for a 24-h study period were possible,unlike the other evaluated WWTPs. DO concentrationswere logged every 10 seconds using an HI9828 multipara-
meter portable meter (Hanna).A floating gas collection chamber (surface area¼
0.05 m2) was used for N2O sampling with the off-gas from
the headspace directed to an N2O/CO-23d infrared gas ana-lyzer (at 0.5 L min�1) (Los Gatos Research Inc., USA),where the N2O concentration was logged each second(Figure 1). The infrared gas analyzer provides measurements
with a precision of 0.05 ppb, sufficient for detecting evenminor variations in ambient N2O concentrations. Thechamber is made of polyvinyl chloride (PVC) equipped
with a float. The N2O emission flux (F) was calculatedby multiplying the ΔN2O concentration, which is thedifference between the chamber headspace and the
atmospheric N2O concentrations, by the emerging air flowrate (Qfloating chamber) and divided by floating chamber area(Afloating chamber) as displayed in Equation (1). The latter
was measured at the surface of the aeration tanks, usingthe PVC floating chamber and a digital rotameter. The airflow rates for the entire aeration tanks (Qair) were extrapo-lated from the Qfloating chamber values. Analytical precision
was ±1% and the quantification limit for the floatingchamber technique was 0.05 mg N m�2 h�1.
N2OF(mgNm�2h�1) ¼ Δ[N2O] ×Qfloating chamber
Afloating chamber(1)
Liquid samples of raw and treated wastewaters fromWWTP-1 and WWTP-2 were regularly collected, manually
Table 1 | Sampling strategy for the three studied WWTPs
Samples WWTP-1 WWT
Raw wastewater (COD, TKN and TN)a (CO
Aeration tank (N2O emission, DO and pH)c (N2O
Treated wastewater (COD, TKN and TN)a (CO
aHourly sampling (between 8 AM and 1 PM) during the three experimental ACs.bHourly sampling during the 24-h study period.c24-h online sampling.dSampling period from 9 to 12 AM.
and with the aid of automatic refrigerated samplers, respect-
ively, to determine the COD, total Kjeldahl N (TKN) andTN. In addition, dissolved inorganic nitrogen (DIN ¼ NHþ
4 ,NO�
2 and NO�3 ) was also determined in samples collected
from the WWTP-2 and WWTP-3 aeration tanks (Table 1).All analytical methods followed standard APHA ()
protocols. COD, TKN and TN were determined using theclosed reflux colorimetric method, block digestion method
and direct persulfate digestion method, respectively. NHþ4
concentrations were measured by an ion-selective electrodemethod using a Star 5 pH-meter (Orion). The NO�
2 and
NO�3 concentrations were determined by ion chromato-
graphy with chemical suppression of eluent conductivity,model 790 Personal IC (Metrohm). The limits of quantifi-
cation were 0.03 mg L�1 for NHþ4 , 0.1 mg L�1 for NO�
2
and NO�3 , and 10 mg N L�1 for TKN and TN. The analytical
precisions for the analyses, performed in triplicate, werewithin ±5%.
RESULTS AND DISCUSSION
WWTP-1: COD, TKN and TN removal efficiencies
The influent COD and TKN loads, measured from 8 AM to 1
PM, varied from 12 to 42 kg h�1 and 1.2 to 4.2 kg h�1,respectively, with a sharp increase from 8 to 9 AM andlittle subsequent variability (Table 2). The hourly valueswere similar in all of the three experimental ACs (AC 1,
AC 2 and AC 3) (Figure 2). The sharp increase of organicload observed is related to the dynamics of the diurnal pat-tern of raw wastewater entering WWTP-1’s aeration tank,
as described previously. Despite the large variation appliedto the air flow rate, COD removal efficiencies were highand similar in the three experimental ACs. Conversely, TN
removal efficiencies were unsurprisingly low, sinceWWTP-1 was not designed for N removal. However, TKN(the fraction of reduced N converted to oxidized N forms)
P-2 WWTP-3
D, TKN and TN)b –
emission, DO and DIN)c (N2O emission, DO and DIN)d
D, TKN and TN)b –
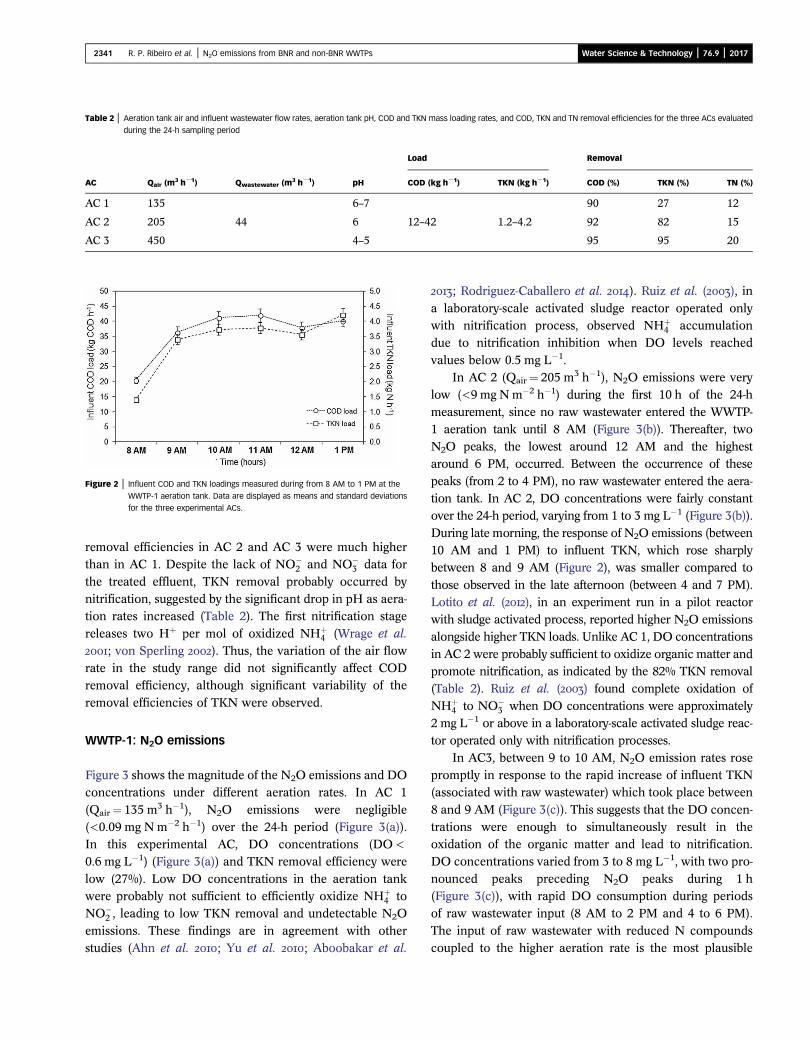
Figure 2 | Influent COD and TKN loadings measured during from 8 AM to 1 PM at the
WWTP-1 aeration tank. Data are displayed as means and standard deviations
for the three experimental ACs.
Table 2 | Aeration tank air and influent wastewater flow rates, aeration tank pH, COD and TKN mass loading rates, and COD, TKN and TN removal efficiencies for the three ACs evaluated
during the 24-h sampling period
AC Qair (m3 h�1) Qwastewater (m3 h�1) pH
Load Removal
COD (kg h�1) TKN (kg h�1) COD (%) TKN (%) TN (%)
AC 1 135
44
6–7
12–42 1.2–4.2
90 27 12
AC 2 205 6 92 82 15
AC 3 450 4–5 95 95 20
2341 R. P. Ribeiro et al. | N2O emissions from BNR and non-BNR WWTPs Water Science & Technology | 76.9 | 2017
removal efficiencies in AC 2 and AC 3 were much higherthan in AC 1. Despite the lack of NO�
2 and NO�3 data for
the treated effluent, TKN removal probably occurred bynitrification, suggested by the significant drop in pH as aera-tion rates increased (Table 2). The first nitrification stage
releases two Hþ per mol of oxidized NHþ4 (Wrage et al.
; von Sperling ). Thus, the variation of the air flowrate in the study range did not significantly affect CODremoval efficiency, although significant variability of the
removal efficiencies of TKN were observed.
WWTP-1: N2O emissions
Figure 3 shows the magnitude of the N2O emissions and DOconcentrations under different aeration rates. In AC 1
(Qair¼ 135 m3 h�1), N2O emissions were negligible(<0.09 mg N m�2 h�1) over the 24-h period (Figure 3(a)).In this experimental AC, DO concentrations (DO<0.6 mg L�1) (Figure 3(a)) and TKN removal efficiency were
low (27%). Low DO concentrations in the aeration tankwere probably not sufficient to efficiently oxidize NHþ
4 toNO�
2 , leading to low TKN removal and undetectable N2O
emissions. These findings are in agreement with otherstudies (Ahn et al. ; Yu et al. ; Aboobakar et al.
; Rodriguez-Caballero et al. ). Ruiz et al. (), ina laboratory-scale activated sludge reactor operated onlywith nitrification process, observed NHþ
4 accumulationdue to nitrification inhibition when DO levels reached
values below 0.5 mg L�1.In AC 2 (Qair¼ 205 m3 h�1), N2O emissions were very
low (<9 mg Nm�2 h�1) during the first 10 h of the 24-h
measurement, since no raw wastewater entered the WWTP-1 aeration tank until 8 AM (Figure 3(b)). Thereafter, twoN2O peaks, the lowest around 12 AM and the highestaround 6 PM, occurred. Between the occurrence of these
peaks (from 2 to 4 PM), no raw wastewater entered the aera-tion tank. In AC 2, DO concentrations were fairly constantover the 24-h period, varying from 1 to 3 mg L�1 (Figure 3(b)).
During late morning, the response of N2O emissions (between10 AM and 1 PM) to influent TKN, which rose sharplybetween 8 and 9 AM (Figure 2), was smaller compared to
those observed in the late afternoon (between 4 and 7 PM).Lotito et al. (), in an experiment run in a pilot reactorwith sludge activated process, reported higher N2O emissionsalongside higher TKN loads. Unlike AC 1, DO concentrations
in AC 2 were probably sufficient to oxidize organic matter andpromote nitrification, as indicated by the 82% TKN removal(Table 2). Ruiz et al. () found complete oxidation of
NHþ4 to NO�
3 when DO concentrations were approximately2 mg L�1 or above in a laboratory-scale activated sludge reac-tor operated only with nitrification processes.
In AC3, between 9 to 10 AM, N2O emission rates rosepromptly in response to the rapid increase of influent TKN(associated with raw wastewater) which took place between
8 and 9 AM (Figure 3(c)). This suggests that the DO concen-trations were enough to simultaneously result in theoxidation of the organic matter and lead to nitrification.DO concentrations varied from 3 to 8 mg L�1, with two pro-
nounced peaks preceding N2O peaks during 1 h(Figure 3(c)), with rapid DO consumption during periodsof raw wastewater input (8 AM to 2 PM and 4 to 6 PM).
The input of raw wastewater with reduced N compoundscoupled to the higher aeration rate is the most plausible

Figure 3 | 24-hour N2O emission fluxes and DO concentrations in the aeration tank of the WWTP-1 under different ACs: (a) AC 1 (Qair¼ 135 m3 h�1); (b) AC 2 (Qair¼ 205 m3 h�1); (c) AC 3
(Qair¼ 450 m3 h�1). Sampling dates: AC 1¼ July 08, 2014, AC 2¼ July 24, 2014 and AC 3¼August 09, 2014.
2342 R. P. Ribeiro et al. | N2O emissions from BNR and non-BNR WWTPs Water Science & Technology | 76.9 | 2017
explanation for the sudden elevated N2O emissionsobserved from 9 to 10 AM. de Mello et al. () reportedvery similar behavior of steep N2O emissions as soon asthe aeration period (60-min) began functioning in an acti-
vated sludge WWTP with intermittent aeration system.Following the sudden increase, N2O emissions
decreased exponentially until 1 PM, even with continuous
raw wastewater loading conditions and constant aerationrate. This behaviour could be attributed to the changingconditions of the process, such as NHþ
4 shock loads. Sig-
nificant alterations in process conditions, such as suddeninputs of organic loading (organic shock loading) followinga period with no raw wastewater discharge, can lead to
increased N2O emission. However, the adaptation of bac-terial metabolism requires time and would probably resultin decreased N2O emissions. Kampschreur et al. ()suggested that rapidly changing operational conditions
could result in N2O emission; however, the bacterial popu-lations subjected to repeatedly varying operationalconditions can reduce N2O emissions by adapting. Future
studies should be performed to better understand therelationship between N2O emissions and the adaptation
of bacterial metabolism during rapidly changing processconditions.
In AC 3, as in AC 2, two N2O peaks were observed(Figure 3(c)). However, they differ markedly in magnitude,
especially the morning peak. During this period (8 AM to1 PM), the maximum N2O fluxes were 34 mg N m�2 h�1
and 391 mg N m�2 h�1 for AC 2 and AC 3, respectively. In
addition, the increasing aeration rate, from 205 m3 h�1
(AC 2) to 450 (AC 3) m3 h�1, resulted in a two-fold increaseof N2O emission flux (the 24-h integrated). The 24-h inte-
grated N2O emission fluxes were, respectively, of 32 and66 mg N m�2 h�1. These outcomes demonstrate the negativeeffect of over-aeration in the overall N2O ERs of a WWTP,
as highlighted by Castro-Barros et al. ().The overall experiment consisted of varying the air flow
rate in the aeration tank of an activated sludge WWTP oper-ating a non-BNR system, with the aim of using N2O
emission responses for operational adjustments regardingthe adequacy of the AC. AC 2 was shown to be the best oper-ating condition for WWTP-1, adequate for achieving both
organic matter oxidation processes and nitrification. ThisAC provided adequate performance in relation to favourable

2343 R. P. Ribeiro et al. | N2O emissions from BNR and non-BNR WWTPs Water Science & Technology | 76.9 | 2017
COD (92%) and TKN (82%) removal efficiencies, with low
N2O emissions when compared to those found in AC 3.However, in AC 2, the N2O EF based on PE was 19 gN2O person�1 year�1, 6-fold higher than the limit proposed
by IPCC ().Prior to this study, WWTP-1 operated with an air aera-
tion rate similar to that in AC 3. Currently, it applies thesame air flow rate as applied in AC 2, maintaining DO con-
centrations in the range of 1 to 3 mg L�1. However, in orderto reduce effluent TN levels, the design and operation of thisplant must be altered, i.e. the establishment of an anoxic
zone, and internal recirculation systems must be added, tocarry out the denitrification process, which is the key pro-cess for the effective removal of TN as N2 (complete
denitrification) and reducing N2O emissions (Foley et al.). This is the first study to demonstrate the actual appli-cation of a 24-h online sampling strategy to determine short-term N2O emissions in order to improve the operating con-
dition of a full-scale system, with major focus on the aerationrate, an important factor in the process performance, oper-ational and maintenance costs, and mitigation of N2O
emissions.
Figure 4 | WWTP-2 (a) influent COD load; (b) influent TN load and (c) COD and TN removal
efficiencies (%).
WWTP-2: COD, TKN and TN removal efficiencies
The 24-h study demonstrated that the influent COD andTN loads began rising in the early morning, with twomajor peaks observed, one at noon and the other in the
early evening (Figure 4(a) and 4(b)). The influent CODand TN loads varied within the range of 318 to1,964 kg h�1 and 28 to 259 kg h�1, respectively. This 24-hvariability did not affect COD, TN and TKN removals,
whose mean efficiencies (hourly range values) were 90%(80–96%), 83% (60–94%) (Figure 4(c)) and 86%(61–97%), respectively. These results were expected, given
that WWTP-2 operates with BNR by SND coupled to anautomatic aeration system controlled by DO concen-trations. This system is set up to maintain DO levels in
the range of 0.3 to 1.0 mg L�1, even during sudden organicloading variations.
WWTP-2: N2O emissions
Figure 5(a) displays two major NHþ4 accumulation periods,
from 1.5 to 4.3 mg N L�1 (between 3 and 5 AM) and from2.5 to 7.5 mg N L�1 (between 8 and 10 AM), near the
outlet end of the aeration tank operated with a 16-h HRT.These periods were associated with higher influent TN
loads (Figure 4(b)). In parallel, NO�3 and, especially, NO�
2
concentrations were low (Figure 5(b) and 5(c)).From 5 to 8 AM, NHþ
4 decreased from 4.3 to2.5 mg N L�1 (40% reduction). Simultaneously, a slight
increase in N2O fluxes was observed from 0.5 to 1.2 mgN m�2 h�1. A different profile was observed from 10 AMto 7 PM, when NHþ
4 decreased from 7.5 to 1.9 mg N L�1
(75% reduction) with simultaneous increases of NO�2 (ran-
ging from 0 to 0.3 mg N L�1) and NO�3 (ranging from 0.7 to
4.2 mg N L�1) concentrations. The N2O fluxes during this
period increased from 1.2 to 8.7 mg N m�2 h�1, reachingtheir maximum during the maximum NO�
2 and NO�3 con-
centrations (Figure 5(a)–5(c)). Daelman et al. ()
reported that NO�2 and NO�
3 peaks were positively corre-lated to N2O emissions from the aeration tank of a full-scale WWTP. After this period (between 7 and 8 PM),NO�
2 and NO�3 concentrations decreased in response to
the limited DO levels (�0.2 mg L�1) (Figure 5(d)), whichcan indicate denitrifying activity. In addition, N2O emis-sion fluxes began to decrease even though reduction of
oxidized N forms (NO�2 and NO�
3 ) was still ensuing(Figure 5).

Figure 5 | N2O emission fluxes (mg N m�2 h�1) and (a) N� NHþ4 ; (b) N� NO�
2 ; (c) N� NO�3 and (d) DO concentrations measured in the WWTP-2 aeration tank.
2344 R. P. Ribeiro et al. | N2O emissions from BNR and non-BNR WWTPs Water Science & Technology | 76.9 | 2017
In summary, the highest N2O emissions occurred whenDO concentrations were very low (�0.3 mg L�1) (Figure 5(d))
and were correlated to NO�2 and NO�
3 peaks (Figure 5(b) and5(c)). Previous studies have reported the effect of low DO
concentrations (<1 mg L�1) onN2Oemissions during nitrifica-tion (Tallec et al. ; Wunderlin et al. ; Aboobakar et al.). Aboobakar et al. () reported a negative and direct cor-relation between DO concentrations and N2O emissions at a
2345 R. P. Ribeiro et al. | N2O emissions from BNR and non-BNR WWTPs Water Science & Technology | 76.9 | 2017
full scale WWTP, with the highest N2O emissions occurring
during lower DO ranges (<1 mg L�1). Tallec et al. ()found higher N2O emissions at low DO levels (from 0.1 to1 mg L�1) from a laboratory-scale batch experiments under
various oxygenation conditions. Clearly, these outcomes indi-cate that, even at low DO concentrations, the nitrificationprocess was the main driving force behind the highest N2Oemissions from the WWTP-2 aeration tank, as reported by
other authors evaluating full-scale WWTPs (Ahn et al. ;Aboobakar et al. ; Rodriguez-Caballero et al. ).
In contrast to WWTP-2, the AC 1 experiment at WWTP-
1 showed negligible N2O emissions (<0.09 mg N m�2 h�1)with low DO concentrations (<0.6 mg L�1) and within therange found for WWTP-2 (between 0.3 and 1 mg L�1). How-
ever, WWTP-1 operated with low TKN removal efficiency(27%) (Table 2), unlike WWTP-2 (61–97%). Thus, WWTP-1 requires DO concentrations within the range of 1 and3 mg L�1 to combine both oxidation of organic matter and
nitrification processes, as described previously (AC 2).These results could be explained by microorganism adap-tation to WWTP-2 operating conditions (limited DO
concentrations). Microorganism adaptation to limited DOconcentrations has been reported in the literature (Belluciet al. ; Wunderlin et al. ). Belluci et al. ()
achieved complete nitrification in a laboratory-scale reactorat DO concentrations as low as 0.5 mg L�1, where high per-formance resulted from elevated ammonia oxidation
bacteria (AOB) levels in the reactor. Thus, WWTP-1 underAC 1 would need to alter certain operating conditions, com-bining reduced SRT and extended HRT, to favour the AOBnitrifying process. In addition, the denitrification process
should be conducted, combined not only with TKN butalso TN (as N2), since WWTP-1 was not designed to
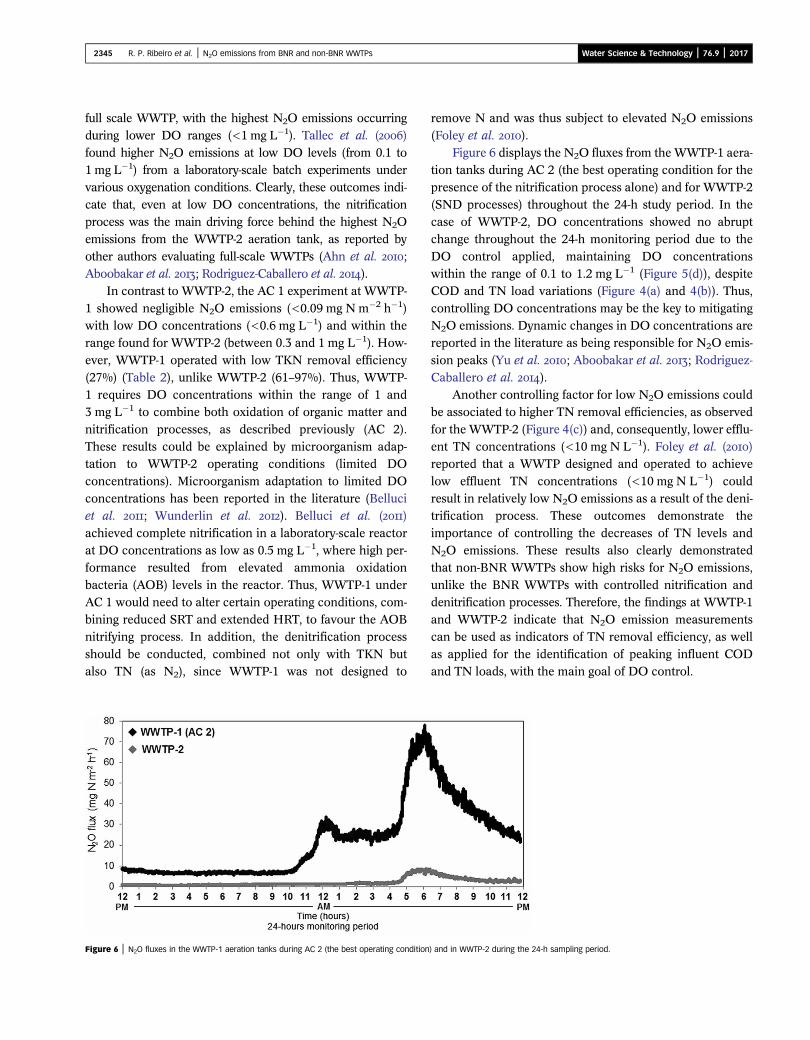
Figure 6 | N2O fluxes in the WWTP-1 aeration tanks during AC 2 (the best operating condition
remove N and was thus subject to elevated N2O emissions
(Foley et al. ).Figure 6 displays the N2O fluxes from the WWTP-1 aera-
tion tanks during AC 2 (the best operating condition for the
presence of the nitrification process alone) and for WWTP-2(SND processes) throughout the 24-h study period. In thecase of WWTP-2, DO concentrations showed no abruptchange throughout the 24-h monitoring period due to the
DO control applied, maintaining DO concentrationswithin the range of 0.1 to 1.2 mg L�1 (Figure 5(d)), despiteCOD and TN load variations (Figure 4(a) and 4(b)). Thus,
controlling DO concentrations may be the key to mitigatingN2O emissions. Dynamic changes in DO concentrations arereported in the literature as being responsible for N2O emis-
sion peaks (Yu et al. ; Aboobakar et al. ; Rodriguez-Caballero et al. ).
Another controlling factor for low N2O emissions couldbe associated to higher TN removal efficiencies, as observed
for the WWTP-2 (Figure 4(c)) and, consequently, lower efflu-ent TN concentrations (<10 mg N L�1). Foley et al. ()reported that a WWTP designed and operated to achieve
low effluent TN concentrations (<10 mg N L�1) couldresult in relatively low N2O emissions as a result of the deni-trification process. These outcomes demonstrate the
importance of controlling the decreases of TN levels andN2O emissions. These results also clearly demonstratedthat non-BNR WWTPs show high risks for N2O emissions,
unlike the BNR WWTPs with controlled nitrification anddenitrification processes. Therefore, the findings at WWTP-1and WWTP-2 indicate that N2O emission measurementscan be used as indicators of TN removal efficiency, as well
as applied for the identification of peaking influent CODand TN loads, with the main goal of DO control.
) and in WWTP-2 during the 24-h sampling period.

2346 R. P. Ribeiro et al. | N2O emissions from BNR and non-BNR WWTPs Water Science & Technology | 76.9 | 2017
WWTP-3: NHþ4 , NO
�2 and NO�
3 profiles
Figure 7 displays the concentration patterns of DIN forms(NHþ
4 , NO�2 and NO�
3 ) along the six WWTP-3 aeration
tank zones on June 30th, 2014, before and after the inputof landfill leachate. The NHþ
4 concentration patternsduring both periods were similar, with the highest concen-trations present in the first four zones, followed by a sharp
decrease in the last two (Figure 7(a)). As proposed byRibeiro et al. (), DO drives the oxidation of organic
Figure 7 | Spatial variability of (a) N� NHþ4 , (b) N� NO�
2 , (c) N� NO�3 concentrations
throughout the six aeration tank zones on June 30th, 2014; without and with
landfill leachate input.
matter in the first four zones and therefore nitrification
takes place only in the last two.During the period without any landfill leachate input,
decreases in NHþ4 concentrations from 5.5 to 0.3 mg N L�1
and increasing NO�3 concentrations from 0.1 to 4 mg N L�1
were observed throughout the six aeration tank zones(ZN1-ZN6), with negligible NO�
2 concentrations (Figure 7).The NHþ
4 degradation rate was of 3.3 mg N L�1 h�1, and NO�2
and NO�3 production rates were 0.2 and 2.5 mg N L�1 h�1,
respectively. These results indicate that complete nitrifica-tion was achieved, since 75% of the NHþ
4 was converted
into NO�3 , with no significant denitrifying activity. A similar
profile was observed during the landfill leachate input, whenNHþ
4 decreased from 29 to 9.2 mg N L�1 with increasing
NO�3 values (ranging from 1 to 9.1 mg N L�1) throughout
the six aeration tank zones. In contrast, an NO�2 accumu-
lation from 0.3 to 1.5 mg L�1 in the last two zonesoccurred (ZN4-ZN6) (Figure 7(b)). The NHþ
4 degradation
rate was of 13 mg N L�1 h�1, and the NO�2 and NO�
3 pro-duction rates were 0.9 and 5.2 mg N L�1 h�1, respectively.Around 40% of the NHþ
4 was converted into NO�3 , indicat-
ing probable simultaneous nitrifying and denitrifyingactivities (N loss as N2). These results indicate that organicshock loading (input of landfill leachate) is responsible for
the accumulation of NO�2 , with a loss of NHþ
4 conversionto NO�
3 (from 75 to 40%). These results clearly demonstratethat landfill leachate input is an important factor influencing
the efficiency of complete nitrification.
WWTP-3: N2O emissions
N2O emission monitoring was carried out only at ZN 5, dueto the higher available DO concentrations and the evolutionof the nitrification process in ZN4-ZN6 of the aeration tank,
as described previously (Figure 7) and reported by Ribeiroet al. (). Figure 8 displays the variation of N2O fluxesand DO concentrations at ZN 5 during landfill leachate
input. During the first 90 min of the study period (from 9to 10:30 AM), the N2O emissions fluxes varied from 147to 561 mg N m�2 h�1 (Figure 8) and DO concentrations
varied from 2 to 6 mg L�1 at ZN 5 (Figure 8) characterizingcomplete nitrification, as described previously. Ribeiro et al.() found a similar N2O flux (250 mg N m�2 h�1) atthe same plant, linked to higher aeration rates and DO
concentrations (between 2 and 4 mg L�1), favouringcomplete nitrification. Thus, higher DO concentrations(DO� 2 mg L�1) seem to favour both oxidation of organic
matter and complete nitrification in the WWTP-3 aerationtank, as indicated by Ribeiro et al. ().
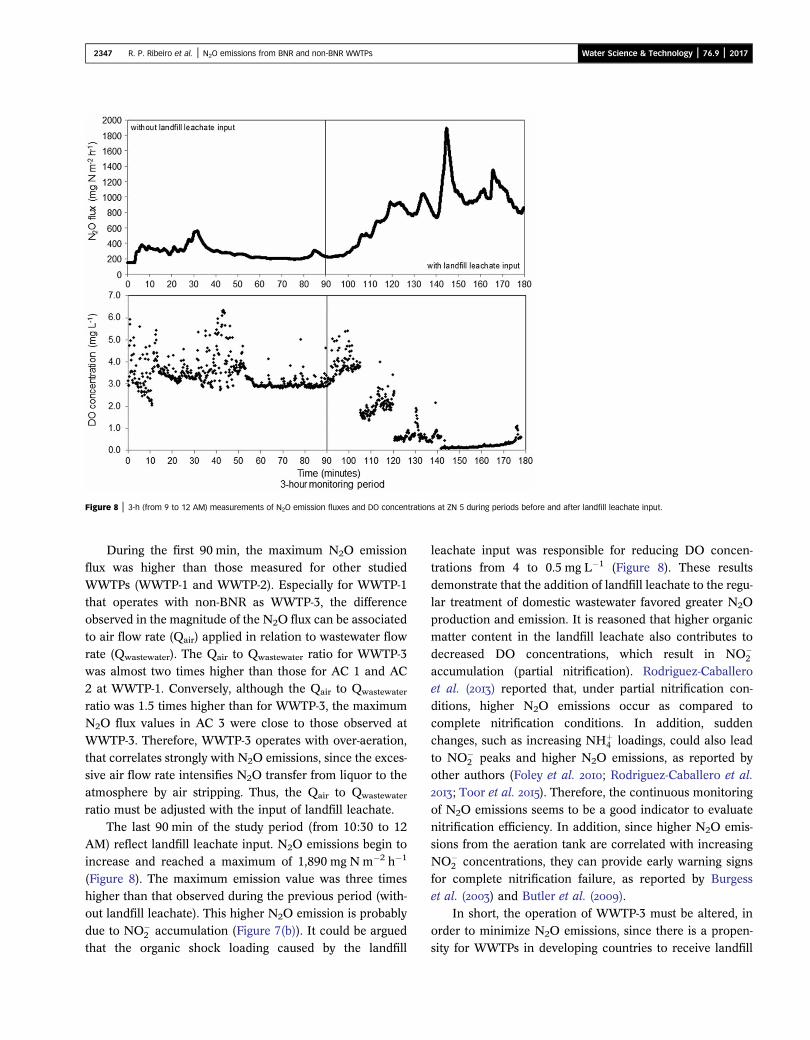
Figure 8 | 3-h (from 9 to 12 AM) measurements of N2O emission fluxes and DO concentrations at ZN 5 during periods before and after landfill leachate input.
2347 R. P. Ribeiro et al. | N2O emissions from BNR and non-BNR WWTPs Water Science & Technology | 76.9 | 2017
During the first 90 min, the maximum N2O emissionflux was higher than those measured for other studied
WWTPs (WWTP-1 and WWTP-2). Especially for WWTP-1that operates with non-BNR as WWTP-3, the differenceobserved in the magnitude of the N2O flux can be associatedto air flow rate (Qair) applied in relation to wastewater flow
rate (Qwastewater). The Qair to Qwastewater ratio for WWTP-3was almost two times higher than those for AC 1 and AC2 at WWTP-1. Conversely, although the Qair to Qwastewater
ratio was 1.5 times higher than for WWTP-3, the maximumN2O flux values in AC 3 were close to those observed atWWTP-3. Therefore, WWTP-3 operates with over-aeration,
that correlates strongly with N2O emissions, since the exces-sive air flow rate intensifies N2O transfer from liquor to theatmosphere by air stripping. Thus, the Qair to Qwastewater
ratio must be adjusted with the input of landfill leachate.The last 90 min of the study period (from 10:30 to 12
AM) reflect landfill leachate input. N2O emissions begin toincrease and reached a maximum of 1,890 mg N m�2 h�1
(Figure 8). The maximum emission value was three timeshigher than that observed during the previous period (with-out landfill leachate). This higher N2O emission is probably
due to NO�2 accumulation (Figure 7(b)). It could be argued
that the organic shock loading caused by the landfill
leachate input was responsible for reducing DO concen-trations from 4 to 0.5 mg L�1 (Figure 8). These results
demonstrate that the addition of landfill leachate to the regu-lar treatment of domestic wastewater favored greater N2Oproduction and emission. It is reasoned that higher organicmatter content in the landfill leachate also contributes to
decreased DO concentrations, which result in NO�2
accumulation (partial nitrification). Rodriguez-Caballeroet al. () reported that, under partial nitrification con-
ditions, higher N2O emissions occur as compared tocomplete nitrification conditions. In addition, suddenchanges, such as increasing NHþ
4 loadings, could also lead
to NO�2 peaks and higher N2O emissions, as reported by
other authors (Foley et al. ; Rodriguez-Caballero et al.; Toor et al. ). Therefore, the continuous monitoring
of N2O emissions seems to be a good indicator to evaluatenitrification efficiency. In addition, since higher N2O emis-sions from the aeration tank are correlated with increasingNO�
2 concentrations, they can provide early warning signs
for complete nitrification failure, as reported by Burgesset al. () and Butler et al. ().
In short, the operation of WWTP-3 must be altered, in
order to minimize N2O emissions, since there is a propen-sity for WWTPs in developing countries to receive landfill

2348 R. P. Ribeiro et al. | N2O emissions from BNR and non-BNR WWTPs Water Science & Technology | 76.9 | 2017
leachate into their wastewater systems. Organic shock load-
ing should be avoided through influent equalization duringlandfill leachate input.
CONCLUSION
The continuous measurement of N2O emissions in activatedsludge WWTPs operated with BNR and non-BNR was eval-uated and the main conclusions are as follows:
• Nitrification process is the main driving force behindN2O emission peaks.
• Variation of air flow rates influence significantlyN2O emissions; high emissions denote over-ACs orincomplete nitrification, with accumulation of NO�
2
concentrations.
• Continuous measurements of N2O emissions can provideinformation on aeration adequacy and the efficiency ofcomplete nitrification.
• Adequate control of DO concentrations is a key factor tomitigate N2O emissions.
• Sudden input of organic loads (e.g. due to landfill lea-
chate input) to the aeration tank of an activated sludgeprocess can lead to substantial increase of N2Oemissions.
• Non-BNR WWTPs are subject to high N2O emissions,unlike the BNR WWTPs, with controlled nitrificationand denitrification processes.
REFERENCES
Aboobakar, A., Cartmell, E., Stephenson, T., Jones, M., Vale, P. &Dotro, G. Nitrous oxide emissions and dissolved oxygenprofiling in a full-scale nitrifying activated sludge treatmentplant. Water Res. 47, 524–534.
Ahn, J. O., Kim, S., Park, H., Rahm, B., Pagilla, K. & Chandran, K. N2o emissions from activated sludge processes, 2008–2009: results of a national monitoring survey in the UnitedStates. Environ. Sci. Technol. 44, 4505–4511.
APHA Standard Methods for the Examination of Water andWastewater, 22nd edn. American Public Health Association,Washington, DC, USA.
Belluci, M., Ofiteru, I. D., Graham, D. W., Head, I. M. & Curtis, T.P. Low-dissolved-oxygen nitrifying systems exploitammonia-oxidizing bacteria with unusually high yields. Appl.Environ. Microbiol. 77 (21), 7787–7796.
Brotto, A. C., de Mello, W. Z., Kligerman, D. C. & Piccoli, A. S. Nitrous oxide emissions from activated sludgewastewater treatment plant with prolonged aeration process.Quim. Nova 33, 618–623 (in Portuguese).
Brotto, A. C., Kligerman, D. C., Andrade, S. A., Ribeiro, R. P.,Oliveira, J. L. M., Chandran, K. & de Mello, W. Z. Factors controlling nitrous oxide emissions from a full-scaleactivated sludge system in the tropics. Environ. Sci. Pollut.Res. Int. 22, 11840–11849.
Burgess, J. E., Stuetz, R. M., Morton, S. & Stephenson, T. Dinitrogen oxide detection for process failure early warningsystems. Water Sci. Tech. 45 (4–5), 247–254.
Butler, M. D., Wang, Y. Y., Cartmell, E. & Stephenson, T. Nitrous oxide emissions for early warning of biologicalnitrification failure in activated sludge. Water Res. 43,1265–1272.
Castro-Barros, C. M., Daelman, M. R. J., Mampaey, K. E., vanLoosdrecht, M. C. M. & Volcke, E. I. P. Effect of aerationregime on N2O emission from partial nitritation-anammox ina full-scale granular sludge reactor. Water Res. 68, 793–803.
Crutzen, P. J. The role of NO and NO2 in the chemistry of thetroposphere and stratosphere. Annu. Rev. Earth Planet Sci. 7,443–472.
Czepiel, P., Crill, P. & Harriss, R. Nitrous oxide emissionsfrom municipal wastewater treatment. Environ. Sci. Technol.29, 2352–2356.
Daelman, M. R. J., de Baets, B., van Loosdrecht, M. C. & Volcke, E. I. Influence of sampling strategies on the estimated nitrousoxide emission from wastewater treatment plants. Water Res.47, 3120–3130.
Daelman, M. R. J., van Voorthuizen, E. M., van Dongen, U. G. J.M., Volcke, E. I. P. & van Loosdrecht, M. C. M. Seasonaland diurnal variability of N2O emissions from a full-scalemunicipal wastewater treatment plant. Sci. Total Environ.536, 1–11.
de Mello, W. Z., Ribeiro, R. P., Brotto, A. C., Kligerman, D. C.,Piccoli, A. S. & Oliveira, J. L. M. Nitrous oxide emissionfrom an intermittent aeration activated sludge system of anurban wastewater treatment plant. Quim. Nova 36, 16–20.
Foley, J., de Haas, D., Yuan, Z. & Lant, P. Nitrous oxidegeneration in full-scale biological nutrient removalwastewater treatment plants. Water Res. 44, 831–844.
Intergovernmental Panel on Climate Change, IPCC IPCCGuidelines for National Greenhouse Gas Inventories, v. 5,Kanagawa.
Intergovernmental Panel on Climate Change, IPCC Climatechange 2013: the physical science basis. In: Contribution ofWorking Group I to the Fifth Assessment Report of theIntergovernmental Panel on Climate Change (T. F. Stocker,D. Qin, G.-K. Plattner, M. Tignor, S. K. Allen, J. Boschung,A. Nauels, Y. Xia, V. Bex & P. M. Midley, eds). CambridgeUniversity Press, New York, NY, USA.
Kampschreur, M. J., Temmink, H., Kleerebezem, R., Jetten, M. S. M.& van Loosdrecht, M. C. M. Nitrous oxide emissionduring wastewater treatment. Water Res. 43, 4093–4103.
Law, Y., Ye, L., Pan, Y. & Yuan, Z. Nitrous oxide emissionsfrom wastewater treatment processes. Philos. T Roy. Soc. B.367, 1265–1277.
Lotito, A. M., Wunderlin, P., Joss, A., Kipf, M. & Siegrist, H. Nitrous oxide emissions from the oxidation tank of a pilotactivated sludge plant. Water Res. 46, 3563–3573.

2349 R. P. Ribeiro et al. | N2O emissions from BNR and non-BNR WWTPs Water Science & Technology | 76.9 | 2017
Ravishankara, A. R., Daniel, J. S. & Portman, R. W. Nitrousoxide (N2O): the dominant ozone depleting substanceemitted in the 21st century. Science 326, 123–125.
Ribeiro, R. P., de Mello, W. Z., Kligerman, D. C., Oliveira, J. L. M.,Alvim, R. B., Andrade, A. S., Brotto, A. C. & de Almeida, P. A. Emissões de óxido nitroso do tanque de aeração de umaestaçãode tratamento de esgotos comsistema de lodos ativadosconvencional. Quim. Nova 36, 998–1003 (in Portuguese).
Ribeiro, R. P., Alvim, R. B., Andrade, S. A., Kligerman, D. C., deAlmeida, P. A., Oliveira, J. L. M. & de Mello, W. Z. Controlling factors of nitrous oxide emissions from aconventional activated sludge wastewater treatment plant.Engevista 17 (3), 375–384.
Rodriguez-Caballero, A., Ribera, A., Balcázar, J. L. & Pijuan, M. Nitritation versus full nitrification of ammonium-richwastewater: comparison in terms of nitrous and nitric oxidesemissions. Bioresour. Technol. 139, 195–202.
Rodriguez-Caballero, A., Aymerich, I., Poch, M. & Pijuan, M. Evaluation of process conditions triggering emissions ofgreen-house gases from a biological wastewater treatmentsystem. Sci. Total Environ. 493, 384–391.
Ruiz, G., Jeison, D. & Chamy, R. Nitrification with high nitriteaccumulation for the treatment of wastewater with highammonia concentration. Water Res. 37 (6), 1371–1377.
Strokal, M. & Kroeze, C. Nitrous oxide (N2O) emissions fromhuman waste in 1970–2050. Curr. Opin. Environ. Sustain.9–10, 108–121.
Tallec, G., Garnier, J., Billen, G. & Gousailles, M. Nitrousoxide emissions from secondary activated sludge in nitrifyingconditions of urban wastewater treatment plants: effect ofoxygenation level. Water Res. 40, 2972–2980.
Toor, U. A., Han, D. W. & Kim, D. J. Effect of organics onnitrous oxide emission during wastewater nitrification withenriched nitrifiers. Int. Biodeter. Biodegr. 102, 94–99.
von Sperling, M. Activated Sludge: Principles of theBiological Treatment of Sewage. Universidade Federal deMinas Gerais, Belo Horizonte, Brazil (in Portuguese).
Wrage, N., Velthof, G. L., van Beusichem, M. L. & Oenema, O. Role of nitrifier denitrification in the production ofnitrous oxide. Soil. Biol. Biochem. 33, 1723–1732.
Wunderlin, P., Mohn, J., Joss, A., Emmenegger, L. & Siegrist, H.Mechanisms of N2O production in biological wastewatertreatment under nitrifying and denitrifying conditions. WaterRes. 46 (4), 1027–1037.
Yu, R., Kampschreur, M. J., van Loosdrecht, M. C. M. &Chandran, K. Mechanisms and specific directionality ofautotrophic nitrous oxide and nitric oxide generation duringtransient anoxia. Environ. Sci. Technol. 44 (4), 1313–1319.
First received 17 March 2017; accepted in revised form 21 June 2017. Available online 6 July 2017