The reproducibility of left ventricular volume and mass measurements: a comparison between...
6
Eur Radiol (2006) 16: 32–37 DOI 10.1007/s00330-005-2853-3 CARDIAC Sarah Clay Khaled Alfakih Daniel R. Messroghli Timothy Jones John P. Ridgway Mohan U. Sivananthan Received: 8 March 2005 Revised: 6 June 2005 Accepted: 28 June 2005 Published online: 20 August 2005 # Springer-Verlag 2005 The reproducibility of left ventricular volume and mass measurements: a comparison between dual-inversion-recovery black-blood sequence and SSFP Abstract The aim of this study was to compare a dual-inversion-recovery black-blood (BB) magnetic resonance imaging (MRI) sequence with steady- state free precession (SSFP) for the assessment of left ventricular param- eters. The improved endocardial bor- der definition seen with SSFP was not observed at the epicardial border. Improvements in segmentation at the left ventricular epicardial border have been observed with this black-blood sequence. Left ventricular (LV) mass and LV end-diastolic volume (EDV) measurements as well as inter- observer and intra-observer variability were compared between images ac- quired with a dual inversion BB and SSFP sequence. The mean±1 standard deviation (SD) for LV EDV was 178.3±52.7 ml measured with SSFP and 158.8±62.2 ml with BB. This difference was not statistically signif- icant (p=0.22). For SSFP, the mean value of LV mass was 124.0±27.0 g and 147.5±37.4 g for BB, a statisti- cally significant difference (p<0.0001). The dual-inversion-re- covery BB imaging showed improved reproducibility for LV mass measure- ments compared with SSFP and im- proved spatial resolution. For studies requiring LV mass measurements, the dual-inversion-recovery BB sequence offers improved spatial resolution and improved reproducibility to SSFP. Keywords Magnetic resonance imaging . Left ventricular volume and mass . Black-blood imaging . Observer variability Introduction Steady-state free precession (SSFP) is now regarded as the preferred technique for data acquisition for left ventricular (LV) volume and mass measurements as it provides better definition between blood and myocardium than conven- tional turbo gradient echo (TGE) sequences. This is due to the high intrinsic contrast based on the relaxation proper- ties of blood and myocardium [1–3]. All bright blood sequences, including SSFP, are rela- tively easy to obtain, but their blood signal intensities are variable, and they are dependent on the cardiac phase [4, 5]. This affects the efficacy of blood pool and myocardial segmentation, which is not only dependent on good blood– myocardium contrast but also on uniform blood signal intensity [5]. Blood flow can also affect image quality because in certain conditions, static blood gives a magnetic resonance (MR) signal whereas rapidly flowing blood does not. This is significant during diastole because the slow- moving blood in the ventricular lumen can affect the de- finition of the endocardial border [6, 7]. It was suggested that sequences providing black-blood (BB) images of the heart by suppressing the blood signal completely could therefore provide more accurate mea- surements of LV parameters [4]. BB imaging using spin- echo-based methods has demonstrated some advantage for segmentation for the measurement of myocardial mass [6]. Calculating LV mass is a good method of assessing cardiac function and is clinically important, as 30% of patients with hypertension have LV hypertrophy [2]. There is a direct linear relationship between cardiovascu- lar morbidity and mortality and LV mass, highlighting the S. Clay (*) . K. Alfakih . D. R. Messroghli . T. Jones . J. P. Ridgway . M. U. Sivananthan Leeds General Infirmary, BHF Cardiac MRI Unit, B Floor, Clarendon Wing, Great George Street, Leeds, LS1 3EX, UK e-mail: [email protected] Tel.: +44-773-6323927 Fax: +44-113-3925690
-
Upload
sarah-clay -
Category
Documents
-
view
212 -
download
0
Transcript of The reproducibility of left ventricular volume and mass measurements: a comparison between...

Eur Radiol (2006) 16: 32–37DOI 10.1007/s00330-005-2853-3 CARDIAC
Sarah ClayKhaled AlfakihDaniel R. MessroghliTimothy JonesJohn P. RidgwayMohan U. Sivananthan
Received: 8 March 2005Revised: 6 June 2005Accepted: 28 June 2005Published online: 20 August 2005# Springer-Verlag 2005
The reproducibility of left ventricular volumeand mass measurements: a comparisonbetween dual-inversion-recovery black-bloodsequence and SSFP
Abstract The aim of this study was tocompare a dual-inversion-recoveryblack-blood (BB) magnetic resonanceimaging (MRI) sequence with steady-state free precession (SSFP) for theassessment of left ventricular param-eters. The improved endocardial bor-der definition seen with SSFP was notobserved at the epicardial border.Improvements in segmentation at theleft ventricular epicardial border havebeen observed with this black-bloodsequence. Left ventricular (LV) massand LV end-diastolic volume (EDV)measurements as well as inter-observer and intra-observer variabilitywere compared between images ac-quired with a dual inversion BB andSSFP sequence. The mean±1 standarddeviation (SD) for LV EDV was178.3±52.7 ml measured with SSFP
and 158.8±62.2 ml with BB. Thisdifference was not statistically signif-icant (p=0.22). For SSFP, the meanvalue of LV mass was 124.0±27.0 gand 147.5±37.4 g for BB, a statisti-cally significant difference(p<0.0001). The dual-inversion-re-covery BB imaging showed improvedreproducibility for LV mass measure-ments compared with SSFP and im-proved spatial resolution. For studiesrequiring LV mass measurements, thedual-inversion-recovery BB sequenceoffers improved spatial resolution andimproved reproducibility to SSFP.
Keywords Magnetic resonanceimaging . Left ventricular volume andmass . Black-blood imaging .Observer variability
Introduction
Steady-state free precession (SSFP) is now regarded as thepreferred technique for data acquisition for left ventricular(LV) volume and mass measurements as it provides betterdefinition between blood and myocardium than conven-tional turbo gradient echo (TGE) sequences. This is due tothe high intrinsic contrast based on the relaxation proper-ties of blood and myocardium [1–3].
All bright blood sequences, including SSFP, are rela-tively easy to obtain, but their blood signal intensities arevariable, and they are dependent on the cardiac phase [4,5]. This affects the efficacy of blood pool and myocardialsegmentation, which is not only dependent on good blood–myocardium contrast but also on uniform blood signalintensity [5]. Blood flow can also affect image quality
because in certain conditions, static blood gives a magneticresonance (MR) signal whereas rapidly flowing blood doesnot. This is significant during diastole because the slow-moving blood in the ventricular lumen can affect the de-finition of the endocardial border [6, 7].
It was suggested that sequences providing black-blood(BB) images of the heart by suppressing the blood signalcompletely could therefore provide more accurate mea-surements of LV parameters [4]. BB imaging using spin-echo-based methods has demonstrated some advantagefor segmentation for the measurement of myocardial mass[6]. Calculating LV mass is a good method of assessingcardiac function and is clinically important, as 30% ofpatients with hypertension have LV hypertrophy [2].There is a direct linear relationship between cardiovascu-lar morbidity and mortality and LV mass, highlighting the
S. Clay (*) . K. Alfakih .D. R. Messroghli . T. Jones .J. P. Ridgway . M. U. SivananthanLeeds General Infirmary,BHF Cardiac MRI Unit,B Floor, Clarendon Wing,Great George Street,Leeds, LS1 3EX, UKe-mail: [email protected].: +44-773-6323927Fax: +44-113-3925690
need and importance of accurate LV mass measurements[3]. The improvements in endocardial border definitionseen with SSFP are not observed at the epicardial border,which can be difficult to define accurately. Unlike LVvolume, accurate LV mass measurements are reliant onboth accurate epicardial and endocardial border definition.It is known that improved definition between myocardiumand the surrounding tissues is present in BB images. Thissuggests that BB sequences may be more accurate andreproducible than SSFP for LV mass measurements. SSFPis known to have greater intrinsic contrast between bloodand myocardium than segmented k space TGE, but nocomparisons between SSFP and BB images have beenreported previously. The aim of this study was to comparethe technical aspects as well as measurements of LVvolume and mass and the reproducibility of this BB dual-inversion-recovery sequence with SSFP.
Methods
Subjects
Sixteen normal subjects were recruited (six women: meanage, 28.5±14 years; ten men; mean age, 29.2±19 years)with no history of cardiovascular disease and normal rest-ing blood pressure. Four patients were recruited (four men:mean age, 31.5; range 19 years), two with dilated ventriclesand two with electrocardiographic features of left ventric-ular hypertrophy. All subjects’ height, weight, age, bloodpressure and body surface area (BSA) were recorded at thetime of the scan.
Subjects were excluded if found to have contraindica-tions to MRI scanning, e.g. pacemakers, aneurysm clips orclaustrophobia. Other exclusion criteria included arrhyth-mias, age over 65 and under 18, elite athletes and preg-nancy. The study received local ethics committee approval,and informed consent was obtained from all subjects.
Acquisition protocol
The MRI studies were performed on a 1.5-Tesla PhilipsIntera CV MRI system (Philips Medical Systems, Best,The Netherlands) equipped with Master gradients withmaximum gradient amplitude of 30 mT/m and a maximumslew rate of 150 mT/m/msec. All subjects were imaged inthe supine position using a vectorcardiographic method forECG synchronisation and a five-element cardiac phased-array coil. All acquisitions were obtained during breathholding in expiration. Following standard survey imagesusing a scout sequence, breath-hold cine acquisitions inthe ventricular long axis, short axis and horizontal longaxis planes were acquired to ensure accurate planning ofthe left ventricular short axis orientation. From the hor-izontal long axis, a stack of short axis images parallel to
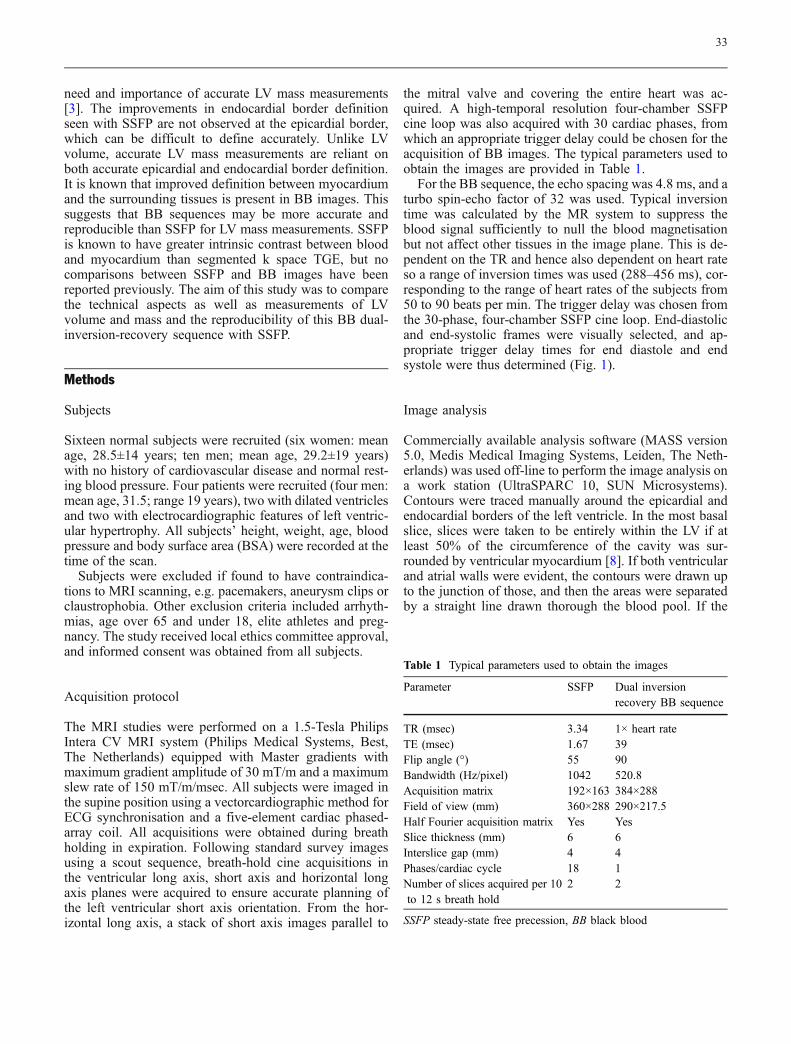
the mitral valve and covering the entire heart was ac-quired. A high-temporal resolution four-chamber SSFPcine loop was also acquired with 30 cardiac phases, fromwhich an appropriate trigger delay could be chosen for theacquisition of BB images. The typical parameters used toobtain the images are provided in Table 1.
For the BB sequence, the echo spacing was 4.8 ms, and aturbo spin-echo factor of 32 was used. Typical inversiontime was calculated by the MR system to suppress theblood signal sufficiently to null the blood magnetisationbut not affect other tissues in the image plane. This is de-pendent on the TR and hence also dependent on heart rateso a range of inversion times was used (288–456 ms), cor-responding to the range of heart rates of the subjects from50 to 90 beats per min. The trigger delay was chosen fromthe 30-phase, four-chamber SSFP cine loop. End-diastolicand end-systolic frames were visually selected, and ap-propriate trigger delay times for end diastole and endsystole were thus determined (Fig. 1).
Image analysis
Commercially available analysis software (MASS version5.0, Medis Medical Imaging Systems, Leiden, The Neth-erlands) was used off-line to perform the image analysis ona work station (UltraSPARC 10, SUN Microsystems).Contours were traced manually around the epicardial andendocardial borders of the left ventricle. In the most basalslice, slices were taken to be entirely within the LV if atleast 50% of the circumference of the cavity was sur-rounded by ventricular myocardium [8]. If both ventricularand atrial walls were evident, the contours were drawn upto the junction of those, and then the areas were separatedby a straight line drawn thorough the blood pool. If the
Table 1 Typical parameters used to obtain the images
Parameter SSFP Dual inversionrecovery BB sequence
TR (msec) 3.34 1× heart rateTE (msec) 1.67 39Flip angle (°) 55 90Bandwidth (Hz/pixel) 1042 520.8Acquisition matrix 192×163 384×288Field of view (mm) 360×288 290×217.5Half Fourier acquisition matrix Yes YesSlice thickness (mm) 6 6Interslice gap (mm) 4 4Phases/cardiac cycle 18 1Number of slices acquired per 10to 12 s breath hold
2 2
SSFP steady-state free precession, BB black blood
33

aortic valve was visible in the basal slice, the blood volumeup to the valve was included. Care was taken to ensuretricuspid septal papillary muscles arising from the inter-ventricular septum were excluded from the LV mass.Contours were traced systematically on each subject’s dataset by two independent observers. One observer then re-peated the measurements after at least a 1-week interval.The LV end-diastolic volume (EDV), end-systolic volume(ESV) and end-diastolic mass (EDM) were computed onthe MASS software using the modified Simpson’s rule.
Statistical analysis
The mean±1 standard deviations (SD) were calculated forthe LV parameters measured; EDV, ESV, EDM andejection fraction. The Bland–Altman method was used tocalculate bias, the mean difference between two sets ofmeasurements and the limits of agreement [9]. Observervariability was expressed as the SD of the difference (SDD)between two means and the percentage variability ex-pressed as the SDD of the two readings divided by theaverage value of the two readings. Pearson’s correlationwas calculated, and paired sample t tests were performedto determine significant differences between two sets ofresults.
Results
The acquisition time was similar between the two tech-niques; a slice was acquired every seven heartbeats withthe BB sequence compared with every six beats withSSFP, so two slices could be acquired within every 10–12 s breath hold. Images covering the whole of the LVwere acquired in less than 3 min for each sequence. Thecomparative temporal and spatial resolution between thetwo techniques is shown in Table 2. Temporal resolution
is reflected by the data acquisition duration for the twotechniques. In the case of the multiphase (SSFP) se-quence, the data acquisition window for each point in thecardiac cycle is 48 ms. The data acquisition window forthe single-phase BB sequence was 150 ms. The spatialresolution of the BB images was also significantly betterthan SSFP (0.76×0.76 versus 1.90×1.77) This increasedspatial resolution made the contour drawing easier andhence shortened analysis time, as there was better def-inition between blood and myocardium at the endocardialborder and between myocardium and surrounding tissuesat the epicardial border.
The means±1 standard deviation for each of the LVparameters measured with the SSFP and BB sequences areshown in Table 3. Differences between the measurementsare apparent for all the LV parameters. A paired t test wasperformed to investigate if these differences were statisti-cally significant, and the results are shown in Table 4.Pearson’s correlation test was also carried out to investigatehow closely the results from the BB images correlate withthe results from the SSFP images. The correlation co-efficients are also shown in Table 4.
Fig. 1 The same mid-ventricu-lar slice of the same volunteertaken with a steady-state freeprecession (SSFP) pulse se-quence (left) and a black-blood(BB) pulse sequence (right)
Table 2 The temporal and spatial resolution for each sequence
SSFP Dual inversion recovery BBsequence
Spatial resolution 1.90×1.77 0.76×0.76Temporalresolutiona
48 ms 150 ms
SSFP steady-state free precession, BB black blooda Temporal resolution is reflected by the data acquisition duration forthe two techniques. In the case of the multiphase (SSFP) data,acquisition for each point in the cardiac cycle is 48 ms. For thesingle-phase BB, the acquisition time is 150 ms
34

BB imaging under-estimated LV EDV and over-es-timated LV mass when compared with SSFP imaging.The mean±1 standard deviation (SD) for LV EDV was178.3±52.7 ml measured with SSFP and 158.8±62.2 mlwith BB. This difference was not statistically significant(p=0.22). For SSFP, the mean value of LV mass was124.0±27.0 g and for BB 147.5±37.4 g, a statisticallysignificant difference (p<0.0001). The results for LVESV from ten of the normal subjects were very similar:54.8±18.4 ml measured with SSFP versus 53.0±19.7 mlwith BB, but this difference was not statistically sig-nificant. There was a statistically significant variation(p=0.001) between the measurements for ejection frac-tion: 64.9±4.0% measured with SSFP versus 54.5±7.3%with BB. Good correlation was seen between the BBsequence and SSFP for mass and ESV measurements(r2=0.97 and 0.93, respectively).
The observer variability expressed as the SD of thedifference (SDD) between LV mass as measured with theBB sequence and SSFP sequence were 3.3 versus 4.5 forinter-observer variability and 3.6 versus 2.9 for intra-observer variability, respectively, for BB versus SSFP.The SDD for LV EDV was 8.6 versus 5.7 for inter-observer variability and 10.0 versus 4.7 for intra-observervariability. The inter-observer variability for LV ESV was4.3 versus 3.8, and the intra-observer variability was 6.1versus 3.6. The inter-observer variability for ejectionfraction was 3.8 versus 3.0, and intra-observer variability
was 5.0 versus 1.9. The SDD was also expressed as apercentage of the mean result. (Tables 5 and 6.)
Discussion
The concept of SSFP was first introduced in the 1980s, butits early application was unsuccessful due to artefactscaused by magnetic-field inhomogeneities. Improvementsin field homogeneity and the development of higher-performance gradient systems resulted in its recent suc-cessful re-application as a validated, fast-imaging sequence[10]. Both Plein et al. [3] and Moon et al. [11] showedthat SSFP produces clearer images that are independentof flow characteristics, generating greater intrinsic con-trast between myocardium and blood pool compared tothe then reference standard, TGE. Carr et al. [12] andThiele et al. [13] published similar findings and alsoshowed SSFP to have improved blood–myocardial con-trast-to-noise ratio and shorter breath-hold times. It wasthought SSFP may, however under-estimate mass andover-estimate EDV, but validation of SSFP with an animalmodel has shown that ventricular mass can be accuratelymeasured to within 3% of the true mass [10]. No val-idation studies have been done using TGE, but SSFP maybe more accurate than TGE due to its improved endocar-dial border definition. The high-quality images producedusing SSFP can be susceptible to flow artefacts, par-ticularly if the aorta is included obliquely through theslice. However, they do not usually affect end diastole andend systole, as peak aortic flow occurs during mid systole.SSFP is now the technique of choice for image acquisitionin cardiac MR and has superseded conventional TGE. It isknown, however, that the improvements in endocardialborder definition with SSFP are not mirrored at the epi-cardial border. BB imaging has been suggested to improvethe contrast between the myocardium and surroundingtissues at the epicardial border.
LVmass measurements as measured by the BB sequencein this study were significantly higher (p<0.0001) than LVmass measurement using SSFP. However, the differencebetween BB and SSFP LV EDV measurements was notstatistically significant (p=0.22). A trigger delay set at theend of the R–R interval in the dual-inversion-recovery BBsequence may account, in part, for the variability in LVEDV, and hence the ‘end-diastolic’ images were possiblybeing acquired before the ventricle had fully dilated insome patients, particularly in the presence of variable heartrate. This probably resulted in the increased variability ofLV EDV measurements for the BB sequence and hence thelarger SDs, resulting in no significant difference beingdetected between SSFP and BB measurements.
BB imaging was found to have very similar repro-ducibility to SSFP as assessed by the inter-observer andintra-observer variability, particularly for LV mass mea-surements. The inter-observer variability of BB LV mass
Table 4 The correlation coefficients and results from a paired t testfor the comparison of black blood (BB) to the steady-state freeprecession (SSFP) results
EDV (n=20) Mass (n=20) ESV (n=10) EF (n=10)
Paired t test p=0.22 p<0.0001 p=0.47 p=0.001Pearson’scorrelation
r=0.5 r=0.97 r=0.93 r=0.28
EDV end-diastolic volume, ESV end-systolic volume, EF ejectionfraction, r correlation coefficient
Table 3 The mean±1 standard deviation (SD) for left-ventricular(LV) mass and LV end-diastolic volume (EDV) measured usingsteady-state free precession (SSFP) and black-blood (BB) imaging(n=20)
SSFP BBMean±1 SD Mean±1 SD
LV EDV (ml) 178.3±52.7 158.8±62.2LV mass (g) 124.0±27.0 147.5±37.4LV EDV/BSA 82.5±17.8 78.9±32.1LV mass/BSA 64.9±11.1 77.0±14.5ESV (ml) 54.8±18.4 53.0±19.7EF (%) 64.9±4.0 54.5±7.3
BSA body surface area, ESV end-systolic volume, EF ejectionfraction
35

measurements was lower than SSFP measurements. Thismay be explained by the improved spatial resolution andepicardial border definition in BB images. This can makesegmentation easier and the papillary muscles and tra-beculations more distinguishable. This better epicardialborder definition may account for the larger estimates ofLV mass compared with SSFP, but it might also possibly bedue to slow-moving blood around the edge of the myo-cardium, resulting in artefact being included inside theepicardial contour. The improved epicardial border defini-tion has another potential benefit, as it may also improvethe success of automated contour detection programmes,which have yet to be implemented successfully.
Parallel acquisition techniques such as GRAPPA orSENSE can allow for further acceleration of acquisitiontime and hence improvements in either temporal or spatialresolution in real-time cine imaging [14, 15]. They can alsobe applied to single-phase acquisition techniques such asthis BB sequence to shorten the breath-hold length or bydecreasing the echo train length, thus shortening the ac-quisition window. Reducing breath-holding time is im-portant, as the majority of patients requiring cardiac MRstudies have other co-morbidities including obesity andshortness of breath, which can cause poor patient compli-ance in terms of breath-holding and significantly reduce
image quality [15]. Even in patients where breath holdingis not a problem, SENSE can be used to improve the signaluniformity over the field of view with a dedicated coil,which may also improve the performance of automatedcontour detection.
BB techniques are not limited to providing data on LVmass in cardiac MR; advantages have also been shown forthe assessment of the coronary arteries (MRCA) [16].Bright blood techniques have several limitations in MRangiography (MRA), including difficulty identifying lu-minal stenosis, as turbulent blood flow can appear asartifactual darkening. Also, thrombus can appear as high-signal intensity, obscuring any stenosis present. A BBsequence that suppresses the blood signal in small-diametervessels such as the coronary arteries and provides sub-stantial contrast between blood and myocardium can ac-curately depict luminal disease, as shown by Stuber et al.[17]. This is just one example of the further potentialapplications of this dual-inversion-recovery BB sequence.
Limitations
A limitation of this dual-inversion-recovery BB sequence,however, is the acquisition of a single image corresponding
Table 6 The inter-observer and intra-observer variability for left ventricular (LV) end-systolic volume (ESV) and ejection fraction (EF)expressed as the standard deviation (SD) of the difference between two values (SDD) and this SDD expressed as a percentage of the meanresult (SDD%)
(n=10) ESV Inter-observer ESV Intra-observer EF Inter-observer EF Intra-observer
SSFP bias 0.5 0.6 1.0 1.0Limits of agreement −10.4 to 11.3 −6.5 to 7.6 −3.7 to 5.7 −3.7 to 5.7SDD 3.8 3.6 3.0 1.9SDD% 6.8% 6.5% 4.6% 2.9%BB bias 0.1 −1.8 −0.6 1.9Limits of agreement −8.4 to 8.7 −13.9 to 10.2 −8.0 to 6.8 −7.9 to 11.7SDD 4.3 6.1 3.8 5.0SDD% 8.2% 11.8% 6.8% 9.0%
SSFP steady-state free precession, BB black blood
Table 5 The inter-observer and intra-observer variability for left ventricular (LV) end-diastolic volume (EDV) and mass expressed as thestandard deviation (SD) of the difference between two values (SDD), and this SDD is expressed as a percentage of the mean result (SDD%)
(n=20) EDV Inter-observer EDV Intra-observer Mass Inter-observer Mass Intra-observer
SSFP bias 4.0 −0.4 1.2 −0.04Limits of agreement −7.5 to 15.4 −9.7 to 8.9 −7.9 to 10.3 −5.9 to 5.8SDD 5.7 4.7 4.5 2.9SDD% 3.3% 5.2% 3.7% 4.7%BB bias 3.5 −0.5 −0.9Limits of agreement −25.0 to 25.6 −16.5 to 23.5 −7.2 to 6.2 −8.1 to 6.3SDD 8.6 10.0 3.3 3.6SDD% 5.4% 6.3% 2.3% 5.0%
SSFP steady-state free precession, BB black blood
36
to the end-diastolic and end-systolic phases. These aredefined at the time of acquisition from a cine image asopposed to during a retrospective analysis of the multiple-phase bright-blood images. As a result, the true end-diastolic phase or end-systolic phase may not be captured,which is a potential limitation of all single-phase acquisi-tion sequences. The true end-systolic phase was not cap-tured in half of the subjects in this study, so they were notincluded in the analysis of LV ESV. However, somestudies using cardiac MRI only require measurements ofLV mass; for example, using cardiac MRI to evaluate theeffect of anti-hypertensives on LV regression. A furtherlimitation of this single-phase technique is that two sep-arate acquisitions are needed to acquire both end-diastolicand end-systolic images compared with a multi-phaseacquisition sequence such as SSFP. This study also had
a relatively small sample size, and the number of pa-tients included was limited. A larger clinical study wouldbe required to fully research the clinical role of this BBsequence.
Conclusion
The dual-inversion-recovery BB imaging sequence pro-duced images with improved spatial resolution comparedwith SSFP and improved reproducibility for LV massmeasurements. At present, the sequence is less suitable forthe measurement of LV volumes. A separate, normal rangewould need to be established because of the differences inmeasured LV volumes and mass.
References
1. Bloomer T, Plein S, Radjenovic A,Higgins DM, Jones TR, Ridgway JP,Sivananthan MU (2001) Cine MRIusing steady state free precession in theradial long axis orientation is a fastaccurate method for obtaining volu-metric data of the left ventricle. J MagnReson 14:685–692
2. Westbrook C (2002) MRI at a glance.Blackwell Publishing, Oxford
3. Plein S, Bloomer TN, Ridgway JP,Jones TR, Bainbridge GJ, SivananthanMU (2001) Steady state free preces-sion magnetic resonance imaging ofthe heart: comparison with segmentedK-space gradient-echo imaging.J Magn Reson 14:230–236
4. Sinha S, Sinha U (1996) Black blooddual phase turbo FLASH MR imagingof the heart. J Magn Reson 6(3):484–494
5. Sinha S, Mather R, Sinha U, Goldin J,Fonarow G, Yoon H (1997) Estimationof the left ventricular ejection fractionusing a multiphase, dark-blood breath-hold MR imaging technique. AmJ Roentgenol 169:101–112
6. Forbat SM, Karwatowski SP,Gatehouse PD, Firmin DN, LongmoreDB, Underwood SR (1994) Technicalnote: rapid measurement of left ven-tricular mass by spin echo magneticresonance imaging. Br J Radiol67:86–90
7. Longmore DB, Underwood SR,Hounsfield GN (1985) Dimensionalaccuracy of magnetic resonance instudies of the heart. Lancet 4:1360–1362
8. Lorenz CH, Walker ES, Morgan VL,Klein SS, Graham TP (1999) Normalhuman right and left ventricular mass,systolic function, and gender differ-ences by cine magnetic resonanceimaging. J Cardiovasc Magn Reson 1(1):7–21
9. Bland JM (1995) An introduction tomedical statistics. Oxford Medicalpublications, Oxford, pp 266–273
10. Fieno DS, Jaffe WC, Simonetti OP,Judd RM, Finn JP (2001) TrueFISP:assessment of accuracy for measure-ment of left ventricular mass in ananimal model. J Magn Reson 15:526–531
11. Moon JC, Lorenz CH, FrancisJM, Smith GC, Pennell DJ (2002)Breath-hold FLASH and FISPcardiovascular MR imaging: leftventricular volume differences andreproducibility. Radiology 223(3):789–797
12. Carr JC, Simonetti O, Bundy J, Li D,Pereles S, Finn JP (2001) Cine MRangiography of the heart with seg-mented true fast imaging with steady-state precession. Radiology 219:828–834
13. Thiele H, Nagel E, Paetsch I,Schnackenburg B, Bornstedt A,Kouwenhoven M, Wahl A, Schuler G,Fleck E (2001) Functional cardiac MRimaging with steady-state free preces-sion (SSFP) significantly improvesendocardial border delineation withoutcontrast agents. J Magn Reson 14(4):362–367
14. Wintersperger BJ, Nikolaou K,Dietrich O, Rieber J, Nittka M, ReiserMF, Schoenberg SO (2003) Singlebreath-hold real-time cine MR imag-ing: improved temporal resolutionusing generalised autocalibrating par-tially parallel acquisition (GRAPPA)algorithm. Eur Radiol 12:1931–1936
15. Van der Brink JS, Watanabe Y, KuhlCK, Chung T, Muthupillai R, VanCauteren M, Yamada K, DymarkowskiS, Bogaert J, Maki JH, Matos C,Casselman JW, Hoogeveen RM (2003)Implications of SENSE MR in routineclinical practice. Eur J Radiol 46:3–27
16. Barkhausen J, Hunold P, Waltering KU(2004) MRI in coronary artery disease.Eur Radiol 14:2155–2162
17. Stuber M, Botnar RM, Kissinger KV,Manning WJ (2001) Free-breathingblack-blood coronary MR angiogra-phy: initial results. Radiol 219:278–283
37