THE REMOVAL OF ORGANIC SUBSTANCE USING THE … · attempts to modify Tripikon-S by adding venturi...
12
The Third Joint Seminar of Japan and Indonesia Environmental Sustainability and Disaster Prevention (3 rd ESDP-2015) Institut Teknologi Bandung, Indonesia – November 25 th , 2015 255 THE REMOVAL OF ORGANIC SUBSTANCE USING THE MODIFIED TRIPIKON S FOR THE USAGE IN COASTAL AND THE SWAMP AREAS Dian Ardina Kusumaningayu 1 , Dyah Wulandari Putri 2 , and Prayatni Soewondo 3 Master Programme of Environmental Engineering Institut Teknologi Bandung Ganesha Road No.10 Bandung 40132 Email : 1 [email protected] , 2 [email protected], and 3 [email protected] Abstract: Sanitation facilities which can be used in reliable and sustainable ways for specific areas must be helpful to improve health condition and environmental quality. Tripikon-S is a vertical septic tank (cesspool) with three pipes used concentrically. However, this tank still has weaknesses. This current research, therefore, attempts to modify Tripikon-S by adding venturi pipes and some baffle pipes to facilitate the occurrence of anaerobic-aerobic processes in Tripikon-S. An experiment is conducted over the influence on COD of various influent concentrations of 1500 mg/L and 2000 mg/L and also that of various hydraulic retention times (HRT) of 24 hours, 36 hours and 48 hours. The measured parameters include pH, temperature, Dissolved Oxygen (DO), Chemical Oxygen Demand (COD), Volatile Suspended Solid (VSS), Nitrogen Total Kedjal (NTK), and Total Phosphate (TP). Result of experiment of continueefficiencyorganic substance for the highest reactor control is 63,04% achieved on influen variation concentrate 2000 mg/1 COD and HRT.Meanwhile,the highest elimination for venturi reactor is 67,39% achieved same variation with control reactor. Keywords : black water waste, tripikon-S, batch system, continuous INTRODUCTION The presence of sanitation facilities to process waste liquid is a very important structure to separate human wastes from life environment in order to prevent disease (Setiawati et al., 2013). Environmental condition of each region throughout Indonesia is different to each other and therefore,this is cause not every area can built processing instalation domestic wastewater with on-site system.For example in a spesific area where have a geographic condition although the weather,so the services system its dificult to apply.Spesific area include coastal areas and estuaries along the river, swamp area, flood prone area, areas prone to water and lake (Djonoputro et al., 2010).Tripikon-S is a solution to develop sanitation for specific areas, especially coastal and swamp areas. Work principle of the modified Tripikon-S is still similar to conventional septic tank. The processing in Tripikon-S is typically facultative anaerobic processing(Sunjoto,2008). Marthee et al. (2010) said that anaerobic processing is a core technology to recover energy and nutrient from black water waste. Anaerobic processing has been widely emphasized by researchers of sanitation because it is more economic than conventional aerobic method (Khrisna et al., 2009). Anaerobic treatment is considered as the core technologi for energy and nutrient recovery from wastewater blackwater(Marthee et al., 2010). According to Khrisna et al., (2009) anaerobic digestion received widespread attention among researchers sanitation, especially on the economic side instead of the conventional aerobic.
Transcript of THE REMOVAL OF ORGANIC SUBSTANCE USING THE … · attempts to modify Tripikon-S by adding venturi...
The Third Joint Seminar of Japan and Indonesia Environmental
Sustainability and Disaster Prevention (3rd ESDP-2015)
Institut Teknologi Bandung, Indonesia – November 25th, 2015
255
THE REMOVAL OF ORGANIC SUBSTANCE USING THE MODIFIED
TRIPIKON S FOR THE USAGE IN COASTAL AND THE SWAMP
AREAS
Dian Ardina Kusumaningayu
1, Dyah Wulandari Putri
2, and Prayatni Soewondo
3
Master Programme of Environmental Engineering
Institut Teknologi Bandung
Ganesha Road No.10 Bandung 40132 Email :
[email protected], and
Abstract: Sanitation facilities which can be used in reliable and sustainable ways for specific areas must be
helpful to improve health condition and environmental quality. Tripikon-S is a vertical septic tank (cesspool)
with three pipes used concentrically. However, this tank still has weaknesses. This current research, therefore,
attempts to modify Tripikon-S by adding venturi pipes and some baffle pipes to facilitate the occurrence of
anaerobic-aerobic processes in Tripikon-S. An experiment is conducted over the influence on COD of various
influent concentrations of 1500 mg/L and 2000 mg/L and also that of various hydraulic retention times (HRT) of
24 hours, 36 hours and 48 hours. The measured parameters include pH, temperature, Dissolved Oxygen (DO),
Chemical Oxygen Demand (COD), Volatile Suspended Solid (VSS), Nitrogen Total Kedjal (NTK), and Total
Phosphate (TP). Result of experiment of continueefficiencyorganic substance for the highest reactor control is
63,04% achieved on influen variation concentrate 2000 mg/1 COD and HRT.Meanwhile,the highest elimination
for venturi reactor is 67,39% achieved same variation with control reactor.
Keywords: black water waste, tripikon-S, batch system, continuous
INTRODUCTION
The presence of sanitation facilities to process waste liquid is a very important structure
to separate human wastes from life environment in order to prevent disease (Setiawati et al.,
2013). Environmental condition of each region throughout Indonesia is different to each other
and therefore,this is cause not every area can built processing instalation domestic wastewater
with on-site system.For example in a spesific area where have a geographic condition
although the weather,so the services system its dificult to apply.Spesific area include coastal
areas and estuaries along the river, swamp area, flood prone area, areas prone to water and
lake (Djonoputro et al., 2010).Tripikon-S is a solution to develop sanitation for specific areas,
especially coastal and swamp areas. Work principle of the modified Tripikon-S is still similar
to conventional septic tank. The processing in Tripikon-S is typically facultative anaerobic
processing(Sunjoto,2008).
Marthee et al. (2010) said that anaerobic processing is a core technology to recover
energy and nutrient from black water waste. Anaerobic processing has been widely
emphasized by researchers of sanitation because it is more economic than conventional
aerobic method (Khrisna et al., 2009). Anaerobic treatment is considered as the core
technologi for energy and nutrient recovery from wastewater blackwater(Marthee et al.,
2010). According to Khrisna et al., (2009) anaerobic digestion received widespread attention
among researchers sanitation, especially on the economic side instead of the conventional
aerobic.

The Third Joint Seminar of Japan and Indonesia Environmental
Sustainability and Disaster Prevention (3rd ESDP-2015)
Institut Teknologi Bandung, Indonesia – November 25th, 2015
256
This research will be carried out modifications to Tripikon S by using additional
pipe.The addition of the first pipe shaped like venturi aerator which has a hole in his throat so
that the air can get into the flowing fluid(Pratama, 2010). It is intended to occur naturally
aerated.Aeration is a natural or mechanical process by increasing the contact between water
and air for the purpose of removaing entrained gases,adding oxygen,and improve the physical
and chemical characteristics of the water (Ozkan et al.,2009). Higher dissolved oxygen means
better quality of the system. Pursuant to F.A.Magnaye et al. (2009), aerobic process take
more time for aeration and will generate a large amount of mud, but this process allows the
nitrification process. The next pipe to be added is a pipe with some bulkhead or barrier with
the aim to extend and cause a mud flow that is not joined to the outside through the channel.It
is expected that anaerobic-aerobic process,it can provide better treatment result in Tripikon S.
Research attempts to review the processing (the removal of organic substance) with
Tripikon-S,study the effect of modifications to the process Tripikon S elimination of organic
substance,study the effect of residence time variation and the influent COD concentration on
the process of eliminination of organic substance,reviewing preliminary kinetic parameters in
the process of degradation of organic substance, a kinetic model used is Monod Model.
METHODOLOGY
Research method is a laboratory research using artificial waste which the characteristic
is made similar to black water waste. Two reactors are used at laboratory scale. First reactor
is Tripikon-S reactor (control reactor) made of PVC pipe at total height of 80 cm while the
outmost pipe (overflow pipe) is at height of 19 cm. Second reactor is a modified Tripikon-S
reactor with additional pipes of PVC and acrylic pipes at total height of 80 cm, while the
diameter of outmost pipe (big pipe) is 31 cm. The following is the description of reactors
used in research,
!!!!!!!!
!
!
www.wsp.org
E. Biofiltrasi
Biofiltrasi merupakan teknologi pengolahan air limbah yang
memanfaatkan material hidup untuk menangkap dan secara
biologis mendegradasi polutan didalamnya. Biofiltrasi air
limbah domestik merupakan proses pengolahan yang unik
dibandingkan dengan pengolahan biologis lainnya dimana
mikroorganisme menempel pada media kontak dan air
limbah dialirkan melewatinya untuk diolah. Teknologi
biofiltrasi ini secara umum dapat dibagi menjadi dua
kategori yaitu (a) sistem konvensional dimana mikroorgan-
isme menempel secara alami pada media kontak dan (b)
penempelan mikroorganisme secara artifisial pada material
polimer. Dalam sistem biofiltrasi modern, mikroorganisme
ditempelkan pada media kontak atau diperangkap dalam
suatu membran sehingga dapat lebih meningkatkan penyisi-
han BOD dan padatan tersuspensi dibandingkan dengan
teknologi biofiltrasi konvensional.
Lebih jauh lagi, penyisihan BOD dan padatan tersuspensi
dalam air limbah dapat tercapai dengan baik apabila mekan-
isme dan parameter yang mempengaruhi kekuatan penem-
pelan biofilm pada permukaan artifisial dapat diketahui dan
dikontrol.(Pract. Periodical of Haz., Toxic, and Radioactive
Waste Mgmt, Oct 2006).
F. Tripikon-S dan T-Pikon-H
Tripikon-S (Tri/Tiga Pipa Konsentris-Septik) merupakan
salah satu alternatif pengolahan air limbah domestik yang
pada awalnya dikembangkan oleh Laboratorium Teknik
Sipil Universitas Gajah Mada, Yogyakarta. Teknologi ini
dikembangkan untuk menjawab tantangan kondisi lingkun-
gan yang dihadapi di daerah yang terpengaruh pasang surut,
seperti misalnya daerah pesisir pantai, muara, sungai,
maupun rawa. Teknologi ini dapat diterapkan untuk toilet
individual maupun komunal.
Kemudian teknologi Tripikon-S ini dikembangkan lebih
lanjut oleh Universitas Muhammadiyah Yogyakarta dengan
melakukan perubahan dan rancang ulang sistem, menghasil-
kan T-Pikon-H (T Pipa Horisontal).
Pengolahan yang terjadi dalam T-Pikon-H ini adalah secara
semi-aerob dan anaerob. Konsep dasar pengolahan adalah
dengan menggunakan 3 pipa, yaitu: (a) pipa kecil sebagi
inlet dari toilet; (b) pipa medium sebagai tempat terjadinya
proses dekomposisi biologis, dan (c) pipa besar sebagai
pelimpah (overflow) efluen. Ketiga pipa tersebut diatur
secara konsentris.
Kinerja kedua sistem ini masih perlu dikaji lebih lanjut,
namun bila dilihat dari ide pengolahannya, maka sistem ini
dapat menjadi salah satu alternatif pengolahan air limbah
yang potensial untuk dikembangkan. Dalam studi ini,
sistem T-Pikon-H menjadi salah satu rekomendasi, dengan
catatan bahwa kinerja pengolahan belum diketahui secara
pasti.
2.6.2. Perbandingan Alternatif Teknologi Pengolahan di
Daerah Spesifik
Teknologi pengolahan yang ada memiliki kelebihan dan
kekurangan masing-masing, seperti terlihat pada Tabel 2.
17
Opsi Sanitasi Yang Terjangkau Untuk Daerah Spesifik I Kaji Ulang Sanitasi, Teknologi Dan Tantanganya Di Daerah Spesifik
Gambar 11 : Tripikon-S (kiri) dan T-Pikon-H (kanan)
(!c!)!outlet!
De+sludge!pipe!
(a)!inlet!Vent!pipe!
(!b!)!reaktor!
The Third Joint Seminar of Japan and Indonesia Environmental
Sustainability and Disaster Prevention (3rd ESDP-2015)
Institut Teknologi Bandung, Indonesia – November 25th, 2015
257
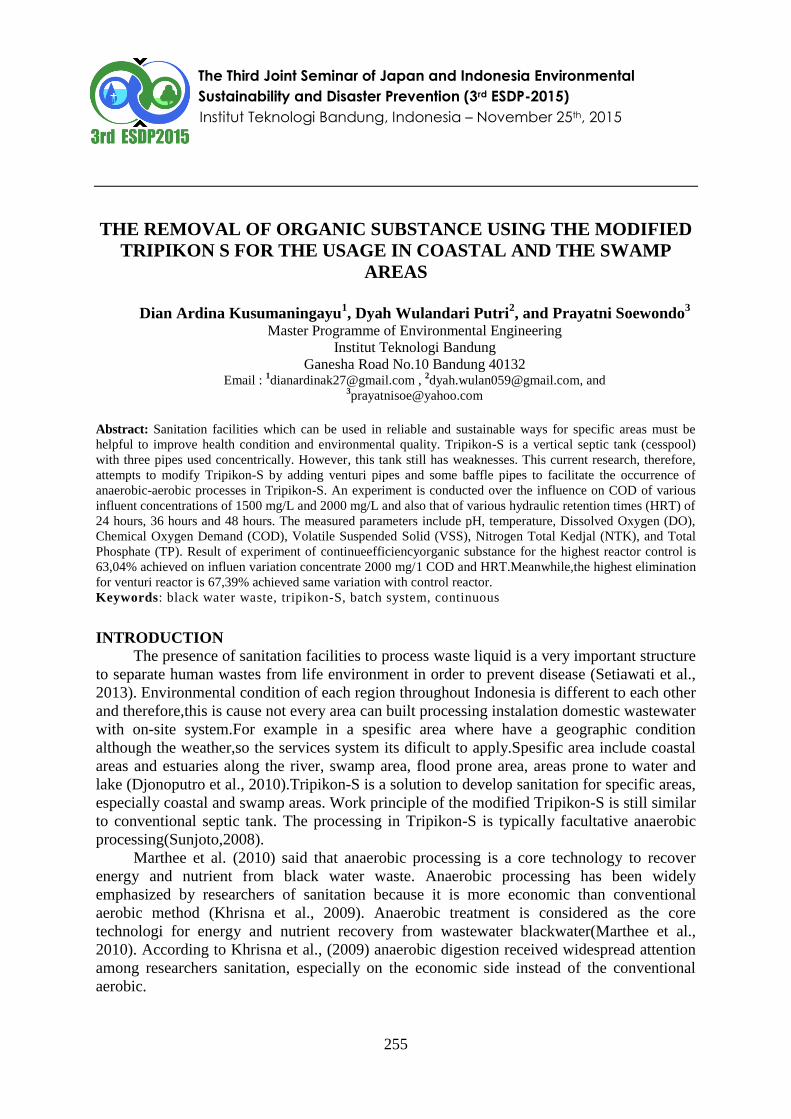
Figure 1. Scheme and photo tripikon-S reactor; (right) control reactor and
(left) modified reactor.
The process begins with the preparation of wastewater artificial.Preparation of artificial
wastewater using materials such as glucose as carbon user, (NH4)2SO4 as nitrogen source,
KH2PO4 as phosphate source and kaolin as total solid. The mixer water is tap water from
Laboratory of Water Quality of Environment Engineering, Technology Institute of Bandung.
This artificial waste is blended with anaerobic bacteria at VSS concentration of 2000 mg/L.
Ratio of waste to bacteria is 80% waste and 20% anaerobic bacteria of total volume of
reactor.
Research begins with batch system,where there is no flow in and out of the reactor in a
batch system.Research conducted in the batch until it reaches a steady state is a characterized
by the absence of significant changes in the parameters tested.Two variations of influent
concentration are 1500 and 2000 mg/L. Recirculation pump is used in batch phase to mix the
waste,with the purpose of waste can be mixed and measurements of
pH,temperature,DO,COD,VSS every day so that a steady state is achieved.NTK and Total
Phosphate are also measured in the beginning and the end of batch phase,it aims to determine
the nutrient processing or not. After finalizing batch phase, continuous phase is then
examined. This phase involves three variations of HRT, which are 48 hours, 36 hours, 24
hours.
Sampling method is grab sampling. This method, also called as momentary collection,
means where sample is collected directly at certain moment in certain point, respectively at
similar point and similar depth of batch reactor.In this study,samples were taken at three
points as shown in Figure 1.reactor scheme (a,b and c). Parameters measured in the
continuous phase are pH, temperature, DO, COD, VSS, NTK and Total Phosphate.
RESULTS AND DISCUSSION
Initial Characterization
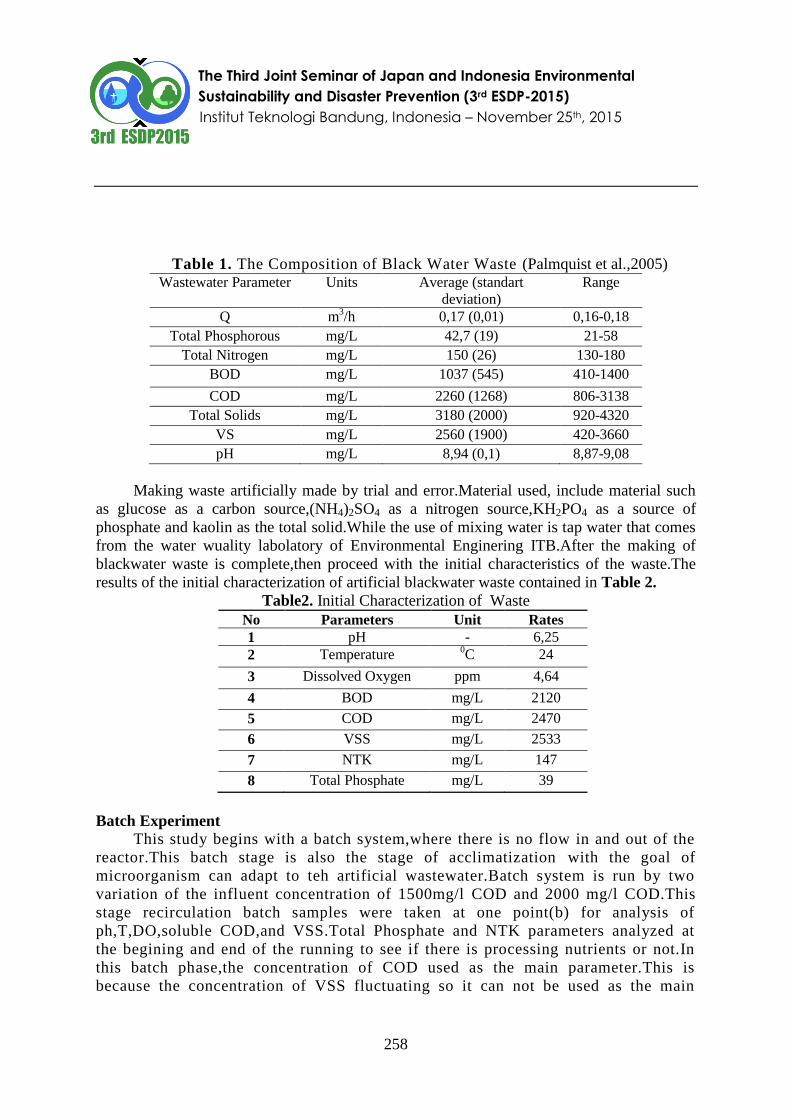
This study used artificial blackwater that refers to Palmquist et al., (2005)with
the composition listed in Table 1.
!!!!!
!!!
!
!(a)!inlet!
Vent!pipe!De-sludge!pipe!
!(b)!reaktor!
!(c)!effluen!
The Third Joint Seminar of Japan and Indonesia Environmental
Sustainability and Disaster Prevention (3rd ESDP-2015)
Institut Teknologi Bandung, Indonesia – November 25th, 2015
258
Table 1. The Composition of Black Water Waste (Palmquist et al.,2005) Wastewater Parameter Units Average (standart
deviation)
Range
Q m3/h 0,17 (0,01) 0,16-0,18
Total Phosphorous mg/L 42,7 (19) 21-58
Total Nitrogen mg/L 150 (26) 130-180
BOD mg/L 1037 (545) 410-1400
COD mg/L 2260 (1268) 806-3138
Total Solids mg/L 3180 (2000) 920-4320
VS mg/L 2560 (1900) 420-3660
pH mg/L 8,94 (0,1) 8,87-9,08
Making waste artificially made by trial and error.Material used, include material such
as glucose as a carbon source,(NH4)2SO4 as a nitrogen source,KH2PO4 as a source of
phosphate and kaolin as the total solid.While the use of mixing water is tap water that comes
from the water wuality labolatory of Environmental Enginering ITB.After the making of
blackwater waste is complete,then proceed with the initial characteristics of the waste.The
results of the initial characterization of artificial blackwater waste contained in Table 2.
Table2. Initial Characterization of Waste
No Parameters Unit Rates
1 pH - 6,25
2 Temperature 0C 24
3 Dissolved Oxygen ppm 4,64
4 BOD mg/L 2120
5 COD mg/L 2470
6 VSS mg/L 2533
7 NTK mg/L 147
8 Total Phosphate mg/L 39
Batch Experiment
This study begins with a batch system,where there is no flow in and out of the
reactor.This batch stage is also the stage of acclimatization with the goal of
microorganism can adapt to teh artificial wastewater.Batch system is run by two
variation of the influent concentration of 1500mg/l COD and 2000 mg/l COD.This
stage recirculation batch samples were taken at one point(b) for analysis of
ph,T,DO,soluble COD,and VSS.Total Phosphate and NTK parameters analyzed at
the begining and end of the running to see if there is processing nutrients or not.In
this batch phase,the concentration of COD used as the main parameter.This is
because the concentration of VSS fluctuating so it can not be used as the main

The Third Joint Seminar of Japan and Indonesia Environmental
Sustainability and Disaster Prevention (3rd ESDP-2015)
Institut Teknologi Bandung, Indonesia – November 25th, 2015
259
parameter.In a batch system,any variation of the influent COD concentration is
performed three times running batch system.
Figure 2. Decreasedconcentration of dissolved COD in the influent concentration variation
1500 mg/I of COD.
In Figure 2. it can be seen that the third running,steady state is achieved faster than
running first and second, it occurs in both reactor.
Figure 3.Decrease concentration of dissolved COD in the influent concentration variation
2000 mg/I of COD.
In Figure 3. looks the most rapidly achieved steady state at the third running within 2-3 days,
this applies both to the reactor control and reactor venturi.From batch experiment, it is known
that the COD reduction was obtained within 1-2 days,see the pattern of the time 24 hours,36
hours, 48 hours used as a variation for the continuous phase.While the SCOD , total phosphate
and NTK removal efficiency for reactor control and reactor venturi at various influent COD
concentration variation can be seen in Figure 4.
0
5001000150020002500
0 1 2 3 4 5 6 7 8 9 10 11 12 13 14 15 16
SC
OD (
mg
/L)
time (day)
control reactor venturi reactor
0500
100015002000250030003500
0 1 2 3 4 5 6 7 8 9 10 11 12 13 14 15 16
SC
OD (
mg
/L)
time (day)
control reactor venturi reactor

The Third Joint Seminar of Japan and Indonesia Environmental
Sustainability and Disaster Prevention (3rd ESDP-2015)
Institut Teknologi Bandung, Indonesia – November 25th, 2015
260
Figure 4.Removal efficiency of NTK, total phospate and SCOD.
Figure 5 and figure 6 shown kinetics of maximum biomass growth.
Figure 5. Kinetics of maximum biomass growth in the reactor control.
Figure 6. Kinetics of maximum biomass growth in the reactor venturi.
0
20
40
60
80
100
1500 2000
percen
t rem
ova
l (%
)
influen concentration COD (mg/l)
(a) Control reactor
NTK
TP
SCOD
0
20
40
60
80
100
1500 2000
percen
t rem
ova
l (%
) influen concentration COD (mg/l)
(b) Venturi reactor
NTK
TP
SCOD
y = 0.0194x + 147
R² = 0.972
0
200
400
600
800
1000
1200
1400
1600
0 20000 40000 60000 80000
(cS
0/c
S )
/ (
ln(c
S0
/cS
)
((cB*t )/(ln(cS0/cS))
(a) Influen concentration variation 1500 mg/l
y
Linear (y)
y = 0.0355x - 5.574
R² = 0.9752
0
200
400
600
800
1000
1200
1400
1600
0 20000 40000
(cS
0-c
S)
/ (l
n(c
S0
/cS
)
cB*t )/(ln(cS0/cS))
(b) Influen concentration variation 2000 mg/l
y Linear (y)
y = 0.0184x + 69.06
R² = 0.8385
0
200
400
600
800
1000
1200
1400
1600
1800
2000
0 50000 100000
(cS
0-c
S)
/ (l
n(c
S0
/cS
)
(cB*t )/(ln(cS0/cS))
a) Influen concentration variation 1500 mg/l
y Linear (y)
y = 0.0335x + 28.12
R² = 0.9254
0
100
200
300
400
500
600
700
800
900
1000
0 10000 20000 30000
(cS
0-c
S)
/ (l
n(c
S0
/cS
)
(cB*t )/(ln(cS0/cS))
b) Influen concentration variation 2000 mg/l
y
Linear (y)
The Third Joint Seminar of Japan and Indonesia Environmental
Sustainability and Disaster Prevention (3rd ESDP-2015)
Institut Teknologi Bandung, Indonesia – November 25th, 2015
261
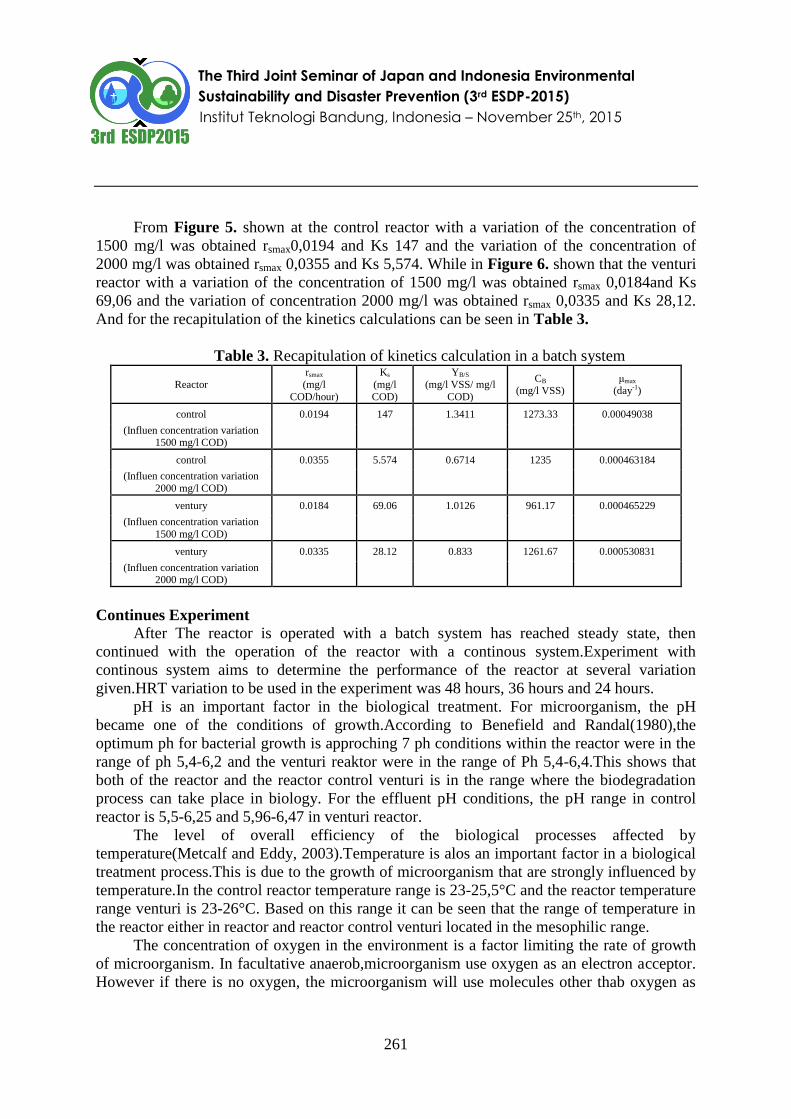
From Figure 5. shown at the control reactor with a variation of the concentration of
1500 mg/l was obtained rsmax0,0194 and Ks 147 and the variation of the concentration of
2000 mg/l was obtained rsmax 0,0355 and Ks 5,574. While in Figure 6. shown that the venturi
reactor with a variation of the concentration of 1500 mg/l was obtained rsmax 0,0184and Ks
69,06 and the variation of concentration 2000 mg/l was obtained rsmax 0,0335 and Ks 28,12.
And for the recapitulation of the kinetics calculations can be seen in Table 3.
Table 3. Recapitulation of kinetics calculation in a batch system
Reactor
rsmax
(mg/l
COD/hour)
Ks
(mg/l
COD)
YB/S
(mg/l VSS/ mg/l
COD)
CB
(mg/l VSS) μmax
(day-1)
control 0.0194 147 1.3411 1273.33 0.00049038
(Influen concentration variation 1500 mg/l COD)
control 0.0355 5.574 0.6714 1235 0.000463184
(Influen concentration variation
2000 mg/l COD)
ventury 0.0184 69.06 1.0126 961.17 0.000465229
(Influen concentration variation
1500 mg/l COD)
ventury 0.0335 28.12 0.833 1261.67 0.000530831
(Influen concentration variation 2000 mg/l COD)
Continues Experiment
After The reactor is operated with a batch system has reached steady state, then
continued with the operation of the reactor with a continous system.Experiment with
continous system aims to determine the performance of the reactor at several variation
given.HRT variation to be used in the experiment was 48 hours, 36 hours and 24 hours.
pH is an important factor in the biological treatment. For microorganism, the pH
became one of the conditions of growth.According to Benefield and Randal(1980),the
optimum ph for bacterial growth is approching 7 ph conditions within the reactor were in the
range of ph 5,4-6,2 and the venturi reaktor were in the range of Ph 5,4-6,4.This shows that
both of the reactor and the reactor control venturi is in the range where the biodegradation
process can take place in biology. For the effluent pH conditions, the pH range in control
reactor is 5,5-6,25 and 5,96-6,47 in venturi reactor.
The level of overall efficiency of the biological processes affected by
temperature(Metcalf and Eddy, 2003).Temperature is alos an important factor in a biological
treatment process.This is due to the growth of microorganism that are strongly influenced by
temperature.In the control reactor temperature range is 23-25,5°C and the reactor temperature
range venturi is 23-26°C. Based on this range it can be seen that the range of temperature in
the reactor either in reactor and reactor control venturi located in the mesophilic range.
The concentration of oxygen in the environment is a factor limiting the rate of growth
of microorganism. In facultative anaerob,microorganism use oxygen as an electron acceptor.
However if there is no oxygen, the microorganism will use molecules other thab oxygen as

The Third Joint Seminar of Japan and Indonesia Environmental
Sustainability and Disaster Prevention (3rd ESDP-2015)
Institut Teknologi Bandung, Indonesia – November 25th, 2015
262
electron acceptor.In the venturi reactor, the addition of this pipeline will allow anaerobic-
aerobic process, so DO parameters will be monitored to see venturi reactor performance.
Figure 7. DO concentration in the reactor.
From Figure 7. it can be seen from the results of measurements of DO, DO
measurement results between the control reactor with venturi reactor is not too much
different. This indicates that the addition of a pipe with a venturi shape which allows the
mechanical aeration does not occur significantly so that the desired aerobic process did not
occur as desired. This may be due to the lack of significant reactor design so that the desired
mechanical aeration process does not occur as desired. If the dissolved oxygen content is low,
it will form an anaerobic environment. From the results obtained measurements conducted
DO dissolved oxygen levels are so low that it can be concluded that the processes that occur
in the same reactor with the reactor control venturi where the processes that occur in the form
of facultative anaerobes.
In Figure 8. and Figure 9. we can seen various concentrations of COD and COD
removal efficiency. For reactor control the highest removal efficiency is 63,04% achieved at
the influent concentration variation to 2000 mg/l COD and HRT 48 hours. At the same
variation in the reactor Venturi also obtained the highest COD removal efficiency is 67,39%.
0
1
2
3
4
5
6
0 5 10 15 20 25 30 35
DO
(m
g/l
)
time (day)
control reactor venturi reactor
HRT 48 h
HRT 36 h
HRT 24 h 1500 mg/l
HRT 48 h 2000 mg/l
HRT 36 h
HRT 24 h 2000 mg/l

The Third Joint Seminar of Japan and Indonesia Environmental
Sustainability and Disaster Prevention (3rd ESDP-2015)
Institut Teknologi Bandung, Indonesia – November 25th, 2015
263
Figure 8.Influent, effluent concentrations of soluble COD and removal efficiency in
the reactor control.
Figure 9.Influent, effluent concentrations of soluble COD and removal efficiency in the
reactor venturi.
0
10
20
30
40
50
60
70
80
90
100
0
500
1000
1500
2000
2500
0 5 10 15 20 25 30 35
per
cen
t re
mo
va
l (%
)
SC
OD (
mg
/l)
time (day)
influen effluen removal
HRT 48 h 1500 mg/l
HRT 36 h 1500 mg/l
HRT 24 h 1500 mg/l
HRT 48 h 2000 mg/l
HRT 36 h
HRT 24 h 2000 mg/l
0
10
20
30
40
50
60
70
80
90
100
0
500
1000
1500
2000
2500
0 5 10 15 20 25 30 35
per
cen
t r
em
ov
al
(%)
SC
OD (
mg
/l)
time (day)
influen effluen removal
HRT 48 h
HRT 36 h
HRT 24 h
HRT 48 h
HRT 36 h
HRT 24 h

The Third Joint Seminar of Japan and Indonesia Environmental
Sustainability and Disaster Prevention (3rd ESDP-2015)
Institut Teknologi Bandung, Indonesia – November 25th, 2015
264
NTK influent concentration on variations both in the control reactor and the venturi
reactor is in the range of 126-196 mg/l. While the total influent concentration of phosphates
in a wide variety of both the control reactor and the venturi reactor is 40,25-57,35 mg/l. In
Figure 10, it can be seen NTK, total phospate dan COD soluble removal efficiency in a wide
variety both for reactor control and continuous reactor. We can seen that the highest NTK
removal efficiency for reactor control is 24,39% achieved at the influent concentration
variation 2000 mg/l COD and HRT 48 hours and with a similar variation in the venturi
reactor obtained the highest removal efficiency of NTK 29,66%. While the highest removal
efficiency of total phosphate (TP) in the control reactor at an influent concentration variation
of 1500 mg/l COD and HRT 48 hours with 34,31% removal efficiency and the same variation
in the venturi reactor obtained the highest removal efficiency of 35,16%.
Figure 10. Percent removal in various variations.
And for the calculation of the rate of removal COD results in a continuous system can be
seen in Table 4. for reactor control dan Table 5. for ventury reactor.
Table 4. Recapitulation of the rate of removal in control reactor variation td CS0 Csi efficiency rs
(hour) (mg/l) (mg/l) (%) (hour-1
)
1500 mg/l 48 1523 717 52.94 16.80
1500 mg/l 36 1493 815 45.45 18.86
1500 mg/l 24 1501 1171 21.95 13.73
2000 mg/l 48 2061 762 63.04 27.07
2000 mg/l 36 2070 1188 42.62 24.51
2000 mg/l 24 2123 1757 17.24 15.25
0
10
20
30
40
50
60
70
80
HRT
48 h(1500
mg/l)
HRT
36 h(1500
mg/l)
HRT
24 h(1500
mg/l)
HRT
48 h(2000
mg/l)
HRT
36 h(2000
mg/l)
HRT
24 h(2000
mg/l)
percen
t rem
ova
l (%
)
Variation of HRT and influent concentration of COD
(a) Control reactor
NTK
total phospate
SCOD
01020304050607080
percen
t rem
ova
l (%
)
Variation of HRT and influent concentration
of COD
(b) Venturi reactor
NTK
total phospate
SCOD

The Third Joint Seminar of Japan and Indonesia Environmental
Sustainability and Disaster Prevention (3rd ESDP-2015)
Institut Teknologi Bandung, Indonesia – November 25th, 2015
265
Table 5. Recapitulation of the rate of removal in ventury reactor variation td CS0 Csi efficiency rs
(hour) (mg/l) (mg/l) (%) (hour-1
)
1500 mg/l 48 1523 538 64.71 20.53
1500 mg/l 36 1561 679 56.52 24.51
1500 mg/l 24 1537 1061 30.95 19.83
2000 mg/l 48 2061 672 67.39 28.93
2000 mg/l 36 2104 1290 38.71 22.63
2000 mg/l 24 2123 1684 20.69 18.30
CONCLUSION
Based on the research results, obtained that the highest of removal efficiency of organic
substance was reached 63,04% and 67,39% for ventury reactor in the variation of the influent
concentration 2000 mg/l COD and HRT 48 hour. Optimum OLR on control reactor and
ventury reactor was 1 kg COD/m3/day. Removal efficiency of both reactor was not
significant difference, this was because the desired aerobic process was not happen. That was
seen fron the DO concentration in the control reactor which doesn’t have significant
difference between control reactor and ventury reactor.
ACKNOWLEDGEMENTS
Bill & Mellinda Gates Foundation in “Stimulating Local Innovation on Sanitation for Urban
Poor in Sub-Saharan Africa and South East Asia” research project.
REFERENCES
Abdel-Kader, Amr M. (2013) : Studying the efficiency of greywater treatment by using rotating biological
contactor system, Journal of King Saud University - Engineering Sciences, 25, 89–95.
Benefield, L.D. dan Randall, C.W. (1980) : Biological Process Design for Wastewater Treatment, Prentice Hall
Inc., New York.
Chen, Hongbo, Dongbo Wang, Xiaoming Li, Qi Yang, Kun Luo, and Guanming Zeng. (2013) : Biological
phosphorus removal from real wastewater in a sequencing batch reactor operated as aerobic/extended-
idle regime, Biochemical Engineering Journal, 77, 147–153.
Chong, Siewhui, Tushar Kanti Sen, Ahmet Kayaalp, Ha Ming Ang. (2012) : The performance enhancements of
upflow anaerobic sludge blanket (UASB) reactors for domestic sludge treatment e A State-of-the-art
review, Water Research, 46 , 3434-3470.
Djonoputro, E.R., Blackett, I., Rosenboom, J.-. & Weitz, A. (2010) : Understanding sanitation options in
challenging environments, Waterlines, vol. 29, no. 3, pp. 186-203
Grady, Jr. C. P. Leslie dan Lim, Henry C. (1990) : Biological Wastewater Treatment, New York, USA, Marcel
Dekker inc.
Graff, marthe, et.al. (2010) : Anaerobic Treatment of Concentrated Black Water in UASB reactor at a Short
HRT, Wetsus, Centre of Excellence for Sustainable Water Technology.
Hocaoglu, Selda Murat, Gu c lu Insel Emine Uba okgor Ahmet Baban and Derin Orhon. (2010) : COD
fractionation and biodegradation kinetics of segregated domestic wastewater: black and grey water
fractions, Research Article, Interscience.wiley.com.
H. Palmquist, J. Hanaeus,. (2005) : Hazardous subtances in separately colected grey- and blackwater from
ordinary Swedish households, Science Total Environment, 348, 151-163.

The Third Joint Seminar of Japan and Indonesia Environmental
Sustainability and Disaster Prevention (3rd ESDP-2015)
Institut Teknologi Bandung, Indonesia – November 25th, 2015
266
Krishna, G.V.T. Gopala, Pramod Kumar, Pradeep Kumar. (2009) : Treatment of low-strenght soluble
wastewater using an aerobic baffled reactor (ABR), Journal of Environmental Management 90, 166-176
Magnaye, Florante A. , Pag-asa D. Gaspillo, Joseph L. Auresenia. (2009) : Biological Nitrogen and COD
Removal of Nutrient-Rich Wastewater Using Aerobic and Anaerobic Reactors, J. Water Resource and
Protection, 1, 376-380
Ozkan. Fahri. Turgut Kaya and Ahmet Baylar (2009) : Study of the influence of venturi weir type on air buble
entrainment. Scientific Research and Essay Vol.4 (11), pp. 1184-1193, November, 2009
Pratama, Prasdiatma. (2010) : Model Alat Pengolahan Fe Dan Mn Menggunakan Sistem Venturi Aerator
Dengan Variabel Diameter Pipa Venturi Dan Kemiringan Irisan Pipa Venturi, Skripsi Program Studi
Teknik Lingkungan, Institut Teknologi Sepuluh November.
Setiawati, Endang, Suprihanto Notodarmojo, Prayatni Soewondo, Agus Jatnika E., Bambang Widjarnako O.
(2013) : Infrastructure Development Strategy For Sustainable Wastewater System By Using SEM
Method (Case Study Setiabudi And Tebet Districts, South Jakarta), Procedia Enviromental Science
Volume 17, Pages 685-692
Shafy, H.I. Abdel, M.A El-Khateeb, M. Regelsberger, R. El.-Sheikh, and M. Shehata. (2009) : Integrated
system for the treatment of black water and grey water via UASB andconstructed
wetland in Egypt, Water Research & Pollution Control Department, National Research Center, El-
Behous Street, Dokki, Cairo, Egypt.
Torondel, Belen. (2010) : Sanitation Ventures Literature Review: On-site sanitation waste characteristics,
London School of Hygene & Tropical Medicine.
Ningrum, Ardina Sita, Syarifuding dan Sudarno. (2012) : Pengaruh Hydraulic Loading Rate (HLR) Dan
Konsentrasi Influen Terhadap Penyisihan Parameter BOD, COD Dan Nitrat Pada Pengolahan Air
Limbah Domestik Campuran (Grey Water Dan Black Water) Menggunakan Reaktor UASB, Skripsi
Program Studi Teknik Lingkungan, Universitas Dipenogoro.
Noor,Rijali . (2011) : T-Pikon-H sebagai teknologi alternative untuk perbaikan sanitasi didaerah spesifik rawa,
Info Teknik, Volume 12 No. 2.
Manfaati, R. (2010) : Kinetika dan Variabel Optimum Fermentasi Asam Laktat dengan Media Campuran
Tepung Tapioka dan Limbah Cair Tahu oleh Rhyzopus Orizae, Tesis Program Magister, Universitas