The relevance of customer based brand equity model in the ...
69
i THE RELEVANCE OF CUSTOMER BASED BRAND EQUITY MODEL IN THE GEOGRAPHICAL INFORMATION SYSTEMS (GIS) INDUSTRY IN KENYA LINDA CHAVERA A RESEARCH PROJECT REPORT SUBMITTED IN PARTIAL FULFILLMENT OF THE REQUIREMENT OF MASTER OF SCIENCE DEGREE IN MARKETING, SCHOOL OF BUSINESS, UNIVERSITY OF NAIROBI OCTOBER 2015
Transcript of The relevance of customer based brand equity model in the ...

i
THE RELEVANCE OF CUSTOMER BASED BRAND EQUITY MODEL IN THE
GEOGRAPHICAL INFORMATION SYSTEMS (GIS) INDUSTRY IN KENYA
LINDA CHAVERA
A RESEARCH PROJECT REPORT SUBMITTED IN PARTIAL FULFILLMENT OF
THE REQUIREMENT OF MASTER OF SCIENCE DEGREE IN MARKETING,
SCHOOL OF BUSINESS, UNIVERSITY OF NAIROBI
OCTOBER 2015

ii
DECLARATION
I declare that this project report is my original work and has never been submitted for a degree in
any university or college for examination or for any academic purpose.
Signature --------------- Date -------------------
Chavera Linda Irusa
D65/67824/13
SUPERVISOR
This research proposal has been submitted for examination with my approval as the university
supervisor.
Signature --------------- Date -----------------------
Dr. Joseph Owino
Lecturer
Department of Business Administration
School of Business
University of Nairobi

iii
DEDICATION
For the support, belief and encouragements given throughout this course and academic
journey; I would like to thank my husband Chris Weru, Parents Mr. & Mrs Chavera, siblings
Kevin, Chris and Maxie and friends for the never ending faith, hope and persistence. I am
forever indebted. Thank you

iv
ACKNOWLEDGEMENT
My sincere thanks to God for the gift of life, health and spirit to pursue this course in the midst of
all challenges both life and academic.
My sincere gratitude also goes to everyone who has encouraged and assisted me directly or
indirectly in undertaking and completing this program
Special thanks to my supervisor and moderator Dr. Joseph Owino and Dr. Raymond Musyoka
respectively for their guidance, invaluable support and rich contribution in the development of
this paper.
To the University of Nairobi, my colleagues and friends, most especially the MSc (Marketing-
Brand class of 2014, who stood by me through the tough times and gave me the moral support
that I needed.

v
TABLE OF CONTENTS
DECLARATION ............................................................................................................................ ii
DEDICATION ............................................................................................................................... iii
ACKNOWLEDGEMENT ............................................................................................................. iv
LIST OF TABLES ........................................................................................................................ vii
LIST OF FIGURES ..................................................................................................................... viii
LIST OF ABBREVIATIONS AND ACRONYMS ...................................................................... ix
ABSTRACT .................................................................................................................................... x
CHAPTER ONE: INTRODUCTION ......................................................................................... 1
1.1 Background ............................................................................................................................... 1
1.1.1 Customer Based Brand Equity ....................................................................................... 2
1.1.2 GIS Industry in Kenya .................................................................................................... 4
1.2 Research Problem ...................................................................................................................... 5
1.3 Research Objectives .................................................................................................................. 6
1.4 Value of the Study ..................................................................................................................... 7
CHAPTER TWO: LITERATURE REVIEW ........................................................................... 8
2.1 Introduction ............................................................................................................................... 8
2.2 Theoretical foundation .............................................................................................................. 8
2.2.1 Resource Based View ..................................................................................................... 8
2.2.2 Signaling Theory Perspective ......................................................................................... 9
2.2.3 Consumer based brand equity....................................................................................... 10
2.3 Brand Awareness ..................................................................................................................... 12
2.4 Perceived Quality .................................................................................................................... 12
2.5 Brand Associations .................................................................................................................. 13
2.6 Brand Loyalty .......................................................................................................................... 14
2.7 Summary of Literature Review ............................................................................................... 14

vi
CHAPTER THREE: RESEARCH METHODOLOGY ......................................................... 17
3.1 Introduction ............................................................................................................................. 17
3.2 Research Design ...................................................................................................................... 17
3.3 Population of the Study ........................................................................................................... 17
3.4 Sampling Procedure ................................................................................................................ 18
3.5 Data Collection ........................................................................................................................ 18
3.5 Data Analysis .......................................................................................................................... 19
CHAPTER FOUR :DATA ANALYSIS, FINDINGS AND DISCUSSIONS ......................... 20
4.1 Introduction ............................................................................................................................. 20
4.2 General Information on CBBE model ..................................................................................... 23
4.3 Level of Awareness of GIS Brands in the Market .................................................................. 27
4.4 Effectiveness of Perceived Quality in Building GIS Brands .................................................. 32
4.5 Relevance of Brand Associations to GIS Brands in the Market ............................................. 33
4.6 Discussion of Findings ............................................................................................................ 33
CHAPTER FIVE: SUMMARY, CONCLUSION AND RECOMMENDATIONS .............. 39
5.1 Introduction ............................................................................................................................. 39
5.2 Summary of Findings .............................................................................................................. 39
5.3 Conclusion ............................................................................................................................... 40
5.4 Suggestions for Further Research ............................................................................................ 40
5.5 Implications for Policy, Theory and Practice .......................................................................... 41
5.6 Limitations of the Study .......................................................................................................... 42
REFERENCES ............................................................................................................................ 43
APPENDICES ............................................................................................................................... i
Appendix 1: Questionnaire ............................................................................................................... i
Appendix 2: List of Surveyors Utilizing GIS Data in Kenya ......................................................... vi

vii
LIST OF TABLES
Table 4.1 Marital status ................................................................................................................. 21
Table 4.2 Age of respondents ........................................................................................................ 21
Table 4.3 Gender of the respondents ............................................................................................. 22
Table 4.4 Use of branded GIS products ........................................................................................ 23
Table 4.5 Factors facilitating loyalty ............................................................................................. 24
Table 4.6 Important factors when dealing with a brand ................................................................ 25
Table 4.7 Description of a perfect brand ....................................................................................... 26
Table 4.8 Effectiveness of perceived quality................................................................................. 32
Table 4.9 Country of origin ........................................................................................................... 34
Table 4.10 Group associations....................................................................................................... 35
Table 4.11 Company sponsorships ................................................................................................ 37
Table 4.12 Company and distribution outlets ................................................................................ 37

viii
LIST OF FIGURES
Figure 4.1 Customer referrals ......................................................................................................... 26
Figure 4.2: Level of awareness ....................................................................................................... 27
Figure 4.3 Recognition of brands ................................................................................................... 28
Figure 4.4 Recall of symbols and labels ......................................................................................... 29
Figure 4.5 Accessibility to GIS brands ........................................................................................... 29
Figure 4.6 Relation of companies to quality .................................................................................. 30
Figure 4.7 Summary of findings on brand awareness .................................................................... 31
Figure 4.8 Effectiveness of perceived quality ................................................................................ 33
Figure 4.9 Celebrity Endorsement .................................................................................................. 36

ix
LIST OF ABBREVIATIONS
CBBE Customer Based Brand Equity Model
RBV Resource Based View
GIS Geographical Information Systems
x
ABSTRACT
This study was conducted to determine relevance of customer based brand equity model to GIS
industry in Kenya. To achieve this, primary data was collected using structured questionnaire. The
questionnaires were administered to a clustered sample of surveyors who utilize GIS services. The
respondents were accessed in their respective offices through drop and pick method. Data was
analyzed using descriptive statistics; this was presented in form of tables - frequencies and
percentages. The study found that respondents were practicing some of the concepts in customer
based brand equity as much as they may not be aware of the model. Among these pillars were
brand awareness, perceived quality and brand associations. The researcher recommended that
similar studies should be carried out on other industries that utilize GIS but are not necessarily
survey firms so as to appreciate fully the relevance of the model.

1
CHAPTER ONE
INTRODUCTION 1.1 Background
Worldwide popularity of brands has given the thought to the world about the importance of
brand as ‘earning daughter’ of the organization. Developing countries such as Kenya have come
to realize the importance of research required to help in building brand. Various consumer
perspective brand equity models have been proposed by marketing practitioners, academicians
and consultants.
Branding models have incorporated different concepts that are believed to build the brand
equity of a firm. One such model is the customer based brand equity model (CBBE). According
to the model, building a strong brand involves establishing the proper brand identity through
brand awareness, creating the appropriate brand meaning through strong, favorable, and unique
brand associations, eliciting positive, accessible brand image and forging brand relationships
with customers that are characterized by intense and active brand loyalty.
In Kenya, policy makers, professionals, industrialists and the academia have now accepted
geospatial technology as a way of conducting business (Muhammad et al, 2014). County
Governments have sought to explore untapped potential to create wealth and full employment at
available resources this can only be possible through the use of GIS. The focus of this study is
on the relevance and application of the customer based brand equity model in the GIS industry.
The increasing relevance of Geographical Information System (GIS) in everyday life has gained
credence during the last decade. It has significantly transformed the way people live. People
working in many different fields use (GIS) technology. Businesses, government institutions,
scientists, resource planners, among others use GIS for planning, analysis and dissemination of
vital information that aid in various tasks. GIS organizations face fierce competition to sustain
their brands. It is for this reason that organizations device marketing strategies. Moreover, with
latest emerging digital economy, the one challenge that remains now is to brand GIS products
and increase their brand equity in the market. This is to ensure that customers have the right
type of experiences with products and services and their accompanying marketing programs so
that the desired thoughts, feelings, images, beliefs, perceptions and opinions become linked to
the brand (Muhammad et al, 2014).

2
1.1.1 Customer Based Brand Equity
Keller (2013) defines customer based brand equity as the differential effect that brand
knowledge has on consumer response to the marketing of a brand. A brand has positive
customer-based brand equity when consumers react more favorably to a product and the way it
is marketed when the brand is identified than when it is not. The concept provides a unique
perspective on what brand equity is and how it should best be built, measured and managed.
The basic premise of the model is that the power of a brand lies in what customers have learned,
felt, seen, and heard about the brand over time. In other words, the power of a brand resides in
the minds of customers. The pillars of the definition of the CBBE model provide insight as to
how and why firms should allocate adequate time and resources in coming up with branding
strategies aimed at building on brand equity. Aaker (1991) defines brand equity as a set of
brand assets and liabilities linked to a brand, its name and symbol that add to or subtract from
the value provided by a product or service to a firm and to that firm’s customers. Building
strong brands involves integrating relevant concepts of brand equity into the marketing
operations of the company. These include enhancing brand awareness, perceived quality, brand
association, brand image and brand loyalty.
Brand awareness refers to customers’ ability to recall and recognize a brand. Brand awareness is
more than just the fact that customers know a brand name and the fact that they have previously
seen it, perhaps even many times. Brand awareness also involves linking the brand name, logo,
symbol to certain associations in memory. According to Kapferer (2008), awareness is mostly
correlated with aspects such as high quality, trust, reliability, closeness to people, quality/price
ratio, accessibility and traditional styling. The role of brand awareness in building brand equity
depends on the strength of the brand’s presence in the consumer’s mind. Higher levels of brand
awareness have a considerable impact on the marketing productivity and enhance the prospects
of being considered in future purchase situations (Keller, 1998). GIS products are perceived to
be very expensive. However in most instances, one would purchase a GIS product that he is
aware of regardless of the price.
Perceived quality is defined as the customer’s judgment of performance, excellence of a product
or service relative to the expectations of quality (Aaker& Jacobson, 1994). For service

3
industries, preferences for certain products of a company within certain categories can be
largely attributed to the high quality brands. This will in turn also influence repeat purchase
decisions. According to Erdem and Swait (1998), the content, clarity and credibility of a brand
as a signal of the product’s position may increase perceived quality and decrease information
costs and the risk perceived by consumers. These effects in turn increase consumer-expected
utility.
Perceived quality is partly characterized by the brand’s image to the public, customer’s
experience and the influence of opinion leaders and peer groups. For high involvement
products, a lot of time is taken by a customer before making the final purchase decision. Thus, it
is important to understand how the market perceives a brand because favorable purchase
decision may be based on the level of trust a customer has in the brand. Brand associations are
thoughts that come to mind after a brand is recalled. In brand associations, the informational
nodes which are linked together in large memory network are considered an important
component of brand equity, and are believed to contain the meaning of the brand for consumers
(Keller, 1993). Brand associations encompass product, functional and organizational
associations. The feelings evoked once a brand is mentioned define the kind of association
attached to the brand. Further, the frequency or number of associations increases the likelihood
of the brand being recalled and evaluated (Krishnan, 1996).Undertaking a research on brand
associations helps inform marketers on the naming procedures and in other cases re-naming
procedure based on the feelings evoked once a brand is mentioned.
Keller (1993) defines brand image as perceptions about a brand reflected by the brand
associations held in consumer memory. Brand image formation is a subjective learning process
and is the result of past total experiences. It consists of associations and attributes organized in
some meaningful manner that are activated from memory when recalled (Aaker, 1991).A brand
with high equity is more likely to have favorable brand image than a brand with low brand
equity. Understanding the image of a brand enables marketers to make product line extensions.
The perceived image of a brand, if favorable can be extended to other brands within the same
product category and hence yield commercial benefits.
4
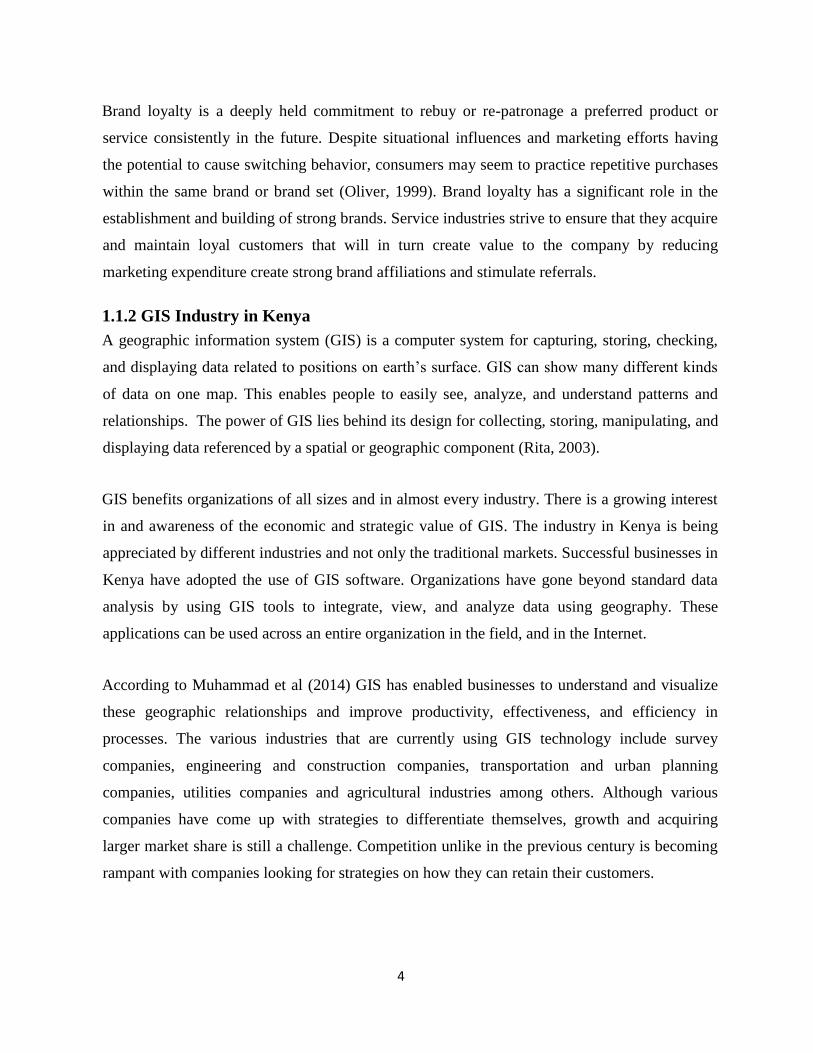
Brand loyalty is a deeply held commitment to rebuy or re-patronage a preferred product or
service consistently in the future. Despite situational influences and marketing efforts having
the potential to cause switching behavior, consumers may seem to practice repetitive purchases
within the same brand or brand set (Oliver, 1999). Brand loyalty has a significant role in the
establishment and building of strong brands. Service industries strive to ensure that they acquire
and maintain loyal customers that will in turn create value to the company by reducing
marketing expenditure create strong brand affiliations and stimulate referrals.
1.1.2 GIS Industry in Kenya
A geographic information system (GIS) is a computer system for capturing, storing, checking,
and displaying data related to positions on earth’s surface. GIS can show many different kinds
of data on one map. This enables people to easily see, analyze, and understand patterns and
relationships. The power of GIS lies behind its design for collecting, storing, manipulating, and
displaying data referenced by a spatial or geographic component (Rita, 2003).
GIS benefits organizations of all sizes and in almost every industry. There is a growing interest
in and awareness of the economic and strategic value of GIS. The industry in Kenya is being
appreciated by different industries and not only the traditional markets. Successful businesses in
Kenya have adopted the use of GIS software. Organizations have gone beyond standard data
analysis by using GIS tools to integrate, view, and analyze data using geography. These
applications can be used across an entire organization in the field, and in the Internet.
According to Muhammad et al (2014) GIS has enabled businesses to understand and visualize
these geographic relationships and improve productivity, effectiveness, and efficiency in
processes. The various industries that are currently using GIS technology include survey
companies, engineering and construction companies, transportation and urban planning
companies, utilities companies and agricultural industries among others. Although various
companies have come up with strategies to differentiate themselves, growth and acquiring
larger market share is still a challenge. Competition unlike in the previous century is becoming
rampant with companies looking for strategies on how they can retain their customers.

5
1.2 Research Problem
Adoption of the customer based brand equity model has been mostly within the goods industry
and less prevalence within the service industry. Though branding of services has started to
develop, this has not kept pace with the growth of the service sector overall. The growth of the
service sector has led to increased competition where branding has become an important tool
for gaining competitive advantages (Hermansson et al, 2005). Greater loyalty and less
vulnerability to competitive marketing actions and crises, higher command on price premium,
greater trade cooperation and support are some of the benefits accrued from the practice. In
addition, the practice brings about increased marketing communication effectiveness, possible
licensing opportunities and additional brand extension opportunities.
Kenyan firms need to keep at per with competitors’ technological abilities in order to remain
competitive. Competition in this industry is largely affected by technological advancements.
Companies are working hard to ensure that they acquire the latest equipment. Some of these
technologies are aimed at ensuring that customers remain loyal, appreciated and maintain a
positive perception about a brand. However, the response rate of some firms to these changes
has been unsatisfactory.
According to Yoo and Donthu (2001), consumer based brand equity scale is functional for
processing information and building confidence in the purchase decision and for enhancing
efficiency and effectiveness of marketing programs, price, profits and brand extensions and
trade leverage. Their study assessed only measuring of customer based brand equity but did not
assess corporate equity, organizational equity, retail equity and chain equity.
Biedenbach et al (2010) concluded that buyer seller dependency affects overall brand equity in
B2B and described the interdependency factors that affect brand loyalty. However, the data
analysis techniques used in this study did not bring fourth the interrelationships between
variables. Biedenbach’s study only considered interdependency factors, did not consider overall
determinants of brand equity. A study by Arthur et al (2011) concluded that consumers are
mainly driven by emotions. A large proportion of consumers clearly have strong feelings about
the supermarkets they patronize, and that effort expended in keeping customers, service level,
and product quality and assortment appear to be basic requirements for achieving high levels of
consumer-based brand equity. The selection of the designated supermarkets (population) was

6
limited by spatial distribution in the geographic area. The sample was derived from more
affluent and educated than the general population hence also introducing sample selection bias
in the findings.
A study by Narumon and Gerard (2012) depicted that in service firms, the customers experience
that occurs during interaction with employees not only creates brand meaning but also attracts
emotional connection between the brand and customers. The study concluded that employee
commitment to keep the brand alive is critical to building equity. However, the population of
the study was limited to high profile service firms leaving out the low profile firms. The
sampling frame was limited to certain characteristics of the population leaving room for bias in
the methodology. This also brought out lack of adequate generalizability of findings.
Muhammad et al (2014) showed that brand quality, brand image, and brand association all have
direct and positive effects on non-alcoholic beverages products. Empirical evidence indicated
that customers of nonalcoholic drinks are willing to pay higher price for those brands they have
developed strong associations with. This therefore means that customer based brand equity
raises brand preferences and purchase intensions. This study was however conducted in a
Pakistan context and hence did not capture different cultural issues that come with customer
preferences.
It is important to note that these studies are more product oriented rather than service oriented.
Given the unique characteristics of service firms that pose a great challenge to branding, it is
expected that there will be disparate outcome from the study. This study intends to fill the
highlighted gaps by seeking answers to the following research question: How relevant is the
customer based brand equity (CBBE) model in the GIS industry in Kenya?
1.3 Research Objectives
The general objective of the study was to determine the relevance of customer based brand
equity mode in the GIS industry in Kenya.
Specific objectives of the studies were:
i. To establish the influence of brand awareness in building a GIS brand
ii. To determine the effectiveness of perceived quality in building GIS services

7
iii. To assess the relevance of brand associations in GIS industry
1.4 Value of the Study
The County Governments Act of Kenya No. 17 of 2012 underscores the importance of GIS in
county governments. All counties are required to prepare and execute a ten year county GIS
based database system and spatial plan. This is a spatial depiction of the social and economic
development program that will aid the counties to utilize resources fully and serve their
customers. In this case members of the public adequately. Findings will therefore enable
governmental and regulatory bodies formulate policies that will enable counties to fully benefit
from these GIS systems.
The study will be significant to GIS industry as it will give a guideline on how firms should
strategize their branding efforts. It is imperative to note that not all branding concepts are
applicable to all industries. GIS companies will make use of the results of this study to develop
strategic brand management programs that will bring about sustainable competitive advantages.
These brand management strategies will in the long run enable growth in the industry.
Academicians including researchers and students can use the findings to get a more practical
overview of the CBBE model. It will also be a guide to what further research can be made
within other service industries. This will in turn bring insight to how to handle some of the
challenges of branding of services.

8
CHAPTER TWO
LITERATURE REVIEW
2.1 Introduction
This chapter puts into perspective brand equity theories and major concepts in marketing of GIS
services. Growth in the industry and technological advancements seem to increase the need for
companies to appreciate brand equity theories. Two outstanding theories and a model in brand
equity literature define brand equity, the Resource Based View (RBV), Signaling Theory and
Customer based brand equity model. The main brand equity concepts highlighted in this chapter
are brand awareness, perceived quality, brand association, brand image and brand loyalty.
2.2 Theoretical foundation
In this section, various theories that are linked to brand equity management are discussed. The
theories are reviewed and relationships between them to brand equity are highlighted.
2.2.1 Resource Based View
The Resource Based View (RBV) theory defines the brand as intangible asset or market based
asset.
According to Tokuda (2005), RBV theory involves identifying the firm’s unique resources,
deciding in which markets those resources can earn the highest rents and making decisions.
These decisions include determining whether the rents from those assets are being effectively
utilized or do they need to be sold out. The RBV suggests that the resources possessed by a firm
are the primary determinants of its performance and these may contribute to a sustainable
competitive advantage. Barney (1991) asserts that the concept of resources includes all assets,
capabilities, organizational processes, firm attributes, information and knowledge controlled by
a firm that enable the firm to conceive of and implement strategies that improve its efficiencies
and effectiveness. These resources, if utilized adequately build on the equity of a firm in the
long run.
The main concern of the RBV theory is to identify the characteristics of resources that are not
subject to imitation by competitors. If the resources possessed by a firm can easily be replicated

9
by competitors, even though the resources are the source of competitive advantage of the firm,
then the advantage will not last long.
A major criticism of this theory is that it doesn’t give precedence to the role of consumers in
building up the brand equity of a firm. The main focus in achieving a firm’s competitive
advantage as proposed by the theory should be on resources of the firm rather than capitalizing
on the relationships between the brands and customers. This theory also does not give a
comprehensive guideline as to how resources are developed and deployed.
2.2.2 Signaling Theory Perspective
According to signaling theory, a brand could be considered a marketing signal, which is a piece
of information about a product or service that helps customers to make inference about the
quality and the value of the product. The brand itself should be considered a valuable
information source for consumers (Herbig and Milewics, 1994). The branding activities for
example, the brand message and offering, the branding campaign, the advertising efforts
undertaken could become the source of value creation only when they are credible (Karasek and
Bryant, 2012). Signaling models include quality as the distinguishing characteristic, referring to
the underlying, unobservable ability of the ‘signaler’ to fulfill the needs or demands of an
outsider observing signal (Connelly et al, 2011). In this scope, a brand could be considered the
signal, which represents a promise of quality that the buyer must take on faith. This promise of
quality, communicated through different branding and marketing activities, might be eroded if
discrepancies between the promise and the actual quality exist (Kirmani &Rao, 2000). The
signal can turn awry, which could cause losses.
Erdem and Swait (1998), in applying signaling theory to the issues of branding, argued that a
credible brand signal generates consumer value, which they denote as consumer-based brand
equity. This theory however doesn’t give value to understanding customer’s previous
experiences with the brand. It dictates that the perception of a customer about a brand is
determined by the signal displayed at that particular moment and not the post purchase
outcomes.

10
2.2.3 Consumer Based Brand Equity
Keller (2008) defines customer based brand equity as the differential effect that brand
knowledge has on consumer response to the marketing of that brand. Customer-based brand
equity occurs when the consumer is familiar with the brand and holds some favorable, strong,
and unique brand associations in the memory (Kamakura and Russell, 1995). A brand has a
positive CBBE when consumers react more favorably to a product and the way it is marketed
when the brand is identified than when it is not (that is when it is unnamed).
A brand has negative customer based brand equity if consumers react less favorable to
marketing activity for the brand compared with an unnamed version of the same product. Brand
equity has increasingly been defined in customer-based contexts and extended to include effects
on brand preferences, purchase intent (Van Osselaer& Alba, 2000) and brand alliances (Rao et
al., 1994).
Brand equity rises from differences in consumer responses. These differences in response are as
a result of consumer’s knowledge and experiences about the brand overtime. Brand equity
strongly resides in the mind of consumers regardless of any marketing activity. Differential
responses are also reflected in perceptions, preferences and behavior related to all aspects of the
brand marketing. Almost all conceptualizations of brand equity appreciate that the phenomena
involves the value added to a product by consumers’ associations and perceptions of a particular
brand name (Winters, 1991; Chaudhuri, 1995).
Consumer based brand equity model seeks to give marketers direction on what makes a brand
strong and how to build a strong brand. It incorporates theoretical advances and managerial
practices in understanding and influencing consumer behavior. The CBBE model provides a
unique point of view as to what brand equity is and how it should be best built measured and
managed. The basic premise of the CBBE model is that the power of a brand lies in what
customers have learned, felt, seen and heard about the brand as a result of their experiences over
time. The main challenge of marketers is to create products and services that will have an
intrinsic reward to the customer such that customers are able to identify with the particular
brands (Keller, 2008).

11
CBBE helps in creating loyalty, building brand awareness, increased loyalty and favorable
brand associations. According to Aaker (1996), utilizing the CBBE model creates strong brands
which in turn create loyalty, resonation with customers, improved brand identity from within
the organization. Studies have identified a number of advantages of a high level of brand equity
including lower costs (Keller, 1993), increased purchase intention (Cobberwalgrin et al, 1995),
and increased sales price premiums and customer loyalty (Aaker, 1991, 1996). Other studies
have also found that strengthened position in distribution channels (Park &Srinvasan, 1994) and
competitive advantage (Adams, 1995) are other benefits of a high level of brand equity. From a
marketing perspective, brand equity is a concept that is based on market perceptions and
assessments. Any assessment of future financial performance is ultimately derived from
customers’ thinking and behavior (Steven & Scott, 2009).
CBBE model maintains that building a strong brand involves a series of logical steps that is:
establishing the proper brand identity and creating the appropriate brand relationships with
customers. According to this model, building a strong brand entails developing favorable and
unique brand associations eliciting positive, accessible brand responses and forging intense
active brand relationships. Achieving these four steps in turn involves establishing six brand
building blocks, salience, performance, imagery, judgments, feelings and brand resonance. The
strongest brands excel on all six of these dimensions and thus fully execute all four steps of
building a brand. The most valuable brand building block, brand resonance, occurs when all the
other core brand values are completely ‘in sync’ with respect to customer’s needs, wants and
desires. Brand resonance reflects a completely harmonious relationship between customers and
the brand. Customers have a high degree of loyalty marked by a close relationship with the
brand and share experiences with others.
Brand salience measures awareness of the brand. Brand imagery depends on the extrinsic
properties of the product or service. It is the way people think about a brand abstractly. Brand
performance describes how well the product or service meets customer’s more functional needs.
Brand judgments are the customer’s personal opinions about and evaluations of the brand
customers form by putting together all the different brand performance and imagery. Brand
feelings are customer’s emotional responses and reactions to the brand and any marketing
program. Brand awareness, perceived quality and brand associations are among the major issues
that would be of concern while examining the relevance of the CBBE model.

12
2.3 Brand Awareness
According to Aaker (1996), for new or niche brands, recognition can be important. For well-
known brands recall and top-of-mind are more sensitive and meaningful. Brand knowledge and
brand opinion can be used in part to enhance the measurement of brand recall. Aaker
conceptualizes brand awareness must precede brand associations. That is where a consumer
must first be aware of the brand in order to develop a set of associations (Washburn and Plank,
2002).
Brand awareness is related to the strength of the brand node or trace in memory as reflected by
consumer’s ability to identify the brand under different conditions (Rossiter and Percy, 1987).
In particular, brand name awareness relates to the likelihood that a brand name will come to
mind and the ease with which it does so. Brand awareness consists of brand recognition and
brand recall performance. Brand recognition relates to consumer’s ability to confirm prior
exposure to the brand when given the brand as a cue. Brand recall relates to customer’s ability
to retrieve the brand when given the product category, the needs fulfilled by the category or
some other type of probe as a cue. Brand awareness is critical since it effectively utilizes the
human senses in brand identification and ultimately purchase decision making. A consumer is
able to recognize a brand; either its colors or physical appearance or how it feels or the scent
from previous interactions or marketing efforts by the company.
2.4 Perceived Quality
Since it’s impossible for consumers to make complete and correct judgments of objective
quality, they use certain attributes that they associate with quality. Perceived quality is hence
formed to judge the overall quality of a product or service. Consumers use the quality attributes
to ‘infer’ quality of an unfamiliar product. It is therefore important to understand the relevant
quality attributes are with regard to brand equity.
Zeithaml (1988) and Steenkamp (1997) classify the concept of perceived quality in two groups
of factors that are intrinsic attributes and extrinsic attributes. The intrinsic attributes are related
to the physical aspects of a product for example color, flavor, form and appearance while

13
extrinsic attributes are related to the product, but not in the physical part: brand name, stamp of
quality, price, store, packaging and production information (Bernue´s et al, 2003).
Consumers’ evaluations of an extension are in the first place influenced by the perceived quality
of the parent brand and the perceived degree of fit. Clearly, extensions are not a way of saving
weak brands: they must have a reputation for quality before it is possible to attempt brand
stretching. With regard to the dimensions of fit, ‘synergy’ and ‘transferability of know-how’ are
more important than ‘substitutability’ (Kapferer, 2008).
2.5 Brand Associations
A brand association is the most accepted aspect of brand equity. Associations represent the
basis for purchase decision and brand loyalty (Aaker, 1992). According to Kotler and Keller
(2006) brand associations consist of all brand-related thoughts, feelings, perceptions, images,
experiences, beliefs, attitudes and is anything linked in memory to a brand. Chen (2001)
categorized two types of brand associations: product associations and organizational
associations.
Product associations include functional attribute associations and non-functional associations.
Organizational associations include corporate ability associations, which are those associations
related to the company’s expertise in producing and delivering its outputs and corporate social
responsibility associations, which include organization’s activities with respect to its perceived
societal obligations (Chen, 2001). Social Image also forms part of brand associations. Social
image can be viewed as the consumer’s perception of the esteem in which the consumer’s social
group holds the brand. It includes the attributions a consumer makes and a consumer thinks that
others make to the typical user of the brand. In close relation to social image, perceived value
also plays a role as an aspect of brand associations. Lassar et al. (1995) define perceived value
as the perceived brand utility relative to its costs, assessed by the consumer and based on
simultaneous considerations of what is received and what is given up to receive it.
Trustworthiness and country of origin are other important attributes that contribute to assessing
the strength of a brand. Trustworthiness is the confidence a consumer places in the firm and the
firm’s communications and as to whether the firm’s actions would be in the consumer’s

14
interest. (Lassar et al., 1995). According to Thakor and Kohli (1996), brand origin is the place,
region or country to which the brand is perceived to belong by its customers.
2.6 Brand Loyalty
Loyalty is a core dimension of brand equity. Aaker (1991) defines brand loyalty as the
attachment that a customer has to a brand. There are different levels of loyalty. Behavioral
loyalty is linked to consumer behavior in the marketplace that can be indicated by number of
repeated purchases or commitment to rebuy the brand as a primary choice.
Cognitive loyalty which means that a brand comes up first in a consumers’ mind, when the need
to make a purchase decision arises, that is the consumers’ first choice. The cognitive loyalty is
closely linked to the highest level of awareness (top-of-mind), where the matter of interest also
is the brand, in a given category, which the consumers recall first. Thus, a brand should be able
to become the respondents’ first choices (cognitive loyalty) and is therefore purchased
repeatedly.
Brand loyalty is directly related to brand price. Aaker (1996) identify price premium as the
basic indicator of loyalty. Price premium is defined as the amount a customer will pay for the
brand in comparison with another brand offering similar benefits and it may be high or low and
positive or negative depending on the two brands involved in the comparison.
2.7 Summary of Literature Review
Literature on branding emphasizes the marketing activities as a major source of brand equity
because many consumer goods brands have been built through advertising. The signaling theory
brings forth marketing campaigns as the major factor in building brand equity with minimal
mention of the role of customers’ post purchase experiences. Furthermore, an expose of the
resource based theory shows that company resources play a very important role in building
equity. It doesn’t mention the impact of customers’ perception, imagery, association, loyalty or
even awareness in building the same.
A new approach that emerges from the service economy in which the customer experiences
occurs during the service encounter and is the result of interaction between customers and
service employees and selfservice technologies. This new approach is more holistic and requires

15
that branding efforts be supported by different departments. An integration of the concepts in
resource based theory, signaling theory perspective and customer based brand equity model
would be an ideal proposition for building brand equity for GIS companies. However, given the
dynamic nature of service branding, it would be important to gain a clearer perspective as which
concepts of brand equity management are applicable and should be prioritized.
STUDY STUDY FOCUS
MAIN OBJECTIVE
METHODOLOGY FINDINGS KNOWLEDGE
GAPS
1. Yoo and
Donthu
(2001)
Developing and
validating a
multidimensional
consumer-based
brand equity scale
Assessed the
measurement scale of
customer based brand
equity
Consumer based brand equity
scale is functional for
processing information and
building confidence in the
purchase decision and for
enhancing efficiency and
effectiveness of marketing
programs, price, profits and
brand extensions and trade
leverage
Study assessed only
the measurement
scale of customer
based brand equity
but did not assess
corporate equity,
organizational
equity, retail equity
and chain equity
2.
Biedenbach
et al (2010)
Dynamics Of B2B Brand Equity: The
Role of
Interdependencies In
Buyer-Seller
Relationships’
Regression analysis
Interdependency
factors that affect
brand loyalty.
Buyer seller dependency affects overall brand equity in
B2B and described the
interdependency factors that
affect brand loyalty.
Study only Considered interdependency factors, did not consider overall determinants of brand equity.
3. Arthur et
al
(2011
Customer-based
brand equity, equity
drivers, and customer loyalty in the supermarket
industry
Purposive sampling
from a non-random
sampling frame
within the
sample universe:
Consumers are mainly driven
by emotions
The sample was
derived from more
Affluent and educated than the general population hence also introducing sample selection bias in the findings.

16
4. Narumon and Gerard (2012)
Service brand equity
and employee brand
commitment
Convenience
sampling. Personal
interviews were
conducted with
questionnaires
Concluded that employee
commitment to keep the brand
alive is critical to building
equity.
The sampling frame was limited to certain characteristics of the population leaving room for bias in the methodology. This also brought out lack of adequate generalizability of findings.
5.
Muhammad
et al (2014)
Customer Based Brand Equity:
Evidence from the
Soft Drink Industry
in Pakistan
Quantitative research.
Detailed explanation
on experiment
design, statistical
results and an
evaluation of the
experiment quality.
Brand quality, brand image, and brand association all have direct and positive effects on non-alcoholic beverages
products
This study was
however conducted
in a Pakistan
context and hence
did not capture
different cultural
issues that come
with customer
preferences.

17
CHAPTER THREE
RESEARCH METHODOLOGY
3.1 Introduction
The study adopted a quantitative approach in research methodology and data analysis. This
chapter gives a detailed description of the nature of descriptive research design, the population
of study, sampling procedure, data collection and analysis tools. The quantitative techniques
used provided a systematic and powerful means of analysis.
3.2 Research Design
The study employed descriptive – cross sectional research design.
According to Kothari (2011) descriptive survey is concerned with describing, recording,
analyzing and interpreting conditions that either exist or existed. The design was necessary for
describing components of the CBBE, explaining their relevance and how they are used in the
GIS industry. Cooper and Schindler (2014) states that descriptive study designs provide
descriptions of phenomena or characteristics associated with a subject population. They provide
estimates of the proportions of a population that have these characteristics and discovery of
associations among different variables. In addition to this, the study also describes common
characteristics among the study population. The constraints of budget and time impose the need
for cross-sectional analysis.
3.3 Population of the Study
This study investigated the various land surveyors who utilize GIS. Surveyors are
predominantly equipped and tasked with collection of GIS data using various tools. They
depend on a variety of software and technology to gather existing information, collect new
information, analyze data, produce plans, manage projects, and deliver accurate data. Surveyors
use GIS to manage the entire planning aspect of a surveying project. The study was conducted
in Nairobi County since it is the hub for many of the 200 licensed surveyors in the country.

18
3.4 Sampling Procedure
Cluster sampling was used for this study. Cluster sampling is used when it is not possible to
obtain a sampling frame because the population is either very large or scattered over a
geographical area (Mugenda & Mugenda, 2003). There are two major cluster; licensed
surveyors and those are that yet to be registered. The selection was of a specific group which in
this case were licensed surveyors. All members of this group were then included in the sample
and each member becomes a unit of observation. The degree of generalization of the research
findings depended on the degree to which the clusters within the population are similar. In this
case, the clusters are similar to very high degree.
The sample size was calculated using the formula below:
P
1+ (P*e2)
Sample size was therefore 134 respondents.
3.5 Data collection
Primary data were collected using structured questionnaire.
Questionnaires instrumental when one doesn’t need to probe further for certain attitudes and
reason for actions. Structured questionnaires are simple to administer. The provision of
alternative replies, at times, helps to understand the meaning of the question clearly (Kothari,
2004). The questionnaire comprised of statements asking the various aspects of the brands in
GIS that would make one shift from one company to another. The statements sought to establish
from the respondents their views on whether branding strategies have an impact on purchase
behavior. The respondents were technical personnel who are the final consumers of GIS data.
Questionnaires were delivered to the target respondents.

19
3.5 Data Analysis
At the preliminary stages, all the questionnaires were checked through for consistency. Data
were then edited, coded and recorded. The data was subjected to descriptive analysis
techniques. The purpose of descriptive statistics is to enable the researcher to meaningfully
describe a distribution of scores of measurements using a few indices or statistics (Mugenda and
Mugenda, 2003). The important statistical measures that were used to summarize the research
data are: measures of central tendency or statistical averages and measures of dispersion.
Statistical averages were carried out in an attempt to get the point at which the data had a
tendency to cluster. In order to get a clear understanding of the distribution, calculations of
means score, mode and median were undertaken. Measures of dispersion were also undertaken.
Given that there are more than one variable in this study, statistical measures of relationship
were used in analysis.

20
CHAPTER FOUR
DATA ANALYSIS
4.1 Introduction
Data analysis was guided by the research objectives presented in chapter one. The report
contains tables directly related to the research objectives which were mainly on brand
awareness, perceived quality and brand associations.
4.1.1 Response rate
The returned questionnaires were cleaned, edited and coded. Out of the 134 questionnaires
distributed 87 questionnaires were returned having been completely filled. On follow up with
the remaining respondents, it turned out that most of the questionnaires were only partially
filled while others were not filled completely. This then led to response rate of 65% percent
which was good enough to facilitate data analysis.
4.2 General consumer information
The demographic characteristics of respondents were analyzed in terms of gender, marital status
and age in years.
4.1.2 Respondent demographics
The demographic characteristics of respondents are analyzed in terms of marital status, age in
years and gender.

21
Marital status
Table 4.1 shows the marital status of the respondents
Table 4.1 Marital status
Marital Status Frequency Percent
Single 22 25%
Married 39 45%
Divorced 1 1%
Others 25 29%
Total 87 100%
Source: Author (2015)
Majority of those sampled were married with a percentage of 45%, followed by those who
preferred to keep their status private at 29% while the singles contributing to a percentage of 22%
while only 1 person was divorced at a percentage of 1%.
Age of respondents
Table 4.2 shows the age of the respondents.
Table 4.2 Age of respondents
Age (Years) Frequency Percent
18-27 11 13%
28-37 30 34%
38-47 34 39%
48-57 10 11%
Above 58 2 2%
Total 87 100%
Source: Author (2015)

22
The respondents interviewed were mostly between the age bracket 38-47 (39%) and 28-37 (34%).
Of the respondents 13% were between the ages of 18-27 while 11% were between ages 48-57.
Only 2% of the respondents were above the age of 58. The analysis shows that most of the
respondents were married probably because of the age brackets of the respondents
Gender of the respondents
Table 4.3 shows the gender of the respondents
Table 4.3 Gender of the respondents
Your Gender Frequency Percent
Male 66 76%
Female 21 24%
Total 87 100%
Source: Author (2015)
Majority of the respondents 76% were male and 24% of the respondents were female. This
analysis can be justified given the nature of the industry since it is mainly male dominated.

23
4.2 General Information on CBBE model
4.2.1 Usage of GIS products
Respondents were asked if they frequently use GIS products. Out of the responses, 83%
confirmed they frequently use while only 17% indicated they do not use the products
frequently.
Usage of branded GIS products
Table 4.4 shows the breakdown of usage of branded products
Table 4.4 Use of branded GIS products
Usage of branded GIS products
Frequency Percentage
Quite often 19 22%
Often 30 34%
Sometimes 22 25%
Not very often 10 11%
Never 6 7%
Source: Author (2015)
Respondents were asked how often they use GIS products that are well branded. Cumulatively,
majority of the respondents at least use branded GIS products with only 7% that do not use
branded ones.

24
4.2.2 Factors facilitating loyalty
Table 4.5 shows the various factors facilitating loyalty in GIS industry
Table 4.5 Factors facilitating loyalty
Factors have made respondents remain with a specific
brand
Frequency Percentage
Multidimensional 16 18.39
popularity of the brand 23 26.44
Easy Availability 15 17.24
Competitive Pricing 10 11.5
Technical support 11 12.64
Quality 12 13.79
Total 87 100
Mean 14.5
Standard deviation 4.764452
Source: Author (2015)
Respondents were required to indicate one factor that made them remain with a particular
brand. This question was instrumental in trying to gauge which factors bore more weight than
others. Of the respondents, 18% indicated that the multidimensional aspect of a brand makes
them loyal, 26.44% inclined towards popularity of the brand, 17.24% indicated easy
availability, 12.64% indicated technical support, 13.79% indicated quality while the lease,
which 11.5% percentage indicated pricing. This therefore meant that among the various factors
that would determine loyalty, pricing may not play a major role. Popularity of the brand
supersedes all.

25
4.2.3 Important factors when dealing with a brand
Table 4.6 shows the important factors when dealing with a brand
Table 4.6 Important factors when dealing with a brand
Important factors when dealing with a brand
Frequency Percentage
Organizational image 19 22%
Communication with staff 23 26%
Treatment by staff 4 5%
Brand communication 26 30%
Emotional quotient 15 17%
Total 87 100%
Mean 17.4
Standard deviation 8.6
Source: Author (2015)
The question sought to find out which attributes were important to customers when it comes to
thee choice of brand to use. Most of the factors almost bore equal weight with brand
communication taking a lead of 30%, communication with staff 26%, organizational image 22%
emotional quotient of the brand (attachment to the brand) 17%. Only a small percentage of the
respondents (5%) value the treatment being given by staff members of any given company.

26
4.2.4 Description of a Perfect Brand
Table 4.7 shows the responses on description of a perfect brand
Table 4.7 Description of a perfect brand
Description of the perfect brand according to respondents Frequency Percentage
Experience 30 34%
Innovative 14 16%
Reliable 22 25%
Efficient 10 11%
Competent 11 13%
Total 87 100%
Source: Author (2015)
As per the results, brand that has been in the market for a longer period would be deemed as a
perfect brand. Of the respondents, 34% indicated so when asked to indicate which attribute would
describe a perfect brand. 25% of the respondents indicated reliability, 16% indicated
innovativeness, and 13% indicated competence, while only 11% indicated efficiency as key.
4.2.5 Customer Referrals
The study also sought to gauge if customers take pleasure in referring their preferred choice of
brand to others as shown in figure 4.1.
Figure 4.1 Customer referrals

27
Majority of the respondents refer their brand of choice to others while on 8% never refer the brand
to others. This means that most customers, once satisfied with a brand wouldn’t have an issue
refereeing the same brand to others.
4.3 Level of awareness of GIS Brands in the Market
4.3.1 Awareness
Respondents were requested to indicate the answer that rightly expresses their level of awareness
of the various GIS brands (in the context of this study, GIS brands include: Arc map, ArcGIS,
Global mapper, Quickbird, Erdas Imagine, Orthophotos, Map info, google maps, Bing, Topobase.
and others) that they have purchased.
The respondents were requested to indicate the extent to which they have heard about certain the
GIS brands mentioned and the responses were as shown in figure 4.2.
Figure 4.2: Level of awareness
4.3.2 Recognition of brands
Respondents were further required to indicate the extents to which they can easily recognize
specific brands among other competing brands. A larger proportion of the respondents can easily
recognize certain brands among competing brands with only a small fraction not being able to.

28
Figure 4.3 Recognition of brands
4.3.3 Recall of symbols and signs
The figure shows the extents to which respondents can easily recall certain signs and symbols.
Majority of the respondents indicated that they can recall the names of certain brands when
shown the symbol and labels. This would imply that companies require to make their symbols
and logos visible to all prospects. This will in turn enable prospects to familiarize themselves
with these signs.

29
Figure 4.4 Recall of symbols and labels
4.3.4 Accessibility to most GIS brands
This question sought to identify if respondents can easily access GIS brands or if they have
difficulties accessing them. Of the responses, 31, respondents indicated that they can to a large
extent access the GIS services.
Figure 4.5 Accessibility to GIS brands

30
4.3.4 Relation of Companies to quality
The respondents were further asked if they can trust on certain companies if they want to
purchase products. This question would enable the researcher to be able to determine whether
the name of the company influences the level of trust a consumer evokes. The name of the
company builds the confidence in customers since they associate it with quality.
Figure 4.6 Relation of companies to quality

31
Summary of findings on brand awareness
Figure 4.7 Summary of findings on brand awareness
The analysis in figure 4.7 gives an indication that brand awareness is a key component in building
brand equity.

32
4.4 Effectiveness of Perceived Quality in Building GIS Brands
Respondents were requested to tick the answer that rightly expresses the qualities that determine
their choice of provider of GIS services. GIS services in this context include: aerial and ground
survey, geo-database development, photogrammetry and topographic mapping.). The respondents
were expected to give their opinion based on the following strategies:
1. Ability to perform the promised service dependably and accurately.
2. Physical facilities, equipment and appearance of personnel
3. Willingness to help customers and provide prompt service.
4. Knowledge and courtesy of employees and their ability to inspire trust and confidence.
5. Empathy (Caring and individualized attention that the firm provides to its customers.
Table 4.8 shows results of the effectiveness of perceived quality in building GIS brands
Table 4.8 Effectiveness of perceived quality
Frequency Percentage Frequency Percentage Frequency Percentage Frequency Percentage Frequency Percentage
V. small
extent
6 7% 6 7% 2 2% 0 0% 3 3%
Small
extent
11 13% 11 13% 14 16% 13 15% 14 16%
Moderate 20 23% 45 52% 26 30% 36 41% 28 32%
Large
extent
34 39% 20 23% 38 44% 28 32% 36 41%
V. Large
extent
16 18% 5 6% 7 8% 10 11% 6 7%
Total 87 87 87 87 87
Mean 17.4 17.4 17.4 17.4 17.4
Standard
Deviation
10.67
16.53
14.62
14.45
14.21
Source: Author (2015)
Among the various strategies that build on perceived quality, performance of a brand, prompt
service provision and adequate customer attention are effective to a larger extent. This can be seen
in the table 4.8.

33
Figure 4.8 Effectiveness of perceived quality
4.5 Relevance of Brand Associations to GIS Brands in the Market
In this section, the researcher mainly sought to establish customers’ opinions that best suit their
attitude about the various brands of GIS products and services that are aware of.

34
4.5.1 Country of origin
Table 4.9 shows the results of extents to which country of origin affects brand equity
Table 4.9 Country of origin
Country of origin
Extents Frequencies Percentages
V. small extent 7 8%
Small extent 50 57%
Moderate 16 18%
Large extent 5 6%
v. Large extent 9 10%
Total 87
Source: Author (2015)
Respondents were required to indicate to what extent the country of origin affects their purchase
decision. Of the respondents 7% & 50% felt that the country of origin affects only to a to very
small extent and small extent respectively while 5% and 9% of the respondent felt it only affects to
a large and very large extent respectively and 16% of the respondents felt that country affects
moderately. This implies that the country origin is not a major factor in determining their purchase
decision.

35
4.5.2 Association of products to certain groups
The table below indicates results on the extents to which group associations are relevant to
building equity.
Table 4.10 Group associations
Group associations
Extents Frequency Percentages
V. small extent 2 2%
Small extent 37 43%
Moderate 31 36%
Large extent 13 15%
v. Large extent 4 5%
Total 87
Mean 17.4
Standard deviation 15.85244461
Source: Author (2015)
Out of those sampled, 37 associate products to certain groups only to a small extent, 2 of them
indicated a very small extent while 31 were moderate. 13 of the respondents indicated that it
affects to a large extent while only 4 indicated a very large extent. From this we can deuce the fact
that group association has minimal impact on the choice of a GIS brand.

36
4.5.3 Celebrity Endorsement
Figure 4.9 Celebrity Endorsement
According to most of the respondents 48%, celebrity endorsements has a moderate impact on
purchase decisions with 25% indicating that it affects to a small extent, 20% to a large extent and
7% to a very small extent.
4.5.4 Company sponsorships
The table below shows the response of the extents to which company sponsorships affect brand
equity of GIS firms.

37
Table 4.11 Company sponsorships
Company sponsorships
Extents Frequency Percentages
V. small extent 3 3%
Small extent 19 22%
Moderate 22 25%
Large extent 41 47%
v. Large extent 2 2%
Total 87
Mean 17.4
Standard deviation 16.00937226
Source: Author (2015)
47% of the respondents agree that company sponsorships play a role in brand decisions, 25% were
moderate, 22% small extent and 3% very small extent.
4.5.5 Size of company and Distribution of outlets
The table below shows the extents to which the size of a company and distribution outlets affects
building brand equity of GIS firms.
Table 4.12 Company and distribution outlets
Size of the company and distribution outlets
Extents Frequencies Percentages
V. small extent 7 8%
Small extent 50 57%
Moderate 16 18%
Large extent 5 6%
v. Large extent 9 10%
Total 87
Mean 17.4
Standard deviation 18.68956928
Source: Author (2015)
38
A company that is large and has an established distribution network is preferable. This can be
attested to the large proportion of respondents, 57%, & 10% who indicated that this affects
purchase to a large extent and very large extent respectively. 20% were moderate while 5% and
8% indicated very small and small extent respectively.
Summary of relevance of brand associations
According to the analysis, country of origin and association of products to certain groups are not as
relevant to building brand equity as company sponsorships and distribution network.
4.6 Discussion of Findings
Majority of those sampled were male (76%), most of them married (39%) and between the age
bracket (28-37) and (38-47). This implies that most of the respondents were mature and few were
youths. From the study, most of the respondents (56%) use branded GIS products. Among other
factors that affect brand loyalty and customer response, popularity of the brand (26.44%) and staff
communication (26%) seemed to have more impact.
Furthermore, most of the respondents (34%) indicated that the experience a brand has in the
market carries more effect than other factors during brand decision making. Respondents also
indicated that brand awareness aspects are key components of building brand equity. From the
study, ability to perform the promised service dependably and accurately, prompt service provision
and empathy towards customers were among the key components of perceived quality that
respondents felt help in building brand equity of GIS products. Users of GIS products may not be
as keen on brand association strategies as majority of the respondents indicated that company
sponsorships and distribution networks are the two components that would have at least an impact.

39
CHAPTER FIVE
SUMMARY, CONCLUSION AND RECOMMENDATIONS
5.1 Introduction
This chapter summarizes the major findings of the study, conclusions, limitations of the study and
recommendations for further research. The general objective of the study was to determine the
relevance of customer based brand equity mode in the GIS industry in Kenya. Specific objectives
of the studies were to establish the influence of brand awareness, perceived quality and brand
associations in GIS industry.
5.2 Summary of Findings
The customer based brand equity model has over the years been applied in various industries.
However, most companies are yet to adopt the concept as a whole but some of its basic pillars.
Some of these pillars have been adopted by GIS companies and have had an impact in building the
brand equity of these firms. The study established that 93% of the respondents actually use
branded GIS services. Among the factors that make a customer loyal to a particular brand, the
multidimensional aspect of a brand is more likely to build loyalty compared to pricing of a
product. Brand communication is an important factor when dealing with a brand while the
treatment given by staff members does not play a major role.
The study also established that the experience a brand has is a major player when it comes to
describing a perfect brand. Customers wouldn’t mind referring their brand of choice to other
prospecting customers while only 8% of the respondents would mind. This means that brand
loyalty actually assists in customer referrals and in turn builds on particular preferred brands.
Findings of the study confirmed that customers are aware of most GIS brands and can easily
recognize specific brands among competing brands. Respondents also indicated that they can be
able to recall symbols and labels of brands that they use or have used before. Majority of the
respondents indicated that they can easily access GIS brands in the market. When asked if they can
trust certain companies if they want to purchase products, most of the respondents pointed out that
it did to a very large extent. In general, as per the analysis, brand awareness indeed influences the
building of a GIS brand in the market.

40
The study also established that perceived quality also plays a significant role in building a GIS
brand. Ability of a brand to perform, prompt service provision and adequate attention to customers
being among the key effective strategies in determining the perceived quality of a GIS brand.
Respondents felt like association of products to certain groups does not play a major role in
building a GIS brand. Further, celebrity endorsement also does not have a major impact. However
it was established that the size and distribution network of a company and company sponsorships
like events is relevant in building a GIS brand. This implies that brand associations is only relevant
to some extent when it comes to building GIS brands. This is because, according to the analysis,
some aspects are effective to a large extent while others to a very minimal extent.
5.3 Conclusion
As per the findings, awareness is a key pillar in the building of brand equity of GIS firms.
Companies build on awareness campaigns to ensure their target market is fully aware of their
existence. Firms also expose their logos and symbols in all manner of ways since customers will
use this to identify with their preferred choice of brand. Accessibility of services is also important
because this enables consumers to easily purchase and repurchase services and products form
particular firms, this in turn builds on loyalty.
Another key element in building GIS brands is perceived quality. This entails, among other issues,
ensuring that customers get value for their money. Given that GIS services are perceived to be
quite costly, it is important for firms to ensure that they provide quality services and products since
this is key. Prompt customer service as provided by the employees should be exceptionally good to
enable customers enjoy the service and refer them to other prospects.
Companies need to be careful while investing in brand association strategies to help build a brand.
This is because some strategies may be relevant while other may not be relevant. For a GIS firms,
they would achieve more by increasing the size of the firm and ensuring that they have a wider
distribution network.
5.4 Implications for Policy, Theory and Practice
Given that all counties are required to prepare and execute a ten year county GIS based database
system and spatial plan, this study will be useful in providing guidance. The social and economic
development program will aid the counties to utilize resources fully and serve their customers.

41
This study will benefit governmental and regulatory bodies formulate policies that will enable
counties to fully benefit from these GIS systems. Government institutions will be able to ensure
that members of the public are made aware of basic GIS systems and its benefits and this will in
turn assist in easier and faster incorporation of GIS in operations.
Academicians including researchers and students can use the findings to be able to gauge the
applicability of certain branding principles to certain disciplines. It enables students to be able to
delineate the extents to which the individual pillars of the CBBE model can be used in order to build on
brand equity.
The findings are significant to GIS industry as it will give a guideline on how firms should
strategize their branding efforts. It is imperative to note that not all branding concepts are
applicable to all industries. GIS companies will make use of the results of this study to develop
strategic brand management programs that will bring about sustainable competitive advantages.
These brand management strategies will in the long run enable growth in the industry. Marketers
will employ brand awareness campaigns, engage critical strategies that will improve on the
perceived quality of firm and effectively manage brand association approaches to building brand
equity.
5.5 Recommendations for Further Research
The study sought to determine the relevance of customer based brand equity mode in the GIS
industry in Kenya. The researcher recommends that a similar study can be carried out in other
technical industries in order to ascertain the exact extent to which the CBBE model can be
applicable to these industries. Industries that sell IT software, web based applications could be
among those that can be studied.
Further research should be done on other institution utilizing GIS services. Such firms include
engineering firms and government ministries who have operations that require GIS services.
Government ministries utilize GIS in order to collect, manipulate and store data which can easily
be retrieved as and when needed as they carry out their mandate. Engineering consultants
manipulate and interpret GIS data during design work and other post-design evaluations. It would
be of value if a study is conducted to ascertain the relevance of the said model to these industries.

42
5.6 Limitations of the Study
There was a major limitation in the data collection methodology. The population was difficult to
reach given that the particular respondents suited for the study were highly technical. The
researcher had to make numerous trips in order to at least get a technical person to fill in the
questionnaire. It was challenging to approximate the average time it would take a respondent to
completely fill in the questionnaire even though the researcher tried as much as possible to limit
the number of questions to capture the main interest of the study. This required a lot of patience
since the goal of the researcher was to try as much as possible to have as high response rate as
possible. Mobility increased the cost to a large extent since most of the respondents are not located
in one centralized. This led to some financial constraints however the researcher tried as much as
possible not to over-exceed the budget.

43
REFERENCES
Aaker D. Erich Joachimsthaler (2000). Brand Leadership, Free Press Publishers
Aaker D. A (1996), Building strong brands, Free Press.
Arthur W. Allaway Patricia Huddleston Judith Whipple Alexander E. Ellinger.
(2011).Customerbased brand equity, equity drivers, and customer loyalty in the
supermarket industry, Journal of Product & Brand Management, Vol. 20 Iss 3 pp. 190
– 204
Anselmsson, J., Johansson, U. and Persson N. (2007). Understanding price premium for
grocery products: a conceptual model of customer-based brand equity. Journal of
Product & Brand Management 16(6): 401–414.
Biedenbach, G, Bengtsson, M and Wincent. (2010). Dynamics Of B2B Brand Equity:
The Role of Interdependencies In Buyer-Seller Relationships,39th EMAC
Conference, The 6 Senses -The essentials of Marketing, Copenhagen Business
School, The European Marketing Academy, Copenhagen, Denmark, 1-4June
Bernue´s, A., Olaizola A. and Corcoran K. (2003). Extrinsic attributes of red meat as
indicators of quality in Europe: an application for market segmentation. Food Quality
and Preference 14(4): 265- 76
BoongheeYoo and Naveen Donthu (2001). Developing and validating a multidimensional
consumer-based brand equity scale, Journal of Business Research 52
C. R. Kothari. (2006). Quantitative Techniques, 3rd Revised Edition Vikas Publishing House
Chen A.C.H. (2001). Using free association to examine the relationship between the
characteristics of brand associations and brand equity. Journal of Product & Brand
Management 10 (7): 439 – 451
Christopher lovelock JochenWirtz, (2007), Service Marketing People, Technology, Strategy 6th
Edition Pearson International Edition.
Hermansson, Frida Larsson, Josephine Tutor: Gustavsson, Veronica. (2005). The Service
Branding Model Small Service Firms Approach to Building Brand Equity
Kamakura, A. W. and Russell G. J. (1993). Measuring brand value with scanner data.
International Journal of Research in Marketing 10(March): 9-22
Kevin Lane Keller, Tony Aperia Mats Georgson. (2008). Strategic Brand Management:
Identifying and establishing brand positioning and values, A European Perspective,
Pearson Edition

44
Kevin Lane Keller, Tony Aperia Mats Georgson. (2008). Strategic Brand Management: Building,
Measuring and Managing Brand Equity, 4th Edition Pearson International Edition.
Keller, K. (2003). Strategic Brand Management, Prentice Hall
Kotler, Philip and Keller Kevin L. (2006). Marketing Management.12th edition. Upper Saddle
River, NJ: Prentice Hall.
Kapferer, J. (2000). Strategic Brand Management; New approaches to creating and evaluating
brand equity,
Krishnan H S. (1996). Characteristics of Memory Associations: A Consumer-Based Brand
Equity Perspective, International Journal of Research in Marketing, Vol. 13, No. 4, pp. 389-
405.
Lassar, W., Mittal B. , and Sharma A. (1995) Measuring Customer-Based Brand Equity. Journal
ofConsumer Marketing 12(4): 11-19.
Leone, R. R. (2006). Linking brand equity to customer equity.Journal of Service Research,
Vol. 9 No. 2, pp. 125-38.
Leslie de Chernatory, MalcomMc Donald, Elain Wallace. (2011). Creating Powerful Brands, 4th
Edition.
Muhammad Ali Yab1, Muhammad Ilyas2, Chaudhry Abdul Rehman, (2014). Customer
Based Brand Equity: Evidence from the Soft Drink Industry in Pakistan, International
Journal of Management & Information Technology Vol. 9, No. 2
NarumonKimpakorn Gerard Tocquer, (2010). Service brand equity and employee brand
commitment, Journal of Services Marketing, Vol. 24 Iss 5 pp. 378 – 388
Olive M. Mugenda and Abel G. Mugenda. (2003). Research Methods, Qualitative and Quantitave
Approaches, Laba Graphics Services
Rossiter,John R. and Larry Percy, (1987), advertising and promotion management . New
York: MC Graw Hill Book company.
Solomon, M. a. (2002). Marketing: Real People, Real Choice, 2nd ed. Englewood Cliffs, NJ:
Prentice-Hall.
Stanley Presser, Converse, Stanley Presser Jean M. Converse (1986). Survey Questions:
Handcrafting the Standardized Questionnaire (Quantitative Applications in the Social
Sciences Series #63): 1st Edition Paperback
Steen Kamp, J-B.E. (1997) Dynamics in consumer behavior with respect to agricultural and food
products. In Agricultural Marketing and Consumer Behavior in a Changing World. Wierenga,
B.,

45
Thakor, Mrugank V. and KohliChiranjeev S. (1996) Brand Origin: Conceptualization and
Review, Journal of Consumer Marketing 13 (3): 27-42.
Tokuda Akio (2005), The Critical Assessment of the Resource-Based View of Strategic Management: The Source of Heterogeneity of the Firm
Van Osselaer, S., & Alba J.W. (2000). Consumer learning and brand equity, Journal of Consumer
Research 27: 1-16.
Zeithaml, V.A. (1988). Consumer perceptions of price, quality, and value: a means-end model and
synthesis of evidence. Journal of Marketing 52(3): 2-22.

i
APPENDICES
Appendix 1: Questionnaire
Letter of introduction
To whom it may concern
Dear Sir/ Madam
My name is Linda Chavera. I am a student at Nairobi University. I am undertaking a research on
relevance of branding GIS products in the industry. The research will form part of my course work
in Masters of Science- Marketing program. I kindly request you to participate by using 15 minutes
to fill out this questionnaire. All information given will be strictly confidential.
Your assistance and coordination will be highly appreciated.
Yours faithfully,
Linda Chavera

ii
QUESTIONNAIRE
DETERMINATION OF RELEVANCE OF CUSTOMER BASED BRAND EQUITY MODEL IN
GIS INDUSTRY IN KENYA.
DATE
SERIAL NO
RESPONDENT’S TITLE
INTRODUCTION
Good morning/Afternoon. My name is __Linda Irusa Chavera_______________________ I am a student
at Nairobi University. I am undertaking a research on relevance of branding GIS products in the industry.
The research will form part of my course work in Masters of Science- Marketing program. I kindly request
you to participate by using 15 minutes to fill out this questionnaire. All information given will be strictly
confidential.
SCREENER QUESTION
1. What role do you play in the Organization?
2. How long have you been playing that role?

iii
Part A; Demographic Information
Kindly tick the appropriate answer
Q1 Gender: Male ( ) Female ( )
Q2 Marital status: Single ( ) Married ( ) Divorced ( ) Others ( )
Q3 Age Bracket
(A) 18 – 27 ( ) (B) 28 – 37 ( ) (C) 38 – 47 ( )
(D) 48 -57 ( ) (E) Above 58
Part B; Demographic Information
Kindly tick the appropriate answer
Q4 Do you frequently use GIS products?
a) Yes
b) No
Q5 How often do you use branded (well labelled) GIS products?
a) Quite often
b) Often
c) Sometimes
d) Not very often
e) Never
Q6 Which of the following factors have made you remain with a specific brand?
a) Multidimensional aspect of the brand
b) Popularity of the brand
c) Easy availability
d) Competitive pricing
e) Good technical support or customer service
f) Quality
Q7 Which of the following are important to you when dealing with a brand?
a) Image of the organization
b) Communication with staff
c) The way you are treated by the staff

iv
d) How the brand communicates to you
e) The emotional quotient of the brand(attachment to the brand)
Q8 Which of the following words describe the perfect brand according to you? a)
Competent
b) Innovative
c) Experience
d) Reliable
e) Efficient
Q9 How often do you refer the brand of your choice to others?
a) Quite often
b) Often
c) Sometimes
d) Never
Q10 Please tick the answer that rightly expresses your level of awareness of the various GIS brands
(in the context of this study, GIS brands include: Arc map, ArcGIS, Global mapper, Quickbird, Erdas
Imagine, Orthophotos, Map info, google maps, Bing, Topobase. e.t.c) that you purchased.
Very small
extent
Small
extent
Moderate Large
extent
Very large
extent
I have heard of most GIS brands
I can easily recognize specific brands
among other competing brands
I can quickly recall the symbol or logo
of certain GIS brands
I can access most GIS products quite easily
I can always trust on certain companies
if I want a product of high quality

v
Q11 Please tick the answer that rightly expresses the qualities that determine your choice of provider of GIS
services. GIS services in this context include: aerial and ground survey, geo-database development,
photogrammetry, topographic mapping e.t.c.)
Very
extent
small Small
extent
Moderate Large
extent
Very
extent
large
Ability to perform the promised
service dependably and accurately.
Physical facilities, equipment and
appearance of personnel
Willingness to help customers and
provide prompt service.
Knowledge and courtesy of
employees and their ability to
inspire trust and confidence.
Empathy (Caring and
individualized attention that the
firm provides to its customers.
Q12 Kindly give your opinion by circling the answer that best suits your attitude about the various brands
of GIS products and services that you are aware of
Very small
extent
Small
extent
Moderate Large
extent
Very large extent
Country of origin affects your purchase
decision
Association of product with a particular
group of company leads to my
preference for such products
Products endorsed by favorite celebrities are preferable
Company sponsorships help build a
brand
Products from bigger companies with
wide distribution are preferable.
THANK YOU FOR YOUR TIME!!

vi
Appendix 2: List of surveyors utilizing GIS data in Kenya
Licensed survey in Kenya (Source: http://www.lands.go.ke/) –www.isk.co.ke
ABBAS MICHUKI YUSUF
ISK/673/LS/06
NAIROBI. / NAIROBI
ISK/A/LS/08
NAIROBI. / NAIROBI
ISK/A/842/LS/06
NAIROBI. / NAIROBI
ISK/A/1126/VS/09
NAIROBI. / NAIROBI
SHIANDA.
ISK/450/VS/94
NAIROBI. / NAIROBI
ISK/840/VS/12
NAIROBI. / NAIROBI
ISK/193/VS/81
NAIROBI. / NAIROBI
ISK/759/LS/09
NAIROBI. / NAIROBI
ISK G/GS/13
NAIROBI
JACQUELINE
NAIROBI / NAIROBI
ISK/527/VS/98
NAIROBI. / NAIROBI
ISK/T/LS/10
ISK/215/VS/82
ISK/A/833/VS/06
NAIROBI. / NAIROBI
ISK/A/VS/11
NAIROBI. / NAIROBI
ISK/A/LS/12
NAIROBI. / NAIROBI
ISK/G/GS/13
SOY
ISK/445/VS/100
HEMUTAI RUTTO
ISK/T/1008/LS/08
ISK/G/VEMS/13
NAIROBI

vii
ISK/T/LS/09
ISK/242/BS/81
ISK/218/VS/82
KISUMU
ISK/A/1094/VS/08
KASARANI.
ISK/G/VEMS/14
NAIROBI
NG' WANYONYI
ISK/A/1052/LMS/09
NAIROBI. / NAIROBI
ISK/195/VS/81
NAIROBI. / NAIROBI
ISK/864/VS/12
MOMBASA. / MOMBASA
LS ASSOCIATES
ISK/A/1484/LS/11
NAIROBI. / NAIROBI
ISK/429/VS/93
NAIROBI. / NAIROBI
ISK/A/VS/12
VEMS TECHNICIANS
NAIROBI. / NAIROBI
ISK/A/VS/10
NAIROBI. / NAIROBI
KIPLIMO SEREM
ISK/A/1137/LS/09
ELDORET. / UASIN GISHU
MWANYUNGU
ISK/617/LS/03
RAGALO
ISK/151/VS/80
NAIROBI. / NAIROBI
ISK/A/LS/12
NGONG
ISK/618/LS/03
NAIROBI. / NAIROBI
ISK/229/VS/83
NAIROBI. / NAIROBI
ISK/A/527/LS/98
NAIROBI / NAIROBI
ISK/839/VS/12
NAIROBI. / NAIROBI
ISK/T/LS/10
NAIROBI. / NAIROBI

viii
NAKURU. / NAKURU
ISK/601/VS/01
NAIROBI. / NAIROBI
ISK/A/LS/11
NAIROBI. / NAIROBI
E JANET OMWOYO
ISK/A/BS/10
ISK/624/VS/03
MOMBASA. / MOMBASA
ISK/A/LS/09
NAIROBI. / NAIROBI
ISK/A/LS/08
NAIROBI. / NAIROBI
ISK/A/VS/12
NAIROBI. / NAIROBI
ISK/739/BS/09
ISK/T/1136/VS/09
NAIROBI. / NAIROBI
ISK/830/VS/12
NAIROBI. / NAIROBI
ISK/A/LS/12
MLOLONGO.
ERNARD OCHIENG ONYANGO
ISK/804/VS/11
NAIROBI. / NAIROBI
ISK/A/LS/10
ISK/A/VS/08
ISK/A/VS/10
NAIROBI. / NAIROBI
ISK/197/VS/81
NAIROBI. / NAIROBI
MURIITHI
ISK/T/LS/08
KERUGOYA
ISK/A/VS/12
OYUGIS.
ISK/T/GS/13
NAIROBI
NANDI HILLS.
ISK/A/1091/LS/09
LS AFFILIATES
NAIROBI. / NAIROBI
OMALLA
ISK/327/LS/87

ix
ISK/806/VS/11
NAIROBI. / NAIROBI
ISK/A/423/LS/96
NAIROBI. / NAIROBI
ISK/A/VS/12
NAIROBI. / NAIROBI
ISK/A/1494/LS/10
NAIROBI. / NAIROBI
ISK/780/VS/10
NAIROBI. / NAIROBI
ISK/A/LS/08
GARISSA.
ISK/479/VS/96
NAIROBI. / NAIROBI
ISK/607/LS/02
NAIROBI. / NAIROBI
ISK/419/VS/93
NAIROBI. / NAIROBI
ISK/A/VS/11
EMBU.
NYAGA MURIITHI
NAIROBI. / NAIROBI
ISK/638/BS/04
ISK/A/1483/VS/10
NAIROBI. / NAIROBI
ISK/T/861/LS/06
MARAGOLI.
ISK/242/BS/82
THIKA. / KIAMBU
ISK/T/900/LS/07
NAIROBI. / NAIROBI
RUIRU / KIAMBU
NAIROBI. / NAIROBI
ISK/A/476/LS/97
NAIROBI. / NAIROBI
LS TECHNICIANS
NAIROBI. / NAIROBI
GICHIRA
ISK/687/VS/06
NAIROBI / NAIROBI
ISK/560/LS/00

x
ISK/356/VS/89
NAIROBI. / NAIROBI
ISK/A/LS/11
KARURI
ISK/852/LS/12
NAIROBI. / NAIROBI
ISK/272/LS/85
NAIROBI. / NAIROBI
ISK/A/LS/12
NAIROBI. / NAIROBI
ISK/T/LS/08
O'L KALOU.
ISK/669/LS/06
NAIROBI. / NAIROBI
ISK/710/VS/08
MOMBASA. / MOMBASA
ISK/637/VS/04
NAIROBI. / NAIROBI
RINE WAMBUI NDEGWA
ISK/A/762/VS/05
NAIROBI. / NAIROBI
ISK/715/VS/08
NAIROBI. / NAIROBI
ISK/A/VS/12
NAIROBI. / NAIROBI
ANJOHI NDORIA
ISL/A/918/VS/07
NAIROBI. / NAIROBI
ISK/G/VEMS/14
ISK/G/GS/14
NAIROBI
ISK/158/LMS/80
NAIROBI. / NAIROBI
ISK/S/GS/13
ISK/G/VEMS/14
NAIROBI
ISK/S/GS/14
ISK/T/1693/GS/2012
NAIROBI / NAIROBI
ISK/164/LMS/80
NAIROBI. / NAIROBI
ISK/G/VEMS/13
NAIROBI

xi
NAIROBI. / NAIROBI
ISK/385/VS/91
NAIROBI. / NAIROBI
ISK/A/540/VS/99
ISK/A/LS/12
NAIROBI. / NAIROBI
LS AFFILIATES
NAIROBI. / NAIROBI
ISK/A/VS/10
NAIROBI. / NAIROBI
ISK/525/VS/98
NAIROBI. / NAIROBI
ISK/465/VS/95
NAIROBI. / NAIROBI
nsolata Wangari
ISK/S/1742/VS/2012
ISK/306/VS/88
NAIROBI. / NAIROBI
ISK/726/BS/08
NAIROBI. / NAIROBI
ISK/A/884/VS/06
NAIROBI. / NAIROBI
ISK/A/VS/11
NYERI. / NYERI
ISK/A/LS/11
NAIROBI. / NAIROBI
LS ASSOCIATES
NAIROBI. / NAIROBI
ISK/A/378/LS/95
NAIROBI. / NAIROBI
ISK/808/VS/11
NAIROBI. / NAIROBI
ISK/G/VEMS/13
NAIROBI. / NAIROBI
ALI
ISK/A/LS/11
NAIROBI. / NAIROBI
ISK/866/VS/13
NAIROBI / NAIROBI
ISK/844/VS/12
NAIROBI. / NAIROBI
ISK/448/LS/94
NAIROBI. / NAIROBI

xii
ISK/G/VEMS/13
NAIROBI. / NAIROBI
ISK/A/LS/10
KILIFI.
ISK/755/VS/09
NAIROBI. / NAIROBI
ISK/A/1578/LS/11
SEREM.
ISK/497/VS/97
SAGANA.
CYRUS MAGAYU KIAMA
ISK/787/VS/11
NAIROBI. / NAIROBI
ISK/736/LS/08
NAIROBI. / NAIROBI
ISK/A/1121/VS/09
NAROBI.
ISK/A/VS/12
NAIROBI. / NAIROBI
ISK/698/LS/07
NAKURU / NAKURU
ISK/273/LMS/85
NAIROBI. / NAIROBI
ISK/826/VS/12
NAIROBI. / NAIROBI
ISK/A/VS
NAIROBI. / NAIROBI
JAMES WILSON MUIGAI KAHIGA
ISK/760/VS/09
NAIROBI / NAIROBI
ISK/A/VS/09
NAIROBI. / NAIROBI
ISK/A/1091/LS/11
ISK/A/LS/12
KAGIO.
ISK/569/LS/00
NAIROBI. / NAIROBI
ISK/474/VS/96
NAIROBI. / NAIROBI
ISK/A/VS
NAIROBI. / NAIROBI
ISK/A/LMS/10
NAIROBI. / NAIROBI

xiii
ISK/814/VS/11
MOMBASA / MOMBASA
ISK/A/LS/10
NAIROBI. / NAIROBI
ISK/A/1654/LS/12
NAKURU. / NAKURU
ISK/369/BS/90
NAIROBI. / NAIROBI
ISK/339/VS/87
NAIROBI. / NAIROBI
ISK/392/VS/92
NAKURU. / NAKURU
ISK/131/LS/74
NAIROBI / NAIROBI
ISK/A/732/LS/04
ELDORET. / UASIN GISHU
ISK/745/VS/09
NAIROBI. / NAIROBI
AVID ONGERI
ISK/702/VS/07
NAIROBI. / NAIROBI
ISK/T/LS/10
ISK/A/1501/VS/10
NAIROBI. / NAIROBI
ISK/638/BS/06
ISK/A/VS/11
NAIROBI. / NAIROBI
ISK/330/LS/88
NAIROBI. / NAIROBI
ISK/612/VS/03
NAIROBI. / NAIROBI
ISK/99/VS/76
NAIROBI. / NAIROBI
O
ISK/482/VS/96
NAIROBI. / NAIROBI
ISK/469/VS/96
NAIROBI. / NAIROBI
ISK/243/VS/84
NAIROBI. / NAIROBI
ISK/T/1008/LS/09
nairobi / NAIROBI
ISK/181/LS/80

xiv
NAIROBI. / NAIROBI
ISK/856/VS/12
NAIROBI. / NAIROBI
ISK/619/LS/03
NAIROBI. / NAIROBI
ISK/104/VS/77
NAIROBI. / NAIROBI
ISK/A/695/VS/03
MOMBASA. / MOMBASA
NAIROBI. / NAIROBI
ISK/617/LS/04
ISK/773/VS/10
ELDORET. / UASIN GISHU
ISK/549/LS/99
NAIROBI.
DAVIS WAMBIA LUMBASI
ISK/T/LS/11
KISUMU.
ISK/A/VS/12 NYERI.