The Relationship of the Unsaturated Soil Shear Strength ... · Canadian Geotechnical Journal, Vol....
29
Canadian Geotechnical Journal, Vol. 32, pp. 40-448, The Relationship of the Unsaturated Soil Shear Strength Function to the Soil-Water Characteristic Curve by D.G. Fredlund, Ph.D. Department of Civil Engineering University of Saskatchewan Saskatoon, Saskatchewan, S7N 5A9 Telephone No. 306-966-5374 Fax No. 306-966-5427 Anqing Xing, Ph.D. Department of Civil Engineering University of Saskatchewan Saskatoon, Saskatchewan, S7N 5A9 Telephone No. 306-966-8647 M.D. Fredlund, M.Sc. Department of Civil Engineering University of Saskatchewan Saskatoon, Saskatchewan, S7N 5A9 Telephone No. 306-966-5347 Fax No. 306-966-5427 and S.L. Barbour, Ph.D. Department of Civil Engineering University of Saskatchewan Saskatoon, Saskatchewan, S7N 5A9 Telephone No. 306-966-5369 Fax No. 306-966-5427 Final Revised Draft Submitted to the Canadian Geotechnical Journal Wednesday, January 18, 1996
-
Upload
nguyenduong -
Category
Documents
-
view
220 -
download
0
Transcript of The Relationship of the Unsaturated Soil Shear Strength ... · Canadian Geotechnical Journal, Vol....
Canadian Geotechnical Journal, Vol. 32, pp. 40-448,
The Relationship of theUnsaturated Soil Shear Strength Function to the
Soil-Water Characteristic Curve
by
D.G. Fredlund, Ph.D.Department of Civil Engineering
University of SaskatchewanSaskatoon, Saskatchewan, S7N 5A9
Telephone No. 306-966-5374Fax No. 306-966-5427
Anqing Xing, Ph.D.Department of Civil Engineering
University of SaskatchewanSaskatoon, Saskatchewan, S7N 5A9
Telephone No. 306-966-8647
M.D. Fredlund, M.Sc.Department of Civil Engineering
University of SaskatchewanSaskatoon, Saskatchewan, S7N 5A9
Telephone No. 306-966-5347Fax No. 306-966-5427
and
S.L. Barbour, Ph.D.Department of Civil Engineering
University of SaskatchewanSaskatoon, Saskatchewan, S7N 5A9
Telephone No. 306-966-5369Fax No. 306-966-5427
Final Revised DraftSubmitted to the Canadian Geotechnical Journal
Wednesday, January 18, 1996
Canadian Geotechnical Journal, Vol. 32, pp. 40-448, 1995
2
The Relationship of the Unsaturated Soil Shear Strength Functions to the
Soil-Water Characteristic Curve
by D.G. Fredlund, Anqing Xing, M.D. Fredlund and S.L. Barbour
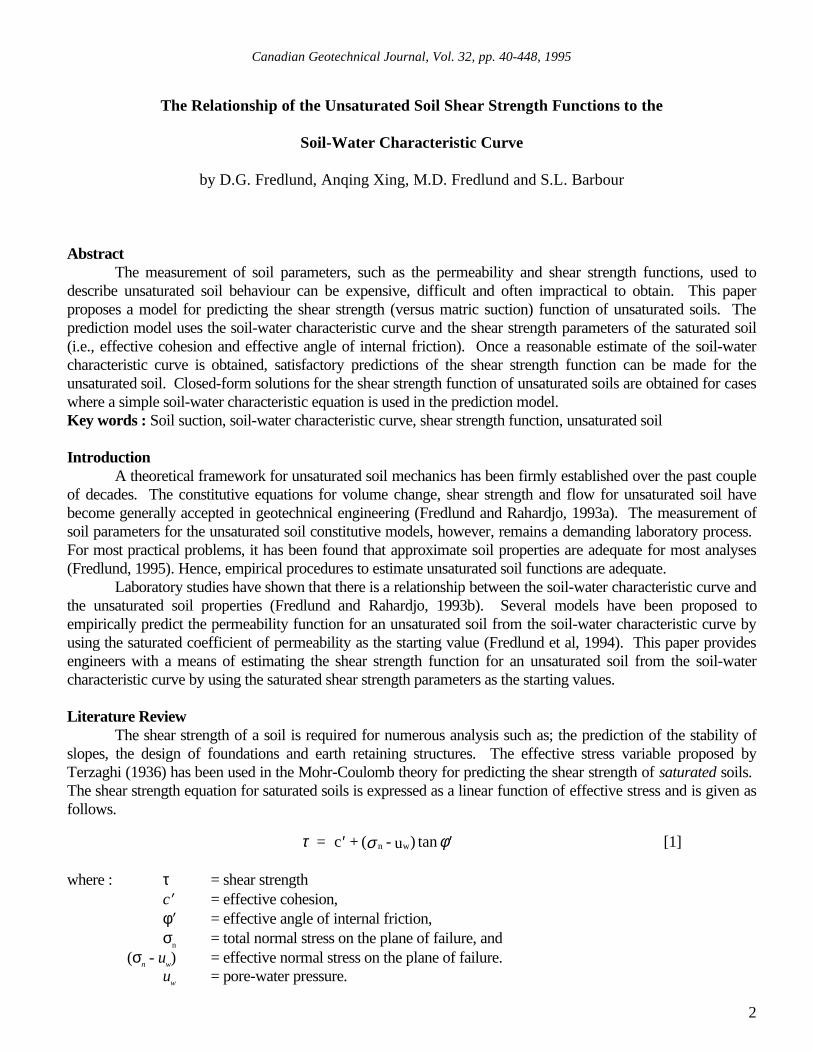
AbstractThe measurement of soil parameters, such as the permeability and shear strength functions, used to
describe unsaturated soil behaviour can be expensive, difficult and often impractical to obtain. This paperproposes a model for predicting the shear strength (versus matric suction) function of unsaturated soils. Theprediction model uses the soil-water characteristic curve and the shear strength parameters of the saturated soil(i.e., effective cohesion and effective angle of internal friction). Once a reasonable estimate of the soil-watercharacteristic curve is obtained, satisfactory predictions of the shear strength function can be made for theunsaturated soil. Closed-form solutions for the shear strength function of unsaturated soils are obtained for caseswhere a simple soil-water characteristic equation is used in the prediction model.Key words : Soil suction, soil-water characteristic curve, shear strength function, unsaturated soil
IntroductionA theoretical framework for unsaturated soil mechanics has been firmly established over the past couple
of decades. The constitutive equations for volume change, shear strength and flow for unsaturated soil havebecome generally accepted in geotechnical engineering (Fredlund and Rahardjo, 1993a). The measurement ofsoil parameters for the unsaturated soil constitutive models, however, remains a demanding laboratory process. For most practical problems, it has been found that approximate soil properties are adequate for most analyses(Fredlund, 1995). Hence, empirical procedures to estimate unsaturated soil functions are adequate.
Laboratory studies have shown that there is a relationship between the soil-water characteristic curve andthe unsaturated soil properties (Fredlund and Rahardjo, 1993b). Several models have been proposed toempirically predict the permeability function for an unsaturated soil from the soil-water characteristic curve byusing the saturated coefficient of permeability as the starting value (Fredlund et al, 1994). This paper providesengineers with a means of estimating the shear strength function for an unsaturated soil from the soil-watercharacteristic curve by using the saturated shear strength parameters as the starting values.
Literature ReviewThe shear strength of a soil is required for numerous analysis such as; the prediction of the stability of
slopes, the design of foundations and earth retaining structures. The effective stress variable proposed byTerzaghi (1936) has been used in the Mohr-Coulomb theory for predicting the shear strength of saturated soils. The shear strength equation for saturated soils is expressed as a linear function of effective stress and is given asfollows.
where : τ = shear strengthc′ = effective cohesion,φ′ = effective angle of internal friction,σn = total normal stress on the plane of failure, and
(σn - uw) = effective normal stress on the plane of failure.uw = pore-water pressure.
τ σ φ = c + ( -u )n w′ ′tan [1]
Canadian Geotechnical Journal, Vol. 32, pp. 40-448, 1995
3
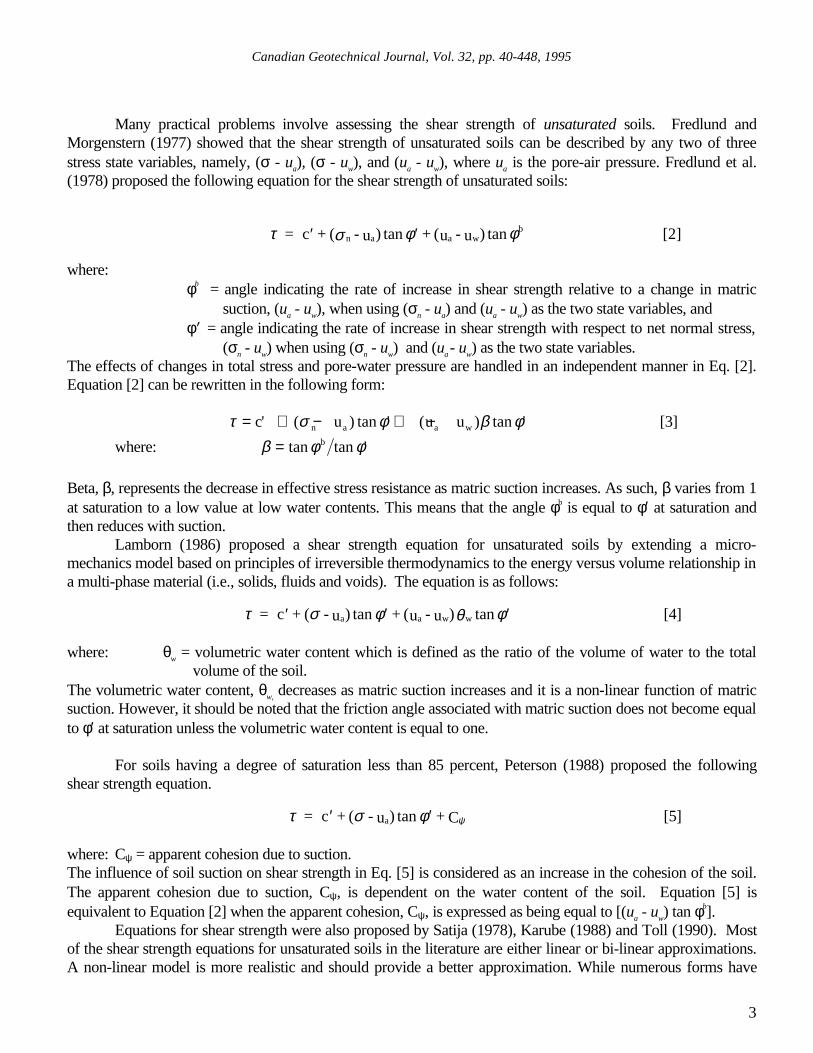
Many practical problems involve assessing the shear strength of unsaturated soils. Fredlund andMorgenstern (1977) showed that the shear strength of unsaturated soils can be described by any two of threestress state variables, namely, (σ - ua), (σ - uw), and (ua - uw), where ua is the pore-air pressure. Fredlund et al.(1978) proposed the following equation for the shear strength of unsaturated soils:
where:φb = angle indicating the rate of increase in shear strength relative to a change in matric
suction, (ua - uw), when using (σn - ua) and (ua - uw) as the two state variables, andφ′ = angle indicating the rate of increase in shear strength with respect to net normal stress,
(σn - uw) when using (σn - uw) and (ua - uw) as the two state variables.The effects of changes in total stress and pore-water pressure are handled in an independent manner in Eq. [2].Equation [2] can be rewritten in the following form:
where: β φ φ= tan tan 'b
Beta, β, represents the decrease in effective stress resistance as matric suction increases. As such, β varies from 1at saturation to a low value at low water contents. This means that the angle φb is equal to φ′ at saturation andthen reduces with suction.
Lamborn (1986) proposed a shear strength equation for unsaturated soils by extending a micro-mechanics model based on principles of irreversible thermodynamics to the energy versus volume relationship ina multi-phase material (i.e., solids, fluids and voids). The equation is as follows:
where: θw = volumetric water content which is defined as the ratio of the volume of water to the totalvolume of the soil.
The volumetric water content, θw, decreases as matric suction increases and it is a non-linear function of matricsuction. However, it should be noted that the friction angle associated with matric suction does not become equalto φ′ at saturation unless the volumetric water content is equal to one.
For soils having a degree of saturation less than 85 percent, Peterson (1988) proposed the followingshear strength equation.
where: Cψ = apparent cohesion due to suction.The influence of soil suction on shear strength in Eq. [5] is considered as an increase in the cohesion of the soil.The apparent cohesion due to suction, Cψ, is dependent on the water content of the soil. Equation [5] isequivalent to Equation [2] when the apparent cohesion, Cψ, is expressed as being equal to [(ua - uw) tan φb].
Equations for shear strength were also proposed by Satija (1978), Karube (1988) and Toll (1990). Mostof the shear strength equations for unsaturated soils in the literature are either linear or bi-linear approximations.A non-linear model is more realistic and should provide a better approximation. While numerous forms have
τ σ φ φ = c + ( -u ) + (u - u )n a a wb′ ′tan tan [2]
τ σ φ β φ= + − + −c u u un a a w' ( ) tan ' ( ) tan ' [3]
τ σ φ θ φ = c + ( -u ) + (u - u )a a w w′ ′ ′tan tan [4]
τ σ φ ψ = c + ( -u ) + Ca′ ′tan [5]
Canadian Geotechnical Journal, Vol. 32, pp. 40-448, 1995
4
been proposed for the unsaturated shear strength equation, there has been little verification of the equations withexperimental data.
Soil-Water Characteristic CurveThe soil-water characteristic curve for a soil is defined as the relationship between water content and
suction. The water content variable (i.e., volumetric water content, gravimetric water content or degree ofsaturation) defines the amount of water contained in the pores of the soil. The variable is often used in adimensionless form where the water content is referenced to a residual or zero water content.
where: θ = volumetric water content at any suction (or θ(ua-uw)),θs = volumetric water content at saturation,θr = volumetric water content at residual conditions, andΘ = normalized volumetric water content. When the reference volumetric water content,
θr is taken as being zero, Θ is equal to θ/θs .
The suction may be either the matric suction, (i.e., (ua - uw)), or total suction (i.e., matric plus osmotic suction) ofthe soil. At high suctions (e.g., greater than about 3000 kPa), matric suction and total suction are generallyassumed to be essentially the same.
The total suction corresponding to zero water content appears to be essentially the same for all type ofsoils. A value slightly below 1,000,000 kPa has been experimentally supported for a variety of soils (Croneyand Coleman, 1961; Russam and Coleman, 1961; Fredlund, 1964). The value is also supported bythermodynamic considerations (Richards, 1965). In other words, there is a maximum total suction valuecorresponding to a zero relative humidity in any porous medium. A general equation describing the soil-watercharacteristic curve over the entire suction range (i.e., 0 to 1,000,000 kPa) has been given by Fredlund and Xing(1994).
where: ψ = total soil suction (kPa), e = natural number, 2.71828..., ψr = total suction (expressed in kPa) corresponding to the residual water content, θr, a = a soil parameter which is related to the air entry value of the soil (kPa), n = a soil parameter which controls the slope at the inflection point in the soil-water
characteristic curve, m = a soil parameter which is related to the residual water content of the soil.
The parameters, a, n and m, in Eq. [7] can be determined using a non-linear regression procedure outlined byFredlund and Xing (1994). The residual water content, θr , is assumed to be zero. The normalized (volumetric orgravimetric) water content when referenced to zero water content is equal to the degree of saturation, S, providedthe total volume change is negligible (Fredlund et al, 1994).
Θ = −−
θ θθ θ
r
s r
[6]
( )θ θψ ψ
ψ ψ = 1 -
(1+ / )
(1+1000000 / )
1
e + ( / a )s
r
r
m
n
ln
ln ln
[7]
Canadian Geotechnical Journal, Vol. 32, pp. 40-448, 1995
5
The shear strength of a soil is a function of matric suction as it goes from the saturated condition to anunsaturated condition. In turn, the water content is a function of matric suction. Equation [7] can be expressed interms of the matric suction of the soil:
where: (ua - uw)r = the matric suction corresponding to the residual water content, θr.
A Model for the Shear Strength Function for Unsaturated SoilsThe contribution of matric suction to shear strength of an unsaturated soil can be assumed to be
proportional to the product of matric suction, (ua - uw), and the normalized area of water, aw, at a particular stressstate (Fredlund et al, 1995). That is,
where: a AAw
dw
tw=
Adw = area of water corresponding to any degree of saturation.Atw = total area of water at saturation
The normalized area of water, aw, decreases as the matric suction increases. The chain rule of differentiation onEq. [9] shows that there is two components of shear strength change associated with a change in matric suction.
The normalized area of water in the soil, aw, may be assumed to be proportional to the normalized volumetricwater content at a particular suction value by applying Green’s theorem, (Fung, 1977) [ i.e., Θ(ua - uw) which isequal to θ(ua - uw) / θs]. The normalized area of water can be defined by the following equation,
where: Θ(ua - uw) = normalized volumetric water content as a function of matric suction, andκ = a soil parameter dependent upon the soil type.
Then, substituting Eq. [11] into Eq. [10] gives
Integrating Eq. [11] yields,
where: C = constant of integration.
θ θ= − + − −+ −
+ −
s
a w a w r
a w r a wn
m
e a1
1
1 1000000
1ln( ( ) / ( ) )
ln( / ( ) ) ln( (( ) / ) )
u u u u
u u u u[8]
τ φ = a (u - u )w a w tan ' [9]
[ ]d a u u u u daw a w a w wτ φ= − + −tan ' ( ) ( ) d [10]
w a wa = [ (u - u ) ]Θ κ [11]
[ ] [ ]{ }d = u u u u u u d u u d u ua w a w a w a w a wτ φ κκ κtan ' ( ) ( ) ( ) ( ) ( )Θ Θ Θ− + − − − −−1
[12]
[ ] [ ]{ }τ
φ κκ κ
(u - u ) C
(u - u ) u u u u d u u d(u - u )
a w
0
u -u
a w a w a w a w a w
a w
= +
+ − − −∫−
tan ' ( ) ( ) ( )Θ Θ Θ1 [13]
Canadian Geotechnical Journal, Vol. 32, pp. 40-448, 1995
6
The constant of integration, C, in Eq. [13] is the shear strength of the soil at zero suction (i.e., thesaturated shear strength). Therefore,
where: uw = ua (i.e., at saturation)c′ = effective cohesion,
φ′ = effective angle of internal friction.
Substituting Eq. [14] into Eq. [13] gives the following shear strength expression as a function of matric suctionand the effective angle of internal friction, φ′,
where : Θ(ua - uw) = θ(ua - uw) /θs, andθ(ua - uw) = the volumetric water content at any suction as given by Eq. [8].
The normalized volumetric water content, Θ(ua - uw), in Eq. [17] is defined by the soil-water characteristicfunction and can be obtained from Eq. [8]. In other words, Equation [15] can be used to predict the shearstrength function of an unsaturated soil using the soil-water characteristic curve and the saturated shear strengthparameters.
Equation [15] can be written in a different form as follows.
This equation is found by substituting equation [11] into equation [9]. Equation [16] will produce the same shearstrength curve as equation [15]. The simple form of equation [16] now allows for the easy substitution of anormalized soil-water characteristic curve. The other advantage of equation [16] is that the difficult integrationshown in equation [15] is avoided. This allows equation [16] to work well with a number of soil-watercharacteristic equations.
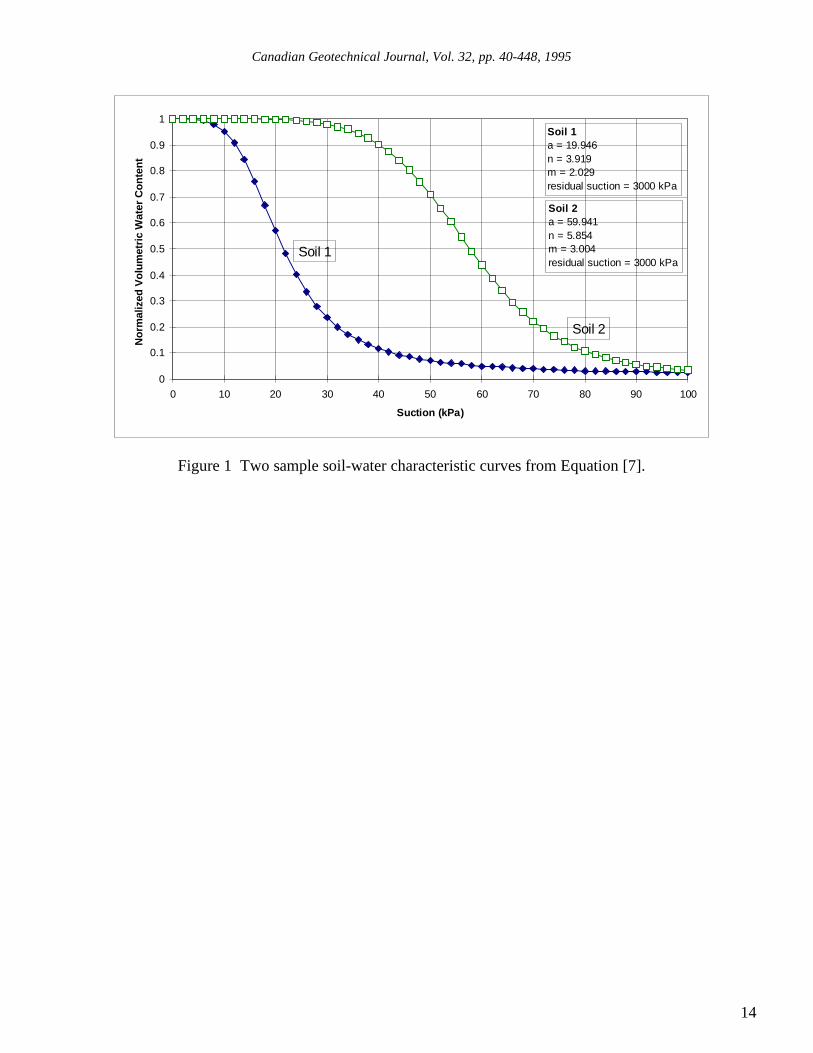
Comparison of Theory to Example DataConsider two different soils, Soil 1 and Soil 2, shown in Fig. 1. The soil-water characteristic curves are
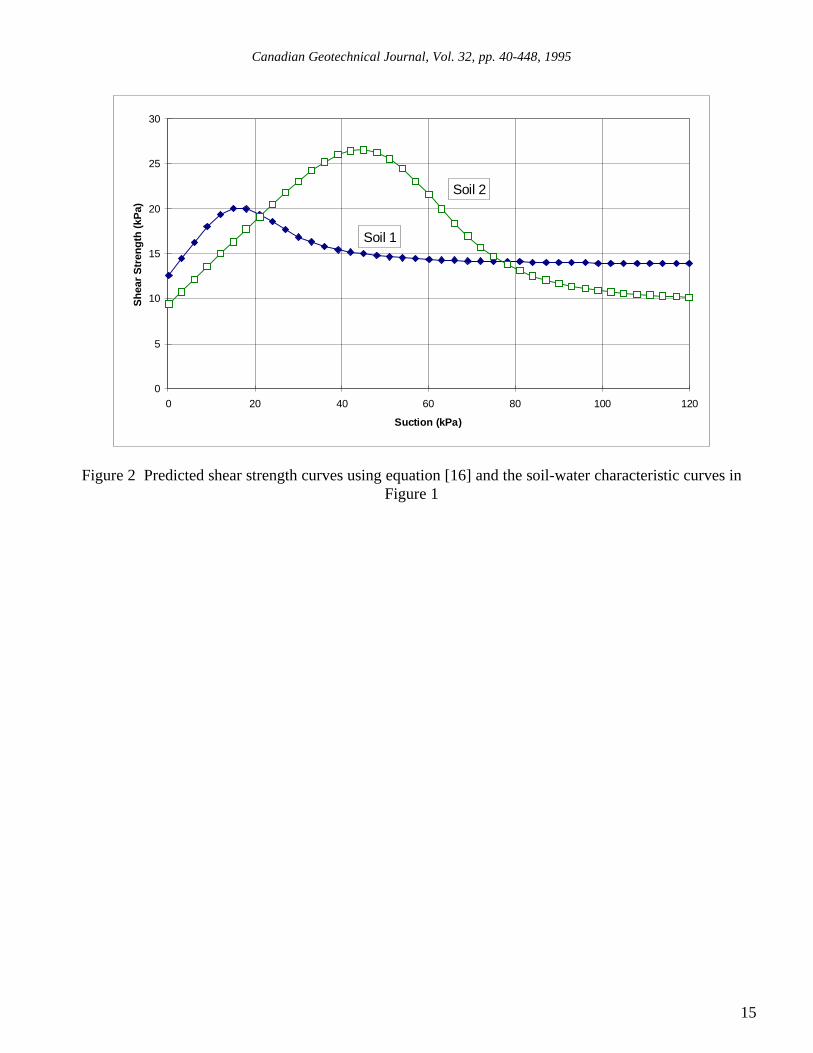
typical of a medium and fine-grained sand, respectively. Soil 1 has an effective cohesion of 0.0 kPa, an effectiveangle of internal friction of 32.0o and an air entry value of 20 kPa. Soil 2 has an effective cohesion of 0.0 kPa ,an effective angle of internal friction of 25.0o and an air entry value of 60 kPa. The predicted shear strengthcurves for Soil 1 and Soil 2 using Eq. [16] are shown in Fig. 2. It can be seen that the shear strength of bothsoils increases linearly at the rate of (tan φ′) up to the air entry values of the soils. Beyond the air entry values,the rate of change of shear strength with matric suction decreases. The change in shear strength with respect tosuction is in accordance with Eq. [12].
The shapes of the shear strength curves with respect to matric suction are similar to those measured byDonald (1956). Donald’s test results for several sands are shown in Fig. 3. In each case the shear strengthincreases with suction and then drops off to a lower value. A similar behavior was observed in the testing of a
C = (0) = c + ( - u )n wτ σ φ′ ′tan [14]
[ ] [ ]{ }τ σ φ
φ κκ κ
(u - u ) = c u
(u - u ) u u u u d u u d(u - u )
a w n a
0
u -u
a w a w a w a w a w
a w
' ( ) tan '
tan ' ( ) ( ) ( )
+ − +
+ − − −∫−Θ Θ Θ1 [15]
[ ]τ σ φ φκ = c + ( -u ) + (u - u ) (u - u )n a a w a w′ ′ ′tan tanΘ [16]
Canadian Geotechnical Journal, Vol. 32, pp. 40-448, 1995
7
fine to medium-grained decomposed tuff from Hong Kong (Fig. 4). The results indicate that at low confiningpressures the shear strength may rise and then start to fall with increasing suction. At higher confining pressuresthe shear strength shows a continual rise in strength with increasing suction. These results also illustrate theimportance of applying an appropriate confining pressure to the soil when measuring the soil-water characteristiccurve.
The ratio between the two friction angles (i.e., φ′ and φb) can be shown as a function of the normalized watercontent.
Equations [17] and [18] show that the angle, φb, is equal to the effective angle of internal friction, φ′, up to the airentry value of the soil (i.e., Θ(ua - uw) = 1). Beyond the air entry value, φb decreases as the matric suctionincreases (Fig. 2). This is in agreement with experimental observations (Gan, et al., 1988).
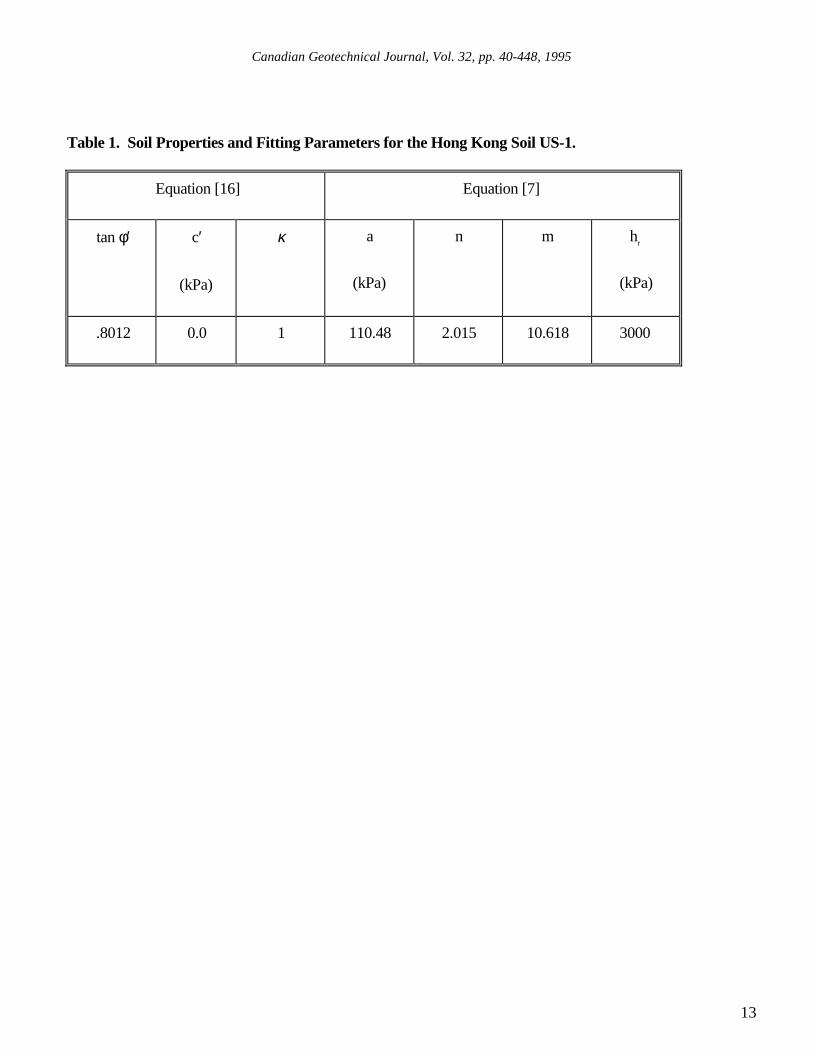
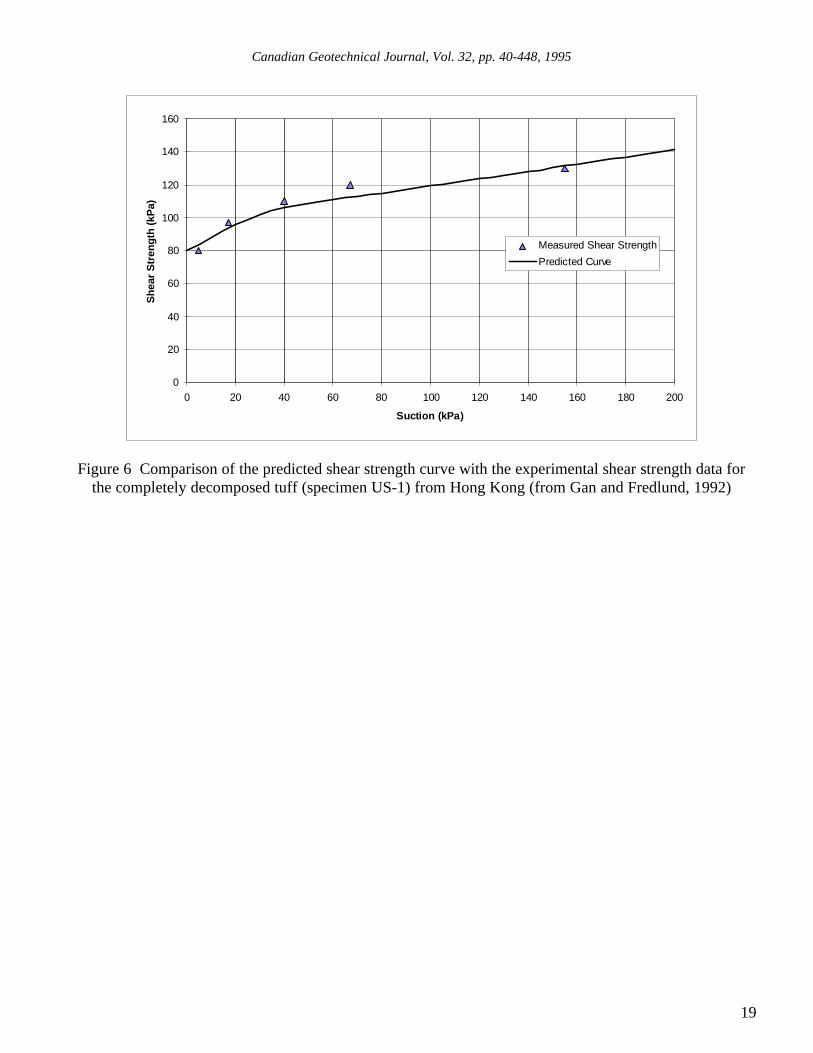
Equation [16] has been tested using experimental data from a completely decomposed tuff from HongKong (Gan and Fredlund, 1992). A best-fit soil-water characteristic curve using Eq. [8] is found by using acurve fitting program to match the measured water contents at various matric suction values (Fig. 5). The shearstrength function is calculated from Eq. [16]. The predicted shear strength values, along with the measuredshear strength values are shown in Fig. 6. The parameters used in the model are listed in Table 1. The value ofthe soil parameter, κ, was set to 1 for the prediction. The model with κ equal to 1, appears to give satisfactorypredictions for sandy soils. The value of κ generally increases with the plasticity of the soil and can be greaterthan 1.0.
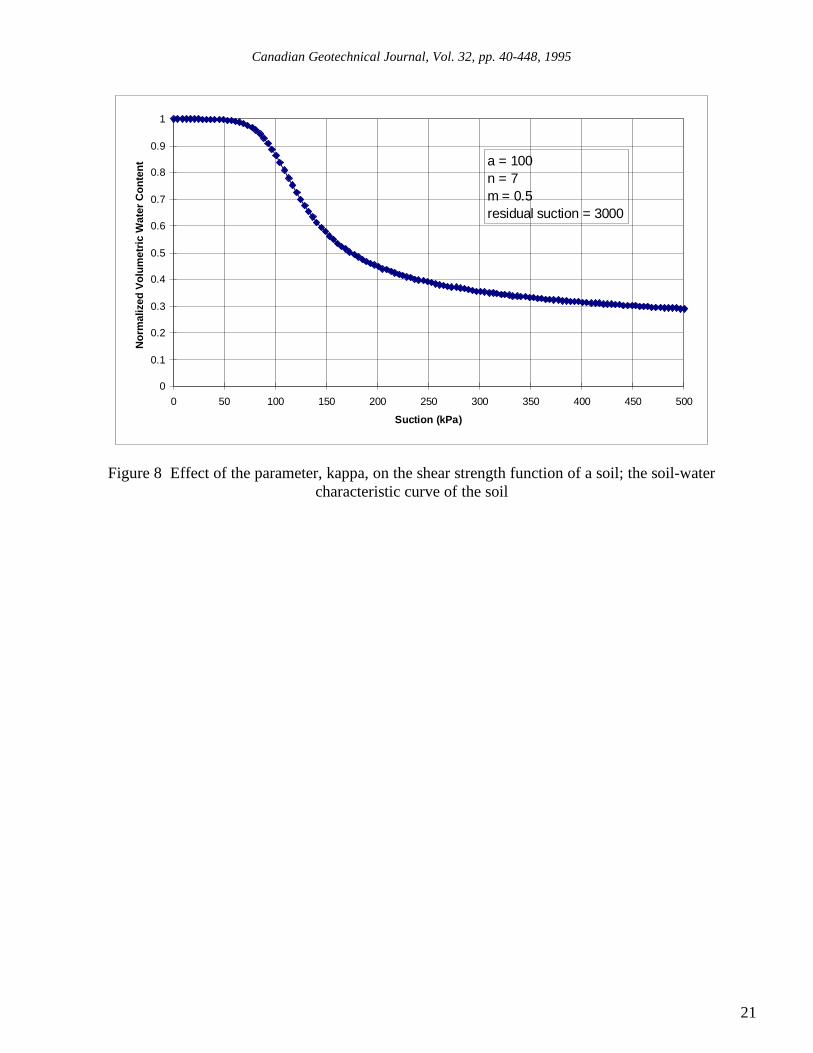
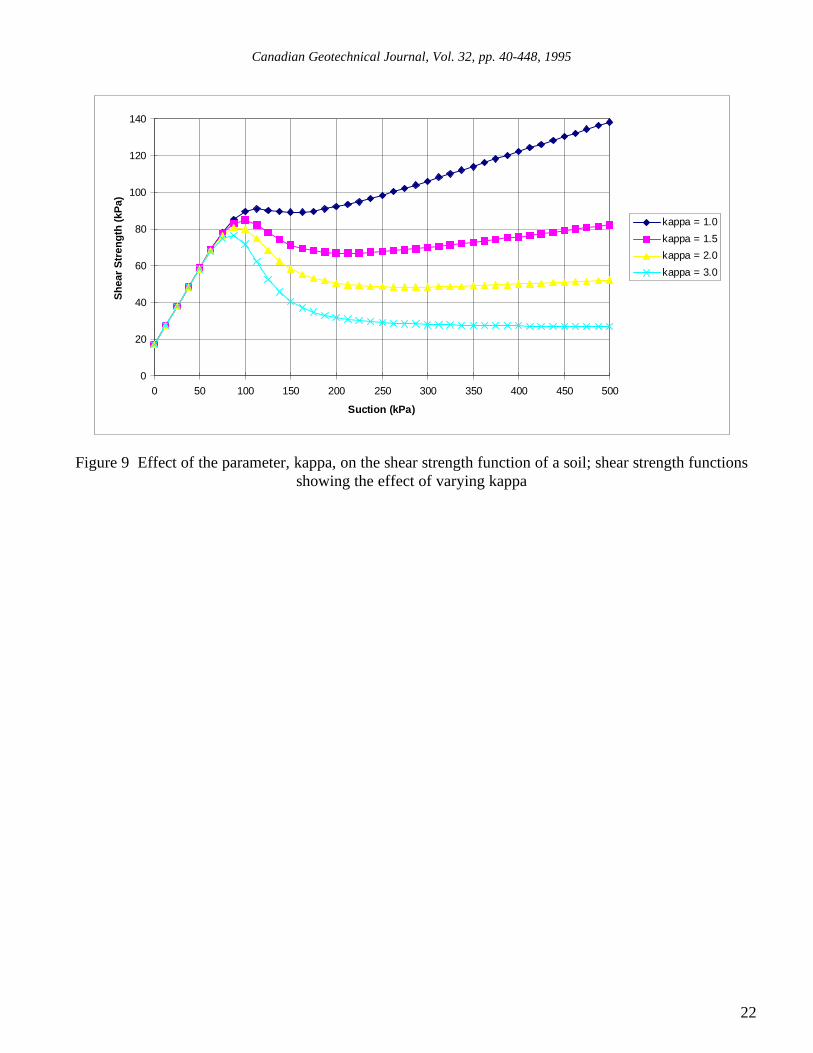
The value of κ affects the rate at which the angle φb decreases as the matric suction exceeds the air entryvalue of the soil. The effect of κ on the shear strength function of a soil with a soil-water characteristic curvedefined in Figures 7 and 8, is shown in Fig. 9. The values of κ range from 1.0 to 3.0. The influence of κ on theshape of the shear strength function occurs once the air entry value of the soil is exceeded. In the exampleshown, a value of κ equal to 2.0 shows that the shear strength envelope becomes essentially horizontal shortlyafter the air entry value is exceeded. The variable κ can be visualized as an indication of the relationship betweenthe volumetric representation of water in the voids and the area representation of water in the voids asrepresented by an unbiased plane passed through the soil mass.
Close-Form SolutionsClosed-form solutions for shear strength functions are developed for two cases, using the empirical
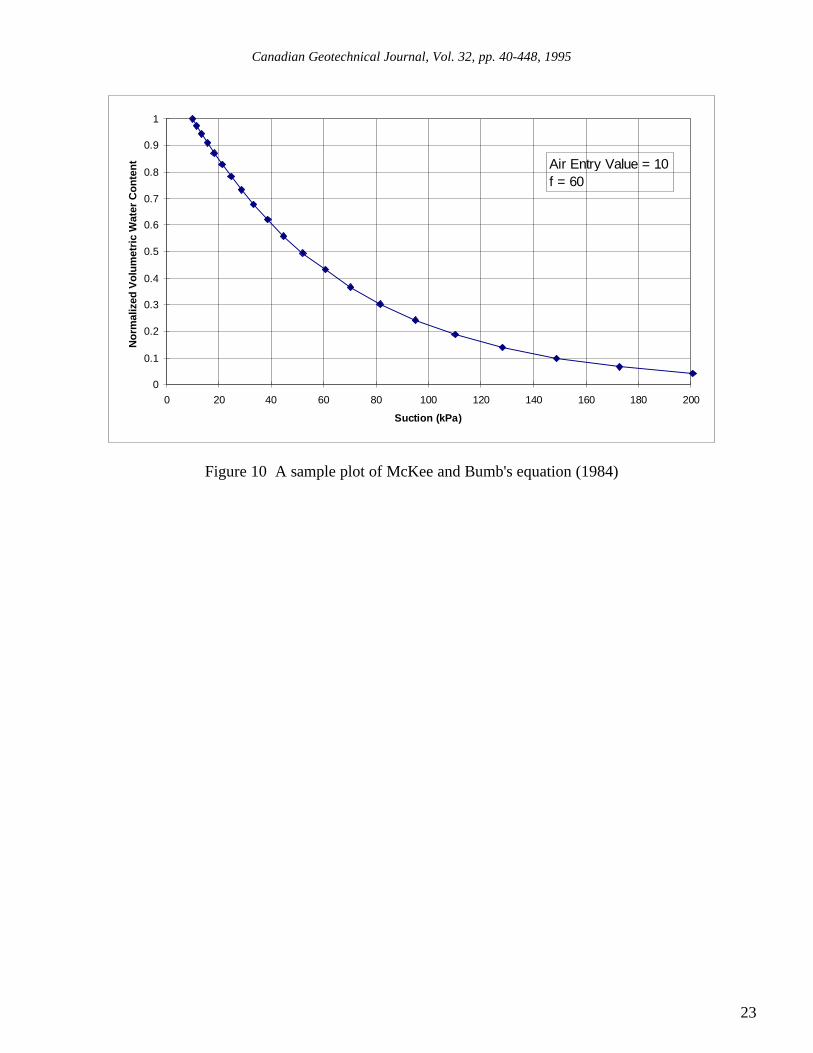
equations proposed by McKee and Bumb (1984) and Brooks and Corey (1964), respectively.The following exponential relationship for the soil-water characteristic curve is suggested by McKee and
Bumb (1984) for the case where the suction is greater than the air entry value (i.e., (ua-uw) > (ua-uw)b). A sampleplot of the equation proposed by McKee and Bumb (1984) can be seen in Fig. 10.
where: (ua-uw)b = the air entry value (also known as the bubbling pressure),
[ ] [ ]{ }tan tanb
a wa w a w a w a w =
d
d(u - u ) = (u - u ) (u - u ) (u - u ) d (u - u )φ τ κ φκ κΘ Θ Θ+ ′−1 [17]
[ ] [ ]βφφ
κκ κ =′
+ −tan
tan
b
a w a w a w a w = (u - u ) (u - u ) (u - u ) d (u - u )Θ Θ Θ1 [18]
Θ = e -ua uw b
f
ua-uw( ) ( )− −
[19]
Canadian Geotechnical Journal, Vol. 32, pp. 40-448, 1995
8
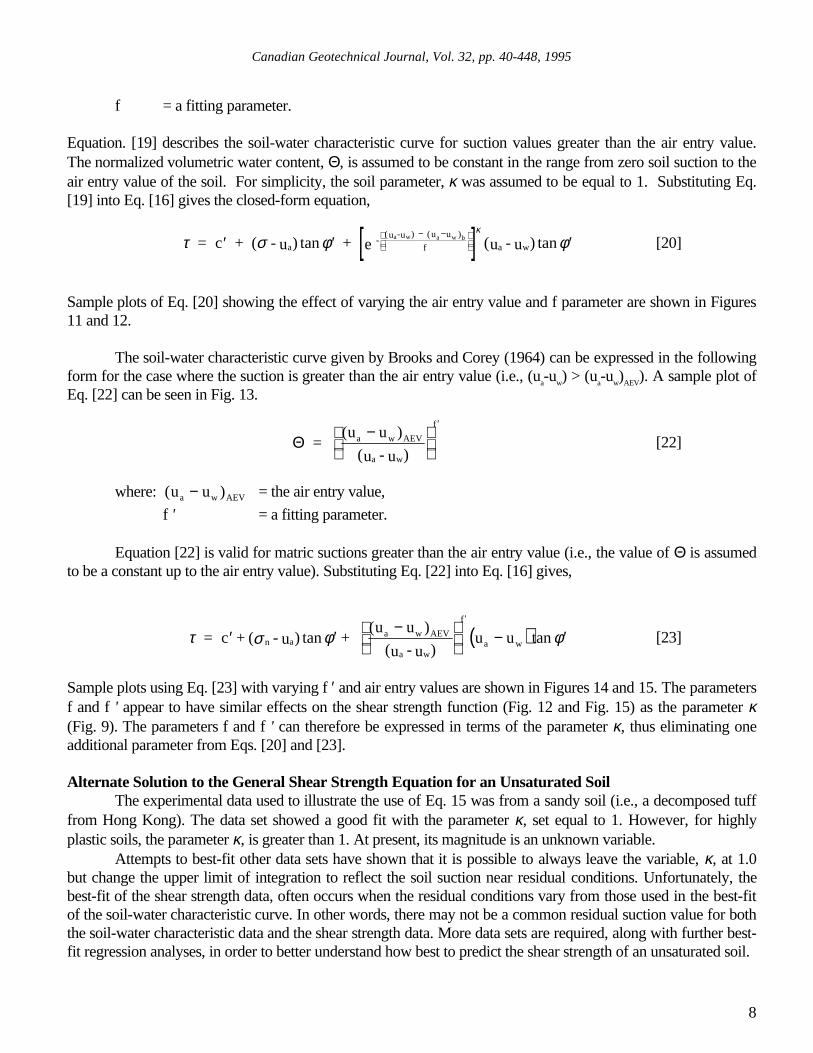
f = a fitting parameter.
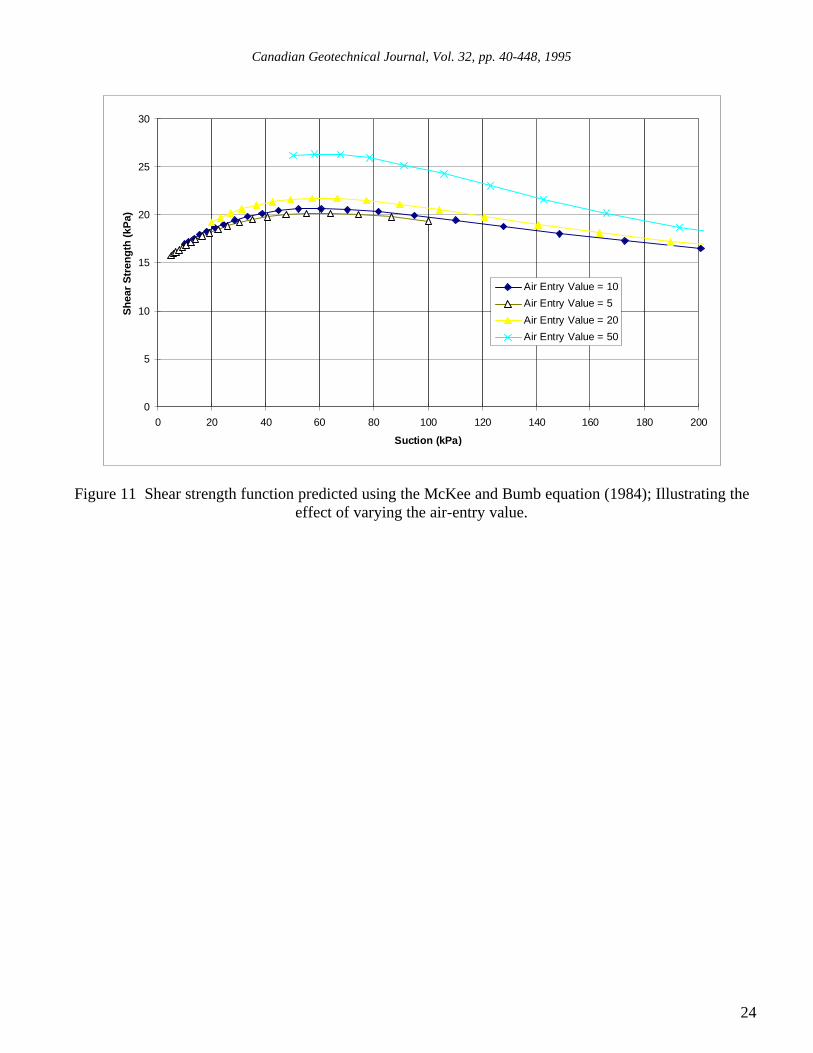
Equation. [19] describes the soil-water characteristic curve for suction values greater than the air entry value.The normalized volumetric water content, Θ, is assumed to be constant in the range from zero soil suction to theair entry value of the soil. For simplicity, the soil parameter, κ was assumed to be equal to 1. Substituting Eq.[19] into Eq. [16] gives the closed-form equation,
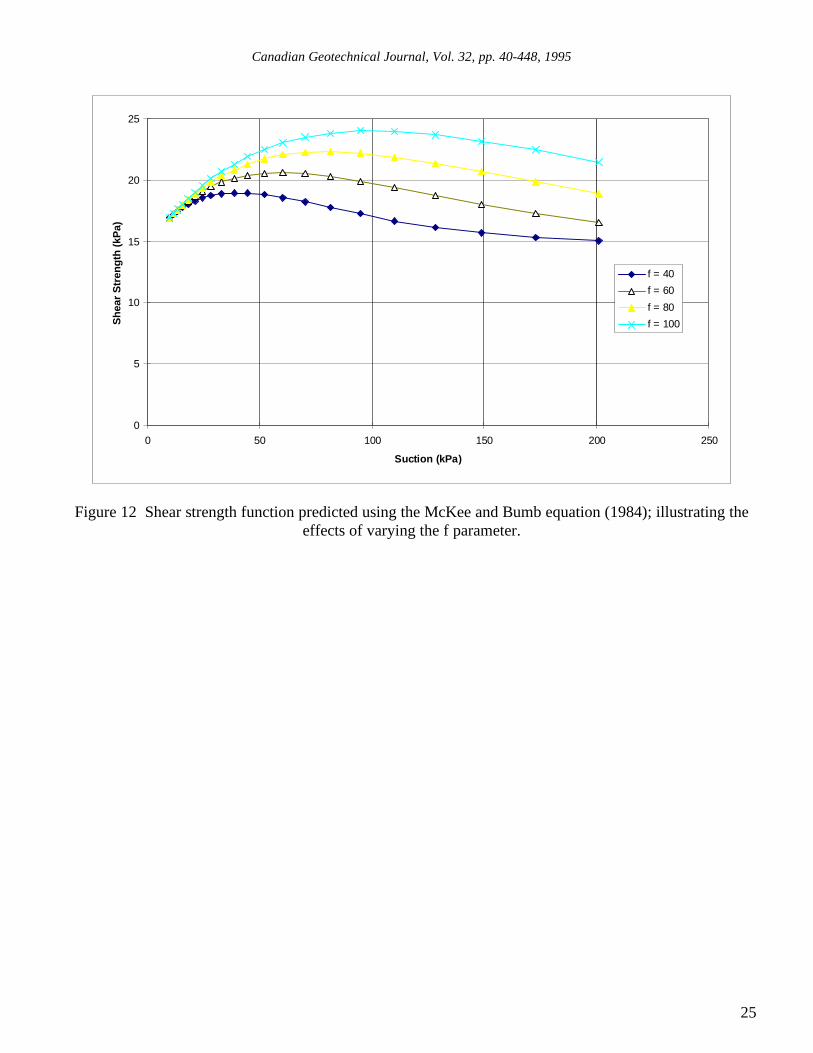
Sample plots of Eq. [20] showing the effect of varying the air entry value and f parameter are shown in Figures11 and 12.
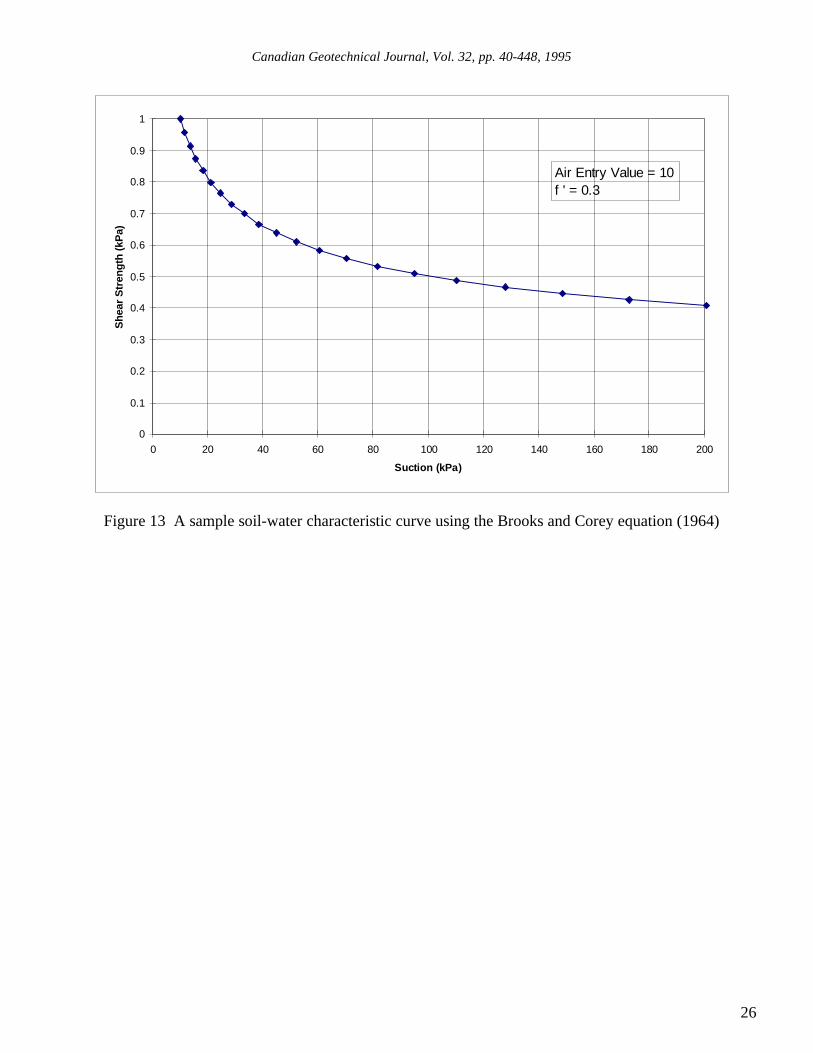
The soil-water characteristic curve given by Brooks and Corey (1964) can be expressed in the followingform for the case where the suction is greater than the air entry value (i.e., (ua-uw) > (ua-uw)AEV). A sample plot ofEq. [22] can be seen in Fig. 13.
where: ( )u ua w AEV− = the air entry value,
f ' = a fitting parameter.
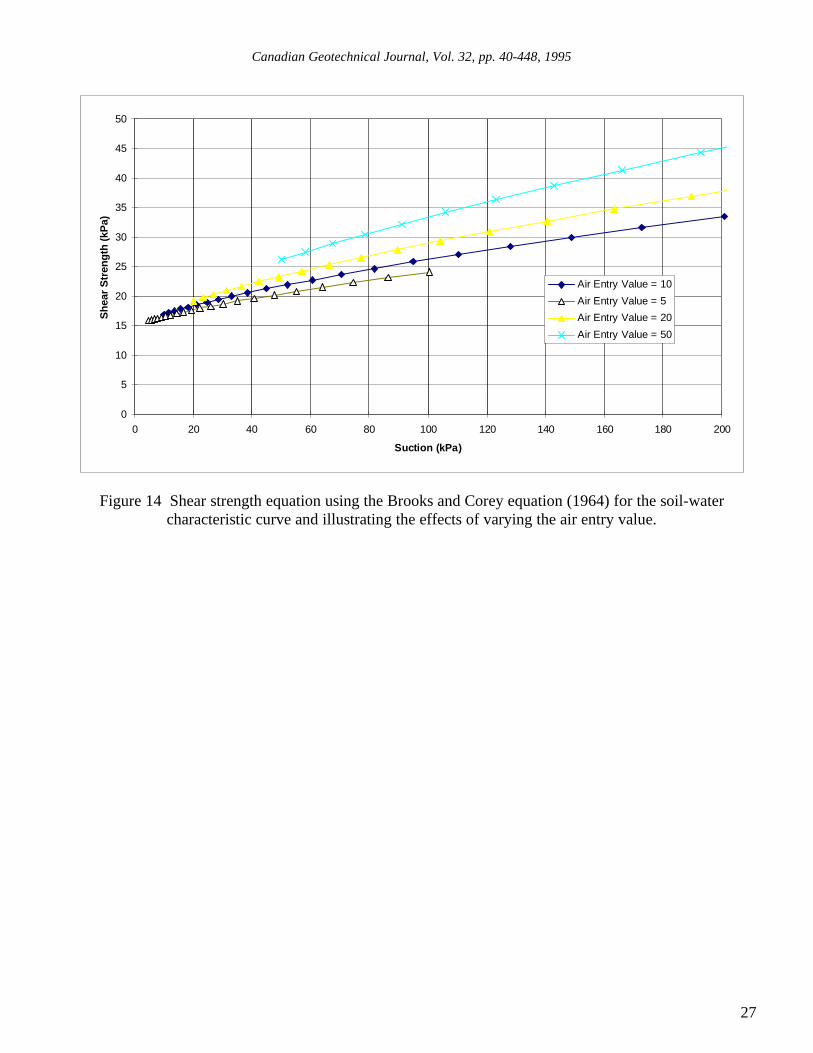
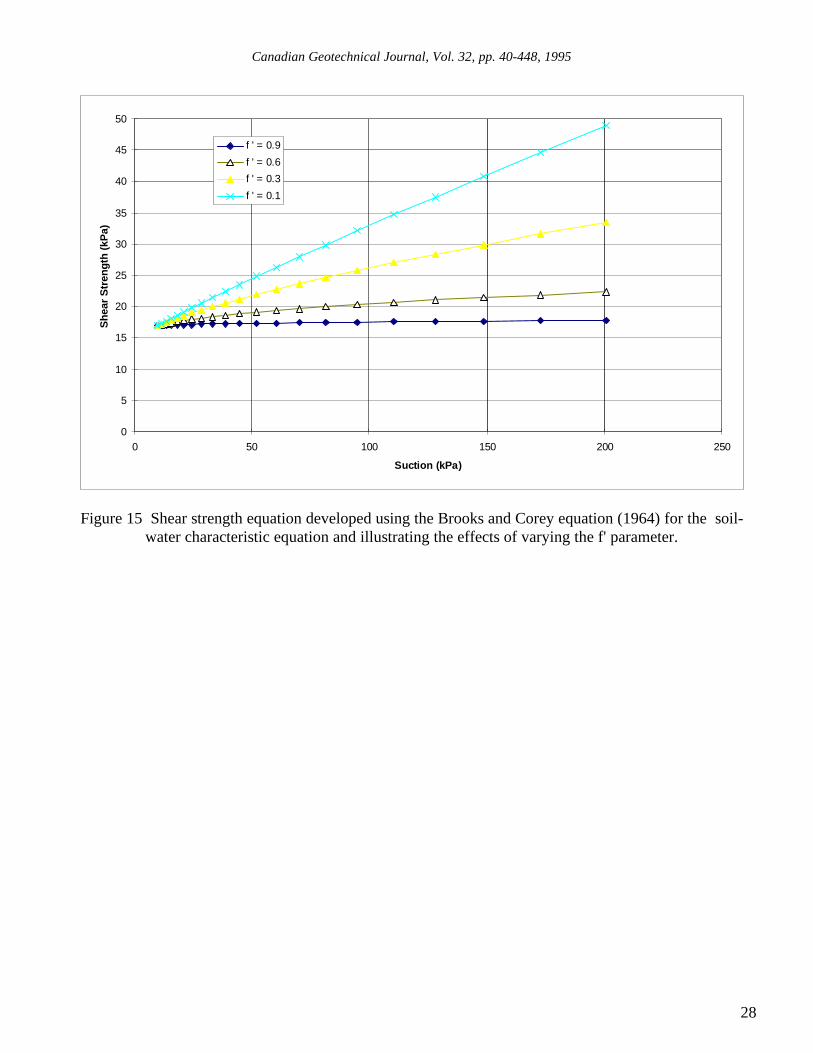
Equation [22] is valid for matric suctions greater than the air entry value (i.e., the value of Θ is assumedto be a constant up to the air entry value). Substituting Eq. [22] into Eq. [16] gives,
Sample plots using Eq. [23] with varying f ′ and air entry values are shown in Figures 14 and 15. The parametersf and f ' appear to have similar effects on the shear strength function (Fig. 12 and Fig. 15) as the parameter κ(Fig. 9). The parameters f and f ' can therefore be expressed in terms of the parameter κ, thus eliminating oneadditional parameter from Eqs. [20] and [23].
Alternate Solution to the General Shear Strength Equation for an Unsaturated SoilThe experimental data used to illustrate the use of Eq. 15 was from a sandy soil (i.e., a decomposed tuff
from Hong Kong). The data set showed a good fit with the parameter κ, set equal to 1. However, for highlyplastic soils, the parameter κ, is greater than 1. At present, its magnitude is an unknown variable.
Attempts to best-fit other data sets have shown that it is possible to always leave the variable, κ, at 1.0but change the upper limit of integration to reflect the soil suction near residual conditions. Unfortunately, thebest-fit of the shear strength data, often occurs when the residual conditions vary from those used in the best-fitof the soil-water characteristic curve. In other words, there may not be a common residual suction value for boththe soil-water characteristic data and the shear strength data. More data sets are required, along with further best-fit regression analyses, in order to better understand how best to predict the shear strength of an unsaturated soil.
[ ]τ σ φ φκ
= c + ( -u ) + e (u - u )a-
(u -u ) u u
f a wa w a w b′ ′ ′
− −
tan tan
( ) [20]
Θ = u u
(u - u )
f
a w AEV
a w
′−
( )[22]
( )τ σ φ φ = c + ( -u ) +u u
(u - u )un a
f
a w AEV
a ww′ ′
−
− ′′
tan( )
tan ua [23]
Canadian Geotechnical Journal, Vol. 32, pp. 40-448, 1995
9
ConclusionsA model is proposed for the prediction of the shear strength of an unsaturated soil. The model makes
use of the soil-water characteristic curve and the saturated shear strength properties of the soil to predict the shearstrength. The use of the model is illustrated using experimental data for a decomposed tuff soil from HongKong. The predicted shear strength curve shows good agreement with measured data; however, there is anadditional soil parameter, κ, which becomes greater than 1 as the plasticity of the soil increases.
AcknowledgementsThe authors would like to acknowledge the assistance of Mr. Julian K-M. Gan, Research Engineer at the
University of Saskatchewan, Saskatoon, in assembling and critiquing this manuscript, as well as performing thelaboratory tests on the decomposed tuff from Hong Kong. The authors also wish to acknowledge the assistanceof Dr. Sai Vanapalli in developing the theoretical concepts for the shear strength of unsaturated soils.
Canadian Geotechnical Journal, Vol. 32, pp. 40-448, 1995
10
REFERENCES
Brooks, R.H. and A.T. Corey, 1964. “Hydraulic Properties of Porous Medium” , Colorado State Univ., Fort
Collins. Hydrology Paper No. 3, 27 p.
Croney, D. and J.D. Coleman, 1961. “Pore Pressure and Suction in Soils” , In Proceedings of the Conference on
Pore Pressure and Suction in Soils, Butterworths, London, pp.31-37.
Donald, I.B., 1956. “Shear Strength Measurements in Unsaturated Non-Cohesive Soils With Negative Pore
Pressures” , Proceedings of 2nd Austraulia-New Zealand Conference of Soil Mechanics and Foundation
Engineering, Christchurch, New Zealand, pp.200-205.
Fredlund, D.G., Vanapalli, S., Xing, A. and Pufahl, D.E., (1995), “Predicting the Shear Strength Function for
Unsaturated Soils using the Soil-Water Characteristic Curve” , Proc. of the First Int. Conf. on
Unsaturated Soils, Paris, France, pp. 63-69
Fredlund, D.G., (1964) “Comparison of Soil Suction and One-Dimensional Consolidation Characteristics on a
Highly Plastic Clay” , Nat. Res. Council Tech. Report No. 245, Div. of Bldg. Res., Ottawa, Ontario,
Canada, 26p., July
Fredlund, D.G. (1995) “The Stability of Slopes with Negative Pore-Water Pressures” . The Ian Boyd Donald
Symposium on Modern Developments in Geomechanics, edited by C.M. Haberfield, Monash
University, Department of Civil Engineering, Clayton, Victoria 3168, Australia, pp. 99-116.
Fredlund, D. G., and N. R. Morgenstern, 1977. "Stress State Variables for Unsaturated Soils", ASCE J. Geotech.
Eng. Div. Vol. 103, GT5, pp. 447-466.
Fredlund, D.G. and Anqing Xing, 1994. “Equations for the Soil-Water Characteristic Curve” , Canadian
Geotechnical Journal, Vol. 31, pp. 521-532.
Fredlund, D.G. and H. Rahardjo, 1993a. “Soil Mechanics for Unsaturated Soils” , John Wiley and Sons, New
York, 517 p.
Canadian Geotechnical Journal, Vol. 32, pp. 40-448, 1995
11
Fredlund, D.G. and H. Rahardjo, 1993b. “An Overview of Unsaturated Soil Behaviour” , Proceedings of ASCE
Specialty Series on Unsaturated Soil Properties, Dallas, TX, October 24-28, pp. 1-31.
Fredlund, D. G., N. R. Morgenstern, and R. A. Widger, 1978. "The Shear Strength of Unsaturated Soils", Can.
Geotech. J., Vol. 15, No. 3, pp. 313-321.
Fredlund, D.G., Anqing Xing and Shangyan Huang, 1994. “Predicting the Permeability Function for
Unsaturated Soils Using the Soil-Water Characteristic Curve” , Canadian Geotechnical Journal, Vol. 31,
pp. 533-546.
Fung, Y.C. 1977, “A First Course in Continuum Mechanics” , Prentice-Hall Inc., Englewood Cliffs, New
Jersey.
Gan, J.K-M., D.G. Fredlund and H. Rahardjo, 1988. “Determination of the Shear Strength Parameters of an
Unsaturated Soil Using the Direct Shear Test” , Canadian Geotechnical Journal, Vol. 25, No. 8, pp. 500-
510.
Gan, J.K-M., and D.G. Fredlund, 1992. "Direct Shear Testing of a Hong Kong Soil under Various Applied
Matric Suctions", GEO Report No. 11, Geotechnical Engineering Office, Civil Engineering Department,
Hong Kong, 587 pp.
Gan, J,K-M., and D.G. Fredlund, 1996. “Shear Strength Characteristics of Two Saprolitic Soils” , Submitted to
Canadian Geotechnical Journal.
Karube, D., 1988. "New Concept of Effective Stress in Unsaturated Soil and Its Proving Test", Advanced
Triaxial Testing of Soil and Rock, ASTM STP 977, American Society for Testing and Materials,
Philadelphia, pp. 539-552.
Lamborn, M.J., 1986. "A Micromechanical Approach to Modeling Partly Saturated Soils", M.Sc. Thesis, Texas
A & M University, Texas.
Canadian Geotechnical Journal, Vol. 32, pp. 40-448, 1995
12
McKee, C.R. and A.C. Bumb, 1984. “The Importance of Unsaturated Flow parameters in Designing a
Monitoring System for a Hazardous Wastes and Environmental Emergencies” Hazardous Materials
Control Research Institute National Conference, Houston, TX, March 1984 pp. 50-58.
Papagiannakis, A. T. and D. G. Fredlund, 1984. “A Steady State Model for Flow in Saturated-Unsaturated
Soils” , Can. Geotech. J., Vol. 21, No. 13, pp. 419-430.
Peterson, R.F.W., 1988. "Interpretation of Triaxial Compression Test Results on Partially Saturated Soils",
Advanced Triaxial Testing of Soil and Rock, ASTM STP 977, American Society for Testing and
Materials, Philadelphia, pp. 512-538.
Richards, B.G., 1965. “Measurement of the Free Energy of Soil Moisture by the Psychrometric Technique
Using Thermistors, in Moisture Equilibria and Moisture Changes in Soils beneath Covered Areas” ,
Butterworth, Australia, pp. 39-46.
Russam, K. and C.D. Coleman, 1961, “The Effect of Climatic Factors on Subgrade Moisture Conditions” ,
Geotechnique, vol. XI, No. 1, pp. 22-28.
Satija, B. S., 1978. "Shear Behaviour of Partly Saturated Soils", Ph. D. Thesis, Indian Inst. of Tech., Delhi,
India.
Terzaghi, K., 1936. "The Shear Resistance of Saturated Soils", Proc. 1st Int. Conf. Soil Mech. Found. Eng.,
Cambridge, U. S. A., Vol. 1, pp.54-56
Toll, D.G., 1990. "A Framework for Unsaturated Soil Behaviour", Geotechnique, Vol. 40, No. 1, pp. 31-44.
Williams, P. J., 1982. "The Surface of the Earth, An Introduction to Geotechnical Science” , Longman Inc., New
York.
Canadian Geotechnical Journal, Vol. 32, pp. 40-448, 1995
13
Table 1. Soil Properties and Fitting Parameters for the Hong Kong Soil US-1.
Equation [16] Equation [7]
tan φ′ c′
(kPa)
κ a
(kPa)
n m hr
(kPa)
.8012 0.0 1 110.48 2.015 10.618 3000
Canadian Geotechnical Journal, Vol. 32, pp. 40-448, 1995
14
0
0.1
0.2
0.3
0.4
0.5
0.6
0.7
0.8
0.9
1
0 10 20 30 40 50 60 70 80 90 100
Suction (kPa)
Nor
mal
ized
Vol
umet
ric W
ater
Con
tent
Soil 1a = 19.946n = 3.919m = 2.029residual suction = 3000 kPa
Soil 2a = 59.941n = 5.854m = 3.004residual suction = 3000 kPa
Soil 1
Soil 2
Figure 1 Two sample soil-water characteristic curves from Equation [7].
Canadian Geotechnical Journal, Vol. 32, pp. 40-448, 1995
15
0
5
10
15
20
25
30
0 20 40 60 80 100 120
Suction (kPa)
She
ar S
tren
gth
(kP
a)
Soil 1
Soil 2
Figure 2 Predicted shear strength curves using equation [16] and the soil-water characteristic curves inFigure 1
Canadian Geotechnical Journal, Vol. 32, pp. 40-448, 1995
16
Figure 3 Results of direct shear tests on sands under low matric suctions (modified from Donald, 1956)
Canadian Geotechnical Journal, Vol. 32, pp. 40-448, 1995
17
Figure 4 Peak shear stress versus matric suction envelope for the completely decomposed fine ash tuff(Gan & Fredlund, 1996)

Canadian Geotechnical Journal, Vol. 32, pp. 40-448, 1995
18
0
0.1
0.2
0.3
0.4
0.5
0.6
0.7
0.8
0.9
1
0 20 40 60 80 100 120 140 160
Suction (kPa)
Nor
mal
ized
Vol
umet
ric W
ater
Con
tent
Best-fit curve
Experimental Data
a = 110.48n = 2.015m = 10.618residual suction = 3000
Figure 5 Soil-water characteristic curve for a completely decomposed tuff (specimen US-1) from HongKong, from experimental values (from Gan and Fredlund, 1992) and from calculations using equation [7]
Canadian Geotechnical Journal, Vol. 32, pp. 40-448, 1995
19
0
20
40
60
80
100
120
140
160
0 20 40 60 80 100 120 140 160 180 200
Suction (kPa)
She
ar S
tren
gth
(kP
a)
Measured Shear Strength
Predicted Curve
Figure 6 Comparison of the predicted shear strength curve with the experimental shear strength data forthe completely decomposed tuff (specimen US-1) from Hong Kong (from Gan and Fredlund, 1992)
Canadian Geotechnical Journal, Vol. 32, pp. 40-448, 1995
20
0
0.1
0.2
0.3
0.4
0.5
0.6
0.7
0.8
0.9
1
0.1 1 10 100 1000 10000 100000 1000000
Suction (kPa)
Nor
mal
ized
Vol
umet
ric W
ater
Con
tent
a = 100n = 7m = 0.5residual suction = 3000
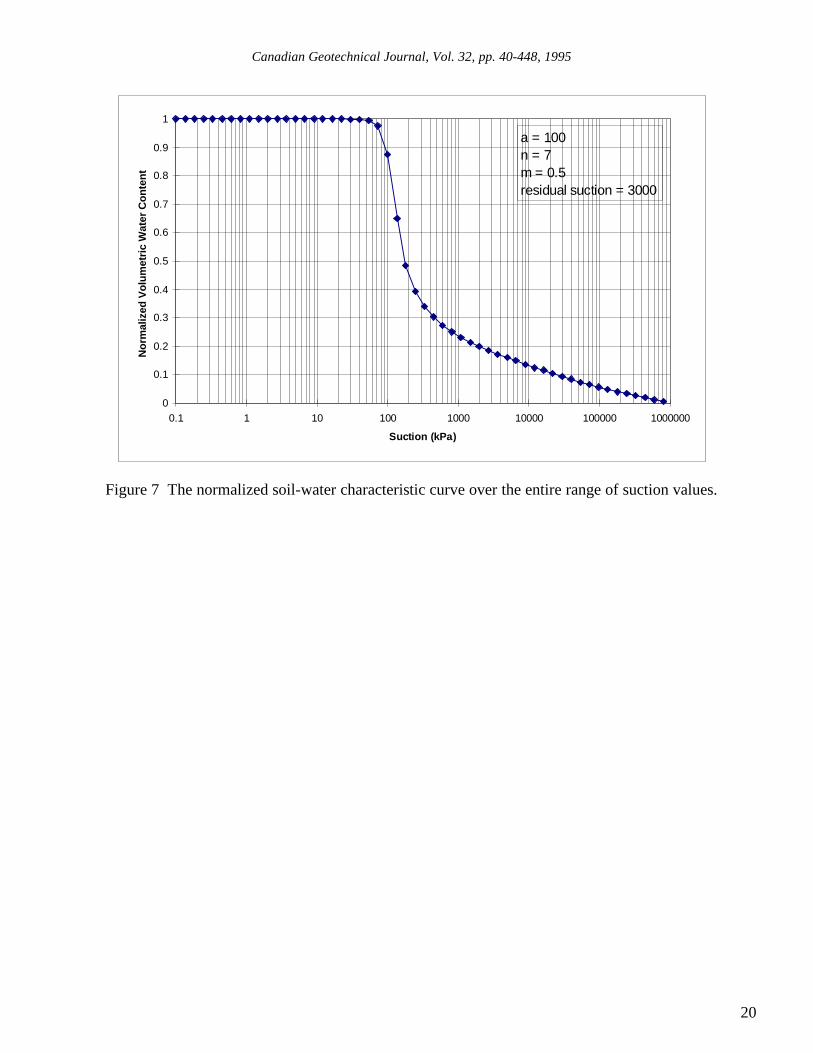
Figure 7 The normalized soil-water characteristic curve over the entire range of suction values.
Canadian Geotechnical Journal, Vol. 32, pp. 40-448, 1995
21
0
0.1
0.2
0.3
0.4
0.5
0.6
0.7
0.8
0.9
1
0 50 100 150 200 250 300 350 400 450 500
Suction (kPa)
Nor
mal
ized
Vol
umet
ric W
ater
Con
tent
a = 100n = 7m = 0.5residual suction = 3000
Figure 8 Effect of the parameter, kappa, on the shear strength function of a soil; the soil-watercharacteristic curve of the soil
Canadian Geotechnical Journal, Vol. 32, pp. 40-448, 1995
22
0
20
40
60
80
100
120
140
0 50 100 150 200 250 300 350 400 450 500
Suction (kPa)
She
ar S
tren
gth
(kP
a)
kappa = 1.0
kappa = 1.5
kappa = 2.0
kappa = 3.0
Figure 9 Effect of the parameter, kappa, on the shear strength function of a soil; shear strength functionsshowing the effect of varying kappa
Canadian Geotechnical Journal, Vol. 32, pp. 40-448, 1995
23
0
0.1
0.2
0.3
0.4
0.5
0.6
0.7
0.8
0.9
1
0 20 40 60 80 100 120 140 160 180 200
Suction (kPa)
Nor
mal
ized
Vol
umet
ric W
ater
Con
tent
Air Entry Value = 10f = 60
Figure 10 A sample plot of McKee and Bumb's equation (1984)
Canadian Geotechnical Journal, Vol. 32, pp. 40-448, 1995
24
0
5
10
15
20
25
30
0 20 40 60 80 100 120 140 160 180 200
Suction (kPa)
She
ar S
tren
gth
(kP
a)
Air Entry Value = 10
Air Entry Value = 5
Air Entry Value = 20
Air Entry Value = 50
Figure 11 Shear strength function predicted using the McKee and Bumb equation (1984); Illustrating theeffect of varying the air-entry value.
Canadian Geotechnical Journal, Vol. 32, pp. 40-448, 1995
25
0
5
10
15
20
25
0 50 100 150 200 250
Suction (kPa)
She
ar S
tren
gth
(kP
a)
f = 40
f = 60
f = 80
f = 100
Figure 12 Shear strength function predicted using the McKee and Bumb equation (1984); illustrating theeffects of varying the f parameter.
Canadian Geotechnical Journal, Vol. 32, pp. 40-448, 1995
26
0
0.1
0.2
0.3
0.4
0.5
0.6
0.7
0.8
0.9
1
0 20 40 60 80 100 120 140 160 180 200
Suction (kPa)
She
ar S
tren
gth
(kP
a)
Air Entry Value = 10f ' = 0.3
Figure 13 A sample soil-water characteristic curve using the Brooks and Corey equation (1964)
Canadian Geotechnical Journal, Vol. 32, pp. 40-448, 1995
27
0
5
10
15
20
25
30
35
40
45
50
0 20 40 60 80 100 120 140 160 180 200
Suction (kPa)
She
ar S
tren
gth
(kP
a)
Air Entry Value = 10
Air Entry Value = 5
Air Entry Value = 20
Air Entry Value = 50
Figure 14 Shear strength equation using the Brooks and Corey equation (1964) for the soil-watercharacteristic curve and illustrating the effects of varying the air entry value.
Canadian Geotechnical Journal, Vol. 32, pp. 40-448, 1995
28
0
5
10
15
20
25
30
35
40
45
50
0 50 100 150 200 250
Suction (kPa)
She
ar S
tren
gth
(kP
a)
f ' = 0.9
f ' = 0.6
f ' = 0.3
f ' = 0.1
Figure 15 Shear strength equation developed using the Brooks and Corey equation (1964) for the soil-water characteristic equation and illustrating the effects of varying the f' parameter.
Canadian Geotechnical Journal, Vol. 32, pp. 40-448, 1995
29
LIST OF FIGURES
Figure 1 Two sample soil-water characteristic curves from Equation [7].
Figure 2 Predicted shear strength curves using equation [16] and the soil-water characteristic curves inFigure 1
Figure 3 Results of direct shear tests on sands under low matric suctions (modified from Donald, 1956)
Figure 4 Peak shear stress versus matric suction envelope for the completely decomposed fine ash tuff (Gan& Fredlund, 1996)
Figure 5 Soil-water characteristic curve for a completely decomposed tuff (specimen US-1) from HongKong, from experimental values (from Gan and Fredlund, 1992) and from calculations usingequation [7]
Figure 6 Comparison of the predicted shear strength curve with the experimental shear strength data for thecompletely decomposed tuff (specimen US-1) from Hong Kong (from Gan and Fredlund, 1992)
Figure 7 The normalized soil-water characteristic curve over the entire range of suction values.
Figure 8 Effect of the parameter, kappa, on the shear strength function of a soil; the soil-water characteristiccurve of the soil
Figure 9 Effect of the parameter, kappa, on the shear strength function of a soil; shear strength functionsshowing the effect of varying kappa
Figure 10 A sample plot of McKee and Bumb's equation (1984)
Figure 11 Shear strength function predicted using the McKee and Bumb equation (1984); Illustrating theeffect of varying the air-entry value.
Figure 12 Shear strength function predicted using the McKee and Bumb equation (1984); illustrating theeffects of varying the f parameter.
Figure 13 A sample soil-water characteristic curve using the Brooks and Corey equation (1964)
Figure 14 Shear strength equation using the Brooks and Corey equation (1964) for the soil-watercharacteristic curve and illustrating the effects of varying the air entry value.
Figure 15 Shear strength equation developed using the Brooks and Corey equation (1964) for the soil-water characteristic equation and illustrating the effects of varying the f' parameter.