The relationship between total quality management practices and ...
31
Journal of Operations Management 21 (2003) 405–435 The relationship between total quality management practices and their effects on firm performance Hale Kaynak ∗ Department of Management, Marketing, and International Business, College of Business Administration, The University of Texas—Pan American, 1201 West University Drive, Edinburg, TX 78539-2999, USA Received 6 June 2000; accepted 10 November 2002 Abstract Recent research on total quality management (TQM) has examined the relationships between the practices of quality management and various levels of organizational performance. These studies have produced mixed results, probably because of the nature of the research designs used such as measuring TQM or performance as a single construct. Based on a comprehensive literature review, this study identifies the relationships among TQM practices and examines the direct and indirect effects of these practices on various performance levels. A proposed research model and hypotheses are tested by using cross-sectional mail survey data collected from firms operating in the US. The test of the structural model supports the proposed hypotheses. The implications of the findings for researchers and practitioners are discussed and further research directions are offered. © 2003 Elsevier Science B.V. All rights reserved. Keywords: Quality management; Performance; Structural equation modeling 1. Introduction The barnyard rooster Chanticleer had a theory. He crowed every morning, putting forth all his energy, flapped his wings. The sun came up. The connex- ion was clear: His crowing caused the sun to come up. There was no question about his importance. There came a snag. He forgot one morning to crow. The sun came up anyhow. Crestfallen, he saw his theory in need of revision. (Deming, 1993, p. 105) In the late 1970s and early 1980s, previously un- challenged American industries lost substantial mar- ket share in both US and world markets. To regain ∗ Tel.: +1-956-381-3380; fax: +1-956-384-5065. E-mail address: [email protected] (H. Kaynak). the competitive edge, companies began to adopt pro- ductivity improvement programs which had proven themselves particularly successful in Japan. One of these “improvement programs” was the total quality management (TQM) system. In last two decades, both the popular press and academic journals have pub- lished a plethora of accounts describing both success- ful and unsuccessful efforts at implementing TQM. Like Chanticleer’s theory, theories of quality manage- ment have been under revision ever since. The early stages of empirical research in TQM have been almost exclusively limited to attempts at constructing instruments capable of measuring TQM practices as, for example, Saraph et al. (1989) have done, and with studies such as Garvin’s (1983) that compare TQM practices in Japanese and US firms. More recently, scholars like Mohrman et al. (1995) have channeled their research efforts into analyzing 0272-6963/03/$ – see front matter © 2003 Elsevier Science B.V. All rights reserved. doi:10.1016/S0272-6963(03)00004-4
Transcript of The relationship between total quality management practices and ...

Journal of Operations Management 21 (2003) 405–435
The relationship between total quality managementpractices and their effects on firm performance
Hale Kaynak∗Department of Management, Marketing, and International Business, College of Business Administration,The University of Texas—Pan American, 1201 West University Drive, Edinburg, TX 78539-2999, USA
Received 6 June 2000; accepted 10 November 2002
Abstract
Recent research on total quality management (TQM) has examined the relationships between the practices of qualitymanagement and various levels of organizational performance. These studies have produced mixed results, probably because ofthe nature of the research designs used such as measuring TQM or performance as a single construct. Based on a comprehensiveliterature review, this study identifies the relationships among TQM practices and examines the direct and indirect effects ofthese practices on various performance levels. A proposed research model and hypotheses are tested by using cross-sectionalmail survey data collected from firms operating in the US. The test of the structural model supports the proposed hypotheses.The implications of the findings for researchers and practitioners are discussed and further research directions are offered.© 2003 Elsevier Science B.V. All rights reserved.
Keywords:Quality management; Performance; Structural equation modeling
1. Introduction
The barnyard rooster Chanticleer had a theory. Hecrowed every morning, putting forth all his energy,flapped his wings. The sun came up. The connex-ion was clear: His crowing caused the sun to comeup. There was no question about his importance.There came a snag. He forgot one morning to crow.The sun came up anyhow. Crestfallen, he saw histheory in need of revision.
(Deming, 1993, p. 105)
In the late 1970s and early 1980s, previously un-challenged American industries lost substantial mar-ket share in both US and world markets. To regain
∗ Tel.: +1-956-381-3380; fax:+1-956-384-5065.E-mail address:[email protected] (H. Kaynak).
the competitive edge, companies began to adopt pro-ductivity improvement programs which had proventhemselves particularly successful in Japan. One ofthese “improvement programs” was the total qualitymanagement (TQM) system. In last two decades, boththe popular press and academic journals have pub-lished a plethora of accounts describing both success-ful and unsuccessful efforts at implementing TQM.Like Chanticleer’s theory, theories of quality manage-ment have been under revision ever since.
The early stages of empirical research in TQMhave been almost exclusively limited to attempts atconstructing instruments capable of measuring TQMpractices as, for example,Saraph et al. (1989)havedone, and with studies such asGarvin’s (1983)thatcompare TQM practices in Japanese and US firms.More recently, scholars likeMohrman et al. (1995)have channeled their research efforts into analyzing
0272-6963/03/$ – see front matter © 2003 Elsevier Science B.V. All rights reserved.doi:10.1016/S0272-6963(03)00004-4

406 H. Kaynak / Journal of Operations Management 21 (2003) 405–435
the relationship between practices of quality manage-ment and organizational performance on various lev-els. Recent studies such as the one conducted byDaset al. (2000)have started investigating both the rela-tionships among techniques of quality managementsystems and the effects they have on performance.
These studies have produced mixed results. Thisfailure to obtain consistent results could be due tothree significant differences among studies in termsof research design issues. First, in some studies suchas the one conducted byDouglas and Judge (2001),TQM is operationalized as a single construct to ana-lyze the relationship between TQM and firms’ perfor-mance, while others,Samson and Terziovski (1999)for instance, operationalize TQM as a multidimen-sional construct. Second, the levels of performancemeasured vary among the studies. Some studies op-erationalize performance only at operating levels asSamson and Terziovski (1999)do, while others likeDouglas and Judge (2001)measure only financialperformance; and still others as doDas et al. (2000),measure performance at multiple levels. Third, theanalytical framework used to investigate the relationbetween TQM and performance also differs amongthe studies. In other words, when the data analysesare based on a series of multiple regressions (Adamet al., 1997; Mohrman et al., 1995; Samson andTerziovski, 1999) or correlations (Powell, 1995), thestudies fall short of investigating which TQM prac-tices have direct and/or indirect effects on variouslevels of performance. In short, comprehensive stud-ies trying to identify the direct and indirect effects ofTQM practices on performance at multiple levels arerather limited and fail to respond conclusively to thefollowing research questions:
• What are the relationships among TQM practices?• Which TQM practices are directly related to oper-
ating, market and financial performance?• Which TQM practices are indirectly related to op-
erating, market and financial performance?
This study investigates these research questions byusing the data fromKaynak’s (1997)study. This re-search contributes to the development of TQM theoryby investigating the relationships between seven qual-ity management practices and their effects on oper-ating, financial, and market performance. While thisstudy does replicate some earlier research, it is unique
in that the dimensions of the quality management prac-tices investigated are extensive and firms’ performanceis measured at multiple levels. Replication research fa-cilitates the goal of science, which is empirical gener-alization or knowledge development (Hubbard et al.,1998), and it is recommended in cases such as this“where different studies produced inconsistent results”(Amundson, 1998, p. 355). This research is relevant topractitioners because the findings may reveal patternsin the implementation of TQM practices, which mayprovide significant information managers can use tosolve implementation challenges and perhaps to im-prove performance. Moreover, the results of this studymay provide support for continued implementation ofTQM. The unsuccessful attempts have prompted crit-icisms of TQM in the popular press and caused somemanagers who might otherwise have had an interestin implementing TQM to question the wisdom of uti-lizing this management approach. But this, to quotean old but still relevant cliché, is throwing out thebaby with the bath water. The remainder of this pa-per is organized as follows. A research model and re-lated hypotheses are offered based on the review ofthe literature in the next section.Section 3describesthe research methodology, including the constructionof the instrument and measures, the survey procedure,the sample, and the tests for reliability and validity.Section 4presents the results of testing the structuralmodel. The implications of the results for researchersand practitioners are discussed and validity of findingsis reevaluated inSection 5. The paper concludes withfurther research implications of this study.
2. Theoretical background
TQM can be defined as a holistic management phi-losophy that strives for continuous improvement in allfunctions of an organization, and it can be achievedonly if the total quality concept is utilized from theacquisition of resources to customer service after thesale. TQM practices have been documented exten-sively in measurement studies as well as in the studiesthat have investigated the relation of TQM practices tovarious dependent variables. The TQM practices iden-tified in measurement studies bySaraph et al. (1989)and those who have followed their example are sum-marized inTable 1.

H.
Ka
yna
k/Jo
urn
al
of
Op
era
tion
sM
an
agem
en
t2
1(2
00
3)
40
5–
43
5407
Table 1TQM Practices identified in measurement studies on TQM
Saraph et al. (1989) Description bySaraph et al. (1989, p. 818) Flynn et al. (1994) Ahire et al. (1996) Black and Porter(1996)
Malcolm Baldrige Award(Criteria for PerformanceExcellence, 2002)
Managementleadership
Acceptance of quality responsibility by topmanagement. Evaluation of top managementon quality. Participation by top managementin quality improvement efforts. Specificityof quality goals. Importance attached toquality in relation to cost and schedule.Comprehensive quality planning.
Top managementsupport
Quality leadershipQuality improvementrewards
Top managementcommitment
Corporate qualitycultureStrategic qualitymanagement
LeadershipStrategic planning
Role of the QualityDepartment
Visibility and autonomy of the qualitydepartment. The quality department’s accessto top management. Use of quality staff forconsultation. Coordination between qualitydepartment and other departments.Effectiveness of the quality department.
Training Provision of statistical training, tradetraining, and quality-related training for allemployees.
Employee training Human resource focus
Employee relations Implementation of employee involvementand quality circles. Open employeeparticipation in quality decisions.Responsibility of employees for quality.Employee recognition for superior qualityperformance. Effectiveness of supervision inhandling quality issues. Ongoing qualityawareness of all employees.
Workforce managementSelection for teamworkpotentialTeamwork
EmployeeempowermentEmployeeinvolvement
People andcustomermanagementTeamworkstructures
Human resource focus
Quality data andreporting
Use of quality cost data. Feedback ofquality data to employees and managers forproblem solving. Timely qualitymeasurement. Evaluation of managers andemployees based on quality performance.Availability of quality data.
Quality informationProcess controlFeedback
Internal qualityinformation usage
Qualityimprovementmeasurementsystems
Information and analysis
Supplier qualitymanagement
Fewer dependable suppliers. Reliance onsupplier process control. Stronginterdependence of supplier and customer.Purchasing policy emphasizing qualityrather than price. Supplier quality control.Supplier assistance in product development.
Supplier involvement Supplier qualitymanagementSupplierperformance
Supplierpartnerships

408H
.K
ayn
ak
/Jou
rna
lo
fO
pe
ratio
ns
Ma
nage
me
nt
21
(20
03
)4
05
–4
35
Table 1 (Continued)
Saraph et al. (1989) Description bySaraph et al. (1989, p. 818) Flynn et al. (1994) Ahire et al. (1996) Black and Porter(1996)
Malcolm Baldrige Award(Criteria for PerformanceExcellence, 2002)
Product/servicedesign
Thorough scrub-down process. Involvementof all affected departments in designreviews. Emphasis on producibility. Clarityof specifications. Emphasis on quality, notroll-out schedule. Avoidance of frequentredesigns.
Product designNew product qualityInterfunctional designprocess
Design qualitymanagement
External interfacemanagement
Process management
Processmanagement
Clarity of process ownership, boundaries,and steps. Less reliance on inspection. Useof statistical process control. Selectiveautomation. Fool-proof process design.Preventive maintenance. Employeeself-inspection. Automated testing.
Process management Statistical processcontrol usage
Operationalquality planning
Process management
Customer involvement CustomerfocusBenchmarking
Customer satisfactionorientationCommunication ofimprovementinformation
Customer andmarketfocus

H. Kaynak / Journal of Operations Management 21 (2003) 405–435 409
A close examination ofTable 1 shows that eachinstrument has some limitations and some strengths.As a part of her research,Kaynak (1997)usedSaraphet al.’s (1989)survey instrument for most of the itemsto assess the implementation of TQM in 382 man-ufacturing and service firms operating in the UnitedStates because the nature of her study was closerto that of Saraph et al. (1989)than it was to theother TQM measurement studies available. The re-sults of reliability tests and factor analysis showedthe same patternSaraph et al. (1989)found in theirstudy. (The instrument will be discussed further inSection 3.) Because the data fromKaynak’s (1997)study are used in this study, the seven TQM techniquesinvestigated here are the same as inSaraph et al.’s(1989) study: management leadership, training, em-ployee relations, quality data and reporting, supplierquality management, product/service design, and pro-cess management. These techniques are described inTable 1. The scale of Role of the Quality Departmentis not included in this study because 105 organiza-tions of the 382 did not have a quality department.The summary of studies on the relationship betweenTQM techniques and firms’ performance is presentedin Table 2. A review of TQM techniques investigatedin these studies shows that the seven techniques ofTQM used in this study represent a wide domain ofTQM.
Based on the strategic management, market-ing, and operations management literature,Kaynak(1997) identified and validated three dimensionsof firms’ performance relevant to TQM.Financialand market performanceindicators include returnon investment (ROI), sales growth, profit growth,market share, and market share growth. The indi-cators for quality performanceare product/servicequality, productivity, cost of scrap and rework, de-livery lead-time of purchased materials, and deliverylead-time of finished products/services to customers.Two indicators of inventory management perfor-mance are purchased material turnover and totalinventory turnover. The same three dimensions offirms’ performanceKaynak (1997)used in her pre-vious study are used in this study, and these areconsistent with the measurement of performance inthe other studies on the relationship between qualitymanagement and firm performance, as presented inTable 2.
2.1. The research model and proposed hypotheses
Because of the inconsistent results, the main find-ings of the studies summarized inTable 2do not reallyprovide a plausible research model for identifying thedirect and indirect effects of TQM practices on the di-mensions of performance, though, asMohrman et al.(1995)remind us, “Most of the TQM practices are re-lated to one form of performance improvement or theother” (p. 39). However, the findings of the studiesin which TQM has been operationalized as a multidi-mensional construct and in which indirect and directeffects of TQM practices on performance are investi-gated (e.g.Das et al., 2000; Flynn et al., 1995; Ho et al.,2001) indicate that the infrastructural TQM practicessuch as top management leadership, training, and em-ployee relations affect performance through core TQMpractices such as quality data and reporting, supplierquality management, product/service design, and pro-cess management.
Given the limited amount of literature on the re-search questions investigated in this study, the hy-potheses pertaining to the relationships suggested inthe research model (seeFig. 1) are drawn from studiesin the literature on organizational change and opera-tions management in addition to quality managementliterature. Each path inFig. 1 is labeled with the asso-ciated hypothesis, and all are discussed in the follow-ing sections.
2.1.1. Management leadershipAs documented by quality gurus (e.g.Deming,
1986; Juran, 1986), and the studies summarized inTables 1 and 2, management leadership is an importantfactor in TQM implementation because it improvesperformance by influencing other TQM practices(Ahire and O’Shaughnessy, 1998; Anderson et al.,1995; Flynn et al., 1995; Wilson and Collier, 2000).Successful implementation of TQM requires effectivechange in an organization’s culture, and it is almostimpossible to change an organization without a con-centrated effort by management aimed at continuousimprovement, open communication, and cooperationthroughout the value chain (Abraham et al., 1999;Adebanjo and Kehoe, 1999; Bell and Burnham, 1989;Choi, 1995; Daft, 1998; Ettkin et al., 1990; Goodsteinand Burke, 1991; Hamlin et al., 1997; Handfield andGhosh, 1994; Ho et al., 1999; Zeitz et al., 1997).

410H
.K
ayn
ak
/Jou
rna
lo
fO
pe
ratio
ns
Ma
nage
me
nt
21
(20
03
)4
05
–4
35
Table 2Summary of studies on the relationship between total quality management (TQM) and firms’ performance
Study Operationalization of TQM Sources of performance dataand measurement level
Operational definition ofperformance
Data gatheringtechnique andanalysis
Main findings
Anderson et al. (1995) Multidimensional constructa
Visionary leadershipInternal and externalcooperationLearningProcess managementContinuous improvementEmployee fulfillmentCustomer satisfaction
Secondary perceivedperformance (subjective)Operating performance Customer satisfaction
Questionnaires frommanagement andworkers in eachplantPath analysis
Employee fulfillment has a significantdirect effect on customer satisfaction. Nosignificant relationship exists betweencontinuous improvement and customersatisfaction.
Flynn et al. (1995) Multidimensional constructCore QM practices
Process flow managementProduct design processStatistical control/feedback
QM infrastructure practicesCustomer relationshipSupplier relationshipWork attitudesWorkforce managementTop management support
Perceived relativeperformance (subjective) andprimary objective dataOperating performance Quality market outcomes,
percent-passed final inspectionwith no rework, competitiveadvantage (unit cost, fastdelivery, volume flexibility,inventory turnover, cycle time)
Same data base asin Anderson et al.(1995)Path analysis
Statistical control/feedback and the productdesign process have positive effects onperceived quality market outcomes whilethe process flow management andstatistical control/feedback are significantlyrelated to internal measure of the percentthat passed final inspection withoutrequiring rework. Both perceived qualitymarket outcomes and percent-passed finalinspection with no rework have significanteffects on competitive advantage.
Mohrman et al. (1995) Multidimensional constructCore practices
Quality improvement teamsQuality councilsCross-functional planningProcess reengineeringWork simplificationCustomer satisfactionmonitoringDirect employee exposureto customers
Production-oriented practicesSelf-inspectionStatistical control methodsused by front-lineemployeesJust-in-time deliveriesWork cells ormanufacturing cells
Other practicesCost-of-quality monitoringCollaboration withsuppliers in quality efforts
Secondary data sources,perceived performance(subjective)Financial performance
Market performanceOperating performance
ROE, ROI, ROS, ROA,perceived profitability andcompetitivenessMarket shareCost of manufacturing,inventory turnover, perceivedproductivity, customersatisfaction, quality and speed
QuestionnaireMultiple regressionanalyses,hierarchicalregression analyses
There is a significant and positive relationbetween the extent of TQM adoption andefficiency of employee and capitalutilization. The relationship of TQM tomanufacturing costs and inventory turnoveris not significant. Although core TQMpractices and market share are significantlyrelated for manufacturing firms, nosignificant relationships are found betweenTQM adoption and financial performance.

H.
Ka
yna
k/Jo
urn
al
of
Op
era
tion
sM
an
agem
en
t2
1(2
00
3)
40
5–
43
5411
Powell (1995) Multidimensional construct
Executive commitmentAdopting the philosophyCloser to customersCloser to suppliersBenchmarkingTrainingOpen organizationEmployee empowermentZero-defects mentalityFlexible manufacturingProcess improvementMeasurement
Perceived performance(subjective)
Questionnaire
Partial correlations
Executive commitment, open organization,and employee empowerment producesignificant partial correlations for bothtotal performance and TQM programperformance. A zero-defects mentality andcloseness to suppliers correlatesignificantly with TQM performance, butwith total performance only marginally.
Financial performance (totalperformance)
Sales growth, profitability,revenue growth
TQM program performance(measured as a mix ofoperating and financialperformance)
Productivity, competitiveposition, profitability,revenues, overall performance
Hendricks and Singhal(1996, 1997)
Single construct (winning of aquality award is a proxy forthe effective implementation ofTQM programs)
Secondary data source Studies events in Implementing an effective TQM program
Financial performance Market returns, percentagechanges in operating income,in sales, in the ratio of sales toassets, in the ratio of sales tonumber of employees, in theratio of total cost to sales, inthe ratio of capital expenditureto assets, in number ofemployees, in assets
various publicationsWilcoxonsigned-rank test,Mann–Whitney test
improves performance of firms.
Adam et al. (1997) Multidimensional construct Perceived performance Questionnaire Employee knowledge about qualityimprovement, what quality customersreceive and perceive, employeecompensation and recognition andmanagement involvement are significantlyand inversely correlated with total cost ofquality and average per cent of itemsdefective. Financial performance ispositively correlated with seniormanagement involvement and employeecompensation and recognition.
Employee involvementSenior executive involvement
(subjective)Financial performanceOperating performance
Net profit as percent of sales,ROA, sales growthPercent defectives, cost ofquality, and customersatisfaction
Stepwise regression
Employee satisfactionCompensationCustomersDesign and conformanceKnowledgeEmployee selection anddevelopmentInventory reduction
Chenhall (1997) Single construct Perceived performance Questionnaire The relation between TQM andperformance is stronger whenmanufacturing performance measures areused as a part of managerial evaluation.
(subjective)Financial performance Growth in sales, in ROS, in
ROA, overall growth inprofitability
Regression, ANOVA

412H
.K
ayn
ak
/Jou
rna
lo
fO
pe
ratio
ns
Ma
nage
me
nt
21
(20
03
)4
05
–4
35
Table 2 (Continued)
Study Operationalization of TQM Sources of performance dataand measurement level
Operational definition ofperformance
Data gatheringtechnique andanalysis
Main findings
Grandzol andGershon (1997)
Multidimensional construct Perceived performance Questionnaire Financial performance is a function ofoperating performance while operatingperformance is a function of continuousimprovement. Customer focus has asignificant effect on product/servicequality. Employee fulfillment, cooperationand customer focus positively impactcustomer satisfaction.
Leadership (subjective)Financial performance
Operating performance
ROI, market share, capitalinvestment ratioProduct/service quality,productivity, scrap/waste,energy/efficiency, materialusage
Structural equationmodelingContinuous improvement
Internal/external cooperationCustomer focusLearningEmployee fulfillmentProcess management
Choi and Eboch(1998)
Single construct (in this study,various dimensions of TQMwere examined; however, asingle TQM construct is used toanalyze the relationship betweenTQM and performance)
Perceived performance(subjective)Operating performance Quality (plant performance),
customer satisfaction
QuestionnaireStructural equationmodeling
TQM practices have a stronger effect oncustomer satisfaction than they do on plantperformance. The plant performance has nosignificant effect on customer satisfaction.
Ahire andO’Shaughnessy(1998)
Multidimensional constructTen dimensions of TQM listedin Table 1 with the exclusionof supplier performance (Ahireet al., 1996)
Perceived performance(subjective)Operating performance Product quality
QuestionnaireStepwise regression,t-tests
Firms with high top managementcommitment produce higher qualityproducts than those with low topmanagement commitment. Customer focus,supplier quality management andempowerment emerge as significantpredictors of product quality.
Easton and Jarrell(1998)
Single construct (in this study,various dimensions of TQMwere examined; however, asingle TQM construct is used toanalyze the relationship betweenTQM and performance)
Secondary data source Interviews For the firms adopting TQM, financialperformance has increased.Financial performance Net income to sales and to
assets, operating income tosales and to assets, sales toassets, net income andoperating income peremployee, sales per employee,total inventory to sales and tocost of goods sold, cumulativedaily stock returns
Sign tests, Wilcoxonrank-sum test,Wilcoxonsigned-rank test
Forza and Flippini(1998)
Multidimensional constructOrientation towards quality
Perceived performance(subjective) and primaryobjective dataOperating performance Quality conformance,
customer satisfaction
QuestionnaireStructural equationmodeling
Process control has a significant effect onquality conformance, and TQM links withcustomers has a significant effect oncustomer satisfaction.
TQM link with suppliersHuman resourcesTQM link with customersProcess control

H.
Ka
yna
k/Jo
urn
al
of
Op
era
tion
sM
an
agem
en
t2
1(2
00
3)
40
5–
43
5413
Rungtusanatham et al.(1998)
Multidimensional constructb Perceived performance Same data base asin Forza andFlippini (1998)Path analysis
Continuous improvement has a positiveeffect on customer satisfaction. Employeefulfillment seems to have no effect oncustomer satisfaction.
The same dimensions as inAnderson et al. (1995)are used
(subjective)Operating performance Customer satisfaction
Dow et al. (1999),Samson andTerziovski (1999)
Multidimensional constructLeadership
Perceived performance(subjective) andself-reported objective dataOperating performance Product quality, customer
satisfaction, employee morale,productivity, deliveryperformance
QuestionnaireStructural equationmodeling; multipleregression analysis
Employee commitment, shared vision, andcustomer focus in combination has apositive impact on quality outcomes.Leadership, human resources managementand customer focus (soft factors) aresignificantly and positively related tooperating performance.
Workforce commitmentShared visionCustomer focusUse of teamsPersonnel trainingCooperative supplier relationsUse of benchmarkingUse of advancedmanufacturing systemsUse of just-in-time principles
Das et al. (2000) Multidimensional constructHigh involvement workpracticesQuality practices
Perceived relativeperformance (subjective)
Financial performance
Operating performance
Market share, ROA, marketshare increaseCustomer satisfaction
QuestionnaireStructural equationmodeling
High involvement practices are positivelycorrelated with quality practices; qualitypractices are positively correlated withcustomer satisfaction; customer satisfactionis positively correlated with firmperformance.
Wilson and Collier(2000)
Multidimensional construct Perceived performance(subjective)
Questionnaire Process management, and information andanalysis have significant and positivedirect effects on financial performance.
LeadershipMarket share, market sharegrowth, ROI, growth in ROI,ROS, growth in ROSCustomer focus andsatisfaction
Structural equationmodelingInformation and analysis Financial performance
Strategic planningHuman resource managementProcess management Operating performance
Douglas and Judge(2001)
Single construct (in this study,various dimensions of TQMwere examined; however, asingle TQM construct is used toanalyze the relationship betweenTQM and performance)
Perceived performance(subjective) and secondarydata sources
QuestionnaireHierarchicalregression analysis
The extent to which TQM practices areimplemented is positively and significantlyrelated to both the perceived financialperformance and industry expert-ratedperformance.
Financial performance Growth in earnings, growth inrevenue, changes in marketshare, return on assets,long-run level of profitability,industry expert ratings
Ho et al. (2001) Multidimensional construct Perceived performance Questionnaire Supportive TQM factor has an indirecteffect on product quality through coreTQM factor.
Supportive TQM factor(employee relations andtraining)
(subjective)Operating performance Product quality
Hierarchicalregression analysis
Core TQM factor (qualitydata and reporting, supplierquality management)
a Anderson et al. (1995)operationalized the constructs by using the questionnaire items in the World-Class Manufacturing (WCM) database (first round).b Rungtusanatham et al. (1998)operationalized the constructs by selecting the questionnaire items from Round 2 of the WCM database for the plants operating in Italy.

414 H. Kaynak / Journal of Operations Management 21 (2003) 405–435
Fig. 1. Theoretical model of the relationship between TQM practices and performance measures.
Management has a complex leadership role whenimplementing TQM. It is impossible to improve anyorganization’s operations without a well-trained work-force. It is management that provides the resourcesnecessary for training employees in the use of newprinciples and tools, and creates a work environmentconducive to employee involvement in the process ofchange (Ahire and O’Shaughnessy, 1998; Andersonet al., 1995; Bell and Burnham, 1989; Burack et al.,1994; Daft, 1998; Flynn et al., 1995; Hamlin et al.,1997; Handfield et al., 1998; Ho et al., 1999; Schroederet al., 1989; Wilson and Collier, 2000). And top man-agement must ensure that the necessary resourcesfor quality-related training are available (Ahireand O’Shaughnessy, 1998; Anderson et al., 1995;Flynn et al., 1995; Handfield et al., 1998; Ho et al.,1999).
But it takes more than training to guarantee efficientand successful change. Employees must be involvedin the process of change, a crucial factor according
to Adebanjo and Kehoe (1999), and this involvementis effected by creating a work environment that en-courages and facilitates open communication. In suchan environment, workers are apt to work harder andcontribute ideas that both facilitate and enhance thechange process (Anderson et al., 1995; Burack et al.,1994; Das et al., 2000; Flynn et al., 1995; Handfieldet al., 1998; Spector and Beer, 1994). Involving em-ployees requires communicating a clear strategy forimproving quality to them, and this function can beenhanced by instituting quality-based incentive andcompensation procedures (Bonito, 1990; Flynn et al.,1995). Thus, the literature discussed above leads tothe following hypotheses:
H1a. Management leadership is positively related totraining.
H1b. Management leadership is positively related toemployee relations.

H. Kaynak / Journal of Operations Management 21 (2003) 405–435 415
Effective leadership is also critical to effectingorganizational changes—especially in purchasing—that improve interactions with supply chain members(Cooper and Ellram, 1993). To promote mutuallybeneficial relations with suppliers, management can,and probably should, privilege quality and deliveryperformance over price when selecting suppliers andcertifying suppliers for material quality (Flynn et al.,1995; Trent and Monczka, 1999). Managing supplierrelationships strategically is essential to the successof organization–supplier relationships because thesepartnerships require both a high level of commitmentand an exchange of proprietary and competitive infor-mation (Ellram, 1991). Consequently, the followinghypothesis is proposed:
H1c. Management leadership is positively related tosupplier quality management.
Last, but not the least, management must be re-sponsible for focusing product design on market andconsumer needs (Deming, 1986; Flynn et al., 1995;Garvin, 1987; Shetty, 1988). This sharp focus is crucialto developing products that are manufacturable andmeet the needs of the customers (Flynn et al., 1995;Hackman and Wageman, 1995; Juran, 1981; Leonardand Sasser, 1982). Thus, we are led to the followinghypothesis:
H1d. Management leadership is positively related toproduct design.
2.1.2. TrainingIn the literature (e.g.Bell and Burnham, 1989;
Choi, 1995; Daft, 1998; Ettkin et al., 1990), employeetraining is clearly identified as a critical component ofworkforce management when implementing signifi-cant changes in an organization. If it is to be effective,i.e. transform employees into creative problem solvers,training in quality-related issues should emphasizeproblem solving in small groups, effective commu-nication, and statistical process control (Flynn et al.,1994). Workforce training in the techniques necessaryfor improving processes must be continuous if theimprovement effort is to be sustained, for an ongoingtraining program will help employees discover inno-vative ways to improve the organization (Choi, 1995)and shoulder more of the responsibility for effecting
improvements (Adebanjo and Kehoe, 1999; Ho et al.,1999). The authors of several studies (Bonito, 1990;Daft, 1998; Easton and Jarrell, 1998; Forza andFlippini, 1998; Hackman and Wageman, 1995; Holpp,1994) argue forcefully that the number of skills em-ployees need to be productive workers is correlatedpositively with the level of engagement employeeshave with their jobs. It would seem reasonable, then,to expect that an increase in training will produce acorresponding increase in employee involvement withtheir jobs and in increased awareness of quality-relatedissues. Thus, we have the following hypothesis:
H2a. Training is positively related to employee rela-tions.
To manage quality, employees must effectivelymeasure and make use of quality data in a timelymanner, and to do this they need to be trained in theuse of quality improvement tools (Ahire and Dreyfus,2000; Ho et al., 1999). Training and employee rela-tions (the latter is discussed in the following section)has a positive effect on quality, which is mediatedthrough quality data and reporting (Ho et al., 2001).Collecting and using quality data are impossible with-out training, but training alone will not sustain animprovement effort: employees must receive qualitydata in a timely manner and use it effectively. Thus,the following hypothesis is suggested:
H2b. Training is positively related to quality data andreporting.
2.1.3. Employee relationsThe employee relations investigated in this study en-
compass a variety of organizational development (OD)techniques to facilitate changes such as employeeparticipation in decisions (Bell and Burnham, 1989;Burack et al., 1994; Choi, 1995; Daft, 1998; Ford andFottler, 1995; Holpp, 1994), employee recognition(Daft, 1998; Ford and Fottler, 1995), teamwork (Belland Burnham, 1989; Daft, 1998; Ford and Fottler,1995; Holpp, 1994), and the use of effective com-munications to create an awareness of organizationalgoals (Bell and Burnham, 1989; Daft, 1998; Fordand Fottler, 1995). These OD techniques, generallyconsidered the most relevant human resource prac-tices in organizations that make effective use of TQM

416 H. Kaynak / Journal of Operations Management 21 (2003) 405–435
techniques, are identified by the studies summarizedin Tables 1 and 2.
Empirical results also support the assertion that em-ployee relations are directly related to quality data andreporting (Flynn et al., 1995; Ho et al., 1999, 2001).This result is not surprising because effective mea-surement, availability, and use of quality data requirecontinuous awareness of quality-related issues in em-ployees who have a significant role in quality deci-sions. Generally speaking, these decisions contributeto improvement only when they are based on accuratequality data (Ho et al., 1999). Thus, we can suggestthe following hypothesis:
H3. Employee relations is positively related to qualitydata and reporting.
2.1.4. Quality data and reportingQuality data and reporting involve using costs of
poor quality such as rework, scrap and warranty costs,and control charts to identify quality problems andprovide information on areas of possible improvement(Choi, 1995; Ho et al., 1999; Lockamy, 1998). Thepositive effect of quality data and reporting on firmperformance is through three other TQM techniques:supplier quality management, product/service design,and process management.
Managing supplier quality entails monitoring andassessing the performance of suppliers through thecreation of a supplier performance measurementdatabase, a tool crucial to enhancing material quality,reducing development costs, purchase prices, and im-proving supplier responsiveness (Krause et al., 1998).With this database companies can accurately tracksuch quality measures as parts-per-million defective,reliability, process capability ratios, and percent partsrejected (Forza and Flippini, 1998; Krause et al.,1998; Trent and Monczka, 1999) as well as on-timedelivery performance and percent of incoming ma-terials acceptable (Tan et al., 1998). In conjunctionwith supplier performance databases, availability,costs of quality, and control charts help employeesand managers identify and solve problems stemmingfrom supplied materials and parts. Suppliers can beprovided the information they need to improve theirperformance (Adebanjo and Kehoe, 1999). Thus, wecan propose the following hypothesis:
H4a. Quality data and reporting is positively relatedto supplier quality management.
Companies implementing TQM emphasize buildingquality into the product rather than inspecting qualityinto the finished product and removing defective prod-ucts (Ahire and O’Shaughnessy, 1998; Flynn et al.,1995; Handfield et al., 1999; Tan, 2001). Becauseproduct design requires such a wide range of informa-tion, design teams are comprised of people from pur-chasing, design, production, suppliers and customers(Flynn et al., 1995; Lockamy, 1998). Design manage-ment tools—design for manufacturability, concurrentengineering, quality function deployment, and designfor experiments (Ahire and Dreyfus, 2000; Easton andJarrell, 1998; Handfield et al., 1999; Ho et al., 1999)—can be used effectively only if quality data are col-lected and disseminated throughout the organizationin a timely manner. Thus, the following hypothesis isproposed:
H4b. Quality data and reporting is positively relatedto product/service design.
Quality data directly affect process managementby informing workers about changes in processesimmediately so they can take corrective actions be-fore defective products are produced and then checkthe results of their improvement efforts (Flynn et al.,1995; Ho et al., 1999). The effectiveness of using sta-tistical process control charts and process capabilitystudies in process improvement is well established inthe literature (Ahire and O’Shaughnessy, 1998; Flynnet al., 1995; Handfield et al., 1999). Therefore, wecan propose the following hypothesis:
H4c. Quality data and reporting is positively relatedto process management.
2.1.5. Supplier quality managementEffective supplier quality management is facilitated
by long-term, cooperative relationships with as fewsuppliers as possible to obtain quality materials and/orservices. Maintaining a small number of suppliers im-proves product quality and productivity of buyers byencouraging enhanced supplier commitment to prod-uct design and quality (Ansari and Modarress, 1990;Burt, 1989; Trent and Monczka, 1999). Additionally,

H. Kaynak / Journal of Operations Management 21 (2003) 405–435 417
dealing with a small number of suppliers facilitatesthe solution of quality and delivery problems becausebuyers can pay close attention to each supplier (Burt,1989; Cooper and Ellram, 1993). Successful relation-ships encourage suppliers to become involved in thebuying firm’s design of products/services, and givesthem a chance to offer suggestions regarding productand/or component simplification. They can also helppurchasers procure the materials and parts that can beused most efficiently (Burt, 1989; Flynn et al., 1995;Forza and Flippini, 1998; Shin et al., 2000; Tan, 2001;Trent and Monczka, 1999). Thus, we can offer the fol-lowing hypothesis:
H5a. Supplier quality management is positively re-lated to product/service design.
A number of researchers have found that improvedsupplier relations enhance the performance of bothsuppliers and buyers, and this is especially true whenquality and delivery are buyer priorities (Flynn et al.,1995; Ho et al., 1999; Shin et al., 2000). The produc-tion of quality products is necessarily dependent onthe timely delivery of quality materials, so it is essen-tial that materials supplied meet the buyer’s specifi-cations and standards for quality (Flynn et al., 1995;Forza and Flippini, 1998; Grieco and Gozzo, 1985;Trent and Monczka, 1999). Improving the quality ofpurchased materials and parts, a main source of pro-cess variability, will have a positive effect on processmanagement (Flynn et al., 1995) by eliminating vari-ance in materials and parts, which makes it possibleto utilize internal controls over such other variablesas machinery and the workforce (Forza and Flippini,1998). Thus, we are led to the following hypothesis:
H5b. Supplier quality management is positively re-lated to process management.
A direct contribution effective supplier manage-ment makes to firm performance is inventory reduc-tion (Easton and Jarrell, 1998; Engelkemeyer, 1990;Levandoski, 1993; United States General AccountingOffice, 1991), which enables firms to sustain effortsto reduce waste, eliminate safety stocks, and create aleaner operation (Choi, 1995; Krajewski and Ritzman,2001). A study byChapman and Carter (1990)shows
that successful customer/supplier cooperation canresult in inventory reduction benefits for both parties.
H5c. Supplier quality management is positively re-lated to inventory management performance.
2.1.6. Product/service designUnder TQM systems, product/service design efforts
have two objectives: designing manufacturable prod-ucts and designing quality into the products (Flynnet al., 1995; Handfield et al., 1999). Designing to sim-plify manufacturing utilizes cross-functional teams toreduce the number of parts per product and standard-ize the parts (Chase et al., 2001), which results in moreefficient process management by reducing processcomplexity and process variance (Ahire and Dreyfus,2000; Flynn et al., 1995). The same cross-functionalteam that designed the product can also focus on im-proving manufacturing processes (Ahire and Dreyfus,2000). Thus, we offer the following hypothesis:
H6a. Product design is positively related to processmanagement.
Using as few parts as possible and standardizing asmany of these parts per product as is feasible speedsup the learning curve effect on employees, thereby en-hancing quality and reducing costs due to decreasedvariety and increased volume (Tan, 2001). As the num-ber of components decreases, the failure rate of a prod-uct also decreases and its reliability increases (Ahireand Dreyfus, 2000; Flynn et al., 1995). Quality prob-lems can be further reduced by including customers’requirements in new product/service design reviewsprior to production (Forza and Flippini, 1998). Thus,the following hypothesis is proposed:
H6b. Product design is positively related to qualityperformance.
2.1.7. Process managementProcess management entails taking a preventive
approach to quality improvement such as designingprocesses that are fool-proof and that provide stableproduction schedules and work distribution (Flynnet al., 1995; Saraph et al., 1989) to reduce processvariation (Flynn et al., 1995) by building quality intothe product during the production stage (Handfield

418 H. Kaynak / Journal of Operations Management 21 (2003) 405–435
et al., 1999). Reducing process variation should re-sult in increased output uniformity as well as reducedrework and waste (Anderson et al., 1994; Forza andFlippini, 1998) because quality problems are identi-fied and corrected immediately (Ahire and Dreyfus,2000). Regular preventive equipment maintenancepositively contributes to product quality by improv-ing machine reliability and reducing interruptionsin production (Ho et al., 1999). Flynn et al. (1995)found that effective process management results inan increased percent-passed final inspection with norework. This increased production quality leads toimproved product quality and, in turn, other improve-ments in competitive priorities such as reduced costsand fast delivery. Additionally, the empirical findingsby Ahire and Dreyfus (2000)andForza and Flippini(1998) show that process management directly andpositively affects product quality. Thus, the followinghypothesis is offered:
H7. Process management is positively related toquality performance.
2.1.8. Firm performanceCompanies implementing TQM experience high
inventory turnover, a situation which enables theidentification of scheduling and production problems(Krajewski and Ritzman, 2001; Tan, 2001) and en-courages continuous improvement of processes andproduct quality (Adam et al., 1997). These improve-ments should result in lower scrap and rework costsas well as enhanced productivity and lead-time per-formance. Thus, we can expect that better inventorymanagement will lead to increased quality perfor-mance.
H8a. Inventory management performance is posi-tively related to quality performance.
Quality performance improves financial and marketperformance, and the literature offers several expla-nations for these effects. First, as a firm acquires areputation for delivering high quality products andservices, the elasticity of demand can decrease, which,in turn, can enable the firm to charge higher prices andearn higher profits (Shetty, 1988). Second, improvingproduct quality by reducing waste and improving ef-ficiency will increase the return on assets (Handfield
et al., 1998), which will increase profitability. Third,reduced rework, less scrap, and improved productivitywill lower the cost structure of a firm, which enablesthe firm to offer lower prices—if it is motivated todo so—for products and services without denting theprofit margin. Low prices can increase market shareand sales (Deming, 1986; Maani et al., 1994; Reedet al., 1996). Last, improvements in quality will re-sult in more satisfied customers with greater loyalty,increased sales (Ahire and Dreyfus, 2000; Choi andEboch, 1998; Handfield et al., 1998; Hendricks andSinghal, 1997), and an enhanced competitive position(Aaker and Jacobson, 1994; Fornell et al., 1996). Thebeneficial effect of product/service quality on mar-ket share (Buzzell et al., 1975; Craig and Douglas,1982; Jacobson and Aaker, 1987; Phillips et al., 1983;Zeithaml and Fry, 1981) and profit when measuredas return on investment (Craig and Douglas, 1982;Jacobson and Aaker, 1987; MacMillan et al., 1982;Phillips et al., 1983; Zeithaml and Fry, 1981) is aconsistent finding of research published in market-ing literature. Based on the reviewed literature, thefollowing hypothesis is suggested:
H8b. Quality performance is positively related tofinancial and market performance.
3. Research methodology
The data for this research were drawn from across-sectional mail study conducted to investigateTQM, just-in-time purchasing (JITP) and the perfor-mance of firms operating in the 48 contiguous statesof the US that have implemented TQM and JITP tech-niques. Using data collected through cross-sectionalmail survey methodology is appropriate because theresearch questions posed in this study lend themselvesto investigating the relationships between multiplevariables. A large sample size is required to obtainreliable and valid research results. Moreover, it isrelatively inexpensive and has the greatest potentialfor reaching a large number of respondents widelydispersed (Alreck and Settle, 1985). Issues pertainingto the construction of the instrument and measures,the survey procedure, the sample, and the tests forreliability and exploratory factor analysis are brieflyreviewed in the following sections. The discussion of

H. Kaynak / Journal of Operations Management 21 (2003) 405–435 419
tests for reliability and validity also includes the re-sults of the confirmatory factor analysis performed inthe current study in order to refine the resulting scalesin exploratory factor analysis and to establish unidi-mensionality, convergent validity, and discriminantvalidity of the measures used in this study.
3.1. Construction of the instrument and measures
Churchill’s (1979)work provided the basis for theconstruction of the instrument and measures utilized inthis study. The domains of constructs were identifiedvia a thorough review of the literature. For most of theitems of the TQM construct,Saraph et al.’s (1989)sur-vey instrument was useful.Saraph et al. (1989)mea-sured the factors of supplier cooperation and materialsquality as one factor: supplier quality management.The measurement of these factors in this study, how-ever, required a more in-depth examination. Therefore,to measure supplier cooperation and materials quality,the items pertaining to these two factors from Saraphet al.’s questionnaire were grouped based on contentanalysis. In addition, one item was adapted fromEttlieand Reza (1992)and the others were originated in theliterature review. The list of scales, items, and theirsources are presented inAppendix A.
Saraph et al.’s (1989)instrument uses a discrete,Likert-type scale. This study favored the use of acontinuous scale because, as research shows, as thenumber of scaling points decreases, the amount ofinformation lost increases (Martin, 1978; McClellandand Judd, 1993; Russell and Bobko, 1992). There-fore, a continuous scale 100 mm long was utilized.The polar points pertaining to TQM practices werenone= 0 and very high= 100. The use of continu-ous scales for research (e.g.Taylor et al., 1992) hasbecome acceptable in the social sciences. The word-ing of some borrowed items was changed to adaptthem to a continuous scale format.
The items relating to performance variables werebased on a review of the literature on strategic man-agement, marketing, and operations management (seeAppendix A). Three levels of performance measureswere identified: financial, market, and operating.These performance measures are consistent with theperformance measurement in the studies presented inTable 2. The values of the end poles measuring relativeperceived performance are adapted fromVenkatraman
and Ramanujam (1987). We asked respondents torate performance measures of their firms from “worsethan competition” to “better than competition” on acontinuous scale (worse than competition= 0, betterthan competition= 100) for the last fiscal year. Therelative perceived performance is measured for 1 yearbecause it is the common period for firms which havebeen using TQM practices.
This study was pilot tested at a joint dinner meetingof the American Production and Inventory ControlSociety (APICS) and the Institute for Supply Man-agement (ISM, formerly the National Association ofPurchasing Management). We tested the study therebecause the test sample was similar to our actual sam-ple. Statistical analyses were performed on the dataobtained from 11 respondents, but our statistical testswere restricted to Cronbach’s alpha (α) and a few cor-relations because the sample was small. The valuesof Cronbach’sα obtained for each factor were sat-isfactory, exceeding, as they did, the threshold valueof 0.70 suggested byNunnally and Bernstein (1994).Additional interviews with the ISM board memberswho participated in the pilot study showed that thequestionnaire needed only a few minor changes inwording to clarify two questions that were to be usedin the actual study.
3.2. Target population and survey procedure
The pilot study and power analysis determined atarget sample of 1884 business units. The industriesmost likely to implement TQM and JITP were iden-tified through a literature review. The SIC codes ofthe industries from which target respondents wouldbe selected were submitted to the American Societyfor Quality (ASQ) and the ISM, which supplied ad-dresses for chosen respondents. In addition to indus-try specifications, other criteria were relevant to theselection of target respondents. We preferred that re-spondents hold a high rank in their companies. An-other concerned finding respondents who were likelyto be familiar with the implementation of TQM andJITP in their companies and knowledgeable about theirfirm’s performance. Job titles provided by ASQ andISM such as quality manager, continuous improve-ment manager, and supplier and quality manager indi-cated that those organizations had implemented TQMtechniques in some form.

420 H. Kaynak / Journal of Operations Management 21 (2003) 405–435
Following the Total Design Methodology sug-gested byDillman (1978), we mailed questionnaires;cover letters; and postage-paid, self-addressed re-turn envelopes to the 1884 subjects. We followed hisfour-step procedure, although our response rate wassufficiently high after the second and third steps thatthe fourth step was not pursued. We received 383replies. One was unusable, so we had 382 usablesurveys, a 20.3% response rate, which is in line withthat of other studies (e.g.Choi and Eboch, 1998; Daset al., 2000; Madu et al., 1995).
By testing the difference of the interest variablesbetween early and late respondents, an estimate ofnon-response bias was calculated (Armstrong andOverton, 1977). To test the non-response bias, twosamplet-test procedures were conducted for TQM,JITP, and three perceived performance factors. Noneof the t-test results indicated a significant differ-ence between the two response waves on the meansof these variables. The second test of non-responsebias concerned the firms’ demographics: numberof employees, annual sales and ownership of theorganization.χ2tests were run to find out whetherthere was a significant difference in the three demo-graphic variables between early and late respondents.Results indicated that no significant differences ondemographics existed between the two waves of re-sponses. Fifty-nine respondents either returned theblank questionnaire in the provided envelope or con-tacted the researcher by phone to explain why theychose not to participate in the study. The resultsof statistical tests and qualitative data indicate thatnon-respondents did not differ significantly fromrespondents.
3.3. Sample demographics
Missing values were neither calculated nor substi-tuted for the performance measures, so the final sam-ple used to test the research model was reduced to214. Replies came from 42 states, although the tar-get sample included firms from all 48 states. No firmsin Delaware, Maine, Montana, North Dakota, Nevadaand Wyoming answered the questionnaire. Moreover,the final sample also lacked responses from Missis-sippi, Oregon, Vermont, and West Virginia. Thus, thenon-responses were not clustered geographically. The38 states that comprised the sample did, however,
provide a fair, representative coverage of geographicaldifferences in the US.
The majority of respondents filled positions withtitles such as president, vice president, director, man-ager, and coordinator. Additionally, the respondents’functions were concerned with quality practices, gen-eral management, engineering, and purchasing, thus,they were likely to pay careful attention to perfor-mance measures (Germain and Dröge, 1997). Weconcluded that the survey’s respondents did pos-sess the knowledge required to answer the questionsappropriately.
Although the organizations that make up the sam-ple represent various manufacturing industries (SICcodes 20–39) and service industries (e.g. transporta-tion, wholesale, financial, and health care), the sam-ple is skewed toward manufacturing firms. Fifteenpercent of the sample is comprised of service firms.The most well-represented industries in the manufac-turing sector are rubber and miscellaneous products(8.5%); fabricated metal (8.9%); machinery and com-puter (7.9%); electrical and electronic (11.2%); andmeasuring, analyzing and controlling instruments(9.8%). Our cross-industry sample is appropriate, asPannirselvam and Ferguson (2001)suggest, becausedistinctions between manufacturing and service havebecome blurred as manufacturers have become moreresponsive to customers and service organizationsmore concerned about quality process and output.
Approximately 30.4% of the firms had 100 or feweremployees, 23.4% of the firms employed between 101and 250 workers, 12.6% of the firms had 251–500 onthe payroll, and 33.6% of the firms had more than 500employees. About 28.5% of the firms reported annualsales of US$ 12.5 million or less, and 25% of the firmshad annual sales between US$ 12.5 million and 50 mil-lion. The firms that had annual sales between US$ 51million and 100 million comprised about 8% of the fi-nal sample. Companies with annual sales between US$101 million and 500 million accounted for 25.2% ofthe final sample, and approximately another 8% of thefirms had annual sales of more than US$ 500 million.
3.4. Tests for reliability and validity
This section reports the results of tests for relia-bility and three components of construct validity—unidimensionality, convergent validity and discrimi-

H. Kaynak / Journal of Operations Management 21 (2003) 405–435 421
nant validity. First,reliability of each scale of TQMand performance constructs was estimated by calculat-ing Cronbach’sα (Cronbach, 1951). Several items inthe TQM factors that did not contribute to theα valuesof the scales were dropped (seeAppendix A). Noneof the items in the performance construct was elimi-nated. All TQM and perceived performance scales hadacceptable reliability levels, values ofα equal to 0.70or higher (Nunnally and Bernstein, 1994).
To establish theunidimensionalityof factors, anexploratory factor analysis using principal componentextraction with a varimax rotation was separatelyperformed for TQM and perceived performance con-structs. Because a significant number of the organiza-tions did not have quality departments, the questionsrelating to a quality department were eliminatedfrom the exploratory factor analysis of TQM. Theexamination of eigenvalues and screen test results re-vealed eight factors of TQM. What were proposed asseparate scales—supplier cooperation and materialsquality—actually formed a single factor; hence, thename of the factor “supplier quality management” inthe study bySaraph et al. (1989)is retained. Processmanagement emerged as two factors, showing thesame patternSaraph et al. (1989)found in their study.This study confirms the existence of two separatescales, which I have called “inspection” and “processmanagement.” The other items formed the expectedfactors. As a result of examining the loadings andcommunalities, several items were also dropped inthis step (seeAppendix A). The inspectionscale wasnot included in the additional data analyses discussedin the following sections because it was deemed toadd little value to the content of quality management.
In the case of the perceived performance construct,three factors emerged. They were not, however, thesame as the proposed scales: financial and marketperformance, quality performance, and inventorymanagement performance. The indicators of theseperformance factors are listed inAppendix A anddescribed inSection 2. (For more details about theresearch method and the tests for reliability and factoranalyses, seeKaynak, 1997.) Cronbach’sα for eachfinal scale pertaining to TQM and performance wasrecalculated, and the reliability values for each factorexceeded the threshold value.
Prior to evaluating the structural equation model(SEM), the validity of the measurement models was
tested (Byrne, 1998; Jöreskog and Sörbom, 1993a). Inother words, the resulting scales in exploratory fac-tor analysis were evaluated and refined by a confir-matory factor analysis (CFA) before testing the fulllatent variable model (Gerbing and Anderson, 1988).The measurement model for each factor was estimatedseparately, then, after combining the factors into pairs,each pair was estimated separately. After estimatingthe measurement model for all factors without con-straining the covariance matrix of the factors, the SEMfor the factors together with the measurement mod-els was estimated. At each step, whether or not themodel fits the data was assessed. This assessment ofthe model was done by examining the standard errors,t-values, standardized residuals, modification indices,and a number of goodness-of-fit statistics (Jöreskogand Sörbom, 1993a).
LISREL 8.14 software (Jöreskog and Sörbom,1993b) was employed to test the measurement modelsand the research model. The fit indices used in thisstudy to estimate measurement models are the ratioof χ2 to degree of freedom, Root Mean Square Errorof Approximation (RMSEA), a consistent version ofthe Akaike’s Information Criterion (CAIC), the Parsi-mony Goodness-of-Fit Index (PGFI), the ParsimonyNormed Fit Index (PNFI), and the Comparative FitIndex (CFI). These fit indices, with the exception ofRMSEA, were chosen because of their abilities toadjust for model complexity and degrees of freedom.Although RMSEA is sensitive to model complexity, itis one of the most informative criteria as to an abso-lute fit (seeByrne, 1998for details). Recommendedvalues of these fit indices for satisfactory fit of amodel to data are presented inTable 3.
The assumptions of multivariate analysis—norma-lity, linearity, and homoscedasticity—were tested forthe variables used in the measurement models. Anal-yses for the assumptions of the multivariate modelindicated no statistically significant violations.
During the estimation of the measurement mod-els for TQM and perceived performance constructs,an examination of the modification indices and stan-dardized residuals revealed redundant items in somescales. These redundant items were eliminated, whichresulted in better-fitted models (Byrne, 1998). A com-parison of goodness-of-fit statistics relating to eachmeasurement model to the recommended values ofthese fit indices (seeTable 3) reveals satisfactory fit of

422H
.K
ayn
ak
/Jou
rna
lo
fO
pe
ratio
ns
Ma
nage
me
nt
21
(20
03
)4
05
–4
35
Table 3Test results of the measurement models and structural model
Goodness-of-fit statistics Measurement modelfor TQM
Measurement modelfor firm performance
Structural model Recommended values for satisfactoryfit of a model to data
χ2/df 657.16/383= 1.72 52.03/24= 2.17 1167.46/683= 1.71 <3.0a
Root Mean Square Error of Approximation (RMSEA) 0.058 0.074 0.058 <0.08b
Akaike’s Information Criterion (CAIC) 1179.17 185.72 1784.96 <Saturated model andindependence modelcCAIC for Saturated Model 2960.18 286.47 4965.46
CAIC for Independent Model 5383.51 1146.98 6992.04Parsimony Goodness-of-Fit Index (PGFI) 0.69 0.51 0.69 >0.50d
Parsimony Normed Fit Index (PNFI) 0.77 0.63 0.76 >0.50d
Comparative Fit Index (CFI) 0.94 0.97 0.92 >0.90b
a Bollen (1989), Carmines and McIver (1981), Hair et al. (1995).b Byrne (1998), Jaccard and Wan (1996), Jöreskog and Sörbom (1993a).c Byrne (1998), Jöreskog and Sörbom (1993a).d Byrne (1998), Mulaik et al. (1989).

H.
Ka
yna
k/Jo
urn
al
of
Op
era
tion
sM
an
agem
en
t2
1(2
00
3)
40
5–
43
5423
Table 4Descriptive statistics, Cronbach’sα, and bivariate correlations for the variables in research modela
Variables 1 2 3 4 5 6 7 8 9 10 Mean S.D. Cronbach’sα
1. Management leadership 1.000 61.24 21.90 0.922. Training 0.651 (0.000) 1.000 53.43 24.72 0.923. Employee relations 0.715 (0.000) 0.643 (0.000) 1.000 53.00 23.25 0.894. Quality data and reporting 0.533 (0.000) 0.556 (0.000) 0.470 (0.000) 1.000 58.38 26.45 0.905. Supplier quality management 0.561 (0.000) 0.570 (0.000) 0.529 (0.000) 0.547 (0.000) 1.000 52.37 21.36 0.866. Product/service design 0.657 (0.000) 0.569 (0.000) 0.668 (0.000) 0.487 (0.000) 0.558 (0.000) 1.000 56.69 22.79 0.937. Process management 0.515 (0.000) 0.574 (0.000) 0.556 (0.000) 0.536 (0.000) 0.536 (0.000) 0.588 (0.000) 1.000 45.37 21.33 0.788. Inventory management 0.269 (0.000) 0.234 (0.001) 0.264 (0.000) 0.114 (0.095) 0.258 (0.000) 0.236 (0.000) 0.225 (0.001) 1.000 62.24 18.63 0.91
performance9. Quality performance 0.353 (0.000) 0.312 (0.000) 0.425 (0.000) 0.251 (0.000) 0.420 (0.000) 0.417 (0.000) 0.359 (0.000) 0.513 (0.000) 1.000 66.79 15.30 0.80
10. Financial and marketperformance
0.264 (0.000) 0.205 (0.003) 0.143 (0.037) 0.287 (0.000) 0.244 (0.000) 0.206 (0.002) 0.256 (0.000) 0.302 (0.000) 0.376 (0.000) 1.000 62.04 18.84 0.89
a CorrespondingP values are in parentheses.N = 214.
424 H. Kaynak / Journal of Operations Management 21 (2003) 405–435
the measurement models to the data. The remainingitems in each scale are indicated inAppendix Aas wellas their standardized factor loadings on the respec-tive factors. (See the first value in parenthesis next toremaining each item.) The mean values, standard de-viations, bivariate correlations, and Cronbach’sα forrefined scales are presented inTable 4. The resultingvalues of Cronbach’sα and factor loadings establishthe reliability and unidimensionality of the measuresused in this study.
The extent to which multiple attempts to measurethe same constructs are in agreement is the issue inconvergent validity(Bagozzi et al., 1991; Hoskissonet al., 1993). An instrument has convergent validity ifthe correlations between measures of the same con-struct using different methods are high (Crocker andAlgina, 1986). In measurement studies, each item inthe scale can be considered a different method for mea-suring the construct (Ahire et al., 1996). A test of eachitem’s coefficient was used to assess convergent valid-
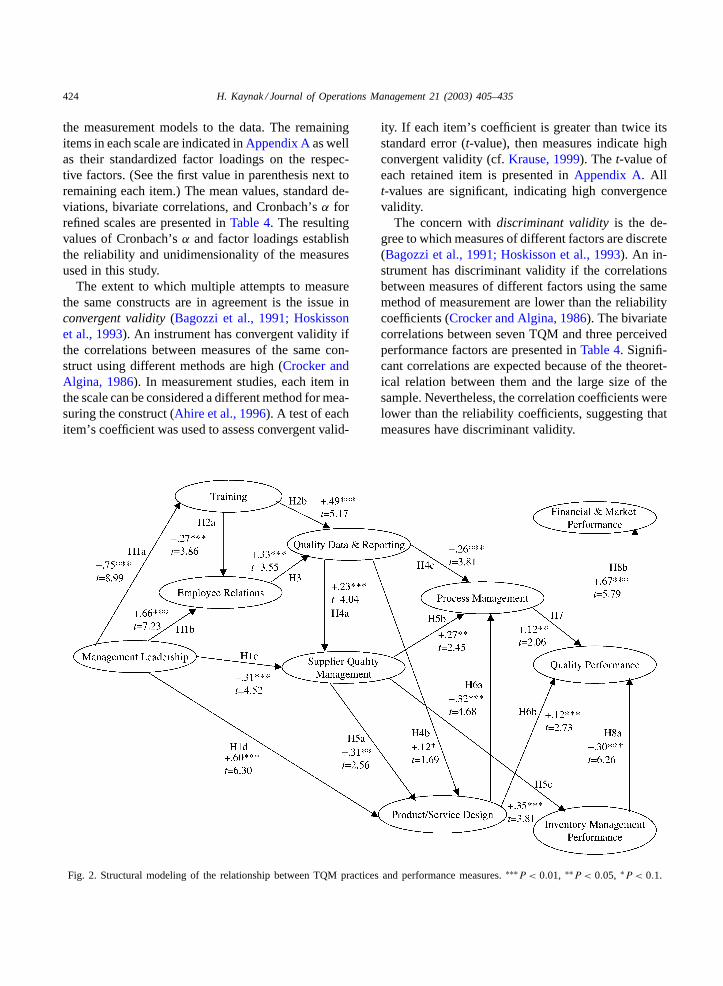
Fig. 2. Structural modeling of the relationship between TQM practices and performance measures.∗∗∗P < 0.01, ∗∗P < 0.05, ∗P < 0.1.
ity. If each item’s coefficient is greater than twice itsstandard error (t-value), then measures indicate highconvergent validity (cf.Krause, 1999). The t-value ofeach retained item is presented inAppendix A. Allt-values are significant, indicating high convergencevalidity.
The concern withdiscriminant validity is the de-gree to which measures of different factors are discrete(Bagozzi et al., 1991; Hoskisson et al., 1993). An in-strument has discriminant validity if the correlationsbetween measures of different factors using the samemethod of measurement are lower than the reliabilitycoefficients (Crocker and Algina, 1986). The bivariatecorrelations between seven TQM and three perceivedperformance factors are presented inTable 4. Signifi-cant correlations are expected because of the theoret-ical relation between them and the large size of thesample. Nevertheless, the correlation coefficients werelower than the reliability coefficients, suggesting thatmeasures have discriminant validity.

H. Kaynak / Journal of Operations Management 21 (2003) 405–435 425
4. Test results of structural model
Fig. 2 depicts the SEM results of the relationshipbetween TQM practices and factors of performancemeasures. Each path in the figure indicates the as-sociated hypotheses as well as the estimated pathcoefficients andt-values. The goodness-of-fit statis-tics used to assess the fit of the data to the hypoth-esized model are the same as those used to test themeasurement models and are presented inTable 3.
In the light of recommended values of fit indices, areview of the goodness-of-fit indices pertaining to thehypothesized model reveals a good fit of the model tothe data. All of the paths in the model are supported(t-values for path coefficients greater than 1.65 aresignificant atP < 0.10; t-values greater than 1.96 aresignificant atP < 0.05; t-values greater than 2.58 aresignificant atP < 0.01).
5. Discussion
5.1. Discussion of results
The primary purposes of this study were to in-vestigate the relationships among TQM practices andto identify the direct and indirect effects of TQMpractices on the various dimensions of performance.Through testing the hypothesized structural model,which was developed based on a comprehensive liter-ature review, these purposes were accomplished. Thesignificant implications of the results of the structuralmodel testing for researchers and practitioners, respec-tively, are discussed in the rest of this section.
The findings as a whole suggest that a positive rela-tionship exists between the extent to which companiesimplement TQM and firm performance. This overallresult corroborates the studies (Douglas and Judge,2001; Easton and Jarrell, 1998; Hendricks and Singhal,1996, 1997) in which TQM is operationalized as asingle construct. This validation is important because,to investigate the relationship between TQM and per-formance,Easton and Jarrell (1998)and Hendricksand Singhal (1996, 1997)employed different researchmethodologies from that utilized in this study (seeTable 2). As Palich et al. (2000)point out, it is impor-tant to obtain consistent research results among mul-tiple studies using a variety of research methods to
make strong statements “about the strength and gen-erality of the findings” (p. 161).
Dow et al. (1999)argue that a fundamental weak-ness in the quality management literature is theassumption, without any empirical testing, of the in-terdependence of quality management practices. (Itshould be noted that the empirical findings supportingthe interdependence of quality management practiceswere published byAnderson et al., 1995and Flynnet al., 1995.) Thus, another significant finding ofthis study is the validation of the interdependence ofTQM practices, which supports both the results ofstudies (e.g.Das et al., 2000; Flynn et al., 1995; Hoet al., 2001) referred to earlier in this research andthe theory of TQM suggested by quality gurus (e.g.Deming, 1993).
The findings also show that assessment of manage-ment leadership is necessary when the effectivenessof TQM implementation is investigated. Managementleadership is directly related to training, employeerelations, supplier quality management, and prod-uct design, and indirectly related to quality data andreporting, and process management. Effective lead-ership by management also indirectly affects firmperformance through the mediating effects of theother six practices of TQM. The results also demon-strate the importance of two other infrastructuralpractices—training and employee relations—to theassessment of TQM implementation. Training andemployee relations are directly related to quality dataand reporting, and they are indirectly related to sup-plier quality management, product/service design, andprocess management through quality data and report-ing. As with management leadership, they indirectlyaffect firm performance.
Quality data and reporting, one of the core TQMpractices, does not have any direct effects on any ofthe three performance dimensions; however, the scaleof quality data and reporting has indirect influenceson them through supplier quality management, prod-uct/service design, and process management. The con-firmed indirect effect of training and direct effect ofquality data and reporting on process management inthis study explain the lack of significant relationshipsfound between task-related training and process man-agement in the studies byAnderson et al. (1995), Forzaand Flippini (1998), andRungtusanatham et al. (1998).Thus, future studies should evaluate availability and

426 H. Kaynak / Journal of Operations Management 21 (2003) 405–435
use of timely quality data when researchers investigatethe relationships between TQM practices and assessthe success of TQM implementation.
Supplier quality management emerges as an impor-tant component of TQM, directly and positively affect-ing product/service design, process management, andinventory management performance. Supplier qualitymanagement has an indirect effect on improved qual-ity performance through product/service design andprocess management. It is important that when inves-tigating the role of supplier quality management inthe effectiveness of TQM implementation, researchersdefine inventory management performance as a rele-vant performance measure. It is also important thatthey recognize the indirect positive effects of supplierquality management on quality performance, and fi-nancial and market performance. The findings regard-ing the effects of supplier quality management alsopoint to some limitations of the conclusions reached inseveral studies that investigated the relation betweenTQM and performance. One of the findings, amongothers, byPowell (1995), for example, is that close-ness to suppliers only marginally correlates with finan-cial performance. He concludes that the most criticalfactors of successful TQM implementation are exec-utive commitment, open organization, and employeeempowerment, but he overlooks a possible indirect ef-fect of closeness to suppliers on financial performance.In another study,Mohrman et al. (1995)found thatno significant relation existed between TQM (TQM isoperationalized as two dimensions: core TQM prac-tices and production-oriented practices) and inventoryturnover. As the finding of this study shows, supplierquality management is the only TQM practice that hasa direct effect on inventory turnover. Thus, in theirstudy, the non-significant finding may have been dueto the information lost by combining TQM practices.
Flynn et al. (1995)pointed out the missing linkbetween product design process and process flowmanagement scales and called for its future inves-tigation. Thus, another notable result in this studyis the significant direct effect of product/service de-sign on process management. Product/service designpositively contributes to quality performance directlyas well as indirectly through process management.Process management is another core TQM practicethat is directly and positively related to quality per-formance. This result confirms the findings in studies
(Ahire and Dreyfus, 2000; Flynn et al., 1995; Forzaand Flippini, 1998) that investigated the relation ofprocess management to quality performance.
The direct relation of inventory management per-formance to quality performance shows that improve-ments in quality, productivity, and on-time deliveryare partly due to reduced inventories. Both the indirecteffect of inventory management and the direct effectof quality performance on financial and market per-formance validate the notion that the improvementsin operating performance result in increased sales andmarket share, thereby providing a competitive edge tocompanies.
In summary, then, the three TQM practices whichhave direct effects on operating performance (inven-tory management and quality performance) are sup-plier quality management, product/service design, andprocess management. Management leadership, train-ing, employee relations, and quality data and reportingaffect operating performance through supplier qual-ity management, product/service design, and processmanagement. The positive effect of TQM practices onfinancial and market performance is mediated throughoperating performance. This finding is consistent withthe results in the study byGrandzol and Gershon(1997).
Given the discussion above, it is apparent thatscholars who engage in TQM research should payattention to several research design issues if theywish to reach theoretically sound conclusions. First,the multidimensionality of the TQM construct shouldbe recognized. Second, a broad set of performancevariables—including operating, market, and finan-cial measures—relevant to TQM practices should bemeasured. Third, researchers must be aware that thepositive effect of each TQM practice on various lev-els of performance is different. Finally, data analysesmore sophisticated than a series of multiple regres-sion or correlations should be performed because it isimportant to be able to identify the direct and indirecteffects of TQM practices. As the results of this studyshow, the relationships among TQM practices and theeffects of these practices on firm performance are toocomplex to be identified by performing regressionanalysis or correlations.
The confirmed positive effects of TQM practiceson firm performance in this study is encouraging forpractitioners. The initiative in implementing TQM

H. Kaynak / Journal of Operations Management 21 (2003) 405–435 427
may originate at different levels of an organization.In companies that operate in highly global competi-tive environments and in quality-focused markets, theparent company may push divisions and/or strategicbusiness units to adopt TQM practices (Handfieldand Ghosh, 1994). In some instances, as expressedby some of this study’s respondents, functional man-agers at local levels may recognize the need for TQMimplementation to respond to competitive challenges.The empirically validated positive relation of TQMto firms’ performance such as that documented in thisstudy, can be very useful for the leaders who take theinitiative in quality improvement to promote and ob-tain the resources needed for TQM implementation.TQM has, as this study shows, much to offer firmsthat wish to improve their performance. The accountsof specific and individual less-than-successful effortsto implement TQM should not be disheartening, forthe problems might lie in the implementation of TQMrather than in TQM practices themselves.
This study’s finding of the interdependent nature ofTQM practices helps explain why TQM has not pro-duced maximum benefits for every company that hasimplemented it. Management leadership clearly has asignificant role to fill in a successful implementationof TQM practices. The more aggressive top man-agement is in the implementation of TQM, the moretraining employees at all levels get. Moreover, man-agement commitment to TQM empowers employeesand makes them more conscious of the organization’sgoals. Management leadership is also important inforging strategic partnerships with suppliers and increating products that are consumer focused and man-ufacturable. Too often, however, a serious commit-ment on the part of top management to TQM is weakor missing. Several respondents complained aboutmanagement’s lack of support, its resistance to change,and the failure of the organization’s structure to changewhen TQM practices were implemented. Problemslike these make it difficult to cultivate and take advan-tage of opportunities for TQM’s potential benefits.
It is apparent that the practitioners as well asresearchers cannot simply pick and choose a fewtechniques to implement. The structural model pro-posed and tested in this study may offer a flow chartto practitioners for effective TQM implementation.Companies first should secure a complete top man-agement commitment to TQM implementation, and
this commitment should motivate management toprovide their employees quality-related training, in-stitute teamwork, and employee involvement to laythe foundation for other practices of TQM.
Actually, it should do more. Establishing an effec-tive system for collecting and disseminating qualitydata throughout the organization in a timely manneris necessary to realize improvements in supplier qual-ity management, product/service design, and processmanagement. Then, firms can focus on developing co-operative relationships with their suppliers to improvethe quality of incoming materials and to involve themin the buyer firms’ product/service design and processmanagement activities. Coordination and cooperationamong employees who participate in product/servicedesign and process management are essential to im-proving quality performance of firms. All in all, a firmcannot simply select some of the TQM practices dis-cussed above and expect to realize full benefits fromimplementing partial TQM.
5.2. Limitations of findings
Every effort was made at the design stage of thisstudy to obtain reliable and valid findings as presentedin Section 3. Nevertheless, several limitations of thisstudy should be discussed in this section. Because ituses the same data for both exploratory and confir-matory factor analysis, this study has a major limi-tation. As the literature makes clear (Anderson andGerbing, 1988; Kelloway, 1995), using the same datafor both analyses is frequently done, probably becauseit streamlines research activities (Huber and Power,1985). Research like that done for this study requiressubstantial investments of time and money, more sothan in fields that allow researchers to collect datafrom one organization by studying the responses froma large sample comprised of respondents within it(Huber and Power, 1985). Because a cross-sectionalsurvey method was utilized here, causal inferenceswere derived from existing theory and research only.This is, admittedly, a controversial approach, butCookand Campbell (1979)say that it is acceptable to clarifytheory and assess specific causal effects from correla-tional research data with structural and path analyses.
As far as construct validity is concerned, the useof self-reported data constitutes a major limitation,primarily because common method variance (CMV)

428 H. Kaynak / Journal of Operations Management 21 (2003) 405–435
is an acknowledged threat to studies that rely onself-reports for their data. A post hoc analysis ofCMV—an evaluation of key informants, Harman’sone-factor test, and multiple methods and sources—was performed in an earlier study byKaynak (1997).The size of this study’s sample, given the time andresource limitations that constrained it, made it im-possible to use another method to gather data orcorroborate what respondents reported about the ex-tent to which their firms had implemented TQM.Likewise, the major problem when investigating per-formance at the business-unit level is the difficultyof obtaining objective performance measures. It iswidely reported in the literature that managers arereluctant to share objective data with researchers (e.g.Choi and Liker, 1995; Swamidass and Newell, 1987).The same problem was also observed in this study.
Furthermore, because archival data are reported atthe corporate rather than the business-unit level andso are unavailable for small and private businesses, itis difficult to find secondary data on financial perfor-mance. It was because of these difficulties thatChoiand Eboch (1998)and Stanley and Wisner (2001)opted to use perceptual data to obtain a large sample.An attempt was made for this study to collect sec-ondary objective data on the number of employees andthe annual sales of firms from other sources. The highconvergence between self-reported and archival dataon number of employees (r = 0.91) and annual salesof firms (r = 0.87) indicates a high level of responseconsistency. Although analyses of key informants—Harman’s one-factor test, and secondary datasources—do not completely eliminate the possibilityof same source, self-report biases, the results indicatednon-significant common method variance. Overall,validity and reliability in this study seem adequate.
6. Conclusion and further research
This study contributes to the TQM literature by val-idating the direct and indirect relations among TQMpractices and the effects of these practices on firm per-formance. With the exception ofFlynn et al. (1995),the TQM practices investigated in this study repre-sent a wider domain of TQM than the other studies inwhich direct and indirect effects of TQM practices onperformance are identified. In addition, measurement
of performance at three levels in this research revealsmore insights than the other studies do into the relationof TQM practices to firms’ performance. It also shedsmore light than they do on the relationships amongthree levels of performance: inventory management,quality, and financial and market performance.
A by-product of this study is a refined version ofthe questionnaire constructed bySaraph et al. (1989)that can be used to measure TQM implementationwithout making excessive demands on the time ofboth respondents and researchers. The final TQMmeasurement model includes 30 items, as indicatedin Appendix A. In addition, a scale on customer re-lations can be added in future studies as one of thetechniques of TQM. Evaluating customer relations asa technique of TQM is becoming more viable becauseTQM organizations are customer focused. Measure-ment studies on TQM discussed in this paper, as apart of the literature review, provide measurementitems for the scale of customer focus. As pointedout byAmundson (1998), researchers should broadentheir focus to include more complex issues regardingTQM implementation rather than simply replicatingstudies that identify TQM practices. Given that theresponse rate and the length of a questionnaire areinversely related, the shortened version of the ques-tionnaire presented in this study allows researchers toinvestigate the relation of TQM to other variables ofinterest without seriously hurting response rate.
The findings of this study, as well as some of thosereported in the literature reviewed in this paper, sup-port the positive effects of TQM practices on firms’performance. A lack of top management commitmentto the implementation of TQM has emerged as a pos-sible reason for the failure of TQM systems in someorganizations. Nevertheless, further empirical researchshould be conducted to assess the degree of effectiveorganizational functioning under TQM systems to re-fine and sharpen our insights into the relationship be-tween TQM practices and firms’ performance. Havingidentified a number of gaps between TQM processesand outcomes in their conceptual study,Hackman andWageman (1995)support the contention that the effec-tiveness of TQM should be measured in order to de-termine whether TQM changes the way people worktogether to meet customer requirements.
Effectiveness criteria such as organizational learn-ing, employee satisfaction, decentralized structure,

H. Kaynak / Journal of Operations Management 21 (2003) 405–435 429
and resource acquisition should be assessed in thecompanies implementing TQM. Although TQM islearning-oriented, many learning failures in organiza-tions that have implemented TQM have been reported(Hackman and Wageman, 1995). The effectivenessof the organizations that implement TQM dependson their ability to satisfy their employees, a neces-sary goal for companies that wish to realize benefitsfrom employee involvement. Furthermore, employeeparticipation in monitoring, detecting, and correct-ing quality problems requires decentralization anddelegation in organizations implementing TQM. De-centralization, suggestGermain and Spears (1999),not only increases the number of minds searching forimaginative solutions to a firm’s quality managementproblems, it also increases the number of internalgroups that will support creative solutions once theyare found. Finally, the effectiveness of TQM or-ganizations should be measured by their degree ofintegration with their supplier bases because supplierquality management is a critical component of TQM.
Acknowledgements
Funding to collect the data was provided by theAmerican Society for Quality and the Institute forSupply Management—National and Dallas Chapter.The author would like to thank Donald J. Newman,Charles F. Bimmerle, William A. Luker, and VictorPrybutok for their helpful comments and suggestions.She is also very grateful to the respondents who filledout the questionnaire for their cooperation.
Appendix A. Measurement scales, items and theirsources
The items marked with the symbol (†) were retainedafter testing the measurement models. The first valuein parenthesis for each retained item indicates the stan-dardized factor loadings. The second value representsthe t-value resulting from testing each item’s coeffi-cient. (The first item in each scale does not have anassociatedt-value because it has a fixed parameter inLISREL.) In her earlier study,Kaynak (1997)droppedthese items (marked with symbol ‡) as a result ofreliability tests and exploratory factor analysis. The
ones marked with asterisk (*) belong to the scale ofinspection.
A.1. Total quality management
A.1.1. Management leadershipAll items in this scale were adapted fromSaraph
et al. (1989).
1. Extent to which the top business unit/organizationexecutive (responsible for organization profit andloss) assumes responsibility for quality perfor-mance.
2. Acceptance of responsibility for quality by majordepartment heads within the organization.
3. †Degree to which organization top management(top organization executive and major departmentheads) is evaluated for quality performance (0.74).
4. Extent to which the organization top managementsupports long-term quality improvement process.
5. †Degree of participation by major departmentsheads in the quality improvement process (0.79,t-value= 11.83).
6. †Extent to which the organizational top manage-ment has objectives for quality performance (0.86,t-value= 12.96).
7. Specificity of quality goals within the organiza-tion.
8. †Comprehensiveness of the goal-setting pro-cess for quality within the organization (0.78,t-value= 11.62).
9. Extent to which quality goals and policy are un-derstood within the organization.
10. Importance attached to quality by the organiza-tional top management in relation to cost andschedule objectives.
11. †Amount of review of quality issues in organiza-tional top management meetings (0.84,t-value=12.53).
12. †Degree to which the organizational top manage-ment considers quality improvement as a way toincrease profits (0.77,t-value= 11.34).
13. Degree of comprehensiveness of the quality planwithin the organization.
A.1.2. TrainingAll items in this scale were adapted fromSaraph
et al. (1989).

430 H. Kaynak / Journal of Operations Management 21 (2003) 405–435
1. †Specific work-skills training (technical and voca-tional) given to hourly employees throughout theorganization (0.84).
2. †Quality-related training given to hourly employ-ees throughout the organization (0.96,t-value =19.02).
3. †Quality-related training given to managers andsupervisors throughout the organization (0.89,t-value= 16.95).
4. Training in the “total quality concept” (i.e. philos-ophy of company-wide responsibility for quality)throughout the organization.
5. Training in the basic statistical techniques (such ashistogram and control charts) in the organizationas a whole.
6. Training in advanced statistical techniques (such asdesign of experiments and regression analysis) inthe organization as a whole.
7. Commitment of the organizational top managementto employee training.
8. Availability of resources for employee training inthe organization.
A.1.3. Employee relationsAll items in this scale were adapted fromSaraph
et al. (1989).
1. ‡Extent to which quality circles or employeeinvolvement-type programs are implemented inthe organization.
2. ‡Effectiveness of quality circles or employeeinvolvement-type programs in the organization.
3. Extent to which employees are held responsible forerror-free output.
4. †Amount of feedback provided to employees ontheir quality performance (0.79).
5. †Degree of participation in quality decisionsby hourly/non-supervisory employees (0.84,t-value= 13.55).
6. †Extent to which building quality awarenessamong employees is ongoing (0.90,t-value =14.76).
7. †Extent to which employees are recognized forsuperior quality performance (0.76,t-value =11.93).
8. Effectiveness of supervisors in solving prob-lems/issues.
A.1.4. Quality data and reportingAll items in this scale were adapted fromSaraph
et al. (1989).
1. Availability of cost of quality data in the organiza-tion.
2. †Availability of quality data (error rates, defectrates, scrap, defects, etc.) (0.75).
3. †Timeliness of the quality data (0.70,t-value =17.96).
4. †Extent to which quality data (cost of quality, de-fects, errors, scrap, etc.) are used as tools to man-age quality (1.00,t-value= 12.33).
5. Extent to which quality data are available to hourlyemployees.
6. Extent to which quality data are available to man-agers and supervisors.
7. Extent to which quality data are used to evaluatesupervisor and managerial performance.
8. Extent to which quality data, control charts, etc.are displayed at employee work stations.
A.1.5. Supplier quality managementItems 1, 4–9 were adapted fromSaraph et al. (1989);
item 10 was adapted fromEttlie and Reza (1992);items 2, 3, and 11 were originated byKaynak (1997).
1. †Extent to which long-term relationships are of-fered to suppliers (0.60).
2. †Reduction in the number of suppliers since im-plementing just-in-time purchasing and/or totalquality management (0.61,t-value= 7.39).
3. †Extent to which suppliers are evaluated accord-ing toquality, delivery performance, andprice, inthat order (0.87,t-value= 9.36).
4. †Extent to which suppliers are selected basedon quality rather than price or delivery schedule(0.82,t-value= 9.07).
5. Reliance on a reasonably few dependable suppli-ers.
6. †Thoroughness of your organization’s supplierrating system (0.71,t-value= 8.24).
7. Amount of education provided for suppliers byyour organization.
8. Technical assistance provided to the suppliers byyour organization.
9. †Involvement of the supplier in your product/ser-vice development process (0.57,t-value= 6.96).

H. Kaynak / Journal of Operations Management 21 (2003) 405–435 431
10. The extent to which the inspection of incomingparts has been reduced since you implementedjust-in-time purchasing and/or total quality man-agement.
11. Extent to which supplier conforms to the ex-act quality attributes required on your incomingparts.
A.1.6. Product/service designAll items in this scale were adapted fromSaraph
et al. (1989).
1. †Thoroughness of new product/service design re-views before the product/service is produced andmarketed (0.90).
2. †Coordination among affected departments inthe product/service development process (0.91,t-value= 20.79).
3. †Quality of new products/services emphasizedin relation to cost or schedule objectives (0.84,t-value= 17.39).
4. Clarity of product/service specifications and proce-dures.
5. †Extent to which implementation/producibility isconsidered in the product/service design process(0.84,t-value= 17.08).
6. ‡Quality emphasis by sales, customer service, mar-keting, and public relations personnel.
A.1.7. Process managementAll items in this scale were adapted fromSaraph
et al. (1989).
1. ∗Use of acceptance sampling to accept/reject lotsor batches of work.
2. ‡Amount of preventive equipment maintenance.3. †Extent to which inspection, review, or checking
of work is automated (0.67).4. ∗Amount of incoming inspection, review, or
checking.5. ∗Amount of in-process inspection, review, or
checking.6. ∗Amount of final inspection, review, or check-
ing.7. †Stability of production schedule/work distribu-
tion (0.57,t-value= 7.43).8. †Degree of automation of the process (0.76,
t-value= 9.48).
9. †Extent to which process design is “fool-proof”and minimizes the chances of employee errors(0.86,t-value= 10.32).
10. ‡Clarity of work or process instructions given toemployees.
A.2. Relative perceived performance
A.2.1. Inventory management performanceAll items in this scale were developed based
on a literature review (e.g.Ansari and Modarress,1990; Chapman and Carter, 1990; Deming, 1993;Engelkemeyer, 1990; Freeland, 1991; United StatesGeneral Accounting Office, 1991).
1. †Purchase material turnover (0.97).2. †Total inventory turnover (0.89,t-value= 13.93).
A.2.2. Quality performanceAll items in this scale were developed based on a
literature review (e.g.Ansari and Modarress, 1990;Deming, 1986, 1993; Engelkemeyer, 1990; Freeland,1991; Garvin, 1983; Maani et al., 1994; Schonbergerand Ansari, 1984; Shetty, 1988; United States GeneralAccounting Office, 1991).
1. †Product/service quality (0.70).2. †Productivity (0.87,t-value= 10.25).3. †Cost of scrap and rework as a % ofsales (0.65,
t-value= 8.49).4. Delivery lead-time of purchased materials.5. †Delivery lead-time of finished products/services
to customer (0.53,t-value= 7.00).
A.2.3. Financial and market performanceAll items in this scale were developed based on a
literature review (e.g.Buzzell et al., 1975; Clevelandet al., 1989; Craig and Douglas, 1982; Dess andRobinson, 1984; Dröge et al., 1994; Jacobson andAaker, 1987; Keats, 1988; MacMillan et al., 1982;Parthasarthy and Sethi, 1993; Phillips et al., 1983;Swamidass and Newell, 1987; Venkatraman andRamanujam, 1987; Vickery et al., 1993; Ward et al.,1994; Woo and Willard, 1983; Zeithaml and Fry,1981).
1. Return on investment.2. †Sales growth (0.78).

432 H. Kaynak / Journal of Operations Management 21 (2003) 405–435
3. Profit growth.4. †Market share (0.78,t-value= 12.70).5. †Market share growth (0.99,t-value= 14.63).
References
Aaker, D.A., Jacobson, R., 1994. The financial information contentof perceived quality. Journal of Marketing Research 31, 191–201.
Abraham, M., Crawford, J., Fisher, T., 1999. Key factors predictingeffectiveness of cultural change and improved productivity inimplementing total quality management. International Journalof Quality and Reliability Management 16, 112–132.
Adam Jr., E.E., Corbett, L.M., Flores, B.E., Harrison, N.J.,Lee, T.S., Rho, B.H., Ribera, J., Samson, D., Westbrook, R.,1997. An international study of quality improvement approachand firm performance. International Journal of Operations andProduction Management 17, 842–873.
Adebanjo, D., Kehoe, D., 1999. An investigation of quality culturedevelopment in UK industry. International Journal of Operationsand Production Management 19, 633–649.
Ahire, S.L., Dreyfus, P., 2000. The impact of design managementand process management on quality: an empirical examination.Journal of Operations Management 18, 549–575.
Ahire, S.L., O’Shaughnessy, K.C., 1998. The role of topmanagement commitment in quality management: an empiricalanalysis of the auto parts industry. International Journal ofQuality Science 3 (1), 5–37.
Ahire, S.L., Golhar, D.Y., Waller, M.A., 1996. Developmentand validation of TQM implementation constructs. DecisionSciences 27, 23–56.
Alreck, P.L., Settle, R.B., 1985. The Survey Research Handbook.Irwin (Richard D.), Homewood, IL.
Amundson, S.D., 1998. Relationships between theory-drivenempirical research in operations management and otherdisciplines. Journal of Operations Management 16, 341–359.
Anderson, J.C., Gerbing, D.W., 1988. Structural equation modelingin practice: a review and recommended two-step approach.Psychological Bulletin 103, 411–423.
Anderson, J.C., Rungtusanatham, M., Schroeder, R.G., 1994.A theory of quality management underlying the Demingmanagement method. Academy of Management Review 19,472–509.
Anderson, J.C., Rungtusanatham, M., Schroeder, R.G., Devaraj,S., 1995. A path analytic model of a theory of qualitymanagement underlying the Deming Management Method:preliminary empirical findings. Decision Sciences 26, 637–658.
Ansari, A., Modarress, B., 1990. Just-in-Time Purchasing. FreePress, New York, NY.
Armstrong, J.S., Overton, T.S., 1977. Estimating nonresponse biasin mail surveys. Journal of Marketing Research 14, 396–402.
Bagozzi, R.P., Yi, Y., Phillips, L.W., 1991. Assessing constructvalidity in organizational research. Administrative ScienceQuarterly 36, 421–458.
Bell, R.R., Burnham, J.M., 1989. The paradox of manufacturingproductivity and innovation. Business Horizons 32 (5), 58–64.
Black, S.A., Porter, L.J., 1996. Identification of the critical factorsof TQM. Decision Sciences 27, 1–21.
Bollen, K.A., 1989. Structural Equations with Latent Variables.Wiley, New York, NY.
Bonito, J.G., 1990. Motivating employees for continuousimprovement efforts. Part 3. Additional critical success factors.Production and Inventory Management Review and APICSNews 10 (8), 32–33.
Burack, E.H., Burack, M.D., Miller, D.M., Morgan, K., 1994. Newparadigm approaches in strategic human resource management.Group and Organization Management 19 (2), 141–159.
Burt, D.N., 1989. Managing suppliers up to speed. HarvardBusiness Review 67 (4), 127–135.
Buzzell, R.D., Gale, B.T., Sultan, R.G.M., 1975. Market share—akey to profitability. Harvard Business Review 53 (1), 97–106.
Byrne, B.M., 1998. Structural Equation Modeling with LISREL,PRELIS, and SIMPLIS: Basis Concepts, Application, andProgramming. Lawrence Erlbaum, Mahwah, NJ.
Carmines, E.G., McIver, J.P., 1981. Analyzing models withunobserved variables. In: Bohrnstedt, G.W., Borgatta, E.F.(Eds.), Social Measurement: Current Issues. Sage, Beverly Hills,CA, pp. 65–115.
Chapman, S., Carter, P.L., 1990. Supplier/customer inventoryrelationships under just-in-time. Decision Sciences 21, 35–51.
Chase, R.B., Aquilano, N.J., Jacobs, F.R., 2001. Opera-tions Management for Competitive Advantage, ninth ed.McGraw-Hill, Boston, MA.
Chenhall, R.H., 1997. Reliance on manufacturing performance,total quality management and organizational performance.Management Accounting Research 8, 187–206.
Choi, T.Y., 1995. Conceptualizing continuous improvement:implications for organizational change. Omega 23, 607–624.
Choi, T.Y., Eboch, K., 1998. The TQM paradox: relations amongTQM practices, plant performance, and customer satisfaction.Journal of Operations Management 17, 59–75.
Choi, T.Y., Liker, J.K., 1995. Bringing Japanese continuousimprovement approaches to US manufacturing: the roles ofprocess orientation and communications. Decision Sciences 26,589–616.
Churchill Jr., G.A., 1979. A paradigm for developing bettermeasures of marketing constructs. Journal of MarketingResearch 16, 64–73.
Cleveland, G., Schroeder, R.G., Anderson, J.C., 1989. A theoryof production competence. Decision Sciences 20, 655–668.
Cook, T.D., Campbell, D.T., 1979. Quasi-Experimentation: Designand Analysis Issues for Field Settings. Houghton Mifflin,Boston, MA.
Cooper, M.C., Ellram, L.M., 1993. Characteristics of supply chainmanagement and the implications for purchasing and logisticsstrategy. The International Journal of Logistics Management4 (2), 13–24.
Craig, C.S., Douglas, S.P., 1982. Strategic factors associatedwith market and financial performance. Quarterly Review ofEconomics and Business 22, 101–112.
Criteria for Performance Excellence, 2002. Baldrige NationalQuality Program. Department of Commerce, National Instituteof Standards and Technology, Technology Administration,Gaithersburg, MD, USA.

H. Kaynak / Journal of Operations Management 21 (2003) 405–435 433
Crocker, L., Algina, J., 1986. Introduction to Classical and ModernTest Theory. Harcourt, Brace and Jovanovich, Forth Worth, TX.
Cronbach, L.J., 1951. Coefficient alpha and the internal structureof tests. Psychometrika 16, 297–334.
Daft, R.L., 1998. Organization Theory and Design. South-WesternCollege Publishing, Cincinnati, OH.
Das, A., Handfield, R.B., Calantone, R.J., Ghosh, S., 2000.A contingent view of quality management—the impact ofinternational competition on quality. Decision Sciences 31, 649–690.
Deming, W.E., 1986. Out of the Crisis. Massachusetts Instituteof Technology, Center for Advanced Engineering Study,Cambridge, MA.
Deming, W.E., 1993. The New Economics for Industry, Govern-ment, Education. Massachusetts Institute of Technology, Centerfor Advanced Engineering Study, Cambridge, MA.
Dess, G.G., Robinson Jr., R.B., 1984. Measuring organizationalperformance in the absence of objective measures: the case ofthe privately-held firm and conglomerate business unit. StrategicManagement Journal 5, 265–273.
Dillman, D.A., 1978. Mail and Telephone Surveys: The TotalDesign Method. Marcel Dekker, New York, NY.
Douglas, T.J., Judge Jr., W.Q., 2001. Total quality managementimplementation and competitive advantage: the role of structuralcontrol and exploration. Academy of Management Journal 44,158–169.
Dow, D., Samson, D., Ford, S., 1999. Exploding the myth: doall quality management practices contribute to superior qualityperformance? Production and Operations Management 8, 1–27.
Dröge, C., Vickery, S., Markland, R.E., 1994. Sources andoutcomes of competitive advantage: an exploratory study in thefurniture industry. Decision Sciences 25, 669–689.
Easton, G.S., Jarrell, S.L., 1998. The effects of totalquality management on corporate performance: an empiricalinvestigation. Journal of Business 71 (2), 253–307.
Ellram, L.M., 1991. A managerial guideline for the developmentand implementation of purchasing partnerships. InternationalJournal of Purchasing and Materials Management 27 (3), 2–8.
Engelkemeyer, S.W., 1990. An empirical study of total qualitymanagement practices in US manufacturing firms. UnpublishedPh.D. Dissertation. Clemson University, Clemson, SC.
Ettkin, L.P., Helms, M.M., Haynes, P.J., 1990. People: acritical element of new technology implementation. IndustrialManagement 32 (5), 27–29.
Ettlie, J.E., Reza, E.M., 1992. Organizational integration andprocess innovation. Academy of Management Journal 35, 795–827.
Flynn, B.B., Schroeder, R.G., Sakakibara, S., 1994. A frame-work for quality management research and an associatedmeasurement instrument. Journal of Operations Management11, 339–366.
Flynn, B.B., Schroeder, R.G., Sakakibara, S., 1995. The impact ofquality management practices on performance and competitiveadvantage. Decision Sciences 26, 659–691.
Ford, R.C., Fottler, M.D., 1995. Empowerment: a matter of degree.The Academy of Management Executive 9 (3), 21–29.
Fornell, C., Johnson, M.D., Anderson, E.W., Cha, J., Bryant,B.E., 1996. The American customer satisfaction index: nature,purpose, and findings. Journal of Marketing 60 (4), 7–18.
Forza, C., Flippini, R., 1998. TQM impact on quality conformanceand customer satisfaction: a causal model. International Journalof Production Economics 55, 1–20.
Freeland, J.R., 1991. A survey of just-in-time purchasing practicesin the United States. Production and Inventory ManagementJournal 32 (2), 43–50.
Garvin, D.A., 1983. Quality on the line. Harvard Business Review61 (5), 65–75.
Garvin, D.A., 1987. Competing on the eight dimensions of quality.Harvard Business Review 65 (6), 101–109.
Gerbing, D.W., Anderson, J.C., 1988. An updated paradigmfor scale development incorporating unidimensionality and itsassessment. Journal of Marketing Research 25, 186–192.
Germain, R., Dröge, C., 1997. Effect of just-in-time purchasingrelationships on organizational design, purchasing departmentconfiguration, and firm performance. Industrial MarketingManagement 26, 115–125.
Germain, R., Spears, N., 1999. Quality management andits relationship with organizational context and design.International Journal of Quality and Reliability Management16, 371–391.
Goodstein, L.D., Burke, W.W., 1991. Creating successful organi-zation change. Organizational Dynamics 19 (4), 5–17.
Grandzol, J.R., Gershon, M., 1997. Which TQM practices reallymatter: an empirical investigation. Quality Management Journal4 (4), 43–59.
Grieco, P.L., Gozzo, M.W., 1985. JIT and TQC—is it for you? Pand IM Review and APICS News 5 (9), 50, 52, 54–55.
Hackman, J.R., Wageman, R., 1995. Total quality management:empirical, conceptual, and practical issues. AdministrativeScience Quarterly 40, 309–342.
Hair, J.F., Anderson, R.E., Tatham, R.L., Black, W.C., 1995.Multivariate Data Analysis, fourth ed. Prentice-Hall, EnglewoodCliffs, NJ.
Hamlin, B., Reidy, M., Stewart, J., 1997. Changing themanagement culture in one part of the British Civil Servicethrough visionary leadership and strategically led research-based OD interventions. Journal of Applied ManagementStudies 6 (2), 233–251.
Handfield, R., Ghosh, S., 1994. Creating a quality culture throughorganizational change: a case analysis. Journal of InternationalMarketing 2 (3), 7–36.
Handfield, R., Ghosh, S., Fawcett, S., 1998. Quality-driven changeand its effects on financial performance. Quality ManagementJournal 5 (3), 13–30.
Handfield, R., Jayaram, J., Ghosh, S., 1999. An empiricalexamination of quality tool deployment patterns and theirimpact on performance. International Journal of ProductionResearch 37, 1403–1426.
Hendricks, K.B., Singhal, V.R., 1996. Quality awards andthe market value of the firm: an empirical investigation.Management Science 42, 415–436.
Hendricks, K.B., Singhal, V.R., 1997. Does implementingan effective TQM program actually improve operating

434 H. Kaynak / Journal of Operations Management 21 (2003) 405–435
performance? Empirical evidence from firms that have wonquality awards. Management Science 43, 1258–1274.
Ho, D.C.K., Duffy, V.G., Shih, H.M., 1999. An empirical analysisof effective TQM implementation in the Hong Kong electronicsmanufacturing industry. Human Factors and Ergonomics inManufacturing 9 (1), 1–25.
Ho, D.C.K., Duffy, V.G., Shih, H.M., 2001. Total qualitymanagement: an empirical test for mediation effect. Interna-tional Journal of Production Research 39, 529–548.
Holpp, L., 1994. Applied empowerment. Training 31 (2), 39–44.Hoskisson, R., Hitt, M., Johnson, R., Moesel, D., 1993. Construct
validity of an objective (entropy) categorical measure ofdiversification strategy. Strategic Management Journal 14, 215–235.
Hubbard, R., Vetter, D.E., Little, E.L., 1998. Replication instrategic management: scientific testing for validity, generaliza-bility, and usefulness. Strategic Management Journal 19, 243–254.
Huber, G.P., Power, D.J., 1985. Retrospective reports of strategic-level managers: guidelines for increasing their accuracy.Strategic Management Journal 6, 171–180.
Jaccard, J., Wan, C.K., 1996. LISREL approaches to interactioneffects in multiple regression. Sage University Paper Series onQuantitative Applications in the Social Sciences, 07–114. Sage,Thousand Oaks, CA.
Jacobson, R., Aaker, D.A., 1987. The strategic role of productquality. Journal of Marketing 51 (4), 31–44.
Jöreskog, K.G., Sörbom, D., 1993a. LISREL 8: Structural EquationModeling with the SIMPLIS Command Language. LawrenceErlbaum, Hillsdale, NJ.
Jöreskog, K.G., Sörbom, D., 1993b. LISREL 8. Scientific SoftwareInternational, Chicago, IL.
Juran, J.M., 1981. Product quality—a prescription for the West.Part 2. Upper management leadership and employee relations.Management Review 70 (7), 57–61.
Juran, J.M., 1986. The quality trilogy. Quality Progress 19 (8),19–24.
Kaynak, H., 1997. Total Quality Management and Just-in-TimePurchasing: Their Effects on Performance of Firms Operatingin the US. Garland, New York, NY.
Keats, B.W., 1988. The vertical construct validity of businesseconomic performance measures. Journal of Applied BehavioralScience 24, 151–160.
Kelloway, E.K., 1995. Structural equation modeling in perspective.Journal of Organizational Behavior 16, 215–224.
Krajewski, L.J., Ritzman, L.P., 2001. Operations Management:Strategy and Analysis, sixth ed. Prentice-Hall, Upper SaddleRiver, NJ.
Krause, D.R., 1999. The antecedents of buying firms’ efforts toimprove suppliers. Journal of Operations Management 17, 205–224.
Krause, D.R., Handfield, R.B., Scannell, T.V., 1998. Anempirical investigation of supplier development: reactive andstrategic processes. Journal of Operations Management 17, 39–58.
Leonard, F.S., Sasser, W.E., 1982. The incline of quality. HarvardBusiness Review 60 (5), 163–171.
Levandoski, R.C., 1993. TQM helps you mind your inventory Psand Qs. Beverage Industry 84 (7), 56.
Lockamy III, A., 1998. Quality-focused performance measurementsystems: a normative model. International Journal of Operationsand Production Management 18, 740–766.
Maani, K.E., Putterill, M.S., Sluti, D.G., 1994. Empirical analysisof quality improvement in manufacturing. The InternationalJournal of Quality and Reliability Management 11 (7), 19–37.
MacMillan, I.C., Hambrick, D.C., Day, D.L., 1982. Theproduct portfolio and profitability—a PIMS-based analysis ofindustrial-product businesses. Academy of Management Journal25, 733–755.
Madu, C.N., Kuei, C., Lin, C., 1995. A comparative analysis ofquality practice in manufacturing firms in the US and Taiwan.Decision Sciences 26, 621–635.
Martin, W.S., 1978. Effects on scaling on the correlationcoefficient: additional considerations. Journal of MarketingResearch 15, 304–308.
McClelland, G.H., Judd, C.M., 1993. Statistical difficulties ofdetecting interactions and moderator effects. PsychologicalBulletin 114, 376–390.
Mohrman, S.A., Tenkasi, R.V., Lawler III, E.E., Ledford Jr.,G.G., 1995. Total quality management: practice and outcomesin the largest US firms. Employee Relations 17 (3), 26–41.
Mulaik, S.A., James, L.R., Van Altine, J., Bennett, N., Lind, S.,Stilwell, C.D., 1989. Evaluation of goodness-of-fitness indicesfor structural equation models. Psychological Bulletin 105, 430–445.
Nunnally, J.C., Bernstein, I.H., 1994. Psychometric Theory, thirded. McGraw-Hill, New York, NY.
Palich, L.E., Cardinal, L.B., Miller, C.C., 2000. Curvilinearity inthe diversification and performance linkage: an examination ofover three decades of research. Strategic Management Journal21, 155–174.
Pannirselvam, G.P., Ferguson, L.A., 2001. A study of therelationships between the Baldrige categories. InternationalJournal of Quality and Reliability Management 18, 14–34.
Parthasarthy, R., Sethi, S.P., 1993. Relating strategy and structure toflexible automation: a test of fit and performance implications.Strategic Management Journal 14, 529–549.
Phillips, L.W., Chang, D.R., Buzzell, R.D., 1983. Product quality,cost position, and business performance: a test of some keyhypotheses. Journal of Marketing 47 (2), 26–43.
Powell, T.C., 1995. Total quality management as competitiveadvantage: a review and empirical study. Strategic ManagementJournal 16, 15–37.
Reed, R., Lemak, D.J., Montgomery, J.C., 1996. Beyond process:TQM content and firm performance. Academy of ManagementReview 21, 173–202.
Rungtusanatham, M., Forza, C., Filippini, R., Anderson, J.C.,1998. A replication study of a theory of quality managementunderlying the Deming method: insights from an Italian context.Journal of Operations Management 17, 77–95.
Russell, C.J., Bobko, P., 1992. Moderated regression analysisand Likert scales: too coarse for comfort. Journal of AppliedPsychology 77, 336–342.

H. Kaynak / Journal of Operations Management 21 (2003) 405–435 435
Samson, D., Terziovski, M., 1999. The relationship between totalquality management practices and operational performance.Journal of Operations Management 17, 393–409.
Saraph, J.V., Benson, G.P., Schroeder, R.G., 1989. An instrumentfor measuring the critical factors of quality management.Decision Sciences 20, 810–829.
Schonberger, R.J., Ansari, A., 1984. “Just-in-time” purchasingcan improve quality. Journal of Purchasing and MaterialsManagement 20 (1), 2–7.
Schroeder, R.G., Scudder, G.D., Elm, D.R., 1989. Innovation inmanufacturing. Journal of Operations Management 8, 1–15.
Shetty, Y.K., 1988. Managing product quality for profitability.SAM Advanced Management Journal 53 (4), 33–38.
Shin, H., Collier, D.A., Wilson, D.D., 2000. Supply managementorientation and supplier/buyer performance. Journal ofOperations Management 18, 317–333.
Spector, B., Beer, M., 1994. Beyond TQM programmes. Journalof Organizational Change Management 7 (2), 63–70.
Stanley, L.L., Wisner, J.D., 2001. Service quality along thesupply chain: implications for purchasing. Journal of OperationsManagement 19, 287–306.
Swamidass, P.M., Newell, W.T., 1987. Manufacturing strategy,environmental uncertainty and performance: a path analyticmodel. Management Science 33, 509–524.
Tan, K.C., 2001. A structural equation model of new productdesign and development. Decision Sciences 32, 195–226.
Tan, K.C., Kannan, V.R., Handfield, R., 1998. Supply chainmanagement: supplier performance and firm performance.International Journal of Purchasing and Materials Management34 (3), 2–9.
Taylor, L.A., Cosier, R.A., Ganster, D.C., 1992. The positive effectsof easy goals on decision quality and risk propensity in anMCPLP task. Decision Sciences 23, 880–898.
Trent, R.J., Monczka, R.M., 1999. Achieving world-class supplierquality. Total Quality Management 10, 927–938.
United States General Accounting Office, 1991. Managementpractices—US companies improve performance through qualityefforts. GAO/NSIAD-91-190, Washington, DC, USA.
Venkatraman, N., Ramanujam, V., 1987. Measurement of businesseconomic performance: an examination of method convergence.Journal of Management 13, 109–122.
Vickery, S.K., Dröge, C., Markland, R.E., 1993. Productioncompetence and business strategy: do they affect businessperformance? Decision Sciences 24, 435–455.
Ward, P.T., Leong, G.K., Boyer, K.K., 1994. Manufacturingproactiveness and performance. Decision Sciences 25, 337–358.
Wilson, D.D., Collier, D.A., 2000. An empirical investigation ofthe Malcolm Baldrige National Quality award causal model.Decision Sciences 31, 361–390.
Woo, C.Y., Willard, G., 1983. Performance representation in stra-tegic management research: discussions and recommendations.In: Proceedings of the Paper Presented at the Annual Meetingof the Academy of Management, Dallas, Texas, August 1983.
Zeithaml, C.P., Fry, L.W., 1981. The impact of real marketgrowth and technology on strategy–performance relationships.In: Proceedings of the American Institute for Decision Sciences,Boston, MA, November 1981, pp. 27–29.
Zeitz, G., Johannesson, R., Ritchie Jr., J.E., 1997. An employeesurvey measuring total quality management practices andculture. Group and Organization Management 22, 414–444.