The Relationship between Institutions and Entrepreneurship ...
29
1 Discussion Paper March 2021 The Relationship between Formal Institutions and Entrepreneurship: A Cross-Country Analysis NataliaTsatsenko 1 and Ganira Ibrahimova 2 Abstract: This paper explores the relationship between formal institutions and entrepreneurship. Using the international data from the Global Entrepreneurship Monitor (GEM) and the Worldwide Governance Indicators (WGI) projects, we show that formal institutions have a different impact on early-established and mature entrepreneurial activity rates. The relationship between formal institutional dimensions (rule of law, control of corruption, regulatory quality) and two entrepreneurial activity rates (total early-stage entrepreneurial activity and established business ownership rates) are estimated. We theorize that formal institutions create necessary conditions where both early established and mature entrepreneurship operate. Since entrepreneurship depends not only on the institutional environment but also on the stage of economic development, we conduct a cross-country analysis, including two groups of countries such as efficiency-driven and innovation-driven economies. Our empirical results confirm that in efficiency- driven countries the relationship between formal institutions and the TEA rate is more intense, while in innovation-driven countries this relationship is stronger between formal institutions and the established business ownership rate. We also discover that the rule of law plays the most important role in relation to entrepreneurial activities, meanwhile in the case of mature entrepreneurship in efficiency-driven economies; regulatory quality turns out to be more important. Keywords: Formal institutions, entrepreneurship, rule of law, regulatory quality, control of corruption, Global Entrepreneurship Monitor (GEM), World Governance Indicators (WGI) JEL classification: L26, M13, O10, O57, P51 1 Natalia Tsatsenko is the research and teaching assistant, PhD candidate, the Economic Faculty, University of Siegen, Germany. ORCID 0000-0002-4258-1865. E-mail: [email protected] ; [email protected] 2 Ganira Ibrahimova is the research assistant, PhD candidate, the Economic Faculty, University of Siegen, Germany. ORCID 0000-0001-9093-5018. E-mail: [email protected] ; [email protected] Author Contributions: Ganira Ibrahimova and Natalia Tsatsenko contributed equally to this work.
Transcript of The Relationship between Institutions and Entrepreneurship ...
1
Discussion Paper March 2021
The Relationship between Formal Institutions and Entrepreneurship:
A Cross-Country Analysis
NataliaTsatsenko1 and Ganira Ibrahimova2
Abstract:
This paper explores the relationship between formal institutions and entrepreneurship. Using the international data from the Global Entrepreneurship Monitor (GEM) and the Worldwide Governance Indicators (WGI) projects, we show that formal institutions have a different impact on early-established and mature entrepreneurial activity rates. The relationship between formal institutional dimensions (rule of law, control of corruption, regulatory quality) and two entrepreneurial activity rates (total early-stage entrepreneurial activity and established business ownership rates) are estimated. We theorize that formal institutions create necessary conditions where both early established and mature entrepreneurship operate. Since entrepreneurship depends not only on the institutional environment but also on the stage of economic development, we conduct a cross-country analysis, including two groups of countries such as efficiency-driven and innovation-driven economies. Our empirical results confirm that in efficiency-driven countries the relationship between formal institutions and the TEA rate is more intense, while in innovation-driven countries this relationship is stronger between formal institutions and the established business ownership rate. We also discover that the rule of law plays the most important role in relation to entrepreneurial activities, meanwhile in the case of mature entrepreneurship in efficiency-driven economies; regulatory quality turns out to be more important.
Keywords: Formal institutions, entrepreneurship, rule of law, regulatory quality, control of corruption, Global Entrepreneurship Monitor (GEM), World Governance Indicators (WGI) JEL classification: L26, M13, O10, O57, P51 1 Natalia Tsatsenko is the research and teaching assistant, PhD candidate, the Economic Faculty, University of Siegen, Germany. ORCID 0000-0002-4258-1865. E-mail: [email protected] ; [email protected] 2 Ganira Ibrahimova is the research assistant, PhD candidate, the Economic Faculty, University of Siegen, Germany. ORCID 0000-0001-9093-5018. E-mail: [email protected] ; [email protected]
Author Contributions: Ganira Ibrahimova and Natalia Tsatsenko contributed equally to this work.
2
1. Introduction
In recent decades, the contribution of entrepreneurship to economic growth has been widely
recognized (Wong et al., 2005; Desai, 2011; Acs et al., 2014; Urbano et al., 2019). Evidence from
entrepreneurial literature shows that entrepreneurship boost innovation, creates new job places and
provides a more fair distribution of income (Baumol, 1990; Acs, 2006; Valliere and Peterson, 2009).
However, the contribution of entrepreneurial activities to a total economy is significantly different among
countries, even if the group of countries is belonged to one geographical area and has some similarities in
culture. It leads to the block of questions such as: what are the determinants that influence the formation
of entrepreneurship in a country; why does entrepreneurial activity flourish in some counties and fails in
others; why conditions for entrepreneurial activities are less sustainable in developing countries than in
developed even if the former has a higher rate of the total early entrepreneurial activities. All these
questions are related to the institutions that play a central role in explaining economic performance and
differences in the entrepreneurial landscape among countries.
Furthermore, institutions are of importance for economic growth, economic development, and
entrepreneurship. As stated in the paper by Acemoglu and Robinson (2008), institutions are considered as
the fundamental causes of economic growth and also, specific institutional characteristics are reasons why
economic outcomes are different across countries. Institutions condition the incentives of and the
constraints on economic actors, and as a result, institutions form economic outcomes (North, 1990). The
connection between institutions and entrepreneurship is that institutions make a contribution to building
the macroeconomic foundations of microeconomic behavior (Minniti and Levesque, 2008). For example,
institutional arrangements influence not only the level of entrepreneurship in a country or a region but
also the type of entrepreneurship initiatives, by making them less or more productive and sustainable
(Bruton et al., 2010). It is important to underline that entrepreneurship is associated with human nature,
and then, the realization of the entrepreneurial propensity of individuals is highly dependent on the quality
of institutions in a country, in the context of the microeconomic side (Baumol, 1990). Having made new
comprehensive syntheses of the literature over the last 25 years (from 1992 to 2016) about the interaction
among entrepreneurship, institutions and economic growth, Urbano et al. (2019) summarize that
entrepreneurship has different impacts on the economy due to institutions among countries and regions.
Hence, the study of the relationship between institutions and entrepreneurship remains a focus of
the growing interest of researchers and policymakers. Our paper is in the line of other works which
3
continue to uncover the relationship between institutions and entrepreneurship. Before we describe our
intended contribution to this field, we highlight the existing direction in this research area. So, the effects
of institutions on entrepreneurship could be divided into the following fourth ways. Firstly, plenty of
literature studies the impact of institutional dimension on two types of entrepreneurship such as the
necessity and opportunity (Wong et al., 2005; Van Stel et al., 2007; Fuentelsaz et al., 2015; Amorós et al.,
2019) and these analyses are mostly based on the cross-country sample. Besides, the researchers attempt
to connect this relationship to different economic development stages. For example, Fuentelsaz et al.
(2015) conclude that the development of formal institutions primarily benefits opportunity
entrepreneurship which is linked to economic growth. Additionally, formal institutions favor the relative
presence of necessity entrepreneurship. Secondly, several papers examine the different effects of formal
and informal institutions on opportunity entrepreneurship (Fuentelsaz et al., 2015; Aparicio et al., 2016).
Thirdly, a huge research area on the topic of the relationship between entrepreneurship and institution is
associated with the effect of different formal institutions on new business formation either inside one
country (Agostino et al., 2020) or in a cross-country sample (Klapper et al., 2007; Levie and Autio, 2011;
Aidis et al., 2012; Stenholm et al., 2013). Fourthly, only a few papers analyze how various institutional
dimensions may differently affect either the entrepreneurial stage (Hartog et al., 2010) or entrepreneurial
aspiration (Troilo, 2011). As we can see from entrepreneurship and institutional literature, formal
institutions shape either “good” or “bad” conditions for entrepreneurs, and then it influences the
sustainability of entrepreneurship in economics. In this way, in the previous literature, there are a lot of
different studies on the topic of how the quality of institutions affects the total early entrepreneurial activity
rate. However, there is still a gap in this research field what is the impact of institution on the established
business ownership rate, and there is a lack of knowledge of comparison between the role of institutions
on those two different entrepreneurial rates.
The goal of this paper sheds light on the effect of whether different institutional dimensions could
enable or hinder entrepreneurial activities on two different stage such as early and mature. In this sense,
we explore the relationship between three formal institutional dimensions and two entrepreneurial rates
for the sample of countries, by using the statistical method of correlation and simple linear regression. We
focus on six single relationships independently from each other and analyze the correlation between them
for each group of countries. Afterwards, we compare the results and examine how they could be associated
with the economic development stage of these countries.
4
Note that the sample of countries is presented by two groups of countries: efficiency- and
innovation-driven. Entrepreneurial data is derived from the Global Entrepreneurial Monitor project which
provides internationally consistent, comparable data to assess entrepreneurial activities in different
countries. Innovation-driven countries are characterized by a healthy set of basic requirements and factors
for creating an enabling environment for entrepreneurship and innovation. Efficiency-driven countries
tend to grow faster than wealthier countries and strive for a robust economy as in countries with innovation
economies. Nevertheless, they are still in the process of further development and establishment of
sustainable conditions for entrepreneurial activities. A comparison between two groups of countries allows
us to see the role of the institution in creating stable entrepreneurship at different stages of development.
To point out that in this work, we deal only with those indicators that might have a direct effect on
entrepreneurial activity such as the rule of law, control of corruption or regulatory quality which comes
from well-known institutional database as the Worldwide Governance Indicators project.
To achieve the research aim, the following research questions are examined in this paper:
▪ Which institutional dimension (rule of law, control of corruption, or regulatory quality) has a
stronger relation to the early (TEA) and the mature (EBO) rates?
▪ Are there any differences in these effects between two groups of economies, namely in efficiency-
driven and innovation-driven economies?
This work may help policymakers design policy to shape a sustainable entrepreneurship landscape
and support entrepreneurial activities, particularly in fast-growing developing countries. Furthermore, the
paper will be interesting for future researchers who are interested to investigate deeply the impact of
different formal institutions on early and mature entrepreneurial rates and the results of the paper will be
helpful for further country studies.
After the introduction, this paper is structured as follows. In Section 2, the theoretical framework of
institutions and entrepreneurship is reviewed. Then, the key data sources concerning entrepreneurship and
institution under our cross-country analysis are highlighted; and the selected indicators used in this
empirical part are defined. In Section 3, the methodology employed is outlined. The samples of countries,
variables, and sources of data are described, and the results of the descriptive statistics are explained. In
Section 4 the empirical results of the analysis are presented for each group of countries. In Section 5
the comparison between the counties’ results is discussed. Section 6 concludes.
5
2. Institutions and entrepreneurship: theoretical framework, measurement issues and indicators
2.1. Institutions: definitions and theoretical background
Economists who have highly emphasized the role of institutions and establish the mainstream of new
institutional economics are Douglass North, Ronald Coase, Oliver Williamson and Elinor Ostrom. They
were even awarded by Noble Prize for the work in this field. On the basis of their researches, the new
institutional economy appeared. The new institutional economy concentrates on several explanations of
the institutions’ impact on economic behavior and economic development: those that reduce transaction
costs, encourage trade and contribute to development, and those that direct the state to protect property
rights rather than expropriate them. Further, the diverse group of well-known institutionalists and
economists (North (1990, 1991; Acemoglu and Robinson, 2008; Greif, 2006; Gneezy and Rustichini,
2000; etc.) state, that institutions matter a big deal for the economic behavior and development.
The first scientist, who defined the institution, was Douglass North. According to his definition,
institutions are the humanly devised constraints that structure political, economic and social interaction.
Throughout history, people have created institutions to secure order and reduce uncertainty in interaction
processes. Along with the standard economic constraints, they also define choice sets and thus determine
transaction and production costs, profitability and feasibility of engaging in different economic activities
(North, 1991).
When we look at the definitions of institutions in the modern literature, we will find out that a large
body of it has been built on the works of Coase, Williamson, and North. We will also find out that the
importance of institutions since that time has increasingly grown, and now they are widely explained and
well discussed in more modern development papers (Grindle, 2004; Ackerman, 2004; North et al., 2009;
2013; Leftwich and Sen, 2010). However, the interpretation of institutions as a tool providing the
framework for social interactions could differ. According to Chang and Evans (2005) institutions does not
exist separately from the individuals, but embedded in normative values and cultures that are internalised
and impact either social behavior or self-identity. Barley and Tolbert (1997) see the complex of institutions
as a “web of values, norms, rules, beliefs and taken for granted assumptions”. Leftwich (2010) states that
the establishment of institutions stands on the interaction process between social structure and individual
agency; being dependent on actors to create and adopt norms that are key to stable social conditions.
Thinking in terms of the relation between institutions and entrepreneurship, the importance of the
following terminology, such as “Game rules”, “Bad” and “Good” institutions is reflected. In more detail,
6
the activity of any entrepreneur or economic agent in society is also governed by a certain set of rules
(North, 1991). These rules both structure the interaction and create restrictions. As soon as a rule emerges,
there might be incentives to break it, so the rules are often accompanied by enforcement mechanisms for
their execution. Therefore, institutions are kind of “Game rules” that are working in society, as well as
organizations and businesses operating in this environment are “Game players”, acting accordingly to
these rules (North, 1991). When these rules are clear and well defined, then as a result, the opportunistic
behavior decreases, the trust increases. This leads in its turn to the increase of the long-term contracts
enforcement, reduction of transaction costs and as a result, to an efficient institutional structure (North et
al., 2013). On the contrary, “bad” quality institutions might reduce the incentives to invest and prevent the
process when resources have been allocated in the most productive way (Knowles and Weatherson, 2006,
p.10). Quality of institutions can shape or destroy the conditions for entrepreneurship (Baumol, 1990;
Johnson et al., 1997).
2.2 Classification of Institutions: Formal and Informal
If we refer to the classification of institutions, North (1990), describes the function of institutions as
a framework, where formal institutions are found in rules, laws, regulations and policies are embedded in
and overlap with established social attitudes, customs and values, distinguished as informal institutions
(Casson et al., 2010). Following the North definition, institutions could be both formal and informal.
Formal institutions are rules that are provided in written form, while informal institutions are codes of
behavior, conventions and customs in contrast to formal ones. Therefore, what he means by distinguishing
between formal and informal institutions is that in the case of formal institutions, people are not only
dealing with codified rules, but also with well-organized sanctions. Informal institutions, on the contrary,
are referring to those institutions where the rules are not codified, nor the sanctions. In most cases, the
informal institutions have been inherited within the social group, the society, the culture and people learn
about them through the interactions they make (North 1990). Formal and informal, institutions
undoubtedly have very big impact on the entrepreneurial climate in a given country. In our research, we
will focus on selected formal institutions and their impact on entrepreneurial activity levels in different
countries.
7
2.3 Measurement of institutions and institutional indicators
Based on the related literature, we can find the different sets of institutional indicators, used for better
understanding of institutional impact upon economic performance and entrepreneurship situation in
different countries. Quantitate measurement of institutions itself could be a complicated task because
institutions themselves have a more qualitative nature (Svensson, 2005). Still, there are different data
sources known worldwide that are providing institutional indices. These sources are those such as UN
CSD indices, GCR report, Transparency International's Corruption Perceptions Index, World Governance
Indicators, World Bank Investment Climate Survey Database, World Bank “Doing Business” report and
many more.
The World Governance Indicators
In our paper, the World Governance Indicators (WGI) is used as the main source of institutional
indicators for research. The WGI is a research dataset initiated and developed by Daniel
Kaufmann (Natural Resource Governance Institute and Brookings Institution) and Aart Kraay (World
Bank Development Research Group) in 1999. Pablo Zooid and Massimo Mastruzzi also made big
contributions to the development and updating of the WGI (Kaufmann et al. 1999). The WGI are
representing the views on the governance quality provided by a large number of survey respondents, such
as citizen, enterprise, and expert survey respondents in industrial and developing countries. These data
have been collected from several survey institutes, non-governmental organizations, international
organizations, and private sector companies in more than 200 countries since 1996 (Kaufmann et al. 2008).
As we have mentioned above, the WGI database is the most popular dataset referred to by many
researchers in this field. Moreover, six composite WGI measures are useful as a tool for broad cross-
country comparisons and for evaluating broad trends over time when making cross-country analysis.
Besides, World Governance Indicators covers a wide range of institutions and concerned as well-known
and very reliable database, collected for more than 20 years. Most of these indicators provide very specific
and disaggregated information about certain governance dimensions that are of great interest itself.
By the information provided, these six indicators have been divided into 3 groups: A, B and C groups.
The group A includes indicators, reflecting the process of how governments are selected, monitored, and
replaced. Those indicators are Voice and Accountability indicator (the extent to which a country's citizens
are able to participate in selecting the government, as well as freedom of expression, association, and free
media), and Political Stability and Absence of Violence/Terrorism indicator (the probability that the
government will be destabilized or replaced by non- constitutional and violent means, including
8
politically‐motivated violence and terrorism). The group B indicators reflect the government capacity of
formulating and implementing effective and sound policies. Indicators included in this group are
Government Effectiveness (quality of public and civil service, the degree of its independence from political
pressures, quality of formulated and implemented policy and the government's commitment on such
policies) and Regulatory Quality (the ability of the government to formulate and implement sound policies
and regulations providing private sector development). The group C the indicators show the respect that
state and citizens have towards the institutions that govern social and economic interactions among them.
Those indicators are Rule of Law (the extent to which agents have confidence in and abide by the society
rules), and Control of Corruption (the extent to which public power is interested in private gain,
corruption, and “capture” of the state by elites and private interests) (Kaufmann et al. 2010).
As can be seen from the definitions of institutional indicators, “institutional quality” is a broad
concept that captures law, individual rights and high-quality government services and regulations. Quality
of institutions affect different entrepreneurial activities (Sobel, 2008). In our research we focus on the last
three indicators since they have the direct impact on entrepreneurial activity in a country. Further, we
consider the individual variables which are included in three institutional indicators we select for our work.
Regulatory quality
Regulatory quality is an institutional indicator of WGI dataset, which belongs to the group B. This
indicator measures the perception of the government ability to formulate and implement sound policies
and regulations that permit and promote private sector development. The individual variables used to
construct this variable are HER (investment and financial freedom), PIA (business regulatory
environment), EIU (unfair competitive practices, price controls, discriminatory tariffs and taxes), IPD
(ease of starting a business by local law), WMO (regulatory burden), according to WGI (2020). This
indicator has direct impact on entrepreneurial activity; because it forms entrepreneurial ecosystem and
conditions, the business emerges and functions in.
Rule of law
Rule of law is an institutional indicator of WGI dataset, which belongs to the group C. This indicator
captures perceptions of the extent to which agents have confidence in and abide by the rules of society, in
particular, the contract enforcement quality, property rights protection, the police, and the court system,
as well as the probability of crime and violence. The individual variables used to construct this variable
are EIU (violent and organized crime, private property protection), HER (property rights), GCS (reliability
on police service, judicial independence, business cost of crime), according to WGI (2020). This
9
institutional indicator also has a direct impact to entrepreneurial activity in a country, because it illustrates
how entrepreneurship has been protected in a given country, by a law (property rights, contract
enforcement), by police service and by fair courts.
Control of corruption
Control of corruption is another institutional indicator of WGI dataset, which belongs to the group C.
measures the extent to which public power is exercised for private gain, including petty and grand forms
of corruption, as well as “capture” of the state by elites and private interests. The individual variables
used to construct this variable are EIU (corruption among public officials), PRS (corruption), GCS (public
trust in politicians, irregular payments and bribes in different spheres), according to the WGI (2020). This
institutional indicator also has a direct impact to entrepreneurial activity, because it provides the
transparency of doing business in a given country and absence of illegal transaction costs related to
entrepreneurial activity.
2.4 Measurement of entrepreneurship at the cross-country level: sources and indicators
According to the GEM project, entrepreneurship is determined such as “any attempt to create a new
business or a new venture, such as self-employment, a new business organization or the expansion of an
existing business by an individual, a team of individuals, or an established business” (GEM 2020).
Thinking in terms of entrepreneurial activities, we usually mean that entrepreneurial activity is “the
enterprising human action in pursuit of the generation of value, through the creation or expansion of
economic activity, by identifying and exploiting new products, processes or markets” (Ahmad and
Seymour 2008, 9).
There are two well-known and good established international entrepreneurship data like the World
Bank Group Entrepreneurship Survey (WBGES) and the Global Entrepreneurial Monitor (GEM). Both
databases measure entrepreneurship by several indicators.
The GEM considers entrepreneurial intentions. The World Bank's Entrepreneurship Survey reflects
only the actual level of entrepreneurial activity. For example, the key indicator of entrepreneurship in
WBGES is the entry rate that is defined as new firms (those that were registered in the current year) as a
percentage of total registered firms. Another important indicator is the business density which is
determined by the number of registered firms as a percentage of the active population (Klapper 2006).
Based on the paper by Acs et al. (2008) with the title “What does “entrepreneurship” data really show?”,
10
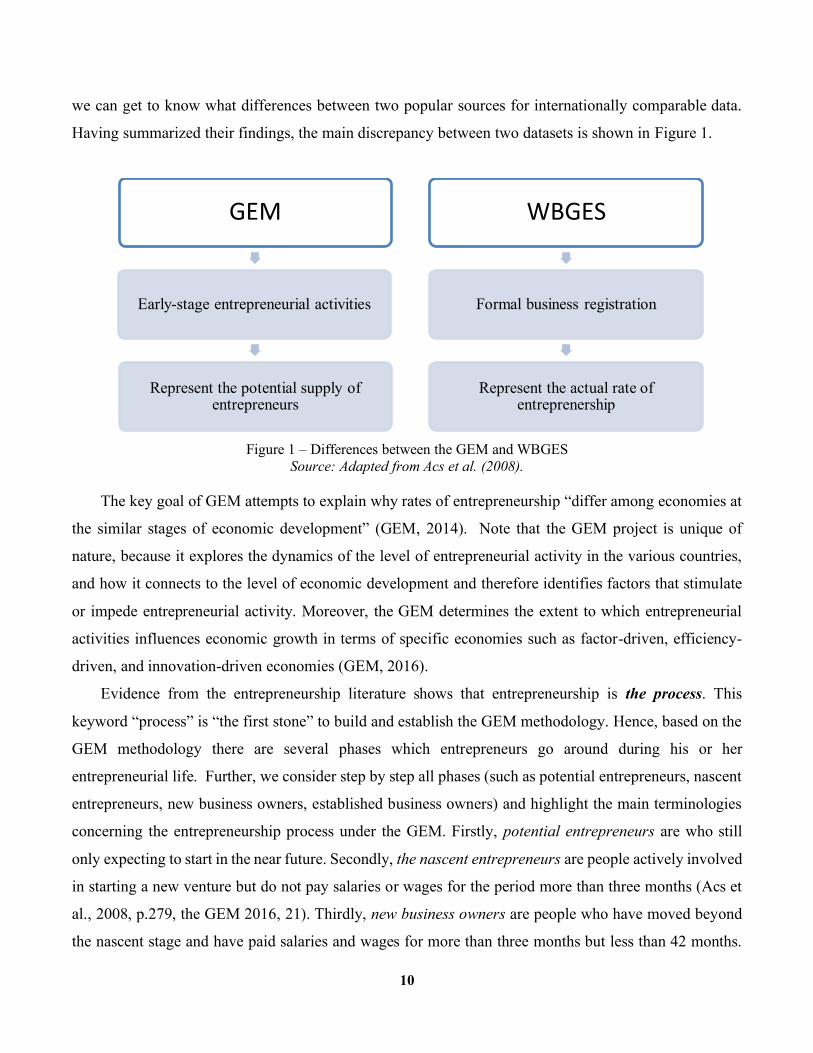
we can get to know what differences between two popular sources for internationally comparable data.
Having summarized their findings, the main discrepancy between two datasets is shown in Figure 1.
Figure 1 – Differences between the GEM and WBGES
Source: Adapted from Acs et al. (2008).
The key goal of GEM attempts to explain why rates of entrepreneurship “differ among economies at
the similar stages of economic development” (GEM, 2014). Note that the GEM project is unique of
nature, because it explores the dynamics of the level of entrepreneurial activity in the various countries,
and how it connects to the level of economic development and therefore identifies factors that stimulate
or impede entrepreneurial activity. Moreover, the GEM determines the extent to which entrepreneurial
activities influences economic growth in terms of specific economies such as factor-driven, efficiency-
driven, and innovation-driven economies (GEM, 2016).
Evidence from the entrepreneurship literature shows that entrepreneurship is the process. This
keyword “process” is “the first stone” to build and establish the GEM methodology. Hence, based on the
GEM methodology there are several phases which entrepreneurs go around during his or her
entrepreneurial life. Further, we consider step by step all phases (such as potential entrepreneurs, nascent
entrepreneurs, new business owners, established business owners) and highlight the main terminologies
concerning the entrepreneurship process under the GEM. Firstly, potential entrepreneurs are who still
only expecting to start in the near future. Secondly, the nascent entrepreneurs are people actively involved
in starting a new venture but do not pay salaries or wages for the period more than three months (Acs et
al., 2008, p.279, the GEM 2016, 21). Thirdly, new business owners are people who have moved beyond
the nascent stage and have paid salaries and wages for more than three months but less than 42 months.
GEM
Early-stage entrepreneurial activities
Represent the potential supply of entrepreneurs
WBGES
Formal business registration
Represent the actual rate of entreprenership
11
Fourthly, established business owners are individuals who run ventures for more than three and a half
years.
Under the GEM conceptual framework entrepreneurial activities are presented by three groups as the
following:
1. Total early-stage Entrepreneurial Activity (TEA) consists of nascent entrepreneurs and new
business owners. The TEA rate is the key indicator of the Global Entrepreneurship Monitor.
2. Established business ownership rate is the percentage of the adult population who are accounted
as established business owners.
3. Business discontinuation rate is the percentage of the adult population aged between 18 and 64
years (who are either a nascent entrepreneur or an owner-manager of a new business) who have, in the
past 12 months, discontinued a business, either by selling, shutting down, or otherwise discontinuing an
owner/management relationship with the business (GEM, 2016).
To conclude, within our analysis we plan to explore the effect of formal institution on the early and
mature entrepreneurial stages so that entrepreneurial data is derived from the GEM. Two entrepreneurial
indicators such as total-early stage entrepreneurial activity rate and established business ownership rate is
taken for consideration and studied.
3. Data analysis and methodology 3.1 Method
In this paper we employ descriptive statistics, statistical method of correlation and regression. We are
interested to understand which the particular institutional dimension has stronger impact to the
entrepreneurial rate either early or mature. To study the relationship between two variables, the simple
linear regression model is employed.
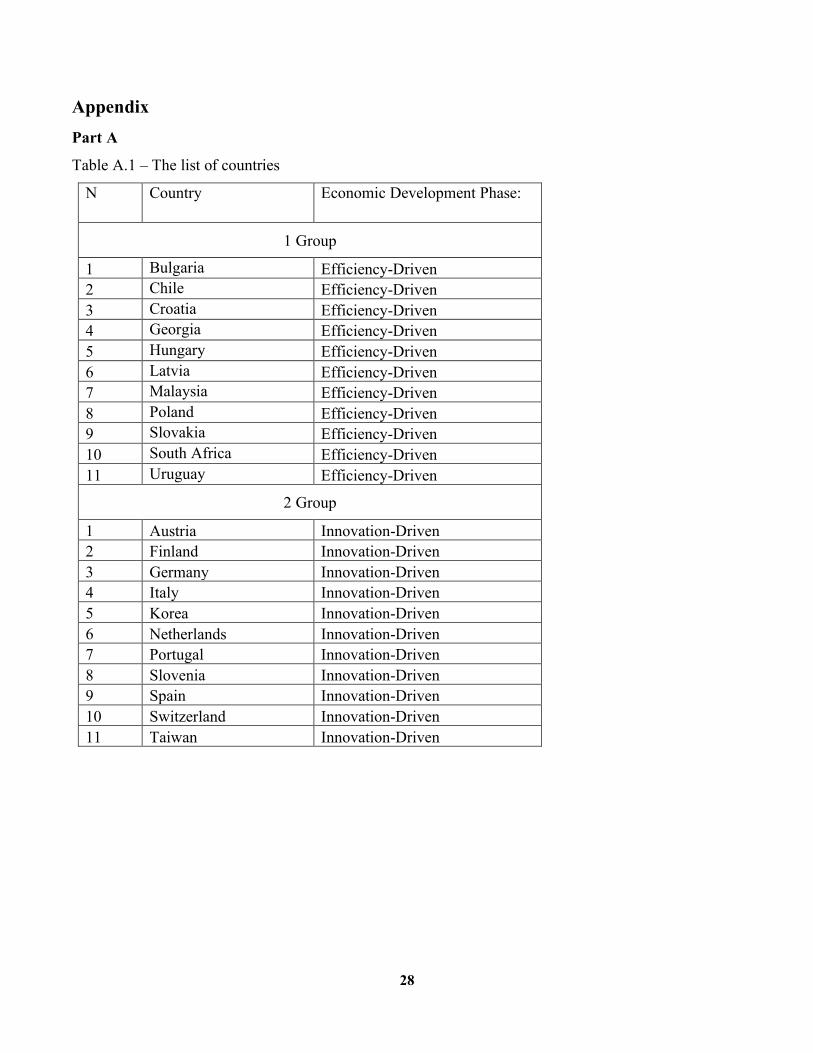
3.2 Sample
The sample of countries includes two groups of countries such as efficiency-driven and innovation-
driven. Each group consists of 11 countries from different geographic regions. The list of countries is
depicted in the Appendix (see Table A.1). Two groups of countries are expected to have two different
patterns of entrepreneurial activities and their attitude to start a business and run a business under particular
institutional conditions. It could be mentioned that countries with innovation-driven economies are the
12
most developed and they are characterized as more knowledge-intensive. Countries with an efficiency-
driven economy are located between factor-driven and innovation-driven categories. That means their
activities moved from subsistence agriculture and extraction businesses, they have more-efficient
production processes than before recently and try to increase their competitiveness in the global market.
The factor-driven economies are not included into the analysis due to the data requirement (more than 10
countries needed).
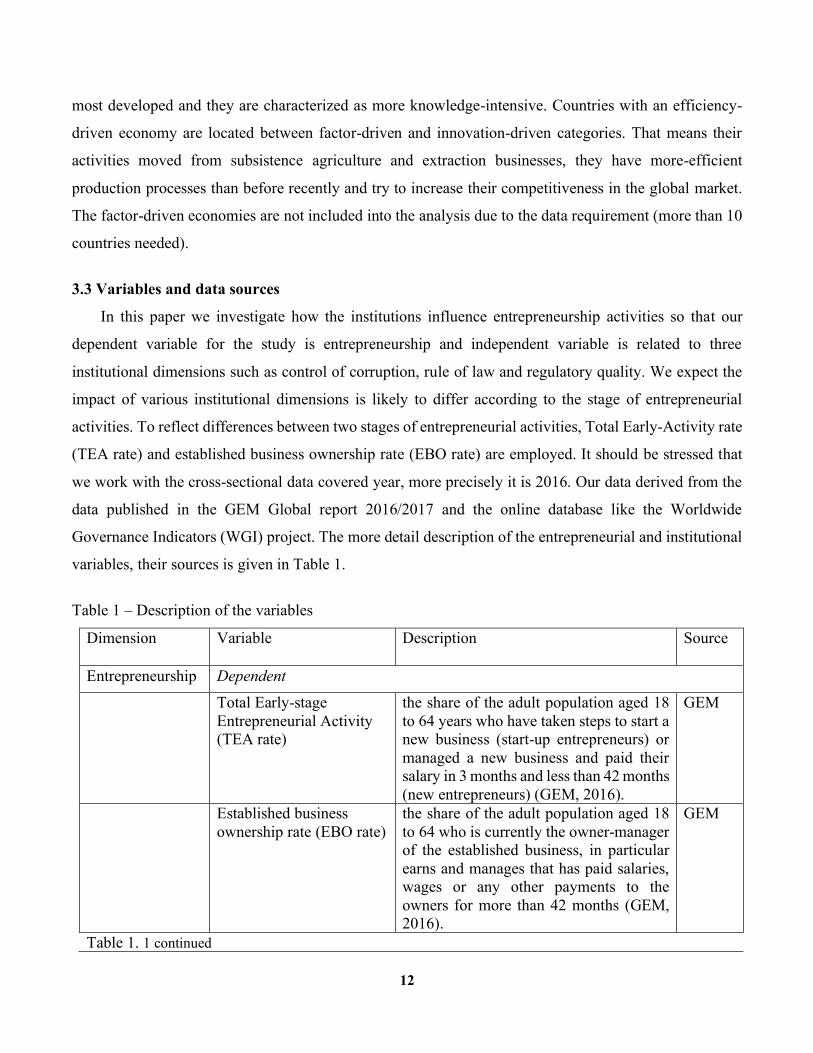
3.3 Variables and data sources
In this paper we investigate how the institutions influence entrepreneurship activities so that our
dependent variable for the study is entrepreneurship and independent variable is related to three
institutional dimensions such as control of corruption, rule of law and regulatory quality. We expect the
impact of various institutional dimensions is likely to differ according to the stage of entrepreneurial
activities. To reflect differences between two stages of entrepreneurial activities, Total Early-Activity rate
(TEA rate) and established business ownership rate (EBO rate) are employed. It should be stressed that
we work with the cross-sectional data covered year, more precisely it is 2016. Our data derived from the
data published in the GEM Global report 2016/2017 and the online database like the Worldwide
Governance Indicators (WGI) project. The more detail description of the entrepreneurial and institutional
variables, their sources is given in Table 1.
Table 1 – Description of the variables
Dimension
Variable Description Source
Entrepreneurship Dependent
Total Early-stage Entrepreneurial Activity (TEA rate)
the share of the adult population aged 18 to 64 years who have taken steps to start a new business (start-up entrepreneurs) or managed a new business and paid their salary in 3 months and less than 42 months (new entrepreneurs) (GEM, 2016).
GEM
Established business ownership rate (EBO rate)
the share of the adult population aged 18 to 64 who is currently the owner-manager of the established business, in particular earns and manages that has paid salaries, wages or any other payments to the owners for more than 42 months (GEM, 2016).
GEM
Table 1. 1 continued
13
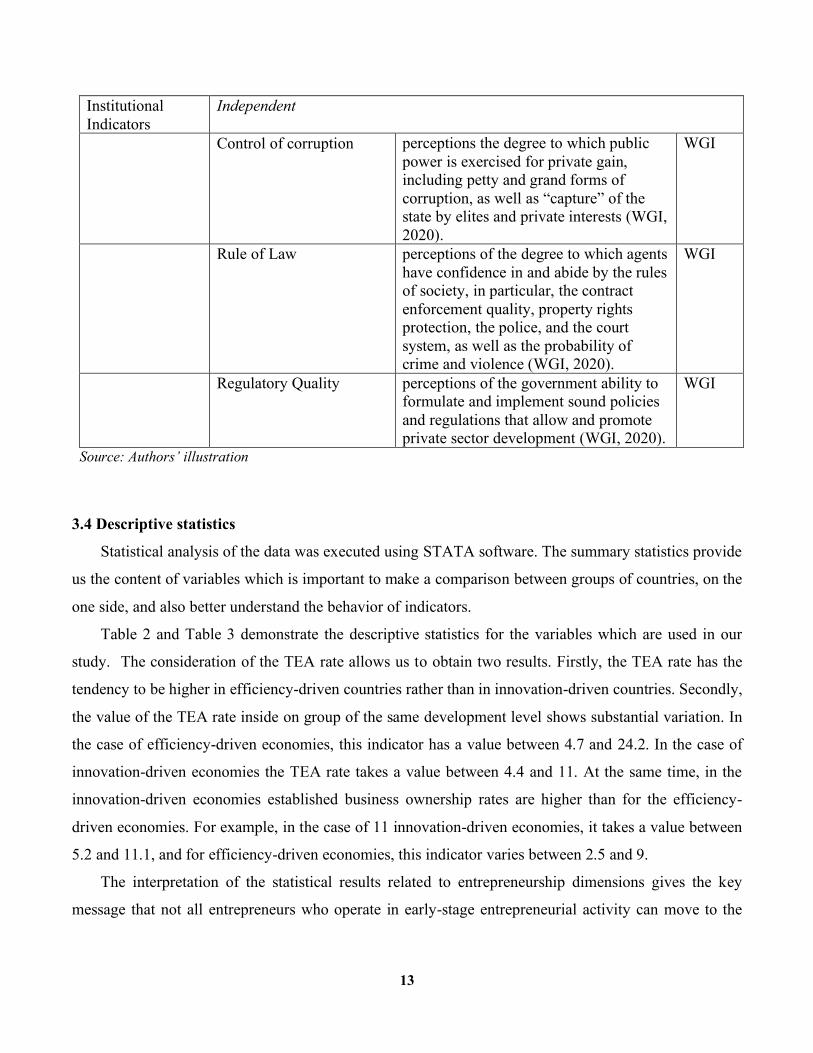
Institutional Indicators
Independent
Control of corruption perceptions the degree to which public power is exercised for private gain, including petty and grand forms of corruption, as well as “capture” of the state by elites and private interests (WGI, 2020).
WGI
Rule of Law perceptions of the degree to which agents have confidence in and abide by the rules of society, in particular, the contract enforcement quality, property rights protection, the police, and the court system, as well as the probability of crime and violence (WGI, 2020).
WGI
Regulatory Quality perceptions of the government ability to formulate and implement sound policies and regulations that allow and promote private sector development (WGI, 2020).
WGI
Source: Authors’ illustration
3.4 Descriptive statistics
Statistical analysis of the data was executed using STATA software. The summary statistics provide
us the content of variables which is important to make a comparison between groups of countries, on the
one side, and also better understand the behavior of indicators.
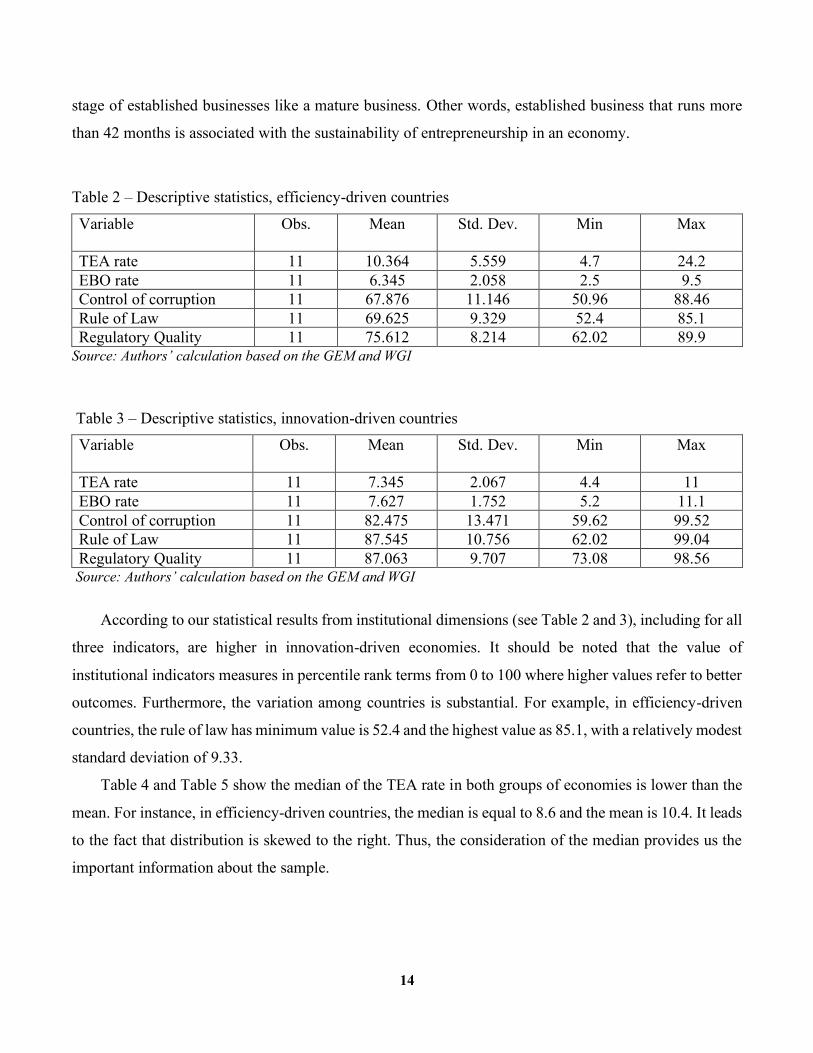
Table 2 and Table 3 demonstrate the descriptive statistics for the variables which are used in our
study. The consideration of the TEA rate allows us to obtain two results. Firstly, the TEA rate has the
tendency to be higher in efficiency-driven countries rather than in innovation-driven countries. Secondly,
the value of the TEA rate inside on group of the same development level shows substantial variation. In
the case of efficiency-driven economies, this indicator has a value between 4.7 and 24.2. In the case of
innovation-driven economies the TEA rate takes a value between 4.4 and 11. At the same time, in the
innovation-driven economies established business ownership rates are higher than for the efficiency-
driven economies. For example, in the case of 11 innovation-driven economies, it takes a value between
5.2 and 11.1, and for efficiency-driven economies, this indicator varies between 2.5 and 9.
The interpretation of the statistical results related to entrepreneurship dimensions gives the key
message that not all entrepreneurs who operate in early-stage entrepreneurial activity can move to the
14
stage of established businesses like a mature business. Other words, established business that runs more
than 42 months is associated with the sustainability of entrepreneurship in an economy.
Table 2 – Descriptive statistics, efficiency-driven countries
Variable
Obs. Mean Std. Dev. Min Max
TEA rate 11 10.364 5.559 4.7 24.2 EBO rate 11 6.345 2.058 2.5 9.5 Control of corruption 11 67.876 11.146 50.96 88.46 Rule of Law 11 69.625 9.329 52.4 85.1 Regulatory Quality 11 75.612 8.214 62.02 89.9
Source: Authors’ calculation based on the GEM and WGI Table 3 – Descriptive statistics, innovation-driven countries
Variable
Obs. Mean Std. Dev. Min Max
TEA rate 11 7.345 2.067 4.4 11 EBO rate 11 7.627 1.752 5.2 11.1 Control of corruption 11 82.475 13.471 59.62 99.52 Rule of Law 11 87.545 10.756 62.02 99.04 Regulatory Quality 11 87.063 9.707 73.08 98.56
Source: Authors’ calculation based on the GEM and WGI
According to our statistical results from institutional dimensions (see Table 2 and 3), including for all
three indicators, are higher in innovation-driven economies. It should be noted that the value of
institutional indicators measures in percentile rank terms from 0 to 100 where higher values refer to better
outcomes. Furthermore, the variation among countries is substantial. For example, in efficiency-driven
countries, the rule of law has minimum value is 52.4 and the highest value as 85.1, with a relatively modest
standard deviation of 9.33.
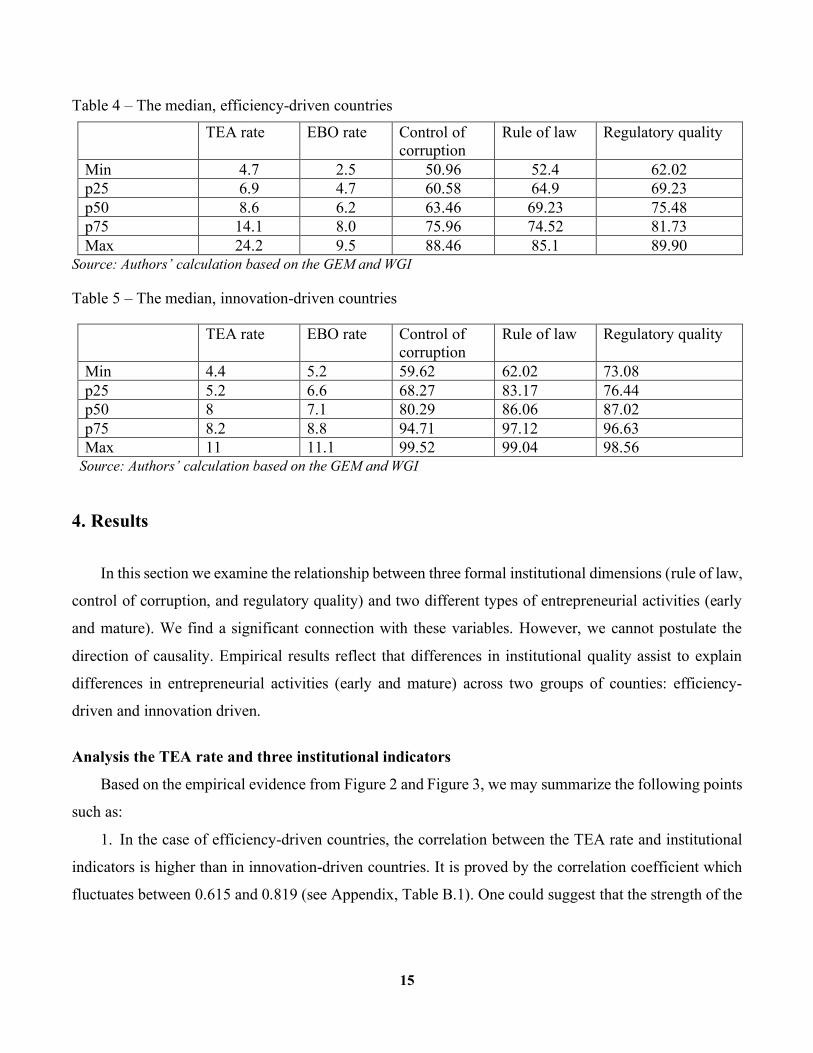
Table 4 and Table 5 show the median of the TEA rate in both groups of economies is lower than the
mean. For instance, in efficiency-driven countries, the median is equal to 8.6 and the mean is 10.4. It leads
to the fact that distribution is skewed to the right. Thus, the consideration of the median provides us the
important information about the sample.
15
Table 4 – The median, efficiency-driven countries
TEA rate EBO rate Control of corruption
Rule of law Regulatory quality
Min 4.7 2.5 50.96 52.4 62.02 p25 6.9 4.7 60.58 64.9 69.23 p50 8.6 6.2 63.46 69.23 75.48 p75 14.1 8.0 75.96 74.52 81.73 Max 24.2 9.5 88.46 85.1 89.90
Source: Authors’ calculation based on the GEM and WGI
Table 5 – The median, innovation-driven countries
TEA rate EBO rate Control of corruption
Rule of law Regulatory quality
Min 4.4 5.2 59.62 62.02 73.08 p25 5.2 6.6 68.27 83.17 76.44 p50 8 7.1 80.29 86.06 87.02 p75 8.2 8.8 94.71 97.12 96.63 Max 11 11.1 99.52 99.04 98.56
Source: Authors’ calculation based on the GEM and WGI
4. Results
In this section we examine the relationship between three formal institutional dimensions (rule of law,
control of corruption, and regulatory quality) and two different types of entrepreneurial activities (early
and mature). We find a significant connection with these variables. However, we cannot postulate the
direction of causality. Empirical results reflect that differences in institutional quality assist to explain
differences in entrepreneurial activities (early and mature) across two groups of counties: efficiency-
driven and innovation driven.
Analysis the TEA rate and three institutional indicators
Based on the empirical evidence from Figure 2 and Figure 3, we may summarize the following points
such as:
1. In the case of efficiency-driven countries, the correlation between the TEA rate and institutional
indicators is higher than in innovation-driven countries. It is proved by the correlation coefficient which
fluctuates between 0.615 and 0.819 (see Appendix, Table B.1). One could suggest that the strength of the
16
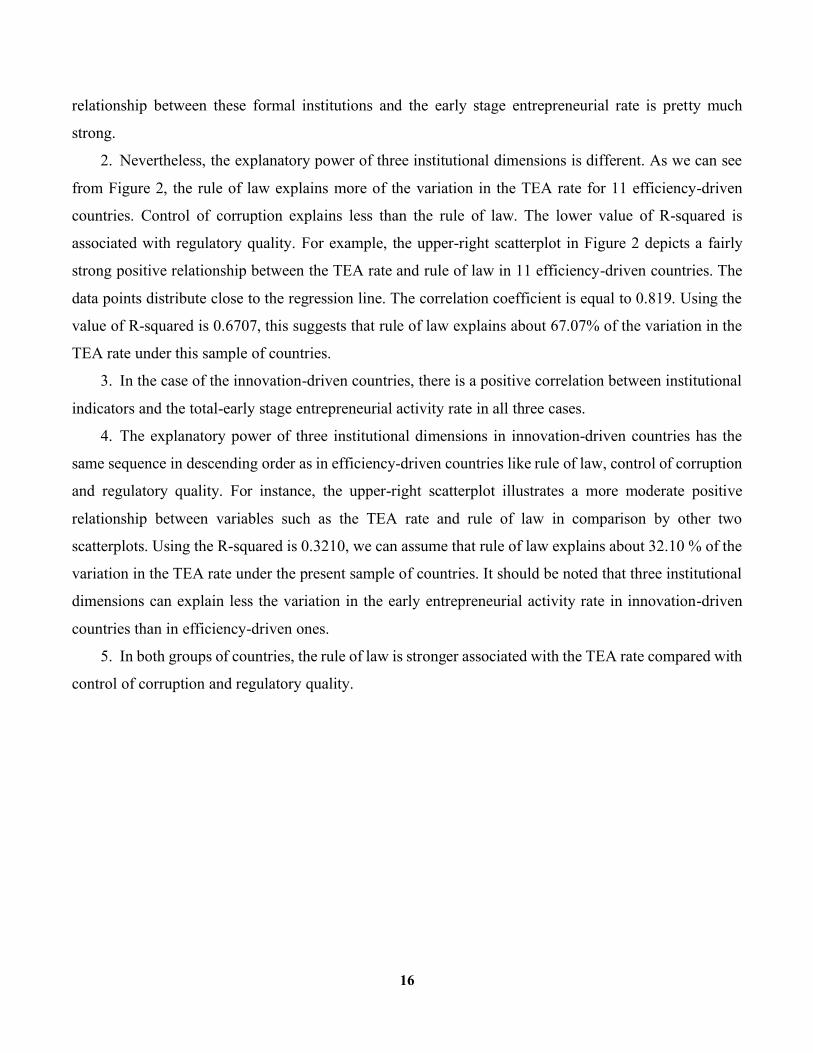
relationship between these formal institutions and the early stage entrepreneurial rate is pretty much
strong.
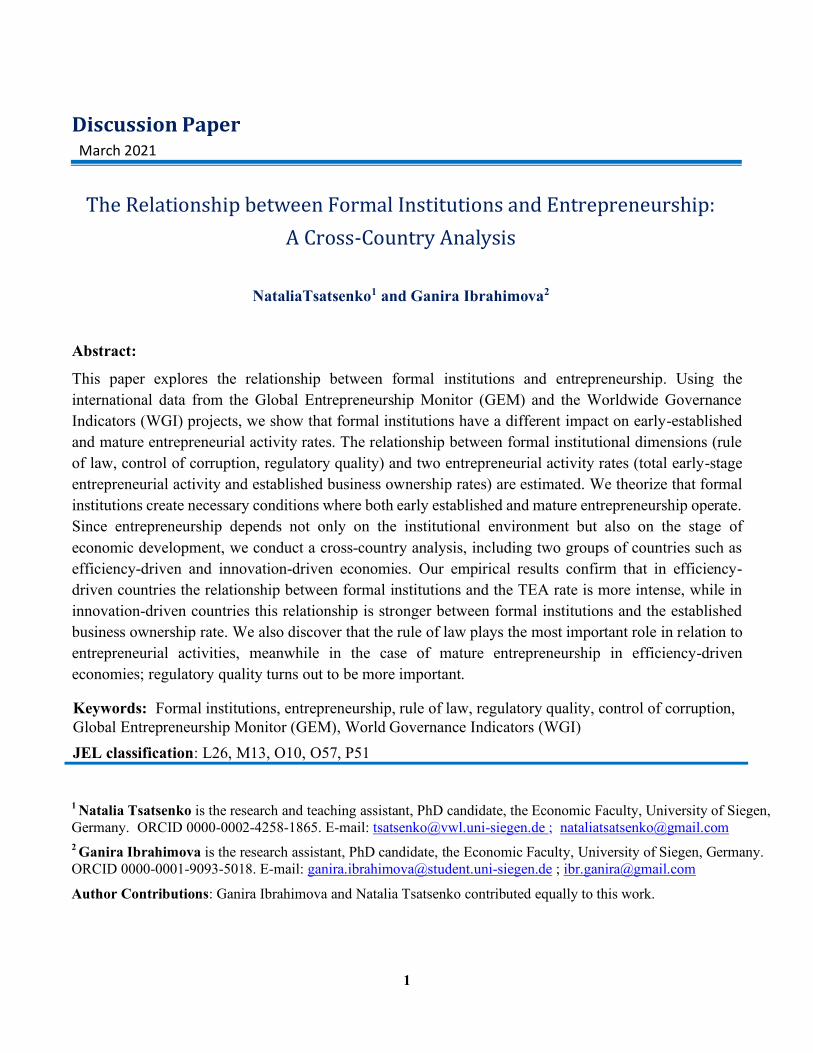
2. Nevertheless, the explanatory power of three institutional dimensions is different. As we can see
from Figure 2, the rule of law explains more of the variation in the TEA rate for 11 efficiency-driven
countries. Control of corruption explains less than the rule of law. The lower value of R-squared is
associated with regulatory quality. For example, the upper-right scatterplot in Figure 2 depicts a fairly
strong positive relationship between the TEA rate and rule of law in 11 efficiency-driven countries. The
data points distribute close to the regression line. The correlation coefficient is equal to 0.819. Using the
value of R-squared is 0.6707, this suggests that rule of law explains about 67.07% of the variation in the
TEA rate under this sample of countries.
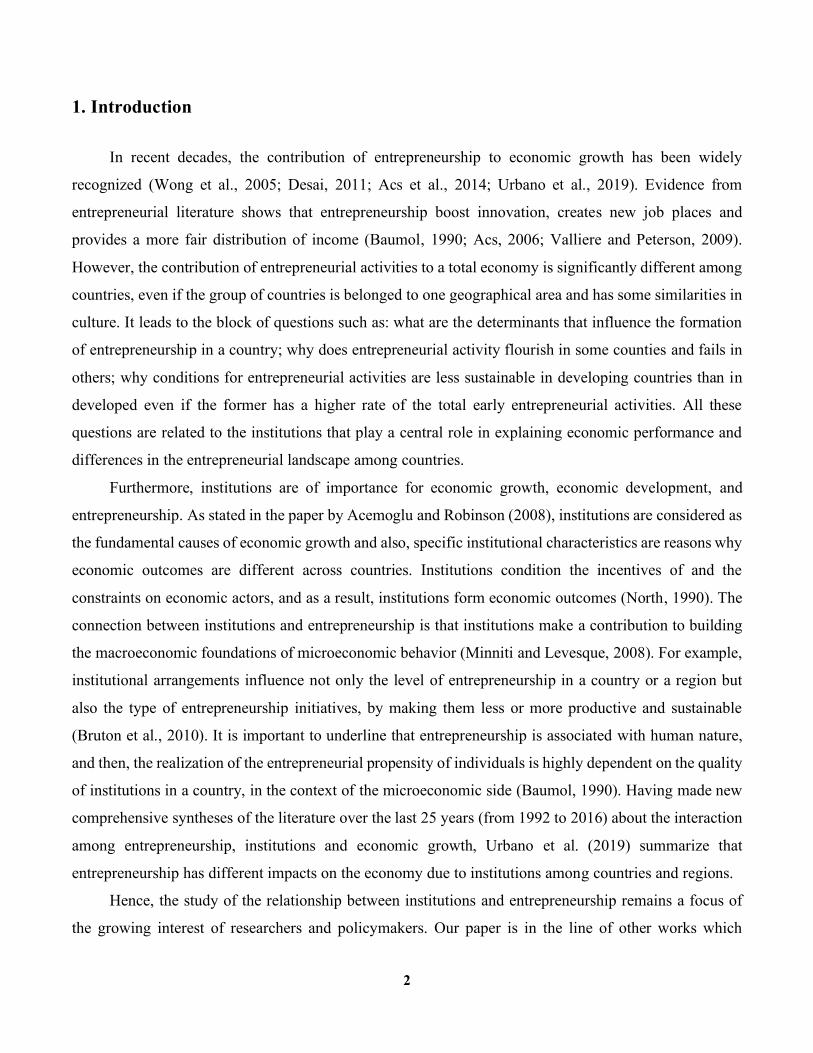
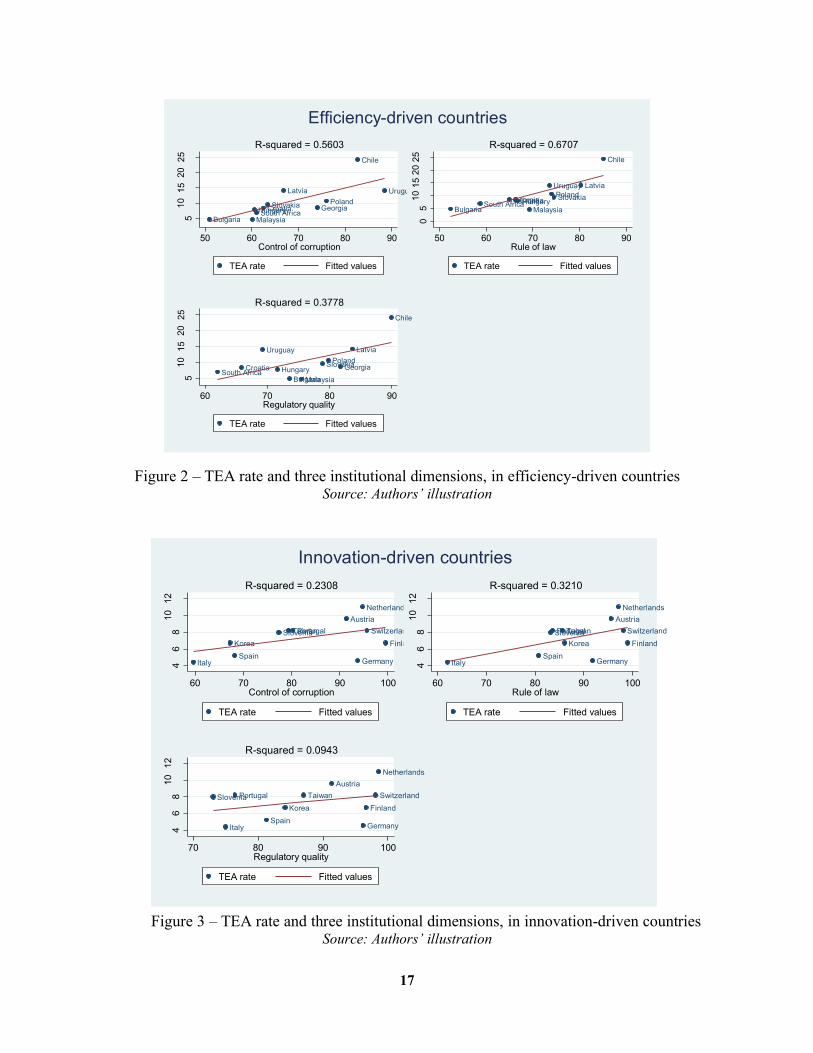
3. In the case of the innovation-driven countries, there is a positive correlation between institutional
indicators and the total-early stage entrepreneurial activity rate in all three cases.
4. The explanatory power of three institutional dimensions in innovation-driven countries has the
same sequence in descending order as in efficiency-driven countries like rule of law, control of corruption
and regulatory quality. For instance, the upper-right scatterplot illustrates a more moderate positive
relationship between variables such as the TEA rate and rule of law in comparison by other two
scatterplots. Using the R-squared is 0.3210, we can assume that rule of law explains about 32.10 % of the
variation in the TEA rate under the present sample of countries. It should be noted that three institutional
dimensions can explain less the variation in the early entrepreneurial activity rate in innovation-driven
countries than in efficiency-driven ones.
5. In both groups of countries, the rule of law is stronger associated with the TEA rate compared with
control of corruption and regulatory quality.
17
Figure 2 – TEA rate and three institutional dimensions, in efficiency-driven countries
Source: Authors’ illustration
Figure 3 – TEA rate and three institutional dimensions, in innovation-driven countries
Source: Authors’ illustration
Bulgaria
Chile
Croatia GeorgiaHungary
Latvia
Malaysia
PolandSlovakiaSouth Africa
Uruguay5
1015
2025
50 60 70 80 90Control of corruption
TEA rate Fitted values
R-squared = 0.5603
Bulgaria
Chile
CroatiaGeorgiaHungary
Latvia
Malaysia
PolandSlovakiaSouth Africa
Uruguay
05
1015
2025
50 60 70 80 90Rule of law
TEA rate Fitted values
R-squared = 0.6707
Bulgaria
Chile
Croatia GeorgiaHungary
Latvia
Malaysia
PolandSlovakiaSouth Africa
Uruguay
510
1520
25
60 70 80 90Regulatory quality
TEA rate Fitted values
R-squared = 0.3778
Efficiency-driven countries
Austria
Finland
GermanyItaly
Korea
Netherlands
PortugalSlovenia
Spain
SwitzerlandTaiwan
46
810
12
60 70 80 90 100Control of corruption
TEA rate Fitted values
R-squared = 0.2308
Austria
Finland
GermanyItaly
Korea
Netherlands
PortugalSlovenia
Spain
SwitzerlandTaiwan
46
810
12
60 70 80 90 100Rule of law
TEA rate Fitted values
R-squared = 0.3210
Austria
Finland
GermanyItaly
Korea
Netherlands
PortugalSlovenia
Spain
SwitzerlandTaiwan
46
810
12
70 80 90 100Regulatory quality
TEA rate Fitted values
R-squared = 0.0943
Innovation-driven countries
18
Analysis of established business ownership rate and three institutional indicators
Based on the empirical evidence from Figure 4 and Figure 5, we could summarize the following
results as:
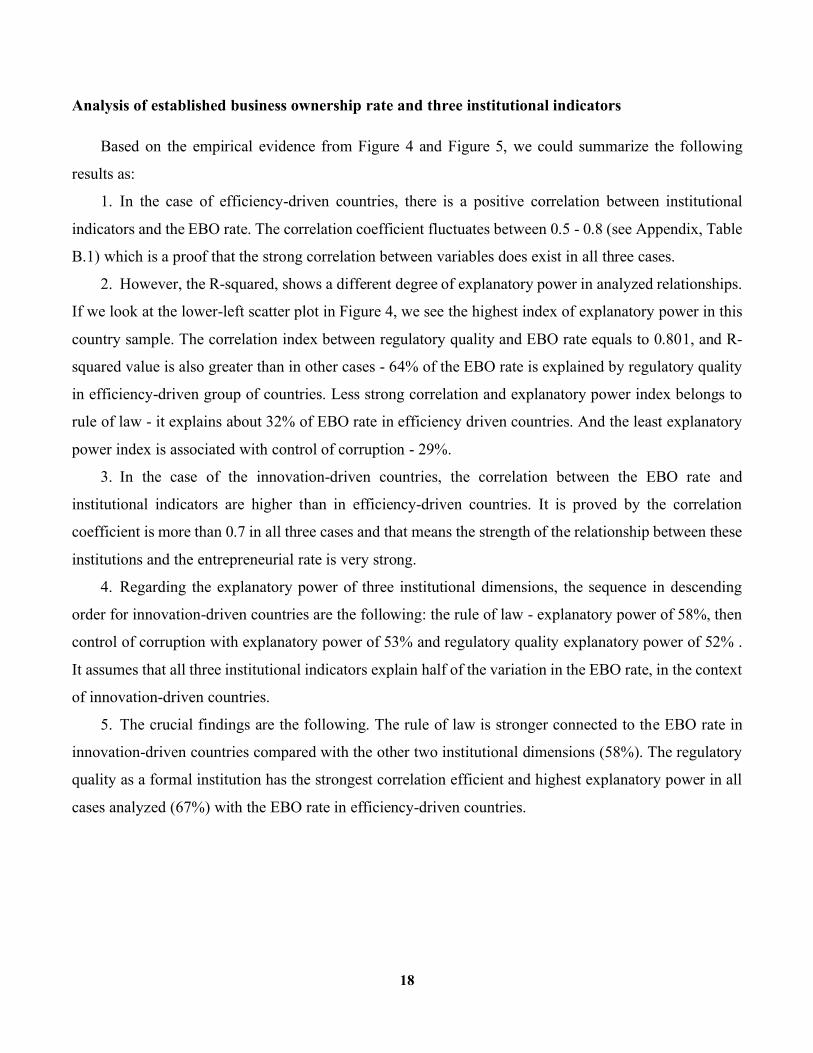
1. In the case of efficiency-driven countries, there is a positive correlation between institutional
indicators and the EBO rate. The correlation coefficient fluctuates between 0.5 - 0.8 (see Appendix, Table
B.1) which is a proof that the strong correlation between variables does exist in all three cases.
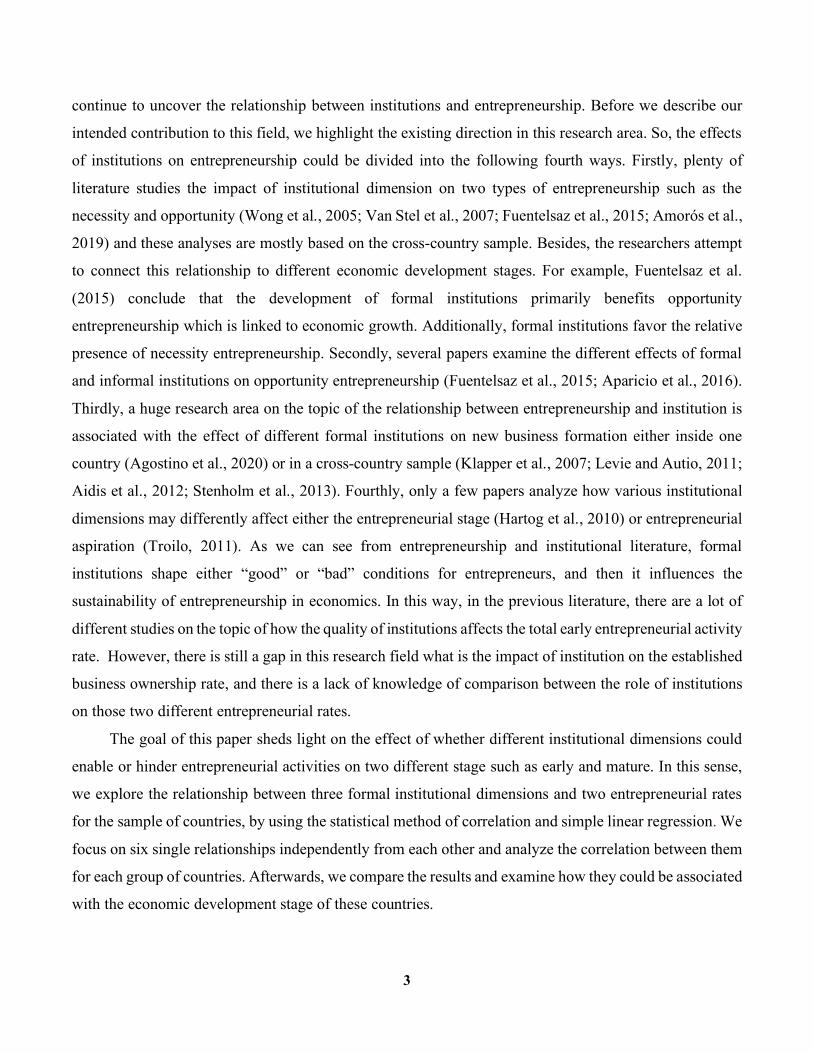
2. However, the R-squared, shows a different degree of explanatory power in analyzed relationships.
If we look at the lower-left scatter plot in Figure 4, we see the highest index of explanatory power in this
country sample. The correlation index between regulatory quality and EBO rate equals to 0.801, and R-
squared value is also greater than in other cases - 64% of the EBO rate is explained by regulatory quality
in efficiency-driven group of countries. Less strong correlation and explanatory power index belongs to
rule of law - it explains about 32% of EBO rate in efficiency driven countries. And the least explanatory
power index is associated with control of corruption - 29%.
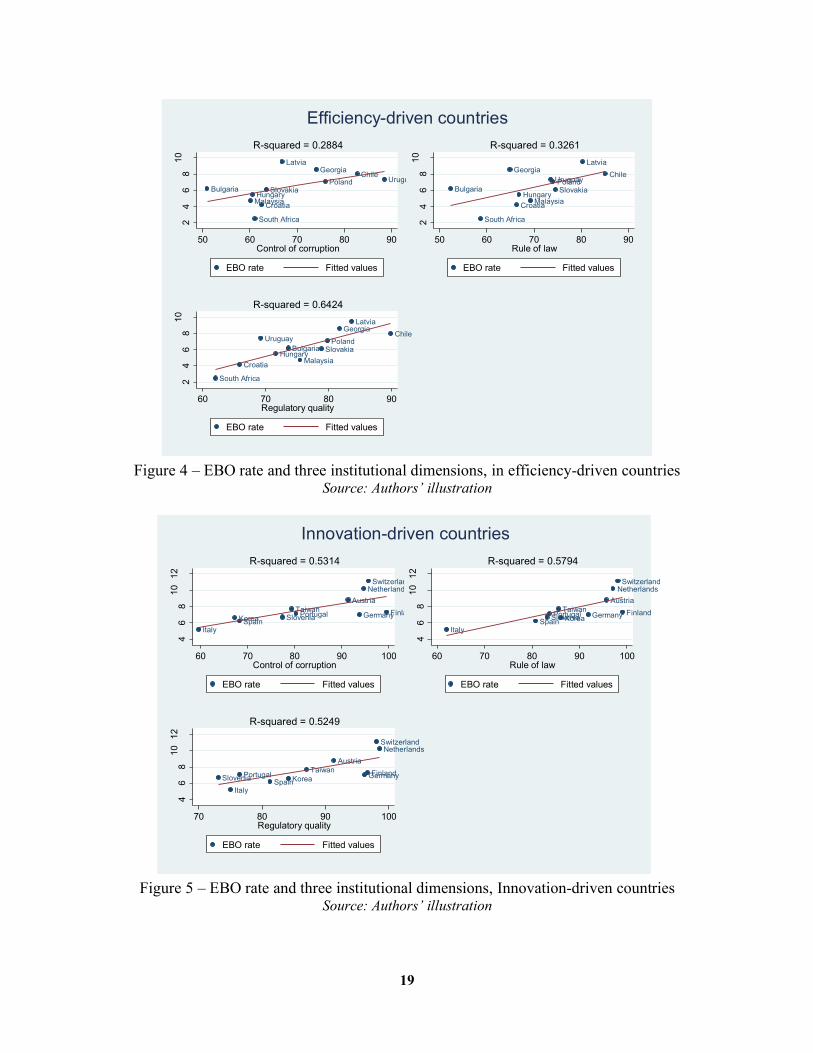
3. In the case of the innovation-driven countries, the correlation between the EBO rate and
institutional indicators are higher than in efficiency-driven countries. It is proved by the correlation
coefficient is more than 0.7 in all three cases and that means the strength of the relationship between these
institutions and the entrepreneurial rate is very strong.
4. Regarding the explanatory power of three institutional dimensions, the sequence in descending
order for innovation-driven countries are the following: the rule of law - explanatory power of 58%, then
control of corruption with explanatory power of 53% and regulatory quality explanatory power of 52% .
It assumes that all three institutional indicators explain half of the variation in the EBO rate, in the context
of innovation-driven countries.
5. The crucial findings are the following. The rule of law is stronger connected to the EBO rate in
innovation-driven countries compared with the other two institutional dimensions (58%). The regulatory
quality as a formal institution has the strongest correlation efficient and highest explanatory power in all
cases analyzed (67%) with the EBO rate in efficiency-driven countries.
19
Figure 4 – EBO rate and three institutional dimensions, in efficiency-driven countries
Source: Authors’ illustration
Figure 5 – EBO rate and three institutional dimensions, Innovation-driven countries
Source: Authors’ illustration
Bulgaria
Chile
Croatia
Georgia
Hungary
Latvia
Malaysia
PolandSlovakia
South Africa
Uruguay2
46
810
50 60 70 80 90Control of corruption
EBO rate Fitted values
R-squared = 0.2884
Bulgaria
Chile
Croatia
Georgia
Hungary
Latvia
Malaysia
PolandSlovakia
South Africa
Uruguay
24
68
10
50 60 70 80 90Rule of law
EBO rate Fitted values
R-squared = 0.3261
Bulgaria
Chile
Croatia
Georgia
Hungary
Latvia
Malaysia
PolandSlovakia
South Africa
Uruguay
24
68
10
60 70 80 90Regulatory quality
EBO rate Fitted values
R-squared = 0.6424
Efficiency-driven countries
AustriaFinlandGermany
ItalyKorea
Netherlands
PortugalSloveniaSpain
Switzerland
Taiwan
46
810
12
60 70 80 90 100Control of corruption
EBO rate Fitted values
R-squared = 0.5314
AustriaFinlandGermany
ItalyKorea
Netherlands
PortugalSloveniaSpain
Switzerland
Taiwan
46
810
12
60 70 80 90 100Rule of law
EBO rate Fitted values
R-squared = 0.5794
AustriaFinlandGermany
ItalyKorea
Netherlands
PortugalSlovenia Spain
Switzerland
Taiwan
46
810
12
70 80 90 100Regulatory quality
EBO rate Fitted values
R-squared = 0.5249
Innovation-driven countries
20
5. Discussion
The main question of our research is to shed some light on the question of how the institutional context
influences the development of entrepreneurship. Based on that research goal, we selected three
institutional and two entrepreneurial indicators. In this section, we discuss our empirical results, obtained
by using the linear regression and correlation analysis, and then we make a comparison of the results
between two groups of countries. Evidence from our empirical results allows us to find out two different
tendencies. On the one hand, in efficiency-driven countries, the TEA rate is more correlated to institutions
than the EBO rate (especially regulatory quality). On the other hand, in innovation-driven countries, the
EBO rate is more correlated to institutions than with the TEA rate (especially rule of law).
The crucial part of our analysis was to evaluate whether formal institutions have the same impact on
innovation-driven (mostly developed countries) and efficiency-driven countries (mostly developing
countries). Before we move to our findings concerning the relationship between institutions and
entrepreneurial activities, we discuss the specific aspects regarding the TEA rate and the EBO rate. As it
was stated in various papers, namely, in the paper of Urbano et al. (2019) and Desai (2011), countries with
the similar economic development stage differ in the rate of the entrepreneurial activities and level of
institutional indicators. In this sense, efficiency-driven countries are more heterogeneous compared with
innovation-driven.
It is important to underline that the GEM shows an economy could have a large number of potential
and nascent entrepreneurs, but this amount will not be transformed directly to a high number of established
firms that will be sustainable for a long time. It is expected that TEA rates are usually high in emerging
economies, but established business ownership rate is usually low (GEM, 2019). Moreover, in developing
countries there is a high rate of entrepreneurship, namely, the growth of new enterprises and a high
proportion of startups. However, a much smaller percentage of such start-ups in developing efficiency-
driven countries than in developed innovative-driven countries can become fast-growing firms and stay
in the market, resulting in significant contribution to added value. It could be explained by the fact that a
high proportion of entrepreneurial initiatives in innovation-driven countries are initiated by opportunities
that indeed make a contribution to total economic growth (Amorós, 2009). Our two random samples of
countries confirm this assumption (see Table 6).
21
Table 6 – Relationship between TEA rate & the EBO rate and economic development level
TEA rate in the Efficiency-driven countries > TEA rate in the Innovation-driven countries
EBO rate in the Efficiency-driven countries < EBO rate in the Innovation-driven countries
Source: Author’s illustration
Hence, two crucial entrepreneurial indicators such as the total early-stage entrepreneurship and
established entrepreneurship level is very important for a better understanding of the role of
entrepreneurial activity in the economy. The TEA rate reflects the situation on new firms' registration,
bureaucracy and different procedures to start the business; while the EBO rate reflects the sustainability
of the business in the economy.
After we carefully analyzed many research papers, dedicated to this important topic, we suggest that
institutions are equally important for all countries, but they have different impact from economy to
economy due to the different historical and cultural backgrounds of institutions, and the period of time
during which they have existed since then. Moreover, differences in institutional quality help to ascertain
the differences in entrepreneurship between efficiency-and innovation-driven countries (Amorós, 2009).
On the one hand, in efficiency-driven countries, the TEA rate is stronger connected to formal institutions
than the EBO rate. This could indicate that institutions have more restrictive effect on total early
entrepreneurial rate in developing countries. In addition, it could reflect that institutional system in these
countries is quite young, so it affects mostly newly established businesses. On the other hand, in
innovation-driven countries the EBO rate is stronger associated with these three formal institutions than
the TEA rate. This might demonstrate the long-term historical interaction between institutions and
entrepreneurship in developed countries. It might also depict less institutional restrictions and favorable
conditions for total early stage entrepreneurial activities, such as start-ups and business incubators. Hence,
newly established business contributes significantly to economic growth in these countries.
We discover that the institutional dimension with the highest correlation coefficient to entrepreneurial
activity is the institution of Rule of Law. Note that this indicates very “healthy” interaction between
entrepreneurs and the legislation system. The rule of law includes fundamental variables for business
activity such as property rights protection and contract enforcement mechanism, as well as the court
system, responsible for the solution of the occurring problems. This institutional dimension reflects the
ability of the business to define property rights, to acquire or to dispose of the property as a result of
business transactions on conditions fixed in a business contract.
22
If the contract is not implemented by one of the sides, the police and the judicial system included in
this mechanism will intervene. In other words, the institution of the rule of law ensures the necessary
legislative framework for the functioning of a business.
The second position fairly belongs to the Control of Corruption. It is also strongly correlated with
entrepreneurial activity in all our studied cases. That institution comprises such variables as the level of
transparency, the corruption level, trust in politicians, bribes and capture of the state by elites. This
institution impacts both the TEA and EBA rates, because corruption may create information asymmetries,
and as a result uncertainty, which has a negative effect on the business climate. Besides, in all the
mentioned cases of corruption, there could be hidden barriers for “outsiders” to enter the market (capture
of the state by the elite), as well as some corruption barriers such as transactional costs of “bribes” that
make problems for established entrepreneurship (bribes to government officials).
The institution of Regulatory Quality has the least impact on entrepreneurial activity in all cases,
except the EBO rate in efficiency-driven countries. The key finding is that the mature entrepreneurial
activity in this group of countries has the strongest correlation with the regulatory quality compared with
the rule of law and control of corruption. This leads to the assumption that mature established business is
very sensitive to the regulatory quality institution, as it contains all necessary conditions for the business
environment. Variables included in this institutional indicator are an investment and financial freedom,
market conditions, taxes, ease of starting a business, etc. In developing countries, established business is
very reactive to existing unfavorable business conditions. In this sense, financial freedom might mean low
or no access to financial funds to start a business; bank loans are extremely high and unaffordable for
entrepreneurs. Market conditions are also not favorable for the business. For instance, there may be unfair
competitive practices, price controls and market monopolization cases, because anti-monopolistic
regulations are weak. Other regulatory quality problems, that mature established business in efficiency-
driven countries face, are discriminatory tariffs and taxes which can become unbearable regulatory
burdens.
6. Conclusion
In this paper we contribute to the understanding of the impact of the particular institutional
dimensions on the early and mature entrepreneurial activity. Our contribution to this topic consists of two
steps. Firstly, we focus our attention on the selected set of institutional dimensions such as rule of law,

23
control of corruption and regulatory quality. We investigate how particular institutional dimension affect
the different entrepreneurial activity rates. Hence, our analysis includes six institution-entrepreneurship
relationships for each group of countries, so that we test three institutional dimensions with two
entrepreneurial rates. We suggest that not all formal institutions from our set influence the level of
entrepreneurship equally. It could be summarized, that formal institution may play an important role in
understanding the early and mature entrepreneurial rates, and they have an impact on entrepreneurial
activity in different scales. Secondly, we analyze two groups of countries from different development
stages and compare their results. Our findings are that the institutional dimensions are correlated to
different entrepreneurial activity rates, depending on the economic development stage. This supposes that
better quality of institutions provides a more sustainable entrepreneurial ecosystem in the country.
The implication of our research paper intends to improve the entrepreneurial landscape. The
comparison of institutional impact on early and mature entrepreneurial rates by using a simple linear
regression model provides a basis for further sophisticated empirical investigation. The main message of
this paper is that various formal institutions such as rule of law, control of corruption or regulatory quality
have a heterogeneous effect on the total-early entrepreneurial rate and established business ownership
rate.
Acknowledgements: We gratefully acknowledge the support and the guidance of Prof. Dr. Friederike Welter (University of Siegen and the Institut für Mittelstandsforschung (IfM) Bonn). We also would like to greatly thank for helpful comments Ph.D. Sebastian Aparicio, Assistant Professor of Entrepreneurship (Durham University Business School).
References
1. Acemoglu, Daron, and James Robinson. 2008. The Role of Institutions in Growth and Development. Working Paper no. 10, Washington, DC: The World Bank (On behalf of the Commission on Growth and Development).
2. Ackerman, John. 2004. Co-governance for accountability: beyond “exit” and “voice”. World Development, 32(3), 447-463. doi.org/10.1016/j.worlddev.2003.06.015.
3. Acs, Zoltan J. 2006. Start-ups and entry barriers: Small and medium-sized firms population dynamics. The Oxford handbook of entrepreneurship. DOI: 10.1093/oxfordhb/9780199546992.003.0008
24
4. Acs, Zoltan J., Erkko Autio, and László Szerb. 2014. National systems of entrepreneurship: Measurement issues and policy implications. Research Policy, 43(3), 476–494. doi.org/10.1016/j.respol.2013.08.016
5. Acs, Zoltan J., Sameeksha Desai, and Leora F. Klapper. 2008. What does „entrepreneurship” data really show? Small Business Economics, 31, 265 – 281. doi 10.1007/sl 1187-008-9137-7
6. Agostino, Mariarosaria, et al. 2020. Rule of law and regulatory quality as drivers of entrepreneurship. Regional Studies, 1–13. doi.org/10.1080/00343404.2019.1648785
7. Ahmad, Nadim and Richard G. Seymour. 2008. Defining entrepreneurial activity: Definitions supporting frameworks for data collection. OECD Statistics Working Paper. doi.org/10.2139/ssrn.1090372.
8. Aidis, Ruta, Saul Estrin, and Tomasz Marek Mickiewicz. 2012. Size matters: entrepreneurial entry and government. Small Business Economics, 39(1), 119–139. DOI 10.1007/s11187-010-9299-y
9. Amorós, José Ernesto, et al. 2019. Necessity or opportunity? The effects of State fragility and economic development on entrepreneurial efforts. Entrepreneurship Theory and Practice, 43(4), 725–750. doi.org/10.1177/1042258717736857
10. Amorós, José Ernesto. 2009. Entrepreneurship and quality of institutions: A developing-country approach. WIDER Research Paper No. 2009/07. 1-23.
11. Aparicio, Sebastian, David Urbano, and David Audretsch. 2016. Institutional factors, opportunity entrepreneurship and economic growth: Panel data evidence. Technological Forecasting and Social Change, 102, 45-61. doi.org/10.1016/j.techfore.2015.04.006
12. Barley, Stephen R., and Pamela S. Tolbert. 1997. Institutionalization and structuration: Studying the links between action and institution. Organization studies. 18(1), 93-117.
13. Baumol, William J. 1990. Entrepreneurship: productive, unproductive and destructive. Journal of Political Economy, 98, 893–921.
14. Bruton, Garry D., David Ahlstrom, and Han–Lin Li. 2010. Institutional theory and entrepreneurship: where are we now and where do we need to move in the future?. Entrepreneurship Theory and Practice, 34(3), 421–440. doi.org/10.1111/j.1540-6520.2010.00390.x
15. Casson, Mark C., Marina Della Giusta, and Uma S. Kambhampati. 2010. Formal and informal institutions and development. World Development. 38(2), 137-141. doi.org/10.1016/j.worlddev.2009.10.008
16. Chang, Ha-Joon, and Peter Evans. 2005. The role of institutions in economic change. Reimagining growth. 99-129.
17. Desai, Sameeksha. 2011. Measuring entrepreneurship in developing countries. In Entrepreneurship and economic development, London: Palgrave Macmillan. 94-107.
25
18. Fuentelsaz, Lucio, et al. 2015. How different formal institutions affect opportunity and necessity entrepreneurship. BRQ Business Research Quarterly, 18(4), 246–258. doi.org/10.1016/j.brq.2015.02.001
19. GEM. 2014. Global Entrepreneurship monitor 2013 Global Report Fifteen Years of Assessing Entrepreneurship Across the Globe by José Ernesto Amorós and Niels Bosma. Available at: https://www.gemconsortium.org/report. (last accessed 15 April 2020).
20. GEM. 2016. The Global Entrepreneurship Monitor Report 2016/2017. Available at: https://www.gemconsortium.org/report (last accessed 15 April 2020)
21. GEM. 2019. How GEM defines entrepreneurship. Available at: https://www.gemconsortium.org/wiki/1149 (last accessed 15 April 2020).
22. GEM. 2020. How GEN defines entrepreneurship. Available at: https://www.gemconsortium.org/wiki/1149 (last accessed 15 April 2020).
23. Gneezy, Uri, and Aldo Rustichini. 2000. A fine is a price. The Journal of Legal Studies. 29(1), 1-17.
24. Greif, Avner. 2006. Institutions and the path to the modern economy: Lessons from medieval trade. Cambridge University Press.
25. Grindle, Merilee S. 2004. Good enough governance: poverty reduction and reform in developing countries. Governance. 17 (4), 525-548. doi.org/10.1111/j.0952-1895.2004.00256.x
26. Hartog, Chantal, André Van Stel, and David J. Storey. 2010. Institutions and entrepreneurship: The role of the rule of law. Research Report H201003, Zoetermeer, Netherlands: EIM.
27. Johnson, Simon, Daniel Kaufmann, and Andrei Shleifer. 1997. Politics and entrepreneurship in transition economies. Working Paper. No 57. William Davidson Institute: University of Michigan. doi.org/10.2139/ssrn.1117620
28. Kaufmann, Daniel, Aart Kraay, and Massimo Mastruzzi. 2008. Governance matters VII: aggregate and individual governance indicators 1996-2007. The World Bank. doi 10.1596/1813-9450-4978
29. Kaufmann, Daniel, Aart Kraay, and Massimo Mastruzzi. 2010. The Worldwide Governance Indicators: Methodology and Analytical Issues. World Bank. Policy Research Working Paper. No. 5430. Washington, DC: The World Bank.
30. Kaufmann, Daniel, Aart Kraay, and Pablo Zoido. 1999. Governance matters. World Bank policy research working paper, (2196). doi: 10.1596/1813-9450-2196
31. Klapper, Leora, et al. 2007. Entrepreneurship and firm formation across countries. Policy Research Working paper 4313. The World Bank.
32. Klapper, Leora. 2006. Entrepreneurship: how much does the business environment matter?. The World Bank Viewpoint. Note, 313.
26
33. Knowles, Stephen, and Clayton Weatherston. 2006. Informal institutions and cross-country income differences. Credit Research Paper, No. 06/06.
34. Leftwich, Adrian, and Kunal Sen. 2010. Beyond institutions: Institutions and organizations in the politics and economics of poverty reduction–Thematic synthesis of research evidence." IPPG Research Consortium on Improving Institutions for Pro-Poor Growth, University of Manchester.
35. Leftwich, Adrian. 2010. Beyond institutions: rethinking the role of leaders, elites and coalitions in the institutional formation of developmental states and strategies. Forum for Development Studies. 37 (1). doi.org/10.1080/08039410903558327
36. Levie, Jonathan, and Erkko Autio. 2011. Regulatory burden, rule of law, and entry of strategic entrepreneurs: An international panel study. Journal of Management Studies, 48(6), 1392–1419. doi.org/10.1111/j.1467-6486.2010.01006.x
37. Minniti, Maria, and Moren Lévesque. 2008. Recent developments in the economics of entrepreneurship. Journal of Business Venturing. 23, 603–612. doi.org/10.1016/j.jbusvent.2008.01.001
38. North, Douglass C. 1990. Institutions, Institutional Change and Economic Performance. Cambridge University Press: Cambridge. doi.org/10.1017/CBO9780511808678
39. North, Douglass C. 1991. Institutions. The Journal of Economic Perspectives, 5(1), 97–112. doi 10.1257/jep.5.1.97
40. North, Douglass C., John Joseph Wallis, and Barry R. Weingast. 2009. Violence and social orders: A conceptual framework for interpreting recorded human history. Cambridge University Press.
41. North, Douglass C., John Joseph Wallis, Steven B. Webb, and Barry R. Weingast. 2013. In the shadow of violence: Politics, economics, and the problems of development. Cambridge University Press.
42. Sobel, Russell S. 2008. Testing Baumol: Institutional quality and the productivity of entrepreneurship. Journal of Business Venturing. 23(6). 641-655. doi.org/10.1016/j.jbusvent.2008.01.004
43. Stenholm, Pekka, Zoltan J. Acs, and Robert Wuebker. 2013. Exploring country-level institutional arrangements on the rate and type of entrepreneurial activity. Journal of Business Venturing, 28(1), 176–193. doi.org/10.1016/j.jbusvent.2011.11.002
44. Svensson, Jakob. 2005. Eight questions about corruption. Journal of economic perspectives 19(3). 19-42. DOI: 10.1257/089533005774357860
45. Troilo, Michael. 2011. Legal institutions and high-growth aspiration entrepreneurship. Economic Systems, 35(2), 158–175. doi.org/10.1016/j.ecosys.2010.08.001
27
46. Urbano, David, Sebastian Aparicio, and David Audretsch. 2019. Twenty-five years of research on institutions, entrepreneurship, and economic growth: what has been learned?. Small Business Economics, 53(1), 21–49. doi.org/10.1007/s11187-018-0038-0
47. Valliere, Dave, and Rein Peterson. 2009. Entrepreneurship and economic growth: Evidence from emerging and developed countries. Entrepreneurship & Regional Development, 21(5-6), 459–480. doi: 10.1080/08985620802332723
48. Van Stel, André, David J. Storey, and A. Roy Thurik. 2007. The effect of business regulations on nascent and young business entrepreneurship. Small Business Economics, 28(2-3), 171–186. doi.org/10.1007/s11187-006-9014-1
49. Van Stel, André. 2006. Total Entrepreneurial Activity Rates and Economic Growth. Empirical Analysis of Entrepreneurship and Economic Growth, New York, NY: Springer, ISBN: 0-387-27963-6, 145–160.
50. WGI. 2020. The Worldwide Governance Indicators. Methodology. Online Database. Available at: https://info.worldbank.org/governance/wgi/ (last accessed 15 April 2020)
51. Wong, Poh Kam, Yuen Ping Ho, and Erkko Autio. 2005. Entrepreneurship, innovation and economic growth: Evidence from GEM data. Small Business Economics, 24(3), 335–350. doi.org/10.1007/s11187-005-2000-1.
28
Appendix Part A
Table A.1 – The list of countries
N Country Economic Development Phase:
1 Group
1 Bulgaria Efficiency-Driven 2 Chile Efficiency-Driven 3 Croatia Efficiency-Driven 4 Georgia Efficiency-Driven 5 Hungary Efficiency-Driven 6 Latvia Efficiency-Driven 7 Malaysia Efficiency-Driven 8 Poland Efficiency-Driven 9 Slovakia Efficiency-Driven 10 South Africa Efficiency-Driven 11 Uruguay Efficiency-Driven
2 Group
1 Austria Innovation-Driven 2 Finland Innovation-Driven 3 Germany Innovation-Driven 4 Italy Innovation-Driven 5 Korea Innovation-Driven 6 Netherlands Innovation-Driven 7 Portugal Innovation-Driven 8 Slovenia Innovation-Driven 9 Spain Innovation-Driven 10 Switzerland Innovation-Driven 11 Taiwan Innovation-Driven
29
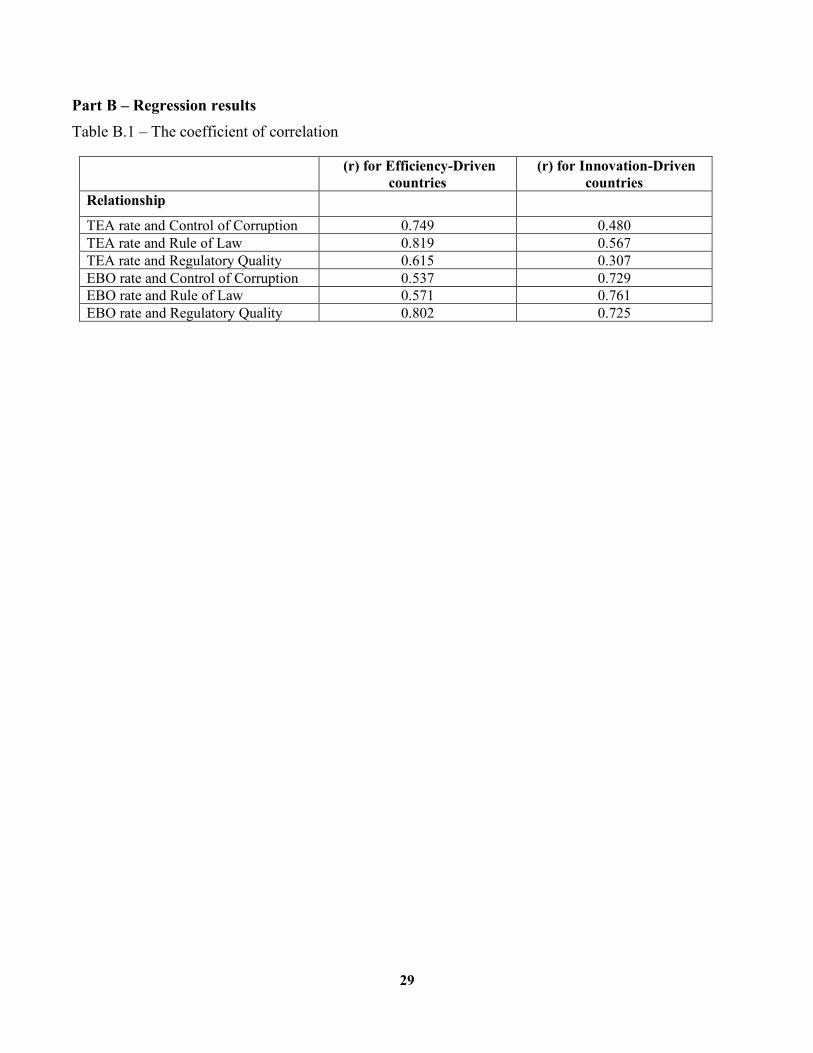
Part B – Regression results Table B.1 – The coefficient of correlation
(r) for Efficiency-Driven countries
(r) for Innovation-Driven countries
Relationship
TEA rate and Control of Corruption 0.749 0.480 TEA rate and Rule of Law 0.819 0.567 TEA rate and Regulatory Quality 0.615 0.307 EBO rate and Control of Corruption 0.537 0.729 EBO rate and Rule of Law 0.571 0.761 EBO rate and Regulatory Quality 0.802 0.725