The Relationship Between English Language …The Relationship Between English Language Literacy and...
44
The Relationship Between English Language Literacy and ELL Student Academic Performance in Mathematics _________________________ A Special Project Presented to Dr. Peter Dallas Finch Heritage University _________________________ In Partial Fulfillment of the Requirement for the Degree of Master of Education _________________________ Molly Lawson May 2017
Transcript of The Relationship Between English Language …The Relationship Between English Language Literacy and...
The Relationship Between English Language Literacy and
ELL Student Academic Performance in Mathematics
_________________________
A Special Project
Presented to
Dr. Peter Dallas Finch
Heritage University
_________________________
In Partial Fulfillment
of the Requirement for the Degree of
Master of Education
_________________________
Molly Lawson
May 2017

ii
FACULTY APPROVAL
The Relationship Between English Language Literacy and
ELL Student Academic Performance in Mathematics
Approved by Committee:
Program Department Chair Signature Date
Faculty Advisor Signature Date
Research Faculty Signature Date

iii
ABSTRACT
This quantitative study used regression analysis to investigate the correlation of limited
language proficiency and the performance of English Language Learner (ELL) students on two
commonly used math assessments, namely the Smarter Balanced Assessment Consortium
(SBAC) and the Measures of Academic Progress (MAP). Scores were analyzed for eighth grade
ELL students (N = 30) from a rural farming community in Central Washington State. The
Washington English Language Proficiency Assessment (WELPA) was used as the independent
variable for reading, writing, listening, and speaking. The study found a strong correlation
between reading and writing and student math scores, and, a correlation of lesser magnitude
between student abilities in listening and speaking and their performance on the math
assessments. All findings were statistically significant (t-test < .05). Results from the study
strongly suggest that the achievement gap within our schools today needs to be analyzed and
evaluated with the importance of literacy and its impact on all content areas. The results of this
study should be used to encourage every educator to recognize the importance of language
acquisition strategies for English Language Learners so that students can maximize their
potential and successfully transition to their next level of learning.

iv
PERMISSION TO STORE
I, Molly Lawson, hereby irrevocably consent and authorize Heritage University Library to file
the Special Project entitled, The Relationship Between English Language Literacy and
ELL Student Academic Performance in Mathematics, and make such Project available for the
use, circulation and/or reproduction by the Library. The Project may be used at Heritage
University Library and all site locations.
I state at this time the contents of this Project are my work and completely original unless
properly attributed and/or used with permission.
I understand that after three years the printed Project will be retired from the Heritage
University Library. My responsibility is to retrieve the printed Project and, if not retrieved,
Heritage University may dispose of the document. The electronic file will be kept indefinitely.
___________________________________, Author
___________________________________, Date

v

vi
TABLE OF CONTENTS
FACULTY APPROVAL ................................................................................................................ ii
ABSTRACT ................................................................................................................................... iii
PERMISSION TO STORE ............................................................................................................ iv
TABLE OF CONTENTS ............................................................................................................... vi
LIST OF TABLES ......................................................................................................................... ix
CHAPTER 1 .................................................................................................................................. ix
Introduction ......................................................................................................................... 1
Background for the Project ..................................................................................... 1
Statement of the Problem ........................................................................................ 2
Purpose of the Project ............................................................................................. 3
Delimitations ........................................................................................................... 3
Assumptions ............................................................................................................ 4
Hypothesis or Research Question ........................................................................... 4
Null Hypothesis ...................................................................................................... 4
Significance of the Project ...................................................................................... 4
Procedure ................................................................................................................ 4
Accronyms .............................................................................................................. 5
CHAPTER 2 ................................................................................................................................... 7
Review of Selected Literature ............................................................................................. 7
Introduction ............................................................................................................. 7

vii
Standardized Assessments ...................................................................................... 8
Academic and Language Challenges English Langauge Learners Face .............. 10
Examining Math Scores in Relation to Language Proficiency ............................. 15
Summary ............................................................................................................... 17
CHAPTER 3 ................................................................................................................................. 19
Methodology and Treatment of Data ................................................................................ 19
Introduction ........................................................................................................... 19
Methodology ......................................................................................................... 19
Participants ............................................................................................................ 19
Instruments ............................................................................................................ 20
Design ................................................................................................................... 20
Treatment of the Data ........................................................................................... 21
Summary ............................................................................................................... 20
CHAPTER 4 ................................................................................................................................. 22
Analysis of the Data .......................................................................................................... 22
Introduction ........................................................................................................... 22
Description of the Environment ............................................................................ 22
Hypothesis/Research Question ............................................................................. 22
Null Hypothesis .................................................................................................... 22
Results of the Study .............................................................................................. 23
Findings ................................................................................................................ 28
Discussion ............................................................................................................. 29

viii
Summary ............................................................................................................... 29
CHAPTER 5 ................................................................................................................................. 30
Summary, Conclusions and Recommendations ................................................................ 30
Introduction ........................................................................................................... 30
Summary ............................................................................................................... 30
Conclusions ........................................................................................................... 31
Recommendations ................................................................................................. 31
REFERENCES ............................................................................................................................. 32

ix
LIST OF TABLES
Page Table 1 MAP Math Vs. WELPA Composite assessment results ............................................. 24 Table 2 MAP Math Vs. WELPA Reading assessment results ................................................ 25 Table 3 MAP Math Vs. WELPA Writing assessment results ................................................ 25 Table 4 MAP Math Vs. WELPA Speaking assessment results ................................................ 25 Table 5 MAP Math Vs. WELPA Listening assessment results ................................................ 26 Table 6 SBAC Math Vs. WELPA Composite assessment results ............................................ 26 Table 7 SBAC Math Vs. WELPA Reading assessment results ................................................ 26 Table 8 SBAC Math Vs. WELPA Writing assessment results ................................................. 27 Table 9 SBAC Math Vs. WELPA Speaking assessment results .............................................. 27 Table 10 SBAC Math Vs. WELPA Listening assessment results ............................................ 27 Table 11 Correlation Coefficients for WELPA/MATH and WELPA/SBAC .......................... 28

1
CHAPTER 1
Introduction
Background for the Project
MAP, SBAC, and ELPA21 are just a few standardized state tests that the Walker School
District students must take, including ELL students, in the academic year (Walker is a
pseudonym). The MAP test is given three times a year: Fall, Winter, and Spring. The ELPA21
is given once a year to ELL students in the Spring, and the SBAC is given once a year to all
students in the Spring as well. These tests provide educators with scores that allow them to
analyze student academic growth and determine academic and language proficiency levels.
In the Walker School District students are prepped for each of these tests in the classroom
prior to the test dates. The MAP preparation is usually two weeks long and encompasses review
material for both Math and Language Arts. The SBAC prep is usually two weeks long, and the
ELPA prep is usually 3-4 weeks long. Taking a closer look at the prep time as well as the actual
testing time, it is calculated that preparation for these tests is approximately 10 weeks, while the
actual test time is approximately 2 weeks. This shows that out of a 180 day school year, the
students are either test prepping or test taking, approximately 60 days in this school district.
These mandated tests limit the amount of classroom instruction time for students.
With class instruction limited and these tests given in English, ELL students face many
challenges. ELL students are mandated to take these standardized tests regardless of their
English language proficiency level. The idea or belief that ELL students have the ability to adapt
and perform in ways that native English speaking students can do is not realistic based on the
research regarding language acquisition. The student performance on these assessments does not
truly reflect the achievement/academic level of the ELL students.
2
ELL students who have not developed proficient language skills in math, language,
reading and science could be struggling with these high stakes tests, and the gap could be due to
lack of language skills and academic vocabulary. Standardized test scores in mathematics, and
other content areas, are predominantly lower in non English speaking students than in native
speakers (OSPI, 2016). The researcher speculates this is due to the lack of academic language
and vocabulary comprehension in non-English speaking students in mathematics.
Statement of the Problem
ELL students who have not developed academic language are performing at lower levels
in mathematics. According to the OSPI, in 2015-2016, approximately 6% of 6th grade Limited
English students met the state standard on the Math SBAC, 6.4% of 7th grade Limited English
students, and less than 5% of 8th grade Limited English students met the state standard for Math.
Limited English students are those who do not meet the proficiency standard on the state
placement test for the Transitional Bilingual Instructional Program.
The researcher predicted that academic performance in math is affected by the lack of
mathematical English academic knowledge in ELL students. The null of the hypothesis is that
non-English speaking abilities or lack of speaking abilities have no bearing in mathematical
practices on math tests administered in English. The researcher will examine the connection
between English Language Literacy and the ability of ELL students to demonstrate their
knowledge of mathematical concepts on standardized math assessments. Data were collected by
examining student WELPA data, MAP data and SBAC data of the selected participants. The
participants consisted of middle school ELL (Limited English) math students. These students
were selected according to performance test scores associated with mathematics and language.
Data were collected through tests, observations, interviews and collaboration with colleagues.

3
Purpose of the Project
The purpose of this project was to explore the relationship between English Language
Literacy and math performance in ELL students. The researcher examined the relationship
between English language literacy and mathematical scores on state standard performance
assessments. The researcher predicted that there is a disconnect for ELL students between
verbalization and comprehension of English vocabulary and language and mathematical
understanding on math tests administered in English.
Delimitations
Students involved in this project were limited English speaking with minimal academic
language exposure due to numerous factors (relocation, exposure), and students that were
assessed on the WELPA, MAP and the SBAC.
The district where the research took place was a rural farming community in Washington
state. OSPI reported that the district demographics in the 2015-2016 academic year were 95%
Hispanic, 61% transitional bilingual, 23% migrant, and 68.5% free and reduced meals. The
school where the study took place was labeled as a high poverty school (OSPI, 2016).
Limitations
The researcher was unable to control the academic levels of the students selected as well
as the English language proficiency level. The students were selected randomly from an 8th
grade math class from the middle school. Each student within the focus group was given the
same three state assessments (WELPA, MAP, and SBAC).
Another limitation is that the study was solely quantitative. Qualitative data would have
provided additional information to illustrate student experience at the school.

4
Assumptions
The researcher assumed the MAP, SBAC and the WELPA state standard based
assessments are reliable and valid. The researcher is a highly qualified middle school
mathematics teacher and has completed the ELL endorsement instruction course through
Heritage University.
Hypothesis or Research Question
English Language Learner Middle School students’ academic performance in Math is
affected by limited English Language Literacy.
Null Hypothesis
Language challenges for non-English speaking students do not affect math test
performance scores. There is no connection between poor testing performance and non English
speaking students’ abilities in mathematical practices.
Significance of the Project
The researcher was looking to improve the tools and practices in her classroom to achieve
student proficiency in academic language. The researcher wants to support ELL students with
appropriate grade level academic language development. ELL students will benefit from this by
grasping a better understanding of academic language and will be more prepared for rigorous
state tests that require the use of academic language.
Procedure
Data were collected using Spring Math SBAC assessment results, Spring MAP
assessment results, and Spring WELPA results from 2015. The participants consisted of middle
school ELL/math students. The data were gathered by investigating the assessment
5
scores and correlating the scores using a scale score and a scatterplot representation. The
participants were students who were enrolled in the Walker School District in the 2016/2017
school year and were enrolled in the bilingual program. All students were considered Limited
English students and had taken the SBAC, MAP, and the WELPA assessments in Spring 2015.
The researcher looked at the many disadvantages that ELL students face. Poverty,
district demographics, student exposure to math education, and student relocation/migrant status
have been studied and shown to affect academic achievement in ELL students. Poverty offers
constraints on children’s lives and affects learning and academic achievement. Poverty affects
intervening factors that in turn affect achievement success for students. These factors include
student health, literacy and language development, access to physical and material resources, and
level of mobility including migrant relocation (Duncan & Brooks, 1997).
The data were collected, interpreted and presented on a scale level. The researcher was
able to analyze a scale score from both assessments and determine the correlation. From the data
collected the researcher was able to conclude whether or not the hypothesis presented was valid.
Acronyms
BICS: Basic Interpersonal Communicative Skills
CALP: Cognitive Academic Language Proficiency
ELA: English Language Acquisition
ELL: English Language Learner
ELPA21: English Language Proficiency Assessment for the 21st Century
MAP: Measures of Academic Progress
MSP: Measurements of Student Progress
SBAC: Smarter Balance Assessment Consortium

6
SIOP: Sheltered Instruction Observation Protocol
WELPA: Washington English Language Proficiency

7
CHAPTER 2
Review of Selected Literature
Introduction
English Language Learners are one of the fastest growing populations in our schools
today (Van Roekel, 2008). By 2030, the ELL population is expected to account for
approximately 40 percent of the school-aged children in the United States (Roseberry-McKibbin
& Brice, 2000). Given the overwhelming number of students who do not natively speak English,
the federal and state governments, as well as local school districts are left to determine how best
to serve these children in our classrooms. With the number of ELL students increasing, and our
standardized assessments becoming more rigorous, these students are struggling to reach the
state academic requirements (OSPI, 2016). Based on evidence that limited English language
proficiency students exhibit difficulties with academic achievement, it is important to find
adequate assessments that will represent their academic performance accurately.
Today’s state assessments all employ language to measure student success. Students need
the appropriate language skills to read the tests and respond to questions. Consequently, all the
test scores include variance because of the various levels of language ability of students.
Language ability is not the construct under examination in content area assessments but is
confounded with the students’ performances on these tests. The achievement gap between
English Language Learners and native English speakers is a concern and believed to be a direct
reflection of limited language proficiency.
The researcher outlined specific standardized test assessments, the challenges that ELL
students’ faced in the classroom, and the performance gap in meeting state math requirements.

8
Standardized Assessments
Each year Washington state requires students to take several standardized tests to assess
their progress. States tests include: Smarter Balanced English Language Arts (ELA) and Math,
Measurements of Student Progress (MSP) Science test for Grades 5 and 8, and End of Course
exams (EOC) Math and Biology tests as student’s finish Algebra I, Geometry and Biology.
Grades 3 through 8 take the Smarter Balance in both Math and ELA and, Grades 5 and 8 take the
Science MSP (OSPI, 2016). These tests are required to be given annually for federal
accountability.
The Smarter Balanced Assessment interim tests provide students with a preview of test
questions aligned to academic standards for Grades 3–8 and high school (11th grade) in both
English Language Arts (ELA) and Math. The Smarter Balanced assessment system claims to be
a valid, fair, and reliable approach to assessing students, while providing educators, students and
parents meaningful results. The assessment is aligned to the Common Core (OSPI, 2016).
Measurements of Students Progress (MSP) is a science assessment that is given in Grades
5 and 8. This test is used to assess students on the current Washington State Science standards
(OSPI, 2016).
End-of-Course (EOC) exams in Math and Biology allow students in grades 9-12 to be
tested on the knowledge and skills they have gained from taking specific courses. These tests
different from tests like Smarter Balanced, which are comprehensive and assess overall content-
area knowledge. EOC’s which are specific to a course, are administered in the last three weeks
of the course semester. Each school determines its own testing schedule (OSPI, 2016).
Another assessment that can be given, but is not required by the state of Washington, is
the Measures of Academic Progress (MAP). MAP creates a personalized assessment experience

9
by adapting to each student's learning level. The assessment data provides essential information
about what each student knows and is ready to learn (OSPI, 2016).
Another state mandated test for ELL students is the English Language Proficiency
Assessment (ELPA21), an online English language learning assessment. This test is used to
determine a student’s eligibility for language development services. The ELPA21 annually
assesses growth in English language development by the state’s English language learners. This
assessment tests reading, writing, listening and speaking knowledge and skills (OSPI, 2016). In
Spring of 2016 the ELPA21 replaced the WELPA (Washington English Language Proficiency
Assessment).
All of these tests have high English language demands and have shown to be extremely
difficult for ELL students. These tests are written and administered only in English, and tend to
leave ELL students at a disadvantage. How reliable and accurate can these test results be for
English Language Learners? How can school funding, graduation, and educational data be
interpreted accurately when these assessments may not reflect the true academic achievement of
our ELL students? A study done by Jamal Abedi (2002), indicated that student assessment
results might be confounded by their language background variables. ELL students generally
perform lower than non-ELL students on reading, science, and math, because of the confounding
issue of language in content knowledge assessments. This is a strong indication of the impact of
English language proficiency on assessments. Moreover, the level of impact of language
proficiency on assessments of ELL students is greater in the content areas with higher language
demands (Abedi, 2002).
The validity and reliability of these assessments present complications when measuring
academic knowledge and skill of ELL students. These tests may reflect the English language
10
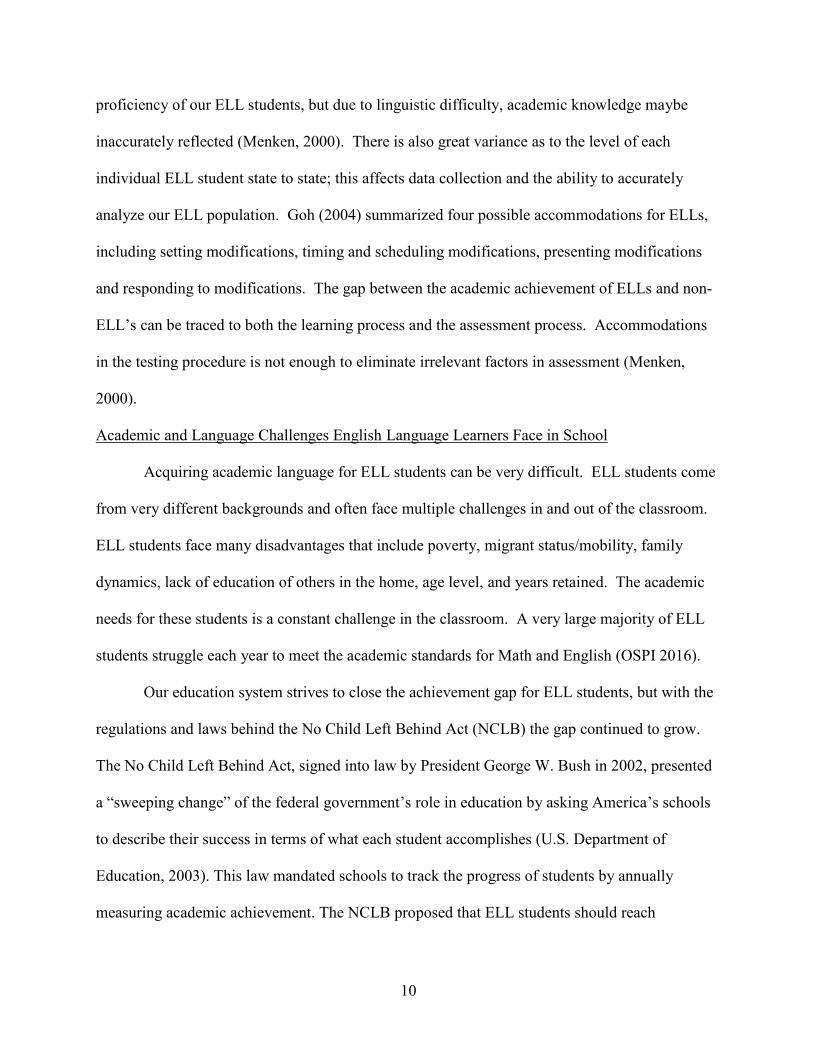
proficiency of our ELL students, but due to linguistic difficulty, academic knowledge maybe
inaccurately reflected (Menken, 2000). There is also great variance as to the level of each
individual ELL student state to state; this affects data collection and the ability to accurately
analyze our ELL population. Goh (2004) summarized four possible accommodations for ELLs,
including setting modifications, timing and scheduling modifications, presenting modifications
and responding to modifications. The gap between the academic achievement of ELLs and non-
ELL’s can be traced to both the learning process and the assessment process. Accommodations
in the testing procedure is not enough to eliminate irrelevant factors in assessment (Menken,
2000).
Academic and Language Challenges English Language Learners Face in School Acquiring academic language for ELL students can be very difficult. ELL students come
from very different backgrounds and often face multiple challenges in and out of the classroom.
ELL students face many disadvantages that include poverty, migrant status/mobility, family
dynamics, lack of education of others in the home, age level, and years retained. The academic
needs for these students is a constant challenge in the classroom. A very large majority of ELL
students struggle each year to meet the academic standards for Math and English (OSPI 2016).
Our education system strives to close the achievement gap for ELL students, but with the
regulations and laws behind the No Child Left Behind Act (NCLB) the gap continued to grow.
The No Child Left Behind Act, signed into law by President George W. Bush in 2002, presented
a “sweeping change” of the federal government’s role in education by asking America’s schools
to describe their success in terms of what each student accomplishes (U.S. Department of
Education, 2003). This law mandated schools to track the progress of students by annually
measuring academic achievement. The NCLB proposed that ELL students should reach

11
academic achievement expectations just as all other students, but the law itself overlooked those
that lack language proficiency (Van Roekel, 2008). ELL students were expected to meet the
state proficiency level in both Mathematics and Language Arts before they were even proficient
in the English language.
Lydia Breiseth (2010) states that many students have trouble mastering the kinds of
language needed to succeed in school, especially if they have never been taught how to use it.
She concludes that there are many differences between academic language and social language
for ELL students. The “social” language is the language that ELL students communicate with
and typically achieve proficiency in using; however, the use of academic language and its
complexity is rarely mastered.
Research indicates that it takes four to twelve years of second language development for
most advantaged students to reach a level of academic proficiency in which they can compete
with native speakers (Collier, 1995). The language struggles and difficulties often make it
extremely challenging for those students to be successful in achieving academic success. Wayne
Wright (2006), an assistant professor of bicultural-bilingual studies at University of Texas, stated
the struggles are not just in English language proficiency; ELL students need substantial English
language skills to comprehend many math tests. Studies suggest that it takes five to seven years,
not one, for students to become proficient enough in academic English to understand assessment
questions. Students need substantial English language skill to comprehend math tests. The high
educational risk for ELLs has been noticed and documented by different sources. ELL students
score lower than mainstream students on national assessments in reading, math, and science
(Kieffer et al., 2009) and ELL students have lower academic achievement and higher drop out

12
rates than native English speaking students (Center for Language Minority Education and
Research, 1996).
With ELL students being put at a disadvantage, Breiseth (2010) states that many
educators have never learned how to teach academic language since language has traditionally
been considered the domain of ESL or English Language Arts (ELA) teachers. Providing correct
instruction for our ELL students with incorporating academic vocabulary and allowing that to
happen in a classroom, will help ELL students understand not only content, but the English
language. ELL students are faced with not only becoming proficient in English but also
comprehending academic content. The ability to use and understand academic language in all
contents, is important in preparing our ELL students for rigorous college and career ready
pathways.
Improving the education of our ELL students could mean that educators need to be
focusing on implementing and improving academic language instruction in our content areas.
Educators could focus on increasing students’ ability to understand concepts, processes, and
operations through teaching terminology and its associated academic vocabulary.
The use of CALP (Cognitive Academic Language Proficiency) in a classroom can be
helpful in developing language and improving subject area content knowledge. CALP refers to
formal academic learning. This includes listening, speaking, reading, and writing about subject
area content material. CALP skills such as literacy and vocabulary continue to grow throughout
schooling. In this sense and in the context of educational settings, language proficiency leans
heavily towards CALP. This level of language learning is essential for students to succeed in
school. Students need time and support to become proficient in academic areas. This usually
takes from five to seven years (Cummins, 1999). Research has shown that if a child has no prior
13
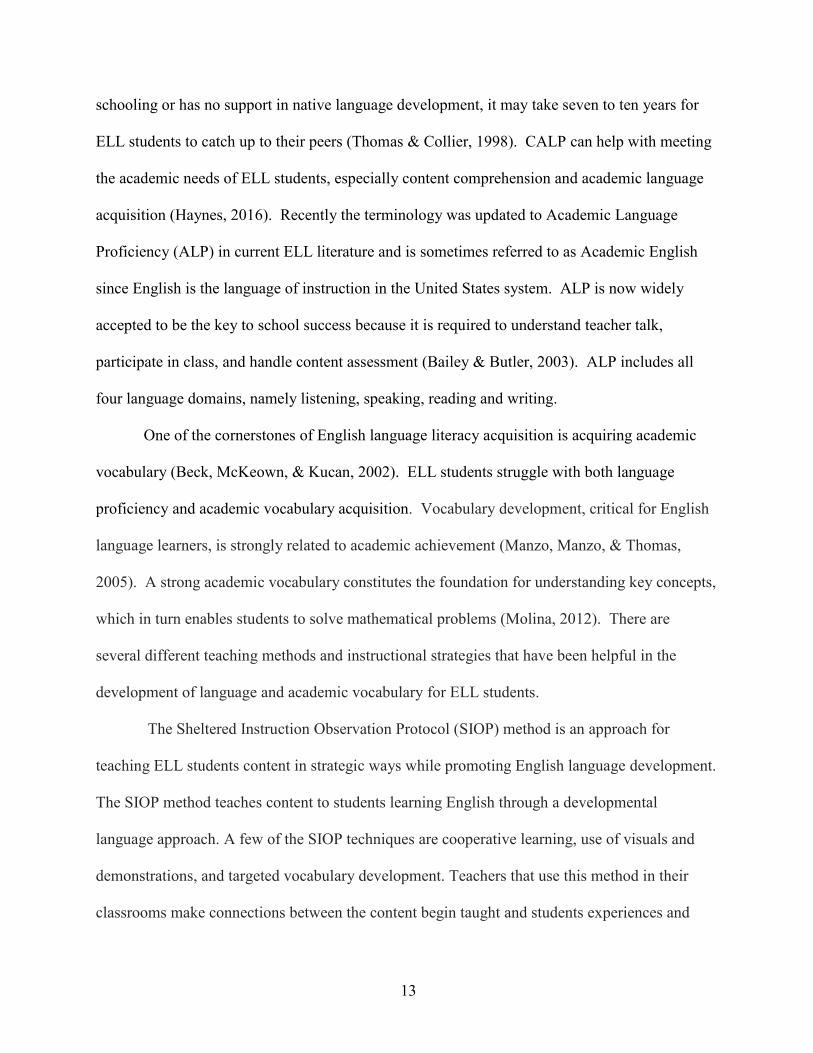
schooling or has no support in native language development, it may take seven to ten years for
ELL students to catch up to their peers (Thomas & Collier, 1998). CALP can help with meeting
the academic needs of ELL students, especially content comprehension and academic language
acquisition (Haynes, 2016). Recently the terminology was updated to Academic Language
Proficiency (ALP) in current ELL literature and is sometimes referred to as Academic English
since English is the language of instruction in the United States system. ALP is now widely
accepted to be the key to school success because it is required to understand teacher talk,
participate in class, and handle content assessment (Bailey & Butler, 2003). ALP includes all
four language domains, namely listening, speaking, reading and writing.
One of the cornerstones of English language literacy acquisition is acquiring academic
vocabulary (Beck, McKeown, & Kucan, 2002). ELL students struggle with both language
proficiency and academic vocabulary acquisition. Vocabulary development, critical for English
language learners, is strongly related to academic achievement (Manzo, Manzo, & Thomas,
2005). A strong academic vocabulary constitutes the foundation for understanding key concepts,
which in turn enables students to solve mathematical problems (Molina, 2012). There are
several different teaching methods and instructional strategies that have been helpful in the
development of language and academic vocabulary for ELL students.
The Sheltered Instruction Observation Protocol (SIOP) method is an approach for
teaching ELL students content in strategic ways while promoting English language development.
The SIOP method teaches content to students learning English through a developmental
language approach. A few of the SIOP techniques are cooperative learning, use of visuals and
demonstrations, and targeted vocabulary development. Teachers that use this method in their
classrooms make connections between the content begin taught and students experiences and
14
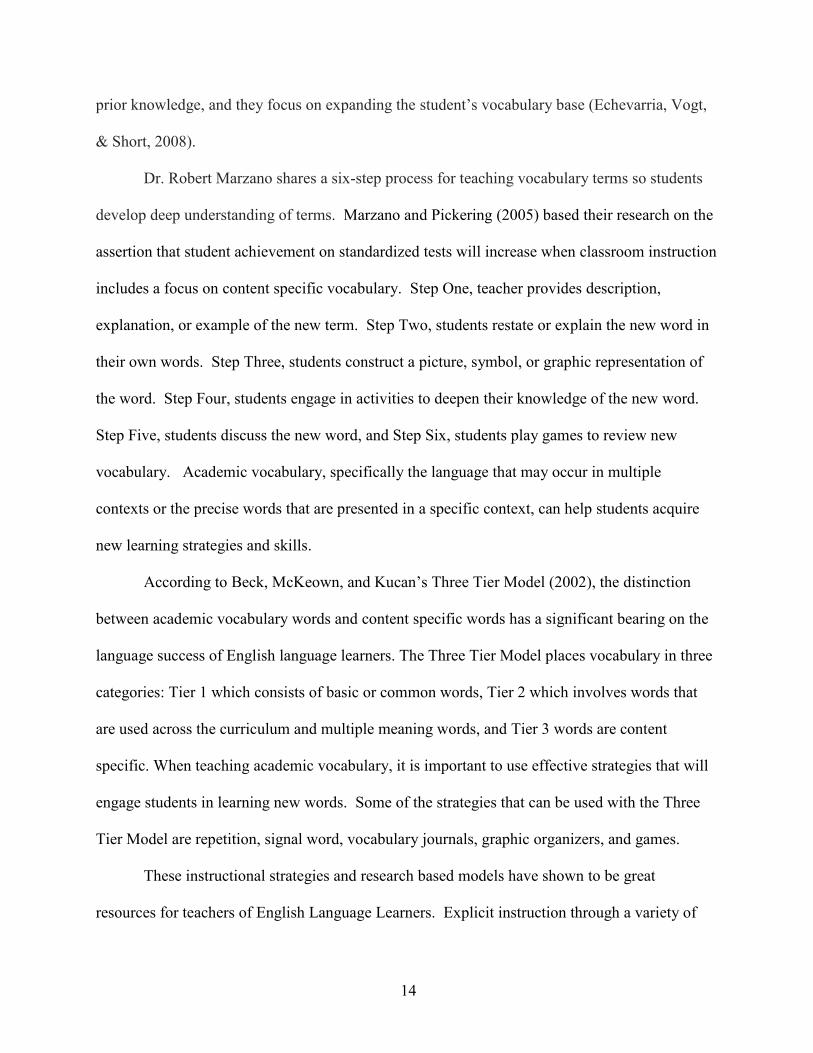
prior knowledge, and they focus on expanding the student’s vocabulary base (Echevarria, Vogt,
& Short, 2008).
Dr. Robert Marzano shares a six-step process for teaching vocabulary terms so students
develop deep understanding of terms. Marzano and Pickering (2005) based their research on the
assertion that student achievement on standardized tests will increase when classroom instruction
includes a focus on content specific vocabulary. Step One, teacher provides description,
explanation, or example of the new term. Step Two, students restate or explain the new word in
their own words. Step Three, students construct a picture, symbol, or graphic representation of
the word. Step Four, students engage in activities to deepen their knowledge of the new word.
Step Five, students discuss the new word, and Step Six, students play games to review new
vocabulary. Academic vocabulary, specifically the language that may occur in multiple
contexts or the precise words that are presented in a specific context, can help students acquire
new learning strategies and skills.
According to Beck, McKeown, and Kucan’s Three Tier Model (2002), the distinction
between academic vocabulary words and content specific words has a significant bearing on the
language success of English language learners. The Three Tier Model places vocabulary in three
categories: Tier 1 which consists of basic or common words, Tier 2 which involves words that
are used across the curriculum and multiple meaning words, and Tier 3 words are content
specific. When teaching academic vocabulary, it is important to use effective strategies that will
engage students in learning new words. Some of the strategies that can be used with the Three
Tier Model are repetition, signal word, vocabulary journals, graphic organizers, and games.
These instructional strategies and research based models have shown to be great
resources for teachers of English Language Learners. Explicit instruction through a variety of

15
approaches and activities provides English Language Learners with multiple changes to learn,
practice and apply academic language (Zwiers, 2008).
Examining Math Scores in Relation to Language Proficiency
The proposal that English proficiency impacts English language learner performances on
mathematics assessments has been analyzed and investigated (Henry, Nistor, & Baltes, 2014).
Analysis has revealed English proficiency as a statistically significant predictor of mathematics
scores. Mathematics scores increase simultaneously with English proficiency but inversely with
grade level. Grade level moderates the influence of English proficiency on mathematics scores.
The National Assessment of Educational Progress (NAEP) measures student performance
at 4th and 8th grade in mathematics. In 1996, 2000, 2003, 2005, and 2007 Mathematics
Assessments, an average of 92 percent of ELLs scored below proficient on the fourth-grade test
compared to 68 percent of non-ELLs. (U.S. Department of Education, 2007). In 2011, the
NAEP reported that 42 percent of grade 4 ELLs nation wide had failed the mathematics
assessment compared to 15 percent of Grade 4 non ELLs (National Center for Educational
Statistics, 2011). In 2013 and 2015, the NAEP reported a significant gap between non ELL
students and ELL students. In 2013, 8th grade ELL students scored 246 and 246 in 2015 on the
Mathematics assessment (test scores range from 0-500). Non ELL 8th grade students scored 287
in 2013 and 284 in 2015 on the math assessment (NAEP, 2015). These results represent an
estimate of overall performance of students in our nation. These results show a national gap in
the comparison of scores between ELL students and non-ELL students.
The Washington state report card reported ELL student scores were significantly lower
on the state SBAC assessment than non-ELL students. In 2014-2015, 5514 8th grade students
took the test, data showed that 11.7% of Limited English students passed or met standard, and

16
88.2% were below. In 2015-2016, 5334 students took this test, and data showed very similar
results, 11.6% met standard, and 88.6% were below. In 2014-15, 46% of non-ELL 8th grade
student took the test and met standard. In 2015-16, 47.8 % passed or met standard. (OSPI, 2016)
In Utah, ELL students did poorly on the required school proficiency exam (Haren,
Holliday & Sharif, 2009). The study consisted of 22 students, ages 14-18. Ten students were
from Africa, four were from Asia, and eight were from Spanish speaking countries. The study
concluded that numbers and symbols are more easily understood than solving word problems.
Visual examples are a great aid for conceptualization. Group collaboration and translation helps
with vocabulary comprehension. And it is not a students’ level of mathematical comprehension
that matters, but their level of English acquisition.
Grant and Cook (2010) examined the relationship between language proficiency and
mathematics achievement. Their study investigated two groups, grades 3-5 and grades 6-8. Their
hypothesis was: “There are structural linear relationships between EL’s proficiency in the
academic languages of mathematics, science, language arts and social studies, and social and
instructional language and their achievement on one’s state mathematics test” (Grant & Cook,
2010, p.3). Grant and Cook chose to have students participate in an ACCESS assessment two
times. This test measures EL proficiency standards and the state’s four mathematics measures:
number and operations, functions and algebra, geometry and measurement, and data, statistics
and probability. Their findings concluded that success in mathematics is influenced by English
language proficiency. Receptive skills directly influence mathematics achievements, writing and
speaking play a role in mathematics achievement, and writing skills are closely related to
mathematics achievement. This study confirmed that academic language proficiency influences
mathematical achievement.
17
Summary
With our standardized testing becoming more rigorous, the academic achievement gap is
increasing and our ELL population is faced with difficulties reaching the state standards. The
research presented in this chapter illustrated several studies and relevant evidence that supported
the educational needs for English Language Learners.
Standardized assessments are an extreme challenge to ELL students. These tests not only
challenge their content knowledge, but, also, their language proficiency. The assessments that
were discussed in this chapter are known to have high English language demands which are
extremely difficult for ELL students. These tests are all written and administered in English with
little to no accommodations, and leave ELL students at a disadvantage. Standardized testing is
only one of the many obstacles that ELL students face. Language proficiency affects content
knowledge learning and assessment especially for ELL students. Regular standardized tests fail
to take students’ language proficiency into consideration; it is questionable whether these
assessments represent the true academic knowledge of ELL students.
The every-day challenges of these students can play a factor in their learning abilities.
Poverty is a huge factor that has been proven to play a role in lower achievement scores, along
with students of color, students of disabilities, and students with limited English proficiency.
Students come from all different backgrounds and face multiple challenges in and out of the
classroom. The academic achievement gap for ELL students continues to grow. With the high
language demands, these students are expected to meet state proficiency levels in both math and
science. Research shows that teaching and providing correct instruction for our ELL students by
incorporating academic vocabulary will help the students understand content and improve
English language literacy.

18
The relationship between math performance and English language proficiency proved
through the research presented to hold true. The studies indicated that English language
acquisition and academic language play a role in assessment performance. The research showed
significant importance to the instruction of academic language and the role it plays in the
development of language acquisition and comprehension. Research not only shows the gap
between ELL and non-ELLs, but also shows the relationship between language and math and the
impact of language on state assessments. Research also showed that academic language
proficiency influences mathematical achievement and also influences proficiency in academic
languages in other content areas.
Educators need to be committed to improving the education of ELL students and
collaborate on strategies to enhance academic language and increase student success. Classroom
instruction should integrate academic content vocabulary in order to support language
development and increase students’ language proficiency. Educators need to provide guidance
and instruction that will support both content based vocabulary and academic language.

19
CHAPTER 3
Methodology and Treatment of Data
Introduction
The researcher examined the relationship between English Language Learners language
challenges and the outcome of their standardized test scores for mathematics. The researcher
examined the relationship between academic performance and mathematic academic knowledge.
Methodology
The research method used was Correlational. Correlational research involves collecting
data to determine whether, and to what degree, a relationship exists between two or more
quantifiable variables. This research method was used by the researcher to determine whether
and to what degree the WELPA test results, the MAPS test results, and the SBAC test results
were related. The researcher used the Relation Type to see how the test results influence one
another. The researcher collected data to determine if two or more variables were related. The
study included 30 participants. The outcome of this study will allow the researcher to determine
a relationship between student language or lack of language, and student understanding/
comprehension of mathematical practices on standardized tests.
Participants
The students chosen to participate were eighth grade middle school students. These 30
students were Hispanic ELL students who had not passed the WELPA assessment. The
participants had scored a 2 or below on the WELPA and were below grade level on the MAP and
SBAC state assessments.

20
Instruments
The researcher used three particular state required tests that are administered in the
school district yearly. The WELPA test was given annually, the SBAC was given once a year,
and the MAP test was given three times a year (Fall, Winter, Spring).
The WELPA is known as the Washington English Language Proficiency Assessment.
This test is a criterion-referenced and performance-based English test. It assesses both the
receptive and productive language skills in contexts relevant to academic studies at tertiary level.
The test assesses growth in English language development and assesses students in reading,
writing, listening and speaking knowledge and skills.
The MAP test is known as the Measure of Academic Progress. This test is a computer
adaptive interim assessment. Recommended usage is 3-4 times a year. The MAP is untimed.
This test is used to inform instruction using valid, reliable and real-time data. It measures the
growth of every student over time regardless of on, above, or below grade level performance,
creates and reinforces evidence-informed instructional practices, evaluates and identifies
professional development needs, and compares and predicts student achievement over time via
exclusive normative and growth information.
The Smarter Balance Assessment Consortium (SBAC) is an assessment system that is
aligned with the Common Core State Standards. The Smarter Balanced assessment system
covers the full range of college- and career-ready knowledge and skills. The SBAC math
assessment focuses on four claims: Concepts and Procedures, Problem Solving, Communicating
Reasoning, and Modeling and Data Analysis. The overall claim for grades 3-8 is students can
demonstrate progress toward college and career readiness in mathematics.
21
The researcher used test scores to determine the correlation between the three
assessments and draw a conclusion from the data collected. The researcher hoped to validate the
hypothesis that test performance is affected by the lack of English Language Literacy.
Design
The researcher examined WELPA test scores, the MAP test scores, and the SBAC scores
of Spring 2015. The researcher used these tests to determine a relationship/non-relationship
between the scores. The researcher ran regression on the data and to identify a correlation
coefficient and t-test for statistical significance.
Treatment of the Data
The researcher analyzed the overall WELPA Spring 2015, SBAC Spring 2015, and MAP
Spring 2015. The researcher analyzed overall WELPA as well as sub-test scores. The researcher
used simple regression and correlational analyses.
Summary
The relationship between English Language Learners language challenges and the
outcome of their standardized test scores for mathematics were examined and researched using
Correlational analysis. The research involved collecting data to determine whether, and to what
degree, a relationship existed between two or more quantifiable variables. The research was
conducted using the SBAC, MAP and WELPA state assessments. The researcher used these
tests and determined the correlation between the three assessments. The participants for this
study were 8th grade middle school math students who have not passed the WELPA assessment.
All data were collected and analyzed by the researcher and the relationship was determined by
the use of simple regression and correlational analyses.

22
CHAPTER 4
Analysis of the Data
Introduction
This chapter presents the findings and evaluation data analysis related to the research
study. The analysis demonstrated a positive correlation between language proficiency and math
achievement in ELL students. The researcher presents the magnitude of correlation between
language proficiency and its student’s academic performance in this chapter.
Description of the Environment
Students involved in this project were limited English speaking with minimal academic
language exposure due to numerous factors (relocation, exposure), and students that were
assessed on the WELPA, MAP and the SBAC.
The district where the research took place was a rural farming community. OSPI
reported that the district demographics in the 2015-2016 academic year were 95% Hispanic, 61%
transitional bilingual, 23% migrant, and 68.5% free and reduced meals. The school where the
study took place was labeled as a high poverty school (OSPI, 2016).
Hypothesis/Research Question
English Language Learner Middle School students’ academic performance in Math is
affected by limited English Language Literacy.
Null Hypothesis
Language challenges for non-English speaking students do not affect math test
performance scores. There is no connection between poor testing performance and non English
speaking students’ abilities in mathematical practices.

23
Results of the Study
The results of the study demonstrated that language proficiency does correlate to math
performance. The literacy score in the findings is expressed as the independent variable and the
mathematics assessment score is the dependable variable. The researcher found that the
hypothesis is truthful in that math achievement is dependent on literacy skills.
The researcher chose to use Regression to show the relationship between English
language proficiency and mathematic assessment performance. Regression is a process for
examining the relationship between independent and dependent variables and the relationships
associated with the two variables. Regression is also used to determine a casual analysis,
forecast a relationship between two variables, and examine a trend. Regression can be used to
identify how the strength of independent variable might effect the dependent variable.
The correlation coefficient is a number between -1 and +1 that represents a relationship
between two variables. In this study the researcher determined the correlation coefficient for the
regression and was able to determine the correlation. The closer the coefficient correlation is to
zero the lower the correlations and the closer it is to one the higher the positive (direct)
correlation.
The data that was collected in this study showed a higher correlation between reading,
writing and math performance levels on both the SBAC and the MAP assessments. In reading
the coefficient correlation was a .48 on the MAP assessment and a .53 on the SBAC. In writing
the coefficient correlation was a .56 on the MAP and a .58 on the SBAC. This data provides the
information that concludes the hypothesis in that language proficiency, especially in the area of
reading and writing is predictive of math performance on state standardized tests for ELL
students.
24
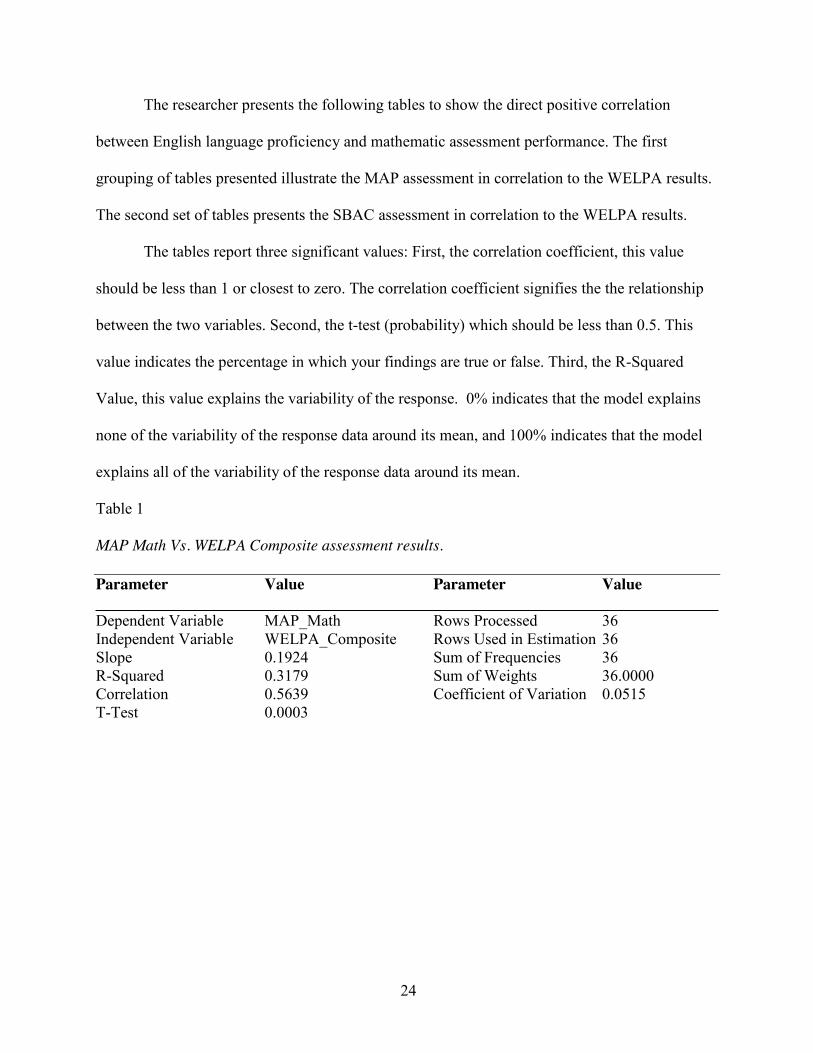
The researcher presents the following tables to show the direct positive correlation
between English language proficiency and mathematic assessment performance. The first
grouping of tables presented illustrate the MAP assessment in correlation to the WELPA results.
The second set of tables presents the SBAC assessment in correlation to the WELPA results.
The tables report three significant values: First, the correlation coefficient, this value
should be less than 1 or closest to zero. The correlation coefficient signifies the the relationship
between the two variables. Second, the t-test (probability) which should be less than 0.5. This
value indicates the percentage in which your findings are true or false. Third, the R-Squared
Value, this value explains the variability of the response. 0% indicates that the model explains
none of the variability of the response data around its mean, and 100% indicates that the model
explains all of the variability of the response data around its mean.
Table 1 MAP Math Vs. WELPA Composite assessment results. Parameter Value Parameter Value Dependent Variable MAP_Math Rows Processed 36 Independent Variable WELPA_Composite Rows Used in Estimation 36 Slope 0.1924 Sum of Frequencies 36 R-Squared 0.3179 Sum of Weights 36.0000 Correlation 0.5639 Coefficient of Variation 0.0515 T-Test 0.0003

25
Table 2
MAP Math Vs. WELPA Reading assessment results Parameter Value Parameter Value Dependent Variable MAP_Math Rows Processed 36 Independent Variable WELPA_Reading Rows Used in Estimation 36 Slope 0.1875 Sum of Frequencies 36 R-Squared 0.2380 Sum of Weights 36.0000 Correlation 0.4878 Coefficient of Variation 0.0544 T-Test 0.0025 Table 3
MAP Math Vs. WELPA Writing assessment results Parameter Value Parameter Value Dependent Variable MAP_Math Rows Processed 36 Independent Variable WELPA_Writing Rows Used in Estimation 36 Slope 0.1231 Sum of Frequencies 36 R-Squared 0.3242 Sum of Weights 36.0000 Correlation 0.5694 Coefficient of Variation 0.0512 T-Test 0.003 Table 4
MAP Math Vs. WELPA Speaking assessment results Parameter Value Parameter Value Dependent Variable MAP_Math Rows Processed 36 Independent Variable WELPA_Speaking Rows Used in Estimation 36 Slope 0.0944 Sum of Frequencies 36 R-Squared 0.0984 Sum of Weights 36.0000 Correlation 0.3138 Coefficient of Variation 0.0592 T-Test 0.0624

26
Table 5
MAP Math Vs. WELPA Listening assessment results Parameter Value Parameter Value Dependent Variable MAP_Math Rows Processed 36 Independent Variable WELPA_Listening Rows Used in Estimation 36 Slope 0.0958 Sum of Frequencies 36 R-Squared 0.1692 Sum of Weights 36.0000 Correlation 0.4114 Coefficient of Variation 0.0568 T-Test 0.0127
The following tables listed below reflect the results of the SBAC in comparison to the WELPA
assessment.
Table 6
SBAC Math Vs. WELPA Composite assessment results Parameter Value Parameter Value Dependent Variable SBAC_Math Rows Processed 36 Independent Variable WELPA_Composite Rows Used in Estimation 36 Slope 0.8766 Sum of Frequencies 36 R-Squared 0.2606 Sum of Weights 36.0000 Correlation 0.5105 Coefficient of Variation 0.0232 T-Test 0.0015 Table 7
SBAC Math Vs. WELPA Reading assessment results Parameter Value Parameter Value Variable SBAC_Math Rows Processed 36 Independent Variable WELPA_Reading Rows Used in Estimation 36 Slope 1.0395 Sum of Frequencies 36 R-Squared 0.2888 Sum of Weights 36.0000 Correlation 0.5374 Coefficient of Variation 0.0227 T-Test 0.0007

27
Table 8
SBAC Math Vs. WELPA Writing assessment results Parameter Value Parameter Value Dependent Variable SBAC_Math Rows Processed 36 Independent Variable WELPA_Writing Rows Used in Estimation 36 Slope 0.6332 Sum of Frequencies 36 R-Squared 0.3388 Sum of Weights 36.0000 Correlation 0.5821 Coefficient of Variation 0.0219 T-Test 0.0002 Table 9 SBAC Math Vs. WELPA Speaking assessment results Parameter Value Parameter Value Dependent Variable SBAC_Math Rows Processed 36 Independent Variable WELPA_Speaking Rows Used in Estimation 36 Slope 0.4434 Sum of Frequencies 36 R-Squared 0.0858 Sum of Weights 36.0000 Correlation 0.2929 Coefficient of Variation 0.0257 T-Test 0.0830 Table 10
SBAC Math Vs. WELPA Listening assessment results Parameter Value Parameter Value Dependent Variable SBAC_Math Rows Processed 36 Independent Variable WELPA_Listening Rows Used in Estimation 36 Slope 0.2759 Sum of Frequencies 36 R-Squared 0.0554 Sum of Weights 36.0000 Correlation 0.2354 Coefficient of Variation 0.0262 T-Test 0.1669
28
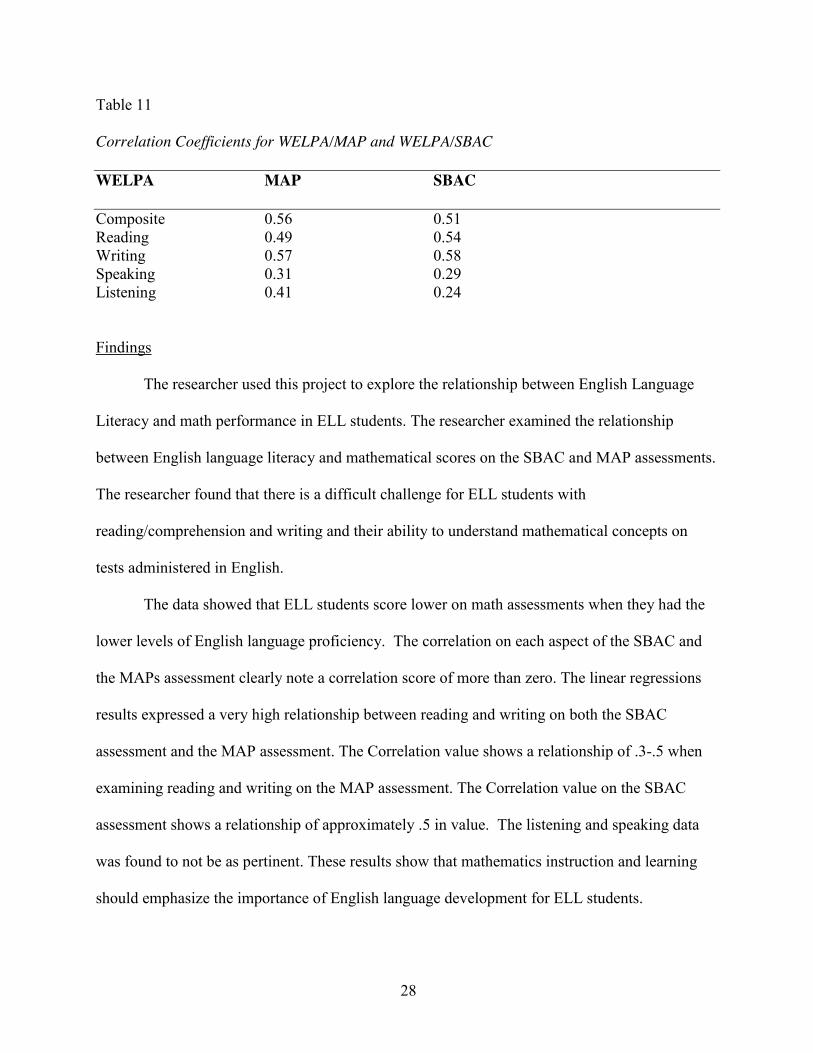
Table 11
Correlation Coefficients for WELPA/MAP and WELPA/SBAC WELPA MAP SBAC Composite 0.56 0.51 Reading 0.49 0.54 Writing 0.57 0.58 Speaking 0.31 0.29 Listening 0.41 0.24
Findings
The researcher used this project to explore the relationship between English Language
Literacy and math performance in ELL students. The researcher examined the relationship
between English language literacy and mathematical scores on the SBAC and MAP assessments.
The researcher found that there is a difficult challenge for ELL students with
reading/comprehension and writing and their ability to understand mathematical concepts on
tests administered in English.
The data showed that ELL students score lower on math assessments when they had the
lower levels of English language proficiency. The correlation on each aspect of the SBAC and
the MAPs assessment clearly note a correlation score of more than zero. The linear regressions
results expressed a very high relationship between reading and writing on both the SBAC
assessment and the MAP assessment. The Correlation value shows a relationship of .3-.5 when
examining reading and writing on the MAP assessment. The Correlation value on the SBAC
assessment shows a relationship of approximately .5 in value. The listening and speaking data
was found to not be as pertinent. These results show that mathematics instruction and learning
should emphasize the importance of English language development for ELL students.
29
Discussion
As expected, the data provided evidence that language proficiency is correlated to math
achievement. The results show that language proficiency is the key variable that can predict the
math achievement gap in ELL students. Regression analysis revealed that language proficiency
is predictive of math performance on the MAP and SBAC state assessments.
Some limitations may need to be considered in the research project. The researcher was
unable to control the academic levels of the students selected as well as the English language
proficiency level. The students were selected randomly from an 8th grade math class from the
middle school. Each student within the focus group was given the same three state assessments
(WELPA, MAP, and SBAC).
Another limitation is that the study was solely quantitative. Qualitative data would have
provided additional information to illustrate student experience at the school.
Summary
The study confirmed that language proficiency is a key variable that can predict the math
achievement gaps between ELLs’ and Non-ELLs. In addition, regression revealed that language
does influence math achievement. There was a strong correlation between reading and writing
and student math scores, and, there was a correlation of lesser magnitude between student’s
abilities in listening and speaking and their performance on the math assessments. The results
from the study strongly suggest that the achievement gap within our schools today needs to be
analyzed and evaluated with the importance of literacy and its impact on all content areas. The
results of this study should be used to encourage every educator to recognize the importance of
language acquisition strategies for English Language Learners so that students can maximize
their potential and successfully

30
CHAPTER 5
Summary, Conclusions and Recommendations
Introduction
The purpose of the research was to examine the relationship between English Language
proficiency and mathematic performance on state assessments in ELL middle school students.
Regression analysis was used to determine the magnitude of correlation between students
literacy skills and their scores on standardized math tests. The relatively large sample size, 36
students, ensured that the results were statistically significant.
Summary
The data were gathered by investigating the assessment scores and correlating the scores
using a scale score and a scatterplot representation. The participants were students who were
enrolled in the Walker School District in the 2016/2017 school year and were enrolled in the
bilingual program. All students were considered Limited English students and had taken the
SBAC, MAP, and the WELPA assessments in Spring 2015.
The researcher was able to see the comparison between the SBAC and the MAP
assessments, and the closeness of the coefficient correlation data. Both the SBAC and the MAP
tests showed similar scores in reading and writing, the coefficient correlation was significantly
high ranging from .48-.53 in reading and .56-.58 in writing. Thus, the researcher was able to
demonstrate that these two skills are correlated to performance on both of these math tests.
The data were collected, interpreted and presented on a scale level and the correlation
was presented in the findings. The researcher was able to analyze a scale score from both
assessments and a positive correlation was found between language proficiency and mathematic

31
assessment performance. From the data collected the researcher was able to conclude the
hypothesis presented was valid.
Conclusions
The data collected and analyzed confirmed that there is a correlation between language
proficiency and math assessment performance. The regression shown in the display of data
demonstrated a strong correlation between math and reading and writing, and a slight correlation
between math and listening and speaking.
Recommendations
Results from the study strongly suggests that the achievement gap within our schools
today needs to be analyzed and evaluated with the importance of literacy and its impact on all
content areas. The English language learner population in our schools continues to rise. It is
crucial for teachers to continue to accommodate and serve linguistically diverse students. The
classroom teacher must focus on ways to enhance English acquisition. The use of word walls,
academic language/vocabulary focus, contextual lessons/instructional strategies, visuals, and
dual language exposure are all strategies that should be part of every educators working
knowledge.
Our education system needs to assist educators in making the best instructional
decisions for ELL students. The results of this study should be used to encourage every educator
to recognize the importance of language acquisition strategies for English language learners,
especially reading and writing, so that students can maximize their potential and successfully
transition to their next level of learning.
.
32
REFERENCES
Abedi, J. (2002). Standardized achievement tests and English language learners:
psychometrics issues. Educational Assessment, 8(3), 231-257. doi:10.1207/s15326-
977ea0803_02
Abedi, J., Courtney, M., Leon, S., Kao, J., & Azzam, T. (2006). English language learners and
math achievement: A study of opportunity to learn and language accommodation. Los
Angeles: CRESST.
Bailey, A.L., & Butler, F.A. (2003). An evidentiary framework for operationalizing academic
language for broad application to K-12 Education: A design document (CSE Tech. Rep.
No. 611). Los Angeles: University of California, Center for the Study of
Evaluation/National Center for Research on Evaluation, Standards, and Student Testing.
Beck, I.L., McKeown, M.G., & Kucan, L. (2002). Bringing words to life: Robust vocabulary
instruction. New York: Guilford Press.
Breiseth, L. (2016, July 12). Academic language and ELLs: What teachers need to know.
Coloring Colorado, 1-9.
Center for Language Minority Education and Research. (1996). Comprehensive services for
secondary immigrant student’s demonstration project outcomes report. Long Beach,
CA: The Andrew F. Mellon Foundation.
Collier, V.P. (1995). Acquiring a second language for school. Directions in language and
education, 1(4).
Cummins, J. (1999). BICS and CALP: Clarifying the distinction. Retrieved from
www.eric.ed.gov.
33
Duncan, G.J., & Brooks-Gunn, J. (1997). Consequences of growing up poor. New York: Russell
Sage Foundation.
Echevarria, J., Vogt, M.E. & Short, D. (2008). Making Content Comprehensible for English
Language Learners: The SIOP® Model, Third Edition. Boston: Allyn & Bacon. Goh, D.S. (2004). Assessment accommodations for diverse learners. Boston: Pearson Education.
Grant, R., & Cook, H.G. (2010). Relationships between language proficiency and mathematic
Achievement. Retrieved from Wida Consortium website: www.wida.us
Haren, D., Holliday, D., & Sharif, T. (2009). English proficiency in mathematical acquisition: A
case study of a math intensive workshop, 1-12.
Haynes, J. (2016). Everything ESL: The K-12 ESL resource from Judie Haynes. Retrieved from
http://www.everythingesl.net
Henry, D., Nistor, N., & Baltes, B. (2014). Examining the relationship between math scores and
English language proficiency. Journal of Educational Research and Practice, 4(1),
11-29.
Kieffer, M.J., Lesaux, N.K., Rivera, M., & Francis, D.J (2009). Accommodations for English
language learners taking large-scale assessments: A meta-analysis on effectiveness and
validity. Review of Educational Research, 79(3), 1168-1201.
Manzo, A.J., Manzo, U.C., & Thomas, M.T. (2005). Content area literacy: Strategic thinking for
strategic learning, 4th Ed. New York: John Wiley & Son.
Marzano, Robert J., and Debra J. Pickering. (2007). Building Academic Vocabulary: Teacher's
Manual. Alexandria, VA: Association for Supervision and Curriculum Development.
Menken, K. (2000). What are the critical issues in the wide-scale assessment of English
language learners? NCBE Issue Brief No. 6, 1-8. Washington, DC: NCBE. [Online].
34
Molina, C. (2012). The problem with math is English: A language-focused approach to helping
all students develop a deeper understanding of mathematics. San Francisco: Jossey-
Bass.
National Assessment of Educational Progress. (2015). Retrieved October 09, 2016 from
www.nationsreportcard.gov
National Center for Educational Statistics. (2011). Achievement Gaps: How Hispanic and
white students in public schools perform in mathematics and reading on the national
assessment of educational progress. U.S. Department of Education.
Office of Superintendent of Public Instruction. (2016). Retrieved October 09, 2016, from
http://www.k12.wa.us
Roseberry-McKibbin, & Brice. (2000). Acquiring English as a second language: What’s
“normal,” & what’s not. The ASHA Leader, 5(12),4-7
Thomas,W. & Collier, V.(1998). Two language are better than one. Education Leadership,
55(4) ,23-26
U.S. Department of Education. (2003). Introduction: No child left behind. Retrieved October 7,
2016, from http:// www.nclb.gov
U.S. Department of Education. (2007) National Assessment of Educational Progress. Nations
Report Card. Retrieved Oct 7, 2016 from http:// www.nces.ed.gov
Van Roekel, D. (2008) English language learners face unique challenges. An NEA
Policy Brief. Washington, D.C.: National Education Association.
Wright, W. (2006). A Catch-22 for language learners. Educational Leadership 64(3), 22-27.
Wright, W.E., & Li, X. (2008). High–stake math tests: How No Child Let Behind
leaves newcomer English language learners behind. Language Policy, 7(3), 237-266.
35
Zwiers, J. (2008). Building academic language: Essential practices for content classrooms.
Newark, DE: International Reading Association.