THE RELATIONSHIP BETWEEN DAY- AHEAD AND FUTURES …
15
CINZIA BONALDO Department of Economics and Management and Department of Civil Environmental and Architectural Engineering, University of Padova MASSIMILIANO CAPORIN Department of Statistical Sciences, University of Padova FULVIO FONTINI Department of Economics and Management, University of Padova THE RELATIONSHIP BETWEEN DAY- AHEAD AND FUTURES PRICES IN THE ELECTRICITY MARKETS: AN EMPIRICAL ANALYSIS ON ITALY, FRANCE, GERMANY AND SWITZERLAND March 2021 Marco Fanno Working Papers – 272
Transcript of THE RELATIONSHIP BETWEEN DAY- AHEAD AND FUTURES …

CINZIA BONALDO
Department of Economics and Management and Department of Civil Environmental and Architectural Engineering, University of Padova
MASSIMILIANO CAPORIN
Department of Statistical Sciences, University of Padova
FULVIO FONTINI
Department of Economics and Management, University of Padova
THE RELATIONSHIP BETWEEN DAY-AHEAD AND FUTURES PRICES IN THE ELECTRICITY MARKETS: AN EMPIRICAL ANALYSIS ON ITALY, FRANCE, GERMANY AND SWITZERLAND
March 2021
Marco Fanno Working Papers – 272
1
The relationship between day-ahead and futures prices
in the electricity markets: an empirical analysis on Italy,
France, Germany and Switzerland
Cinzia Bonaldo; Massimiliano Caporin; Fulvio Fontini°
Abstract
We evaluate the relationship between electricity day-ahead and future prices following the hedging pressure
theory, which explains the difference between future prices and expected spot prices in terms of market players’ risk aversion. We calculate the sign and intensity of the risk premia ex-post in the electricity market
of Italy, France, Switzerland and Germany during the last decade and for all products traded, namely, monthly,
quarterly, yearly futures and distinguishing between base-load and peak-price futures. We show that in all the
countries there is no convergence of future prices to the underlying day ahead ones; moreover, for most of
future contracts, the premium rises as contracts approach the delivery. For Italy and Switzerland this means
that an inversion of the sing occurs, since on average risk premia are negative at the beginning of the trading
period but become positive as the delivery period approaches. The hedging pressure theory implies that in
these Countries premia are on average paid by power producers at the beginning of the period and by suppliers
(i.e. power buyers) when coming close to the delivery. On the contrary, in France and Germany risk premia
are both positive at the begging and at the end of the trading period, signaling that on average buyers are
relatively more risk averse during the whole trading period. In addition, when considering the duration of the
delivery period, contracts with longer delivery periods have, on average, higher negative risk premia.
Keywords: electricity, prices, futures, spot, risk premium.
J.E.L. Codes: D46, G12, G13, L94, Q41
Department of Economics and Management and Department of Civil Environmental and Architectural Engineering,
University of Padua, Italy Department of Statistical Sciences, University of Padua, Italy ° Department of Economics and Management, University of Padua, Italy

2
1. Introduction The high volatility, the existence of a strong component of mean-reversion, and the presence of
sudden and huge price spikes are well-known characteristics of wholesale electricity spot prices
(Knaut and Paschmann, 2019 ; Li et al., 2016). These features are due to power limited storability
and load fluctuation.
Sellers (i.e. power producers) and buyers (i.e. final customers’ suppliers) of electricity can hedge risks
by exchanging future contracts in organized markets, such as the ones managed by European Energy
Exchange (EEX) for central European countries (Germany, Austria, France and Switzerland), and
GME for Italy. Electricity futures are derivatives that fix the price ahead of the delivery period.
During the trading periods, market participants exchange standardized contracts composed of a unit
of energy (one MWh). The latter is going to be delivered to the buyer by the seller at the exchange
price for the whole delivery period, for the contracts with physical settlement. On the contrary, a cash
settlement is foreseen based on the difference between the spot and the forward price for financial
contracts, which are indeed the majority of future contracts exchanged in the above-cited markets.1
There exist several types of standardized contracts. At the EEX, for instance, electricity futures are
traded for delivery periods equal to one week, one month, one quarter and the entire year. In addition,
the delivery can refer to the whole period, or just a subset of hours throughout the period. The former
are termed base-load contracts, while the latter peak-load, since delivery ranges from Monday to
Friday, 8:00 a.m. to 8:00 p.m.
The limited storability of electricity means that the classic approach used for financial forward
evaluation, i.e. non-arbitrage condition, cannot be applied. Electricity cannot be sold short; it cannot
be purchased at the spot price today, stored it for a certain period of time and resold it at the forward
price. Moreover, the classical concepts of convenience yield and cost of carry, that explain the
relationship between forward and future prices, loose their meaning here, since they imply that traders
can acquire and store the underlying asset (Hoff and Mortensen, 2014).2 On the contrary, according
to the hedging pressure approach (see Hendrik Bessembinder, 1992), the forward price of a certain
asset can be read as the sum of the expected spot price on that asset and the risk premium. The latter
is paid by the risk-averse operator in order to transfer the price risk to the counterparty. Both
electricity producers and buyers may be interested in incurring an additional cost to cover themselves
from price risk. This would result in both positive and negative risk premium (Pietz, 2009). In
particular, a positive premium, namely, a positive difference between forward and expected spot
price, would signal that buyers are relatively more risk averse than sellers, and therefore are willing
to buy electricity forward at a premium compared to the spot. Doing so, they can guarantee
themselves a fix price, transferring the risk due to spot price volatility to sellers. On the contrary, a
negative premium, i.e., a forward price lower than the expected spot, implies that sellers are willing
to pay a premium to buyers in order to transfer them the risk of spot price volatility.
There is a growing literature on the relationship between electricity forward and spot prices,3 starting
from the seminal paper of H Bessembinder and Lemmon (2002). Focusing on prices in the American
PJM and California Power Exchange, these authors showed that the risk premia depend on the price
volatility (and the skewness of spot prices), tend to increase as delivery period approaches and is
1 In the EEX the physical fulfillment is available only for weekly and monthly contract for German, Austrian, France,
Dutch, Swiss, Belgian and GB power futures. The other contracts have a cash fulfillment. More information are available
on www.EEX.com. 2 An exception is for countries that have an electrical system based entirely (or almost) on hydroelectric power plants. In
this case, prices are driven by the current and expected availability of the water resources and the convenience yield can
be represented by water reserves stored in tanks. For an analysis of the Nord Pool, see (Botterud, Kristiansen, and Ilic
2010) 3 A general survey about electricity derivatives with a focus on electricity futures is provided by (Aid 2015).

3
negative when expected demand is low. Several scholars have followed such an approach, yet
providing discordant evidence about the sign and behavior of risk premia in future markets. Shawky,
Marathe, and Barrett (2003) studied daily futures contract, for the years 1998 and 1999, traded in
New York Mercantile Exchange market 6 months before the delivery and find a positive relationship
between spot and futures prices. Lucia and Torró (2011) analyze weekly contracts of NordPool
market during 1997-2007. They find that on average ex-post risk premium was positive and seasonal.
Similarly, Junttila, Myllymäki, and Raatikainen (2018) find that risk premia of monthly products in
Finnish market from 2006 to 2016 seems to vary between seasons but are positive on average. Other
scholars, on the contrary, find both positive and negative values for risk premia. Handika and Trueck
(2013) studied the risk premium ex-post of quarterly and yearly futures contract in the Australian
regional markets from 2000 to 2012. The find that risk premium was positive on average but they
record a strong impact of seasonality causing negative risk premium for quarters related to summer
and winter while positive risk premia for spring and autumn quarters. Cartea and Villaplana (2008)
study the risk premium in PJM, England and Wales, and Nord Pool markets and find that in PJM and
E&W markets there are periods in which forward premium achieves negative values. Kolos and Ronn
(2008) estimate positive risk premiums for the German EEX market and negative for the US PJM
market. Furió and Meneu (2010) consider the monthly contracts for Spanish from 2003 to 2008. They
find that two subperiods exists: before 2006 the mean forward premium was negative while after
2006 it was positive. In the Italian market Casula and Masala (2020) find that monthly futures
contracts risk premium between 2011 and 2016 were negative on average while Falbo, Felletti, and
Stefani (2014) have studied risk premia in the same market between 2008 and 2013 and find a positive
value. Bevin-McCrimmon et al. (2018) focus on New Zealand market and study the relation between
risk premia of quarterly futures contracts and market liquidity for the period from 2009 to 2015. They
showed that for contracts exchanged two years ahead risk premia reduce as liquidity increases.
In this work we follow this stream of literature, performing a comprehensive analysis of the risk
premia in four large European markets, namely, Italy, Germany, France and Switzerland. We study
the relationship between spot and forward prices in these electricity markets in order to quantify and
evaluate the risk premia for all forward contracts exchanged in these markets in the last decade,
namely, from 2010 to 2019. In order to carry out the task we follow an ex post analysis of risk premia,
namely, we study whether and how the future price have converged or not to the realized average
spot prices that have been observed for the delivery period, per each type of product traded, monthly,
quarterly and annual.4 We investigate if and by how much the risk premia depended on the length of
the contracting period, and the delivery duration; moreover, motivated by the undecisive results about
the sign of the risk premia, we also investigate if a change in the sign of the premia is observed when
comparing the beginning of the contraction period and the end of the exchange period. The latter
would indicate that the need to cover risks shifted across market participants as contracts approach
their maturity.
The paper is organized as follows. In Section 2, data is presented and discussed. Section 3 presents
the formal definition of risk premium that we employ here as well as the empirical strategy followed.
Results are presented and discussed in Section 4, and conclusion follow in Section 5. Further analyses
and data are available as supplementary material.
4 At EEX, also daily and weekly futures are exchanged for Italy, France, Germany and Switzerland. Usually the trading
of these products start at most one month before the delivery. We do not include them in our study since their period of
exchange is too short and does not allow to perform a comprehensive analysis of the behaviour of the risk premia overtime
during the exchange period.

4
2. Data In electricity markets, electricity is traded on an hourly base, the day before the delivery; thus, the
prices are termed day-ahead prices. Future prices are traded continuously (during market opening
times) every day before the delivery. In this work, we consider daily base-load and peak-load futures
quotations at the daily settlement prices of futures exchanged at EEX platform5 for Italy, France,
Germany and Switzerland. For the prices of the underlying, we consider the daily average day-ahead
hourly prices. Time series considered starts from the beginning of 2010 to the end of 2019. All
contracts are quoted in Euro/MWh. The minimum daily price fluctuation is set to 0.01 €/MWh while
there no limits on maximum price fluctuation. At EEX, for monthly and yearly contracts, the trading
always terminates on the business day before the first day of the delivery, while the trading for
monthly contracts continue till the end of the delivery period.
Each future contract exchanged refers to a Country, a type of power delivered, namely, base-load or
peak-load (for Switzerland just baseload contracts are exchanged), and a delivery period (either a
month, a quarter, or a year). Monthly products are denoted by the first three letters of month and the
year of the delivery (for example FEB-18), quarterly products are denoted by Q followed by the
number of quarter they refer to and the year of the delivery (for example Q3-15), and yearly products
are referred as CAL followed by year of the delivery (for example CAL-17).
Our dataset contains data of daily settlement prices for each contract, from the starting of trade until
the last day before power delivery.6 Note that the starting of trade depends on the contracts
themselves. For EEX, monthly products are exchanged starting from 9 months before the delivery,
quarterly products from 11 full quarters and yearly products from 9 years before delivery. The dataset
includes also daily data on the open interests7 for all contracts considered. It is important to note that
in each trading day more than one product for a future delivery day can be exchanged.
The final dataset analyzed is composed by 166.526 observation for 936 contracts:
- 141 monthly, 45 quarterly and 10 yearly contracts for Italy;
- 196 monthly, 64 quarterly and 16 yearly contracts for France;
- 257 monthly, 89 quarterly and 21 yearly contracts for Germany8;
- 72 monthly, 20 quarterly and 5 yearly contracts for Switzerland.
Day-ahead time series contains 374.783 hourly observations for each of the countries we consider.
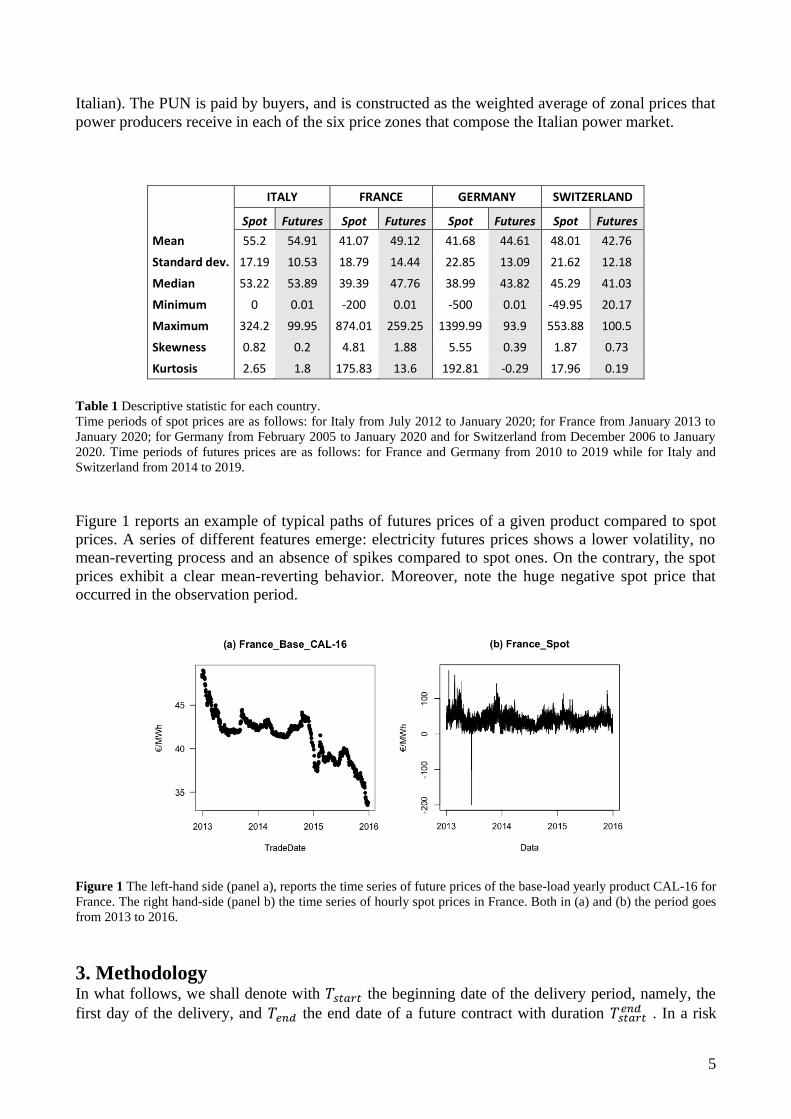
Table 1 contains descriptive statistics of day-ahead and future prices for all countries considered. We
observe very high volatility with spikes which can also be negative. Spikes are usually caused by
exogenous factors which cause an electricity supply deficit that cannot be filled with existing power
capacity; this in turn will cause a sudden and massive increase in the price of electricity. Negative
spot prices are due to load reduction and rigid supply with non-convexities in the cost functions (Cretì
and Fontini, 2020). When this happens, buyer receive both electricity and money from the producers.9
For Italy prices refer to the so-called PUN (“Prezzo Unico Nazionale” – single national price, in
5 See http:// www.EEX.com 6 We do not include in our data the future prices of monthly contracts traded during the delivery period since we focus on
the comparison between forward prices and expected ones before the day of the delivery. 7 Open interests are a market liquidity measure. They represent the total number of futures contracts for a given product
that have not yet been closed out. 8 Before 2017 there was only one electricity futures market for Germany and Austria, i.e. Phelix Power Futures. After
that date EEX launched two different power futures for the domestic Austrian market area (Phelix-AT Power Futures)
and German market area (Phelix-DE Power Futures). In our analysis we used, as reference price for the study of Germany,
the Phelix Power Futures a before 2017 and subsequently the Phelix-DE Power Futures. 9 Negative electricity prices have administratively set lower limits. In the Italian power exchange, the lower bound of
prices is zero, namely, negative prices are not allowed.
5
Italian). The PUN is paid by buyers, and is constructed as the weighted average of zonal prices that
power producers receive in each of the six price zones that compose the Italian power market.
ITALY FRANCE GERMANY SWITZERLAND
Spot Futures Spot Futures Spot Futures Spot Futures
Mean 55.2 54.91 41.07 49.12 41.68 44.61 48.01 42.76
Standard dev. 17.19 10.53 18.79 14.44 22.85 13.09 21.62 12.18
Median 53.22 53.89 39.39 47.76 38.99 43.82 45.29 41.03
Minimum 0 0.01 -200 0.01 -500 0.01 -49.95 20.17
Maximum 324.2 99.95 874.01 259.25 1399.99 93.9 553.88 100.5
Skewness 0.82 0.2 4.81 1.88 5.55 0.39 1.87 0.73
Kurtosis 2.65 1.8 175.83 13.6 192.81 -0.29 17.96 0.19
Table 1 Descriptive statistic for each country.
Time periods of spot prices are as follows: for Italy from July 2012 to January 2020; for France from January 2013 to
January 2020; for Germany from February 2005 to January 2020 and for Switzerland from December 2006 to January
2020. Time periods of futures prices are as follows: for France and Germany from 2010 to 2019 while for Italy and
Switzerland from 2014 to 2019.
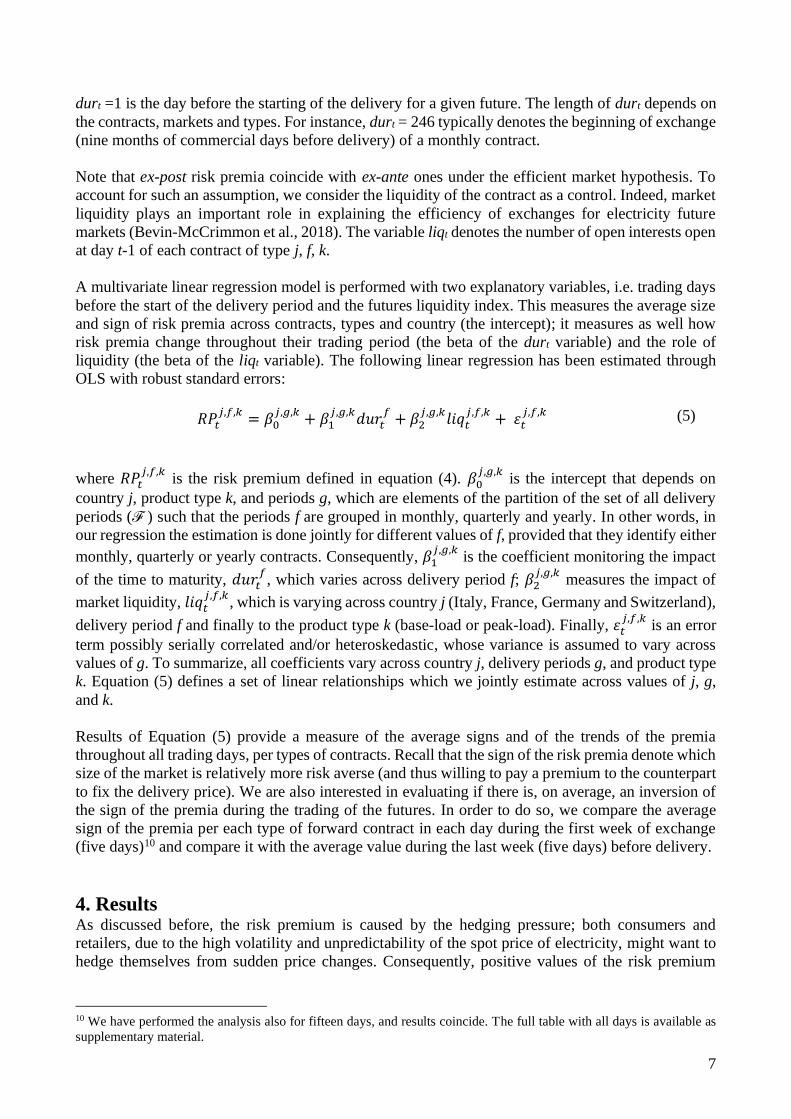
Figure 1 reports an example of typical paths of futures prices of a given product compared to spot
prices. A series of different features emerge: electricity futures prices shows a lower volatility, no
mean-reverting process and an absence of spikes compared to spot ones. On the contrary, the spot
prices exhibit a clear mean-reverting behavior. Moreover, note the huge negative spot price that
occurred in the observation period.
Figure 1 The left-hand side (panel a), reports the time series of future prices of the base-load yearly product CAL-16 for
France. The right hand-side (panel b) the time series of hourly spot prices in France. Both in (a) and (b) the period goes
from 2013 to 2016.
3. Methodology In what follows, we shall denote with 𝑇𝑠𝑡𝑎𝑟𝑡 the beginning date of the delivery period, namely, the
first day of the delivery, and 𝑇𝑒𝑛𝑑 the end date of a future contract with duration 𝑇𝑠𝑡𝑎𝑟𝑡𝑒𝑛𝑑 . In a risk

6
neutral world, the price of an electricity futures contract traded in t with delivery period from 𝑇𝑠𝑡𝑎𝑟𝑡to
𝑇𝑒𝑛𝑑 is:
𝐹𝑡,𝑇𝑠𝑡𝑎𝑟𝑡𝑒𝑛𝑑 =
1
𝑇𝑒𝑛𝑑 − 𝑇𝑠𝑡𝑎𝑟𝑡∑ 𝔼𝑡[𝑆𝑇]
𝑇𝑒𝑛𝑑
𝑇=𝑇𝑠𝑡𝑎𝑟𝑡
(1)
Where 𝐹𝑡,𝑇𝑠𝑡𝑎𝑟𝑡𝑒𝑛𝑑 is the futures price of the forward contract with delivery starting at date 𝑇𝑠𝑡𝑎𝑟𝑡 and
ending at date 𝑇𝑒𝑛𝑑 , evaluated at time t; 𝑆𝑇 is the daily average hourly day-ahead price of day T; 𝔼𝑡
is the expected value operator conditioned to the information available at the trade time t. The
algebraic difference between the left-hand side and the right hand side of equation 1 is the risk
premium of the underlying asset:
𝑅𝑃𝑡𝑒𝑥−𝑎𝑛𝑡𝑒 = 𝐹𝑡,𝑇𝑠𝑡𝑎𝑟𝑡
𝑒𝑛𝑑 − 1
𝑇𝑒𝑛𝑑 − 𝑇𝑠𝑡𝑎𝑟𝑡∑ 𝔼𝑡[𝑆𝑇]
𝑇𝑒𝑛𝑑
𝑇=𝑇𝑠𝑡𝑎𝑟𝑡
(2)
The definition above is the so-called ex-ante risk premium, which is based on the specific definition
of the expectations. Under a market efficiency hypothesis, expectations should coincide with realized
values plus an iid random error term (Cartea and Villaplana, 2014; Lucia and Torró, 2011). This gives
rise to the so-called ex-post risk premium, in which the expected values of the underlying asset is
substituted with the realized values that have been observed ex-post:
𝑅𝑃𝑡𝑒𝑥−𝑝𝑜𝑠𝑡 = 𝐹𝑡,𝑇𝑠𝑡𝑎𝑟𝑡
𝑒𝑛𝑑 − 1
𝑇𝑒𝑛𝑑 − 𝑇𝑠𝑡𝑎𝑟𝑡∑ 𝑆𝑇
𝑇𝑒𝑛𝑑
𝑇=𝑇𝑠𝑡𝑎𝑟𝑡
(3)
By using the ex-post risk premium we assume that the market is efficient and that operators’
expectations are unbiased and thus the error term vanishes.
Equation (3) allows us to calculate the risk premium for each trading day t per each contract in our
dataset. We start from hourly day-ahead (spot) time series and compute both base-load and peak load
daily average prices; then, the average monthly, quarterly and yearly prices have been calculated to
be used as, respectively, the ex-post expected monthly, quarterly and yearly day-ahead prices, each
one for the corresponding contract with a given delivery period. The risk premia for each trading day
t has then been calculated as:
𝑅𝑃𝑡𝑗,𝑓,𝑘
= 𝐹𝑡𝑗,𝑓,𝑘
− �̅�𝑗,𝑓,𝑘 (4)
where 𝑅𝑃𝑡𝑗,𝑓,𝑘
is the risk premium at time t, relative to country j (France, Switzerland, Italy and
Germany), for a contract related to a product type k (baseload or peak), with a specific delivery period
f (where 𝑓 ∈ ℱ, being ℱ is the set of all delivery periods - that is, all monthly, quarterly and yearly
deliveries for all time span considered). 𝐹𝑡𝑗,𝑓,𝑘
is the daily settlement future price contracted at day t;
finally �̅�𝑗,𝑓,𝑘 is the mean of the daily spot prices verified in the delivery period of the contract j ,f, k
(from now onward for brevity of notation we shall omit uppercase j, f, k whenever not needed).
We also construct the variable 𝑑𝑢𝑟𝑡𝑗,𝑓,𝑘
= 𝑇𝑠𝑡𝑎𝑟𝑡(𝑓) − 𝑡 that measures the trading day remaining
before the beginning of delivery for each contract of type k, country j and delivery period f. Thus,
7
durt =1 is the day before the starting of the delivery for a given future. The length of durt depends on
the contracts, markets and types. For instance, durt = 246 typically denotes the beginning of exchange
(nine months of commercial days before delivery) of a monthly contract.
Note that ex-post risk premia coincide with ex-ante ones under the efficient market hypothesis. To
account for such an assumption, we consider the liquidity of the contract as a control. Indeed, market
liquidity plays an important role in explaining the efficiency of exchanges for electricity future
markets (Bevin-McCrimmon et al., 2018). The variable liqt denotes the number of open interests open
at day t-1 of each contract of type j, f, k.
A multivariate linear regression model is performed with two explanatory variables, i.e. trading days
before the start of the delivery period and the futures liquidity index. This measures the average size
and sign of risk premia across contracts, types and country (the intercept); it measures as well how
risk premia change throughout their trading period (the beta of the durt variable) and the role of
liquidity (the beta of the liqt variable). The following linear regression has been estimated through
OLS with robust standard errors:
𝑅𝑃𝑡𝑗,𝑓,𝑘
= 𝛽0𝑗,𝑔,𝑘
+ 𝛽1𝑗,𝑔,𝑘
𝑑𝑢𝑟𝑡𝑓
+ 𝛽2𝑗,𝑔,𝑘
𝑙𝑖𝑞𝑡𝑗,𝑓,𝑘
+ 𝜀𝑡𝑗,𝑓,𝑘
(5)
where 𝑅𝑃𝑡𝑗,𝑓,𝑘
is the risk premium defined in equation (4). 𝛽0𝑗,𝑔,𝑘
is the intercept that depends on
country j, product type k, and periods g, which are elements of the partition of the set of all delivery
periods (ℱ ) such that the periods f are grouped in monthly, quarterly and yearly. In other words, in
our regression the estimation is done jointly for different values of f, provided that they identify either
monthly, quarterly or yearly contracts. Consequently, 𝛽1𝑗,𝑔,𝑘
is the coefficient monitoring the impact
of the time to maturity, 𝑑𝑢𝑟𝑡𝑓, which varies across delivery period f; 𝛽2
𝑗,𝑔,𝑘 measures the impact of
market liquidity, 𝑙𝑖𝑞𝑡𝑗,𝑓,𝑘
, which is varying across country j (Italy, France, Germany and Switzerland),
delivery period f and finally to the product type k (base-load or peak-load). Finally, 𝜀𝑡𝑗,𝑓,𝑘
is an error
term possibly serially correlated and/or heteroskedastic, whose variance is assumed to vary across
values of g. To summarize, all coefficients vary across country j, delivery periods g, and product type
k. Equation (5) defines a set of linear relationships which we jointly estimate across values of j, g,
and k.
Results of Equation (5) provide a measure of the average signs and of the trends of the premia
throughout all trading days, per types of contracts. Recall that the sign of the risk premia denote which
size of the market is relatively more risk averse (and thus willing to pay a premium to the counterpart
to fix the delivery price). We are also interested in evaluating if there is, on average, an inversion of
the sign of the premia during the trading of the futures. In order to do so, we compare the average
sign of the premia per each type of forward contract in each day during the first week of exchange
(five days)10 and compare it with the average value during the last week (five days) before delivery.
4. Results As discussed before, the risk premium is caused by the hedging pressure; both consumers and
retailers, due to the high volatility and unpredictability of the spot price of electricity, might want to
hedge themselves from sudden price changes. Consequently, positive values of the risk premium
10 We have performed the analysis also for fifteen days, and results coincide. The full table with all days is available as
supplementary material.
8
indicate a relatively higher risk aversion of consumers; on the contrary, negative values of the
premium risk indicate a situation in which producers’ risk aversion is greater.
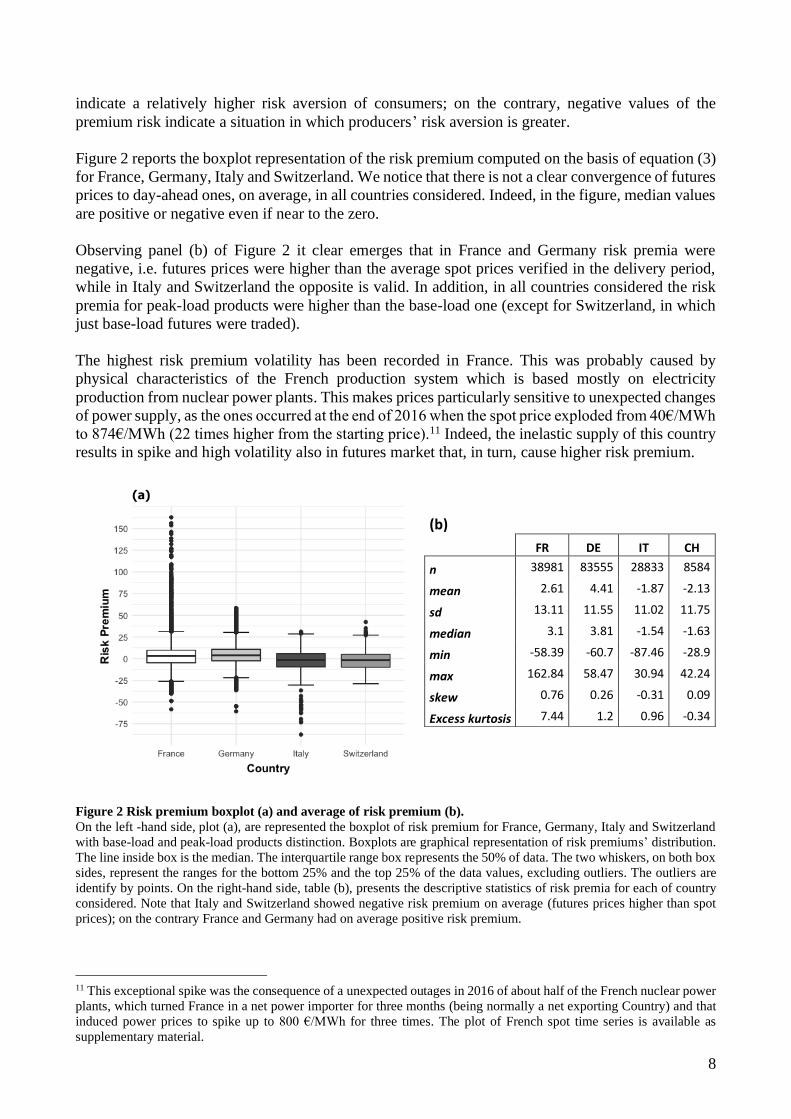
Figure 2 reports the boxplot representation of the risk premium computed on the basis of equation (3)
for France, Germany, Italy and Switzerland. We notice that there is not a clear convergence of futures
prices to day-ahead ones, on average, in all countries considered. Indeed, in the figure, median values
are positive or negative even if near to the zero.
Observing panel (b) of Figure 2 it clear emerges that in France and Germany risk premia were
negative, i.e. futures prices were higher than the average spot prices verified in the delivery period,
while in Italy and Switzerland the opposite is valid. In addition, in all countries considered the risk
premia for peak-load products were higher than the base-load one (except for Switzerland, in which
just base-load futures were traded).
The highest risk premium volatility has been recorded in France. This was probably caused by
physical characteristics of the French production system which is based mostly on electricity
production from nuclear power plants. This makes prices particularly sensitive to unexpected changes
of power supply, as the ones occurred at the end of 2016 when the spot price exploded from 40€/MWh
to 874€/MWh (22 times higher from the starting price).11 Indeed, the inelastic supply of this country
results in spike and high volatility also in futures market that, in turn, cause higher risk premium.
Figure 2 Risk premium boxplot (a) and average of risk premium (b).
On the left -hand side, plot (a), are represented the boxplot of risk premium for France, Germany, Italy and Switzerland
with base-load and peak-load products distinction. Boxplots are graphical representation of risk premiums’ distribution.
The line inside box is the median. The interquartile range box represents the 50% of data. The two whiskers, on both box
sides, represent the ranges for the bottom 25% and the top 25% of the data values, excluding outliers. The outliers are
identify by points. On the right-hand side, table (b), presents the descriptive statistics of risk premia for each of country
considered. Note that Italy and Switzerland showed negative risk premium on average (futures prices higher than spot
prices); on the contrary France and Germany had on average positive risk premium.
11 This exceptional spike was the consequence of a unexpected outages in 2016 of about half of the French nuclear power
plants, which turned France in a net power importer for three months (being normally a net exporting Country) and that
induced power prices to spike up to 800 €/MWh for three times. The plot of French spot time series is available as
supplementary material.
(b)
FR DE IT CH
n 38981 83555 28833 8584
mean 2.61 4.41 -1.87 -2.13
sd 13.11 11.55 11.02 11.75
median 3.1 3.81 -1.54 -1.63
min -58.39 -60.7 -87.46 -28.9
max 162.84 58.47 30.94 42.24
skew 0.76 0.26 -0.31 0.09
Excess kurtosis 7.44 1.2 0.96 -0.34

9
The results of the estimation of the regression model presented in Equation (4) are displayed in Table
2. The dependent variable is the daily risk premium. Robust standard errors are reported in
parenthesis. The intercept measures the average value of the risk premia per each type, country and
product. In France we observe that the value increases as delivery period rises, both for base-load and
peak-load contract. The opposite occurs in Germany in which shorter maturity are associated with
higher risk premia. For Italy and Switzerland, the highest values of risk premia are associated to
quarterly products. There are negative premia for yearly Germany products, yearly peak-load
products and Switzerland base-load products.
FR DE IT CH
Base Peak Base Peak Base Peak Base Peak
β_0
Monthly 2.446 *** 1.291 ** 2.553 *** 2.538 *** 2.164 *** -1.646 *** 1.116 *** -
(0.305) (0.546) (0.144) (0.181) (0.286) (0.373) (0.318) -
Quarterly 10.386 *** 6.330 *** 1.336 *** 0.729 *** 3.336 *** 2.492 *** 4.359 *** -
(0.283) (0.432) (0.192) (0.237) (0.313) (0.474) (0.498) -
Yearly 10.576 *** 10.164 *** -1.039 *** -7.949 *** 3.051 *** -0.419 -11.399 *** -
(0.351) (0.475) (0.346) (0.584) (0.634) (0.806) (0.389) -
β_1
Monthly -0.002 0.079 *** -0.009 *** -0.005 ** -0.044 *** 0.026 *** -0.064 *** -
(0.005) (0.012) (0.002) (0.002) (0.004) (0.008) (0.008) -
Quarterly -0.046 *** -0.017 *** 0.004 *** 0.014 *** -0.034 *** -0.031 *** -0.049 *** -
(0.001) (0.002) (0.001) (0.001) (0.001) (0.002) (0.003) -
Yearly -0.018 *** -0.012 *** 0.014 *** 0.026 *** -0.029 *** -0.031 *** -0.022 *** -
(0.001) (0.001) (0.0004) (0.001) (0.002) (0.003) (0.001) -
β_2
Monthly 0.0001 *** 0.003 *** 0.00000 -0.0001 *** 0.00000 0.001 *** 0.007 *** -
(0.00002) (0.0003) (0.00000) (0.00002) (0.00001) (0.0001) (0.001) -
Quarterly -0.001 *** -0.001 *** 0.00002 *** 0.0002 *** -0.0001 *** -0.001 ** -0.004 *** -
(0.00002) (0.0003) (0.00000) (0.00003) (0.00001) (0.0003) (0.001) -
Yearly -0.002 *** -0.011 *** 0.00000 0.002 *** -0.0003 *** 0.004 *** 0.038 *** -
(0.00004) (0.001) (0.00001) (0.0001) (0.00005) (0.001) (0.001) -
R2
Monthly 0.006 0.014 0.003 0.001 0.022 0.023 0.097 -
Quarterly 0.149 0.007 0.003 0.021 0.102 0.037 0.076 -
Yearly 0.227 0.054 0.172 0.237 0.155 0.167 0.528 -
Table 2. Relationship between daily risk premium, days before the delivery and open interest.
The table provide OLS regression estimates using Eq. (12). The dependent variable is daily risk premium. Robust standard
errors are reported in parenthesis. Coefficients with p-values lower than 1%, 5% or 10% are highlighted with one (*), two
(**) and three (***) asterisks, respectively. R2 is the determination coefficient.
The values of the coefficients associated with the time before the delivery, 𝛽1, show how premium
change, on average, as the delivery moves away. For almost all base-load products we observe a
negative coefficient, the only exception being the German quarterly and yearly contracts. This means
that, as durt reduces, the value of the premia tends to increase; as trading time approaches the delivery
period, risk premia rise. A similar tendency occurs for peak load contracts, with the notable

10
exceptions of monthly contracts, for which risk premia reduces as maturity approaches in France and
Italy, while there is no significant difference between forward and spot prices for monthly German
ones.
Moreover, even if coefficients of liquidity are on average significant, they are very small, and no
clear indication arises with respect to their sign as they are near to zero and displays no homogeneous
sign. Finally, if we focus on the coefficients of determination, we observe some heterogeneity across
countries and delivery lengths. Overall, we observe that the largest values of R-squared are observed
for yearly deliveries.
In Table 3 and Table 4 we report the average signs of the premia for the first five trading days and
the last five trading days before delivery., respectively It should be noted that for the majority of
products the magnitude of premia tends to rise as delivery approaches (the only exception being the
yearly French and German contracts). In addition, the risk premia are higher for products with longer
delivery periods. Note that in Germany and France the risk premium is positive both at the begging
and at the end of the trading period. On the contrary, for Italy and Switzerland, there is, on average,
also a sign inversion: while at the begging of the trading period the sign is negative, it becomes
positive as the delivery period approach (for Switzerland, this occurs for all products but monthly
ones).
The first 5 trading days
FR DE IT CH
Base Peak Base Peak Base Peak Base
t = 1
Monthly 0.874 5.639 1.903 3.481 -3.485 -3.604 2.359
Quarterly 0.115 2.767 3.086 6.152 -3.583 -11.019 -2.963
Yearly 6.138 10.088 21.602 32.146 -2.214 -6.987 -14.556
t = 2
Monthly 1.903 5.535 1.862 3.782 -2.26 0.425 2.559
Quarterly 0.112 2.787 2.931 5.971 -3.651 -8.712 -3.27
Yearly 5.745 9.879 20.977 32.854 -2.036 -7.425 -14.464
t = 3
Monthly 1.934 5.74 1.906 3.721 -2.324 0.561 2.357
Quarterly 0.022 2.655 2.878 5.845 -3.76 -6.777 -3.201
Yearly 5.498 9.478 20.105 32.194 -2.048 -7.659 -14.549
t = 4
Monthly 1.95 5.625 2.031 3.655 -2.229 0.43 2.232
Quarterly 0.037 2.256 2.849 5.901 -3.79 -6.785 -3.481
Yearly 4.984 9.122 20.149 32.022 -2.092 -7.601 -14.694
t = 5
Monthly 2.705 5.606 1.987 3.678 -2.111 0.526 2.053
Quarterly 0.02 2.29 2.781 5.706 -3.712 -6.649 -3.611
Yearly 4.986 9.201 19.951 31.531 -2.168 -7.411 -14.549
Table 3. Average of risk premium for each of the first 5 days of trading period.
The table provide average of risk premium for France, Germany, Italy and Switzerland both for base-load and peak-load
products for each of the first 5 days of the trading period. Shaded cells denote negative figures.

11
The last 5 trading days
FR DE IT CH
Base Peak Base Peak Base Peak Base
t = 1
Monthly 2,103 3,143 1,103 1,021 0,11 -0,021 1,222
Quarterly 2,415 3,794 2,029 2,385 0,477 0,833 0,88
Yearly 3,144 5,628 3,704 4,94 0,37 0,707 1,426
t = 2
Monthly 1,927 3,018 1,307 1,132 0,168 0,032 1,155
Quarterly 2,439 3,818 2,06 2,461 0,486 0,8 1,076
Yearly 3,289 5,751 3,842 5,063 0,432 0,913 1,654
t = 3
Monthly 1,758 2,864 1,346 1,228 0,058 -0,087 1,012
Quarterly 2,478 3,783 2,151 2,487 0,646 0,924 1,219
Yearly 3,194 5,625 3,819 5,027 0,416 1,125 1,494
t = 4
Monthly 1,744 2,792 1,327 1,233 0,031 -0,036 1,136
Quarterly 2,391 3,578 2,133 2,566 0,57 0,912 1,058
Yearly 3,198 5,798 3,926 5,163 0,446 1,055 1,659
t = 5
Monthly 1,768 2,993 1,422 1,336 0,138 0,105 1,342
Quarterly 2,259 3,576 2,109 2,514 0,61 0,815 1,101
Yearly 2,951 5,633 3,597 4,879 0,092 0,729 1,439
Table 4. Average of risk premium for each of the last 15 days of trading period.
The table provide average of risk premium for France, Germany, Italy and Switzerland both for base-load and peak-load
products for each of the last 5 days of the trading period. Shaded cells denote negative figures.
Conclusions
In this paper we examine the relationship between day-ahead and futures prices in electricity market
of Germany, France, Italy and Switzerland. The electricity futures prices depend both on the spot
price expectations and on a risk component, that could be positive or negative. A positive (or
negative) premium risk corresponds to a futures price higher (or lower) than the average spot price
recorded during the delivery period. This signals that buyers (sellers) are willing to buy at a premium
in order to fix the electricity price for the delivery period.
We analyze a large sample of data of short, medium and long-term futures contracts which spans over
a decade for four big European Continental markets, namely, Italy, Germany, France and Switzerland.
Our results confirm that there is no-convergence on average of future prices to the realized prices.
Moreover, we show that there is on average a negative relation between risk premia and days before
the delivery period: the closer the trading day is to the expiration date, the bigger the risk premium.
For all countries and products considered the risk premium verified at the end of the trading period
is positive. However, for Italy and Switzerland there is an inversion of the sign of the risk premia: at
the begging of the trading period on average risk premium are negative, rising as expiration time
approaches.
The inversion of sign might be due to market power of the participants, as conjectured in the literature
by Kolos and Ronn (2008), and in paticular by the fact that power producers have a relatively weaker
market power for longer maturities. Thus, power producers, in order to be sure to sell electricity in

12
the long run, could be willing to accept a discounted price compared to the expected spot ones well
ahead of the delivery. In this case, our analysis would signal that such a behavior occurs in Italy and
Switzerland, but not in France and Germany, where the sign of risk premium is on average positive,
both at the beginning and at the end of the trading period. Another possible reason might be related
to the progressive introduction of renewables in the grid, that increased (in particular in Italy) during
the period considered in the analysis, which has generated a rise in day-ahead variance (Ketterer,
2014; Maciejowska, 2020; Rai and Nunn 2020).
In any case, the detailed identification of the factors behind the risk premiums trend over time goes
beyond the scope of this paper and requires further analysis to precisely identify the real causes.
Further study could relate the energy production and renewables of each country to the risk premium
trends that we have analyzed here.
Overall, we shown that premia have a complex facet. Their amount and trend depend on the
characteristics of the products, the reference market, as well as the duration of the contract and how
early they are traded compared to the delivery. This results could be of interest for market participants
and traders, for both speculative and hedging perspectives, as well as monitoring agencies that could
investigate further the nature of the different premia observed.

13
References
Aid, Rene. 2015. Electricity Derivatives. Edited by Springer. 1st ed. Springer International
Publishing. https://doi.org/10.1007/978-3-319-08395-7.
Bessembinder, H, and M L Lemmon. 2002. “Equilibrium Pricing and Optimal Hedging in Electricity
Forward Markets.” Journal of Finance 57 (3): 1347–82. https://doi.org/10.1111/1540-
6261.00463.
Bessembinder, Hendrik. 1992. “Systematic Risk, Hedging Pressure, and Risk Premiums in Futures
Markets.” The Review of Financial Studies 5 (4): 637–67.
Bevin-McCrimmon, Fergus, Ivan Diaz-Rainey, Matthew McCarten, and Greg Sise. 2018. “Liquidity
and Risk Premia in Electricity Futures.” Energy Economics 75: 503–17.
https://doi.org/10.1016/j.eneco.2018.09.002.
Botterud, A, T Kristiansen, and M D Ilic. 2010. “The Relationship between Spot and Futures Prices
in the Nord Pool Electricity Market.” Energy Economics 32 (5): 967–78.
https://doi.org/10.1016/j.eneco.2009.11.009.
Cartea, Álvaro, and Pablo Villaplana. 2008. “Spot Price Modeling and the Valuation of Electricity
Forward Contracts: The Role of Demand and Capacity.” Journal of Banking and Finance 32
(12): 2502–19. https://doi.org/10.2139/ssrn.1024243.
Cartea, Álvaro, and Pablo Villaplana. 2014. “An Analysis of the Main Determinants of Electricity
Forward Prices and Forward Risk Premia.” In Quantitative Energy Finance: Modeling, Pricing,
and Hedging in Energy and Commodity Markets, edited by Norway) Benth, Fred Espen (Center
of Mathematics for Applications, University of Oslo, Oslo, Austria) Kholodnyi, Valery A.
(Verbund Trading AG, Vienna, and Italy) Laurence, Peter (Dipartimento di Matematica,
University di Roma, La Sapienza, Rome, 215–36. Springer New York LLC.
https://doi.org/10.1007/978-1-4614-7248-3_8.
Casula, L, and G Masala. 2020. “Electricity Derivatives: An Application to the Futures Italian
Market.” Empirical Economics. https://doi.org/10.1007/s00181-020-01915-2.
Cretì, Anna, and Fulvio Fontini. 2020. Economics of Electricity Markets, Competition and Rules.
Edited by Cambridge University Press.
Falbo, Paolo, Daniele Felletti, and Silvana Stefani. 2014. “Electricity Futures.” In The World
Scientific Handbook of Futures Markets, 635–60. World Scientific.
https://doi.org/https://doi.org/10.1142/9789814566926_0018.
Furió, Dolores, and Vicente Meneu. 2010. “Expectations and Forward Risk Premium in the Spanish
Deregulated Power Market.” Energy Policy 38 (2): 784–93.
https://doi.org/10.1016/j.enpol.2009.10.023.
Handika, Rangga, and Stefan Trueck. 2013. “Risk Premiums in Interconnected Australian Electricity
Futures Markets.” SSRN Electronic Journal. https://doi.org/10.2139/ssrn.2279945.
Hoff, Guttorm André, and Maria Mortensen. 2014. “The Nordic Electricity Market: The Risk
Premium in Mid-Term Futures Contracts,” no. May. https://ntnuopen.ntnu.no/ntnu-
xmlui/handle/11250/2400629.
Junttila, J, V Myllymäki, and J Raatikainen. 2018. “Pricing of Electricity Futures Based on Locational
Price Differences: The Case of Finland.” Energy Economics 71: 222–37.
https://doi.org/10.1016/j.eneco.2018.02.018.
Ketterer, Janina C. 2014. “The Impact of Wind Power Generation on the Electricity Price in
Germany.” Energy Economics 44: 270–80. https://doi.org/10.1016/j.eneco.2014.04.003.
Knaut, Andreas, and Martin Paschmann. 2019. “Price Volatility in Commodity Markets with
Restricted Participation.” Energy Economics 81: 37–51.
https://doi.org/10.1016/j.eneco.2019.03.004.
Kolos, S P, and E I Ronn. 2008. “Estimating the Commodity Market Price of Risk for Energy Prices.”
Energy Economics 30 (2): 621–41. https://doi.org/10.1016/j.eneco.2007.09.005.
14
Li, L, R Mendoza-Arriaga, Z Mo, and D Mitchell. 2016. “Modelling Electricity Prices: A Time
Change Approach.” Quantitative Finance 16 (7): 1089–1109.
https://doi.org/10.1080/14697688.2015.1125521.
Lucia, J J, and H Torró. 2011. “On the Risk Premium in Nordic Electricity Futures Prices.”
International Review of Economics and Finance 20 (4): 750–63.
https://doi.org/10.1016/j.iref.2011.02.005.
Maciejowska, Katarzyna. 2020. “Assessing the Impact of Renewable Energy Sources on the
Electricity Price Level and Variability – A Quantile Regression Approach.” Energy Economics
85: 104532. https://doi.org/10.1016/j.eneco.2019.104532.
Pietz, Matthäus. 2009. “Risk Premia in the German Electricity Futures Market.” SSRN Electronic
Journal. https://doi.org/10.2139/ssrn.1400120.
Rai, Alan, and Oliver Nunn. 2020. “On the Impact of Increasing Penetration of Variable Renewables
on Electricity Spot Price Extremes in Australia.” Economic Analysis and Policy 67: 67–86.
https://doi.org/10.1016/j.eap.2020.06.001.
Shawky, H A, A Marathe, and C L Barrett. 2003. “A First Look at the Empirical Relation between
Spot and Futures Electricity Prices in the United States.” Journal of Futures Markets 23 (10):
931–55. https://doi.org/10.1002/fut.10093.