
The Relationship between Critical Success Factors …...The Relationship between Critical Success...
14
e Relationship between Critical Success Factors (CSFs) and Organisational Performance A Study of Small to Medium Enterprises Rajkumar B. Chadge, Rakesh L. Shrivastava and Surendra D. Kshirsagar Department of Mechanical Engineering, Yeshwantrao Chavan College of Engineering, Nagpur, India E-mail: [email protected] [email protected] [email protected] ISSN: 2348-2869 (print), 2348-5434 (online) © 2014 Symbiosis Centre for Management Studies, NOIDA Journal of General Management Research, Vol. 1, Issue 2, July 2014, pp. 69–82. Abstract Small to medium enterprises are observed as a fertile area for the formation of effective furniture cluster. However, most of the research to date has focused primarily on large companies. ese seem to be a lack of thorough research reported in the literature that tests the relationship between CSFs and organisation performance. Quantitative data was gathered from a random sample of Indian Furniture Cluster. A total of 715 respondents were sent the questionnaire from which a response rate of 49 percent was achieved. Performance improvement regression model were developed in order to test the strength of relationship between success factors and several dimensions of performance improvement of furniture cluster. e data was analyzed using techniques available on the statistical package for social sciences. e paper concludes that 11 critical success factors are required for improving the performance of cluster. e main implication of the research results for furniture cluster is that JOURNAL OF GENERAL MANAGEMENT RESEARCH 69
Transcript of The Relationship between Critical Success Factors …...The Relationship between Critical Success...

69
The Relationship between Critical Success Factors (CSFs) and Organisational PerformanceA Study of Small to Medium Enterprises
Rajkumar B. Chadge, Rakesh L. Shrivastava and Surendra D. Kshirsagar
Department of Mechanical Engineering, Yeshwantrao Chavan College of Engineering, Nagpur, India E-mail: [email protected] [email protected] [email protected]
ISSN: 2348-2869 (print), 2348-5434 (online)
© 2014 Symbiosis Centre for Management Studies, NoIda
Journal of General Management Research, Vol. 1, Issue 2, July 2014, pp. 69–82.
Abstract Small to medium enterprises are observed as a fertile area for the formation of effective furniture cluster. However, most of the research to date has focused primarily on large companies. These seem to be a lack of thorough research reported in the literature that tests the relationship between CSFs and organisation performance. Quantitative data was gathered from a random sample of Indian Furniture Cluster. A total of 715 respondents were sent the questionnaire from which a response rate of 49 percent was achieved. Performance improvement regression model were developed in order to test the strength of relationship between success factors and several dimensions of performance improvement of furniture cluster. The data was analyzed using techniques available on the statistical package for social sciences. The paper concludes that 11 critical success factors are required for improving the performance of cluster. The main implication of the research results for furniture cluster is that
Journal of General ManaGeMent research
69
70 Journal of General Management Research
cluster is more likely to improve its chances of performance improvement with critical success factors than without these CSFs.
Keywords: CSFs, Furniture Cluster, Performance.
IntroductIon
In small-firm industrial districts, which are characterized by groups of geographically
concentrated, interlinked firms, the industries tend to, collaborate technologically and/or strategically. The growth and success of these industries depend on the extent of co-operation. This new type of industrial
organization seemed to flourish despite the predominance of SMEs in the structure and the trends of globalization. These agglomerations, or clusters of firms, have gained broad attention for their competitive characteristics. Clusters are agglomerations of interconnected companies and associated institutions. Firms in a cluster produce similar or related goods or services and are supported by a range of dedicated institutions located in spatial proximity, such as business associations or training and technical assistance providers. Vibrant clusters are homes of innovation oriented firms that reap the benefits of an integrated support system and dynamic
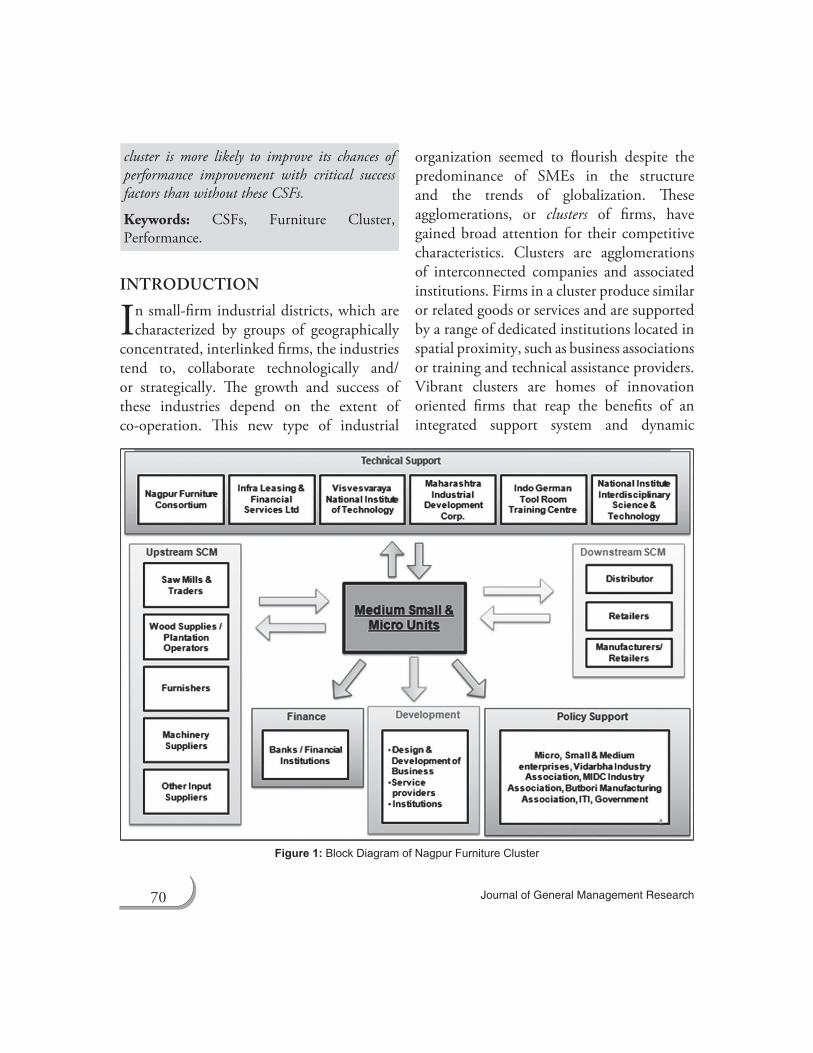
figure 1: Block Diagram of Nagpur Furniture Cluster
71 The Relationship between Critical Success Factors (CSFs) and Organisational Performance
business networks. Figure 1 shows the integration of a cluster with its supply chain and supporting firms.
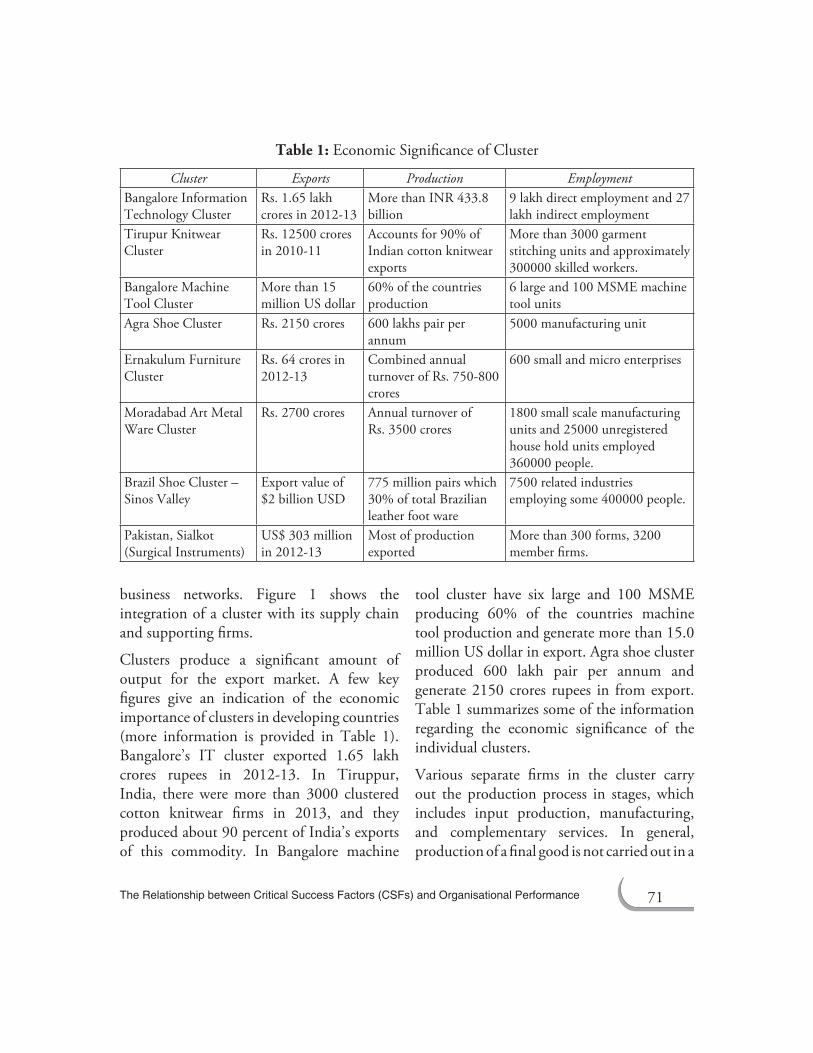
Clusters produce a significant amount of output for the export market. A few key figures give an indication of the economic importance of clusters in developing countries (more information is provided in Table 1). Bangalore’s IT cluster exported 1.65 lakh crores rupees in 2012-13. In Tiruppur, India, there were more than 3000 clustered cotton knitwear firms in 2013, and they produced about 90 percent of India’s exports of this commodity. In Bangalore machine
tool cluster have six large and 100 MSME producing 60% of the countries machine tool production and generate more than 15.0 million US dollar in export. Agra shoe cluster produced 600 lakh pair per annum and generate 2150 crores rupees in from export. Table 1 summarizes some of the information regarding the economic significance of the individual clusters.
Various separate firms in the cluster carry out the production process in stages, which includes input production, manufacturing, and complementary services. In general, production of a final good is not carried out in a
Table 1: Economic Significance of Cluster
Cluster Exports Production EmploymentBangalore Information Technology Cluster
Rs. 1.65 lakh crores in 2012-13
More than INR 433.8 billion
9 lakh direct employment and 27 lakh indirect employment
Tirupur Knitwear Cluster
Rs. 12500 crores in 2010-11
Accounts for 90% of Indian cotton knitwear exports
More than 3000 garment stitching units and approximately 300000 skilled workers.
Bangalore Machine Tool Cluster
More than 15 million US dollar
60% of the countries production
6 large and 100 MSME machine tool units
Agra Shoe Cluster Rs. 2150 crores 600 lakhs pair per annum
5000 manufacturing unit
Ernakulum Furniture Cluster
Rs. 64 crores in 2012-13
Combined annual turnover of Rs. 750-800 crores
600 small and micro enterprises
Moradabad Art Metal Ware Cluster
Rs. 2700 crores Annual turnover of Rs. 3500 crores
1800 small scale manufacturing units and 25000 unregistered house hold units employed 360000 people.
Brazil Shoe Cluster – Sinos Valley
Export value of $2 billion USD
775 million pairs which 30% of total Brazilian leather foot ware
7500 related industries employing some 400000 people.
Pakistan, Sialkot (Surgical Instruments)
US$ 303 million in 2012-13
Most of production exported
More than 300 forms, 3200 member firms.
72 Journal of General Management Research
single, vertically integrated firm. For example, shoe production in the Sinos Valley (Brazil) takes place in stages that are often carried out in different firms, although some firms were vertically integrated. In the Sinos Valley, there are suppliers that produce a variety of goods and services including raw materials, components, machinery, and services such as freelance design and transport. There also was an extensive use of subcontracting in the Sinos Valley, usually to small firms. In Sialkot (Pakistan), in addition to the clusters core producers, there were various process specialized subcontractors and suppliers of locally manufactured scrap steel. In the Agra (India) footwear cluster, there are many input suppliers that produce different components, such as lasts, tools, leather board, soles, laces, stiffeners, and chemicals.
LIterature revIewCritical Success Factors
The modern day industry works in global environment, which provides it opportunities and threats. To perform and prosper industry has to perform in certain key areas. D. Ronald Daniel (1961) first introduced the concept of key factors. To achieve organisational goals and accomplish its mission the organisation must ensure high performance in these key areas consistently. Rockhart (1979) described CSFs as the limited number of areas in which results, if they are satisfactory, will ensure successful competitive performance for the organisation. He (1982) further stated that favourable results in these areas are absolute necessary for a manager to reach his/her goals.
Various authors have attempted to define CSFs. J. Esteves and Pastor (2001) defined CSFs as the factors critical to the success of organisation. If these are not achieved organisation will fail. Rungasamy et al. (2002) too described them as essential to the success of any program. According to him if the objectives associated with these factors are not achieved the program will fail catastrophically. Wali et al. (2003) regarded CSFs as vital few requirements that must be present to attain organisational vision. According to Alazmi and Zairi (2003) these are limited number of areas in which results ensure successful competitive performance. Wong (2005) views them as the activities and practices that should be addressed to ensure successful performance. In more recent work, Fryer et al. (2007) explains that CSFs increase success rate reduce cost and prevent disillusionment with continuous process improvement program. In the latest work Sirus and Rahimi Moghaddam (2007) define CSF as durable activities that an organisation must undertake in order to achieve its mission.
In a nutshell, Critical Success Factors are those limited areas on which an organisation can spend its resources and focus its efforts to achieve the desired goals (Performance improvement, productivity, quality improve- ment and increasing its market share) in most effective and efficient manner.
Several articles have dealt with the identification and evaluation of Critical success factors for performance improvement of industries but the topic is still under considerable development and debate. Kuan
73 The Relationship between Critical Success Factors (CSFs) and Organisational Performance
Yew Wong (2005) reviewed the literature on critical success factors for implementing knowledge management. He proposed 11 CSFs which are believed to be more suitable for small and medium enterprises. G. Karuppusami and R. Gandhinathan (2006) reviewed the literature on critical success factors of total quality management. They examined 37 Empirical studies which resulted in 56 CSFs but it is difficult to operationlize this huge data. They analysed and sorted the CSFs in descending order according to frequency of occurrences using Pareto analysis. Karen J. Fryer et al. (2007) reviewed the literature on Critical success factors of continuous improvement in the public sector. It appears that there are factors that are important in manufacturing organisations that do not figure in service/public sector organisations and vice versa. Shahin Dezdar and Ainin Sulaiman (2009) analyzed all CFSs mentioned in literature during the last ten years and formulated taxonomy of ERP CSFs implementation. In total 17 CSFs were identified. These are categorized into five main categories. Ismail Sila and M. Ebrahimpour (2003) analysed, compared and empirically validated TQM factors and their impact on various performance measures.
It is possible to define a cluster loosely as sectoral and spatial concentrations of firms (Schmitz & Nadvi, 1999). Although the latest studies about industrial clusters of developing countries may put too much emphasis on the significance of cost advantage, they also underline that learning is critical for a cluster. It becomes more and more competitive as a result of its vital role
in diffusing knowledge and giving birth to possible innovation (Giuliani et al., 2005). There are two indispensable elements which have been addressed in many research papers about the innovation of a cluster (Malmberg and Maskell, 2002). The first one refers to a substantial local infrastructure of institution, which holds up collective learning. This needs the interlacing of the R&D institutes, connections among firms as well as the common cultural tradition which smoothen the process of knowledge diffusion or information flow. The second is composed of extra-local connections that make knowledge and information into the flow with the intention that local enterprises are not only likely to learn advanced techniques from local surroundings but also from outside players by means of social interactions, which help them to keep away from the lock-in effect and then facilitate the creation and innovation of knowledge.
Local firms attempted to learn technologies from developed countries through cooperation with international firms. As a result, the local government adopts policies in order to achieve a good investing environment for the industrial clusters. During this process, laggard firms can build up technological capability and then promote their own innovative ability.
Ernst (2005) argues that though the existance of leading firms is quite beneficial for laggard firms to learn newest technologies due to sharing of knowledge, local efforts matter in bringing this change. It means that the city’s reaction to agglomeration trend and local
74 Journal of General Management Research
institutional arrangements decide whether a city can become an innovative region or not. Institutional support is significant for firms to undertake technological innovation.
Indian Furniture Industry
Indian Furniture Industry is mostly a ‘non organized’ sector. The manual production accounts for about 85% of the furniture production in India. The furniture sector makes a marginal contribution to the formation of GDP, representing just a small percentage. In the year 2000, India ranked 48th among furniture exporters and 49th among importers. The major reasons for this were (1) High rate of import/export duty, (2) Employment of low level of technology by Indian Industries, (3) Focus of Indian Industries on local customers. Due to this the product style is focused on local taste and tradition. This posse’s difficulty in export.
Today in India Wood Products, Furniture and Fixtures carry a weight of 27 % in the total furniture manufacturing sector. This category has however shown a decline in recent some years. The visible consumption of furniture in India is estimated to be 15 USD per year per inhabitant but this average hides wide variation in populations and in cities. India has a favourable outlook to sell furniture and one expects the furniture industry to grow further in the coming years.
Two important reasons for this are: First India’s large size and Secondly, Indian tastes have started to be more refined and Indian people are looking for more western furniture style. The prospect of the furniture sector in
India seems positive. A recent on-field research has identified some 150 Indian companies not only as the furniture manufacturers and retailers but also banks, hotels, enterprises wishing to start commercial and/or industrial co-operation with EU counterparts. Indian Legislation on various ways of setting up business and on intellectual property rights exists as well as a lot of advantages for foreign companies to establish business alone or with partners in India. Indian government is taking steps to minimize entry-exit barriers for foreign companies and government is facing pressure to liberalise the duty structure. However in India the time required to start a business is more in comparison with other countries such as China and Mexico; it has become a hindrance for development of this industry.
Contribution of Indian Furniture ClusterThe furniture industry was prestigious industry in India. Indian furniture with fine carvings and superb works was a matter of pride for entire India. However with the entry of large industries in furniture manufacturing, the taste of people has gradually changed. The changes in customers taste, style, and personal taste have put a lot of pressure on Indian furniture clusters. The presence of Indian furniture clusters at global market is also waning. The share of Indian furniture manufacturing industries is less than 1% of the global furniture output. In fact, global furniture industry research and consulting firm, CSIC Milano has rated India as the 14th largest furniture markets in the world. Currently Indian Furniture industry is valued
75 The Relationship between Critical Success Factors (CSFs) and Organisational Performance
at Rs. 70000 crores. Its annual growth rate is 30% which is much higher than that of Indian economy.
India has witnessed an unprecedented period of economic growth in the last two decades. The acceleration of economic growth has raised the disposable income of common Indians. The rise in urban and rural household income and shift in spending on lifestyle products are the reasons behind the recent phenomenal growth of furniture industries.
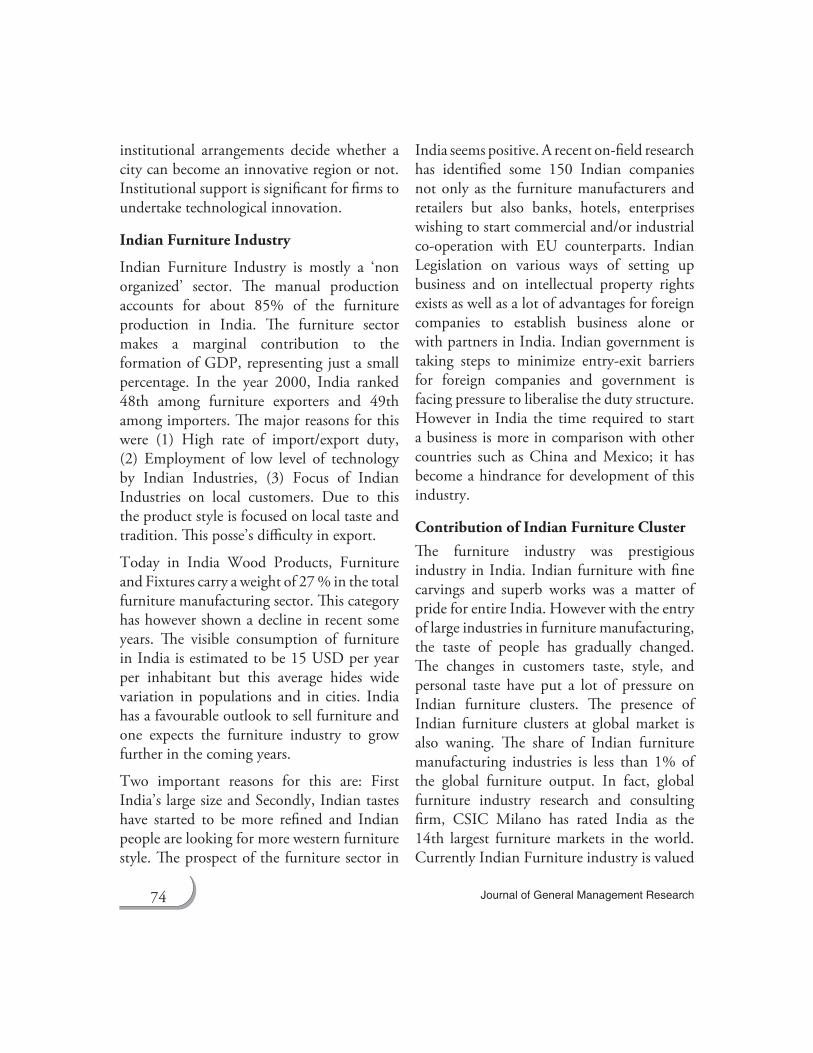
Furniture Cluster in India
research desIgn
Design of Questionnaire
A questionnaire instrument is a formalized set of questions for obtaining information from respondents. A questionnaire is the main means of collecting quantitative primary data. A questionnaire enables quantitative data to be collected in a standardized way so that the data are internally consistent and coherent for analysis. A questionnaire is designed with considering the educational level and experience of the respondents. The language
figure 2: Shows the Locations of Major Furniture Clusters in India
76 Journal of General Management Research
used and the context of the questions must all be familiar to the respondents.
The Likert scale is one of the most widely used scale is used in this research to ask the response of the respondents to each of the statements. The respondents are asked to indicate their degree of agreement by checking one of five response categories such as Not Important, Slightly Important, Medium Important, Very Important and Most Important. Likert scale is easy to construct and administer and easy for respondent to understand. Therefore it is suitable for mail, telephone, personnel, or electronic interviews.
Data Collection
The questionnaire was sent along with a covering letter (request letter) which provides the objectives of the research study and also emphasizes the confidentiality of data. A questionnaire is sent to the persons concerned with request to answer the questions and return the questionnaire. Questionnaires are sent in form of soft copy (through Emails) and in form of hard copy (through post/couriers) and hand delivery to various respondents in industries along with a covering letter with a request after completing the same. Reminders like visit, phone calls, and mails are also used to increase the rate of responses.
Profile of the Respondents Firms
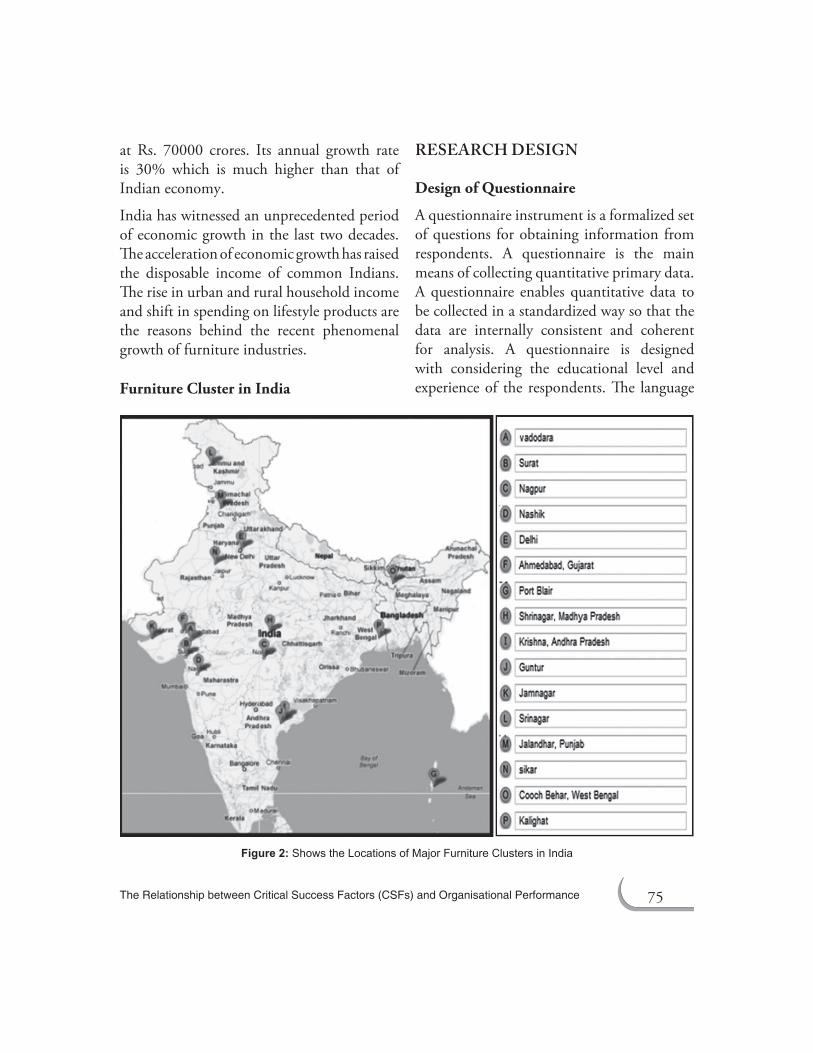
The continuous follow up with the respondent’s resulted in receiving 347 valid responses with the responses rate of 49%. The response rate is quite encouraging. The
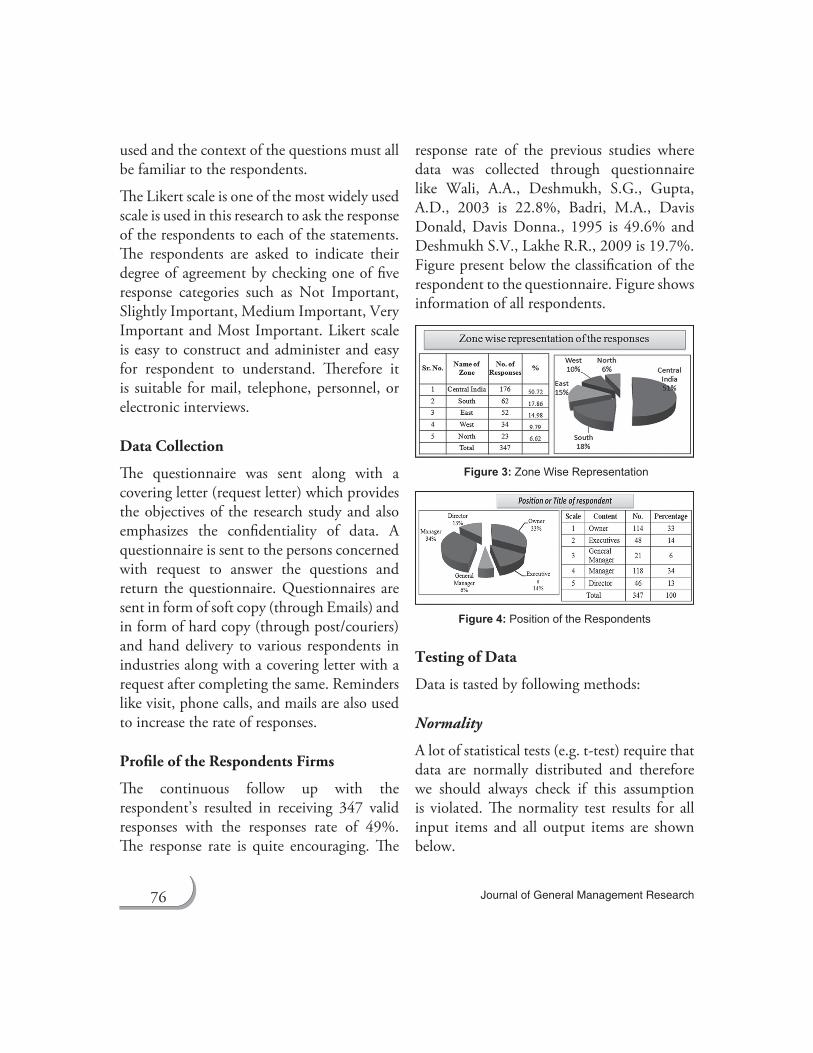
response rate of the previous studies where data was collected through questionnaire like Wali, A.A., Deshmukh, S.G., Gupta, A.D., 2003 is 22.8%, Badri, M.A., Davis Donald, Davis Donna., 1995 is 49.6% and Deshmukh S.V., Lakhe R.R., 2009 is 19.7%. Figure present below the classification of the respondent to the questionnaire. Figure shows information of all respondents.
figure 3: Zone Wise Representation
figure 4: Position of the Respondents
Testing of Data
Data is tasted by following methods:
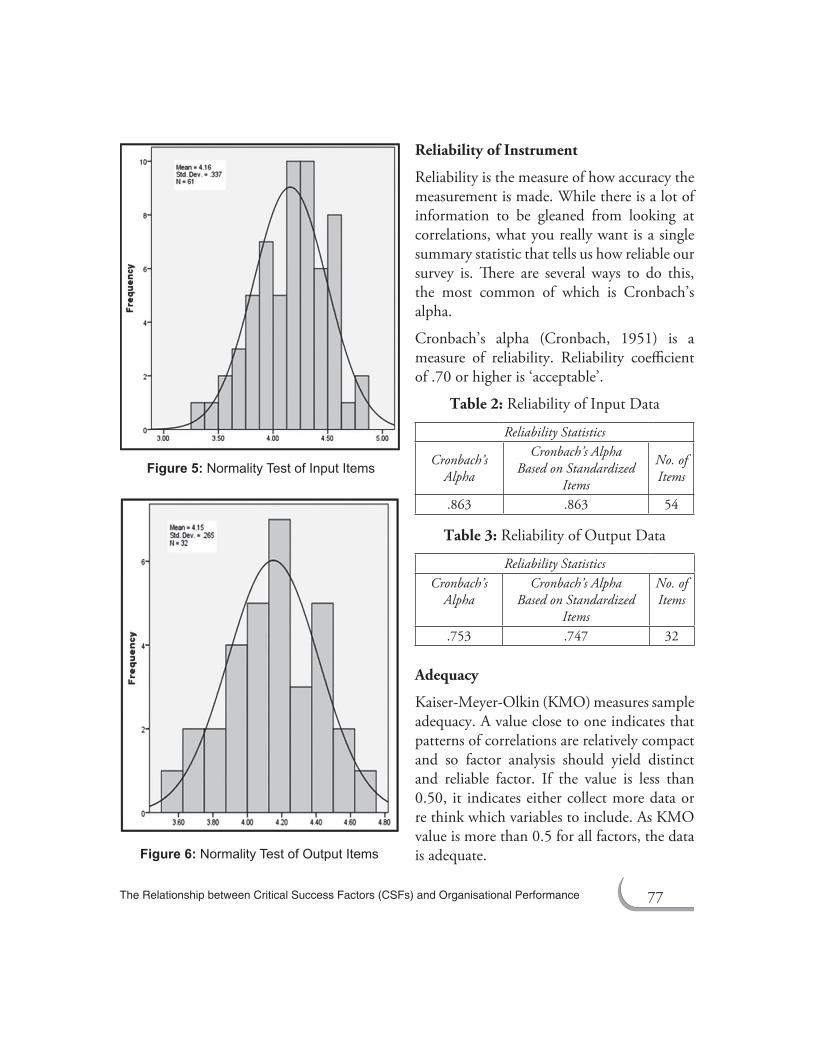
Normality
A lot of statistical tests (e.g. t-test) require that data are normally distributed and therefore we should always check if this assumption is violated. The normality test results for all input items and all output items are shown below.
77 The Relationship between Critical Success Factors (CSFs) and Organisational Performance
Reliability of Instrument
Reliability is the measure of how accuracy the measurement is made. While there is a lot of information to be gleaned from looking at correlations, what you really want is a single summary statistic that tells us how reliable our survey is. There are several ways to do this, the most common of which is Cronbach’s alpha.
Cronbach’s alpha (Cronbach, 1951) is a measure of reliability. Reliability coefficient of .70 or higher is ‘acceptable’.
Table 2: Reliability of Input Data
Reliability Statistics
Cronbach’s Alpha
Cronbach’s Alpha Based on Standardized
Items
No. of Items
.863 .863 54
Table 3: Reliability of Output Data
Reliability StatisticsCronbach’s
AlphaCronbach’s Alpha
Based on Standardized Items
No. of Items
.753 .747 32
Adequacy
Kaiser-Meyer-Olkin (KMO) measures sample adequacy. A value close to one indicates that patterns of correlations are relatively compact and so factor analysis should yield distinct and reliable factor. If the value is less than 0.50, it indicates either collect more data or re think which variables to include. As KMO value is more than 0.5 for all factors, the data is adequate.
figure 5: Normality Test of Input Items
figure 6: Normality Test of Output Items
78 Journal of General Management Research
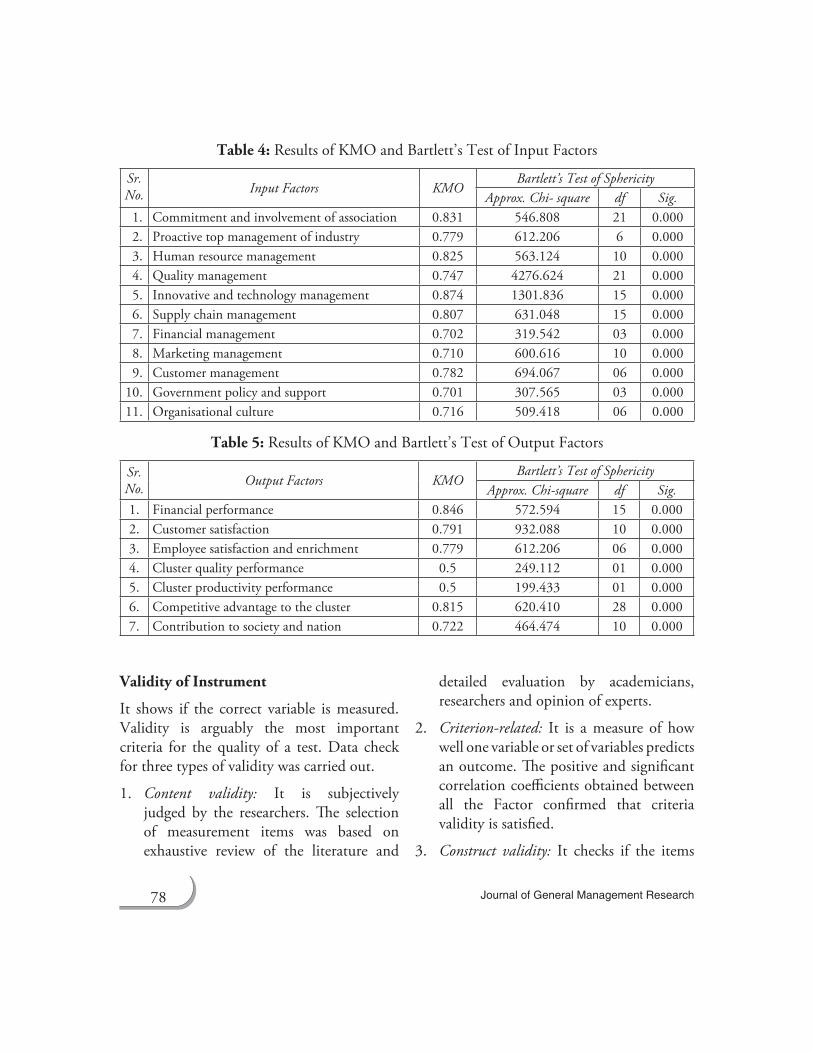
Table 4: Results of KMO and Bartlett’s Test of Input Factors
Sr. No. Input Factors KMO
Bartlett’s Test of SphericityApprox. Chi- square df Sig.
1. Commitment and involvement of association 0.831 546.808 21 0.0002. Proactive top management of industry 0.779 612.206 6 0.0003. Human resource management 0.825 563.124 10 0.0004. Quality management 0.747 4276.624 21 0.0005. Innovative and technology management 0.874 1301.836 15 0.0006. Supply chain management 0.807 631.048 15 0.0007. Financial management 0.702 319.542 03 0.0008. Marketing management 0.710 600.616 10 0.0009. Customer management 0.782 694.067 06 0.000
10. Government policy and support 0.701 307.565 03 0.00011. Organisational culture 0.716 509.418 06 0.000
Table 5: Results of KMO and Bartlett’s Test of Output Factors
Sr. No. Output Factors KMO
Bartlett’s Test of SphericityApprox. Chi-square df Sig.
1. Financial performance 0.846 572.594 15 0.0002. Customer satisfaction 0.791 932.088 10 0.0003. Employee satisfaction and enrichment 0.779 612.206 06 0.0004. Cluster quality performance 0.5 249.112 01 0.0005. Cluster productivity performance 0.5 199.433 01 0.0006. Competitive advantage to the cluster 0.815 620.410 28 0.0007. Contribution to society and nation 0.722 464.474 10 0.000
Validity of Instrument
It shows if the correct variable is measured. Validity is arguably the most important criteria for the quality of a test. Data check for three types of validity was carried out.
1. Content validity: It is subjectively judged by the researchers. The selection of measurement items was based on exhaustive review of the literature and
detailed evaluation by academicians, researchers and opinion of experts.
2. Criterion-related: It is a measure of how well one variable or set of variables predicts an outcome. The positive and significant correlation coefficients obtained between all the Factor confirmed that criteria validity is satisfied.
3. Construct validity: It checks if the items
79 The Relationship between Critical Success Factors (CSFs) and Organisational Performance
belong to same group (factor) or not. This is done with the help of principal component factor analysis.
Results of above validity test shows that the data is within acceptable range.
Analysis of Variance (ANOVA)
Analysis of variance is used when multiple sample cases are involved. The significance of the difference between the means of two samples can be judged through either z-test or the t-test, but the difficulty arises when we happen to examine the significance of the difference amongst more than two sample means at the same time. The ANOVA technique enables us to perform this simultaneous test and as such is considered to be an important tool of analysis in the hands of a researcher. Using this technique, one can draw inferences about whether the samples have been drawn from populations having the same mean.
Null hypothesis: H0: B1 = B2 = . . . = Bk = 0, i.e. there is no correlation between the performance improvement factors and respondent (there is no significant difference between in mean factor score of performance improvement factors and respondents).
Alternative hypothesis: H1: Bi ≠ 0 for at least one i, i = 1, . . ., k, i.e. there is correlation between performance improvement factors and respondents (there is significant difference between in mean factor score of performance improvement factors and respondents)
Level of significance = 0.001
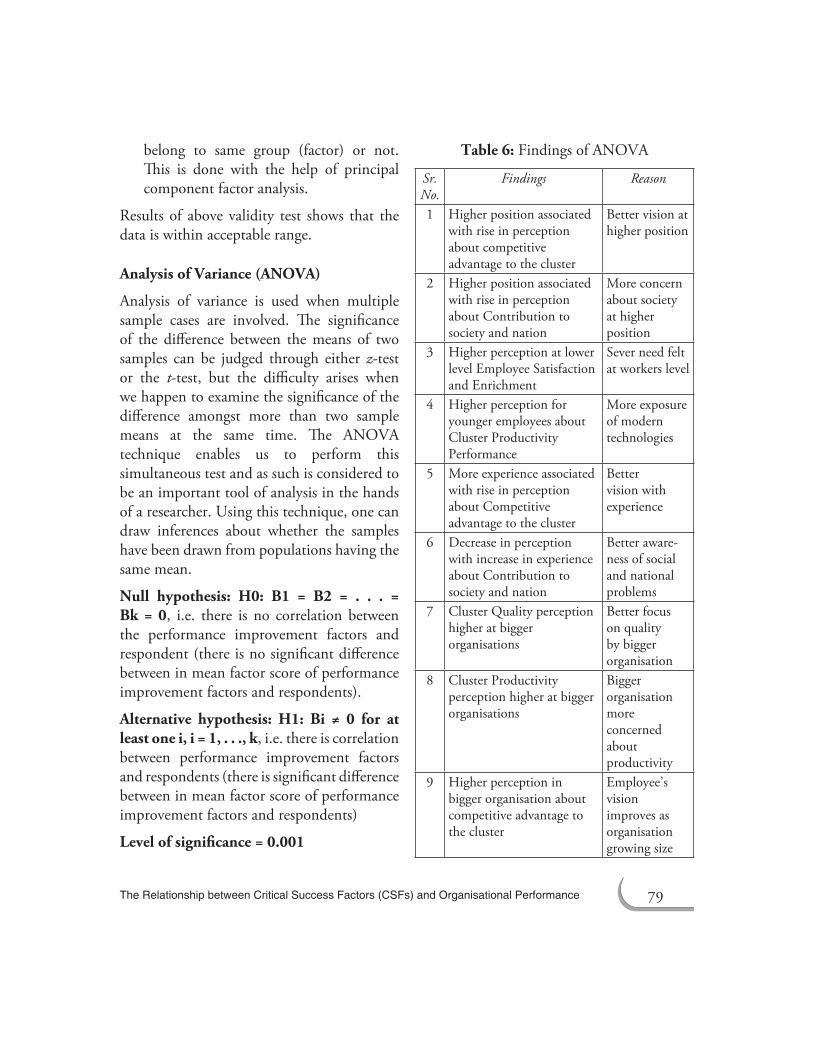
Table 6: Findings of ANOVA
Sr. No.
Findings Reason
1 Higher position associated with rise in perception about competitive advantage to the cluster
Better vision at higher position
2 Higher position associated with rise in perception about Contribution to society and nation
More concern about society at higher position
3 Higher perception at lower level Employee Satisfaction and Enrichment
Sever need felt at workers level
4 Higher perception for younger employees about Cluster Productivity Performance
More exposure of modern technologies
5 More experience associated with rise in perception about Competitive advantage to the cluster
Better vision with experience
6 Decrease in perception with increase in experience about Contribution to society and nation
Better aware- ness of social and national problems
7 Cluster Quality perception higher at bigger organisations
Better focus on quality by bigger organisation
8 Cluster Productivity perception higher at bigger organisations
Bigger organisation more concerned about productivity
9 Higher perception in bigger organisation about competitive advantage to the cluster
Employee’s vision improves as organisation growing size
80 Journal of General Management Research
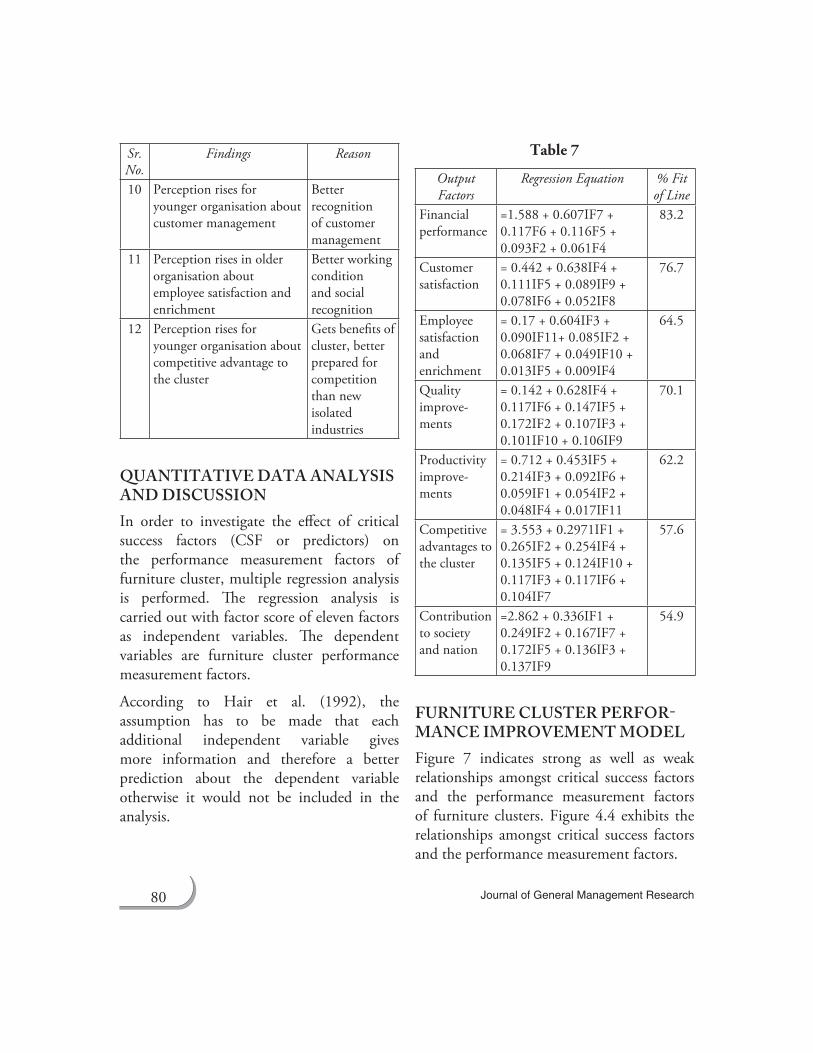
Sr. No.
Findings Reason
10 Perception rises for younger organisation about customer management
Better recognition of customer management
11 Perception rises in older organisation about employee satisfaction and enrichment
Better working condition and social recognition
12 Perception rises for younger organisation about competitive advantage to the cluster
Gets benefits of cluster, better prepared for competition than new isolated industries
QuantItatIve data anaLysIs and dIscussIonIn order to investigate the effect of critical success factors (CSF or predictors) on the performance measurement factors of furniture cluster, multiple regression analysis is performed. The regression analysis is carried out with factor score of eleven factors as independent variables. The dependent variables are furniture cluster performance measurement factors.
According to Hair et al. (1992), the assumption has to be made that each additional independent variable gives more information and therefore a better prediction about the dependent variable otherwise it would not be included in the analysis.
Table 7
Output Factors
Regression Equation % Fit of Line
Financial performance
=1.588 + 0.607IF7 + 0.117F6 + 0.116F5 + 0.093F2 + 0.061F4
83.2
Customer satisfaction
= 0.442 + 0.638IF4 + 0.111IF5 + 0.089IF9 + 0.078IF6 + 0.052IF8
76.7
Employee satisfaction and enrichment
= 0.17 + 0.604IF3 + 0.090IF11+ 0.085IF2 + 0.068IF7 + 0.049IF10 + 0.013IF5 + 0.009IF4
64.5
Quality improve- ments
= 0.142 + 0.628IF4 + 0.117IF6 + 0.147IF5 + 0.172IF2 + 0.107IF3 + 0.101IF10 + 0.106IF9
70.1
Productivity improve- ments
= 0.712 + 0.453IF5 + 0.214IF3 + 0.092IF6 + 0.059IF1 + 0.054IF2 + 0.048IF4 + 0.017IF11
62.2
Competitive advantages to the cluster
= 3.553 + 0.2971IF1 + 0.265IF2 + 0.254IF4 + 0.135IF5 + 0.124IF10 + 0.117IF3 + 0.117IF6 + 0.104IF7
57.6
Contribution to society and nation
=2.862 + 0.336IF1 + 0.249IF2 + 0.167IF7 + 0.172IF5 + 0.136IF3 + 0.137IF9
54.9
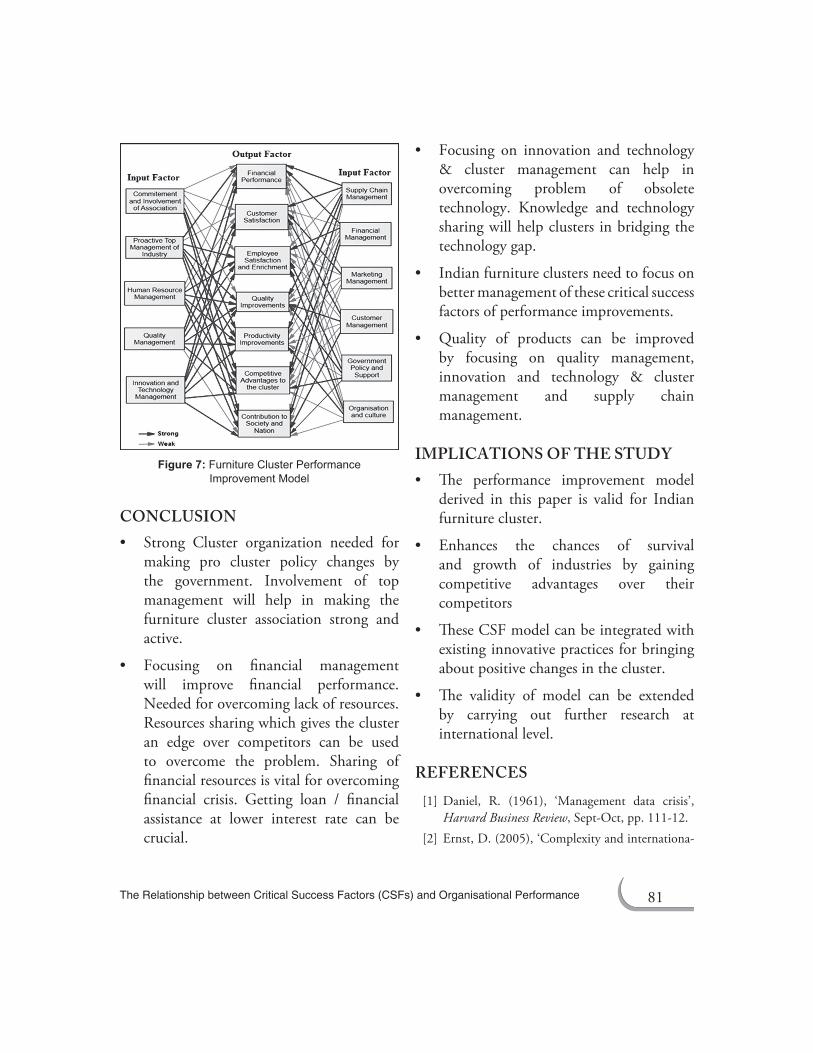
FurnIture cLuster PerFor- mance ImProvement modeL Figure 7 indicates strong as well as weak relationships amongst critical success factors and the performance measurement factors of furniture clusters. Figure 4.4 exhibits the relationships amongst critical success factors and the performance measurement factors.
81 The Relationship between Critical Success Factors (CSFs) and Organisational Performance
figure 7: Furniture Cluster Performance Improvement Model
concLusIon• Strong Cluster organization needed for
making pro cluster policy changes by the government. Involvement of top management will help in making the furniture cluster association strong and active.
• Focusing on financial managementwill improve financial performance. Needed for overcoming lack of resources. Resources sharing which gives the cluster an edge over competitors can be used to overcome the problem. Sharing of financial resources is vital for overcoming financial crisis. Getting loan / financial assistance at lower interest rate can be crucial.
• Focusing on innovation and technology& cluster management can help in overcoming problem of obsolete technology. Knowledge and technology sharing will help clusters in bridging the technology gap.
• Indianfurnitureclustersneedtofocusonbetter management of these critical success factors of performance improvements.
• Quality of products can be improvedby focusing on quality management, innovation and technology & cluster management and supply chain management.
ImPLIcatIons oF the study• The performance improvement model
derived in this paper is valid for Indian furniture cluster.
• Enhances the chances of survivaland growth of industries by gaining competitive advantages over their competitors
• TheseCSFmodelcanbeintegratedwithexisting innovative practices for bringing about positive changes in the cluster.
• The validity of model can be extendedby carrying out further research at international level.
reFerences [1] Daniel, R. (1961), ‘Management data crisis’,
Harvard Business Review, Sept-Oct, pp. 111-12. [2] Ernst, D. (2005), ‘Complexity and internationa-
82 Journal of General Management Research
lisation of innovation: Why is chip design moving to Asia?’ International Journal of Innovation Management, Vol. 9, No. 1.
[3] Fryer, K., Antony, J. and Douglas, A. (2007), ‘Critical success factors of continuous improvement in the public sector’, Total Quality Management Magazine, Vol. 19, No. 5, pp. 497–517.
[4] G. Karuppusami and R. Gandhinathan (2006), ‘Pareto analysis of critical success factor of total quality management’, Total Quality Management Magazine, Vol. 18, No. 4, pp. 372–85.
[5] Ismail Sila and M. Ebrahimpour (2003), ‘Examination and comparison of the critical factors of total quality management (TQM) across countries’, International Journal of Production Research, Vol. 41, No. 2, pp. 235–68.
[6] Karen J. Fryer, Jiju Antony and Alex Douglas (2007), ‘Critical success factors of continuous improvement in the public sector’, Total Quality Management Magazine, Vol. 19, No. 5, pp. 497–517.
[7] Kuan yew Wong (2005), ‘Critical success factors for implementing knowledge management in small and medium enterprises’, Industrial
Management and Data Systems, Vol. 105, No. 3, pp. 261–79.
[8] Porter, M. (1990), ‘Competitive advantage of nations’, New York: The Free Press.
[9] Porter, M. (1998), ‘Clusters and the new economics of competition’, Harvard Business Review, pp. 77–90.
[10] Rockart, J.F. (1979), ‘Chief executives define their own data needs’, Harvard Business Review, Vol. 57, No. 2, pp. 238–41.
[11] Shahin Dezdar and Ainin Sulaiman (2009), ‘Successful enterprise resource planning implementation: Taxonomy of critical factors’, Industrial Management & Data Systems, Vol. 109, No. 8, pp. 1037–52.
[12] Wali, A., Deshmukh, A. and Gupta, A. (2003), ‘Critical success factor of TQM: A select study of Indian organization’, Production Planning and Control, Vol. 14, ISSN 0953–7287 print/ISSN 1366–5871.
[13] Wong, K. and Aspinwall, E. (2005), ‘An empirical study of the important factors for knowledge-management adoption in the SMEs sector’, Journal of Knowledge Management, Vol. 9, No. 3, pp. 64–82.