The Relationship between Contingent Factors that Influence ...The Relationship between Contingent...
28
205 IJEM International Journal of Economics and Management Journal homepage: http://www.ijem.upm.edu.my The Relationship between Contingent Factors that Influence the Environmental Management Accounting and Environmental Performance among Manufacturing Companies in Klang Valley, Malaysia ONG TZE SAN A , TEH BOON HENG B , SELVI SELLEY C AND HUSSAIN MAGSI C A Faculty of Economics and Management, Universiti Putra Malaysia, Malaysia B Faculty of Management, Multimedia University, Malaysia C Putra Business School, Malaysia ABSTRACT Environmental issues are attracting increasing attention in Malaysia with the tremendous increase in waste generation; the cost of production and waste treatment is getting expensive. Data from the Malaysian Environmental Department shows that 80% of the waste is generated by the manufacturing industry. Firms are constantly requested to change their business practices to incorporate environmental activities. It also indicates that future natural resources are being squandered as waste due to less exposure to environmental management accounting, which results in unproductivity, overproduction, increase in total delivery cost, or inefficiency in manufacturing plant. This research exploits the quantitative research methodology to understand the relationship between contingent factors, which are uncertainty in the environment, organizational size, environmental strategy, regulatory pressure, and top management commitment that influence environmental management accounting and environmental performance among manufacturing companies in Klang Valley, Selangor. The survey was conducted on manufacturing companies located in Klang Valley, based on the 2,400 companies registered in the Federal Malaysian Manufacturer (FMM) database. 600 questionnaires were sent out to manufacturing companies and the finding highlights that the uncertainty in the environment, regulatory pressure, and top management commitment significantly affect environmental performance. JEL Classification: L25, M41 Keywords: Environmental Management Accounting; Contingent factors, Top Management Commitment, Regulatory Pressure, Uncertainty Environment, Environmental Strategy, Manufacturing and Sustainability Article history: Received: 3 July 2017 Accepted: 3 April 2018 Corresponding author: Email: [email protected] Int. Journal of Economics and Management 12 (1): 205-232 (2018)
Transcript of The Relationship between Contingent Factors that Influence ...The Relationship between Contingent...
205
IJEM International Journal of Economics and Management
Journal homepage: http://www.ijem.upm.edu.my
The Relationship between Contingent Factors that Influence the
Environmental Management Accounting and Environmental
Performance among Manufacturing Companies in Klang
Valley, Malaysia
ONG TZE SANA
, TEH BOON HENGB, SELVI SELLEY
C AND HUSSAIN
MAGSIC
AFaculty of Economics and Management, Universiti Putra Malaysia, Malaysia BFaculty of Management, Multimedia University, Malaysia CPutra Business School, Malaysia
ABSTRACT
Environmental issues are attracting increasing attention in Malaysia with the
tremendous increase in waste generation; the cost of production and waste treatment is
getting expensive. Data from the Malaysian Environmental Department shows that
80% of the waste is generated by the manufacturing industry. Firms are constantly
requested to change their business practices to incorporate environmental activities. It
also indicates that future natural resources are being squandered as waste due to less
exposure to environmental management accounting, which results in unproductivity,
overproduction, increase in total delivery cost, or inefficiency in manufacturing plant.
This research exploits the quantitative research methodology to understand the
relationship between contingent factors, which are uncertainty in the environment,
organizational size, environmental strategy, regulatory pressure, and top management
commitment that influence environmental management accounting and environmental
performance among manufacturing companies in Klang Valley, Selangor. The survey
was conducted on manufacturing companies located in Klang Valley, based on the
2,400 companies registered in the Federal Malaysian Manufacturer (FMM) database.
600 questionnaires were sent out to manufacturing companies and the finding
highlights that the uncertainty in the environment, regulatory pressure, and top
management commitment significantly affect environmental performance.
JEL Classification: L25, M41
Keywords: Environmental Management Accounting; Contingent factors, Top
Management Commitment, Regulatory Pressure, Uncertainty Environment,
Environmental Strategy, Manufacturing and Sustainability
Article history:
Received: 3 July 2017
Accepted: 3 April 2018
Corresponding author: Email: [email protected]
Int. Journal of Economics and Management 12 (1): 205-232 (2018)

206
International Journal of Economics and Management
INTRODUCTION
Environmental issues like urban air pollution, water pollution, deforestation, loss of
biodiversity, loss of mangrove habitats, as well as national and transboundary
smoke/haze (Anbumozhi and Intal, 2015) are attracting increasing attention in Malaysia,
with companies or businesses being requested to change their business practices to
incorporate environmental activities. Bursa Malaysia requires all listed companies to
disclose their corporate social responsibility (CSR) activities as a mandatory
requirement. More and more incentives and rebates are being provided to encourage
more environmental engagement, such as green tax incentives, duty exemptions for
hybrid cars, pioneer status tax incentives for waste recycling facilities. However,
companies are still not convinced about the benefits of reporting environmental-related
issue, because it involves a high cost and no immediate return (Aragón-Correa and
Rubio-Lopez, 2007).
Contingency theory (CT) examines the relationships between contingent factors
and management accounting systems, which is the main idea of contingent fit. The
contingency approach in management accounting is built on the evidence that there is
no universally appropriate management accounting system that applies equally well to
all organizations in all circumstances (Otley, 1980; Otley, 2016). Based on CT, the
current research tries to address the contingent factors that can achieve better
environmental performance. Organizations face pressure from stakeholders to become
more environmentally friendly. The main underlying reason why many firms are
pursuing environmental strategies is the growing body of evidence that green production
improves efficiency and synergy among business partners; leads corporations to achieve
better financial gain; helps to enhance environmental performance, minimize waste, and
achieve cost savings and marketing exposure. In addition to that, for firms in the
manufacturing industry, environmental friendly initiatives may not be seen positively by
stockholders, employees, and consumers (Nishimura, 2014). Therefore, organizations
are adopting environmental management practices, which have become an important
part of their strategy (Wiengarten et al., 2013). As a result, this research was carried out
to gather empirical evidence to address this important phenomenon regarding the
relationship between contingent factors and environmental management accounting in
Malaysian manufacturing industries.
Hopwood, Unerman, and Fries (2010) investigated the challenges faced by
organizations in today’s world; operating in an environmentally, socially, and
economically sustainable manner is one of the most urgent challenges facing
organizations today, and the basic issues are climate change, overconsumption of finite
natural resources, and rapidly increasing destruction of the Earth’s ecosystems. EMA
refers to the design and use of physical and monetary environmental information to
support business decision-making (Bartolomeo et al., 2000). According to Jasch (2003),
environmental management accounting (EMA), established in 2003 by the United
Nations Divisions for Sustainable Development, is significant for modernization
strategies for cleaner production due to the better cost and benefits yielded. At the same
207
The Relationship between Contingent Factors
time, environmental management accounting provides information that can be used by
the corporate management to assess opportunities for economic and environmental
improvement.
Noor (2011) states that Malaysia is an environmentally rich country, and it is one
of the fastest-growing economies in the Association of Southeast Asian Nations
(ASEAN) region at present, though facing numerous environmental problems such as
air pollution, water pollution, and exploitation of natural resources. The paper concludes
that, although the Government of Malaysia has passed some important environmental
laws along with the international initiatives for protecting the environment, it regrets the
absence of environmental governance that deals with the human and environmental
rights approaches, including good governance under the public international law and the
international environmental laws along with ethics and social responsibilities. With that
in mind, each organization has to plan well to guarantee efficient usage of resources and
ensure that the future’s needs can be satisfied. This again shows that Malaysia is at an
infancy stage for environmental accounting.
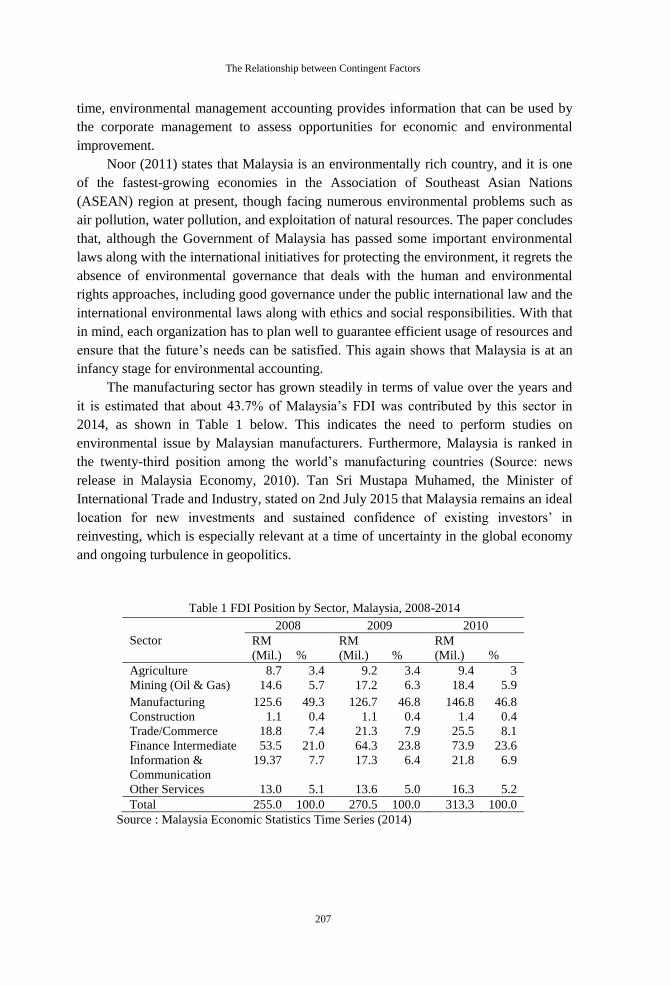
The manufacturing sector has grown steadily in terms of value over the years and
it is estimated that about 43.7% of Malaysia’s FDI was contributed by this sector in
2014, as shown in Table 1 below. This indicates the need to perform studies on
environmental issue by Malaysian manufacturers. Furthermore, Malaysia is ranked in
the twenty-third position among the world’s manufacturing countries (Source: news
release in Malaysia Economy, 2010). Tan Sri Mustapa Muhamed, the Minister of
International Trade and Industry, stated on 2nd July 2015 that Malaysia remains an ideal
location for new investments and sustained confidence of existing investors’ in
reinvesting, which is especially relevant at a time of uncertainty in the global economy
and ongoing turbulence in geopolitics.
Table 1 FDI Position by Sector, Malaysia, 2008-2014
Sector
2008 2009 2010
RM
(Mil.) %
RM
(Mil.) %
RM
(Mil.) %
Agriculture 8.7 3.4 9.2 3.4 9.4 3
Mining (Oil & Gas) 14.6 5.7 17.2 6.3 18.4 5.9
Manufacturing 125.6 49.3 126.7 46.8 146.8 46.8
Construction 1.1 0.4 1.1 0.4 1.4 0.4
Trade/Commerce 18.8 7.4 21.3 7.9 25.5 8.1
Finance Intermediate 53.5 21.0 64.3 23.8 73.9 23.6
Information &
Communication
19.37 7.7 17.3 6.4 21.8 6.9
Other Services 13.0 5.1 13.6 5.0 16.3 5.2
Total 255.0 100.0 270.5 100.0 313.3 100.0
Source : Malaysia Economic Statistics Time Series (2014)
208
International Journal of Economics and Management
Table 1 Cont.
2011 2012 2013 2014
RM
(Mil.) %
RM
(Mil.) %
RM
(Mil.) %
RM
(Mil.) %
9.5 2.6 9.9 2.4 10.9 2.4 11.1 2.4
24.3 6.6 27.5 6.8 35.0 7.8 35.8 7.7
173.2 47.4 187.6 46.2 203.4 45.6 204.1 43.7
1.4 0.4 1.6 0.4 2.8 0.6 3.4 0.7
30.5 8.4 34.1 8.4 32.3 7.2 34.5 7.4
81.4 22.3 87.3 21.5 94.8 21.2 98.0 21.0
25.6 7.0 33.5 8.2 34.7 7.8 45.0 9.6
19.7 5.4 24.1 5.9 32.4 7.3 35.8 7.6
365.5 100.0 405.7 100.0 446.4 100.0 467.5 100.0
Source : Malaysia Economic Statistics Time Series (2014)
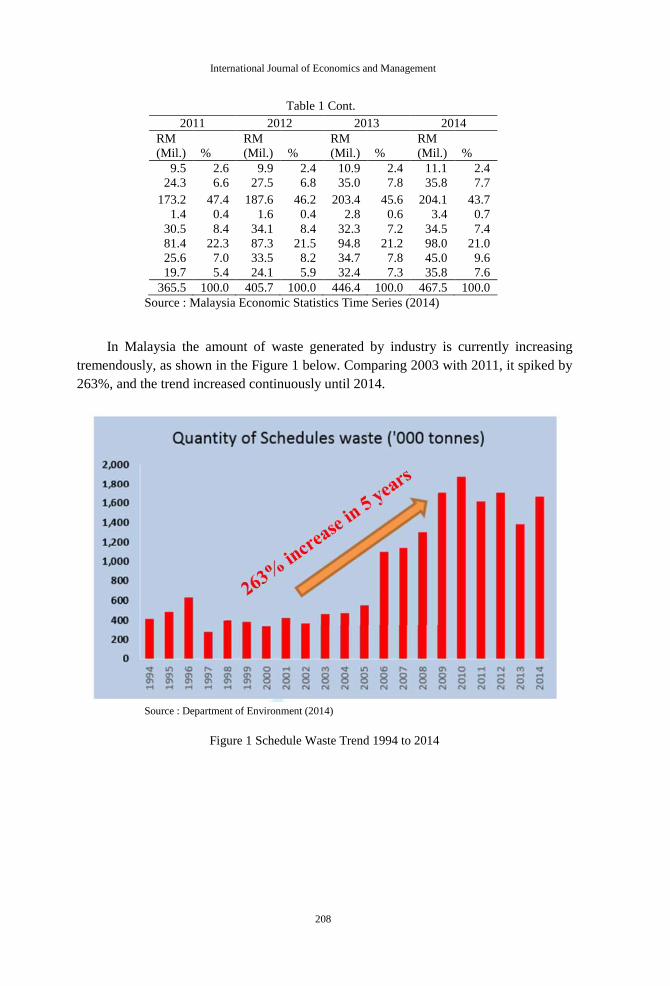
In Malaysia the amount of waste generated by industry is currently increasing
tremendously, as shown in the Figure 1 below. Comparing 2003 with 2011, it spiked by
263%, and the trend increased continuously until 2014.
Source : Department of Environment (2014)
Figure 1 Schedule Waste Trend 1994 to 2014
209
he Relationship between Contingent Factors
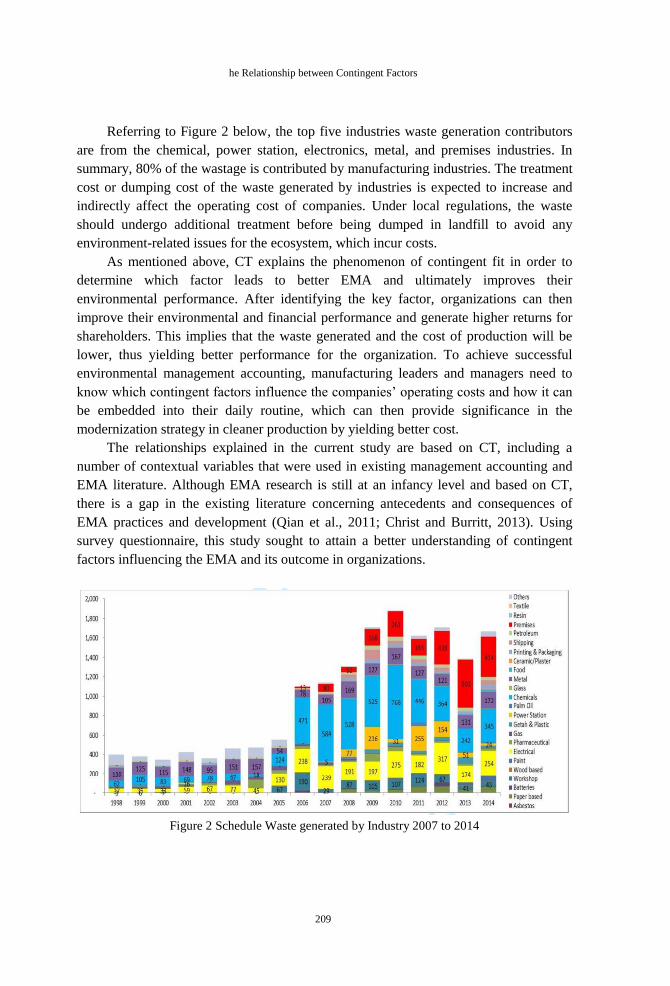
Referring to Figure 2 below, the top five industries waste generation contributors
are from the chemical, power station, electronics, metal, and premises industries. In
summary, 80% of the wastage is contributed by manufacturing industries. The treatment
cost or dumping cost of the waste generated by industries is expected to increase and
indirectly affect the operating cost of companies. Under local regulations, the waste
should undergo additional treatment before being dumped in landfill to avoid any
environment-related issues for the ecosystem, which incur costs.
As mentioned above, CT explains the phenomenon of contingent fit in order to
determine which factor leads to better EMA and ultimately improves their
environmental performance. After identifying the key factor, organizations can then
improve their environmental and financial performance and generate higher returns for
shareholders. This implies that the waste generated and the cost of production will be
lower, thus yielding better performance for the organization. To achieve successful
environmental management accounting, manufacturing leaders and managers need to
know which contingent factors influence the companies’ operating costs and how it can
be embedded into their daily routine, which can then provide significance in the
modernization strategy in cleaner production by yielding better cost.
The relationships explained in the current study are based on CT, including a
number of contextual variables that were used in existing management accounting and
EMA literature. Although EMA research is still at an infancy level and based on CT,
there is a gap in the existing literature concerning antecedents and consequences of
EMA practices and development (Qian et al., 2011; Christ and Burritt, 2013). Using
survey questionnaire, this study sought to attain a better understanding of contingent
factors influencing the EMA and its outcome in organizations.
Figure 2 Schedule Waste generated by Industry 2007 to 2014
210
International Journal of Economics and Management
Environmental Management Accounting
Environmental management accounting (EMA) is the next step in the evolution of
management accounting (Jasch, 2006). EMA plays a significant and important role not
only in environmental management system and decisions, but also in contributing to the
production process, budgeting, procurement, and performance appraisal system. EMA
can also be described as the identification, allocation, generation, and use of physical
and monetary environmental information to support business decision-making in order
to achieve a sustainable business (Bartolomeo, Bennett, and Bouma, 2000; Bennett,
Bouma, and Wolters, 2002; Christ and Burritt, 2013; Wilmshurst and Frost, 2001). The
data from financial and cost accounting have been used to increase material efficiency
and reduce environmental impact (Herzig, Viere, Schaltegger, and Burritt, 2012; Jasch,
2003).
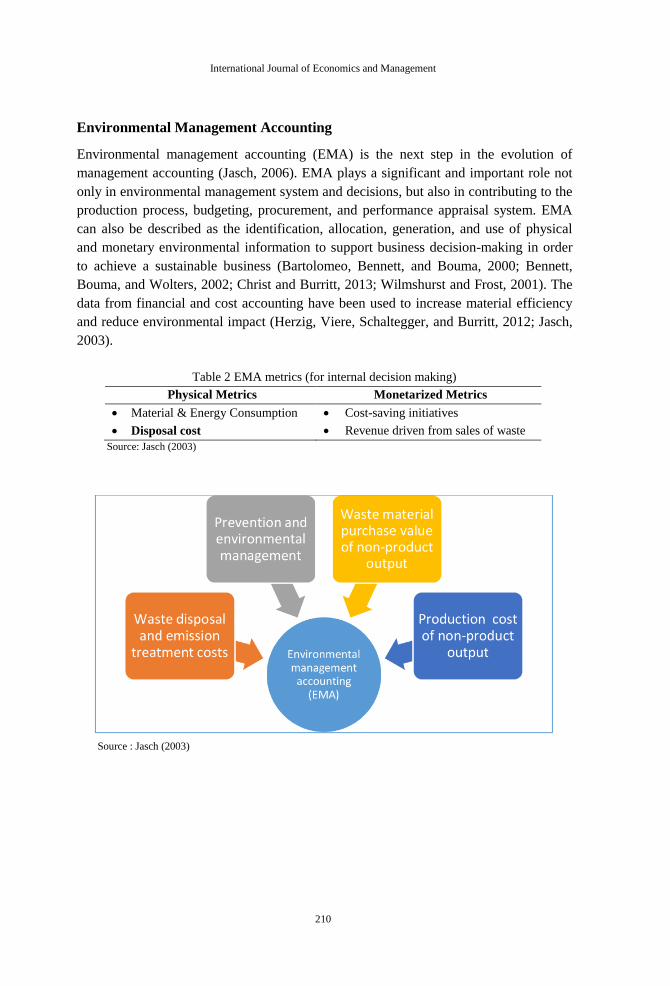
Table 2 EMA metrics (for internal decision making)
Physical Metrics Monetarized Metrics
Material & Energy Consumption
Disposal cost
Cost-saving initiatives
Revenue driven from sales of waste
Source: Jasch (2003)
Source : Jasch (2003)
211
The Relationship between Contingent Factors
The working group also established the definition of environmental cost, as this
was not clearly defined in traditional accounting standards. An accountant has most of
the information, but is unable to separate the environmental part without further
guidance, since they have limited experiences within the framework of existing
accounts. Even an environmental manager rarely has access to the actual cost
accounting documents of the company and is only aware of a tiny fraction of the
cumulative environmental cost.
Figure 3 Environment cost categories
Based on Figure 3, the environmental protection cost is summarized into waste
disposal and emission treatment, environmental management and pollution prevention
in Jasch’s (2003) research. The first categories of waste disposal and emission treatment
comprise of all treatment, disposal, and clean-up costs of existing waste and emission.
The second categories’ main focus for prevention and environmental management is the
annual cost of waste and emission prevention without cost-saving components. Even
environmental revenues that derive from sales of waste or grants of subsidies are
accounted for in separate grouping.
THEORY AND HYPOTHESES DEVELOPMENT
Contingency Theory (CT)
Contingency theory is a very traditional approach to organizational performance and
identifies the relationship between variables. All organizations use this theory during
their performance management system design phase, as it is also a classic basic
management tool that has been used since the beginning of the management theory
(Chenhall, 2003; Donalson, 2001; Ong and Teh, 2008). Christ et al.’s (2013) research
suggested that the extension of contingency factors is required in the field of
environmental management accounting (EMA), as the business world is becoming
extremely competitive and various stakeholders are demanding that managers meet the
challenges of environmental sustainability. Therefore, various techniques and tools need
to be designed to assist organizations in managing their environmental activities. Otley
(2016) argued that the majority of the research in management accounting is based on
contingent factors. These contingent factors decide when a particular framework may be
more suitable for specific firms in a particular circumstance. This research argues that,
based on Otleys’ definition that improved industrial environmental performance, it is
essential that the Malaysian manufacturing industry is competitive in the international
market.
212
International Journal of Economics and Management
Hypotheses Development
The research in the area of EMA is growing with time. Researchers are trying to
understand the impact of the contingent factors of EMA, as well as the consequences
(see Bouma and van der Veen, 2002; Qian et al., 2011). The result is a significant
knowledge gap concerning EMA. By looking into these factors, it appears to be an
impasse between the effort made by Malaysian Government in promoting EMA
activities and the level of EMA uptake in manufacturing industry, and there is a clear
need to develop a greater understanding of the variables that influence and drive EMA
adoption at the organizational level. CT offers an appropriate way to investigate this
relationship (Abdel-Kader and Luther, 2008), as it is a widely used theoretical approach
in contemporary management accounting research, a discipline from which EMA has
developed and evaluated with the passage of time. Based on the assumption that an
organizational activity is the direct result of organizational context, CT posits that when
an appropriate match or fit between accounting activities and context is achieved,
organizational performance is likely to be enhanced (Chenhall, 2003; Ong and Teh,
2008).
Similarly, a series of studies conducted by the Council on Economic Priorities
(CEP) in the 1970s found that the expenditure on pollution control (petroleum refining,
steel, pulp and paper, and electric utility industries) is significantly correlated with
financial performance. In this research, the authors identified a significant positive
correlation between various financial returns and an index of environmental
performance developed by the CEP (Russo and Fouts, 1997). Konar and Cohen’s (2001)
key finding showed that there is a significant positive relationship between
environmental performance and financial performance. Publicly traded firms in the S&P
500 that have poor environmental performance have lower intangible asset values, as
well as negative abnormal returns when they have bad environmental news such as oil
spills. However, positive returns are foreseen when firms receive environmental awards.
Clarkson et al. (2011) took a positive outlook: firms that choose to improve their
environmental performance tend to experience an improvement in their financial
resources or management capability immediately prior to the material improvement in
their relative environmental performance.
i) Uncertainty Environment and EMA
Henri’s (2010) research highlighted the perceived environmental uncertainty that
reflects the changes in the external environment promotes innovation in management
control system (i.e. EMA). The findings concluded that when a firm faces a higher level
of perceived uncertainty, its managers need additional information to understand the
changing situation in order to reduce the information gap and undertake a periodic
review of performance alignment among the strategies, actions, and measures for
sustainability performance measurement. As a result, more advanced management
control system is used to facilitate the requirement. Carlos et al. (2010), focusing on the
213
The Relationship between Contingent Factors
impact of the changing competitive environment on organizational practices, stated that
recent environmental and market changes have left their unmistakable marks on
performance measurement literature and lead to the development of advanced
management control techniques. In short, uncertainty environment promotes
organizations to adopt more advanced management control techniques such as EMA.
ii) Size and EMA
The current research argues that advanced management accounting system such as
EMA is more adoptable in large organizations compared with small organizations
(Cadez and Guilding, 2008; Chenhall, 2003). Abdel-Kader and Luther (2008)
summarized this position by suggesting that “moving from naive to more sophisticated
management accounting practices requires resources and specialists only affordable by
large and very well established organizations. Large firms tend to invest more
extensively on environmental management (Murphy et al., 1995) due to better
availability of resources (Judge and Douglas, 1998) and also greater need to protect
their reputation. As a result, in this study size, it is anticipated that firm size will have an
impact on EMA adoption.
iii) Environmental Strategy and EMA
Literatures show that corporate environmental strategies are more likely to bring
positive financial performance when firms obtain environmental competencies (Walls et
al., 2011). Sharma and Vredenburg (1998) articulated the notion of proactive corporate
environmental strategies to conceptualize voluntary environmental practices such as
leading to EMA adoption from firms. Common strategies developed in contingency-
based studies include product-differentiation cost leadership (Porter, 1980; Chenhall,
2003). Firms with environmental strategic focus regard environmentalism as a new
product concept and respond with actions to go green with its products, as well as with
environmentally improved system such as EMA (Mccloskey and Maddock, 1994).
Previous literatures suggest that environmental strategy may become the contingent
factor for environmental management system. This can be found in the studies of Qian
et al. (2011) and Qian and Burritt (2009), where they included the environmental
strategy within their research framework. They found that the level of proactivity added
into environmental strategies to have a direct impact on EMA in waste management
system of local governments. In sum, environmental strategy implementation facilitates
the emergence of firm’s adoption of EMA.
iv) Regulatory Pressure and EMA
According to Liu et al. (2010), government agencies are the obvious actors that
influence organizations’ adoption of green practices. For instance, in order to reduce
pollution towards the environment, organizations need to use pollution-control
214
International Journal of Economics and Management
technology and report their pollution emissions. Otherwise, organizations may face legal
sanctions that affect business progress. The fear of legal sanctions is considered the
main reason why organizations practice going green (Hoffman, 1997). The
government’s environmental policy and regulations are critical drivers in which firms
have to comply with (Schrettle et al., 2014). Banerjee (2001) suggested that regulatory
requirements have a significant impact on organizational green approaches, profitability,
and growth. Jamaluddin et al. (2009) stated that Malaysia, following the vision of 2020,
has introduced environmentally sound and sustainable development as two main factors
in social, cultural, and economic progress and enhancement of the quality of life of
Malaysians. Therefore, companies are encouraged by the Malaysian Government to
enhance their performance by minimizing their activities that exert an impact on the
environment and increasing their innovative capacity through superior environmental
cost information for creating and sustaining competitive advantages. Therefore, it brings
the role of regulatory pressure to implement the EMA as a new tool in management
accounting. This could be viewed as a strategic management technique that is embedded
in the current management accounting practices, which create and drive companies’
values to a higher level of environmental performance.
v) Top Management Commitment and EMA
The successful implementation of EMA activities requires the commitment from
different functional departments (Lee, 2011; Yakhou and Dorweiler, 2004). The
literature recommends that the absence of correspondence between accounting and EMS
can possibly hinder firms’ efforts with respect to EMA adoption (Bartolomeo et al.,
2000; Bennett and James, 2017; Lee, 2011), it is sensible to accept that EMA will
probably be actualized and effective when the organizational structure of a business
supports parallel communication and exchange of ideas within a firm. Pondeville et al.’s
(2013) findings highlighted the importance of top management in the development of a
corporate environmental strategy and adoption of a more advanced management control
system to drive business success. In summary, top management commitment is crucial
in driving any change in management or new implementation such as EMA.
vi) EMA and Environmental Performance
According to the International Federation of Accountants (IFAC; 1998, para. 1): “EMA
is the management of environmental and economic performance through the
development and implementation of appropriate environment-related accounting
systems and practices. While this may include reporting and auditing in some
companies, EMA typically involves life-cycle costing, full-cost accounting, benefits
assessment, and strategic planning for environmental management”. EMA allows for a
better integration of the environmental information into the existing accounting systems.
As it explicitly treats environmental costs and tracks environmental information, EMA
also highlighted hidden environmental costs and benefits (Jasch 2003; Jasch and
215
The Relationship between Contingent Factors
Lavicka, 2006) and helps firms to work to face their environmental responsibilities
(Schaltegger and Burritt, 2000).
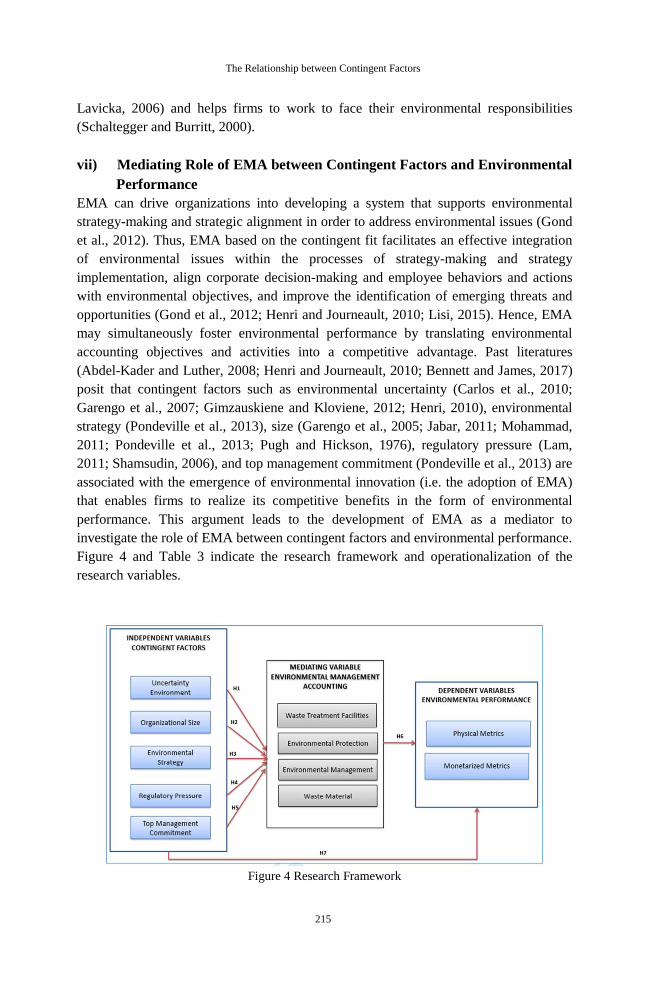
vii) Mediating Role of EMA between Contingent Factors and Environmental
Performance
EMA can drive organizations into developing a system that supports environmental
strategy-making and strategic alignment in order to address environmental issues (Gond
et al., 2012). Thus, EMA based on the contingent fit facilitates an effective integration
of environmental issues within the processes of strategy-making and strategy
implementation, align corporate decision-making and employee behaviors and actions
with environmental objectives, and improve the identification of emerging threats and
opportunities (Gond et al., 2012; Henri and Journeault, 2010; Lisi, 2015). Hence, EMA
may simultaneously foster environmental performance by translating environmental
accounting objectives and activities into a competitive advantage. Past literatures
(Abdel-Kader and Luther, 2008; Henri and Journeault, 2010; Bennett and James, 2017)
posit that contingent factors such as environmental uncertainty (Carlos et al., 2010;
Garengo et al., 2007; Gimzauskiene and Kloviene, 2012; Henri, 2010), environmental
strategy (Pondeville et al., 2013), size (Garengo et al., 2005; Jabar, 2011; Mohammad,
2011; Pondeville et al., 2013; Pugh and Hickson, 1976), regulatory pressure (Lam,
2011; Shamsudin, 2006), and top management commitment (Pondeville et al., 2013) are
associated with the emergence of environmental innovation (i.e. the adoption of EMA)
that enables firms to realize its competitive benefits in the form of environmental
performance. This argument leads to the development of EMA as a mediator to
investigate the role of EMA between contingent factors and environmental performance.
Figure 4 and Table 3 indicate the research framework and operationalization of the
research variables.
Figure 4 Research Framework

216
International Journal of Economics and Management
Table 3 Operationalization of Research Variables
Variables Definition Operational References
Organization-Contingent Factors
Uncertainty
Environment
(UE)
This refers to
the
environment,
market
changes, and
regulations,
which creates an
environment of
uncertainty
• In an uncertainty operating
environment, the manner
organizations compete with
the competitors.
• Do organizations respond in
adopting the manufacturing
technology to improve their
productivity?
• The organizational ability to
sustain while dealing with
uncertainty environment
change.
• The organizational ability to
detect market and
environment changes and
encourage employees to
accept and identify the
goals; and
• Organizational progress in
launching new products that
indicate clear
market/customer focus.
Henri
(2010);
Carlos
(2010);
Neely et
al. (2005);
Pondeville
et al.
(2013)
Organizational
Size (OS)
In pursuit to
understand if
company size is
really concern.
Will that impact
the Environment
Management
Accounting
implementation?
• A large organization with
more resources is able to
develop performances
metrics in depth.
• Larger organizations
especially multinational
companies have already
embarked EMA.
Pondeville
et al.
(2013);
Henri
(2010);
Neely
(1999)

217
The Relationship between Contingent Factors
Table 3 Cont.
Environmental
Strategy (ES)
To understand
the
implementation
of
Environmental
Strategy in the
improvement of
a manufacturing
company’s
condition.
• The organization’s ability to
translate key performance
indicators that reach
bottom-line employees and
fit the manufacturing
process;
• The organization’s ability to
align those strategies with
appropriate tools that could
demonstrate to the
management commitment
and decision making;
• The ability to detect a gap
in the responsiveness to
markets, which impacts on
the organization’s
effectiveness; and
• Leader’s effectiveness from
environmental perspective
on environmental policy,
review that is being
embedded into products and
processes.
Pondeville
et al.
(2013);
Henri and
Journeault
(2008);
Chenhall
(2003);
Garengo et
al.
(2005a);
Henk and
Joost
(2009);
Siti-
Nabiha
(2010)
Regulator
Pressure (RP)
This is to
understand the
impact of
regulator
pressure on
performances of
the company.
At the same
time what are
their opinions
about it.
• The organization’s sharing
on their opinion on
regulator pressure;
• How do they find the
support and subject matter
experts provided to them?
and
• Effectiveness and
implementation that
required additional
resources and cost to
company.
Shamsudin
(2006);
Norhayati
(2009);
Pondeville
et al.
(2013);
Gestel and
Hertogh
(2006)
Top
Management
Commitment
(TMC)
This
distinguishes
commitment
from top
management to
drive and
enforce on
environmental
matter and
improvement.
• The management’s ability to
communicate and sustain
via key strategies of the
company;
• The environmental
improvement, initiatives
and review being
periodically done by the top
management;
• They are always vigilant on
the changes occurring in
environmental policy.
Pondeville
et al.
(2013);
Henri
(2008);
Lam
(2011)
218
International Journal of Economics and Management
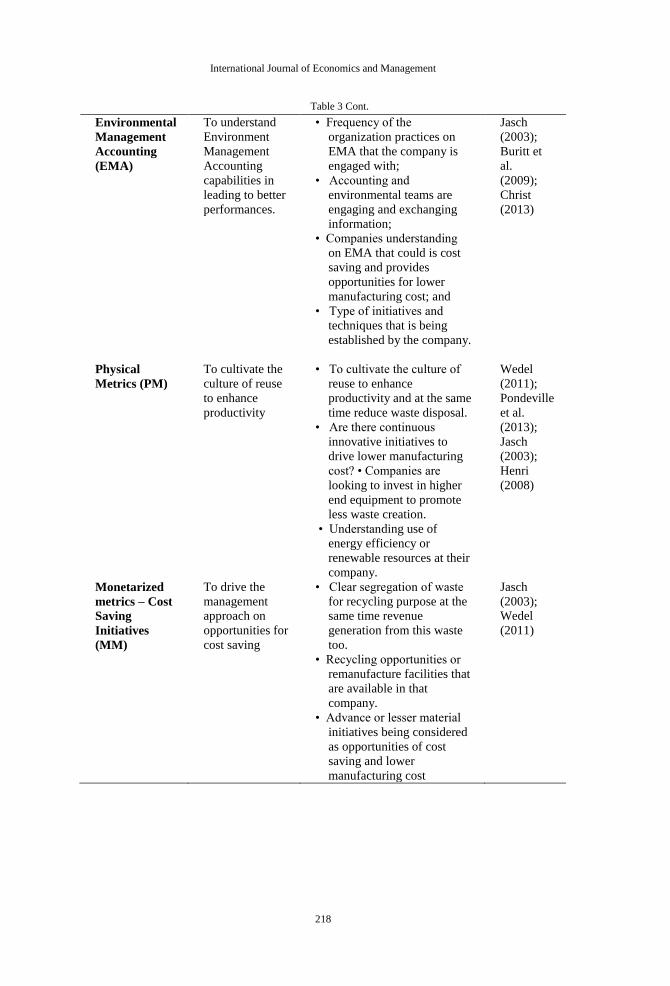
Table 3 Cont.
Environmental
Management
Accounting
(EMA)
To understand
Environment
Management
Accounting
capabilities in
leading to better
performances.
• Frequency of the
organization practices on
EMA that the company is
engaged with;
• Accounting and
environmental teams are
engaging and exchanging
information;
• Companies understanding
on EMA that could is cost
saving and provides
opportunities for lower
manufacturing cost; and
• Type of initiatives and
techniques that is being
established by the company.
Jasch
(2003);
Buritt et
al.
(2009);
Christ
(2013)
Physical
Metrics (PM)
To cultivate the
culture of reuse
to enhance
productivity
• To cultivate the culture of
reuse to enhance
productivity and at the same
time reduce waste disposal.
• Are there continuous
innovative initiatives to
drive lower manufacturing
cost? • Companies are
looking to invest in higher
end equipment to promote
less waste creation.
• Understanding use of
energy efficiency or
renewable resources at their
company.
Wedel
(2011);
Pondeville
et al.
(2013);
Jasch
(2003);
Henri
(2008)
Monetarized
metrics – Cost
Saving
Initiatives
(MM)
To drive the
management
approach on
opportunities for
cost saving
• Clear segregation of waste
for recycling purpose at the
same time revenue
generation from this waste
too.
• Recycling opportunities or
remanufacture facilities that
are available in that
company.
• Advance or lesser material
initiatives being considered
as opportunities of cost
saving and lower
manufacturing cost
Jasch
(2003);
Wedel
(2011)
219
The Relationship between Contingent Factors
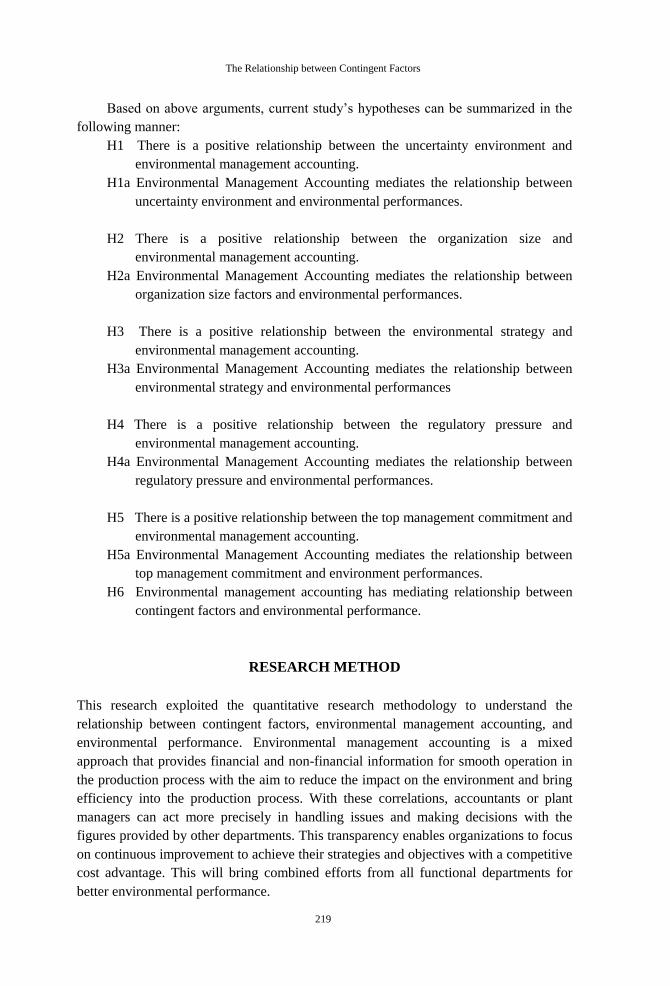
Based on above arguments, current study’s hypotheses can be summarized in the
following manner:
H1 There is a positive relationship between the uncertainty environment and
environmental management accounting.
H1a Environmental Management Accounting mediates the relationship between
uncertainty environment and environmental performances.
H2 There is a positive relationship between the organization size and
environmental management accounting.
H2a Environmental Management Accounting mediates the relationship between
organization size factors and environmental performances.
H3 There is a positive relationship between the environmental strategy and
environmental management accounting.
H3a Environmental Management Accounting mediates the relationship between
environmental strategy and environmental performances
H4 There is a positive relationship between the regulatory pressure and
environmental management accounting.
H4a Environmental Management Accounting mediates the relationship between
regulatory pressure and environmental performances.
H5 There is a positive relationship between the top management commitment and
environmental management accounting.
H5a Environmental Management Accounting mediates the relationship between
top management commitment and environment performances.
H6 Environmental management accounting has mediating relationship between
contingent factors and environmental performance.
RESEARCH METHOD
This research exploited the quantitative research methodology to understand the
relationship between contingent factors, environmental management accounting, and
environmental performance. Environmental management accounting is a mixed
approach that provides financial and non-financial information for smooth operation in
the production process with the aim to reduce the impact on the environment and bring
efficiency into the production process. With these correlations, accountants or plant
managers can act more precisely in handling issues and making decisions with the
figures provided by other departments. This transparency enables organizations to focus
on continuous improvement to achieve their strategies and objectives with a competitive
cost advantage. This will bring combined efforts from all functional departments for
better environmental performance.
220
International Journal of Economics and Management
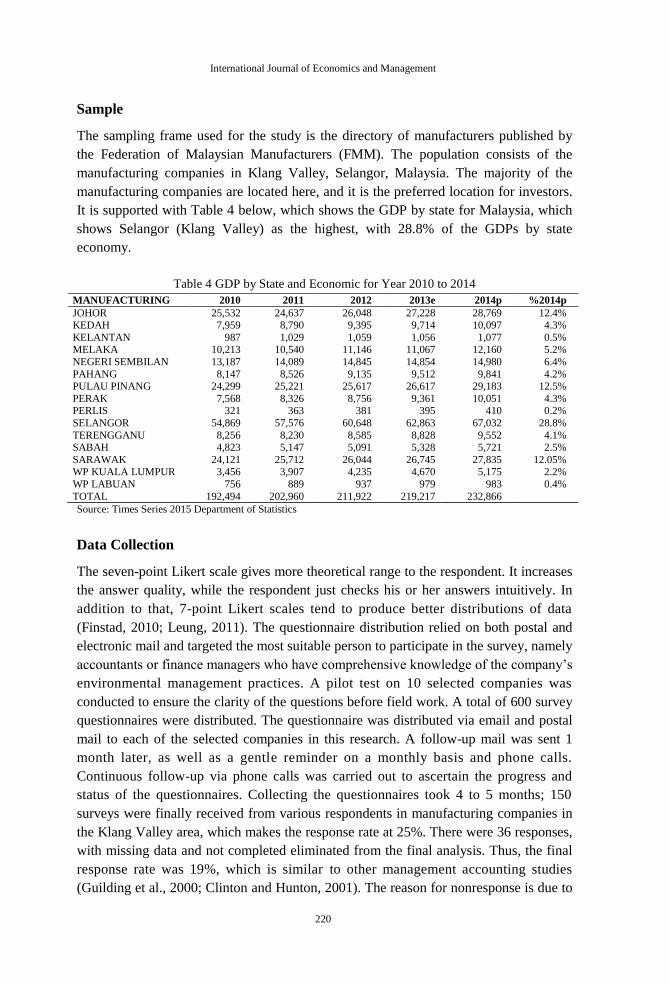
Sample
The sampling frame used for the study is the directory of manufacturers published by
the Federation of Malaysian Manufacturers (FMM). The population consists of the
manufacturing companies in Klang Valley, Selangor, Malaysia. The majority of the
manufacturing companies are located here, and it is the preferred location for investors.
It is supported with Table 4 below, which shows the GDP by state for Malaysia, which
shows Selangor (Klang Valley) as the highest, with 28.8% of the GDPs by state
economy.
Table 4 GDP by State and Economic for Year 2010 to 2014
MANUFACTURING 2010 2011 2012 2013e 2014p %2014p
JOHOR 25,532 24,637 26,048 27,228 28,769 12.4% KEDAH 7,959 8,790 9,395 9,714 10,097 4.3%
KELANTAN 987 1,029 1,059 1,056 1,077 0.5%
MELAKA 10,213 10,540 11,146 11,067 12,160 5.2%
NEGERI SEMBILAN 13,187 14,089 14,845 14,854 14,980 6.4%
PAHANG 8,147 8,526 9,135 9,512 9,841 4.2%
PULAU PINANG 24,299 25,221 25,617 26,617 29,183 12.5%
PERAK 7,568 8,326 8,756 9,361 10,051 4.3%
PERLIS 321 363 381 395 410 0.2%
SELANGOR 54,869 57,576 60,648 62,863 67,032 28.8%
TERENGGANU 8,256 8,230 8,585 8,828 9,552 4.1%
SABAH 4,823 5,147 5,091 5,328 5,721 2.5%
SARAWAK 24,121 25,712 26,044 26,745 27,835 12.05%
WP KUALA LUMPUR 3,456 3,907 4,235 4,670 5,175 2.2%
WP LABUAN 756 889 937 979 983 0.4%
TOTAL 192,494 202,960 211,922 219,217 232,866
Source: Times Series 2015 Department of Statistics
Data Collection
The seven-point Likert scale gives more theoretical range to the respondent. It increases
the answer quality, while the respondent just checks his or her answers intuitively. In
addition to that, 7-point Likert scales tend to produce better distributions of data
(Finstad, 2010; Leung, 2011). The questionnaire distribution relied on both postal and
electronic mail and targeted the most suitable person to participate in the survey, namely
accountants or finance managers who have comprehensive knowledge of the company’s
environmental management practices. A pilot test on 10 selected companies was
conducted to ensure the clarity of the questions before field work. A total of 600 survey
questionnaires were distributed. The questionnaire was distributed via email and postal
mail to each of the selected companies in this research. A follow-up mail was sent 1
month later, as well as a gentle reminder on a monthly basis and phone calls.
Continuous follow-up via phone calls was carried out to ascertain the progress and
status of the questionnaires. Collecting the questionnaires took 4 to 5 months; 150
surveys were finally received from various respondents in manufacturing companies in
the Klang Valley area, which makes the response rate at 25%. There were 36 responses,
with missing data and not completed eliminated from the final analysis. Thus, the final
response rate was 19%, which is similar to other management accounting studies
(Guilding et al., 2000; Clinton and Hunton, 2001). The reason for nonresponse is due to
221
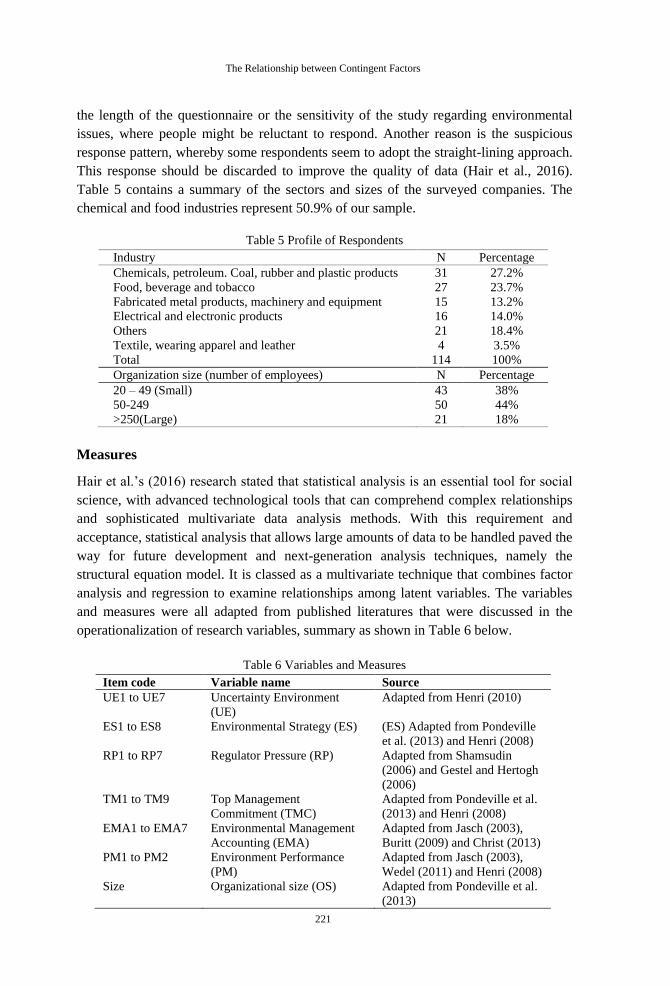
The Relationship between Contingent Factors
the length of the questionnaire or the sensitivity of the study regarding environmental
issues, where people might be reluctant to respond. Another reason is the suspicious
response pattern, whereby some respondents seem to adopt the straight-lining approach.
This response should be discarded to improve the quality of data (Hair et al., 2016).
Table 5 contains a summary of the sectors and sizes of the surveyed companies. The
chemical and food industries represent 50.9% of our sample.
Table 5 Profile of Respondents
Industry N Percentage
Chemicals, petroleum. Coal, rubber and plastic products 31 27.2%
Food, beverage and tobacco 27 23.7%
Fabricated metal products, machinery and equipment 15 13.2%
Electrical and electronic products 16 14.0%
Others 21 18.4%
Textile, wearing apparel and leather 4 3.5%
Total 114 100%
Organization size (number of employees) N Percentage
20 – 49 (Small) 43 38%
50-249 50 44%
>250(Large) 21 18%
Measures
Hair et al.’s (2016) research stated that statistical analysis is an essential tool for social
science, with advanced technological tools that can comprehend complex relationships
and sophisticated multivariate data analysis methods. With this requirement and
acceptance, statistical analysis that allows large amounts of data to be handled paved the
way for future development and next-generation analysis techniques, namely the
structural equation model. It is classed as a multivariate technique that combines factor
analysis and regression to examine relationships among latent variables. The variables
and measures were all adapted from published literatures that were discussed in the
operationalization of research variables, summary as shown in Table 6 below.
Table 6 Variables and Measures
Item code Variable name Source
UE1 to UE7 Uncertainty Environment
(UE)
Adapted from Henri (2010)
ES1 to ES8 Environmental Strategy (ES) (ES) Adapted from Pondeville
et al. (2013) and Henri (2008)
RP1 to RP7 Regulator Pressure (RP) Adapted from Shamsudin
(2006) and Gestel and Hertogh
(2006)
TM1 to TM9 Top Management
Commitment (TMC)
Adapted from Pondeville et al.
(2013) and Henri (2008)
EMA1 to EMA7 Environmental Management
Accounting (EMA)
Adapted from Jasch (2003),
Buritt (2009) and Christ (2013)
PM1 to PM2 Environment Performance
(PM)
Adapted from Jasch (2003),
Wedel (2011) and Henri (2008)
Size Organizational size (OS) Adapted from Pondeville et al.
(2013)
222
International Journal of Economics and Management
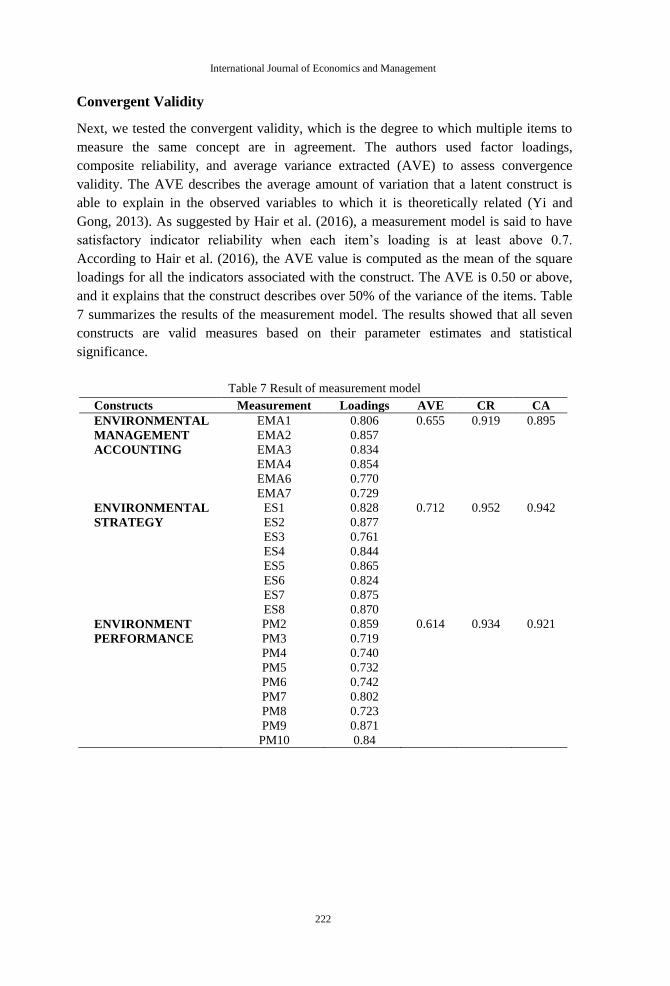
Convergent Validity
Next, we tested the convergent validity, which is the degree to which multiple items to
measure the same concept are in agreement. The authors used factor loadings,
composite reliability, and average variance extracted (AVE) to assess convergence
validity. The AVE describes the average amount of variation that a latent construct is
able to explain in the observed variables to which it is theoretically related (Yi and
Gong, 2013). As suggested by Hair et al. (2016), a measurement model is said to have
satisfactory indicator reliability when each item’s loading is at least above 0.7.
According to Hair et al. (2016), the AVE value is computed as the mean of the square
loadings for all the indicators associated with the construct. The AVE is 0.50 or above,
and it explains that the construct describes over 50% of the variance of the items. Table
7 summarizes the results of the measurement model. The results showed that all seven
constructs are valid measures based on their parameter estimates and statistical
significance.
Table 7 Result of measurement model
Constructs Measurement Loadings AVE CR CA
ENVIRONMENTAL
MANAGEMENT
ACCOUNTING
EMA1
EMA2
EMA3
EMA4
EMA6
EMA7
0.806
0.857
0.834
0.854
0.770
0.729
0.655 0.919 0.895
ENVIRONMENTAL
STRATEGY
ES1
ES2
ES3
ES4
ES5
ES6
ES7
ES8
0.828
0.877
0.761
0.844
0.865
0.824
0.875
0.870
0.712 0.952 0.942
ENVIRONMENT
PERFORMANCE
PM2
PM3
PM4
PM5
PM6
PM7
PM8
PM9
PM10
0.859
0.719
0.740
0.732
0.742
0.802
0.723
0.871
0.84
0.614 0.934 0.921
223
The Relationship between Contingent Factors
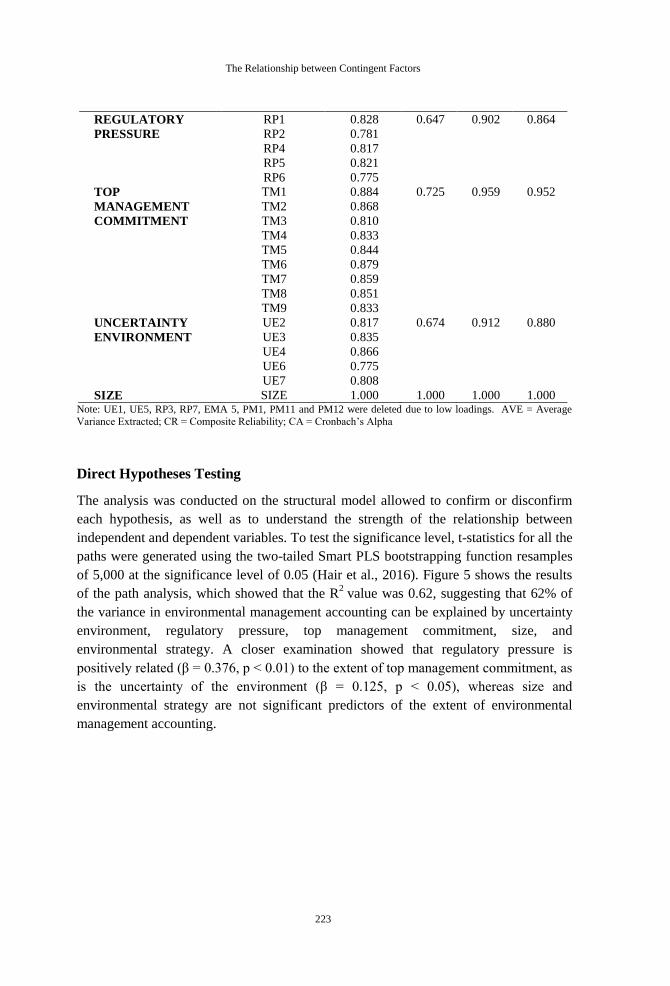
REGULATORY
PRESSURE
RP1
RP2
RP4
RP5
RP6
0.828
0.781
0.817
0.821
0.775
0.647 0.902 0.864
TOP
MANAGEMENT
COMMITMENT
TM1
TM2
TM3
TM4
TM5
TM6
TM7
TM8
TM9
0.884
0.868
0.810
0.833
0.844
0.879
0.859
0.851
0.833
0.725 0.959 0.952
UNCERTAINTY
ENVIRONMENT
UE2
UE3
UE4
UE6
UE7
0.817
0.835
0.866
0.775
0.808
0.674 0.912 0.880
SIZE SIZE 1.000 1.000 1.000 1.000 Note: UE1, UE5, RP3, RP7, EMA 5, PM1, PM11 and PM12 were deleted due to low loadings. AVE = Average
Variance Extracted; CR = Composite Reliability; CA = Cronbach’s Alpha
Direct Hypotheses Testing
The analysis was conducted on the structural model allowed to confirm or disconfirm
each hypothesis, as well as to understand the strength of the relationship between
independent and dependent variables. To test the significance level, t-statistics for all the
paths were generated using the two-tailed Smart PLS bootstrapping function resamples
of 5,000 at the significance level of 0.05 (Hair et al., 2016). Figure 5 shows the results
of the path analysis, which showed that the R2
value was 0.62, suggesting that 62% of
the variance in environmental management accounting can be explained by uncertainty
environment, regulatory pressure, top management commitment, size, and
environmental strategy. A closer examination showed that regulatory pressure is
positively related (β = 0.376, p < 0.01) to the extent of top management commitment, as
is the uncertainty of the environment (β = 0.125, p < 0.05), whereas size and
environmental strategy are not significant predictors of the extent of environmental
management accounting.
224
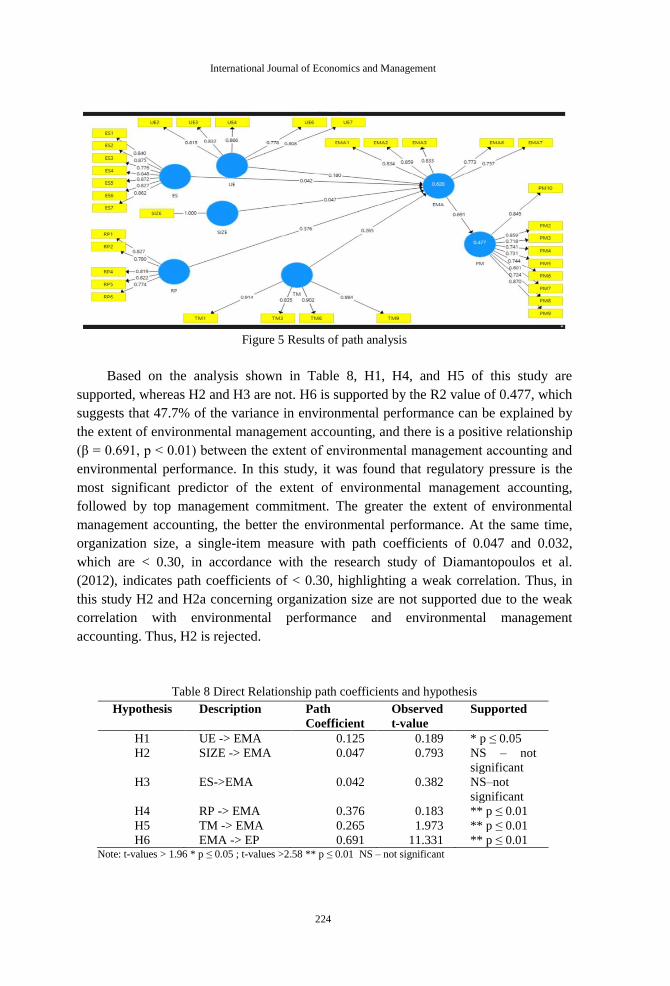
International Journal of Economics and Management
Figure 5 Results of path analysis
Based on the analysis shown in Table 8, H1, H4, and H5 of this study are
supported, whereas H2 and H3 are not. H6 is supported by the R2 value of 0.477, which
suggests that 47.7% of the variance in environmental performance can be explained by
the extent of environmental management accounting, and there is a positive relationship
(β = 0.691, p < 0.01) between the extent of environmental management accounting and
environmental performance. In this study, it was found that regulatory pressure is the
most significant predictor of the extent of environmental management accounting,
followed by top management commitment. The greater the extent of environmental
management accounting, the better the environmental performance. At the same time,
organization size, a single-item measure with path coefficients of 0.047 and 0.032,
which are < 0.30, in accordance with the research study of Diamantopoulos et al.
(2012), indicates path coefficients of < 0.30, highlighting a weak correlation. Thus, in
this study H2 and H2a concerning organization size are not supported due to the weak
correlation with environmental performance and environmental management
accounting. Thus, H2 is rejected.
Table 8 Direct Relationship path coefficients and hypothesis
Hypothesis Description Path
Coefficient
Observed
t-value
Supported
H1 UE -> EMA 0.125 0.189 * p ≤ 0.05
H2 SIZE -> EMA 0.047 0.793 NS – not
significant
H3 ES->EMA 0.042 0.382 NS–not
significant
H4 RP -> EMA 0.376 0.183 ** p ≤ 0.01
H5 TM -> EMA 0.265 1.973 ** p ≤ 0.01
H6 EMA -> EP 0.691 11.331 ** p ≤ 0.01 Note: t-values > 1.96 * p ≤ 0.05 ; t-values >2.58 ** p ≤ 0.01 NS – not significant
225
The Relationship between Contingent Factors
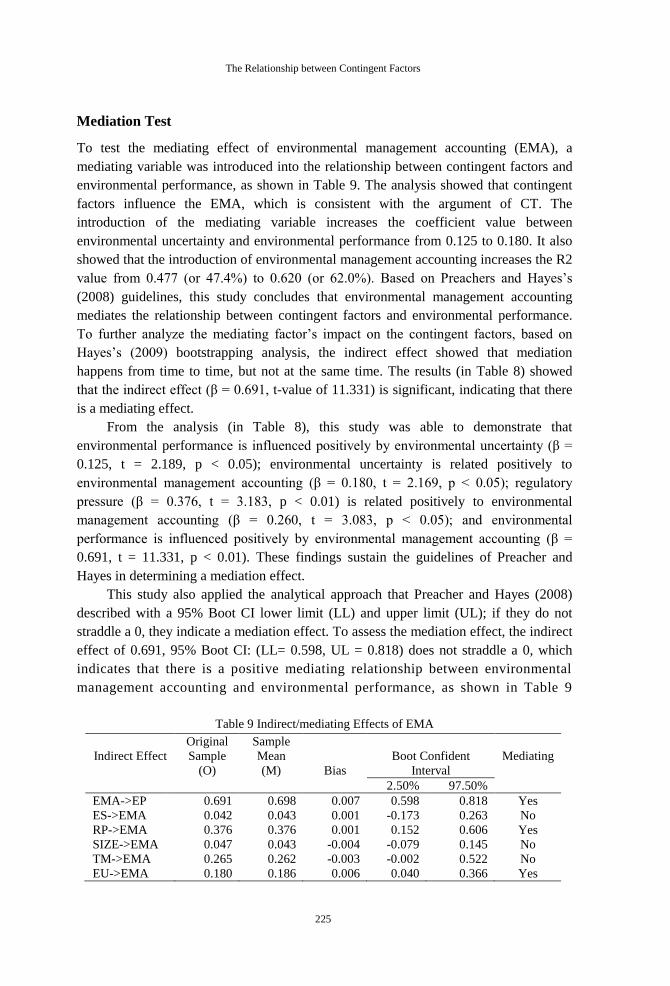
Mediation Test
To test the mediating effect of environmental management accounting (EMA), a
mediating variable was introduced into the relationship between contingent factors and
environmental performance, as shown in Table 9. The analysis showed that contingent
factors influence the EMA, which is consistent with the argument of CT. The
introduction of the mediating variable increases the coefficient value between
environmental uncertainty and environmental performance from 0.125 to 0.180. It also
showed that the introduction of environmental management accounting increases the R2
value from 0.477 (or 47.4%) to 0.620 (or 62.0%). Based on Preachers and Hayes’s
(2008) guidelines, this study concludes that environmental management accounting
mediates the relationship between contingent factors and environmental performance.
To further analyze the mediating factor’s impact on the contingent factors, based on
Hayes’s (2009) bootstrapping analysis, the indirect effect showed that mediation
happens from time to time, but not at the same time. The results (in Table 8) showed
that the indirect effect (β = 0.691, t-value of 11.331) is significant, indicating that there
is a mediating effect.
From the analysis (in Table 8), this study was able to demonstrate that
environmental performance is influenced positively by environmental uncertainty (β =
0.125, t = 2.189, p < 0.05); environmental uncertainty is related positively to
environmental management accounting (β = 0.180, t = 2.169, p < 0.05); regulatory
pressure (β = 0.376, t = 3.183, p < 0.01) is related positively to environmental
management accounting (β = 0.260, t = 3.083, p < 0.05); and environmental
performance is influenced positively by environmental management accounting (β =
0.691, t = 11.331, p < 0.01). These findings sustain the guidelines of Preacher and
Hayes in determining a mediation effect.
This study also applied the analytical approach that Preacher and Hayes (2008)
described with a 95% Boot CI lower limit (LL) and upper limit (UL); if they do not
straddle a 0, they indicate a mediation effect. To assess the mediation effect, the indirect
effect of 0.691, 95% Boot CI: (LL= 0.598, UL = 0.818) does not straddle a 0, which
indicates that there is a positive mediating relationship between environmental
management accounting and environmental performance, as shown in Table 9
Table 9 Indirect/mediating Effects of EMA
Indirect Effect
Original
Sample
(O)
Sample
Mean
(M) Bias
Boot Confident
Interval
Mediating
2.50% 97.50%
EMA->EP 0.691 0.698 0.007 0.598 0.818 Yes
ES->EMA 0.042 0.043 0.001 -0.173 0.263 No
RP->EMA 0.376 0.376 0.001 0.152 0.606 Yes
SIZE->EMA 0.047 0.043 -0.004 -0.079 0.145 No
TM->EMA 0.265 0.262 -0.003 -0.002 0.522 No
EU->EMA 0.180 0.186 0.006 0.040 0.366 Yes
226
International Journal of Economics and Management
The analysis also demonstrated that environmental management accounting has a
partial mediating effect on the relationship between contingent factors and
environmental performance. This is because the introduction of environmental
management accounting as a mediating factor increases the coefficient value between
environmental uncertainty and environmental performance from 0.125 to 0.180. The
introduction of environmental management accounting as a mediating variable increases
the R2 value from 0.477 to 0.620. This result is consistent with previous studies
conducted by Hair et al. (2016) and Hashim (2012).
Another way to determine the strength of this mediation is to use the VAF
(variance accounted for), which determines the size of the indirect effect in relation to
the total effect. The direct effect of environmental uncertainty on environmental
performance has a value of 0.125, while the indirect effect via environmental
management accounting is 0.180. Thus, the total effect has a value of 0.125 +
(0.180.0.691) = 0.249. The VAF equals the direct effect divided by the total effect and
has a value of 0.124/0.249 = 0.499. Consequently, 49.9% of the environmental
uncertainty effect on environmental performance is explained by environmental
management accounting. Since the VAF is larger than 20%, but smaller than 80%, this
situation is classified as partial mediation. Thus, this study confirms that environmental
management accounting has a partial mediating effect on the relationship between
contingent factors and environmental performance.
DISCUSSION
The primary purpose of this study was to identify the contingent factors that influence
environmental management accounting and environmental performance. Generally, the
respondents in the sample perceived that their organizations would engage in EMA
practices and result in better environmental performance.
The current study found that uncertainty environment, regulatory pressure, and top
management have a significant relationship with EMA. Firstly, environment-related
issues are becoming important for stakeholders, and companies nowadays are trying to
mitigate environmental uncertainty by adopting more advanced management control
techniques. This is also evident in Malaysia, in which companies implement EMA to
mitigate the impact of current environmental issues such as industrial waste or water
pollution and sustain their current businesses. Secondly, in a developing country like
Malaysia, regulatory pressure is more effective in enforcing new initiatives, and this
result is consistent with previous studies that examine EMA adoption (Christ, 2013;
Pondeville, 2013). However, the previous study by Pondeville (2013) stated that there is
a significant effect of regulatory pressure, but not the degree of corporate environmental
proactivity. Regulatory pressure only prompts companies to collect environmental
information. Thirdly, any management changes or innovations must be supported by top
management because they are the ones to develop and implement the changes. As a
result, top management commitment would ensure the successful adoption of more
advanced management control techniques, i.e. EMA. This result is similar to Pondeville

227
The Relationship between Contingent Factors
et al.’s (2013) study, which highlighted the importance of top management commitment
to driving the culture of EMA and performance by developing environmental
proactivity and audits.
Contrary to existing EMA literatures, this study did not find any significant
association between (1) organizational size and EMA, and (2) environmental strategy
and EMA. Environmental strategy as the contingent factor is not supported in this
analysis due to a lack of internal written environmental policy in local organizations
compared with multinational and global companies, in which the environmental
awareness is more prominent. However, Christ and Buritt’s (2013) research
demonstrates a high level of reliability for the present and future use of environmental
strategy in environmental management accounting. In this study, environmental strategy
correlates with top management commitment, and leaders’ effectiveness matters.
Therefore, future research should raise more environmental concerns that should be
integrated with corporate strategy to be adapted into a questionnaire. In terms of
organizational size, size would not matter when it comes to organizational innovation
such as adoption of EMA. For example, some large companies with more resources find
it difficult to accept changes due to the complexity and red tape in management
decision.
From the analysis, this study was able to demonstrate that environmental
performance is influenced positively by environmental management accounting. These
findings support the guidelines on the indirect effects of Preacher and Hayes (2008),
who were both confident in the interval and determine the mediation effect. It also
indicated that part of the impact of environmental uncertainty and part of the effect of
regulatory pressure on environmental performance have been overtaken by EMA.
Furthermore, this study demonstrated that environmental uncertainty and regulatory
pressure have a more dominant mediating effect on environmental performance.
Implication
These findings have a number of implications for both theoretical and policy
development in the EMA area. First, from a theoretical perspective, there was sufficient
evidence for three of the contingent variables to suggest organizational context does
play a significant role in determining whether organizations choose to adopt EMA
practices. The findings of the current study are consistent with the CT, in which
organizations match their practices to the circumstances they find themselves in.
Furthermore, as suggested by Qian et al. (2011), while organizations may face sources
of environmentally induced institutional pressure to address environmental issues, the
manner in which they respond to such pressure is likely to be shaped by the specific
circumstances faced by individual organizations. Hence, the findings support the
extension of contingency research into the field of EMA, as previously suggested by
Parker (1997), Bouma and van der Veen (2002), and Qian et al. (2011). The results also
suggest that in order to obtain a more thorough understanding of EMA in practice,
228
International Journal of Economics and Management
researchers need to look beyond social system-based theories that have traditionally
dominated environmental accounting literature.
This study also contributes practical implications. Most importantly, this
research’s findings may help top management or accountants to understand the current
problems faced by manufacturing industries. This research shows that top management
is vigilant regarding environmental policy and changes. At the same time, the sharing of
environmental improvements and initiatives creates awareness and implants them well
from the lower level of employees in most companies. However, a lack of training given
to employees about the environmental segment was found in this study. Therefore,
organizations could have more training awareness so that the importance of the
environment can spread mentally from the bottom level up to the higher levels in the
organization.
CONCLUSION
This study sought to investigate whether finance managers or accountants perceived
there to be a present and future role for EMA in the manufacturing industry in Malaysia.
Drawing on CT, a research framework was developed that incorporated the following
contingent variables: uncertainty environment, size, environmental strategy, regulatory
pressure, and top management commitment. Overall, the quantitative research showed
that the manufacturing firms in Klang Valley are aware of the issue of environmental
performance and the implementation of EMA practices, regardless of the company age
or size. The results revealed that those companies do not impose the issue of
environmental performance well on their daily production cycle, business practices, and
strategies, which resulted in inefficiency in the production process. Furthermore, the
implementation of environmental management accounting in companies’ practices is
time-consuming; the companies’ environmental strategy and culture are also not easily
changed in a short time. Thus, the environmental strategy factors are not favorable to
EMA. Therefore, future research should raise more environmental concerns that should
be integrated with corporate strategy to be adapted into a questionnaire. Since
environmental issues have progressively become essential, the need for improvement in
environmental performance has become apparent. Therefore, companies in Malaysia
should consider environmental performance as an important metric during their strategy
planning, development of new product design, selection of vendors, as well as the
development of culture. Finally, the study provided empirical knowledge towards the
understanding of the driving factors of environmental management accounting practices
in Malaysia. It considers that environmental issues are closely associated with business
sustainability agendas; policy-makers should recognize the need to instill regulatory
pressure to promote environmental business practices.

229
The Relationship between Contingent Factors
REFERENCES
Anbumozhi, V. and Intal, P. S. (2015), “Can Thinking Green and Sustainability Be an Economic
Opportunity for ASEAN?”, Economic Research Institute for ASEAN and East Asia (ERIA),
Jakarta.
Aragón-Correa, J. A. and Rubio-Lopez, E. A. (2007), “Proactive corporate environmental
strategies: myths and misunderstandings”, Long Range Planning, Vol. 40 No. 3, pp. 357-381.
Bartolomeo, M., Bennett, M., Bouma, J. J., Heydkamp, P., James, P. and Wolters, T. (2000),
“Environmental management accounting in Europe: current practice and future potential”,
European Accounting Review, Vol. 9 No.1, pp. 31-52.
Bennett, M. D., Bouma, J. J. and Wolters, T. J. (Eds.). (2002), “Environmental management
accounting: Informational and institutional developments (Vol. 9)”, Springer Science &
Business Media.Bennett, M., and James, P. (Eds.). (2017). The Green bottom line:
environmental accounting for management: current practice and future trends. Routledge.
Cadez, S. and Guilding, C. (2008), “An exploratory investigation of an integrated contingency
model of strategic management accounting”, Accounting, organizations and society, Vol. 33
No. 7, pp. 836-863.
Carlos, F. G., Mahmoud, M. Y. and Joao, V. L. (2010), “Performance measurement practices in
manufacturing firms revisited”, International Journal of Operations & Production
Management, Vol. 31 No. 1, pp. 7-8.
Chenhall, R. H. (2003), “Management control systems design within its organizational context:
findings from contingency-based research and directions for the future”, Accounting,
Organizations and Society, Vol. 28, pp. 127-68.
Christ, K. L. and Burritt, R. L. (2013), “Environmental management accounting: the significance
of contingent variables for adoption”, Journal of Cleaner Production, Vol. 41, pp. 163–173.
Clarkson, P. M., Overell, M. B. and Chapple, L. (2011), “Environmental reporting and its relation
to corporate environmental performance”, Abacus, Vol. 47 No. 1, pp. 27-60.
Clinton, B. D. and Hunton, J. E. (2001), “Linking Participative Budgeting Congruence to
Organization Performance (Retracted)”, Behavioral research in accounting, Vol. 13 No. 1,
pp. 127-141.
Delai, I. and Takahashi, S. (2011), “Sustainability measurement system: a reference model
proposal”, Social Responsibility Jounral, Vol. 7 No. 3, pp. 438-471.
Federal of Malaysian Manufacturers (FMM) directory (2014), “Malaysian Industries 45th
Edition”.
Finstad, K. (2010), “Response interpolation and scale sensitivity: Evidence against 5-point
scales”, Journal of Usability Studies, Vol. 5 No. 3, pp. 104-110.
Garengo, P. and Bititci. U. (2007), “Towards a contingency approach to performance
measurement: an empirical study in Scottish SMEs”, International Journal of Operation &
Production Management, Vol. 27 No. 8, pp. 806-807.

230
International Journal of Economics and Management
Guilding, C., Cravens, K. S. and Tayles, M. (2000), “An international comparison of strategic
management accounting practices”, Management Accounting Research, Vol. 11 No. 1, pp.
113-135.
Hair, J. F., Hult, G., Ringle, C. and Sarstedt, M. (2016), “A primer on partial least squares
structural equation modeling (PLS-SEM)”, Sage.
Hashim. K (2012), “Understanding the determinants of continuous knowledge sharing intention
within business online communities”, pp. 105-110.
Hayes, A. F. (2009), “Beyond Baron and Kenny: Statistical Mediation Analysis in the New
Millennium”, Communication Monographs, Vol. 76 No. 4, pp. 408-420.
Henri, J. F. (2010), “The Periodic Review of Performance Indicators: An Empirical Investigation
of the Dynamism of Performance Measurement Systems”, European Accounting Review,
Vol. 19 No. 1. pp.73-96.
Henri, J. F. and Journeault, M. (2008), “Environmental performance indicators: An empirical
study of Canadian manufacturing firms”, Journal of environmental management, Vol. 87 No.
1, pp. 165-176.
Herzig, C., Viere, T., Schaltegger, S., Burritt, R. L. (2012), “Environmental Management
Accounting”, Case Studies in South-east Asian Companies, Routledge, London and New
York.
Hopwood, A., Unerman, J. and Fries, J. (2010), “Accounting for Sustainability: Practical
Insights”, London: Earthscan.
Indicators of Sustainable Development (2007), “Guidelines and Methodologies”, 3rd Edition
United Nation Publication.
International Federation of Accounts (IFAC), “Global Sustainability and Growth
Recommenations for G-20 Leaders”, Summit 2012
Jabar. J, Soosay, C. and Santa, R. (2011), “Organisational learning as an antecedent of
technology transfer and new product development: A study in manufacturing firms in
Malaysia”, Journal of Manufacturing Technology Management, Vol. 22, pp. 25-45.
Jamaluddin, J., Kadaruddin, A., Kadir, A. and Azahan, A. (2009), “Development, Environmental
Degradation and Environmental Management in Malaysia”, European Journal of Social
Sciences, Vol. 9 No. 2, pp. 257-264.
James R. B (2010), “Managing the retail format portfolio: An application of modern portfolio
theory”, Journal of Retailing and Consumer Services, Vol. 17.
Jasch, C. (2003), “The use of Environmental Management Accounting (EMA) for identifying
environmental costs”, Journal of Cleaner Production, Vol. 11 No. 6, pp. 667–676.
Jasch, C. (2006), “Environmental management accounting (EMA) as the next step in the
evolution of management accounting”, Journal of Cleaner Production, Vol. 14, pp. 1190-
1193.
Katsikeas, C. S., Leonidou, C. N. and Zeriti, A. (2016), “Eco-friendly product development
strategy: antecedents, outcomes, and contingent effects”, Journal of the Academy of
Marketing Science, Vol. 44 No. 6, pp. 660-684.
231
The Relationship between Contingent Factors
Kennerley, M. and Neely, A. (2002), “A framework of the factors affecting the evolution of
performance measurement systems”, International Journal of Operations & Production
Management, Vol. 22 No. 11, pp. 1222–1245.
Konar, S. and Cohen, M. A. (2001), “Does the market value environmental performance?”, The
review of economics and statistics, Vol. 83 No. 2, pp. 281-289.
Kotter, J. P. (1996), “Leading Change”, Harvard Business School Press, Boston, MA.
Lam, M. L. L. (2011), “Challenges of sustainable environmental programs of foreign
multinational enterprise in China”, Management Research Review, Vol. 34, pp. 1153-1168.
Lee, K. H. (2011), “Motivations, barriers, and incentives for adopting environmental
management (cost) accounting and related guidelines: a study of the Republic of Korea”,
Corporate Social Responsibility and Environmental Management, Vol. 18 No. 1, pp. 39-49.
Leung, S. O. (2011), “A comparison of psychometric properties and normality in 4-, 5-, 6-, and
11-point Likert scales”, Journal of Social Service Research, Vol. 37 No. 4, pp. 412-421.
Lucas, C. H. and Baroudi, J. (1993), “The Role of Information Technology in Organization
Design”, Center of Digital Economy Research, pp. IS-93-48.
Malaysia Economic Statistics Time Series 2014, Department of Statistics Malaysia.
Malaysia in Focus, Investment booklet 2013, PWC Malaysia, 2012 Pricewaterhouse Coopers.
Mohammad, N. (2011), “Environmental law and policy practices in Malaysia: An empirical
study”, Australian Journal of Basic and Applied Sciences, Vol. 5 No. 9, pp. 1248-1260.
Morse, J. M., Barrett, M., Mayan, M., Olson, K. and Spiers, J. (2002), “Verification strategies for
establishing reliability and validity in qualitative research”, International Journal of
Qualitative Methods, Vol. 1 No. 2.
Ong, T. S. and Teh, B. H. (2008), “Factors influencing the design and use of performance
measurement systems in the Malaysian electrical and electronics industry”, Int J Eco Man’t,
Vol. 2, pp. 437–457.
Otley, D. (2016), “The contingency theory of management accounting and control: 1980–2014”,
Management accounting research, Vol. 31, pp. 45-62.
Otley, D. T. (1980), “The contingency theory of management accounting: Achievement and
prognosis. Accounting”, Organizations and Society, Vol. 5 No. 4, pp. 413-428.
Pondeville, S., Swaen, V. and Ronge, Y. (2013), “Environmental management control system:
The role of contextual and strategic factors”.
Porter, M. (1980), “Competitive Strategy”, The Free Press, New York.
Preacher, K. J. and Hayes, A. F. (2008), “Asymptotic and resampling strategies for assessing and
comparing indirect effects in multiple mediator models”, Behavior research methods, Vol. 40
No. 3, pp. 879-891
Pugh. D. S., Hickson, D. J, Hinings, C. R. and Turner, C. (1976), “The Context of Organization
Structure”, Administrative Sciences Quarterly, Vol. 14, pp. 91-104.
Qian, W., Burritt, R. L. and Monroe, G. (2011), “Environmental management accounting in local
government: a case of waste management”, Account. Audit. Account, Vol. 24, pp. 93e128.
232
International Journal of Economics and Management
Russo, M. V. and Fouts, P. A. (1997), “A Resource-Based Perspective on Corporate
Environmental Performance and Profitability”, Academy of Management Journal, Vol. 40
No. 3, pp. 534–559.
Wiengarten, F., Pagell, M. and Fynes, B. (2013), “ISO 14000 certification and investments in
environmental supply chain management practices: identifying differences in motivation and
adoption levels between Western European and North American companies”, Journal of
Cleaner Production, Vol. 56, pp. 18–28.
Wilmshurst, T. D. and Frost, G. R. (2001), “The role of accounting and the accountant in the
environmental management system”, Bus. Strat. Environ, Vol. 10, pp. 135e147.
Yi, Y. and Gong, T. (2013), “Customer value co-creation behavior: Scale development and
validation”, Journal of Business Research, Vol. 66 No. 9, pp. 127.