The Relationship between Carbon Emissions, Land Use Change ...
76
e University of San Francisco USF Scholarship: a digital repository @ Gleeson Library | Geschke Center Master's Projects and Capstones eses, Dissertations, Capstones and Projects Spring 5-19-2017 e Relationship between Carbon Emissions, Land Use Change and the Oil Palm Industry within Southeast Asia Savanna L. Booth University of San Francisco, [email protected] Follow this and additional works at: hps://repository.usfca.edu/capstone Part of the Natural Resources and Conservation Commons , and the Other Environmental Sciences Commons is Project/Capstone is brought to you for free and open access by the eses, Dissertations, Capstones and Projects at USF Scholarship: a digital repository @ Gleeson Library | Geschke Center. It has been accepted for inclusion in Master's Projects and Capstones by an authorized administrator of USF Scholarship: a digital repository @ Gleeson Library | Geschke Center. For more information, please contact [email protected]. Recommended Citation Booth, Savanna L., "e Relationship between Carbon Emissions, Land Use Change and the Oil Palm Industry within Southeast Asia" (2017). Master's Projects and Capstones. 562. hps://repository.usfca.edu/capstone/562
Transcript of The Relationship between Carbon Emissions, Land Use Change ...

The University of San FranciscoUSF Scholarship: a digital repository @ Gleeson Library |Geschke Center
Master's Projects and Capstones Theses, Dissertations, Capstones and Projects
Spring 5-19-2017
The Relationship between Carbon Emissions,Land Use Change and the Oil Palm Industrywithin Southeast AsiaSavanna L. BoothUniversity of San Francisco, [email protected]
Follow this and additional works at: https://repository.usfca.edu/capstone
Part of the Natural Resources and Conservation Commons, and the Other EnvironmentalSciences Commons
This Project/Capstone is brought to you for free and open access by the Theses, Dissertations, Capstones and Projects at USF Scholarship: a digitalrepository @ Gleeson Library | Geschke Center. It has been accepted for inclusion in Master's Projects and Capstones by an authorized administratorof USF Scholarship: a digital repository @ Gleeson Library | Geschke Center. For more information, please contact [email protected].
Recommended CitationBooth, Savanna L., "The Relationship between Carbon Emissions, Land Use Change and the Oil Palm Industry within Southeast Asia"(2017). Master's Projects and Capstones. 562.https://repository.usfca.edu/capstone/562

1
This Master’s Project
The Relationship between Carbon Emissions, Land Use Change and the Oil
Palm Industry within Southeast Asia
By:
Savanna L. Booth
Is submitted in partial fulfillment of the requirements
for the degree of:
Master of Science
in
Environmental Management
at the
University of San Francisco
Submitted: Received:
Savanna L. Booth May 27, 2017 John Callaway, PhD Date

2
Acknowledgements
Firstly, I would like to acknowledge my graduate advisor, Dr. John Calloway Ph.D. of the
University of San Francisco for his guidance and input during this project, along with his
assistance in helping me develop research on such a complex topic.
Furthermore, I would like to express my gratitude to Dr. Gretchen Coffman, Ph.D. at the
University of San Francisco for introducing me to this topic through her Tropical Restoration
Ecology course in Malaysian Borneo, as well as her ongoing support throughout the course of
this project.
Finally, I would like to acknowledge and thank my colleague James D. Heaster for his assistance
and contributions in the development of the ArcGIS maps used in this paper; and also for his
motivation and friendship over the course of my graduate studies.

3
Table of Contents
TITLE PAGE .................................................................................................................................................................................. 1
ABSTRACT ................................................................................................................................................................. 4
1. INTRODUCTION: ................................................................................................................................................ 5
2. BACKGROUND: ................................................................................................................................................... 9 2.1 ELAEIS GUINEENSIS ........................................................................................................................................................ 9 2.2 GLOBAL DEMAND OF OIL PALM ................................................................................................................................. 10 2.3 OIL PALM INDUSTRY EXPANSION AND DEFORESTATION IN INDONESIA ........................................................... 12
a. Economically driven industry in Indonesia: ..................................................................................................... 13 2.4 OIL PALM INDUSTRY EXPANSION AND DEFORESTATION IN MALAYSIA ............................................................. 15 2.5 DEFORESTATION AND DEGRADATION OF TROPICAL PEATLAND ........................................................................ 18 2.6 FIRE-RELATED CONVERSION ...................................................................................................................................... 19 2.7 PRODUCTION:................................................................................................................................................................ 20
3. METHODS .......................................................................................................................................................... 23
4. EVIDENCE ......................................................................................................................................................... 25 4.1 EMISSIONS AS A RESULT OF CONVERSION PROCESSES ......................................................................................... 25
a. Conversion of forest ........................................................................................................................................................ 25 b. Conversion of tropical peatlands ............................................................................................................................... 28 c. Land use change by fire-related clearing ........................................................................................................... 30
4.2 EMISSION AS A RESULT OF OIL PALM PRODUCTION .............................................................................................. 35 a. Extraction processes: ...................................................................................................................................................... 38
5. DISCUSSION: .................................................................................................................................................... 42 5.1 BROADER IMPACTS RESULTING FROM AN INCREASE IN DEFORESTATION, DEGRADATION AND CARBON
EMISSIONS .............................................................................................................................................................................. 44 a. Impacts of deforestation and forest degradation on surface characteristics: ......................................... 44 b. Impacts of carbon emissions on flora biodiversity: ........................................................................................... 45 c. Impacts of deforestation and degradation on species biodiversity: ............................................................ 46
5.2 RESEARCH LIMITATIONS: ............................................................................................................................................ 49 a. Government based analyses: ................................................................................................................................... 49 b. Definition ambiguity ................................................................................................................................................... 50 c. Emission ambiguity: .................................................................................................................................................... 52 d. Exclusion of aboveground biomass and carbon sequestration potential within literature: ......... 53
5.3 EFFORTS TO REDUCE EMISSIONS: ............................................................................................................................. 55 a. Malaysia: ......................................................................................................................................................................... 56 b. Indonesia: ........................................................................................................................................................................ 58
6. RECOMMENDATIONS .................................................................................................................................... 59
7. CONCLUSIONS ................................................................................................................................................. 63
4
Abstract
Tropical forests store the largest amount of carbon globally by sequestering up to 2.7 Gt
of carbon every year in soils and vegetation. Deforestation and the conversion of tropical
peatland soil have contributed to global anthropogenic carbon dioxide emissions, as well as
significantly hindering tropical ecosystems and the natural carbon sequestration potential that
could potentially help mitigate atmospheric CO2 levels. Deforestation has increased rapidly since
the 1970’s across Southeast Asia with oil palm contributing to 61% of deforestation between
2010 and 2015 with emissions reaching 22.1 million tons CO2-eq during that time. The
conversions of tropical peatlands are a significant source of regional carbon emissions since the
transformation of these soils both degrades carbon storage capacity, and increases emissions
during the conversion process. Conversion processes for monoculture lead to long-term
degradation and over the last four decades, emissions from tropical peatland modification has
reached over 6 Gt CO2-eq. Land use change by fire, although a method of deforestation, emits
the highest levels of CO2-eq during conversion. The conversion by fire also leads to an increased
risk of wildfires within the area. As fire continues to be used as a method of land clearing,
emissions and wildfires are expected to increase. There are two methods of oil palm extraction
and production, wet and dry, and emissions from these processes average 3.03 and 1.69 tons
CO2-eq/ha respectively. The wastewater treatment system implemented for wet extraction could
either aid in decreasing or result in increased production emissions. A transition in production
processes could decrease emissions by up to 47%.
The evidence from the analysis was used to develop recommendations for carbon
emission mitigation and land use change that results from the oil palm industry within Southeast
Asia. These recommendations can be summarized into: discontinuing oil palm expansion on
unsuitable land, promoting the movement towards sustainable oil palm production through
sustainability certification processes as well as discontinuing fire related conversion processes,
and already established plantations should transition from wet to dry extraction processes to
reduce overall emissions; however, if this is not economically feasible, the implementation of a
biogas capture system would aid in emission reduction.

5
1. Introduction:
Oil from tropical oil palm plantations is one of the most widely used agricultural products
in the world (Carlson et al. 2012; Hamdan et al. 2016), and is only grown in tropical regions
globally. There is consensus across literature that this agricultural product fuels large sectors of
economies in countries where it is cultivated and is of vital import to the stability of these
nations. While this crop provides much needed income, it is unfortunately causing considerable
environmental damage in the tropical ecosystems where it is grown due to land use practices that
are necessary to make areas suitable for this type of agricultural monoculture. Oil palm
agriculture is responsible for the loss of some the most species rich areas of the globe, and
continued unsustainable practices are threatening these sensitive and fragile ecosystems with
potential collapse.
Tropical forests provide a variety of ecosystem services across biome scales, such as
providing habitat for areas with high species diversity, supporting the nutrient cycling and
formation of soil, and climate mitigation through carbon sequestration. Southeast Asia contains
four of the 25 global biodiversity hotspots, and is home to approximately 4,295 species of
mammals and birds, and 56,120 species of plants (Sodhi et al. 2004). The large forest structures
and canopy levels provide habitats for species with specialized niches, such as the Proboscis
Monkey (Nasalis larvatus) and the Rhinoceros Hornbill (Buceros rhinoceros)1. The trees also
maintain soil structure in these highly precipitated areas through their extensive root structures.
The organic material assists in cycling nutrients for the surrounding flora. Additionally, forests
within tropical ecosystems hold the largest amount of carbon globally and store approximately
2.2 to 2.7 Gt of carbon per year (Goodman and Herold 2014). Tropical peatland forests
specifically are estimated to store ten times more carbon than tropical forests on mineral soil
(Page et al. 2011). The absorption of carbon by forests and tropical peatlands has the potential to
mitigate and sequester atmospheric CO2-eq concentrations.
Unfortunately, these ecosystem services are at risk due to increasing carbon emission
levels. Tropical forests have been exploited at alarming rates, resulting in an unprecedented
increase in CO2-eq emissions that ultimately hinders the natural carbon cycle and contributing to
global climate change. Deforestation across tropical ecosystems has been considered the second
1 Personal observation based on research conducted for Dr. Gretchen Coffman’s Tropical Restoration Ecology course on the island of Borneo, summer of 2016.

6
largest source of anthropogenic emissions globally, with the potential to create permanent
climatic shifts (Cruz et al. 2007; Hamdan et al. 2016). When large scales of land are deforested
or burned, there is an instant transition from carbon sink to carbon source and CO2 is emitted into
the atmosphere at a much more accelerated rate than what would occur naturally.
The oil palm industry has contributed significantly to these rising emission levels and
deforestation rates, especially within Southeast Asia as 90% of global oil palm production is
located within Indonesia and Malaysia, and 40% of these plantations replaced forests, some of
which contain critical species, such as dipterocarp trees (Englund et al. 2015). Dipterocarps are
the tallest tropical trees across the globe, and play a vital role in tropical ecosystems by providing
canopy layers and promoting habitat biodiversity. However, in Indonesia, approximately 80% of
lowland dipterocarp forests have been cleared and converted specifically for oil palm cultivation
(Santilli et al. 2005). Coastal and low lying inland regions are ideal locations for oil palm
cultivation and subsequent deforestation that ultimately degrades the island landscapes across
Southeast Asia (Figure 1-1). Emission levels have increased with land use change within forests
and tropical peatland, and have further increased with the use of fire to clear land for oil palm
monoculture (Carlson et al. 2012; Warren et al. 2016). Tropical peatlands have been a major
factor to these emission levels compared to other forest structures as they release larger
quantities of CO2-eq following draining, burning, and other conversion processes.
The precise recovery rate of tropical ecosystems following deforestation and degradation
is uncertain within the scientific community, which aids in the seriousness of this issue and
supporting the need for greater industrial sustainability practices. Literature suggests that tropical
forests could either collapse completely or transition to an alternative stable state after a certain
level of disturbance has been reached, permanently altering ecosystem services and biodiversity
(Poorter et al. 2016). Given the increase in demand of oil palm and land for plantations, it can be
expected that there will be an increase in deforestation, tropical peatland degradation and fire-
related conversion, which will result in higher carbon emissions and continue to negatively
impact tropical ecosystems unless mitigation procedures are implemented. Given the invasive
nature of oil palm cultivation on tropical ecosystems, the goal of this paper is to evaluate how the
oil palm industry has affected the ecosystem in regards to deforestation and tropical peatland
degradation, and the increase in carbon emissions as a result. The primary research question for
this analysis was:

7
What are the impacts on carbon emissions from oil palm related land conversion and production
within Southeast Asia?
To further evaluate this question, the following sub-questions were developed for a more concise
synthesis of data:
1. What are the carbon emissions from the processes of the deforestation and/or alteration of
intact, logged, and agro-forests?
2. When analyzed as a separate entity, what are the carbon emissions from tropical peatland
conversion, specifically within peatland soils?
3. Analyzed separately from deforestation, how have fire-related conversion processes
contributed to increasing carbon emission levels?
4. What are the carbon emissions from the production processes of oil palm?

8
Figure 1-1: Current land use within Malaysian and Indonesian Borneo as of 2015. Considerable land use is
dedicated to oil palm and timber harvesting at the expense of forests and tropical peatlands (Data from CIFOR,
map document created by J. D. Heaster 2017).

9
2. Background:
2.1 Elaeis guineensis
Oil palm is one of the worlds most consumed vegetable oils, accounting for nearly 30%
of the world’s vegetable oil demand (Corley 2009). It is grown and harvested in large quantities
for the production of a low-cost vegetable oil that is used in a variety of food, cosmetic and
household products. Oil palm is native to West Africa, although the production of it as a
plantation crop originated in Southeast Asia. There are two main species of oil palm, Elaeis
guineensis (African oil palm) and Elaeis melanococca (American oil palm) (Hai 2002). Elaeis
guineensis is the main crop used for oil production as Elaeis melanococca has lower oil
extraction rates. For the purposes of this paper, the analysis was focused around the planting and
production of Elaeis guineensis.
The oil palm tree is monoecious and typically
grows between 20 – 30 meters tall with a root system that
reaches up to 1 meter deep (Pasiecznik 2013). Elaeis
guineensis thrives in areas with high-precipitation, low
elevation and an adequate amount of soil moisture. As the
trees are a non-competitive species and are usually found
in areas where other tree species do not grow well, or
areas that are not dominated by dense forests, it is strictly
found within tropical forest ecosystems within 10° north
or south of the equator (Pasiecznik 2013). Oil palm
plantations are typically established in low elevation
areas because the crop cannot be planted on slopes
greater than 25°, and elevation must be below 500 meters
for best growth potential of fruitlets (Verheye 2010);
these criteria make floodplains and tropical peatlands a
target for oil palm production sites. However, most of these areas are prone to flooding and
although oil palm is tolerant of fluctuating water tables and short periods of standing water it is a
flood intolerant crop, resulting in high palm mortality (Pasiecznik 2013; Abram, et al 2014).
Figure 2-1: Physical structure of oil palm fruit (Hai 2002).

10
The fruit from the palm tree is condensed in bunches. Each palm bears 8 – 12 bunches
with 1,000 to 1,300 fruitlets per bunch (Hai 2002; Verheye 2010; Pasiecznik 2013). These
fruitlets have a mesocarp layer and an endocarp layer (Figure 2-1; Hai 2002). The mesocarp is a
fibrous layer of pulp, and the endocarp layer contains the oil palm kernel. Two types of oil are
produced from the oil palm plant: oil from the mesocarp of the fruit and oil palm kernel. Due to
the different oil produced from the plant parts, there is a preference on which subspecies of E.
guineensis will be cultivated for harvesting. This preference is a constituent of the oil extraction
rate (OER) of the oil palm mesocarp and kernel. There are three subspecies of E. guineensis that
are cultivated for oil palm production: subsp. dura, pisifera, and tenera (Verheye 2010). Each
subspecies has a variance for extraction dependent on plant morphology. Elaeis guineensis
subsp. dura possesses a larger kernel size (2 – 8 mm) and is therefore typically used via means of
kernel extraction (Hai 2002). In contrast, E. guineensis subsp. pisifera possesses a greater
percentage of mesocarp to kernel ratio (95%) and is therefore used via means of mesocarp
extraction (Hai 2002). Compared to the other subspecies, E. guineensis subsp. tenera has the
highest level of oil extraction with 60 – 95% of mesocarp content and thick kernels (05. – 3 mm)
(Latiff 2000; Hai 2002).
The chemical characteristics of oil palm have contributed to the rise in consumer demand.
Due to an increase in health trends to replace animal based products with alternatives, the
demand for vegetable based oils with less trans-fat has been increasing more than 5% annually
(Shibao 2015). The lower levels of saturated fatty acids make oil palm a more stable product, and
therefore less likely to change chemical properties at high temperatures (Hai 2002). Elaeis
melanococca is not typically cultivated for production due to the lower oil extraction rate
compared to E. guineensis, as well as having higher levels of unsaturated fatty acids (Hai 2002).
Oil from the palm kernel can also be produced in large quantities; however, it mainly contains
saturated fatty acids, making it less desirable for the consumer market (Fitzerbert et al. 2008).
2.2 Global demand of oil palm
Inexpensive production and labor has also been a leading contributor to the rapid growth
of the oil palm industry, especially within Southeast Asia. Oil palm is considered a production-
efficient crop, yielding 11 times more oil per hectare (ha) than soybeans (Figure 2-2; Shibao
2015; Indonesian Investments 2016). In 2015, the global production of soybean oil was 47

11
million tons compared to the 52 million tons of oil palm produced in 2014 from Indonesia and
Malaysia alone (Indonesian Investments 2016; Mylo Trade 2016). In response to the high
demand of oil palm, approximately 9.97 Mha of cultivated cropland around the world was
dominated by oil palm agriculture in 2000, and by 2012 it was over 17.1 Mha (Abram et al.
2014). Corley (2009) analyzed the predicted global population trends along with the current
global demand for oil palm and hypothesized that the demand for oil palm will increase faster
than the industry can supply. Based on the consumption of oil palm per capita and current global
consumption rates, it is estimated that demand will increase by 240 Mt of oil palm by 2050,
which is equivalent to double the current amount of production (Corley 2009). Global demand at
that rate would require between 38.2 and 53 Mha of additional land for cultivation and
production by 2050 based on per capita consumption (Corley 2009).
Figure 2-2: The production yield of vegetable oil from large-scale agriculture. The graph displays the average oil
produced per hectare in tons annually from 2004 – 2006 across all agriculture sectors (Tan et al. 2009).
The rise in global demand has led to an increase in land use modification for oil palm
monoculture, specifically deforestation, tropical peatland soil degradation, and fire-related
conversion processes. Due to the specificity of oil palm habitat, monoculture is limited by
geographic area. Most oil palm plantations are located in Southeast Asia, South America, and
Africa because of the tropical climate required for maximum yielding potential of the crop. The
rate of deforestation and tropical peatland degradation has continued to increase, which has
significantly contributed to the rising carbon emission levels in these areas.

12
2.3 Oil palm industry expansion and deforestation in Indonesia
Oil palm is Indonesia’s third most valuable export, behind coal and petroleum gas and, as
a result, experiences the world's highest deforestation rate (Abood et al. 2015). Indonesia has a
longstanding history with the oil palm industry, much of which has been closely related to the
country’s politics. The first oil palm plantation was established in 1911 and covered a total of
5,123 hectares of land in Aceh and Deli, North Sumatra (Shibao 2015). By 1923, production had
become highly successful and the demand for crude oil palm in Europe was on the rise; that year
Indonesia exported 850 tons of oil palm to various European countries (Shibao 2015). The global
price of oil began to decline during the early 1980’s while the economic growth of Indonesia
initially slowed. However, political instability caused a deregulation of foreign exchanges, which
proved to be economically beneficial for the oil palm industry due to an increase in exports
(Tsujino et al. 2016). Indonesia’s export of oil palm began to rise again and as expected,
deforestation and degradation rates also increased. The estimated annual deforestation rate for
Indonesia doubled from 0.3 Mha per year in the 1970’s to 0.6 Mha annually during the 1980’s
(Table 2-1; Tsujino et al. 2016). By the 1990’s, the demand for oil palm was high enough that
the expansion of oil palm plantations rapidly increased to approximately 2 Mha of land
deforested annually in Indonesia, all while the country was still economically unstable (Tsujino
2016).
Deforestation as a result of oil palm expansion in Indonesia progressed at alarming rates
from 1980 until 2000 (Figure 2-3). However, studies have shown that in more recent years,
deforestation rates have not been as drastic. From 2000 to 2010, deforestation decreased to 0.82
Mha of loss per year, however, these losses still accounted for approximately 56% of total forest
loss in Southeast Asia (Abood et al. 2015). The rate of deforestation continued to decrease in the
following years. Data from the Ministry of Forestry reports that within a two-year span, from
2009 to 2011, Indonesia experienced a loss of 1.24 Mha of forest (Greenpeace 2013).
Records at the Civil Society Coalition for Fair and Sustainable Spatial Planning
department show that 326 oil palm plantations currently own approximately 4.8 Mha of West
Kalimantan, Indonesia, equivalent to the three times the size of the state of Texas (Shibao 2015).
It is estimated that this number will increase to 13 Mha of oil palm monoculture by 2020 (Shibao
2015). Based on the leases already allocated for future oil palm plantations in Kalimantan,

13
Indonesia, Carlson et al. (2012) predicts another 9.3 Mha of forest will be cleared for cultivation,
including an additional 41% of intact forest, 21% logged forest, and 27% agro-forest.
Figure 2-3: Trends of deforested land for oil palm cultivation across Indonesia, by year and measured in hectares.
While data is usually measured in Mha, showing the deforestation in hectares, as above, gives a better
understanding of the drastic increase in overall deforestation trends.
a. Economically driven industry in Indonesia:
Over the past six decades, Southeast Asia has experienced times of economic turmoil and
has used oil palm monoculture to help counteract the decline in the economy. It is evident from
the literature analysis that the rapid growth of the oil palm industry was largely economically
driven, especially within Indonesia. During the 1960’s Indonesia was undergoing the fall of their
president, their revenue from exporting goods was diminishing, and industrial plantations were
operating at their lowest production rates. By 1966 Indonesia was within a major economic crisis
with inflation levels reaching over 700% (Tsujino et al. 2016). At this time of heightened
corruption, illegal logging and industrial practices occurred with little regulation enforced.
Political officials and oil palm industry representatives financially benefitted from the

14
commercial exploitation and exportation of forest resources, including 1,000 ha of roundwood
lumber to Japan, decreasing national forest cover from 162.3 Mha of land to 119.7 Mha by 1985
(Tsujino et al. 2016).
Indonesia underwent economic reform and deregulation in the 1980’s. Former laws that
restricted foreign exchanges were changed to incorporate a freer flow of capital that resulted in
national economic growth. In the late 1980’s the New Order Government started allocating
reserved forest for industry representatives to further the “enterprise-driven deforestation” for
their economic benefit (Abood et al. 2015, 58). The Indonesian economy grew at an annual rate
of 8% GDP from 1989 until 1997, with forest logging concessions being the largest driver
(Tsujino et al. 2016).
The expansion of job availability in the oil palm sector attracted immigrant families to
relocate. This resulted in a dramatic increase in population densities, and in turn induced pressure
on the clearing of forests for urban development and oil palm monoculture. Population census
data estimates that from 1950 to 1979, there was an average of 6,570 families immigrating to
Kalimantan, Indonesia; and that average rose to 73,200 families annually from 1980 to 1984
(Tsujino et al. 2016). Researchers conclude that the influx of immigrants is responsible for a
large part of deforestation in Indonesia (Sunderlin and Resosudarmo 1996; Tsujino et al. 2016).
Political figures in Indonesia saw forests as a valuable but unnecessary resource. The
conversion of forest to oil palm plantations was seen as an easy source of financial gain. There
was little concern for the resulting carbon emissions or environmental degradation from the oil
palm industry until recent years. Indonesia, in particular, has faced challenges to reduce their
deforestation rates and carbon emissions. The Asian Financial Crisis of 1997 caused the
Indonesian government to initiate reform and transition to a new administration. After the fall of
the New Order Government in 2001, the local level authorities gained the power to allocate
forested land for agricultural production (Tsujino et al. 2016). It was not until the Yudhyono
government took office that there was a move away from an economically driven industry and a
turn towards progressive movements to decrease deforestation and mitigate carbon emissions
came into effect in Indonesia.

15
2.4 Oil palm industry expansion and deforestation in Malaysia
There is minimal data available on the expansion of the oil palm industry in Malaysia
prior to 1960. The commercial production of crude oil palm did not begin in Malaysia until 1970
when the government transitioned their economic focus away from rubber. Hai (2002) reported
that the geographical distribution of oil palm plantations increased 478% from 0.05 Mha in 1960
to 0.26 Mha in 1970, and continued to increase dramatically following the commercialization of
the industry (Figure 2-4). By 2000, oil palm crops covered 3.37 Mha of land compared to 0.26
Mha in 1970 (Hai 2002), and by 2005 plantations covered 4.2 Mha (Fitzerbert et al. 2008). As
seen in the data on Indonesia, deforestation in Malaysia decreased slightly during the turn of the
century. According to the Malaysian Palm Oil Board, in 2013 Malaysia’s oil palm plantations
5.2 Mha of oil palm plantations that occupied 15.7% of total land area (Yamada et al. 2016).
During this period of expansion, 55 – 59% of Malaysia’s oil palm industry had replaced old
growth and secondary growth forests (Abram et al. 2014). The largest oil palm contributor in
Malaysia is the state of Sabah, producing approximately 28.6% of the country’s total oil palm
product (Abram et al. 2014). By 2011, 1.43 Mha of Sabah’s tropical ecosystems were dominated
by oil palm plantations, with expansions projected to increase another 2.1 Mha by 2025 (Abram
et al. 2014). Comparatively, Hamdan et al. (2016) estimated that oil palm plantations contributed
to 61% of the deforestation that occurred between 2010 and 2015.
As a result of the rapid expansion of the industry, oil palm plantations have been
cultivating floodplains with higher ground saturation for monoculture. Consequently, the crops
cultivated on these floodplains experience palm mortality from root rotting and low oxygen from
saline water. Using a Classification and Regression Tree (CART) analysis, Abram et al. (2014)
examined oil palm dominated lands within the Lower Kinabatangan region of Sabah, Malaysian
Borneo that are unsuitable for oil palm monoculture, but have still been converted for
production. Abram et al. (2014) concluded that 51,466 hectares of oil palm dominated land is
currently under-producing because of unsuitable soil conditions. The expansion of oil palm
monoculture will prove to be difficult in Sabah as an estimated 66% of the 30,173 ha of
undeveloped forest is unsuitable for oil palm production (Abram et al. 2014). However, 59% of
these lands have already been reserved for oil palm conversion, and 11% were under land
applications for future conversion (Abram et al. 2014). The research concluded that plantations
are not abiding by the necessary requirements of the oil palm for maximum yield when planting.

16
Further expansion of the oil palm industry in these areas will depend on further research of land
suitability.
Figure 2-4: Trends of deforested land for oil palm cultivation across Malaysia, by year and measured in hectares.
While data is usually measured in Mha, showing the deforestation in hectares, as above, gives a better
understanding of the drastic increase in overall deforestation trends.

17
Figure 2-5: An island-wide documentation of Borneo shows the impact of selective logging fire and conversion to
palm oil plantations since the 1970's (Data from CIFOR, map document created by J. D. Heaster 2017).
18
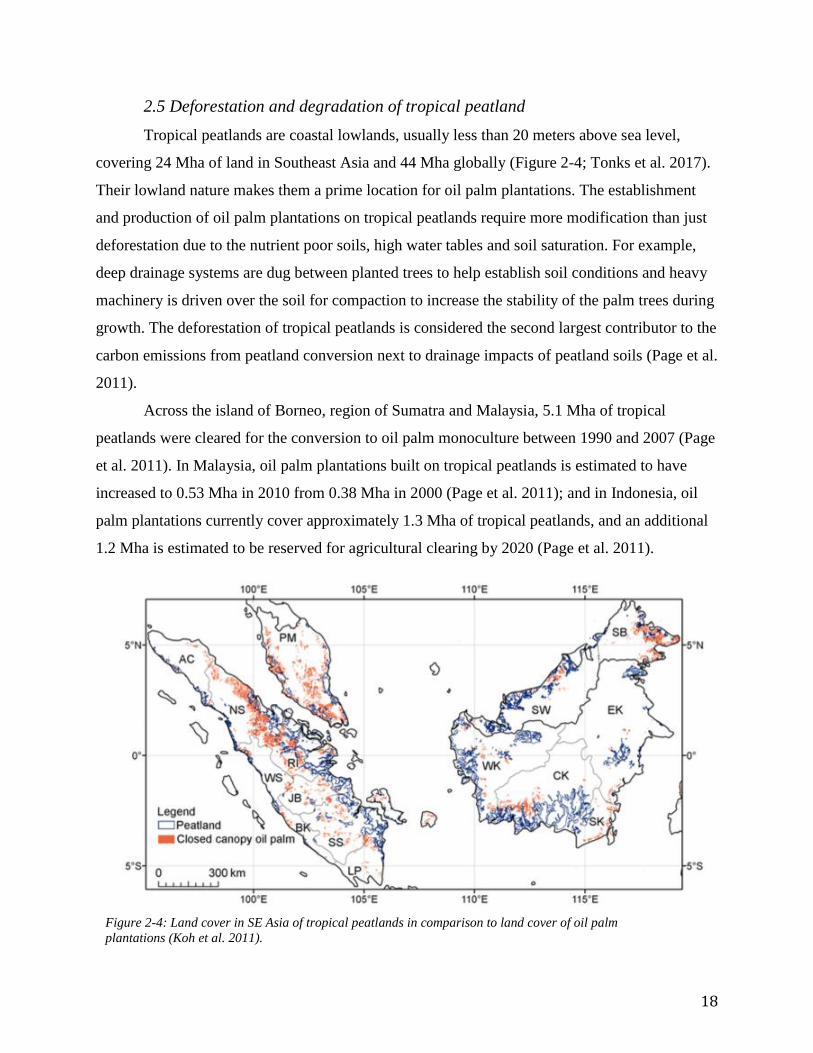
2.5 Deforestation and degradation of tropical peatland
Tropical peatlands are coastal lowlands, usually less than 20 meters above sea level,
covering 24 Mha of land in Southeast Asia and 44 Mha globally (Figure 2-4; Tonks et al. 2017).
Their lowland nature makes them a prime location for oil palm plantations. The establishment
and production of oil palm plantations on tropical peatlands require more modification than just
deforestation due to the nutrient poor soils, high water tables and soil saturation. For example,
deep drainage systems are dug between planted trees to help establish soil conditions and heavy
machinery is driven over the soil for compaction to increase the stability of the palm trees during
growth. The deforestation of tropical peatlands is considered the second largest contributor to the
carbon emissions from peatland conversion next to drainage impacts of peatland soils (Page et al.
2011).
Across the island of Borneo, region of Sumatra and Malaysia, 5.1 Mha of tropical
peatlands were cleared for the conversion to oil palm monoculture between 1990 and 2007 (Page
et al. 2011). In Malaysia, oil palm plantations built on tropical peatlands is estimated to have
increased to 0.53 Mha in 2010 from 0.38 Mha in 2000 (Page et al. 2011); and in Indonesia, oil
palm plantations currently cover approximately 1.3 Mha of tropical peatlands, and an additional
1.2 Mha is estimated to be reserved for agricultural clearing by 2020 (Page et al. 2011).
Figure 2-4: Land cover in SE Asia of tropical peatlands in comparison to land cover of oil palm
plantations (Koh et al. 2011).

19
A study conducted by Tonks et al. (2017) on the chemical and physical changes that
result from the conversion of tropical peatland soil for oil palm monoculture found that the
conversion process leads to long-term intense stages of degradation, and researchers question if it
is possible to mediate these damages. After draining the peatland soil to acquire threshold
moisture levels for planted oil palm, the water table is lowered and water-holding capacity is
altered, this can result in the physical collapse of the soil structure and an increase in the risk of
fire because of carbon levels in the soil (Tonks et al. 2017). Clearing the natural vegetation in the
peatlands also removes organic matter needed for the physical stability of peatlands. Natural
peatlands have an estimated 934 tons CO2-eq/ha stored in biomass compared to oil palm
plantations having 88.8 tons CO2-eq/ha (Page et al. 2011). The combination of altered water
tables, anthropogenic modifications during the conversion process, and the overall deforestation
contributes significantly to the increase in carbon emissions. Tonks et al. (2017) outlined in their
research the limitation on published data in relation to the deforestation of tropical peatlands and
the negative effects of oil palm conversion processes. These research limitations are further
discussed in 5.2.
2.6 Fire-related conversion
The conversion processes from forest and tropical peatland to oil palm monoculture
include enacting fire-related techniques to clear vegetation and forest structure. Controlled
burning has contributed significantly to carbon emissions related to the oil palm industry and the
long-term degradation of tropical forests and peatlands. After the initial burning for clearing, the
area is at an increased risk of burn cycles that will result in wildfires and the transition of
forested land to degraded scrubland, such as the fire events following the El Niño droughts of
1983 (Gavaeu et al. 2016). Between 1997 and 2007, more than 72,000 fires were recorded in
Raiu, Indonesia via satellite imagery, and 12% of areas had burned more than once (Uryu, et al.
2008). When fires occur that are not associated with land-use change or an agricultural
conversion process, it is categorized as degradation (Pearson et al. 2017). The reoccurrence of
fires interfere with natural regeneration and prevent tropical forests from recovering after fire
events. Because of the increase of fire occurrences, carbon emission rates are expected to
increase in the future as a result.
20
Fire clearing techniques have initiated other fire events, such as the Indonesian Haze
Crisis. In June 2013, Indonesia experienced a fire event that resulted in a haze pollution
spreading across Southeast Asia. The fires began on the island of Sumatra, and although the
direct cause and nature of the fires is debated, The World Resources Institute (2013) reported
that half of the fires occurred on timber and oil palm plantations. A satellite analysis on the Riau
Province found that, out of 0.14 Mha of land that was burned, most of the fires were in areas of
recently deforested tropical peatland, further suggesting the fires are a result of land clearing for
new agriculture plantations (Greenpeace 2013). The haze from the fires caused an international
crisis as airports in Indonesia had to temporarily close and the air quality in Singapore dropped to
the worst levels ever recorded (Sizer et al. 2014). The following year in April, fires began again
on Sumatra and at an increased rate compared to 2013. Data from the Global Forest Watch on
tree cover change as a result of the fires reported that the clearing of forests for agriculture was
the greatest primary influence of the fires (Sizer et al. 2014). Since then, Sumatra has had large-
scale annual fire events affecting neighboring countries such as Malaysia and Singapore, while
also spreading as far as Southern Thailand. The Global Fire Emissions Database estimated that
the CO2-eq emissions from these fires exceed the daily average emitted by the United States
(Schecter and Wright 2015).
2.7 Production:
In addition to land use modifications, and the resulting increase in carbon emissions, the
production process of oil palm monoculture also contributes to increased carbon emissions
through its complex system (Figure 2-5). The production cycle continues the deforestation and
degradation of land, as one set of oil palm crop only lasts 25 years. After 25 years, the palm tree
becomes too tall for harvesting and the plantation clears their crop and begins another cycle (Hai
2002; Page et al. 2011). Harvesting begins 24 – 30 months after planting and lasts until the
plantations initiate the next production cycle (Hai 2002). Different extraction processes of oil
from fresh fruit bunches (FFB) have been found to emit different levels of CO2-eq. There are two
processes of extracting oil palm from the FFB, wet and dry extraction (Poku 2002;
Klaarenbeeksingel 2009; Kaewmai et al. 2012; Bunchai et al 2016). More studies have been
conducted on the wet extraction process, as it results in larger carbon emissions and more
negative effects than the dry extraction process due to wastewater treatment. Prior to Bunchai et

21
al. (2016) there were no studies published that analyzed the emissions from the dry extraction
process although it is considered to be more efficient than wet extraction. Most studies do not
analyze the emissions from packaging and distribution, but rather, emissions from cradle-to-gate.
Cradle-to-gate is defined as emissions from the time of extraction to when the oil is ready for
transportation. Wet and dry extractions have different emission factors involved, as they are
implemented differently. However, between both extraction processes, the common emission
factors are the utilities used during the extraction process, the transportation of products to
specific mills, and the processing of the oil palm plant (Kaewmai et al. 2012; Kusin et al 2016).
There is a preference for the dry extraction process of oil palm production because it can
process more FFB than wet extraction and has less environmental impacts (Poku 2002). The
purpose of the dry extraction process is to mechanically press the oil from the fruit bunches.
Most large-scale oil palm plantations adopt the ‘dry’ method of oil extraction because of the
larger volume of oil that can be extracted (Poku 2002). In the primary production stage the fresh
fruit bunches (FFB) are harvested from the palm trees and the palm fruit is transported to the oil
palm mill. The palm fruit is processed in a series of chambers for cleaning and drying. The
drying chamber is heated to 100° C with firewood (Poku 2002). After the fruit has been cleaned
and dried, it is taken through the dry extraction mill and processed through a screw press where
the oil is extracted (Poku 2002). The screw press is a common tool used for the extraction of
food material processing and oil extraction (Poku 2002; Azizi et al. 2015). Screw presses are
able to break open fruit cells and release more oil than wet extraction from the pressure exerted
on the fruit bunches. Although, it is expected to extract the maximum amount of oil palm from
the fruit bunches, the screw press is prone to malfunction frequently making it a less sustainable
tool for processing oil palm (Azizi et al. 2015). The products of the dry extraction process are
mixed oil palm (MOP) and palm kernel cake (PKC). Mixed oil palm is the main product, and is
the oil that is most widely used in household merchandise and biodiesel. After extraction, MOP
undergoes a filtration process that separates crude oil palm (CPO) and the kernel oil so the MOP
can be collected and distributed to the oil palm refineries. PKC is typically used as animal feed
for cattle, however, other PKC extraction procedures are possible to create oil from the
byproduct (Hosseini and Wahid 2013). The analysis of the extraction and production of CPO is
more common since it is the more widely exported oil than PKC. Therefore, for the purposes of
this paper, the emissions based on the production of CPO will be analyzed rather than PKC.

22
The term “wet extraction” comes from the use of hot water to leach the oil from the FFB
(Poku 2002). The production process of wet extraction can be summarized into the sterilizing,
stripping, separating the FFB, digestion and pressing, oil extraction and purification of the oil
(Hosseini and Wahid 2015). During wet extraction, FFB are processed whole in large amounts of
water to extract the oil, however, the fruit and mesocarp are processed separately. The water
allows the heavy materials from the fruit bunch to separate from the oil. The “stripped” empty
fruit bunches are taken to another mill to be processed for mulch, while the fruit are transported
to be pressed for oil (Fitzerbert et al. 2008). The high temperature of water and steam weakens
the fruit bunches and allows the fruit to be removed more easily.
Figure 2-5: The overall oil palm extraction and production processes, including wet and dry extraction (Kaewmai et
al. 2012).
The process of extracting the oil is the largest contributor to wastewater. The wastewater
produced during the production process is typically referred to as palm oil mill effluent (POME).
Emissions from palm oil mill effluent can contribute to more than 90% of overall emissions
during this process (Hosseini and Wahid 2015). Approximately 0.5 - 0.75 tons of POME are
produced for every ton of FFB that is processed (Reijnders and Huijbregts 2008). Following oil

23
extraction the wastewater is transferred into a ponding system for treatment. Oil palm plantations
typically use stabilization ponds or open tank systems to treat the wastewater that results from
the production process. Ponding systems are the most common methods of wastewater treatment
because of the low cost due to minimal utilities needed. The ponding system used, and whether it
is a closed system or not, greatly affects the amount of emissions. Following treatment, the
wastewater is usually discharged back into the oil palm fields to water to crops.
3. Methods
My methodology for deriving an answer to my primary research question was a literature
review and synthesis with some minor support for my evidence utilizing ArcGIS® technology.
For the purposes of this study, the research focused on carbon emissions resulting from the
conversion and production of oil palm monoculture within Southeast Asia. The goal of the
research was to analyze the carbon emissions that result from oil palm cultivation, land
conversion, extraction processes (both wet and dry), and the impacts these processes have had on
tropical ecosystem carbon emissions. Carbon emissions and CO2-equivalent data were analyzed
from a variety of literature sources, and it is noteworthy that there is a lack of consensus on
emissions data, especially within conversion factors.
To properly examine the relationship between the variables of land use change, oil
production and transport, land conversion, and regional carbon emissions, I used a comparative
analysis to elucidate how these different factors increase CO2 outputs related to this industry.
Additionally, the comparative analysis that I used assists in informing policy practices within the
industry, and my professional recommendations to increase the sustainability of this industry. To
further quantify and clarify how land use changes or practice affect regional carbon emissions I
looked at the industry practices within Southeast Asia, specifically Malaysia and Indonesia.
Literature regarding land clearing, land use changes, and production methodologies provided
supporting data to strengthen my analysis of the primary region of study in Malaysia and
Indonesia, and particularly, the island of Borneo.
Literature review is the primary source of data that was used to provide evidentiary
answers for these questions. Through extensive research I was able to accumulate enough peer-
reviewed documentation to provide answers to my sub-questions. To further support my
24
conclusions, minor use of geospatial technology was included to provide spatial reference for
factors such as fire, logging, and plantation conversion. Government literature is available to
support my findings; however, this literature should be considered somewhat suspect due to
rampant government corruption and overt influence that economic interests wield on government
reporting to the international community.
For studying carbon emissions resulting from oil palm monoculture, two major categories
were analyzed: land use change and oil palm production. For the scope of land use, there were
three subcategories: conversion of forest (defined as intact, logged, and agro-forests), conversion
of tropical peatlands, and land use modification by method of fire (commonly referred to as
“slash and burn”). Tropical peatlands were investigated separately to display the significant
contribution to CO2-eq emissions rates unique to these ecosystems from soil composition. Land
use change by fire was also analyzed separately due to its significant contribution to overall
emissions. Although fire is a method of deforestation, there is discrepancy amongst data and
literature on how fire related emissions should be categorized; therefore the emissions strictly
from fire were analyzed as a separate parameter. When considered separately, these categories
aid in provided a more accurate estimation of potential carbon emissions from the processes
within the region, and further providing information to support the need for changes in industry
practices to favor increased sustainability.
Emissions from these parameters were measured in carbon dioxide equivalent (CO2-eq),
CO2-eq per hectare and CO2-eq per ton of oil produced. As means of accurate comparison, the
conversion of carbon (C) to CO2-equivalent was calculated. The unit of “carbon dioxide
equivalent emissions per ton of oil produced” was used to analyze production emissions while
the unit “carbon dioxide equivalent emissions per hectare” was used to analyze emissions related
to land use change, and the changes in carbon stocks (Klaarenbeeksingel 2009). It is important to
understand the distinction between these two methods as the quantity listed on a per hectare basis
implies a spatial attribute, while the carbon emissions per ton of oil produced is strictly a unit of
production emissions with no direct spatial component. This is critical because emissions from
land clearing and cultivation are somewhat more difficult to mitigate, while emissions from the
production process of the actual oil can be more readily addressed through process and
engineering control modifications.

25
Within the category of production, there were two extraction processes that were
analyzed: the wet and dry extraction processes. Data was gathered via peer-reviewed and
academic literature for comparative analysis to analyze the carbon emissions resulting from both
processes. This analysis focused on the emissions from cradle to gate (emissions from the time of
extraction to when the oil is ready for distribution). Other sources of emissions have been
documented, such as packaging and distribution, however, they reside outside the scope of this
study and were not incorporated in the analysis due to lack of pertinence. Although other
greenhouse gas emissions, such as N2O and CH4, play an important role in understanding the
extent of impacts created by the oil palm industry in tropical ecosystems, this paper focuses
strictly on carbon equivalent emissions. Evidence supporting my conclusions regarding land use
changes influence on regional carbon emissions are delineated in the following Section 4:
Evidence.
4. Evidence
4.1 Emissions as a result of conversion processes
a. Conversion of forest
Deforestation within tropical ecosystems is the second largest source of anthropogenic
greenhouse gas emissions (Hamdan et al. 2016). There is a consensus among the literature that
the conversion of forest to oil palm monoculture has had larger effects on carbon emissions than
other agriculture industries due to the loss of biomass that is associated with industry expansion,
and therefore deforestation should be analyzed separately from tropical peatland degradation.
The rate of CO2-eq emissions varies based on the type of forest that is converted for oil palm.
The three forest types discussed among researchers were intact, logged (also called secondary
growth forests), and agro-forests. Intact forests are defined as pristine old-growth forest with
little or no signs of anthropogenic influence (Koh et al. 2011). Logged forests are old-growth
forest that have lost their original structure, and have gone through a previous industrial-related
conversion but have recovered (either naturally or through restoration efforts) much of their
original biodiversity and structural integrity (Carlson et al. 2013). Agro-forests are forests built
around croplands to promote biodiversity and maintain some or most ecosystem services
associated with this region (Gaveau et al. 2016).

26
Distinguishing the types of forest is imperative to understand the extent of how
deforestation contributes to CO2-eq emissions as each forest type provides different services in
terms of habitat or carbon sequestration capabilities. The process of converting intact forests to
oil palm monoculture is the most detrimental to overall carbon emissions, as these forests (when
converted) are responsible for the greatest quantities of CO2-eq emissions. Between the years of
1990 – 2010 in Kalimantan, Indonesia, forests converted for oil palm monoculture consisted of
intact (47%), logged (22%), and agro-forests (21%), and more than 560 Mt (75%) of the nations
CO2-eq emissions are a result of the conversion of these forests (Carlson et al. 2012). If all
current allocated leases of intact, logged, and agro-forests for oil palm production are converted,
Carlson et al. (2012) predicts Kalimantan’s emissions will increase 284% and contribute to 34%
of Indonesia’s national land-based emissions.
In their analysis of deforestation rates across tropical countries that have growing
agriculture industries, Pearson et al. (2017) found that emissions from the conversion of non-
peatland forest ranges from 2,300 to 4,200 Mt CO2-eq per year. The reason for the large range in
emissions varies on the study conducted and whether or not the researchers focused on net or
gross emissions (considering carbon stock loss) and the study area in question (Pearson et al.
2017). Throughout the literature analysis, some studies include the sequestration of carbon from
oil palm monoculture into their analysis while others focused strictly on net carbon emissions
from conversion. This exclusion of biomass and carbon stock in CO2-eq analyses is further
discussed in Section 5.2.
Within the province of Riau, Indonesia, the deforestation of non-peatland forest
contributed 52.4 Mt of CO2-eq/year between 1982 and 2007, equivalent to 63% of the regions
total estimated emissions (Uryu et al. 2008). With the inclusion of forest degradation through
conversion, total CO2-eq emissions were estimated to be 366 Mt CO2-eq/year from 1997 to 2007
(Uryu et al. 2008). Following the early 2000’s deforestation emission rates decreased (Table 4-
1). It can be assumed that this was due to the transition from deforesting large areas of intact
forest to converting already logged and agro-forested areas, resulting in lower emissions.
Forests in oil palm dominated areas also go through ongoing conversion after the
production of oil plantations begin due to crop rotation. Oil palm trees cannot be harvested after
the tree grows past a specific height, therefore plantations conduct “crop rotation” by cutting
down the trees that are too tall and replant new crops. Forest conversion of oil palm crops per

27
rotation period of 25 years also contributes to deforestation rates and is estimated to emit a total
of 795 – 1099 tons CO2-eq/ha during each cycle (Hergoualc’h and Verchot 2013). This variance
cannot be measured on an annual scale as each plantation rotates their crops at different time
periods based on initial planting and the size of the plantation. It is highly likely that the spike in
emissions from 2010 – 2015 is associated with crop rotation. Because of the lack of uniformity
in crop rotation schedules, CO2-eq/ha is the more accurate measure of emissions from crop
rotation processes.
Table 4-1: Summary of emission rates of non-peatland forest converted within Southeast Asia, measured in Mt of
CO2-eq.
The conversion of forests for oil palm cultivation was estimated by Singh et al. (2015) to
release approximately 650 tons CO2-eq/ha. Comparatively, Bunchai et al. (2016) found that
undistrubed intact forests that underwent conversion emitted 322.4 – 404.2 tons CO2-eq/ha,
showing that intact forest result in higher emissions than other forests. When these forests are
degraded, one of the primary mechanisms for removing excess atmospheric CO2 is lost or
severely limited, with damaging effects to neighboring ecosystems. Because the conversion
process of forest to oil palm monoculture releases up to 420 times more CO2-eq than annual
reductions from natural sequestration this results in a “carbon debt” (Singh 2015). One
significant counter finding during the literature analysis is that the conversion from logged
Source of
conversion
emissions
Emission rates
(Mt/CO2-eq)
Note Source
Deforestation 26 Annual emissions from deforestation
during 1990's and 2000's in Indonesia
Ramdani and
Hino 2013
4.9 Annual emissions from deforestation
during 2000's to 2012 in Indonesia
Ramdani and
Hino 2013
6.33 Average annual emissions from
deforestation between 2005 – 2010
across tropical ecosystems
Pearson et al.
2017
52.4 Annual emissions from deforestation
between 1982 and 2007 in Indonesia
Uryu et al. 2008
28
forests, cleared specifically for rubber plantations, to oil palm plantation could result in lower
CO2-eq emissions due to an increase in carbon stocks. Kusin et al. (2016) found that the
conversion of intact tropical forest to oil palm plantations results in four times higher emissions
and 50% carbon stock reduction when compared to the conversion of logged forests, however,
the conversion from previously logged forest for rubber plantations to oil palm increased carbon
stocks by 20%. This indicates that this process creates a carbon sink in newly established oil
palm plantations from logged forests. This is due to the amount of CO2-eq from aboveground
and belowground biomass that is lost during the conversion of intact forest systems, while
logged over forests gain sequestration potential from the planting of oil palm trees.
b. Conversion of tropical peatlands
Tropical peatlands are one of the Earth’s most efficient reserves for terrestrial organic
carbon and are at considerable risk for industrial conversion into oil palm plantations (Page et al.
2011; Tonks et al. 2017). As of 2010, 46% of tropical peatlands in Southeast Asia had been
burned and cleared for agriculture, of which 20% of those lands were converted to oil palm
plantations (Hergoualc’h and Verchot 2014). As tropical peatlands are a major carbon repository
and store ten times more carbon than forests on mineral soil, they should be analyzed separately
when looking at deforestation rates because of the extensive conversion procedures for peatland
soils (Sodhi et al. 2004). For the purpose of this analysis, the conversion of peatlands is defined
as the clearing and drainage for oil palm cultivation.
All processes in the conversion of tropical peatland soil to oil palm plantations affect the
natural characteristics of tropical ecosystems while expediting decomposition rates, and result in
an increase of CO2 emissions. During the conversion process, carbon resources are depleted and
tropical peatland soils transition from a carbon sink to a carbon source. This is due to the high
concentrations of available organic carbon that is stored within the strata of peatland soils; this
carbon is then combusted during conversion processes. The more destructive or invasive the
conversion process, the more tropical peatlands will become a significant carbon source within
the region. The rate of decomposition of tropical peatland soil depends on the forest vegetation,
hydrology, nutrient levels and any other disturbances, including natural and anthropogenic
effects (Page et al. 2011). The most recent publication on tropical peatland conversion, Tonks et
al. (2017), analyzed the ways that the chemical and physical properties of tropical peatlands are
altered during land conversion to oil palm and the predicted rate of carbon emissions as the oil

29
palm industry continues to grow in Central Kalimantan, Indonesia. The researchers concluded
that the conversion of peatlands outweighs natural sequestration and results in a rapid loss of
carbon, emitting approximately 39.6 – 52.4 t CO2-eq/ha per year while taking carbon stocks into
account. Their modeling studies on the rate of carbon emissions from peat degradation and
carbon stock assessments predict an increase of 5,138 tons CO2-eq/ha over a period of 100 years
and the majority of carbon loss in these areas will be at the expense of conversion from tropical
peatland to oil palm plantation (Tonks et al. 2017). Naturally occurring climatic fluctuations are
also being altered or intensified by the increased anthropogenic landscape alterations. For
example, temperatures are warming as a result of increased atmospheric CO2 levels and are
likely to increase decomposition rates of tropical peatlands as a result.
During the transition for oil palm monoculture, there are fertilizers used to prepare the
soil for planting. The fertilizer causes an increase in nutrient levels, resulting in peat
decomposition and an increase in CO2-eq emissions. Although these fertilizers emit more
nitrogen-based emissions than carbon equivalents, it is acknowledged that this factor contributes
to greenhouse gas emissions from the oil palm industry; however, for the purposes of this paper
the rate and impact of these emissions were not further analyzed.
Along with the loss of biomass from conversion, tropical peatlands become carbon
sources when they lose sequestration potential. Tropical peatlands have shallow water tables that
must be lowered and altered through pumping or aquifer diversion for successful conversion.
This process of drainage to make land suitable for oil palm agriculture also contributes to the
increase in conversion-related carbon emissions. The conversion of tropical peatlands for oil
palm monoculture requires the drainage of water to 60 – 80 cm below the soil surface, which
also results in a higher rate of peat decomposition (Klaarenbeeksingel 2009; Koh et al. 2011;
Page et al. 2011; Carlson et al. 2012; Ramdani and Hino 2013; Tonks et al. 2017). Emissions
during peat conversion are highest during the initial processes of drainage since the level of
emissions increases with drainage depth (Page et al. 2011; Tonks et al. 2017). The Roundtable of
Sustainable Palm Oil (RSPO) estimated that there are 9 tons of CO2-eq emissions for every 10
cm of peatland drained during conversion and emit 18 – 73 tons CO2-eq/ha annually
(Klaarenbeeksingel 2009). This estimation increased in following years, as Page et al. (2011)
concluded that emissions range from below 30 tons CO2-eq/ha to above 100 tons CO2-eq/ha
annually depending on the depth and scale of land undergoing conversion (Figure 4-1).

30
Table 4-2: Summary of emission rates from various literature sources of peatland drainage and conversion within Southeast
Asia, measured in tons of CO2-eq.
Following their research, Ramdani and Hino (2013) estimated that the conversion of
peatlands accounted for 41% of annual CO2-eq emissions (0.54 Mt CO2-eq/year) during the
1990’s and 2000’s (Table 4-2). Recent publications concluded that the emissions from the
conversion to oil palm monoculture were the largest contributor to the degradation of tropical
peatlands from 2009 to 2011 (Greenpeace 2013). Although emissions up until 2012 decreased
(0.24 Mt CO2-eq/year), approximately 69.94% of total emissions after the 2000’s until 2012
could be contributed to peatland drainage (Table 4-2). Hergoualc’h and Verchot (2014) predicted
that if conversion for oil palm continues at the current rate, tropical peatlands might be
nonexistent in Southeast Asia by 2030.
c. Land use change by fire-related clearing
Land use change through controlled burning is one of the most significant contributors to
carbon emissions, affecting both the physical and chemical composition of soils. It is evident that
Peatland
conversion
emission statistics
Emission (t/CO2-
eq)
Note Source
Annual estimations 538,000 Annual emissions during the 1990's and
2000's from peatland drainage in
Indonesia
Ramdani and
Hino 2013
4.6 million Estimated annual emissions until the
early 2000’s across Southeast Asia
Koh et al. 2011
Overall estimations 0.6 trillion Total peatland drainage emissions across
Southeast Asia
Tan et al. 2009
246,000 Total emissions from peatland drainage
during 2000's to 2012 in Indonesia
Ramdani and
Hino 2013
Emissions per
hectare (ha)
18 – 73 Emissions from peatland drainage Klaarenbeeksin
gel 2009
30 – 100 Emissions from peatland drainage Page et al.
2011

31
fire-related clearing techniques result in increased in larger carbon emissions in comparison to
deforestation and degradation emissions (Figure 4-1). Although fire is plays a major role in land
conversion emissions, many published articles have a variety of data regarding how they are
categorized. Within tropical ecosystems, fire emissions from deforestation and degradation are
categorized separately based on the length of time that each fire burns (Pearson et al. 2017).
Although it is a method of deforestation, due to the effects that fire-related conversion has on
increasing emissions, it is imperative to analyze this process separately when measuring the
effects of oil palm monoculture on tropical ecosystems. Researchers have highlighted that the
distinction between deforestation and degradation is essential to accurately measure carbon
emissions, especially in relation to fire conversion processes, and avoid the misrepresentation of
emissions associated with deforestation with emissions from fire degradation. Deforestation is a
direct human caused landscape alteration and is defined throughout literature as the clearing of
trees with no subsequent regeneration or replanting, such as the clearing for oil palm
monoculture or other land uses. Forest degradation is the deliberate and direct, human-induced
decrease in the overall quality of tropical forest ecosystems, including soil and biodiversity.
However, degradation addresses a multifaceted change to landscapes that affect not only above
ground ecosystems, but their sub surface components as well. Recent publications estimated that
the total carbon emissions from forest degradation were 2.1 Gt CO2-eq annually across 74
tropical countries as a result of oil palm plantations (Pearson et al. 2017). In terms of relativity,
fire-related degradation emissions measure to be about one-third of deforestation emissions
(Pearson et al. 2017).
Fire-related clearing, also called “slash-and-burn systems,” is used to convert large scales
of land for oil palm monoculture due to the inexpensive cost and how quick land can be
converted afterwards. Initially, the vegetation in the area is cut down and the remainder is set on
fire. Hamdan et al. (2016) estimated that the overall net CO2-eq emissions from deforestation
including fire-related conversion processes in Malaysia were 110 teratonnes (Tt) CO2-eq from
2010 to 2015, which is equivalent to 22 Tt CO2-eq/year. The oil palm industry contributed to
61% of these emissions during this time period, which is estimated to be approximately 67 Tt
CO2-eq (Hamdan et al. 2016). A study conducted by Carlson et al. (2012) concluded that fire
was the primary cause of 93% of the deforestation in Indonesia from 1989 to 2008. This
estimation included the fire-related conversion of land to oil palm monoculture, which

32
contributed to 69% of total carbon emissions; logging was the second largest contributor at 27%
of emissions (Carlson et al. 2012). Hergoualc’h and Verchot (2013) estimated that emissions
from a single fire-related land clearing are 493.0 – 649.0 t CO2-eq/ha.
Clearing techniques for the establishment of plantations have numerous contributing
factors to carbon emissions, including the direct carbon loss from cutting down vegetation, the
emissions from forest-burning techniques, and the carbon loss from the aboveground biomass
(approximately 40%, [Klaarenbeeksingel 2009]). The conversion via fire has caused significant
damage to tropical ecosystems, such as the rapid decline in the fertility of the land from fire
induced biogeochemical changes to the soil. Natural decomposition of debris also allows for the
return of vital nutrients to the soils via organic pathways, increasing soil fertility and allowing
nutrient transport to undisturbed areas via natural mechanisms. When fire is not used as a
clearing technique for tropical forests and peatlands, the vegetation debris is left to decompose,
which oxidizes and releases CO2 emissions, but at a much slower and reduced rate. If one hectare
of land was to be cleared without the use of fire-related clearing techniques, it would take
approximately three years for the biomass to biodegrade before the land would be clear to build
oil palm plantations which some producers deem to be an unacceptable delay (BBC 2013).
Climatic fluctuations will also have an effect on fire emissions from the conversion of
tropical peatlands, as they are expected to emit more than twice the amount of carbon emissions
from fire than drainage processes (Tan et al. 2009). Like forests, tropical peatlands will
experience higher flammability indexes during drier seasons and will therefore experience more
intense burnings during the conversion to oil palm monoculture. Warren et al. (2016) predicts
that using fire to clear tropical peatlands would increase emissions significantly on the hectare
scale to approximately 1,101 t CO2-eq/ha during the wet season, and 1,174.4 – 1,211.1 t CO2-
eq/ha during the dry season (Warren et al. 2016). Based on these estimations, the emissions from
just tropical peatlands are equivalent to about 15% of Indonesia’s total loss from deforestation
(Warren et al. 2016).
Warren et al. (2016) describes the risk of sporadic wildfires as a result of deforestation
and tropical peatland drainage processes for plantation establishment and concludes that the risk
of fires during drier seasons is even higher for areas of drained peatlands under oil palm
monoculture due to the altered water table. Unaltered areas near oil palm plantations are also
exposed to the risk of wildfires because of the migration of groundwater away from the unaltered
33
areas to the locations where the water table has been modified for conversion. This process of
hydrologic migration can be compared to osmosis due to water migrating from an area of high
concentration to low concentration within the water table, i.e. areas altered for oil palm
monoculture. As the water table levels balance, the risk of fire increases and as a result fires burn
much larger areas with increased frequency. Carlson et al. (2012) concluded that 8% of the
wildfires in Indonesia in 1997 resulted from oil palm production, as these fires occurred within 5
km from operating oil palm plantations (Figure 4-2).
Many of these fire emission estimations also depend on future climate patterns as longer
periods between wet seasons, or an increase in mean temperatures, can increase the spatial extent
and quantity of areas prone to burning, i.e. areas of dense vegetation susceptible to
uncharacteristic drying. Forest loss from fire in Indonesia reached 9% per year during the 1997 –
1998 El Nino Southern Oscillation due to an increase in wildfires (Carlson et al. 2012). The fires
that resulted from the event contributed to the highest annual net carbon flux in Indonesia and
carbon emissions were estimated to account for 19% of the annual 45.1 t CO2-eq emitted per
year (Carlson et al. 2012). Warren et al. (2016) looked at simulated models of the carbon
emissions over a 100-year period in regards to forest clearing and crop rotations as a result of the
oil palm industry. Their conclusions were based on current trends of oil palm expansion and
climate in Southeast Asia; however, the authors noted that the predictions will change based on
global climate change, especially if drier conditions occur. For example, drier conditions and
increased fire frequency could result in total emissions from conversion and cultivation reaching
over 30.7 Gt CO2-eq over a 100-year period, compared to the current estimate of 8.7 Gt CO2-eq
(Warren et al. 2016).
Although these clearing techniques are illegal in most countries, such as Indonesia, they
are still widely used with little to no repercussions to plantation stakeholders. South American
countries, such as Brazil, have implemented stricter policies about deforestation and land
degradation using fires to clear land for oil palm monoculture (Vijay et al. 2016). The policies in
these countries have severe consequences for stakeholders and employees in the agriculture
industry if found to be using fire for clearing. However, fire techniques are still used in other
countries mainly because of how soon the plantation owners can begin production following
conversion, compared to waiting for the biodegradation of biomass after cutting down vegetation

34
(BBC 2013). The World Wildlife Fund reported that more than 2 Mha of land are burned every
year globally for the cultivation of oil palm (2016).
Fire is perhaps the single largest contributor of regional carbon emissions and is in need
of stringent monitoring to quantify, inform, and support reduction recommendations to both
private and governmental entities if these emissions are to be decreased in the future. To better
quantify the extent of fire-related emissions from land use change for oil palm monoculture in
future studies, emissions should be categorized as a form of deforestation emissions rather than
degradation because it is a land use change to fully transform forest (Pearson et al. 2017). The
Global Fire Emissions Database could be a useful resource for future studies, as it estimates
emissions from forest fires while providing a monthly update of data. Due to the higher
resolution imagery needed to identify degradation, beyond the canopy cover, the accurate
monitoring and measuring of tropical forest degradation has proven to be challenging (Pearson et
al. 2017). Given the ease of the “slash and burn” method of land clearing, it is reasonable to
conclude that carbon emissions from fire related conversion in Southeast Asia will continue to
increase unless direct and stringent measures are enacted to cease this practice; and that requires
increased enforcement by governmental regulators.
Figure 4-1: Comparison of emissions resulting from deforestation, peatland drainage and fire related conversion processes
measured in CO2-eq per hectare.
404.2
100
649
0
100
200
300
400
500
600
700
Forest Peatland drainage Fire
CO
2-e
q p
er
he
cta
re
Parameter measured
Emissions from the conversion processes of oil palm monoculture

35
Figure 4-2: Locations of fires in Malaysian and Indonesian Borneo compiled from NOAA data on tropical Fires (Data from
CIFOR, map document created by J. D. Heaster 2017).

36
4.2 Emission as a result of oil palm production
There is no one methodology to calculate CO2-eq emissions that include all contributing
variables in the production of oil palm (Kaewmai et al. 2012). The range of emission factors
analyzed varies on the study conducted, as some researchers include carbon stock assessments
and others omit this parameter. Across literature, emissions from oil palm production are
categorized as the daily operations of plantations (including transportation during production and
utilities to power the plantation), fresh fruit bunch acquisition and processing, wastewater
treatment (if applicable at that location), and the changes in carbon stocks in either soils or above
ground biomass. Due to the various emission factors, studies analyze overall emissions using
either the unit of “CO2-eq per ton of CPO produced” or “CO2-eq per hectare.” The units of CO2-
eq/ton CPO is used to describe emissions directly related to the extraction and production of oil
palm, while CO2-eq/ha is used for emissions related to changes in carbon stock and production
emissions (Klaarenbeeksingel 2009). During the literature analysis, both units were quoted, and
neither of the units includes emissions from the clearing or conversion processes of land.
As discussed in Section 2.7, there are two production processes of oil palm, wet and dry.
The emissions as a result of these processes vary due to the use of water for wet extraction and
increased firewood usage for dry extraction. Due to the inclusion of water during wet extraction,
there is an additional emission factor from wastewater treatment processes; these wastewater
treatment emissions will also vary based on whether the plantation has biogas capture systems
for treatment (Figure 4-2). Within the wastewater treatment stage, there are also various ponding
mechanisms used, which will also affect emission levels. Data across literature have wide
estimations on the extent of CO2-eq emissions as a result of different extraction processes and
wastewater treatment involved. Most literature analyses focus on the wet extraction process as it
is more widely used across oil palm production; however, a study conducted by Bunchai et al.
(2016) focused strictly on the dry extraction process, and therefore I was able to provide a more
accurate comparison of emissions from both processes by analyzing the difference in emission
levels between processes. For this project and to facilitate ease of comparison, the emissions
from wet and dry extraction are investigated on a CO2-eq/ton CPO basis.
Reijnders and Huijbregts (2008) and Kusin et al. (2016) analyzed the overall emissions of
oil palm plantations on a CO2-eq per hectare basis, as they included estimated changes in carbon
stock to their analyses. It was concluded that production related CO2-eq emissions vary based on
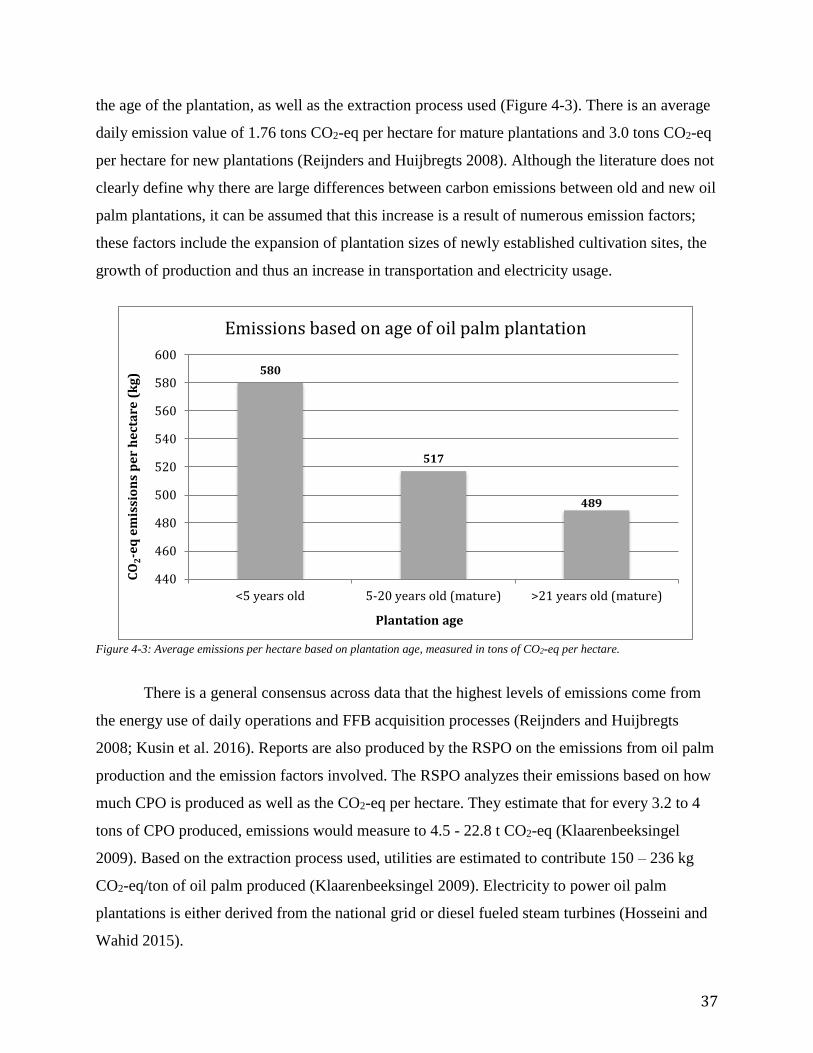
37
the age of the plantation, as well as the extraction process used (Figure 4-3). There is an average
daily emission value of 1.76 tons CO2-eq per hectare for mature plantations and 3.0 tons CO2-eq
per hectare for new plantations (Reijnders and Huijbregts 2008). Although the literature does not
clearly define why there are large differences between carbon emissions between old and new oil
palm plantations, it can be assumed that this increase is a result of numerous emission factors;
these factors include the expansion of plantation sizes of newly established cultivation sites, the
growth of production and thus an increase in transportation and electricity usage.
Figure 4-3: Average emissions per hectare based on plantation age, measured in tons of CO2-eq per hectare.
There is a general consensus across data that the highest levels of emissions come from
the energy use of daily operations and FFB acquisition processes (Reijnders and Huijbregts
2008; Kusin et al. 2016). Reports are also produced by the RSPO on the emissions from oil palm
production and the emission factors involved. The RSPO analyzes their emissions based on how
much CPO is produced as well as the CO2-eq per hectare. They estimate that for every 3.2 to 4
tons of CPO produced, emissions would measure to 4.5 - 22.8 t CO2-eq (Klaarenbeeksingel
2009). Based on the extraction process used, utilities are estimated to contribute 150 – 236 kg
CO2-eq/ton of oil palm produced (Klaarenbeeksingel 2009). Electricity to power oil palm
plantations is either derived from the national grid or diesel fueled steam turbines (Hosseini and
Wahid 2015).
580
517
489
440
460
480
500
520
540
560
580
600
<5 years old 5-20 years old (mature) >21 years old (mature)
CO
2-e
q e
mis
sio
ns
pe
r h
ect
are
(k
g)
Plantation age
Emissions based on age of oil palm plantation

38
Gas to fuel machinery in the production process was measured to release 6 kg CO2-eq/t
of oil produced (Klaarenbeeksingel 2009). The transportation sector of the production process
uses high-emitting fossil fuels, such as diesel, to power the machinery needed to harvest, collect,
transport, and mill the fruit bunches. Carbon emissions from diesel use were quoted to be 3.21 kg
CO2-eq per ton of diesel used, resulting in 225 kg CO2-eq/ha per year (Klaarenbeeksingel 2009).
Klaarenbeeksingel (2009) estimated that annual emissions from transportation contribute to 45 –
125 kg CO2-eq/t CPO.
Table 4-4: Summary of estimated production emissions including the wet and dry extraction processes of oil palm monoculture,
measured in tons CO2-eq.
a. Extraction processes:
Wet extraction:
Carbon emissions of the wet extraction process of oil palm production result from the
numerous inputs associated, such as: the acquisition of raw fruit bunches, chemical input for
wastewater treatment, disposal of chemical waste, energy and utilities, and wastewater treatment
after production (Poku 2002; Klaarenbeeksingel 2009; Kaewmai et al. 2012; Carlson et al 2012;
Bunchai et al 2016). Wet extraction emits higher levels of carbon emissions than dry extraction
because it requires large amounts of water and energy to convert FFB to CPO (Figure 4-4), and
therefore involves a wastewater treatment procedure and chemical inputs (Kaewmai et al. 2012).
The average rate of emissions from oil palm mills in Thailand using the wet extraction processes
were 1,039 kg CO2-eq/t CPO in 2009 (Bunchai et al 2016). Wastewater treatment accounts for
approximately 58% of CO2-eq emissions in the wet extraction process (Bunchai et al 2016).
Emissions
(t/CO2-eq)
Source
Overall emissions per ton of CPO produced
including wet extraction
1.3 (Kaewmai et al.
2012)
Overall emissions per ton of CPO produced
including wet extraction
1.21 (Hosseini and Wahid
2015)
Overall emissions per ton of CPO produced in 2009
including dry extraction
1.14 (Bunchai et al 2016)

39
There are three ponding systems used to treat wastewater, anaerobic, aerobic and
detention ponds (Reijnders and Huijbregts 2008; Kaewmai et al. 2012; Hosseini and Wahid
2015). Each of the three ponds provides different stages of treatment through separate processes,
and whether or not the ponding systems are covered affects carbon emissions. For example, the
aerobic ponds decrease the amount of organic material in wastewater and are estimated to emit
225 kg CO2-eq/Mt CPO; however, if the ponding system were to be covered, emissions could
decrease to 25 kg CO2-eq/Mt CPO (Hosseini and Wahid 2015). These pond systems are the most
common wastewater treatment method because of the low cost. Emissions from the electricity
demand of ponding systems generate about 0.50 kg CO2-eq/t CPO (Hosseini and Wahid 2015).
Following treatment, wastewater is discharged into the oil palm fields or held in the detention
ponds.
Numerous techniques have been applied to the oil palm industry to improve wastewater
treatment while also reducing emissions, such as a biogas capture system. These capture systems
are used to generate electricity using the biogas that results from the oil palm effluent during
plantation operations. The electricity generated is used to power the mills for the production of
oil palm. In 2010, only 10% of Malaysian palm oil plantations had installed the biogas capture
infrastructure (Hosseini and Wahid 2015). There is a general consensus that biogas capture
systems have not been seriously considered among more oil palm plantations due to the national
grid being easily accessible, the low cost of electricity, a lack of information or interest, and the
lack of regulations on plantations (Hosseini and Wahid 2015). However, the conversion of
biogas to electricity also causes the conversion of CH4 to CO2, which can also result in an
increase of emissions if it is not implemented properly (Klaarenbeeksingel 2009).
Based on a study by Hosseini and Wahid (2015), oil palm plantations in Malaysia that did
not have a biogas capture system emitted approximately 1,102 kg CO2-eq/t CPO, while
plantations that implemented the system emitted 192.5 kg CO2-eq/t CPO (Figure 4-4). The
researchers found that the implementation of biogas capturing technology decreased overall
emission levels by 80% (Hosseini and Wahid 2015). A significant counter finding to these
emissions is that the extent of emission mitigation varies based on the location of oil palm
plantations across Southeast Asia, and what wastewater treatment ponding system is used.
Kaewmai et al. (2012) assessed the emissions of 14 oil palm plantations in Thailand with and
without biogas capture and different ponding systems. Their studies found that the average

40
emissions of oil palm production were approximately 1,198 kg CO2-eq/t CPO produced. Within
those emissions, the plantations that have implemented biogas capture systems emitted 1,039 kg
CO2-eq/t of CPO, while those without biogas systems emitted 1,484 kg CO2-eq/t CPO (Figure 4-
4; Kaewmai et al. 2012). Kaewmai et al. (2012) predicted that biogas systems could reduce
carbon emissions in Thailand palm oil plantations by 30%. Thailand is believed to have
relatively higher emissions than other Southeast Asian countries producing oil palm because of
the wastewater treatment (Kusin et al. 2016).
Figure 4-4: Comparison of emissions of the extraction processes of oil palm production from various literature sources,
measured in kg CO2-eq. Data shows that the wet extraction process without a biogas capture systems emits the highest levels of
CO2-eq than other processes.
Dry extraction:
During the dry extraction process there is no wastewater treatment involved, which
results in relatively lower GHG emissions. However, due to the lack of wastewater treatment and
chemical input, compared to the wet extraction process, the utilities used during the dry
extraction process are measured to emit higher levels of carbon emissions than other contributors
(Kaewmai et al. 2012; Bunchai et al 2016). The process of harvesting of the palm fruit was the
537
193
1,1021,039
1,484
0
200
400
600
800
1000
1200
1400
1600
Wet extraction withbiogas capture system
Wet extraction withoutbiogas capture system
Dry extraction
CO
2-e
q p
er
ton
of
oil
pro
du
ced
(kg
)
Extraction process of oil palm
Comparison of emissions from literature sources of extraction related CO2-eq emissions
Bunchai et al.(2016)
Hosseini andWahid (2015)
Kaewmai et al.(2012)

41
largest contributor of emissions during the dry extraction process, measuring to approximately
448 kg CO2-eq per ton of oil, which is approximately 83.4% of total emissions (Figure 4-5;
Bunchai et al 2016). Firewood, diesel and electricity are the remaining contributors emissions, as
firewood is used to dry the palm fruit, measuring to about 5% of emissions; the diesel is used in
the transportation of the fruit to the mills for processing, approximately 1.82% of emissions; and
the electricity that are used to power the plantations, typically through generators on smaller
scale operations, contributing to 9.78% of emissions (Figure 4-5; Bunchai et al 2016). It is
assumed that these emissions result from the electricity and fuel use during the harvesting
process, rather than production emissions. The removal of the palm fruit from the FFB is usually
done by the employees of the oil palm plantation, therefore most studies did not incorporate this
process in their analyses. Without incorporating carbon emissions of firewood and burning, the
average total emissions of the dry extraction process are 537 kg CO2-eq/t CPO (Figure 4-4;
Bunchai et al 2016). The burning of firewood increased these emissions significantly to 871 kg
CO2-eq per ton of oil that was extracted (Bunchai et al 2016).
Figure 4-5: Emission factors involved with the dry extraction process and the percentage of how much each factor contributes to overall emissions. The harvesting of the oil palm fruit contributes the largest amount of emissions during the process, as the remaining factors have lower emission levels and a wastewater treatment facility is not needed.
83.40%
5%
1.82%9.78%
Percentage of emission factors involved in dry extraction
Harvesting
Firewood
Transportation,diesel
Electricity

42
The study conducted by Bunchai et al. (2016) analyzed the emissions from both the wet
and dry extraction processes and concluded that if oil palm plantations converted to using strictly
dry processes, it could decrease overall emissions 5.08 t CO2-eq/ha/year. Dry extraction also
results in a more efficient oil extraction rate (OER) during production than wet processes. This is
caused by just palm fruit being used during dry extraction (called raw material), while the palm
fruit, FFB and EFB are used in wet extraction; and when moisture is lost in the process it effects
the overall extraction of oil (Bunchai et al 2016). The OER of wet extraction is estimated to
range from 14 to 19% (Kaewmai et al. 2012; Hosseini and Wahid 2015), compared to a 22.3%
OER for dry extraction (Bunchai et al 2016). A conversion from wet to dry extraction could
prove significantly beneficial for all countries that are producing large amounts of oil palm as the
conversion of extraction processes will also effect the direct and indirect land use changes. It is
estimated that this conversion of extraction processes in Thailand could result in a 3% saving of
emissions from land use of up to 274,774 t CO2-eq/year (Bunchai et al 2016). Across all
parameters, the conversion of extraction processes (from wet to dry), or implementation of
biogas capture technology, will result in a reduction of CO2-eq emissions and also increase oil
palm production levels.
5. Discussion:
Due to the lack of consensus on one methodology to measure emissions, CO2-eq is
measured on annually or per hectare basis throughout literature. Emissions vary across the type
of forest converted, i.e. intact, logged, and agro-forests. The deforestation and conversion of
intact forests also emit the highest levels of CO2-eq across all forest-related parameters
measured. Plantations replace intact forests more frequently, followed by logged forests, then
agro-forests. It is evident that the continuous harvest rotation aids in a spike of emission levels
when crops are replaced every 25 years.
The degradation of tropical peatland soils is an important factor that is often
underestimated, or not included, when analyzing CO2-eq emissions as a result of oil palm
conversion. For the purposes of this analysis, tropical peatlands were analyzed separately from
forests (intact, logged, and agro-forest) to outline the significance of how the conversion process
results in the transition from natural carbon sinks to carbon emitters; and it was evident that
tropical peatland soils, although having lower CO2-eq emission rates, lose large quantities of

43
carbon stock during conversion process. Draining and conversion processes expedite degradation
rates, the risk of wildfires and the water table collapsing. The draining of peatlands has the most
significant impact on the carbon balance in these soils as CO2-eq emissions increases with depth.
The necessary modifications for oil palm monoculture on tropical peatland composition also
hinder carbon balance and sequestration potential through the alteration of the water table.
Land use change via fire related clearing events was also analyzed separately due to more
significant emissions rates. The conversion of tropical peatlands by fire related tactics emit twice
as much CO2-eq than strictly draining. Fires not only emit more CO2-eq but also significantly
affect the overall ecosystem, i.e. the combustion of carbon stored in aboveground biomass.
Future climatic patterns will have an effect on these emissions and drier seasons will also put
Southeast Asia at greater risk for wildfires. Although the amount of land cleared by fire for oil
palm cultivation has decreased in recent years, fire-related conversion tactics should be of
concern for future studies.
The process used for extraction determines emissions from the production of oil palm.
There are numerous emission factors that contribute to overall emission measurement, however,
as previously mentioned, this analysis focuses on emissions strictly from cradle to gate.
Emissions are typically measured by how many tons of oil palm is produced per hectare. It was
evident that wet extraction emits more CO2-eq than dry extraction processes; however, the
counter finding showed that the implementation of a biogas capture system could lower wet
extraction emission levels past those from dry extraction. Emissions from plantations using wet
extraction with a biogas capture system are considerably lower than those without, by
approximately 30-80% depending on the wastewater treatment facilities installed on the
plantation site. It can be concluded that the implementation of this system, if economically
feasible, could prove to be beneficial in decreasing overall production emissions. This
conversion is further discussed in Section 6.
It is important to clarify that this paper is not claiming the oil palm industry is the only
cause of deforestation and degradation in tropical ecosystems, but rather the most influential
factor. Other agricultural industries have contributed to the rates of deforestation, i.e. pulpwood
and soybeans; however, these crops are not as economically feasible as the cultivation of oil
palm and therefore the industries have not expanded or contributed as much to the dramatic
increase of deforestation rates the last five decades. For example, from 1973 to 2015 industrial

44
plantations expanded by 9.1 Mha of land on the island of Borneo, 1.3 Mha were cultivated for
pulpwood production and the remaining 7.8 Mha were oil palm plantations (Gaveau et al. 2016).
The emissions as a result of the oil palm industry has had greater impacts on the environment
than just aiding to the percentage of global anthropogenic carbon emissions. Carbon emissions
have effects that range from small-scale to large-scale. It is evident across literature that the
conversion of forests, degradation of tropical peatland soils and fire-related clearings have
broader effects on tropical ecosystems and ecosystem services. Biodiversity of flora and fauna
are ultimately altered, as are the soil characteristics within the areas cultivated for oil palm
production.
There were many emission related data gaps found during the literature analysis which
researchers concluded result in statistical errors and do not represent a thoroughly accurate
assessment of the amount of CO2-eq that is released from the conversion and production of oil
palm. These data gaps and limitations result in more assumptions than concrete based
conclusions across research. However, countries within Southeast Asia have committed to
mitigation programs to lower their national CO2-eq emissions that result from large-scale
agriculture industries. For example, Indonesia has put a moratorium in place that has seized
future cultivation for oil palm while protecting an additional 43 Mha of land, and Malaysia has
committed to the program of Reducing Emissions from Deforestation and Degradation, and
Forest Conservation (REDD+). The broader impacts on tropical landscapes as a result of oil
palm cultivation and the data limitations are discussed in the following section.
5.1 Broader impacts resulting from an increase in deforestation, degradation and
carbon emissions
a. Impacts of deforestation and forest degradation on surface characteristics:
Most deforestation and degradation results from the establishment of new plantations for
large-scale cultivation. Many plantation owners prefer to clear intact forests so they are able to
benefit from the sale of the timber after clearing, rather than planting on already cleared land or
abandoned plantations (Tan et al. 2009). The impacts of deforestation have a significant effect on
the carbon cycle and biophysical processes in tropical ecosystems. The clearing of land, removal
of canopy structures, and conversion to oil palm plantation also change the surface

45
characteristics of the area, such as an increase in albedo (the reflective capacity of surface soils)
and surface temperatures. Different vegetation compositions have different absorbency and
reflective rates, and therefore different radiative forcing profiles. It is estimated that the loss of
60% of tropical forests by 2100 would contribute to the warming climate, equivalent to an
additional 44,000 Mt of CO2-eq in the atmosphere (Parrotta et al. 2012). A study conducted by
Saswattecha et al. (2016) found that the impacts of converting land to oil palm monoculture
between 2009 – 2012 were significantly higher than 2000-2009. It can be expected that any
future land conversion will continue to have increased rates of negative effects on tropical
ecosystem surface characteristics and their ecosystem services. The long-term success of these
services is of scientific and environmental management concern.
b. Impacts of carbon emissions on flora biodiversity:
Although this paper does not examine the full extent of the effects that the oil palm
industry has on biodiversity, it is important to address how drastic these impacts have also been
on tropical ecosystems. Metrics of flora biodiversity are typically divided into structural (growth
potential) and compositional (species richness) parameters (Parrotta et al. 2012). It has been
disputed within literature whether or not increased levels of CO2 emissions have a negative effect
on plant biology and biodiversity. One argument is that increased CO2 emissions are beneficial
for plants, as they need CO2 for growth (Shwartz 2002). However, recent publications have
proven these claims irrelevant and the negative effects to be accurate. Carbon emissions have
consequences on photosynthesis, as it depends on the equilibrium of metabolic processes. When
there is a greater abundance of one chemical, it has an overall effect to the photosynthetic
process. An increase in CO2 has been found to affect a plant’s water balance and nutrient
cycling, such as stomatal closure within plant leaves (Feng 2015). The closing of the stomata
restricts the consumption of water and a decrease in transpiration.
Comparatively, as the emissions and atmospheric levels of CO2 increase the nitrogen
concentration in plants will decrease; this results in a decline of plant protein levels and affects
ultimate growing potential (Feng 2015). Studies have confirmed that nitrogen concentration in
terrestrial plants decrease by 10% when there is an increase in CO2 (Feng 2015). A loss of
nitrogen in already nutrient-poor soils, such as tropical peatlands, will impede greatly on plant
biodiversity. At Stanford University, a study examining the effect CO2 in combination with
atmospheric temperature, water, and nitrogen levels was administered under controlled

46
circumstances (Shwartz 2002). Across all scenarios of the 36 plots in the experiment, Shwartz
(2002) found that the addition of increased CO2 levels hindered plant growth, regardless of any
changes made to the other controlled parameters. Other analyses suggest that the loss of plant
diversity can result in the decline of key functional species within the area (Parrotta et al. 2012),
such as the estimated 11% of endemic flora species that reside in tropical peatlands (Evers et al.
2017). This loss of key species can ultimately affect trophic levels by decreasing primary
production. It can be concluded that plant growth and biodiversity within tropical ecosystems
will be significantly affected due to rising CO2 levels emitted from the continuation of oil palm
related emissions.
c. Impacts of deforestation and degradation on species biodiversity:
The fragmentation of forests from deforestation and its effect on species biodiversity is a
growing concern amongst researchers (Abdullah and Nakagoshi 2007). Tropical forests in
Borneo are home to approximately 129 species of mammals, 314 species of birds, 101 species of
reptiles, and 33 species of amphibians (Abram et al. 2014). Comparatively, the IUCN estimated
259 endemic mammals, 382 endemic birds, and 172 endemic amphibians within Indonesia
(Profauna 2012). Out of these estimates, 507 species are currently threatened (184 mammals, 119
birds, 32 reptiles, 32 amphibians, and 140 fish) (Profauna 2012). Since the expansion of the oil
palm industry, and the resulting increase of deforestation and degradation, there have been
significant declines in species richness. For example, bird species experienced a 77% decline in
richness and butterfly species declined 83% just within Malaysia in response to deforestation
rates (Butler and Laurance 2009). The various levels of deforestation and degradation of tropical
forests and peatlands for oil palm monoculture is fragmenting natural habitats and converting
them to “biological deserts” (Butler and Laurance 2009), causing substantial changes in trophic
structure and food chains (Parrotta et al. 2012). Among the species that are greatly affected by
the oil palm related habitat destruction are Asian elephant species and the Sumatran tiger.
Sumatran elephant (Elephas maximus ssp. sumatranus) population numbers in Riau,
Indonesia declined 84% over a 23-year period, from approximately 1,342 in 1984 to 210 in 2007
(Uryu et al. 2008). By 2007, elephant populations in Rokan Hilir, Kerumutan, Koto Panjang,
Bukit Rimbang Baling, Tanjung Pauh and Bukit Suligi had gone extinct, and as a result, the
number of elephant herds declined from 15 in 2003 to nine (Uryu et al. 2008). The Borneo
elephant (Elephas maximus borneensis) has suffered similar fates to those of Sumatran

47
elephants. Recent studies estimate there are approximately 1,500 individuals left on the entire
island (Asian Elephant Support, n.d.). This decline in population numbers can be correlated to
the forest loss. Uryu et al. (2008) estimated that during the same time that elephant populations
were rapidly decreasing, 65% of forests were lost. It is evident that the number of elephant herds
decline as deforestation increases and forests became more fragmented. When deforestation and
forest fragmentation occurs, elephants become separated from their herds and are more
vulnerable to poachers due to lack of habitat cover.
Elephants have been known to damage the oil palm crops and eat the fruit bunches off of
the trees. As a result, many plantation owners and employees install illegal snares (a trapping
mechanism typically made of wire, usually with an attached noose) to trap elephants, as well as
other small game animals. There has also been evidence in recent years of elephants being
poisoned on or near oil palm dominated land across Southeast Asia. In Indonesia, four mass
poisonings of elephant herds have been reported between 2002 and 2006; however, it is
concluded literature suggests that other poisonings have eliminated entire herds at one time but
have gone unnoticed. In 2015, 14 pygmy elephants in Borneo were poisoned over a four-week
span all within government owned wood and oil palm plantations (Asian Elephant Support, n.d.).
Comparatively, the capturing of elephants by government teams from nearby oil palm
plantations has also caused a decline in population numbers. Uryu et al. (2008) reported there
were at least 224 captures in Indonesia, and it is suspected that most of the elephants died during
the capture or within holding facilities. These captures often claim the lives of young elephants,
ultimately creating a threat to the future populations. Due to the sensitivity of these species, it
can be assumed that many of these captures have gone undocumented.
The Sumatran tiger (Panthera tigris sumatrae) has also faced a similar fate to the Asian
elephant species; it is the only living species of Indonesian tigers left, as the rest have gone
extinct (Uryu et al. 2008). Tiger populations require a forest cover for a variety of reasons,
including prey availability, protection from anthropogenic influence and habitat for propagation.
Numerous studies have been conducted on the population of tigers in Riau, Sumatra and all have
concluded the decline in population is a result of habitat loss from deforestation (Uryu et al.
2008; Wibisono and Pusparini 2010; Sunarto et al. 2013). Research conducted by Sunarto et al.
(2013) found that tiger densities in Sumatra are roughly 50% lower than expected. Uryu et al.
(2008) estimated, based on previous studies, that there was at least one tiger per 10,000 hectares

48
and the populations of tigers were declining faster than forests. In 1982, Riau had 6.4 Mha of
suitable habitat for tigers, and it was estimated that there were 640 individuals living in the area
(Uryu et al. 2008). In 2007, habitat availability declined so rapidly that tiger population numbers
decreased 70% to 192 individuals and tigers were separated into nine isolated population patches
(Uryu et al. 2008). The loss of habitat at this rate hindered the overall prey availability for tigers,
also affecting population viability. Contrary to prior research, as of 2013, there was
approximately <1 tiger per 10,000 hectares (Sunarto et al. 2013).
The fragmentation of forests has destroyed wildlife corridors and isolated viable habitat
into small patches, some of which could not hold more than 50 individuals at a time, according
to Uryu et al. (2008). For the survival of tiger species, conservation biologists have determined
there needs to be a minimum of 100 individuals to create new subpopulations (Uryu et al. 2008).
These corridors are essential for the movement of species within habitat patches in
metapopulations. All species within Southeast Asia, especially Asian elephants and Sumatran
tigers, have experienced isolation due to increasing deforestation rates. Isolation of individuals
can lead to inbreeding within smaller populations and the degradation of existing population
genetics. When there is a decline of diversity in the phenotypes of a particular gene pool, a
reduction in the fitness of subsequent generations occur because of a lack of heterogeneity in the
genetic matrix. Long-term viability of these species require the connectivity of functioning
corridors so species are able to access habitat, food sources and breeding populations.
The critical status of these species, and others that have been affected by the oil palm
industry, has brought attention to Southeast Asia. Many non-governmental organizations have
begun campaigns to bring awareness to the issues, such as Asian Elephant Research and
Conservation (AERC) and the Global Tiger Initiative. Researchers believe that there is hope for
the array of threatened species in agriculture-dominated areas, as long as government-supported
implementation plans are put into place. Sunarto et al. (2013) explains how controlling the illegal
activity, i.e. illegal methods of deforestation and fire-related clearing, could facilitate the
recovery of natural habitats, and thus the recovery of species populations. A successful habitat
protection program will require the cooperation of stakeholders within the oil palm industry and
forest reserve services.
Tropical forests are home to some of the highest levels of biodiversity, as well as
providing many other ecosystem services, and the expansion of the oil palm industry has

49
significantly hindered these imperative ecosystems. It is evident from the literature analysis that
the oil palm industry will continue to accelerate tropical deforestation and the destruction of
natural habitats. The long-term effects of this destruction are not within just the forest structure,
but also the degradation of species. The conservation of tropical forests is essential for the
success of maintaining species diversity and preservation of those already in danger of
extinction.
5.2 Research Limitations:
There are gaps in data pertaining to the relationships between carbon emissions,
deforestation, and the effects on biodiversity and ecosystem services. Conclusions within data
based on the literature evaluation have highlighted data gaps on carbon emissions from the oil
palm industry practices within Indonesia and Malaysia. While the data is sufficient for a broad
analysis overall, there are significant limitations. These limitations require assumptions on
certain facets rather than solid conclusions. The following data gaps were found within the
literature analysis:
• Discrepancy in government based analysis compared to academic literature in regards to
deforestation rates and actual industry-related emissions
• Ambiguity in definitions of forests and the overlapping concessions in satellite imagery
analysis
• Under-estimations of emissions due to methodologies used, such as closed chamber flux
measurements
• The exclusion of aboveground biomass and carbon sequestration potential within
literature
The data used in this analysis supports the conclusions and assumptions discussed below.
a. Government based analyses:
A significant limitation in further research of the effect the oil palm industry has on
carbon emissions and the environment is the inconsistency amongst data between academic
literature and government documentation. A study conducted by Gavaeu, et al. (2016) analyzed
the expansion of the oil palm industry and the deforestation as a result between 1973 and 2015 in
Borneo. Using satellite imagery, researchers concluded that the estimated total of forest area loss
to plantation expansion was 18.7 Mha (Gavaeu et al. 2016). However, the actual estimate of how

50
extensive deforestation as a result of industrial plantations in Southeast Asia is ambiguous.
Official government registered documents for the construction of plantations claimed that 1.6
Mha to 1.9 Mha of forest was cleared between 2000 and 2010 (Gavaeu et al. 2016). However,
LANDSAT satellite imagery shows Indonesia lost approximately 14.7 Mha of forest between
2000 and 2010, and oil palm plantation monoculture contributed to 90% of that deforestation
(Gavaeu et al. 2016; Abood et al. 2015).
The Land Development Minister of Sarawak, Malaysia and the Malaysian Palm Oil
Council chief executive officer claimed that oil palm plantations do not cause deforestation, but
instead make “reasonable use” of current deforested and degraded lands (Gavaeu et al. 2016).
Santilli et al. (2005) estimated that annual deforestation in Indonesia from 1987 to 1997 was
approximately 1.7 Mha, and increased to 2.1 Mha by 2003. However, data from the Food and
Agriculture Organization (FAO) claimed that deforestation rates were only 1.7 Mha over a 15
year period, 1990 and 2005 (Gavaeu et al. 2016). Koh and Wilcove (2008) addressed that one of
the shortcomings of their research was FAO reported data due to the lack of validation; they
discuss how the self-reporting data puts actual deforestation rates at risk for bias rather than an
accurate measurement.
Country-level estimates on carbon emissions that are reported by government agencies
have been based on forest inventory data from the FAO. Gibbs et al. (2007) concluded these
estimates to be inaccurate as they are subject to inadequate sampling procedures across a national
scale and inconsistent monitoring methods; and as a result, national carbon emission estimates
are relying on “best guesses” (Gibbs et al. 2007). The accurate measurement of deforestation is
necessary to measure CO2-eq emissions, and the lack of reliable data has caused a difficulty for
researchers to quantify the extent to which oil palm monoculture has affected these parameters.
b. Definition ambiguity
Abood et al. (2015) addressed two major limitations in accurately understanding
deforestation data as a result of large-scale industrial agriculture. First, the overlapping of data in
different concessions causes ambiguity. For example, a majority of oil palm dominated forest has
been categorized as mixed concessions (where other agricultural cultivation included in dataset).
Mixed concessions cover approximately 2.2 Mha of land in Kalimantan, and the overlap of data
may result in researchers under-reporting the extent of forest within oil palm concessions (Abood
et al. 2015). Prior to 1984, satellite imagery was not as widely used to measure deforestation and
51
degradation; however, attempting to measure these parameters via satellites, such as LANDSAT,
has also proven to be a difficult process and has aided in the overlap of data. Due to the spectral
colors of logged forests resembling intact forests on satellite imagery after forest regrowth, it is
assumed that recent studies have categorized logged forests as intact forest (Gaveau et al. 2016).
The second limitation is the definition of forests within literature. Abood et al. (2015)
outlines how the definition of forest varies across data. Carlson et al. (2013) includes plantations
and regrowth in the forest definition while Abood et al. (2015) analyzes forest and agro-forest
separately. It is imperative to understand the definition within literature to accurately analyze the
extent of deforestation and degradation from oil palm monoculture. For example, Gaveau et al.
(2016) found in their literature analyses that forest was defined as old growth and logged forest
in some articles, but the definition included agro-forest in others. In the study that defined forest
as old growth and logged forest, the researchers estimated that 43% of oil palm plantations
resulted in deforestation, while the other study that included agro-forest in their definition
estimated 90% of plantations were established at the expense of forests (Gaveau et al. 2016).
Government based organizations also have a differentiating definition of forest in their
published reports. The Food and Agriculture Organization defines forest as “naturally
regenerated forests of native tree species, in which there are no clearly visible indications of
human activity and ecological processes are not significantly disturbed” (Murdiyarso et al.
2011). It was found in a study by Murdiyarso et al. (2011) that this definition signifies old
growth forests that have experienced little to no anthropogenic influences with high species
richness.
This limitation also has affected the policy reform within progressive movements in
Southeast Asia. In regards to the moratorium in Indonesia, there were mixed interpretations on
the terminology used in the Letter of Intent and Inpres No. 10/2011. The moratorium applied to
“primary natural forests” and peatlands; however the LoI called for the protection of “natural
forests” (Murdiyarso et al. 2011; Austin et al. 2014; Kissinger 2016). The ambiguity on these
definitions affected the scope of what was protected under the moratorium. As a result, the areas
of forest protected were limited to those without any licensing application or logging roads. The
new term, (primary natural forest), excludes disturbed and secondary forests. Any secondary,
logged, or agro-forests within the moratorium boundaries will not be protected based on the
definition of “primary natural forests.” Secondary forests contribute to more than half of

52
Indonesia’s forested areas (41.4 Mha), other disturbed forested areas contribute 5.3 Mha, and
both hold higher carbon stocks than oil palm plantations (Murdiyarso et al. 2011). By not
including these areas in the moratorium, Indonesia is at a loss of at least 46.7 Mha of carbon, and
biodiversity rich forests (Murdiyarso et al. 2011). The differentiating definitions in these
documents could lead to discrepancies within future government based climate change
mitigation plans.
c. Emission ambiguity:
For the purpose of this literature analysis, emissions were distinguished between the
deforestation of various forest types, the degradation of peatlands, and fire-related conversion.
The emissions as a result of conversion via fire techniques were analyzed as a separate entity to
highlight the distinct impact these fires have had on tropical ecosystems dominated by oil palm
monoculture. Many authors generalize their analysis of carbon emissions and disregard the
emissions from different forest ecosystems. As presented in the evidence, intact forests, logged
forests, agro-forests and tropical peatlands emit different levels of CO2-eq during deforestation
and land conversion processes; by considering these various forest types as a single stratum it
makes data analysis less transparent. Many publications have outlined their use of LANDSAT,
synthetic aperture radar (SAR), or Palsar/Palsar-2 satellite programs in an attempt to gain the
best estimate for emissions data, as these programs have been recognized to have more accurate
sensors. However, as a result of these uncertainties, researchers and recent publications have
relied on the data presented in long-term studies and literature surveys (Hamdan et al. 2016).
Accurate, detailed data on these emissions have not been readily available.
There are numerous sources of error when analyzing CO2-eq emissions, which has
caused discrepancy in data amongst researchers, such as the underestimation or exclusion of
emissions from the conversion and degradation of tropical peatlands for oil palm cultivation. One
example of this ambiguity was discussed in Page et al. (2011); the researchers describe how
emissions from oil palm plantations were calculated to be approximately one-quarter (18.4 Mt
CO2-eq/ha/year) of the value outlined by the IPCC in 2006; however, this approximation is
expected to be underestimated because CO2-eq emissions from the conversion and drainage of
peatlands were not included based on the assumption that oil palm monoculture required less soil
disturbance at the time the study was conducted (Page et al. 2011).

53
Many analyses use closed-chamber methods to measure CO2-eq emissions from the
degradation of tropical peatlands and agricultural cultivation, however there are limitations in the
results based on the analytical methodology (Kutzbach et al. 2007; Fargione et al. 2008; Page et
al. 2011; Koh et al. 2011). Closed-chamber methods analyze atmospheric concentrations within a
free-flowing, non-steady state. The air sample is injected into a chamber and the CO2-eq flux is
estimated based on the change during circulation (Riederer et al. 2014). The rate of CO2-eq
accumulation or depletion is quantified based on a set time parameter. Closed-chamber methods
are typically used due to their low cost and short-term analytical run time (Kutzbach et al. 2007;
Page et al. 2011; Riederer et al. 2014); however, these could also be disadvantageous as they can
result in errors. The short-term analysis minimizes the accuracy of emissions due to the changing
CO2-eq fluxes between the time period that is sampled as well as soil, vegetation and
atmospheric composition (Kutzbach et al. 2007; Riederer et al. 2014). Due to the sensitivity of
atmospheric conditions, closed-chamber fluxes vary on sampling time that the analysis is
conducted. Researchers have found that fluxes are greater in the late afternoon during surface
cooling or times of high wind velocity, while the evenings have higher variability but more
stable data (Riederer et al. 2014).
Literature on the emissions of tropical peatlands as a result of the palm oil industry
conversion process usually report either direct measurements of fluxes within closed-chamber
analyses or an estimation of carbon loss. Studies that have based their results on just closed-
chamber methods have been considered insufficient due to the constant change in flux values and
the exclusion of CO2-eq emissions strictly from tropical peatland degradation (Page et al. 2011;
Riederer et al. 2014). The underestimation of emissions from tropical peatland conversion within
previous assessments has consequences for future models of land use impacts from the oil palm
industry and the policies that would be associated with decreasing these emissions (Kutzbach et
al. 2007; Page et al. 2011). To improve these analyses, long-term studies (over a period of years)
need to be conducted and the accurate measurement of peatland density and actual carbon
concentration should be involved.
d. Exclusion of aboveground biomass and carbon sequestration potential
within literature:
The impact on carbon stocks from land use change for oil palm monoculture has been
disputed because the establishment of plantations removes the present aboveground carbon

54
stocks; however, plantations also promote the storage of carbon through crop cultivation. Carbon
stocks in tropical ecosystems usually consist of the aboveground living biomass (AGB),
belowground living biomass, detritus, and soil organic matter (Gibbs et al. 2007; Hamdan et al.
2016). There is a consensus across the literature that aboveground biomass is the largest carbon
stock that is directly affected by deforestation and degradation. It is estimated that the transition
from forest to oil palm cultivation results in a reduction of the carbon stock of the area converted
by more than 50%, and AGB contributes to 89% of this carbon loss (Morel et al. 2011; Kusin et
al. 2016). A recent study, conducted by Kusin et al. (2016), estimated through a soil carbon
content analysis that carbon stocks in areas converted for oil palm monoculture and logged
forests are approximately -99 t CO2-eq/ha and 473 t CO2-eq/ha respectively, resulting in a carbon
debt within oil palm plantations. Intact forests are expected to have the highest levels of AGB,
although logged forests have been found to have similar levels depending on when it was logged
and the intensity of the degradation (Morel et al. 2011). The regrowth after forest degradation,
specifically secondary forests, also contribute to carbon stock estimates, however, they are
usually analyzed among other forest types.
The inclusions of diameter at breast height (DBH) and tree height estimations are also
important measurements for AGB calculations (Gibbs 2007; Morel et al. 2011; Abram et al.
2016). Oil palm plantations, and other large-scale agriculture, remove the largest trees from the
region (i.e. trees from the Dipterocarpaceae family). Morel et al. (2011) found that there is a
positive correlation between height measurements and biomass estimations since the DBH can
be used to explain 95% of variation in AGB and carbon stocks in tropical ecosystems. The
researchers concluded that AGB equations that included DBH and overall tree height result in a
more accurate analysis than those conducted without this variable.
Many carbon stock estimations are made based on previous academic studies or the
generalization of data from country-level estimates such as the FAO (Gibbs et al. 2007). These
estimations may cause gaps in data as different studies use different methods for estimating
carbon stocks and levels of AGB, or rely on anecdotal data. However, studies found during the
literature analysis that investigate these parameters use allometric functions to estimate
aboveground biomass. Due to the protracted and costly nature of developing species-specific
allometric relationships, as tropical ecosystems hold over 300 species of trees, using generalized

55
allometric functions by grouping forest types has been considered highly effective in estimating
AGB (Gibbs 2007; Hamdan et al. 2011).
As seen with measuring the extent of deforestation, challenges in mapping AGB and
other carbon stocks are a result of the complexity of canopy structures causing uncertainties in
satellite imagery (Morel et al. 2011; Gibbs et al. 2007; Hamdan et al. 2016). Although there is no
exact methodology to measure carbon stocks on forests, the use of SAR and LiDAR assist
researchers in better estimations for AGB, as they are more sensitive to complex forest structures
especially when analyzing tropical peatlands (Gibbs et al. 2007; Morel et al. 2011; Hamdan et al.
2016). Many studies do not address these parameters when looking at the carbon emissions from
the conversion and production processes of the oil palm industry due to their uncertainties;
however, recent publications outline that these parameters are critical to consider, especially
within tropical peatlands where soils are a massive carbon sink and source of emissions
following deforestation (Gibbs 2007; Morel et al. 2011). The analysis of AGB and other carbon
stocks would give future studies a more accurate representation of carbon emissions that result
from the oil palm industry.
5.3 Efforts to reduce emissions:
Both Malaysia and Indonesia have committed to United Nations Framework Convention
on Climate Change (UNFCCC) and programs within it, such as Reducing Emissions from
Deforestation and Degradation, and Forest Conservation (REDD+). There is a wide range of
intergovernmental cooperation with regards to mitigating greenhouse gas emissions and reducing
deforestation that are outside the scope of this analysis. For the purpose of this paper, the
REDD+ program and association with the UNFCCC were the main focus. The REDD+ program
was adopted at the 13th Session of the Conference of Parties in 2007 (Murdiyarso et al. 2011).
This program aims to mitigate increasing greenhouse gas emissions through reducing
deforestation while providing incentives. Countries that display a reduction in emissions and the
conversion of land are financially rewarded based on the extent of the remedial actions taken and
the resulting reductions.
REDD+ is an extension of the originally proposed REDD program, and was finalized in
2010 at the Cancun Agreements (REDD Desk 2016). Initially REDD was focused on just
reducing emissions from deforestation and degradation, however REDD+ incorporated the

56
conservation and enrichment of forest carbon stocks and the sustainable management of forests
(Parker et al. 2009). The reason for expanding the original program to REDD+ was to provide
benefits to countries that already exhibit low emission and deforestation rates and promote
conservation within these areas (Campbell 2009). Originally, programs that put a hold on further
deforestation were excluded from the first commitment period of the Kyoto Protocol because
government representatives were concerned with the procedures to measure emissions and
reduction, and the effect on national economies (Gibbs et al. 2007). However, within Malaysia
and Indonesia specifically, the REDD+ program has the ability to supply incentives to
government representatives, oil palm stakeholders and landowners that would promote the
conservation of forests and the ecosystem services they provide (Abram et al. 2016).
There have been disputes as to whether or not the REDD+ program is feasible for the oil
palm industry, based on the price of carbon credits compared to the profits made per ton of oil
palm produced. Recent studies have concluded that REDD+ incentives are a feasible option for
conservation, especially for tropical peatlands (Abood et al. 2015). Tsujino et al. (2016) found
that the carbon-rich nature of peatlands outcompete current carbon credit prices and costs of
industrial land use, therefore REDD+ would be a practicable program for countries with high
CO2-eq emissions and significant amounts of peatland landscape. The implementation of this
program could also assist local communities by enforcing land tenure rights to local landowners
(Abram et al. 2016). On the other hand, there are challenges with the framework of REDD+. For
example, the definition of policies and management are imperative for the successful
implementation of this program as it includes stakeholders at national, sub-national, district,
local, government and private levels (Abram et al. 2016). These parameters must be determined
for the overall benefit of the countries involved. Overall, the REDD+ program has the potential
to contribute significantly to the success of climate change mitigation through providing
countries with a financially beneficial opportunity to reduce their greenhouse gas emissions
while conserving the biodiversity of their nations.
a. Malaysia:
Malaysia became a ratified party of the UNFCCC in 1994 and then ratified the Kyoto
Protocol in 2002 (UNFCCC Malaysia 2011). The Malaysian government has committed to
reducing national carbon emissions levels by 45% by 2030, compared to 2005 levels (Abram et
al. 2016; Gill et al. 2017). Although Malaysia has not committed to a moratorium to halt future

57
deforestation and land conversion for oil palm monoculture, the government has moved towards
mitigating these issues in other ways. In Malaysia’s Second National Communication to the
UNFCCC, the government agreed to practice Reduced Impact Logging and Sustainable Forest
Management to decrease deforestation while maintaining 50% of land area as forest in an
attempt to reduce carbon emissions (UNFCCC Malaysia 2011; REDD Desk 2016). It is
estimated that a 1% and 5% reduction in the current deforestation rate can reduce approximately
3.34 Mt and 16.68 Mt of CO2-eq annually until 2030 (UNFCCC Malaysia 2011).
The sequestration of forests in Malaysia also plays a role in these decreased emission
rates as Malaysia has had a history of sequestration positively benefiting their overall emissions.
Although carbon emissions were approximately 223 Mt CO2-eq in 2000, sequestration removal
was estimated to be 249.7 Mt of CO2-eq, concluding that Malaysia was a net carbon sink during
that time (UNFCCC Malaysia 2011); following that period, they transitioned into a net emitter.
This change was a result of increases in emissions from the energy and agriculture sectors
(UNFCCC Malaysia 2011).
The Malaysian government has made progress towards their goal through the
implementation of the REDD+ program; however, the state of Sabah has had more success in
developing REDD+ than the state of Sarawak. Sabah is a recipient of sub-national and state
funded REDD+ projects (Abram et al. 2016). The Sabah Forestry Department has been working
alongside World Wildlife Fund in carbon emission assessment methodologies as well as the
appropriate legal and policy structure for financing the progression of REDD+ (REDD Desk
2016). Sabah has received support through other international organizations, such as the United
Nations Development Programme and Forest Stewardship Council. Sabah has also received
funding from the European Union on their ‘Tackling Climate Change through Sustainable Forest
Management and Community Development’ program (REDD Desk 2016). Malaysia has faced
many challenges in the progression of emission mitigation programs, such as gender
discrimination when discussing native peoples rights to land, although they have worked towards
alleviating this issues in their continuing program drafts. Malaysia’s third draft of the National
Communications to the UNFCCC promotes gender equality for the adaption of climate change
and mitigation (REDD Desk 2016). Through the resolution and enactment of mitigation
programs, such as REDD+, and their commitment to decreased deforestation rates, Malaysia has
the potential to make significant changes in their emissions prior to 2030.

58
b. Indonesia:
In Indonesia, the Yudhyono government developed national and provincial climate
change mitigation plans to reduce carbon emissions beginning in the early 2000’s (Murdiyarso et
al. 2011; UNFCCC Indonesia 2011; Michaelowa and Michaelowa 2015). These progressive
movements within the Indonesian government led to long-term commitments to reduce
emissions and deforestation across the country. During their initial agreement with the UNFCCC
in 2009, Indonesia committed to reduce greenhouse gas emissions 26% by 2020, and up to 41%
if other countries provided support (Murdiyarso et al. 2011; UNFCCC Indonesia 2011; Austin et
al. 2014). This international assistance includes an official Letter of Intent (LoI) with the
Kingdom of Norway, signed on May 26, 2010, and US $1 billion to Indonesia in support of their
actions (Murdiyarso et al. 2011). In this LoI, Indonesia agreed to: the development of a national
REDD+ strategy, the establishment of an agency to implement emission reduction strategies,
develop policy enforcements - which included a two-year suspension of all new plantation
development and the conversion of forests and tropical peatlands (Murdiyarso et al. 2011;
UNFCCC 2011). In their agreement, the Indonesian government outlined that their goal would
be achieved through:
• Sustainable tropical peatland management;
• A reduction in the rate of deforestation and land degradation;
• The development of carbon sequestration projects in forestry and agriculture;
• The promotion of energy efficiency;
• The development of alternative and renewable energy sources;
• A reduction in solid and liquid waste;
• Shifting to low-emission modes of transport.
President Yudhoyono also committed to making sure all actions taken would have proper
monitoring systems and accurate reports that assisting countries would need to verify funding.
In May 2011, the Indonesian government released a document, known as Inpres No.
10/2011, which announced a forest moratorium that would be implemented to meet the
requirements of the LoI (Murdiyarso et al. 2011; Austin et al. 2014). Inpres No. 10/2011 not only
implemented a moratorium to reduce deforestation and degradation of forests and peatlands; it
suspended new concession licenses for agriculture, including oil palm, and promoted the
scientific analysis of the areas to allow the development of better management practices. Any

59
concession licenses, or land grants, that had been approved prior to the Inpres being formally
announced are exempt from the moratorium.
The coverage of this moratorium has been questioned as different stakeholders had given
different estimates when it was first announced. An advisor from the President’s council told the
public that the land protected by the moratorium would be as much as 96 Mha, however, the
Secretary-General of the Ministry of Forestry publically stated at a different time that only 72
Mha of land would be protected, 55 Mha of primary forest and 17 Mha of tropical peatlands
(Murdiyarso et al. 2011). Later, a digital analysis constructed the Indicative Moratorium Map
(IMM) and the actual coverage of the moratorium was approximately 46 Mha; however, recent
analysis suggests that the extent of forests and peatlands protected by the moratorium is closer to
66 Mha (Murdiyarso et al. 2011). Currently, there are approximately 28.4 Mha of primary forest
and 14.9 Mha of tropical peatlands within the IMM (Austin et al. 2014). Although there were
discrepancies on the definition of forest between the LoI and Inpres No. 10/2011, the Inpres No.
10/2011 implied that the moratorium will cover all peatlands regardless of their type, depth,
location, jurisdiction or level of disturbance within the IMM; previously regulations from the
Ministry of Agriculture only protected tropical peatlands that were deeper than 3 m (Murdiyarso
et al. 2011).
Peatlands in Southeast Asia are believed to be one of the largest storage locations of
terrestrial carbon, with an estimated 42,000 Mt of carbon across 12% of the region (Tonks et al.
2017). The level of degradation as a result of oil palm industry expansion thus far has had long-
term effects on tropical peatlands, such as the continuation of the emission of greenhouse gases
after a halt on conversion processes. By allowing the moratorium to cover all peatlands within
the IMM, the Indonesian government is making a progressive move to reduce emissions and
prevent further environmental degradation, to the physical nature of peatlands and the carbon
storage potential. The moratorium was renewed in 2013 and then again in 2015, concluding there
are positive developments within the government towards the reduction of emissions and
deforestation.
6. Recommendations

60
It is evident there is an increase in CO2-eq emissions as a result of the expanding oil palm
industry in tropical regions, specifically Southeast Asia. Current environmental policies are
progressing in terms of reducing these emissions and reducing the deforestation and degradation
of forests and tropical peatlands. However, it can be concluded that due to the rising demand for
oil palm there will be a continuing increase in emissions. Based upon the evidence from the
literature analysis in Section 4, I recommend the following measures:
1. Discontinue oil palm expansion on unsuitable land
a. Transition away from tropical peatlands
b. Establishment of plantations on already deforested or degraded land
c. Unsuitable lands could hinder overall oil palm profits
As discussed previously, the rapid expansion of the oil palm industry has resulted in
cultivation on lands that are unsuitable for production, especially within floodplain regions and
over tropical peatlands. By discontinuing this expansion on land that is unable to support oil
palm monoculture, CO2-eq emissions and overall degradation of land could decrease. Tropical
peatlands should be of major conservation concern since they can assist in the mitigation of oil
palm related and atmospheric CO2-eq levels. As seen in the evidence, the conversion and
cultivation of tropical peatlands contributes significantly to overall carbon emissions; therefore,
land suitability is imperative to analyze for the future of oil palm plantations and the reduction of
emissions. Recent studies suggest that if the conversion of peatlands to oil palm plantations
seize, over a 100-year period, 4,600 Mt CO2-eq/ha could be avoided, based on moderate climate
patterns (Warren et al. 2016). Comparatively, Reijnders and Huijbregts (2008) found that if oil
palm plantations were to expand on non-peatland soils, emissions during production could result
in a decrease of 1.6 - 7 tons of CO2-eq per ton of CPO produced, based on the size of the
plantation and productivity rates.
The use of already degraded land, or previously abandoned plantations, could also aid in
the reduction of emissions. It was concluded from the literature analysis that the conversion of
former rubber plantations may prove beneficial to emission factors and increase carbon stocks by
approximately 20%, compared to the carbon loss of 50% from the conversion of forest to oil
palm monoculture (Kusin et al. 2016). By expanding plantations on already degraded land, intact

61
forests, logged forests, agro-forests and tropical peatlands have the ability to retain carbon
storage and regain ecosystem services that may have been lost in previous conversion processes.
An analysis of land suitability could be beneficial for not only the ecosystem, but also the
economy within Southeast Asia. For example, within Sabah, Malaysian Borneo, 54-68% of the
251,000 ha of land cultivated for oil palm is unsuitable for production, primarily due to flooding
(Abram et al. 2014; Abram et al. 2016). Abram et al. (2014) estimated 66% of the remaining
uncultivated land in the area is unsuitable for oil palm production based on CART analysis.
However, more than 64% of those lands are already alienated for oil palm and 11% were in the
process of conversion as of 2014 (Abram et al. 2014; Abram et al. 2016). The continuation of
converting these lands could become more costly than profitable for the oil palm industry due to
financial losses from underproduction and palm mortality. It is estimated that 51,466 ha of
overall oil palm plantations are under-producing, and 15,810 hectares experience palm mortality
annually (Abram et al. 2014). As a result of these losses, plantations experience up to $299 per
hectare per year, totaling annual losses to be approximately $4.7 million (Abram et al. 2014;
Vogel 2016). Rather than continuing cultivation on unsuitable soil every year, oil palm
stakeholders should seize replanting within these areas and the financial losses could be used to
integrate more sustainable production methods or restore unsuitable areas. It costs approximately
$3,100 to restore one hectare of land through replanting and other regeneration methods (Vogel
2016). The financial losses in this area could restore approximately 1,351 hectares of land every
year, which would assist in the country's goal to combat the increase in carbon emissions (Vogel
2016).
2. Movement towards sustainable production
a. Stricter regulations on fire-related conversion processes
b. Certification process from RSPO
The production of oil palm has gone through scrutiny over the use of sustainable
practices, leading to the development of the RSPO. The Roundtable of Sustainable Palm Oil is
an association comprised of palm oil industry representatives, manufacturers, and other
stakeholders to promote the sustainable production of oil palm. As of 2012, only 15% of oil palm
plantations in Indonesia were RSPO certified (Greenpeace 2013). A movement towards
becoming sustainably certified is recommended for the remaining oil palm industries within

62
Southeast Asia. This transition could assist with increasing production levels to meet the global
demand of oil palm. As discussed in section 2.2, the high demand of oil palm will result in
further expansion and establishment of the oil palm industry within Southeast Asia; therefore
developing sustainable practices for the new plantations will prove beneficial to meet these
demands. To successfully implement these strategies, stakeholders involved with the oil palm
industry will need to collaborate and create new management strategies, and there will have to be
cooperation among all parties involved.
While developing new management strategies, it is imperative that the oil palm industry
takes conservation into account. The rate of deforestation and degradation within forests and
tropical peatlands have had significant effects on the ecosystem services and biodiversity within
the area and these factors need to be of more concern. By involving themselves with programs,
such as REDD+ and the Indonesian moratorium, Southeast Asian countries will be able to
combat some of the long-term effects, while progressively moving towards preventing future
damage. Within the certification process, the RSPO has criteria that plantations must meet that
would benefit future conservation efforts of biodiversity and ecosystem services; for example,
the negative impacts on from the plantation in question to the surrounding environment, such as
habitat and species richness, are assessed. I recommend that all future oil palm plantations, and
those in the process of establishment, undergo an environmental assessment and sustainability
certification process.
I also recommend discontinuing all fire-related conversion techniques. Land clearing by
fire puts the area at risk for wildfires and severe degradation, seen in the tropical peatland
degradation that results and Indonesia’s fire crisis discussed in section 2.6. By discontinuing fire-
related clearing, there is a greater probability that the natural resources and biodiversity can
regenerate while mitigating the increasing carbon emissions. For example, eliminating the use of
fires could reduce emissions by 52% over a 100-year period, equivalent to 2,000 Mt CO2-eq per
hectare (Warren et al. 2016). Also, since fire-related clearing increases the risk of wildfires,
especially from the conversion of tropical peatland soils, a transition to more sustainable
conversion processes will decrease this risk. Comparatively, this decrease in the wildfire risk is
beneficial for the neighboring communities whose homes and land have been affected by the
wildfires in recent years. The RSPO bans the use of fire for land clearing, so affiliating oil palm

63
plantations with the sustainability certification process will improve future land clearing by
promoting less damaging conversion tactics.
3. For already established plantations, a conversion from wet to dry extraction processes
a. A conversion of processes could increase oil extraction rates (OER)
b. Overall decrease in CO2-eq emissions
As discussed in section 4.2, the transition from wet to dry extraction could prove
beneficial for high CO2-eq emitting oil palm plantations. Due to the emission factors involved in
wet processes, such as wastewater treatment, emissions are higher and oil extraction rates are
lower than the dry process. Refer to section 4.2 for the statistics as to why I made this
recommendation. The literature does not define the financial cost for oil palm plantations to
move towards dry extraction. Therefore, further economic feasibility studies should be
conducted to determine the possibility for oil palm plantations to make this transition.
Comparatively, dry extraction can assist in increasing oil palm production through higher
oil extraction rates. Since dry processes have a more efficient OER (by 3.3 - 8.3% respectively),
it can be concluded that oil palm plantations that undergo conversion will increase production
and generate more revenue than those with lower efficiency production rates from lower
extraction. As I outlined in section 2.3 and 5.2, the oil palm industry has a strong correlation to
government representatives. This increase in production and revenue could prove beneficial for
not only oil palm stakeholders, but also the national economy through increased exports. If this
recommendation is implemented, it can be assumed that the decrease in emissions would assist
in climate change mitigation programs within oil palm dominated landscapes, such as REDD+,
and contribute to national goals of reducing overall emission levels.
7. Conclusions
The oil palm industry has been growing at alarming rates within tropical regions globally,
but especially in Malaysia and Indonesia. During this expansion, plantations have been
established at the expense of intact forests, logged forests, agro-forests and tropical peatlands.
The rising deforestation and degradation rates that have resulted from this expansion have
significantly hindered these valuable and essential ecosystems and their services. Comparatively
to deforestation and tropical peatland degradation, fire-related conversion has also had increasing

64
negative effects on tropical ecosystems. Burning large scales of land as a quick solution for
clearing areas for oil palm cultivation has proved to be extremely harmful with little or no
benefit, as it emits at least twice the amount of CO2-eq than natural draining or clearing and
increases the risk of wildfires. Additionally, this practice alters soil hydrology, nutrient loading,
and overall quality to the detriment of entire regions that were previously pristine tropical
rainforests. This method increases exposes large swaths of unprotected soil, increasing erosion
rates and exasperating the problem of nutrient loading in already low-nutrient soils. Using these
“slash and burn” clearing methods ultimately makes recovery and restoration efforts extremely
expensive and difficult, given the degradation of the soils throughout the study area.
In addition, the rising carbon emissions because of the conversion and production of land
for oil palm monoculture have contributed an increase to overall global climate emissions.
However, these carbon emissions not only affect atmospheric carbon levels, but also the
biodiversity of the region. Flora and fauna across Southeast Asia face challenges from the
increase in CO2-eq because of saturation of this gas that can overwhelm plant respiratory
metabolic processes. The increased atmospheric CO2 levels that lead to warming also affect plant
communities due to the interference with temperature dependent lifecycles, or other phenological
considerations. Many government and non-profit organizations have worked progressively
towards mitigating these emissions, providing incentives for oil palm stakeholders; however,
there is still much to be accomplished by way of implementation of these programs, or
enforcement of rules (and subsequent sanctions for violations). By continuing with these
programs, and providing economic incentives, the oil palm industry across Southeast Asia has
the potential to assist their national governments in reaching their carbon emission goals,
discussed in section 5.3.
It can be concluded that further studies must be conducted to provide accurate data on
parameters of deforestation, increased CO2 effects, and the feasibility of oil palm restoration in
highly altered areas. As discussed in section 5, there are various data gaps that cause ambiguity
within this area of research, largely due to governmental malfeasance. Further investigations into
tropical peatlands, specifically their soils, and fire related conversion processes, as separate
entities would provide scientists and oil palm stakeholders with clear data to use in developing
carbon emission mitigation strategies. In addition, the inclusion of aboveground biomass and
carbon stocks within study regions would be beneficial for future studies.

65
Although it is questionable whether the current damage can be remediated, there is hope
within the scientific community that these tropical regions have not passed a critical “point of no
return” where total ecosystem collapse is inevitable, and ecosystem services, species richness,
and biodiversity are irreversibly altered. By reducing deforestation and ecosystem degradation
within tropical ecosystems, putting an end to fire-related clearing techniques, and discontinuing
building oil palm plantations on unsuitable lands, oil palm industry stakeholders are giving the
region an opportunity to naturally regenerate. This demonstrates to stakeholders, and ultimately
end use consumers, that this industry can be responsible environmental stewards. Tropical
ecosystems hold the highest levels of biodiversity and ecosystem services globally while serving
as a natural climate regulator, and therefore it should be of upmost concern to protect them.

66
References:
Abood, S. A., J. S. H. Lee, Z. Burivalova, J. Garcia-Ulloa, and L. P. Koh. 2015. Relative
contributions of the logging, fiber, oil palm, and mining industries to forest loss in Indonesia.
Conservation Letters 8:58-67.
Abdullah, S. A., and N. Nakagoshi. 2007. Forest fragmentation and its correlation to human land
use change in the state of Selangor, peninsular Malaysia. Forest Ecology and Management
241:39-48.
Abram, N. K., P. Xofis, J. Tzanopoulos, D. C. MacMillan, M. Ancrenaz, R. Chung, L. Peter, R.
Ong, I. Lackman, B. Goossens, L. Ambu, and A. T. Knight. 2014. Synergies for improving oil
palm production and forest conservation in floodplain landscapes. PLoS One 9:1-12. [doi:
10.1371/journal.pone.0095388]
Abram, N. K., D. C. MacMillan, P. Xofis, M. Ancrenaz, J. Tzanopoulos, R. Ong, B. Goossens,
L. P. Koh, C. Del Valle, L. Peter, A. C. Morel, I. Lackman, R. Chung, H. Kler, L. Ambu, and W.
Baya. 2016. Identifying where REDD+ financially out-competes oil palm in floodplain
landscapes using a fine-scale approach. PLoS One 11:1-231. [doi:
10.1371/journal.pone.0156481].
Adachi, M., A. Ito, A. Ishida, W. R. Kadir, P. Ladpala, and Y. Yamagata. 2011. Carbon budget
of tropical forests in Southeast Asia and the effects of deforestation: An approach using a
process-based model and field measurements. Biogeosciences Discussions 8:3051-3079.
Aide, T. M., J. K. Zimmerman, J. B. Pascarella, L. Rivera, and H. Marcano‐ Vega. 2000. Forest
regeneration in a chronosequence of tropical abandoned pastures: Implications for restoration
ecology. Restoration Ecology 8:328-338.
Ali, M., D. Taylor, and K. Inubushi. 2006. Effects of environmental variations on CO2 efflux
from a tropical peatland in Eastern Sumatra. Wetlands 26:612-618.
Asian Elephant Support. The Palm Oil Crisis. (n.d.). Asian Elephant Support.
http://www.asianelephantsupport.org/the-palm-oil-crisis/. Accessed on 04/09/2017.
Austin, K., A. Alisjahbana, T. Darusman, R. Boediono, B. E. Budianto, C. Purba, G. B. Indrarto,
E. Pohnan, A. Putraditama, and F. Stole. 2014. Indonesia's forest moratorium: Impacts and next
steps. Washington DC: World Resources Institute. www.wri.org. Accessed on 04/10/2017.
Azizi, C. Y. M., M. N. Azian, M. Y. Harun, and M. H. S. Ismail, editors. 2015. Simulation of
palm oil expression in screw press using computational fluid dynamics: Laying the foundation.
2015 10th Asian Control Conference (ASCC), Sabah, Malaysia:1-7. [doi:
10.1109/ASCC.2015.7244909]
Baccini, A., S. J. Goetz, W. S. Walker, N. T. Laporte, M. Sun, D. Sulla-Menashe, J. Hackler, P.
S. A. Beck, R. Dubayah, M. A. Friedl, S. Samanta, and R. A. Houghton. 2012. Estimated carbon

67
dioxide emissions from tropical deforestation improved by carbon-density maps. Nature Climate
Change 2:182-185.
British Broadcasting Corporation (BBC) News. 2013. South East Asia haze: What is slash-and-
burn? http://www.bbc.com/news/business-23026219. Accessed on 02/12/2017.
Bunchai, A., O. Suttinun, A. H-Kittikun, and C. Musikavong. 2016. Life cycle greenhouse gas
emissions of palm oil production by wet and dry extraction processes in Thailand. International
Journal of Life Cycle Assessment:1-13. [doi: 10.1007/s11367-016-1232-4].
Butler, R. A., and W. F. Laurance. 2009. Is oil palm the next emerging threat to the Amazon?
Tropical Conservation Science 2:1-10. [doi: 10.1177/194008290900200102].
Campbell, B. M. 2009. Beyond Copenhagen: REDD+, agriculture, adaptation strategies and
poverty. Global Environmental Change 19:397-399.
Carlson, K. M., L. M. Curran, D. Ratnasari, A. M. Pittman, B. S. Soares-Filho, G. P. Asner, S. N.
Trigg, D. A. Gaveau, D. Lawrence, and H. O. Rodrigues. 2012. Committed carbon emissions,
deforestation, and community land conversion from oil palm plantation expansion in West
Kalimantan, Indonesia. Proceedings of the National Academy of Sciences of the United States of
America 109:7559-7564.
Carlson, K. M., L. M. Curran, G. P. Asner, A. M. Pittman, S. N. Trigg, and J. Marion Adeney.
2012. Carbon emissions from forest conversion by Kalimantan oil palm plantations. Nature
Climate Change 3:283-287.
Chazdon, R. L., E. N. Broadbent, D. M. A. Rozendaal, F. Bongers, A. M. A. Zambrano, T. M.
Aide, P. Balvanera, J. M. Becknell, V. Boukili, P. H. S. Brancalion, D. Craven, J. S. Almeida-
Cortez, G. A. L. Cabral, B. de Jong, J. S. Denslow, D. H. Dent, S. J. DeWalt, J. M. Dupuy, S. M.
Durán, M. M. Espírito-Santo, M. C. Fandino, R. G. César, J. S. Hall, J. L. Hernández-Stefanoni,
C. C. Jakovac, A. B. Junqueira, D. Kennard, S. G. Letcher, M. Lohbeck, M. Martínez-Ramos, P.
Massoca, J. A. Meave, R. Mesquita, F. Mora, R. Muñoz, R. Muscarella, Y. R. F. Nunes, S.
Ochoa-Gaona, E. Orihuela-Belmonte, M. Peña-Claros, E. A. Pérez-García, D. Piotto, J. S.
Powers, J. Rodríguez-Velazquez, I. E. Romero-Pérez, J. Ruíz, J. G. Saldarriaga, A. Sanchez-
Azofeifa, N. B. Schwartz, M. K. Steininger, N. G. Swenson, M. Uriarte, M. van Breugel, H. van
der Wal, M. D. M. Veloso, H. Vester, I. C. G. Vieira, T. V. Bentos, G. B. Williamson, and L.
Poorter. 2016. Carbon sequestration potential of second-growth forest regeneration in the Latin
American tropics. Science Advances 2:1-10. [doi: 10.1126/sciadv.1501639].
Chiew, Y. L., and S. Shimada. 2013. Current state and environmental impact assessment for
utilizing oil palm empty fruit bunches for fuel, fiber and fertilizer: A case study of Malaysia.
Biomass and Bioenergy 51:109-124.
Corley, R. H. V. 2009. How much palm oil do we need? Environmental Science and Policy
12:134-139.

68
Cruz, R.V., H. Harasawa, M. Lal, S. Wu, Y. Anokhin, B. Punsalmaa, Y. Honda, M. Jafari, C. Li
and N. H. Ninh. 2007. Asia. Pages 469-506 in M.L. Parry, O.F. Canziani, J.P. Palutikof, P.J. van
der Linden and C.E. Hanson, editors. Climate change 2007: Impacts, adaptation and
vulnerability: Contribution of working group II to the fourth assessment report of the
Intergovernmental Panel on Climate Change. Cambridge University Press, Cambridge, United
Kingdom and New York, NY, USA.
Edwards, F. A., D. P. Edwards, T. H. Larsen, W. W. Hsu, S. Benedick, A. Chung, C. Vun Khen,
D. S. Wilcove, and K. C. Hamer. 2014. Does logging and forest conversion to oil palm
agriculture alter functional diversity in a biodiversity hotspot? Animal Conservation 17:163-173.
Englund, O., G. Berndes, U. M. Persson, and G. Sparovek. 2015. Oil palm for biodiesel in Brazil
— risks and opportunities. Environmental Research Letters 10:1-10. [doi: 10.1088/1748-
9326/10/4/044002].
Evers, S., C. M. Yule, R. Padfield, P. O'Reilly, and H. Varkkey. 2016. Keep wetlands wet: The
myth of sustainable development of tropical peatlands - implications for policies and
management. Global Change Biology 23:534-549.
Fargione, J., J. Hill, D. Tilman, S. Polasky, and P. Hawthorne. 2008. Land clearing and the
biofuel carbon debt. Science 319:1235-1238.
Feng, Z., T. Rütting, H. Pleijel, G. Wallin, P. B. Reich, C. I. Kammann, P. C. D. Newton, K.
Kobayashi, Y. Luo, and J. Uddling. 2015. Constraints to nitrogen acquisition of terrestrial plants
under elevated CO2. Global Change Biology 21:3152-3168.
Fitzherbert, E. B., M. J. Struebig, A. Morel, F. Danielsen, C. A. Brühl, P. F. Donald, and B.
Phalan. 2008. How will oil palm expansion affect biodiversity? Trends in Ecology & Evolution
23:538-545.
Gaveau, D. L. A., D. Sheil, Husnayaen, M. A. Salim, S. Arjasakusuma, M. Ancrenaz, P.
Pacheco, and E. Meijaard. 2016. Rapid conversions and avoided deforestation: Examining four
decades of industrial plantation expansion in Borneo. Scientific Reports 6:1-13. [doi:
10.1038/srep32017].
Gibbs, H. K., S. Brown, J. O. Niles, and J. A. Foley. 2007. Monitoring and estimating tropical
forest carbon stocks: Making REDD a reality. Environmental Research Letters 2:1-13. [doi:
10.1088/1748-9326/2/4/045023].
Gill, A. R., and K. K. Viswanathan. 2017. A test of environmental Kuznets curve (EKC) for
carbon emission and potential of renewable energy to reduce greenhouse gases (GHG) in
Malaysia. Environment, Development, and Sustainability 3:327-349.
Gillespie, G. R., E. Ahmad, B. Elahan, A. Evans, M. Ancrenaz, B. Goossens, and M. P.
Scroggie. 2012. Conservation of amphibians in Borneo: Relative value of secondary tropical
forest and non-forest habitats. Biological Conservation 152:136-144.

69
Goh, C. S., B. Wicke, L. Potter, A. Faaij, A. Zoomers, and M. Junginger. 2017. Exploring under-
utilized low carbon land resources from multiple perspectives: Case studies on regencies in
Kalimantan. Land Use Policy 60:150-168.
Goodman, R. C., and M. Herold. 2014. Why maintaining tropical forests is essential and urgent
for a stable climate. Washington D.C.: Center for Global Development; November 4. Report nr
385:1-51. [doi: 10.2139/ssrn.2622758].
Greenpeace International. 2013. Certifying destruction. Greenpeace International, The
Netherlands. www.greenpeace.org/forests. Accessed on 02/12/2017.
Hai, T. C. 2002. The palm oil industry in Malaysia. WWF. Selangor, Malaysia:1-145.
www.assets.panda.org/downloads/oilpalmchainpartaandb_esri.pdf. Accessed on 03/16/2017.
Hamdan, O., H. A. Khali, and K. A. Rahman. 2011. Remotely sensed L-Band SAR data for
tropical forest biomass estimator. Journal of Tropical Forest Science 23:318-327.
Hamdan, O., K. A. Rahman, and M. Samsudin. 2016. Quantifying rate of deforestation and CO2
emission in Peninsular Malaysia using PALSAR imageries. IOP Science 8:1-11. [doi:
10.1088/1755-1315/37/1/012028].
Harris, N. L., S. Brown, S. C. Hagen, S. S. Saatchi, S. Petrova, W. Salas, M. C. Hansen, P. V.
Potapov, and A. Lotsch. 2012. Baseline map of carbon emissions from deforestation in tropical
regions. Science 336:1573-1576.
Heaster. J. D. 2017. Deforestation on Borneo 1973-2015. University of San Francisco Geospatial
Analysis Laboratory. CIFOR data from www.ESRIonline.com. Accessed on 04/10/2017.
Heaster. J. D. 2017. Fires near oil palm plantations and timber harvesting regions, Borneo.
University of San Francisco Geospatial Analysis Laboratory. CIFOR data from
www.ESRIonline.com. Accessed on 04/10/2017.
Heaster. J. D. 2017. Land use on Borneo. University of San Francisco Geospatial Analysis
Laboratory. CIFOR data from www.ESRIonline.com. Accessed on 04/10/2017.
Hector, A., C. Philipson, P. Saner, J. Chamagne, D. Dzulkifli, M. O'Brien, J. L. Snaddon, P.
Ulok, M. Weilenmann, G. Reynolds, and H. C. J. Godfray. 2011. The Sabah biodiversity
experiment: A long-term test of the role of tree diversity in restoring tropical forest structure and
functioning. Philosophical Transactions of the Royal Society 366:3303-3315.
Hergoualc'h, K., and L. V. Verchot. 2014. Greenhouse gas emission factors for land use and
land-use change in Southeast Asian peatlands. Mitigation and Adaptation Strategies for Global
Change 19:789-807.

70
Hooijer, A., S. Page, J. G. Canadell, M. Silvius, J. Kwadijk, H. Wösten, and J. Jauhiainen. 2010.
Current and future CO2 emissions from drained peatlands in Southeast Asia. Biogeosciences
7:1505-1514.
Hosseini, S. E., and M. A. Wahid. 2015. Pollutant in palm oil production process. Journal of the
Air and Waste Management Association 65:773-781.
Houghton, R. A., B. Byers, and A. A. Nassikas. 2015. A role for tropical forests in stabilizing
atmospheric CO2. Nature Climate Change 5:1022-1023.
Indonesian Investments. 2016. Palm oil in Indonesia. http://www.indonesia-
investments.com/business/commodities/palm-oil/item166. Accessed on 02/12/2017.
Kaewmai, R., A. H-Kittikun, and C. Musikavong. 2012. Greenhouse gas emissions of palm oil
mills in Thailand. International Journal of Greenhouse Gas Control 11:141-151.
Klaarenbeeksingel, F. W. 2009. Greenhouse gas emissions from palm oil production. 39.
Roundtable of Sustainable Palm Oil, Brinkmann Consultancy, Hoevelaken, The Netherlands.
www.rspo.org/files/project/GreenHouse.Gas.Working.Group/GHGWG-
draftrecommendations240909.pdf. Accessed on 03/12/2017.
Koh, L. P., J. Miettinen, S. C. Liew, and J. Ghazoul. 2011. Remotely sensed evidence of tropical
peatland conversion to oil palm. Proceedings of the National Academy of Sciences of the United
States of America 108:5127-5132.
Koh, L. P., and D. S. Wilcove. 2007. Cashing in palm oil for conservation. Nature 448:993-994.
Kusin, F. M., N. I. M. Akhir, F. Mohamat-Yusuff, and M. Awang. 2016. Greenhouse gas
emissions during plantation stage of palm oil-based biofuel production addressing different land
conversion scenarios in Malaysia. Environmental Science and Pollution Research 24:1-12. [doi:
10.1007/s11356-016-8270-0].
Kutzbach, L., J. Schneider, T. Sachs, M. Giebels, H. Nykänen, N. J. Shurpali, P. J. Martikainen,
J. Alm, and M. Wilmking. 2007. CO2 flux determination by closed-chamber methods can be
seriously biased by inappropriate application of linear regression. Biogeosciences 4:1005-1025.
Langner, A. and F. Siegert. 2009. Spatiotemporal fire occurrence in Borneo over a period of 10
years. Global Change Biology 15:48-62.
Latiff, A. 2000. In advances in oil research. Pages 19-38 in Y. Basiron, B. S. Jalani, and K. W.
Chan, editors. The biology of the genus Elaeis. Malaysian Palm Oil Board. [ISBN: 967-961-081-
0].
Laurance, S. G., and W. F. Laurance. 2015. Peat fires: Emissions likely to worsen. Nature
527:305. [doi: 10.1038/527305].

71
Laurance, S. G., W. F. Laurance, J. L. C. Camargo, R. C. C. Luizão, S. L. Pimm, E. M. Bruna, P.
C. Stouffer, G. Bruce Williamson, J. Benítez-Malvido, H. L. Vasconcelos, K. S. Van Houtan, C.
E. Zartman, S. A. Boyle, R. K. Didham, A. Andrade, and T. E. Lovejoy. 2011. The fate of
Amazonian forest fragments: A 32-year investigation. Biological Conservation 144:56-67.
Lian P. K., J. Miettinen, S. C. Liew, J. Ghazoul, and P. R. Ehrlich. 2011. Remotely sensed
evidence of tropical peatland conversion to oil palm. Proceedings of the National Academy of
Sciences of the United States of America 108:5127-5132.
Lin, H., Y. Jin, L. Giglio, J. A. Foley, and J. T. Randerson. 2012. Evaluating greenhouse gas
emissions inventories for agricultural burning using satellite observations of active fires.
Ecological Applications 22:1345-1364.
Lovbrand, E., and K. Backstrand. 2006. Planting trees to mitigate climate change: Contested
discourses of ecological modernization, green governmentality and civic environmentalism.
Global Environmental Politics 6:50-75.
Marlier, M. E., R. Defries, D. Pennington, E. Nelson, E. M. Ordway, J. Lewis, S. N. Koplitz, and
L. J. Mickley. 2015. Future fire emissions associated with projected land use change in Sumatra.
Global Change Biology 21:345-362.
Michaelowa, A., and K. Michaelowa. 2015. Do rapidly developing countries take up new
responsibilities for climate change mitigation? Climatic Change 133:499-510.
Miles, L., and V. Kapos. 2008. Reducing greenhouse gas emissions from deforestation and forest
degradation: Global land-use implications. Science 320:1454-1455.
Morel, A. C., S. S. Saatchi, Y. Malhi, N. J. Berry, L. Banin, D. Burslem, R. Nilus, and R. C.
Ong. 2011. Estimating aboveground biomass in forest and oil palm plantation in Sabah,
Malaysian Borneo using ALOS PALSAR data. Forest Ecology and Management 262:1786-1798.
Mulyani, M., and P. Jepson. 2013. REDD+ and Forest Governance in Indonesia. The Journal of
Environment & Development 22:261-283.
Murdiyarso, D., S. Dewi, D. Lawrence, and F. Seymour. 2011 Indonesia’s forest moratorium: A
stepping stone to better forest governance? Working Paper 76. CIFOR, Bogor, Indonesia.
Mylo Trade. 2017. Crude Palm Oil vs. Soybean Oil. Mylo Trade.
http://www.mylotrade.com/crude-palm-oil-vs-soybean-oil.html. Accessed on 02/12/2017.
Nurulita, Y., E. M. Adetutu, K. K. Kadali, E. Shahsavari, D. Zul, M. Taha, and A. S. Ball. 2016.
Assessment of the influence of oil palm and rubber plantations in tropical peat swamp soils using
microbial diversity and activity analysis. Journal of Agricultural Chemistry and Environment
5:53-65.

72
Page, S. E., R. Morrison, C. Malins, A. Hooijer, J. O. Rieley, and J. Jauhiainen. 2011. Review of
peat surface greenhouse gas emissions from oil palm plantations in Southeast Asia. The
International Council on Clean Transportation 15:1-80.
http://www.theicct.org/sites/default/files/publications/ICCT_Peat-Emissions_Sept2011.pdf.
Accessed on 02/12/2017.
Parker, C., A. Mitchell, M. Trivedi, and N. Mardas. 2009. The little REDD+ book: A guide to
governmental and non-governmental proposals for reducing emissions from deforestation and
degradation. Global Canopy Programme, Oxford UK.
Parrotta, J. A., C. Wildburger, S. Mansourian, I. D. Thompson, and J. Ferreira. 2012.
Understanding relationships between biodiversity, carbon, forests and people: The key to
achieving REDD+ objectives. International Union of Forest Research Organizations, Vienna.
[ISBN: 978-3-902762-17-7]
Pasiecznik, N., editor. 2013, July 24. Elaeis guineensis (African oil palm). CAB International.
http://www.cabi.org/isc/datasheet/20295. Accessed 02/16/2017.
Pearson, T. R. H., S. Brown, L. Murray, and G. Sidman. 2017. Greenhouse gas emissions from
tropical forest degradation: An underestimated source. Carbon Balance and Management 12:1-
11. [doi: 10.1186/s13021-017-0072-2].
Persson, U. M., S. Henders, and C. Cederberg. 2014. A method for calculating a land‐ use
change carbon footprint (LUC‐ CFP) for agricultural commodities – applications to Brazilian
beef and soy, Indonesian palm oil. Global Change Biology 20:3482-3491.
Poku, K. 2002. Origin of oil palm small-scale palm oil processing in Africa. FAO Agricultural
Services Bulletin 148. Food and Agriculture Organization of the United Nations, Rome. [ISBN:
92-5-104859-2].
Poorter, L., F. Bongers, T. M. Aide, A. M. Almeyda Zambrano, P. Balvanera, C. C. Jakovac, M.
Lohbeck, M. Penã-Claros, and D. M. A. Rozendaal. 2016. Biomass resilience of Neotropical
secondary forests. Nature 530:211-214.
PROFAUNA. 2012. Facts about Indonesian Wildlife. PROFAUNA Wildlife Rescue Center.
https://www.profauna.net/en/facts-about-indonesian-animals#.WOlp7lKZOMK. Accessed on
04/10/2017.
Ramdani, F., and M. Hino. 2013. Land use changes and GHG emissions from tropical forest
conversion by oil palm plantations in Riau Province, Indonesia. PLoS One 8:1-6. [doi:
10.1371/journal.pone.0070323].
The REDD Desk. 2016. What is REDD? The REDD Desk. http://theredddesk.org/what-redd.
Accessed on 04/10/2017.

73
Reijnders, L., and M. A. J. Huijbregts. 2008. Palm oil and the emission of carbon-based
greenhouse gases. Journal of Cleaner Production 16:477-482.
Riederer, M., A. Serafimovich, and T. Foken. 2014. Net ecosystem CO2 exchange measurements
by the closed chamber method and the eddy covariance technique and their dependence on
atmospheric conditions. Atmospheric Measurement Techniques 7:1057-1064.
Runting, R. K., E. Meijaard, N. K. Abram, J. A. Wells, D. L. A. Gaveau, M. Ancrenaz, H. P.
Posssingham, S. A. Wich, F. Ardiansyah, M. T. Gumal, L. N. Ambu, and K. A. Wilson. 2015.
Alternative futures for Borneo show the value of integrating economic and conservation targets
across borders. Nature Communications 6:1-10. [doi: 10.1038/ncomms7819].
Santilli, M., P. Moutinho, S. Schwartzman, D. Nepstad, L. Curran, and C. Nobre. 2005. Tropical
Deforestation and the Kyoto Protocol. Climatic Change 71:267-276.
Saswattecha, K., L. Hein, C. Kroeze, and W. Jawjit. 2016. Effects of oil palm expansion through
direct and indirect land use change in Tapi river basin, Thailand. International Journal of
Biodiversity Science, Ecosystem Services & Management 12:291-323.
Saswattecha, K., M. Cuevas Romero, L. Hein, W. Jawjit, and C. Kroeze. 2015. Non-CO2
greenhouse gas emissions from palm oil production in Thailand. Journal of integrative
Environmental Sciences 12:67-85.
Scriven, S. A., J. A. Hodgson, C. J. McClean, and J. K. Hill. 2015. Protected areas in Borneo
may fail to conserve tropical forest biodiversity under climate change. Biological Conservation
184:414-423.
Schecter, K., and E. Wright. 2015, November 11. Indonesia's Burning Problem.
ForeignAffairs.com. https://www.foreignaffairs.com/articles/2015-11-11/indonesias-burning-
problem. Accessed on 02/12/2017.
Shibao, P., 2015. Why palm oil expanded, and what keeps it growing.
https://news.mongabay.com/2015/03/why-palm-oil-expanded-and-what-keeps-it-growing/.
Accessed on 03/16/2017.
Shwartz, M. 2012. Climate change surprise: High carbon dioxide levels can retard plant growth,
study reveals. Stanford News Release:1-3. http://news.stanford.edu/pr/02/jasperplots124.html.
Accessed on 03/19/2017.
Singh, M. Y. Malhi, and S. A. Bhagwat. 2015. Aboveground biomass and tree diversity of
riparian zones in an oil palm-dominated mixed landscape in Borneo. Journal of Tropical Forest
Science 27:227-239.
Sizer, N., J. Anderson, F. Stolle, S. Minnemeyer, M. Higgins, A. Leach, and A. Alisjahbana.
2014. Fires in Indonesia spike to highest levels since June 2013 haze emergency. World

74
Resources Institute. http://www.wri.org/blog/2014/03/fires-indonesia-spike-highest-levels-june-
2013-haze-emergency. Accessed on 02/12/2017.
Sodhi, N. S., L. P. Koh, B. W. Brook, and P. K. L. Ng. 2004. Southeast Asian biodiversity: An
impending disaster. Trends in Ecology & Evolution 19:654-660.
Sunarto, M. J. Kelly, S. Klenzendorf, M. R. Vaughan, Zulfahmi, M. B. Hutajulu, and K.
Parakkasi. 2013. Threatened predator on the equator: Multi-point abundance estimates of the
tiger Panthera tigris in central Sumatra. Oryx 47:211-220.
Sunderlin, W. D., and I. A. P. Resosudarmo. 1996. Rates and causes of deforestation in
Indonesia: Towards a resolution of the ambiguities. Center for International Forestry Research
9:1-23. [doi: 10.17528/cifor/000056].
Tan, K. T., K. T. Lee, A. R. Mohamed, and S. Bhatia. 2009. Palm oil: Addressing issues and
towards sustainable development. Renewable and Sustainable Energy Reviews 13:420-427.
Tonks, A. J., P. Aplin, D. J. Beriro, H. Cooper, S. Evers, C. H. Vane, and S. Sjögersten. 2017.
Impacts of conversion of tropical peat swamp forest to oil palm plantation on peat organic
chemistry, physical properties and carbon stocks. Geoderma 289:36-45.
Tsujino, R., T. Yumoto, S. Kitamura, I. Djamaluddin, and D. Darnaedi. 2016. History of forest
loss and degradation in Indonesia. Land Use Policy 57:335-347.
United Nations Framework Convention on Climate Change (UNFCCC). 2011. Compilation of
information on nationally appropriate mitigation actions to be implemented by parties not
included in Annex I to the Convention. Publication No. GE.11-60582. United Nations
Framework Convention on Climate Change. New York, NY, USA.
http://unfccc.int/resource/docs/2011/awglca14/eng/inf01.pdf. Accessed on 04/04/2017.
United Nations Framework Convention on Climate Change (UNFCCC). 2011. Malaysia's
second national communication to the UNFCCC. Ministry of Natural Resources and
Environment Malaysia. Kuala Lumpur, Malaysia. [ISBN: 978-983-44294-9-2].
Uryu, Y., Mott, C., Foead, N., Yulianto, K., Budiman, A., Setiabudi, Takakai, F., Nursamsu,
Sunarto, Purastuti, E., Fadhli, N., Hutajulu, C. M. B., Jaenicke, J., Hatano, R., Siegert, F., Stüwe,
M. 2008. Deforestation, forest degradation, biodiversity loss and CO2 emissions in Riau,
Sumatra, Indonesia. WWF Indonesia Technical Report, Jakarta, Indonesia:1-80.
Verheye, W. 2010. Growth and production of oil palm. Land use, land cover and soil sciences.
Encyclopedia of Life Support Systems 2:1-10. http://hdl.handle.net/1854/LU-1009126. Accessed
on 02/28/2017.
Vijay, V., S. L. Pimm, C. N. Jenkins, and S. J. Smith. 2016. The impacts of oil palm on recent
deforestation and biodiversity loss. PLoS One 11:1-19. [doi: 10.1371/journal.pone.0159668].

75
Vogel, M. 2016. Interview by author. Sabah, Malaysian Borneo. June 12.
Warren, M., S. Frolking, Z. Dai, and S. Kurnianto. 2016. Impacts of land use, restoration, and
climate change on tropical peat carbon stocks in the twenty-first century: Implications for
climate mitigation. Mitigation and Adaptation Strategies for Global Change:1-21. [doi:
10.1007/s11027-016-9712-1].
Wibisino, H. and W. Pusparini. 2010. Sumatran tiger (Panthera tigris sumatrae): A review of
conservation status. Integrative Zoology 5:313-323.
World Wildlife Foundation. 2016. Palm Oil. WWF-Australia. http://www.wwf.org.au/what-we-
do/food/palm-oil#gs.zgiYRak. Accessed on 02/12/2017.
Yamada, T., K. Watanabe, T. Okuda, T. Sugimoto, and Y. N. Azlin. 2016. Growth and survival
of trees plants in an oil palm plantation: Implications for restoration of biodiversity. Journal of
Tropical Forest Science 28:97-105.
Yue, S., J. F. Brodie, E. F. Zipkin, and H. Bernard. 2015. Oil palm plantations fail to support
mammal diversity. Ecological Applications 25:2285-2292.