THE RELATIONSHIP BETWEEN BUSINESS INTELLIGENCE AND ...
42
191 ECONOMIC AND BUSINESS REVIEW | VOL. 22 | No. 2 | 2020 | 191-232 THE RELATIONSHIP BETWEEN BUSINESS INTELLIGENCE AND ANALYTICS USE AND ORGANIZATIONAL ABSORPTIVE CAPACITY: APPLYING THE DELONE & MCLEAN INFORMATION SYSTEMS SUCCESS MODEL KATERINA BOŽIČ 1 Received: July 24, 2018 VLADO DIMOVSKI 2 Accepted: August 29, 2018 ABSTRACT: Building on the DeLone and McLean Information Systems (IS) success model and the knowledge-based theory of absorptive capacity, this paper examines the role of the business intelligence and analytics (BI&A) use for enhancing a firm’s absorptive capacity for knowledge creation. We collected survey data from an online and mail-delivered survey questionnaire with 97 respondents at the organizational level in the Slovenian medium- and large-sized firms from several industries. The results from the partial least squares SEM showed that the BI&A use relates significantly to absorptive capacity enhancement, thus fostering knowledge creation. Moreover, information quality and system quality are positively linked with BI&A use at the organizational level. Key words: Business intelligence and analytics use, DeLone and McLean IS success model, absorptive capacity, knowledge creation JEL classification: M12 DOI: 10.15458/ebr99 1 INTRODUCTION The last decade has witnessed accelerated growth in investment in business intelligence and analytics (BI&A). Following the Chen, Chiang, and Storey (2012) definition, firms use BI&A techniques, technologies, systems, and applications to analyse business and market data and information to derive better and timely business decisions. BI&A encompasses many advanced analytics techniques, such as data mining, machine learning forecasting, semantic analysis, network analysis, and neural networks (Arnott & Pervan, 2014). Gartner’s (2013) survey on IT spending found that BI&A continues to be one of the top priorities for the most successful firms, hence many authors have become interested in measuring the payoffs realized in terms of enhanced organizational performance and 1 Corresponding author, University of Ljubljana, School of Economics and Business, Ljubljana, Slovenia, e-mail: [email protected] 2 University of Ljubljana, School of Economics and Business, Ljubljana, Slovenia, e-mail: [email protected] lj.si
Transcript of THE RELATIONSHIP BETWEEN BUSINESS INTELLIGENCE AND ...

191ECONOMIC AND BUSINESS REVIEW | VOL. 22 | No. 2 | 2020 | 191-232
THE RELATIONSHIP BETWEEN BUSINESS INTELLIGENCE AND ANALYTICS USE AND ORGANIZATIONAL ABSORPTIVE CAPACITY: APPLYING THE DELONE & MCLEAN INFORMATION SYSTEMS SUCCESS MODELKATERINA BOŽIČ1 Received: July 24, 2018 VLADO DIMOVSKI2 Accepted: August 29, 2018
ABSTRACT: Building on the DeLone and McLean Information Systems (IS) success model and the knowledge-based theory of absorptive capacity, this paper examines the role of the business intelligence and analytics (BI&A) use for enhancing a firm’s absorptive capacity for knowledge creation. We collected survey data from an online and mail-delivered survey questionnaire with 97 respondents at the organizational level in the Slovenian medium- and large-sized firms from several industries. The results from the partial least squares SEM showed that the BI&A use relates significantly to absorptive capacity enhancement, thus fostering knowledge creation. Moreover, information quality and system quality are positively linked with BI&A use at the organizational level.Key words: Business intelligence and analytics use, DeLone and McLean IS success model, absorptive capacity, knowledge creationJEL classification: M12DOI: 10.15458/ebr99
1 INTRODUCTION
The last decade has witnessed accelerated growth in investment in business intelligence and analytics (BI&A). Following the Chen, Chiang, and Storey (2012) definition, firms use BI&A techniques, technologies, systems, and applications to analyse business and market data and information to derive better and timely business decisions. BI&A encompasses many advanced analytics techniques, such as data mining, machine learning forecasting, semantic analysis, network analysis, and neural networks (Arnott & Pervan, 2014). Gartner’s (2013) survey on IT spending found that BI&A continues to be one of the top priorities for the most successful firms, hence many authors have become interested in measuring the payoffs realized in terms of enhanced organizational performance and
1 Corresponding author, University of Ljubljana, School of Economics and Business, Ljubljana, Slovenia, e-mail: [email protected]
2 University of Ljubljana, School of Economics and Business, Ljubljana, Slovenia, e-mail: [email protected]

ECONOMIC AND BUSINESS REVIEW | VOL. 22 | No. 2 | 2020 192
increased organizational value (Beath, Becerra-Fernandez, Ross, & Short, 2012; Côrte-Real, Oliveira, & Ruivo, 2017; Elbashir, Collier, Sutton, Davern, & Leech, 2013; Hsieh, Rai, & Xu, 2011). It is evident, however, that significant differences among studies exist regarding the measurement and examination of the technology’s benefits and costs. Many organizational-level studies have observed positive organizational benefits from BI&A investments (Davenport, 2006; Elbashir et al., 2013; Trkman, McCormack, De Oliveira, & Ladeira, 2010), while a large body of research indicates that organizations have failed to reap organizational benefits from using BI&A or detects no significant advantage from using BI&A (Chen, Chen, & Bajwa, 2016; Ransbotham, Kiron, & Prentice, 2016; Torres, Sidorova, & Jones, 2018).
Despite the prominence of BI&A as a source that yields organizational benefits, very few studies have examined BI&A’s value creation process (Fink, Yogev, & Even, 2016; Trieu, 2017; Vidgen, Shaw, & Grant, 2017). Existing research has examined BI&A’s success predominantly from a technological point of view (Bose, 2009; Chaudhuri, Dayal, & Narasayya, 2011; Chen et al., 2012; Hackney, Dooley, Levvy, & Parrish, 2015). However, the success of some information systems is often indirectly influenced by different organizational, human, and environmental factors, making success measurement generally complex. Unsurprisingly, some authors have called for moving beyond traditional financial measures, such as return on investment (ROI), market share, profitability, and sales growth, to better understand and explore both the tangible and intangible benefits of BI&A use (Fink et al., 2016; Sharma, Mithas, & Kankanhalli, 2014; Trieu, 2017; Yeoh & Popovič, 2016). To date, nonetheless, little attention has been given to improving the understanding of the role of BI&A in creating intangible organizational benefits, such as knowledge, organizational capabilities, and customer relationship management (Elbashir et al., 2013; Fan, Lau, & Zhao, 2015; Işık, Jones, & Sidorova, 2013; Sangari & Razmi, 2015; Shollo & Galliers, 2016; Yeoh & Popovič, 2016).
Acknowledging the great need to understand the association of the BI&A use with the intangible organizational benefits, the following research questions were addressed: (1) What are the appropriate dimensions for evaluating the success of BI&A in knowledge creation at an organizational level? (2) What is the role of the BI&A use in enhancing a firm’s absorptive capacity for knowledge creation? To provide a comprehensive answer to these questions, we developed a theoretical model that relies on the DeLone and McLean IS success model (DeLone & McLean, 1992, 2003) and the knowledge-based theory of absorptive capacity (Lane, Koka, & Pathak, 2006; Zahra & George, 2002), applied to the context of BI&A. This paper, therefore, offers a twofold contribution to the BI&A and IS management research areas. Firstly, to the best of our knowledge, this is the first time that the DeLone and McLean model has been combined with the theory of absorptive capacity to develop and test a BI&A success model focusing on enhancing knowledge creation. Secondly, this research examines BI&A use not only from a rate-recurrence view but also regarding the nature of its use for fully capturing the BI&A use dimension. Hence, according to Seddon (1997) discussion, we apply BI&A use as a proxy variable for the benefits from use. Instead of assuming a pure, positive relationship between the time spent

K. BOŽIČ, V. DIMOVSKI | THE RELATIONSHIP BETWEEN BUSINESS INTELLIGENCE ... 193
using BI&A and the benefits it provides, we considered the nature of the use to play an important role in providing benefits as well.
In what follows, the paper starts with the theoretical foundation of the presented conceptual model for the BI&A success. Next, a set of hypotheses is developed, examining the interplay between the dimensions of the presented model. Following this, the research methodology and data analysis using partial least squares SEM are presented. The paper concludes by discussing the theoretical contributions and practical implications of the research, in addition to addressing limitations and providing suggestions for future research.
2 THEORETICAL FOUNDATION
Much research has been done to explain what makes some BI&A systems successful. For instance, the technology acceptance model (TAM) (Davis, 1989) is often applied to explain the intention to use and the readiness to accept the systems (Foshay & Kuziemsky, 2014; Popovič, Coelho, & Jaklič, 2009). Acceptance, however, is not equivalent to usage and success, thus the unified theory of acceptance and use of technology (Venkatesh, Morris, Davis, & Davis, 2003) is often used to supplement the behavioural intent to use with the usage behaviour (Grublješič & Jaklič, 2015b). Moreover, the task-technology fit theory (Goodhue & Thompson, 1995) and technology–organization–environment (TOE) framework (Depietro, Wiarda, & Fleischer, 1990) have been used to explain how certain organizational capabilities and the environment influence the acceptance and use of technology (Burnay, Jureta, Linden, & Faulkner, 2016; Grublješič & Jaklič, 2015a). Nevertheless, the DeLone and McLean IS success model (DeLone & McLean, 1992, 2003) has been widely applied in the existing literature to describe how system quality, information quality, and service quality affect individual or organizational performance, BI success, or decision-making processes (Hou, 2012; Kokin & Wang, 2014; Popovič et al., 2009; Popovič, Hackney, Coelho, & Jaklič, 2012; Wieder & Ossimitz, 2015).
In the current research, we focus on the organizational benefits of the BI&A use by applying the DeLone and McLean IS success model. This model has been found to be a useful framework for understanding, describing, and measuring the IS success and is one of the most often employed and cited models. The model identifies several variables of the IS success: information quality, system quality, service quality, use, user satisfaction, and net benefits. Although value (or net benefits) is the dependent success variable, system use is crucial for net benefits to occur. Moreover, the original D&M model (1992) demonstrated a good fit for measuring the IS success compared to other model re-specifications (Rai, Lang, & Welker, 2002; Sedera & Gable, 2004). Likewise, many meta-analyses have examined and validated different relationships in the D&M model (Bokhari, 2005; Mahmood, Hall, & Swanberg, 2001; Sabherwal, Jeyaraj, & Chowa, 2006). Respectively, the DeLone & McLean IS success model has often been used as the theoretical basis with which to evaluate the BI&A success. Hence, a diverse application can be found. For instance, the model has been extensively applied for investigating the relationship between the end-user satisfaction,

ECONOMIC AND BUSINESS REVIEW | VOL. 22 | No. 2 | 2020 194
BI&A use, and financial performance (Hou, 2012; Kokin & Wang, 2014), further, for investigating the relationship between the information, system, and service quality on one hand and the user satisfaction and use on the other (Daradkeh & Moh'd Al-Dwairi, 2018; Gaardboe, Nyvang, & Sandalgaard, 2017; Gonzales, Wareham, & Serida, 2015), and lastly, for the investigation of the relationship between the managerial-decision making quality, user-satisfaction, and organizational performance (Wieder, Ossimitz, & Chamoni, 2012). Since some variables of the IS success have demonstrated unstable relations with the other variables included in the DeLone and McLean IS success model, such as the user satisfaction with use and further use with individual impact, D&M was applied as a guiding framework and other organizational factors included in the model. Moreover, service quality was not incorporated as a success dimension, since it was not part of the original model and has often been criticized as irrelevant (Seddon, 1997). Therefore, the conceptual framework of this research is presented in Figure 2 1.
Figure 2-1. Proposed conceptual model: Adapted DeLone and McLean BI&A success model
Note: Dotted lines represent hypotheses regarding mediation (indirect) effects via BI&A use
2.1 Business intelligence and analytics use
In line with the existing IS literature, we define the BI&A use as the degree to and the manner in which BI&A is utilized by organizations (Petter, DeLone, & McLean, 2008). Empirical studies have adopted multiple long-standing measures of use, including the frequency of use, extent of use, amount of use, appropriateness of use, and self-reported use. However, many authors have criticized the use of the self-reported, rate recurrence-based measures of use and called for measures that integrate different aspects of usage and are more contextualized, complete, and valid (Burton-Jones & Straub Jr, 2006; Petter, DeLone, & McLean, 2013). The system use represents an appropriate measure of success however only when properly capturing the relationship between the use and expected outcomes. Measuring the frequency and intensity of use without considering and capturing the nature of the use is deficient (Doll & Torkzadeh, 1998). For this reason, we measured the BI&A use as the use of information from the BI&A system regarding the extent, frequency, and

K. BOŽIČ, V. DIMOVSKI | THE RELATIONSHIP BETWEEN BUSINESS INTELLIGENCE ... 195
nature of use (DeLone & McLean, 2003, Burton-Jones & Straub, 2006). Since the expected outcome is enhanced knowledge creation, the BI&A system should allow organizations to monitor the market, competition, and consumers, easily track the sources of internal and external knowledge, search for, generate and store knowledge, and easily retrieve and use the stored knowledge (Gold, Malhotra, & Segars, 2001; Shollo & Galliers, 2016).
Nevertheless, following Burton-Jones and Gallivan (2007), we examined use from a higher-level perspective, that is at the organizational level. As Doll and Torkzadeh (1998) suggested, we used the BI&A use as the central construct in the system-to-value chain that links the system use antecedents with the organizational impact of information technology. BI&A is therefore a mediating variable leading to downstream impact on benefit organizations (DeLone & McLean, 1992; Goodhue, 1995). Following the DeLone and McLean (1992) model, we considered the information quality and system quality to be antecedent constructs to the BI&A use. Both prove to be equally important since even a high-quality system can produce worthless results if the generated information is of low quality (inadequate or wrong). In addition, we view success not simply as the system being used but rather as its contribution to knowledge creation.
2.2 System quality and BI&A use
System quality is defined as the desirable characteristics of an information system. The perceived ease of use has often been implemented as a measure of system quality within the TAM-related research (Davis, 1989), although it does not fully capture the system quality construct. As a response researchers have developed measurement instruments that capture diverse system quality dimensions, such as reliability, effectiveness, maintainability, ease of learning, intuitiveness, sophistication, flexibility, response time, accessibility, and integration (Nelson, Todd, & Wixom, 2005; Petter et al., 2008; Rivard, Poirier, Raymond, & Bergeron, 1997). We conceptualized system quality as a construct measured by dimensions of reliability, flexibility, accessibility, response time, and integration (DeLone & McLean, 2016; Petter et al., 2008; Wixom et al., 2014; Wixom & Watson, 2001). Hence, reliability is the degree to which a system is trustworthy and performs consistently well, while flexibility refers to the ability to adapt and customize the system to users’ changing demands. Further, accessibility refers to the ease with which information can be accessed, integration refers to the degree to which the system allows integration with various data sources, and response time refers to the length of time a system needs to respond to a request for action or information.
The relationship between the system quality and the IS system use has been differently described in the existing literature (Nguyen, Nguyen, & Cao, 2015; Urbach & Müller, 2012). For instance, Fitzgerald and Russo (2005) and Caldeira and Ward (2002) found support for it, while Gill (1995) found this relationship to be insignificant, and Weill and Vitale (1999) with Premkumar and King (1994) found that the system quality can negatively

ECONOMIC AND BUSINESS REVIEW | VOL. 22 | No. 2 | 2020 196
affect the system use when the information system is complex and incompatible with the existing hardware and software.
Organizations should ensure good system quality to reap the full benefits of the BI&A use. This includes upgrading and customizing the existing BI&A infrastructures and architectures to fit the changing data requirements (Chen et al., 2012). Examples include upgrading traditional data warehouses and data marts to Hadoop database technology and customizing advanced analytics tools, such as data mining and natural language processing. In addition, the system should allow integration with a variety of data sources, especially with the new developments in the “big data” era (Chen & Zhang, 2014). Long response time could be an important obstacle that leads to the BI&A underuse (Gandomi & Haider, 2015). Nonetheless, the system should allow easy access to relevant information to anyone who needs them, regardless of their training (Boyd & Crawford, 2012). Accordingly, the first hypothesis is as follows:
H1: System quality is positively associated with BI&A use.
2.3 Information quality and BI&A use
Information quality is on the other hand about the system output’s desirable characteristics. However, information quality is often not distinguished as a unique construct and is measured as a dimension of user satisfaction (Doll, Xia, & Torkzadeh, 1994; McKinney, Yoon, & Zahedi, 2002; Rai et al., 2002). Accordingly, many authors have developed scales via their review of the information quality literature relevant to the type of the IS under study (Fraser & Salter, 1995; Gable, Sedera, & Chan, 2003; Wixom & Watson, 2001). Hence, dimensions such as relevance, completeness, conciseness, accuracy, timeliness, usability, and understandability are often used to describe information quality (DeLone & McLean, 2016; Lee, Strong, Kahn, & Wang, 2002; Nelson et al., 2005; Wixom et al., 2014). Following Nelson et al. (2005), we shaped information quality by using four dimensions: completeness, accuracy, format and currency. Accordingly, completeness represents the degree to which all possible elements are represented in the stored information, further, accuracy is the degree to which the user recognizes that same information as correct and unambiguous, while format represents the degree to which information is presented in an understandable and interpretable manner to the user, and currency represent the user’s perception of the degree to which the information is up-to-date.
The existing literature has found mixed support for the relationship between the information quality and system use (Petter et al., 2013). For example, some authors found support for information quality in that it is an important antecedent of the system use or intention to use (Fitzgerald & Russo, 2005; Halawi, McCarthy, & Aronson, 2008; Kositanurit, Ngwenyama, & Osei-Bryson, 2006). On the other hand, Goodhue and Thompson (1995) found some of the characteristics of information quality to be significantly related to usage, but also some
K. BOŽIČ, V. DIMOVSKI | THE RELATIONSHIP BETWEEN BUSINESS INTELLIGENCE ... 197
that are not. Furthermore, certain studies have found an insignificant relationship between the information quality and intention to use (Iivari, 2005; McGill, Hobbs, & Klobas, 2003).
BI&A systems are increasingly being used to provide decision-makers with a real-time, rich market and consumer data for better decision-making and action-taking (Kowalczyk & Buxmann, 2014; Lavalle, Lesser, Shockley, Hopkins, & Kruschwitz, 2011). However, BI&A analyses can often provide very limited scope and quality, namely, the information must have good predictive power along with high degrees of completeness and accuracy, leading to confident acting upon the information (Dhar, 2013). Moreover, decision-makers need real-time information that will allow them to adjust their actions on a continuous basis, especially in a high-velocity market (Eisenhardt & Martin, 2000). Thus, as discussed by Kowalczyk and Buxmann (2015), the information insufficiency regarding incompleteness, inconsistency, inaccuracy, irrelevance, and unreliability can limit the decision-making ability, affecting the success of BI&A use. Moreover, decision-makers can revert to intuitive decision-making (Matzler, Bailom, & Mooradian, 2007; Ransbotham et al., 2016). Nonetheless, presenting the information in the form of visualizations and graphs facilitates the interpretation of new information and the further use of the system (Lavalle et al., 2011; Yeoh & Popovič, 2016). As such, our second hypothesis is:
H2: Information quality is positively associated with BI&A use.
2.4 BI&A use and absorptive capacity
In the literature, the BI&A use has been reported to yield different organizational benefits. Therefore, a variety of measures of organizational impact can be observed, such as improved organizational performance and overall success (Boyd & Crawford, 2012; Davenport, Barth, & Bean, 2012; Elbashir, Collier, & Davern, 2008; Kiron & Shockley, 2011; McAfee, Brynjolfsson, Davenport, Patil, & Barton, 2012; Shuradze & Wagner, 2016), business process change (Arnold, 2006), innovation of new business models, products, and services (Bughin, Livingston, & Marwaha, 2011; Fisher, DeLine, Czerwinski, & Drucker, 2012; Lavalle et al., 2011; Manyika et al., 2011), support and enhancement of collaboration and decision-making (Chen et al., 2012; Kowalczyk & Buxmann, 2014; Kowalczyk, Buxmann, & Besier, 2013), and also knowledge creation and learning (Holsapple, Lee-Post, & Pakath, 2014; Shollo & Galliers, 2016; Siemens & Long, 2011). Although this body of research has theoretically advanced the understanding of the BI&A’s success, it nevertheless offers a limited understanding of the knowledge-creation process that delivers value, which calls for further research. Hence, we propose that the BI&A use facilitates absorptive capacity processes and enhances knowledge creation (Roberts, Galluch, Dinger, & Grover, 2012).
In their research on innovation, Cohen and Levinthal (1990, p. 128) conceptualized a firm’s absorptive capacity as “the ability of a firm to recognize the value of new, external information, assimilate it, and apply it to a commercial end.” It all depends on the prior related knowledge which helps firms to better evaluate the signals for technological

ECONOMIC AND BUSINESS REVIEW | VOL. 22 | No. 2 | 2020 198
advances and development. Absorptive capacity, therefore, allows an organization to identify new outside knowledge and to assimilate and integrate that knowledge with the existing knowledge internally (Kogut & Zander, 1992). Prior studies have shown the underlying absorptive capacity's capabilities of external knowledge acquisition and assimilation (potential absorptive capacity), as well as further transformation to new knowledge and exploitation (realized absorptive capacity) to be an important component of dynamic capabilities (George, 2005; Malhotra, Gosain, & El Sawy, 2005; Verona & Ravasi, 2003; Wang & Ahmed, 2007; Zahra & George, 2002). On that account, knowledge acquisition refers to the organization’s ability to identify and obtain information through external sources, while knowledge assimilation is the organization’s ability to analyze, interpret and understand the acquired information. Further, knowledge transformation is about facilitating the combination of existing knowledge with the new knowledge as well as its internalization, whereas knowledge exploitation is the application of the transformed knowledge to commercial ends (Flatten, Engelen, Zahra, & Brettel, 2011). Accordingly, absorptive capacity in itself is captured by capabilities that reflect dynamic processes (Flatten et al., 2011; Lane et al., 2006). Moreover, absorptive capacity not merely connects the underlying knowledge capabilities, but combines and integrates them, creating synergistic outcomes, hence, it might be observed as a second-order dynamic capability where absorptive capacity is more than the sum of the underlying knowledge capabilities (Grant, 1996; Lichtenthaler, 2009; Raisch & Birkinshaw, 2008). In this way, absorptive capacity plays an important role in improving firm ability to develop dynamic capabilities and prevent core capabilities from becoming core rigidities (Kang & Snell, 2009; Leonard-Barton, 1995; Teece, Pisano, & Shuen, 1997).
BI&A is predominantly viewed as an information processing tool that provides knowledge infrastructure and knowledge process capabilities, such as acquisition, transformation, application of knowledge, which enhance an organization's existing knowledge base, and in turn increases organizational absorptive capacity (Gold et al., 2001; Srivardhana & Pawlowski, 2007). Moreover, BI&A use facilitates knowledge acquisition through identification, collection, and analysis of external data and information. Hence, the quality of information provided by the BI&A system is an important driver of the use behaviour. Unsatisfactory information quality could arouse doubts about the reliability of the BI&A, which in turn could harm the use behavior and vice versa. Next, the knowledge-acquisition process is enhanced by an advanced analysis of the vast amount of data and information collected in the previous process. In addition, the interpretation of information is assisted through different visualization techniques (Minelli, Chambers, & Dhiraj, 2012). BI&A supports the combination of new, assimilated knowledge with the prior knowledge based on advanced database technologies and parallel, distributed algorithms (McAfee et al., 2012). It is important, however, to ensure sufficient system quality, leading to increased trust in the ability of the system to assist knowledge creation and ultimately to a willingness to use (Saeed, Hwang, & Mun, 2003). Also, BI&A supports the dissemination of, search for, and reuse of the transformed knowledge to aid further improvement of business processes, products, and services (Kowalczyk & Buxmann, 2015). Therefore, we hypothesized the following:
K. BOŽIČ, V. DIMOVSKI | THE RELATIONSHIP BETWEEN BUSINESS INTELLIGENCE ... 199
H3: The BI&A use is positively associated with organizational absorptive capacity.
H3a: The positive association of system quality with organizational absorptive capacity is mediated by the BI&A use.
H3b: The positive association of information quality with organizational absorptive capacity is mediated by the BI&A use.
3 RESEARCH METHODOLOGY
3.1 Sampling, data collection, and sample properties
To test the model and the related hypotheses, we surveyed Slovenian organizations from several industries. As recommended by Moore and Benbasat (1991), the survey instruments drew upon a comprehensive literature review, and all of the constructs were operationalized through an existing measurement scale that has been validated in the extant literature. To ensure content validity, we asked five academic IS and management researchers to review and assess the content, scope, and purpose of the survey (Lawshe, 1975; Lynn, 1986). We modified some of the questionnaire items to properly tap into the study's specific context and simplify interpretation. The questionnaire was developed and disseminated in English to ensure identical meanings.
The data for this research were acquired from a web-based and mail surveying tool in 2018. Two screening criteria were used to guarantee the quality of the data: (1) the respondent had deep knowledge of the organization’s management, and (2) the respondent had more than three years of experience in the BI&A initiatives and held a management, executive, or IT position in the firm. The Strategic Research Innovation Partnership (SRIP) MOBILITY ACS+ and Purchasing Association of Slovenia provided us with access to their internal mailing databases. The data were supplemented by the database of the top 101 most successful Slovenian firms in 2016. Hence, the initial sample of 500 firm representatives from the mailing list received an e-mail invitation to participate in the web-based survey.
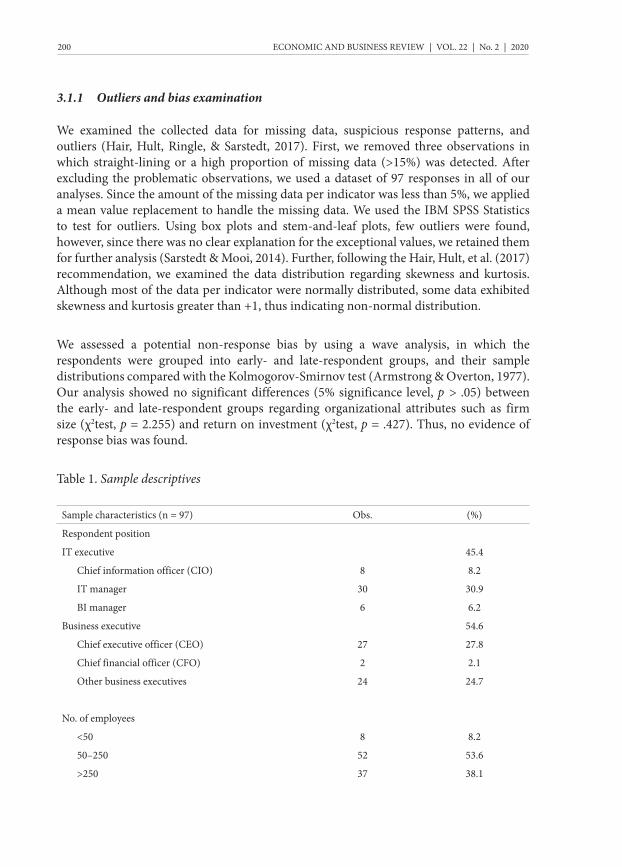
We received 36 valid responses in the first round. To increase the response rate, we sent follow-up e-mails and offered to send them the survey by mail. During the following month, we received 61 additional valid responses, totalling in 97 usable responses (overall response rate of 19.4%). Table 1 shows the sample’s descriptives. The final sample consisted mostly of medium (53.6%) and large organizations (38.1%), according to the current EU guidelines (European Commission, 2005). The latter sample comprises different industry sectors in line with the NACE classification, of which almost 70% were from the manufacturing, wholesale and retail trade, transport, storage, and communication sectors. Regarding the respondents’ positions, IT and business executives were almost equally represented.
ECONOMIC AND BUSINESS REVIEW | VOL. 22 | No. 2 | 2020 200
3.1.1 Outliers and bias examination
We examined the collected data for missing data, suspicious response patterns, and outliers (Hair, Hult, Ringle, & Sarstedt, 2017). First, we removed three observations in which straight-lining or a high proportion of missing data (>15%) was detected. After excluding the problematic observations, we used a dataset of 97 responses in all of our analyses. Since the amount of the missing data per indicator was less than 5%, we applied a mean value replacement to handle the missing data. We used the IBM SPSS Statistics to test for outliers. Using box plots and stem-and-leaf plots, few outliers were found, however, since there was no clear explanation for the exceptional values, we retained them for further analysis (Sarstedt & Mooi, 2014). Further, following the Hair, Hult, et al. (2017) recommendation, we examined the data distribution regarding skewness and kurtosis. Although most of the data per indicator were normally distributed, some data exhibited skewness and kurtosis greater than +1, thus indicating non-normal distribution.
We assessed a potential non-response bias by using a wave analysis, in which the respondents were grouped into early- and late-respondent groups, and their sample distributions compared with the Kolmogorov-Smirnov test (Armstrong & Overton, 1977). Our analysis showed no significant differences (5% significance level, p > .05) between the early- and late-respondent groups regarding organizational attributes such as firm size (χ2test, p = 2.255) and return on investment (χ2test, p = .427). Thus, no evidence of response bias was found.
Table 1. Sample descriptives
Sample characteristics (n = 97) Obs. (%)
Respondent position
IT executive 45.4
Chief information officer (CIO) 8 8.2
IT manager 30 30.9
BI manager 6 6.2
Business executive 54.6
Chief executive officer (CEO) 27 27.8
Chief financial officer (CFO) 2 2.1
Other business executives 24 24.7
No. of employees
<50 8 8.2
50–250 52 53.6
>250 37 38.1

K. BOŽIČ, V. DIMOVSKI | THE RELATIONSHIP BETWEEN BUSINESS INTELLIGENCE ... 201
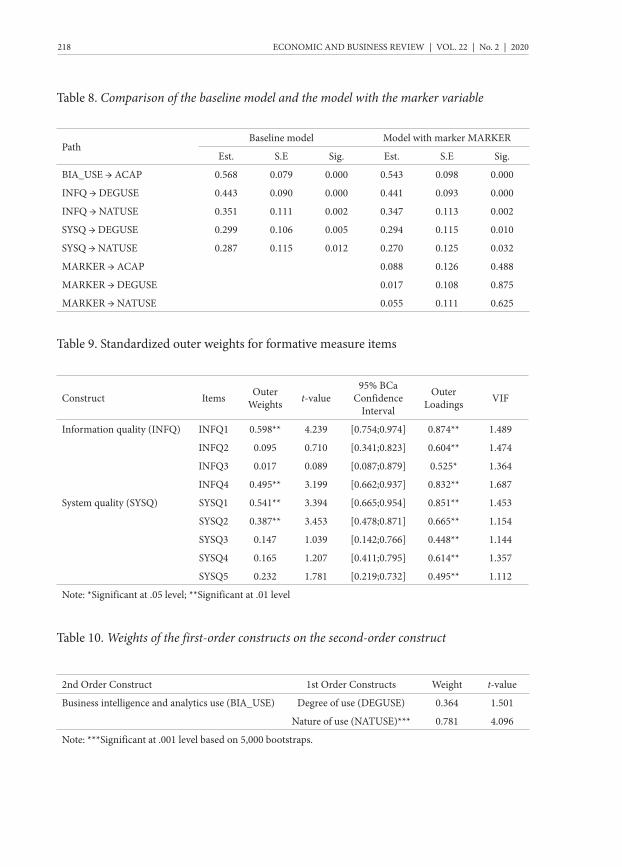
Moreover, as within the study a single-respondent research design was used and the responses were self-reported, we assessed the common method variance (CMV) biases for the sake of validity (Podsakoff, MacKenzie, Lee, & Podsakoff, 2003). In order to diagnose and control for CMV biases, three approaches were employed. First, we used the Harman’s ex-post single-factor analysis. The factorial analysis showed that no single factor accounted for the majority of the covariance among the measures, with the first extracted factor accounting for 35.743% of the variance. Hence, the common method bias is unlikely to be an issue in this study. Second, we applied the Rönkkö and Ylitalo (2011) six-step marker variable approach to control for CMV in PLS. Since the factor structure of the marker items is not important in itself as long as the marker constructs are mostly uncorrelated with the rest of the study constructs (Rönkkö & Ylitalo, 2011), the marker indicators were a combination of two partial scales of environmental dynamism (Dill, 1958; Volberda & Van Bruggen, 1997) and environmental competitiveness (Birkinshaw, Hood, & Jonsson, 1998; Jaworski & Kohli, 1993). The results presented in Table 8 (Appendix B) show no remarkable differences between the baseline model and the model with the marker variable, while all paths maintained their level of statistical significance, indicating no method variance problem. Also, we adopted the full collinearity assessment approach (Kock, 2015) and found that all factor-level VIF values ranged from 1.277 to 2.051, i.e. all below the recommended threshold of 3.3. (Diamantopoulos & Siguaw, 2006). Thus, the traditional single-factor test, the marker variable test, and the full collinearity assessment approach provided support in that the common method bias was not a significant threat to the validity of our study.
Sample characteristics (n = 97) Obs. (%)
Industry
Agriculture, forestry, hunting 2 2.1
Manufacturing 33 34.0
Electricity, gas, water supply 8 8.2
Construction 1 1.0
Wholesale and retail trade 18 18.6
Hotels and restaurants 1 1.0
Transport, storage, and communication 16 16.5
Financial intermediation 4 4.1
Real estate, renting and business activities 6 6.2
Education 1 1.0
Health and social work 1 1.0
Other 6 6.2

ECONOMIC AND BUSINESS REVIEW | VOL. 22 | No. 2 | 2020 202
3.2 Structural equation modelling approach
Two methods are available to researchers for estimating structural equation models by means of empirical data: (1) covariance-based SEM techniques (CB-SEM) (Jöreskog, 1978; Jöreskog & Sörbom, 1982) and (2) variance-based partial least squares (PLS-SEM) (Chin, 1998; Hair, Hult, et al., 2017; Lohmoller, 1988). Following the Hair, Sarstedt, Ringle, and Mena (2012) and Ringle, Sarstedt, and Straub (2012) arguments for selecting an appropriate method for the SEM estimation, our study relies on the PLS-SEM method. The model includes complex second-order latent variables as well as mediation, for which adopting the PLS-SEM approach is considered to be a better choice (Hair et al., 2012). Moreover, the PLS-SEM approach is particularly suitable when a combination of reflectively and formatively measured latent variables are part of the structural model. Furthermore, not all of our indicator variables met the requirement for normal data distribution. Our analysis showed that some of our data variables were non-normal but not excessively non-normally distributed, providing an additional rationale for adopting PLS-SEM (Gefen, Straub, & Boudreau, 2000). Nonetheless, PLS-SEM has been established as particularly useful when analysing relatively small sample sizes in medium and high-complexity model setups (Reinartz, Haenlein, & Henseler, 2009). However, following Ringle, Wende, and Becker (2015) and Hair, Hult, et al. (2017), we determined the required sample size using power analyses. In our model, the maximum number of arrows pointing at a construct is five. Assuming the commonly used level of statistical power of 80%, we therefore needed at least 45 (or 58 in G*Power analysis) data sets to detect the R2 values of at least 0.25 (with a 5% probability of error). Hence, the acquired 97 data sets met the data sample size requirements and were used to assess the proposed model in the SmartPLS 3 software (Ringle et al., 2015).
3.3 Operationalization of the constructs
In this study, two types of latent variables, namely reflective and formative, are employed. We used the information quality and system quality success variables as desirable characteristics and important antecedents of the BI&A use (DeLone & McLean, 2003, 2016). As discussed in section 2.2, system quality focuses on the impact of the system quality dimensions on the BI&A use and is measured by the dimensions of reliability, flexibility, accessibility, response time, and integration (DeLone & McLean, 2016; Petter et al., 2008; Wixom et al., 2014; Wixom & Watson, 2001). On the other hand, information quality focuses on the quality of the BI&A output and is frequently conceptualized as a multi-dimensional concept measured by various dimensions, such as completeness, accuracy, format, and currency (DeLone & McLean, 2016; Lee et al., 2002; Nelson et al., 2005; Wixom et al., 2014). Therefore, to measure the system quality and information quality, we adopted a measurement scale developed and tested by Nelson et al. (2005) and deemed valid and reliable. Both system and information quality were operationalized as formatively measured latent variables since all of the indicators capture a specific aspect of the constructs’ domain and cause the constructs themselves, of which both were explored at the organizational level. Table 4 represents all items adapted from the literature used.
K. BOŽIČ, V. DIMOVSKI | THE RELATIONSHIP BETWEEN BUSINESS INTELLIGENCE ... 203
For the purpose of measuring the BI&A use, we applied hierarchical component models (HCMs). The link between the lower-order components (LOCs) and higher-order components (HOCs) was characterized as a reflective-formative type relationship, which allowed for a more parsimonious PLS model. Since the latent variable of the BI&A use was operated at the organizational level, we employed the intensity, frequency, and nature/purpose of use to measure the degree and manner in which organizations utilize BI&A, as discussed by Petter et al. (2013). The degree of use was reflectively measured by the frequency and intensity measures adapted from Venkatesh, Brown, Maruping, and Bala (2008). Frequency was measured on a 7-point scale ranging from “does not use” to “almost always,” while the intensity of use was also measured on a 7-point scale ranging from “not at all” to “a very great extent.” Regarding the nature/purpose of use, we adapted a measurement scale developed and tested by Gold et al. (2001). Hence, the nature of use was operationalized as a reflectively measured latent variable. All items were measured using a 7-point scale ranging from “strongly disagree” to “strongly agree.”
Following the Gao, Yeoh, Wong, and Scheepers (2017) research findings, we used absorptive capacity as a dependent variable, since the aim of the research involved knowledge-creation and sharing. To measure absorptive capacity, we adopted a measurement scale developed and tested by Flatten et al. (2011), which relies on the absorptive capacity definition of Zahra and George (2002). Once again, we used a hierarchical component model to measure the latent variable of absorptive capacity. Knowledge acquisition, assimilation, transformation, and exploitation were applied as lower-order components. Hence, a reflective-reflective type of HOC with the mode A approach was applied, reducing the level of collinearity among the indicators and increasing the model’s parsimony. All of the items were measured on a 7-point Likert scale ranging from “strongly disagree” to “strongly agree.”
4 RESULTS
4.1 Measurement model
We modelled the constructs of assimilation (ASS), acquisition (ASQ), transformation (TRF), exploitation (EXP), degree of use (DEGUSE), and nature of use (NATUSE) as measured reflective constructs. Further, we modelled the information quality (INFQ) and system quality (SYSQ) as formatively measured constructs since they are not interchangeable and are not expected to co-vary within the same latent construct (Petter, Straub, & Rai, 2007). In addition, we modelled the absorptive capacity (ACAP) as a reflective-reflective second-order construct, with ASS, ASQ, TRF, and EXP as lower-order constructs (Flatten et al., 2011), and used the repeated indicator approach with mode A on the higher-order construct, following the Becker, Klein, and Wetzels (2012) recommendation. Moreover, we modelled the business intelligence and analytics use (BIA_USE) as a reflective-formative, second-order construct, with NATUSE and DEGUSE as lower-order constructs. Hence, for BIA_USE, we followed the Becker et al. (2012) recommendation and used the repeated indicator approach with mode B on the higher-order construct and an inner path
ECONOMIC AND BUSINESS REVIEW | VOL. 22 | No. 2 | 2020 204
weighting scheme, since this specification was found to be the most appropriate for an unequal number of items among the first-order reflective constructs. Detailed procedures and the results of the measurement validation are presented in the continuation.
4.1.1 Reflective measurement
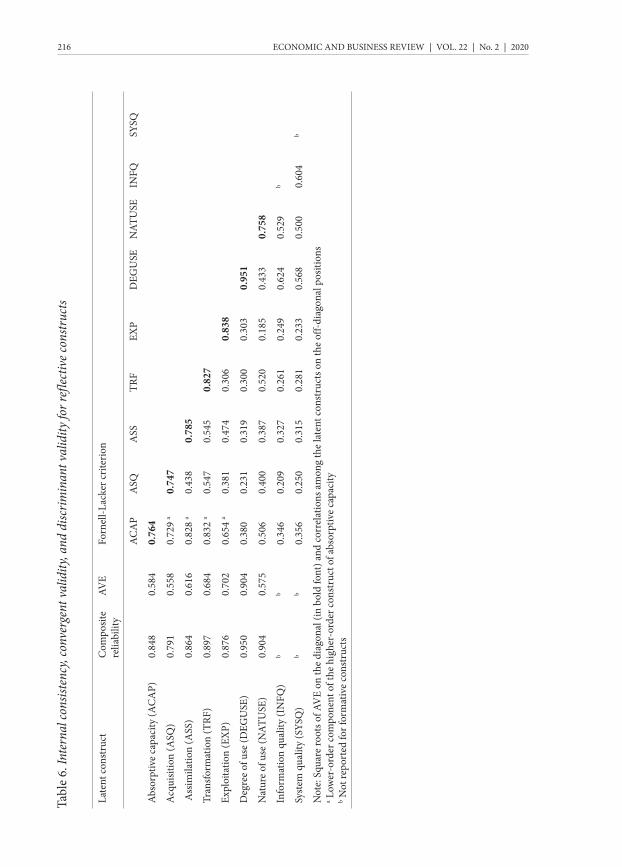
The PLS-SEM model assessment initially focuses on the evaluation of the reliability and validity of the construct measures (Gefen & Straub, 2005; Ringle et al., 2012). Our reflectively measured constructs were tested for the indicators of reliability, construct reliability, convergent validity, and discriminant validity (Ringle et al., 2012). Based on our assessment of the indicator reliability, we removed three items (TI1, TI3, TI5) which increased the average variance extracted to above the threshold (Hair, Hult, et al., 2017). As Table 5 reveals, the indicators in the reflective measurement models reached satisfactory indicator reliability, since all of the reflective indicators had an outer loading of above 0.708, and two indicators exhibited slightly lower loadings of 0.694 and 0.691. Also, the reflective measurement model achieved a composite reliability of 0.791 or higher, suggesting reliability of the construct measures’ internal consistency. To test the convergent validity, we used the average variance extracted (AVE) and found acceptable values of 0.5 or higher, as the construct explains more than half of the variance in its indicators (Fornell & Larcker, 1981; Henseler, Ringle, & Sinkovics, 2009). For the higher-order reflective-reflective construct of absorptive capacity (ACAP), we calculated the AVE and composite reliability manually, following Hair, Hult, et al. (2017) guidelines. Finally, we used two measures to assess the constructs’ discriminant validity. First, according to the Fornell and Lacker (1981) criterion, the square root of each construct’s AVE was to be higher than the correlations with other latent variables. Second, we examined the indicators’ cross-loadings, which were supposed to not reveal any indicators with higher loading on another construct (Chin, 1998). Both analyses indicated that the constructs exhibit discriminant validity. Finally, we applied the heterotrait-monotrait ratio (HTMT) criterion and found that all of the values were lower than the conservative threshold value of 0.85 (Hair, Hult, et al., 2017), thus indicating the establishment of discriminant validity. In addition, we ran bootstrapping to test whether the HTMT values were significantly different from 1, clearly favouring the discriminant validity of the constructs. However, the discriminant validity between the higher- and lower-order constructs of absorptive capacity could not be established, which is expected because the measurement model of the higher-order construct repeats the indicators of the lower-order constructs. Based on the above findings, it is concluded that all of the reflective construct measures were valid and reliable.
4.1.2 Formative measurement
For our model two first-order formative constructs were proposed, namely information quality (INFQ) and system quality (SYSQ). To evaluate the formative measurement models, we started by assessing the outer collinearity. In formative measurement, excessive multicollinearity between the constructs is undesirable because it can destabilize the

K. BOŽIČ, V. DIMOVSKI | THE RELATIONSHIP BETWEEN BUSINESS INTELLIGENCE ... 205
model and lead to redundant items (Diamantopoulos & Winklhofer, 2001). Therefore, we examined the variance inflation factor (VIF) scores for the formative measures and found values that were uniformly below the threshold value of 3.3 (Diamantopoulos & Siguaw, 2006), indicating that multicollinearity is not an issue for the estimation of the PLS path model. Next, we assessed the relevance and significance of the indicators’ weights. Looking at the significance level of the outer weights, we found that all of the formative indicators were significant at the 5% level, except for INFQ2, INFQ3, SYSQ3, SYSQ4, and SYSQ5. However, following the Hair, Hult, et al. (2017) recommendations, we retained all indicators of the formative constructs, since all of the outer loadings were significant at a 5% level. Moreover, prior research and theory also support the relevance of these indicators in capturing information quality and system quality dimensions (Gorla, Somers, & Wong, 2010; Nelson et al., 2005; Saeed & Abdinnour-Helm, 2008). We report the bias-corrected bootstrap confidence interval for additional information on the stability of the coefficient estimates. Moreover, we used the Cadogan and Lee (2013) and Hair, Sarstedt, Ringle, and Gudergan (2017) guidelines to assess the effect of the antecedent constructs (information quality and system quality) on the formative second-order construct of BIA_USE through its lower-order constructs (DEGUSE and NATUSE). We observed that among the two lower-order constructs, NATUSE had a stronger effect on business intelligence and analytics use (0.781 for NATUSE and 0.364 for DEGUSE) and thus greater relevance for forming BIA_USE. Among the BIA_USE’s antecedents, INFQ (0.436) had a stronger effect than SYSQ (0.333). Moreover, at the second-order construct level, first-order constructs act as indicators for the second-order constructs. Therefore, their weights and significance (Table 10) were examined and the weights of both first-order constructs established to be higher than 0.10. In addition, their signs were consistent with the underlying theory (Andreev, Heart, Maoz, & Pliskin, 2009). Although the DEGUSE weight was not significant, the indicator was retained because theory strongly supports the relevance of this indicator in capturing the BI&A use (Popovič, Hackney, Coelho, & Jaklič, 2014; Trieu, 2017). The results suggest all of the formative measures demonstrated a satisfactory construct validity and also no significant multicollinearity. Considering that the results from the reflective and formative constructs exhibited satisfactory levels of quality, we proceeded with the evaluation of the structured model.
4.2 Structural model
To evaluate the structural model, we followed the Hair, Hult, et al. (2017) six-step procedure , namely the collinearity assessment, structural path coefficients, the coefficient of determination R2, effect size f2, predictive relevance Q2, and the effect size q2. We ran the PLS-SEM algorithm in SmartPLS 3, using the path weighting scheme and a stop criterion set at 10−7, with 5,000 iterations of re-sampling and the no sign change option. The VIF values of all combinations of endogenous constructs and corresponding exogenous constructs were below the threshold of 3.3 (the highest VIF among the explanatory variables was 1.575). Thus, collinearity among the predictor constructs did not prove to be a critical issue in the structural model. To avoid bias toward complex models, we considered the adjusted R2 values according to the number of exogenous constructs relative to the sample size
ECONOMIC AND BUSINESS REVIEW | VOL. 22 | No. 2 | 2020 206
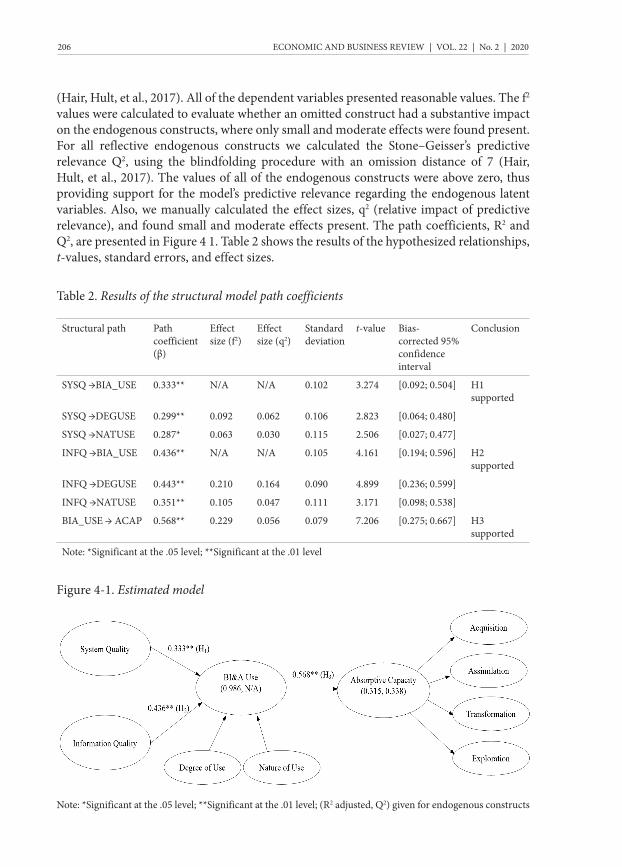
(Hair, Hult, et al., 2017). All of the dependent variables presented reasonable values. The f2 values were calculated to evaluate whether an omitted construct had a substantive impact on the endogenous constructs, where only small and moderate effects were found present. For all reflective endogenous constructs we calculated the Stone–Geisser’s predictive relevance Q2, using the blindfolding procedure with an omission distance of 7 (Hair, Hult, et al., 2017). The values of all of the endogenous constructs were above zero, thus providing support for the model’s predictive relevance regarding the endogenous latent variables. Also, we manually calculated the effect sizes, q2 (relative impact of predictive relevance), and found small and moderate effects present. The path coefficients, R2 and Q2, are presented in Figure 4 1. Table 2 shows the results of the hypothesized relationships, t-values, standard errors, and effect sizes.
Table 2. Results of the structural model path coefficients
Figure 4-1. Estimated model
Note: *Significant at the .05 level; **Significant at the .01 level; (R2 adjusted, Q2) given for endogenous constructs
Structural path Path coefficient (β)
Effect size (f2)
Effect size (q2)
Standard deviation
t-value Bias-corrected 95% confidence interval
Conclusion
SYSQ →BIA_USE 0.333** N/A N/A 0.102 3.274 [0.092; 0.504] H1 supported
SYSQ →DEGUSE 0.299** 0.092 0.062 0.106 2.823 [0.064; 0.480]
SYSQ →NATUSE 0.287* 0.063 0.030 0.115 2.506 [0.027; 0.477]
INFQ →BIA_USE 0.436** N/A N/A 0.105 4.161 [0.194; 0.596] H2 supported
INFQ →DEGUSE 0.443** 0.210 0.164 0.090 4.899 [0.236; 0.599]
INFQ →NATUSE 0.351** 0.105 0.047 0.111 3.171 [0.098; 0.538]
BIA_USE → ACAP 0.568** 0.229 0.056 0.079 7.206 [0.275; 0.667] H3 supported
Note: *Significant at the .05 level; **Significant at the .01 level

K. BOŽIČ, V. DIMOVSKI | THE RELATIONSHIP BETWEEN BUSINESS INTELLIGENCE ... 207
The results presented in Figure 2 1 show that the conceptual model explained 31.5% of the variation in firm absorptive capacity. Both the system quality (β = 0.436, p < .01) and information quality (β = 0.333, p < .01) proved statistically significant in explaining the BI&A use. This way, both H1 and H2 are confirmed. Moreover, the BI&A use (β = 0.568, p < 0.01) was statistically significant in explaining absorptive capacity, thus supporting H3 as well.
4.2.1 Mediation analysis
Our model hypothesized that the BI&A use would mediate relationships between system quality and absorptive capacity on one hand and between information quality and absorptive capacity on the other. We tested further for mediation following the approach outlined by Hair, Hult, et al. (2017). Consequently, to evaluate mediation bootstrapping was used instead of the Sobel test. We found that both indirect effects were significant since neither of the 95% confidence intervals included zero. Furthermore, we assessed the direct effects and found that both direct effects were statistically non-significant (t = 0.377; p = .706, and t = 0.184; p = .854). It was therefore concluded that the BI&A use mediated fully the SYSQ-to-ACAP and INFQ-to-ACAP relationships, thus supporting H3a and H3b.
Table 3. Mediation bootstrapping test: Significance analysis of the direct and indirect effects
Direct effect
95% confidence interval of the direct effect
t-value Indirect effect
95% confidence interval of the indirect effect
t-value Conclusion
SYSQ →ACAP 0.050 [−0.207; 0.320] 0.377 0.190** [0.046; 0.323] 2.617 H3a supported
INFQ →ACAP −0.025 [−0.280; 0.234] 0.184 0.235** [0.070; 0.389] 2.849 H3b supported
Note: **Significant at .01 level

ECONOMIC AND BUSINESS REVIEW | VOL. 22 | No. 2 | 2020 208
5 DISCUSSION AND CONLCUSION
Many organizations have heavily invested in BI&A to enhance organizational performance and increase organizational value. This has led to an increase in the scholarly attention to understanding the mechanisms through which the BI&A use yields organizational benefits. While the extant research provides a relatively rich description of the possible net benefits/impacts of the BI&A use regarding financial benefits, we know correspondingly little about the role of the BI&A use in creating intangible organizational benefits, such as knowledge creation. In the present study, we sought to understand the relatively unexplored aspect of knowledge creation from the BI&A use, answering the Gao et al. (2017)’s call for a deeper investigation of this scarcely researched issue. We created a conceptual model that draws and integrates the DeLone and McLean IS success theory with the absorptive capacity theory for knowledge creation in order to understand the relatively unexplored aspect of knowledge creation as a result of the BI&A use.
5.1 Theoretical contributions
Prior studies of BI&A have already been built upon the DeLone, and McLean IS success theory for the purposes of evaluating the BI&A success (Gaardboe et al., 2017; Hou, 2012; Kokin & Wang, 2014). Although these studies include the idea of value creation through an intensive BI&A use, much less attention has been focused on another important aspect, namely how knowledge is created through the BI&A use. To understand this aspect, we hypothesized that the intangible organizational benefit of knowledge creation happens through the facilitation of absorptive capacity processes. Specifically, we argued that BI&A provide the technological infrastructure and knowledge-procession capabilities to complement the existing knowledge base which in turn enhances organizational absorptive capacity. Unlike the prior research that views the benefits of BI&A predominantly from a technological perspective (Hou, 2012; Kokin & Wang, 2014), through quantifiable financial measures (Davenport et al., 2012; Elbashir et al., 2008) our study instead sheds light on the specific role of BI&A to initiate knowledge creation. This is not to say the previous BI&A success models are not important simply because they do not, or at least not directly, lead to knowledge creation. While such knowledge is beneficial in the context of system adoption, organizational readiness evaluation, and assessment of the BI&A fit, it is less useful in the context of organizational knowing. Overall, our findings are consistent with the existing anecdotal evidence (Eom, 2014; Shollo & Galliers, 2016), but also extend the research by emphasizing how knowledge is created through the processes of knowledge acquisition, assimilation, transformation and exploration, as well as the active role of BI&A in these processes.
Further, the IS success scholars have often assumed a positive effect between the intensity of the BI&A use, as measured by the rate-recurrence measures, and the organizational benefits, but at the same time generally taking for granted that more use yields benefits itself, neglecting the nature of the use. Considering the criticism on this incompleteness of capturing the BI&A use dimension by the degree of use (Petter et al., 2008; Petter et

K. BOŽIČ, V. DIMOVSKI | THE RELATIONSHIP BETWEEN BUSINESS INTELLIGENCE ... 209
al., 2013), within our research the nature of the use is considered as well in order to fully capture the BI&A use dimension. By doing so, we provided an enrichment of the prior work on the topic and highlighted the need for including the nature of use as an important dimension explaining the BI&A use.
Apart from the role of BI&A in fostering knowledge creation, the BI&A system and information quality are significant determinants of organizational absorptive capacity through their intermediate effect on the BI&A use. The results of our research suggest that by providing greater reliability, flexibility, accessibility, response time, and easy integration with the existing systems, system quality can be an important catalyst of the process of knowledge creation (Boyd & Crawford, 2012; Chen & Zhang, 2014). Scholars suggest mixed support for the relationship between system quality and use (Fitzgerald & Russo, 2005; Gill, 1995; Nguyen et al., 2015), and within this research we established a positive association between system quality and the BI&A use, suggesting that organizations should ensure good system quality, especially with the new developments in the “big data” era, in which BI&A technologies, techniques, and applications need to be adjusted to the changing data requirements (Chen et al., 2012). Moreover, in highly dynamic markets, a flexible and fast response system positively impacts the perceived ease of use, thus preventing the BI&A underuse. Hence, easy access contributes to a more frequent and extended use of BI&A (Boyd & Crawford, 2012). However, the mediation analysis showed that high-quality systems should be aligned with the nature of use, as otherwise firms may be unsuccessful at reaping the full benefits from their investments. Moreover, the BI&A system should assure that on the one hand, the generated insights and knowledge are adequate, and that on the other hand, the system reduces the additional effort required for use and distributes the assimilated knowledge across the organization. This is in line with a part of the existing research in which organizations overemphasize the importance of instantaneously buying and installing high-quality BI&A systems without ensuring beforehand that the systems fit the nature of use and that their users are ready to use the system extensively (Ransbotham et al., 2016).
In addition, our study implies that information quality plays another important role in transforming insights into organizational knowledge that can further serve in decision-making. In the beginning, the current study hypothesized that information quality influences the knowledge creation processes of absorptive capacity through the degree and nature of the BI&A use. In the extant work on the BI&A success, it is exactly this association that has been understudied. Namely, we found that complete and accurate information presented in an understandable format can provide decision-makers with good grounds for action-taking and decision-making, which is in line with a part of the existing research (Kowalczyk & Buxmann, 2014; Lavalle et al., 2011). Nevertheless, more information is not necessarily beneficial for an organization, since an organization’s information- and knowledge-processing capacity is limited (Simsek, 2009), and what is more, can be counterproductive when organizations face information overload (Koka & Prescott, 2002; Wales, Parida, & Patel, 2013). The results of the current study extend this line of inquiry by revealing that the good-quality information and insights provided from

ECONOMIC AND BUSINESS REVIEW | VOL. 22 | No. 2 | 2020 210
BI&A in combination with the rich prior knowledge base may improve the process of identification of useful external information and their incorporation into further actions. In contrast, low-quality information distracts organizations, leading them to additional search and processing, consequently affecting negatively the knowledge creation processes.
5.2 Practical implications
Support for the BI&A use having a positive impact on organizational absorptive capacity was established within our research. This is why it is important for practitioners (IT managers and executives) to understand that investment into a high-quality BI&A system is a necessary but not at all a sufficient condition to ensure organizational benefits (Ransbotham et al., 2016). Instead, they should pay attention to the nature of use considering it as a very important determinant of the BI&A use and reconcile the nature of the use with the intended organizational benefits.
Second, the mediation role of the BI&A use supports the notion that managers should carefully opt for both high system quality and information quality of the installed BI&A systems. High information quality raises trust in BI&A and prevents managers from reverting to intuitive decision-making and the underuse of BI&A (Erevelles, Fukawa, & Swayne, 2016; Matzler et al., 2007). Accordingly, the system quality of the selected BI&A solution should be high, so that organizations can cope with the increased amounts of data and information they are faced with in their everyday operations (Kiron & Shockley, 2011). Hence, the BI&A systems should be reliable, fast-responding, real-time systems that adapt easily to the organizational employees’ needs, even the less-skilled ones. Nonetheless, despite the excitement about the possibilities that BI&A has to offer, firms should also be aware that delivering organizational benefits represents a challenging and time-consuming process.
5.3 Limitations and future research
Several limitations of this study are worth noting. First, although we employed multiple measures of the BI&A use, including the frequency, extent, and nature of use, they were all nevertheless self-reported. Self-reported usage may induce biases in the participants’ perception on the actual usage, resulting in differences regarding either the underestimation or overestimation of use. However, since the research was done at an organizational level, and different organizations have different BI&A systems, measuring the actual usage of BI&A would be very difficult, as it would be hard to apply the same proxies for the degree of use. Yet, we welcome the measurement of the actual use in future research across organizations using the same or similar BI&A systems, for which proxies for the actual use can be applied.

K. BOŽIČ, V. DIMOVSKI | THE RELATIONSHIP BETWEEN BUSINESS INTELLIGENCE ... 211
Next, since a single-respondent research design was used, we consciously risked common method variance biases. Nevertheless, several remedies were taken to reduce such problems. First, we addressed the CMV during the procedural stage by not informing the respondents about what we were measuring and by separating the measurement of the predictor from those of the criterion variables. The latter was done by introducing in between new items that were not used in this study, with the purpose of achieving a psychological separation. In this step of the research, respondent anonymity was properly ensured. Second, we addressed the CMV bias in the statistical stage by using Harman’s, marker variable analyses, and the full collinearity assessment approach. The results in this second step suggested no serious CMV in our study.
The sampling strategy applied in the paper included a sampling of the impact of the BI&A use on organizational benefits during the same time period. Hence, a longitudinal, sequential design with resampling can serve as a good starting point for more insights into the causality between the BI&A use and the process of creating organizational benefits, as well as shed more light on how this process changes over time. The strong theoretical foundations of the hypothesized relationships do provide confidence about the directions of the identified associations.
Nevertheless, this paper also shows that a large-sample analysis of the BI&A use at multiple levels is called for to examine the BI&A’s successes in detail, for greater generalization across firms, industries, and countries. In addition, future research may draw on other theories, such as the resource-based view, dynamic capabilities perspective, and information processing view, with the aim of exploring the effects of other factors.

ECONOMIC AND BUSINESS REVIEW | VOL. 22 | No. 2 | 2020 212
APPENDIX A
Table 4. Measurement scales and items
Items Literature
Degree of use Venkatesh, Brown, Maruping, and Bala (2008)
Please indicate the extent to which you are currently using the BI&A. (EXT)
Please indicate how often does your organization use BI&A. (FRQ)
Nature of use Gold, Malhotra, and Segars (2001)
My firm has clear rules for formatting or categorizing process knowledge. (TI1)*
My firm uses Business Intelligence and Analytics technology that allows...
….it to monitor its competition and business partners. (TI2)
... employees to collaborate with other persons inside the organization. (TI3)*
... people in multiple locations to learn as a group from a single source or at a single point in time. (TI4)
... people in multiple locations to learn as a group from multiple sources or at multiple points in time. (TI5)*
... it to search for new knowledge. (TI6)
... it to map the location of specific types of knowledge. (TI7)
... it to retrieve and use knowledge about its products and processes. (TI8)
... it to retrieve and use knowledge about its markets and competition. (TI9)
... generate and store new knowledge about its customers, partners, employees, or suppliers. (TI10)
Acquisition (ASQ) Flatten, Engelen, Zahra, and Brettel (2011)
The search for relevant information concerning our industry is an every-day business in our firm. (ASQ1)
Our management motivates the employees to use information sources within our industry. (ASQ2)

K. BOŽIČ, V. DIMOVSKI | THE RELATIONSHIP BETWEEN BUSINESS INTELLIGENCE ... 213
Items Literature
Our management expects that the employees deal with information beyond our industry. (ASQ3)
Assimilation (ASS)
In our firm ideas and concepts are communicated cross-departmental. (ASS1)
Our management emphasizes cross-departmental support to solve problems. (ASS2)
In our company, there is a quick information flow, e.g., if a business unit obtains the important information it communicates this information promptly to all other business units or departments. (ASS3)
Our management demands periodic cross-departmental meetings to interchange new developments, problems, and achievements. (ASS4)
Transformation (TRF)
Our employees have the ability to structure and use collected knowledge. (TRF1)
Our employees are used to absorb new knowledge as well as to prepare it for further purposes and to make it available. (TRF2)
Our employees successfully link existing knowledge with new insights. (TRF3)
Our employees are able to apply new knowledge in their practical work. (TRF4)
Exploitation (EXP)
Our management supports the development of prototypes. (EXP1)
Our firm regularly reconsiders technologies and adapts them accordant to new knowledge. (EXP2)
Our company has the ability to work more effective by adopting new technologies. (EXP3)
Information quality (INFQ) Nelson, Todd, and Wixom (2005); B. H. Wixom and Watson (2001)
BI&A produces comprehensive information. (INFQ1)

ECONOMIC AND BUSINESS REVIEW | VOL. 22 | No. 2 | 2020 214
Items Literature
The information provided by BI&A is well formatted and clearly presented. (INFQ2)
The information provided by BI&A is accurate. (INFQ3)
BI&A provides me with the most recent information. (INFQ4)
System quality (SYSQ) Nelson, Todd, and Wixom (2005); B. H. Wixom and Watson (2001)
BI&A operates and performs reliably. (SYSQ1)
BI&A makes information easy to access. (SYSQ2)
BI&A can flexibly adjust to new demands or conditions. (SYSQ3)
BI&A effectively integrates data from different areas of the company. (SYSQ4)
It takes too long for BI&A to respond to requests. (SYSQ5) **
Marker variable (MARKER) Birkinshaw, Hood, & Jonsson (1998); Jaworski & Kohli (1993); Dill (1958); Volberda & Van Bruggen (1997)
Competition in our local market is intense. (C1)
Price competition is a hallmark of our local market. (C4)
Our clients regularly ask for new products and services. (D2)
In a year, nothing has changed in our market. (D4) **
Notes: *items eliminated due to low loading; **reverse scale item

K. BOŽIČ, V. DIMOVSKI | THE RELATIONSHIP BETWEEN BUSINESS INTELLIGENCE ... 215
APPENDIX B
Table 5. Loadings and cross-loading for the reflective measurement model
Construct Item ASQ ASS TRF EXP DEGUSE NATUSE
Absorptive capacity
Acquisition ASQ1 0.731 0.273 0.401 0.198 0.205 0.283
ASQ2 0.775 0.369 0.491 0.323 0.245 0.334
ASQ3 0.734 0.331 0.322 0.325 0.056 0.274
Assimilation ASS1 0.361 0.863 0.430 0.486 0.309 0.320
ASS2 0.318 0.761 0.315 0.346 0.115 0.165
ASS3 0.234 0.694 0.375 0.237 0.188 0.295
ASS4 0.433 0.811 0.560 0.387 0.350 0.409
Transformation TRF1 0.440 0.450 0.823 0.223 0.325 0.456
TRF2 0.433 0.475 0.827 0.178 0.284 0.498
TRF3 0.473 0.401 0.847 0.180 0.120 0.415
TRF4 0.463 0.473 0.811 0.417 0.261 0.357
Exploitation EXP1 0.259 0.371 0.227 0.856 0.179 0.098
EXP2 0.432 0.356 0.304 0.842 0.144 0.207
EXP3 0.256 0.464 0.234 0.815 0.441 0.155
Degree of use EXT 0.243 0.324 0.287 0.282 0.944 0.389
FRQ 0.198 0.285 0.284 0.293 0.957 0.431
Nature of use TI2 0.344 0.398 0.482 0.267 0.265 0.762
TI4 0.238 0.303 0.217 0.150 0.502 0.691
TI6 0.267 0.222 0.407 0.163 0.397 0.803
TI7 0.367 0.317 0.442 0.085 0.247 0.742
TI8 0.310 0.259 0.448 0.105 0.379 0.793
TI9 0.343 0.292 0.429 0.117 0.272 0.796
TI10 0.263 0.265 0.350 0.080 0.175 0.714
ECONOMIC AND BUSINESS REVIEW | VOL. 22 | No. 2 | 2020 216
Late
nt co
nstr
uct
Com
posit
e re
liabi
lity
AVE
Forn
ell-L
acke
r crit
erio
n
AC
AP
ASQ
ASS
TRF
EXP
DEG
USE
NAT
USE
INFQ
SYSQ
Abs
orpt
ive
capa
city
(AC
AP)
0.84
80.
584
0.76
4
Acq
uisit
ion
(ASQ
)0.
791
0.55
80.
729
a0.
747
Ass
imila
tion
(ASS
)0.
864
0.61
60.
828
a0.
438
0.78
5
Tran
sfor
mat
ion
(TRF
)0.
897
0.68
40.
832
a0.
547
0.54
50.
827
Expl
oita
tion
(EX
P)0.
876
0.70
20.
654
a0.
381
0.47
40.
306
0.83
8
Deg
ree
of u
se (D
EGU
SE)
0.95
00.
904
0.38
00.
231
0.31
90.
300
0.30
30.
951
Nat
ure
of u
se (N
ATU
SE)
0.90
40.
575
0.50
60.
400
0.38
70.
520
0.18
50.
433
0.75
8
Info
rmat
ion
qual
ity (I
NFQ
)b
b0.
346
0.20
90.
327
0.26
10.
249
0.62
40.
529
b
Syst
em q
ualit
y (S
YSQ
)b
b0.
356
0.25
00.
315
0.28
10.
233
0.56
80.
500
0.60
4b
Not
e: S
quar
e ro
ots o
f AV
E on
the
diag
onal
(in
bold
font
) and
corr
elat
ions
am
ong
the
late
nt co
nstr
ucts
on
the
off-
diag
onal
pos
ition
sa L
ower
-ord
er co
mpo
nent
of t
he h
ighe
r-or
der c
onst
ruct
of a
bsor
ptiv
e ca
paci
tyb N
ot re
port
ed fo
r for
mat
ive
cons
truc
ts
Tabl
e 6.
Inte
rnal
cons
isten
cy, c
onve
rgen
t val
idity
, and
disc
rimin
ant v
alid
ity fo
r ref
lectiv
e con
struc
ts

K. BOŽIČ, V. DIMOVSKI | THE RELATIONSHIP BETWEEN BUSINESS INTELLIGENCE ... 217
A
SQA
SSTR
FEX
PD
EGU
SEN
ATU
SEA
CA
P
Acq
uisit
ion
(ASQ
)
Ass
imila
tion
(ASS
)0.
615
[0.3
42;0
.849
]
Tran
sfor
mat
ion
(TRF
)0.
754
[0.5
75;0
.903
]0.
654
[0.3
78;0
.825
]
Expl
oita
tion
(EX
P)0.
539
[0.3
01;0
.801
]0.
589
[0.3
54;0
.755
]0.
367
[0.1
71;0
.612
]
Deg
ree
of u
se (D
EGU
SE)
0.30
8 [0
.093
;0.5
45]
0.36
7 [0
.145
;0.6
08]
0.34
4 [0
.118
;0.5
78]
0.36
2 [0
.180
;0.5
84]
Nat
ure
of u
se (N
ATU
SE)
0.54
8 [0
.321
;0.7
21]
0.45
7 [0
.240
;0.6
38]
0.60
9 [0
.415
;0.7
15]
0.21
6 [0
.106
;0.3
56]
0.47
5 [0
.280
;0.6
37]
Abs
orpt
ive
capa
city
(AC
AP)
1.00
9 [0
.889
;1.1
83]
0.98
6 [0
.916
;1.0
51]
0.94
2 [0
.860
;0.9
92]
0.81
4 [0
.706
;0.9
15]
0.42
6 [0
.207
;0.6
49]
0.56
9 [0
.383
;0.6
93]
Not
e: T
he v
alue
s in
the
brac
kets
rep
rese
nt th
e 95
% b
ias-
corr
ecte
d an
d ac
cele
rate
d co
nfid
ence
inte
rval
of t
he H
TMT
valu
es o
btai
ned
by r
unni
ng th
e bo
otst
rapp
ing
rout
ine
with
5,0
00 sa
mpl
es in
Sm
artP
LS.
Tabl
e 7.
Disc
rimin
ant v
alid
ity a
sses
smen
t usin
g the
het
erot
rait-
mon
otra
it ra
tio (H
TMT)
crite
rion
ECONOMIC AND BUSINESS REVIEW | VOL. 22 | No. 2 | 2020 218
Table 8. Comparison of the baseline model and the model with the marker variable
Table 9. Standardized outer weights for formative measure items
Table 10. Weights of the first-order constructs on the second-order construct
PathBaseline model Model with marker MARKER
Est. S.E Sig. Est. S.E Sig.
BIA_USE → ACAP 0.568 0.079 0.000 0.543 0.098 0.000
INFQ → DEGUSE 0.443 0.090 0.000 0.441 0.093 0.000
INFQ → NATUSE 0.351 0.111 0.002 0.347 0.113 0.002
SYSQ → DEGUSE 0.299 0.106 0.005 0.294 0.115 0.010
SYSQ → NATUSE 0.287 0.115 0.012 0.270 0.125 0.032
MARKER → ACAP 0.088 0.126 0.488
MARKER → DEGUSE 0.017 0.108 0.875
MARKER → NATUSE 0.055 0.111 0.625
Construct Items Outer Weights t-value
95% BCa Confidence
Interval
Outer Loadings VIF
Information quality (INFQ) INFQ1 0.598** 4.239 [0.754;0.974] 0.874** 1.489
INFQ2 0.095 0.710 [0.341;0.823] 0.604** 1.474
INFQ3 0.017 0.089 [0.087;0.879] 0.525* 1.364
INFQ4 0.495** 3.199 [0.662;0.937] 0.832** 1.687
System quality (SYSQ) SYSQ1 0.541** 3.394 [0.665;0.954] 0.851** 1.453
SYSQ2 0.387** 3.453 [0.478;0.871] 0.665** 1.154
SYSQ3 0.147 1.039 [0.142;0.766] 0.448** 1.144
SYSQ4 0.165 1.207 [0.411;0.795] 0.614** 1.357
SYSQ5 0.232 1.781 [0.219;0.732] 0.495** 1.112
Note: *Significant at .05 level; **Significant at .01 level
2nd Order Construct 1st Order Constructs Weight t-value
Business intelligence and analytics use (BIA_USE) Degree of use (DEGUSE) 0.364 1.501
Nature of use (NATUSE)*** 0.781 4.096
Note: ***Significant at .001 level based on 5,000 bootstraps.
K. BOŽIČ, V. DIMOVSKI | THE RELATIONSHIP BETWEEN BUSINESS INTELLIGENCE ... 219
REFERENCES
Andreev, P., Heart, T., Maoz, H., & Pliskin, N. (2009). Validating formative partial least squares (PLS) models: methodological review and empirical illustration. ICIS 2009 Proceedings, 193.
Armstrong, J. S., & Overton, T. S. (1977). Estimating nonresponse bias in mail surveys. Journal of marketing research, 396-402.
Arnold, V. (2006). Behavioral research opportunities: Understanding the impact of enterprise systems. International Journal of Accounting Information Systems, 7(1), 7-17.
Arnott, D., & Pervan, G. (2014). A critical analysis of decision support systems research revisited: the rise of design science. Journal of Information Technology, 29(4), 269-293.
Beath, C., Becerra-Fernandez, I., Ross, J., & Short, J. (2012). Finding value in the information explosion. MIT Sloan management review, 53(4), 18.
Becker, J.-M., Klein, K., & Wetzels, M. (2012). Hierarchical latent variable models in PLS-SEM: guidelines for using reflective-formative type models. Long range planning, 45(5-6), 359-394.
Birkinshaw, J., Hood, N., & Jonsson, S. (1998). Building firm‐specific advantages in multinational corporations: the role of subsidiary initiative. Strategic Management Journal, 19(3), 221-242.
Bokhari, R. H. (2005). The relationship between system usage and user satisfaction: a meta-analysis. Journal of Enterprise Information Management, 18(2), 211-234.
Bose, R. (2009). Advanced analytics: opportunities and challenges. Industrial Management & Data Systems, 109(2), 155-172.
Boyd, D., & Crawford, K. (2012). Critical questions for big data: Provocations for a cultural, technological, and scholarly phenomenon. Information, communication & society, 15(5), 662-679.
Bughin, J., Livingston, J., & Marwaha, S. (2011). Seizing the potential of ‘big data’. McKinsey Quarterly, 4, 103-109.
ECONOMIC AND BUSINESS REVIEW | VOL. 22 | No. 2 | 2020 220
Burnay, C., Jureta, I. J., Linden, I., & Faulkner, S. (2016). A framework for the operationalization of monitoring in business intelligence requirements engineering. Software & Systems Modeling, 15(2), 531-552.
Burton-Jones, A., & Gallivan, M. J. (2007). Toward a deeper understanding of system usage in organizations: a multilevel perspective. MIS quarterly, 657-679.
Burton-Jones, A., & Straub Jr, D. W. (2006). Reconceptualizing system usage: An approach and empirical test. Information Systems Research, 17(3), 228-246.
Cadogan, J. W., & Lee, N. (2013). Improper use of endogenous formative variables. Journal of Business Research, 66(2), 233-241.
Caldeira, M. M., & Ward, J. M. (2002). Understanding the successful adoption and use of IS/IT in SMEs: an explanation from Portuguese manufacturing industries. Information Systems Journal, 12(2), 121-152.
Chaudhuri, S., Dayal, U., & Narasayya, V. (2011). An overview of business intelligence technology. Communications of the ACM, 54(8), 88-98.
Chen, C. P., & Zhang, C.-Y. (2014). Data-intensive applications, challenges, techniques and technologies: A survey on Big Data. Information Sciences, 275, 314-347.
Chen, H. C., Chiang, R. H. L., & Storey, V. C. (2012). Business Intelligence and Analytics: From Big Data to Big Impact. MIS quarterly, 36(4), 1165-1188.
Chen, X., Chen, L., & Bajwa, D. (2016). Organizational Readiness for Business Intelligence and Analytics Systems Success. Paper presented at the Twenty-second American conference on information systems, San Diego.
Chin, W. W. (1998). The partial least squares approach to structural equation modeling. Modern methods for business research, 295(2), 295-336.
Cohen, W. M., & Levinthal, D. A. (1990). Absorptive-capacity - a new perspective on learning and innovation. Administrative science quarterly, 35(1), 128-152. doi: 10.2307/2393553
Côrte-Real, N., Oliveira, T., & Ruivo, P. (2017). Assessing business value of Big Data Analytics in European firms. Journal of Business Research, 70, 379-390.

K. BOŽIČ, V. DIMOVSKI | THE RELATIONSHIP BETWEEN BUSINESS INTELLIGENCE ... 221
Daradkeh, M., & Moh'd Al-Dwairi, R. (2018). Self-Service Business Intelligence Adoption in Business Enterprises: The Effects of Information Quality, System Quality, and Analysis Quality Operations and Service Management: Concepts, Methodologies, Tools, and Applications (pp. 1096-1118): IGI Global.
Davenport, T. H. (2006). Competing on analytics. Harvard business review, 84(1), 98.
Davenport, T. H., Barth, P., & Bean, R. (2012). How 'Big Data' Is Different. MIT Sloan management review, 54(1), 22-24.
Davis, F. D. (1989). Perceived usefulness, perceived ease of use, and user acceptance of information technology. MIS quarterly, 319-340.
DeLone, W. H., & McLean, E. R. (1992). Information systems success: The quest for the dependent variable. Information Systems Research, 3(1), 60-95.
DeLone, W. H., & McLean, E. R. (2003). The DeLone and McLean model of information systems success: a ten-year update. Journal of Management Information Systems, 19(4), 9-30.
DeLone, W. H., & McLean, E. R. (2016). Information systems success measurement. Foundations and Trends® in Information Systems, 2(1), 1-116.
Depietro, R., Wiarda, E., & Fleischer, M. (1990). The context for change: Organization, technology and environment. The processes of technological innovation, 199(0), 151-175.
Dhar, V. (2013). Data science and prediction. Communications of the ACM, 56(12), 64-73.
Diamantopoulos, A., & Siguaw, J. A. (2006). Formative versus reflective indicators in organizational measure development: A comparison and empirical illustration. British Journal of Management, 17(4), 263-282.
Diamantopoulos, A., & Winklhofer, H. M. (2001). Index construction with formative indicators: An alternative to scale development. Journal of marketing research, 38(2), 269-277.
Dill, W. R. (1958). Environment as an influence on managerial autonomy. Administrative science quarterly, 409-443.
ECONOMIC AND BUSINESS REVIEW | VOL. 22 | No. 2 | 2020 222
Doll, W. J., & Torkzadeh, G. (1998). Developing a multidimensional measure of system-use in an organizational context. Information & Management, 33(4), 171-185.
Doll, W. J., Xia, W., & Torkzadeh, G. (1994). A confirmatory factor analysis of the end-user computing satisfaction instrument. MIS quarterly, 453-461.
Eisenhardt, K. M., & Martin, J. A. (2000). Dynamic capabilities: what are they? Strategic Management Journal, 21(10-11), 1105-1121.
Elbashir, M. Z., Collier, P. A., & Davern, M. J. (2008). Measuring the effects of business intelligence systems: The relationship between business process and organizational performance. International Journal of Accounting Information Systems, 9(3), 135-153.
Elbashir, M. Z., Collier, P. A., Sutton, S. G., Davern, M. J., & Leech, S. A. (2013). Enhancing the business value of business intelligence: The role of shared knowledge and assimilation. Journal of Information Systems, 27(2), 87-105.
Eom, S. (2014). Knowledge Management And Data Mining: Emerging Business Intelligence Research Subspecialties. DSS, 2, 353-362.
Erevelles, S., Fukawa, N., & Swayne, L. (2016). Big Data consumer analytics and the transformation of marketing. Journal of Business Research, 69(2), 897-904.
European Commission. (2005). The new SME definition: User guide and model declaration: European Comm., Publication Office.
Fan, S., Lau, R. Y., & Zhao, J. L. (2015). Demystifying big data analytics for business intelligence through the lens of marketing mix. Big Data Research, 2(1), 28-32.
Fink, L., Yogev, N., & Even, A. (2016). Business Intelligence and Organizational Learning: An Empirical Investigation of Value Creation Processes. Information & Management.
Fisher, D., DeLine, R., Czerwinski, M., & Drucker, S. (2012). Interactions with big data analytics. interactions, 19(3), 50-59.
Fitzgerald, G., & Russo, N. L. (2005). The turnaround of the London ambulance service computer-aided despatch system (LASCAD). European Journal of Information Systems, 14(3), 244-257.
K. BOŽIČ, V. DIMOVSKI | THE RELATIONSHIP BETWEEN BUSINESS INTELLIGENCE ... 223
Flatten, T. C., Engelen, A., Zahra, S. A., & Brettel, M. (2011). A measure of absorptive capacity: Scale development and validation. European Management Journal, 29(2), 98-116.
Fornell, C., & Larcker, D. F. (1981). Evaluating structural equation models with unobservable variables and measurement error. Journal of marketing research, 39-50.
Foshay, N., & Kuziemsky, C. (2014). Towards an implementation framework for business intelligence in healthcare. International Journal of Information Management, 34(1), 20-27.
Fraser, S., & Salter, G. (1995). A motivational view of information systems success: a reinterpretation of Delone and McLean's model: Department of Accounting and Finance, University of Melbourne.
Gaardboe, R., Nyvang, T., & Sandalgaard, N. (2017). Business intelligence success applied to healthcare information systems. Procedia Computer Science, 121, 483-490.
Gable, G., Sedera, D., & Chan, T. (2003). Enterprise systems success: a measurement model. ICIS 2003 Proceedings, 48.
Gandomi, A., & Haider, M. (2015). Beyond the hype: Big data concepts, methods, and analytics. International Journal of Information Management, 35(2), 137-144.
Gao, S., Yeoh, W., Wong, S. F., & Scheepers, R. (2017). A literature analysis of the use of Absorptive Capacity construct in IS research. International Journal of Information Management, 37(2), 36-42.
Gefen, D., & Straub, D. (2005). A practical guide to factorial validity using PLS-Graph: Tutorial and annotated example. Communications of the Association for Information Systems, 16(1), 5.
Gefen, D., Straub, D., & Boudreau, M.-C. (2000). Structural equation modeling and regression: Guidelines for research practice. Communications of the Association for Information Systems, 4(1), 7.
George, G. (2005). Learning to be capable: patenting and licensing at the Wisconsin Alumni Research Foundation 1925–2002. Industrial and corporate change, 14(1), 119-151.
Gill, T. G. (1995). Early expert systems: Where are they now? MIS quarterly, 51-81.

ECONOMIC AND BUSINESS REVIEW | VOL. 22 | No. 2 | 2020 224
Gold, A. H., Malhotra, A., & Segars, A. H. (2001). Knowledge management: An organizational capabilities perspective. Journal of Management Information Systems, 18(1), 185-214.
Gonzales, R., Wareham, J., & Serida, J. (2015). Measuring the Impact of Data Warehouse and Business Intelligence on Enterprise Performance in Peru: A Developing Country. Journal of Global Information Technology Management, 18(3), 162-187.
Goodhue, D. L. (1995). Understanding user evaluations of information systems. Management science, 41(12), 1827-1844.
Goodhue, D. L., & Thompson, R. L. (1995). Task-technology fit and individual performance. MIS quarterly, 213-236.
Gorla, N., Somers, T. M., & Wong, B. (2010). Organizational impact of system quality, information quality, and service quality. The Journal of Strategic Information Systems, 19(3), 207-228.
Grant, R. M. (1996). Prospering in dynamically-competitive environments: Organizational capability as knowledge integration. Organization science, 7(4), 375-387.
Grublješič, T., & Jaklič, J. (2015a). Business intelligence acceptance: The prominence of organizational factors. Information Systems Management, 32(4), 299-315.
Grublješič, T., & Jaklič, J. (2015b). Conceptualization of the business intelligence extended use model. Journal of computer information systems, 55(3), 72-82.
Hackney, R., Dooley, P., Levvy, Y., & Parrish, J. (2015). Critical value factors in business intelligence systems implementation success: An empirical analysis of system and information quality.
Hair, J., Sarstedt, M., Ringle, C. M., & Mena, J. A. (2012). An assessment of the use of partial least squares structural equation modeling in marketing research. Journal of the academy of marketing science, 40(3), 414-433.
Hair, J. F., Hult, G. T. M., Ringle, C., & Sarstedt, M. (2017). A primer on partial least squares structural equation modeling (PLS-SEM): Sage Publications.
Hair, J. F., Sarstedt, M., Ringle, C. M., & Gudergan, S. P. (2017). Advanced Issues in Partial Least Squares Structural Equation Modeling: SAGE Publications.
K. BOŽIČ, V. DIMOVSKI | THE RELATIONSHIP BETWEEN BUSINESS INTELLIGENCE ... 225
Halawi, L. A., McCarthy, R. V., & Aronson, J. E. (2008). An empirical investigation of knowledge management systems' success. Journal of computer information systems, 48(2), 121-135.
Henseler, J., Ringle, C. M., & Sinkovics, R. R. (2009). The use of partial least squares path modeling in international marketing New challenges to international marketing (pp. 277-319): Emerald Group Publishing Limited.
Holsapple, C., Lee-Post, A., & Pakath, R. (2014). A unified foundation for business analytics. Decision Support Systems, 64, 130-141.
Hou, C.-K. (2012). Examining the effect of user satisfaction on system usage and individual performance with business intelligence systems: An empirical study of Taiwan's electronics industry. International Journal of Information Management, 32(6), 560-573.
Hsieh, J. P.-A., Rai, A., & Xu, S. X. (2011). Extracting business value from IT: A sensemaking perspective of post-adoptive use. Management science, 57(11), 2018-2039.
Iivari, J. (2005). An empirical test of the DeLone-McLean model of information system success. ACM SIGMIS Database: the DATABASE for Advances in Information Systems, 36(2), 8-27.
Işık, Ö., Jones, M. C., & Sidorova, A. (2013). Business intelligence success: The roles of BI capabilities and decision environments. Information & Management, 50(1), 13-23.
Jaworski, B. J., & Kohli, A. K. (1993). Market orientation: antecedents and consequences. The Journal of marketing, 53-70.
Jöreskog, K. G. (1978). Structural analysis of covariance and correlation matrices. Psychometrika, 43(4), 443-477.
Jöreskog, K. G., & Sörbom, D. (1982). Recent developments in structural equation modeling. Journal of marketing research, 404-416.
Kang, S. C., & Snell, S. A. (2009). Intellectual capital architectures and ambidextrous learning: a framework for human resource management. Journal of Management Studies, 46(1), 65-92.
Kiron, D., & Shockley, R. (2011). Creating business value with analytics. MIT Sloan management review, 53(1), 57.

ECONOMIC AND BUSINESS REVIEW | VOL. 22 | No. 2 | 2020 226
Kock, N. (2015). Common method bias in PLS-SEM: A full collinearity assessment approach. International Journal of e-Collaboration (IJeC), 11(4), 1-10.
Kogut, B., & Zander, U. (1992). Knowledge of the firm, combinative capabilities, and the replication of technology. Organization science, 3(3), 383-397.
Koka, B. R., & Prescott, J. E. (2002). Strategic alliances as social capital: A multidimensional view. Strategic Management Journal, 23(9), 795-816.
Kokin, S., & Wang, T. A. (2014). Empirical Research on Business Intelligence Success. Paper presented at the Advanced Materials Research, Vol. 842, pp. 754-758, 2014.
Kositanurit, B., Ngwenyama, O., & Osei-Bryson, K.-M. (2006). An exploration of factors that impact individual performance in an ERP environment: an analysis using multiple analytical techniques. European Journal of Information Systems, 15(6), 556-568.
Kowalczyk, M., & Buxmann, P. (2014). Big Data and information processing in organizational decision processes. Business & Information Systems Engineering, 6(5), 267-278.
Kowalczyk, M., & Buxmann, P. (2015). An ambidextrous perspective on business intelligence and analytics support in decision processes: Insights from a multiple case study. Decision Support Systems, 80, 1-13.
Kowalczyk, M., Buxmann, P., & Besier, J. (2013). Investigating Business Intelligence and Analytics from a Decision Process Perspective: A Structured Literature Review: Darmstadt Technical University, Department of Business Administration, Economics and Law, Institute for Business Studies (BWL).
Lane, P. J., Koka, B. R., & Pathak, S. (2006). The reification of absorptive capacity: A critical review and rejuvenation of the construct. Academy of management review, 31(4), 833-863. doi: 10.5465/amr.2006.22527456
Lavalle, S., Lesser, E., Shockley, R., Hopkins, M. S., & Kruschwitz, N. (2011). Big Data, Analytics and the Path From Insights to Value. MIT Sloan management review, 52(2), 21-32.
Lawshe, C. H. (1975). A quantitative approach to content validity. Personnel psychology, 28(4), 563-575.
K. BOŽIČ, V. DIMOVSKI | THE RELATIONSHIP BETWEEN BUSINESS INTELLIGENCE ... 227
Lee, Y. W., Strong, D. M., Kahn, B. K., & Wang, R. Y. (2002). AIMQ: a methodology for information quality assessment. Information & Management, 40(2), 133-146.
Leonard-Barton, D. (1995). Wellsprings of knowledge: Building and sustaining the sources of innovation. University of Illinois at Urbana-Champaign's Academy for Entrepreneurial Leadership Historical Research Reference in Entrepreneurship.
Lichtenthaler, U. (2009). Absorptive capacity, environmental turbulence, and the complementarity of organizational learning processes. Academy of management journal, 52(4), 822-846.
Lohmoller, J.-B. (1988). The PLS program system: Latent variables path analysis with partial least squares estimation. Multivariate Behavioral Research, 23(1), 125-127.
Lynn, M. R. (1986). Determination and Quantification Of Content Validity. Nursing research, 35(6), 382-386.
Mahmood, M. A., Hall, L., & Swanberg, D. L. (2001). Factors affecting information technology usage: A meta-analysis of the empirical literature. Journal of Organizational Computing and Electronic Commerce, 11(2), 107-130.
Malhotra, A., Gosain, S., & El Sawy, O. A. (2005). Absorptive capacity configurations in supply chains: Gearing for partner-enabled market knowledge creation. MIS quarterly, 29(1), 145-187.
Manyika, J., Chui, M., Brown, B., Bughin, J., Dobbs, R., Roxburgh, C., & Byers, A. H. (2011). Big data: The next frontier for innovation, competition, and productivity. McKinsey Global Institute (http://www.mckinsey.com/insights/mgi/research/technology_and_innovation/big_data_the_next_frontier_for_innovation).
Matzler, K., Bailom, F., & Mooradian, T. A. (2007). Intuitive decision making. MIT Sloan management review, 49(1), 13.
McAfee, A., Brynjolfsson, E., Davenport, T. H., Patil, D., & Barton, D. (2012). Big data: The management revolution. Harvard business review, 90(10), 60-68.
McGill, T., Hobbs, V., & Klobas, J. (2003). User developed applications and information systems success: A test of DeLone and McLean's model. Information Resources Management Journal (IRMJ), 16(1), 24-45.
ECONOMIC AND BUSINESS REVIEW | VOL. 22 | No. 2 | 2020 228
McKinney, V., Yoon, K., & Zahedi, F. M. (2002). The measurement of web-customer satisfaction: An expectation and disconfirmation approach. Information Systems Research, 13(3), 296-315.
Minelli, M., Chambers, M., & Dhiraj, A. (2012). Big data, big analytics: emerging business intelligence and analytic trends for today's businesses: John Wiley & Sons.
Moore, G. C., & Benbasat, I. (1991). Development of an instrument to measure the perceptions of adopting an information technology innovation. Information Systems Research, 2(3), 192-222.
Nelson, R. R., Todd, P. A., & Wixom, B. H. (2005). Antecedents of information and system quality: an empirical examination within the context of data warehousing. Journal of Management Information Systems, 21(4), 199-235.
Nguyen, T. D., Nguyen, T. M., & Cao, T. H. (2015). Information Systems Success: A Literature Review. In T. K. Dang, R. Wagner, J. Küng, N. Thoai, M. Takizawa, & E. Neuhold (Series Eds.), Future Data and Security Engineering (pp. 242-256). Cham: Springer International Publishing.
Petter, S., DeLone, W., & McLean, E. (2008). Measuring information systems success: models, dimensions, measures, and interrelationships. European Journal of Information Systems, 17(3), 236-263.
Petter, S., DeLone, W., & McLean, E. R. (2013). Information Systems Success: The Quest for the Independent Variables. Journal of Management Information Systems, 29(4), 7-62. doi: 10.2753/MIS0742-1222290401
Petter, S., Straub, D., & Rai, A. (2007). Specifying formative constructs in information systems research. MIS quarterly, 623-656.
Podsakoff, P. M., MacKenzie, S. B., Lee, J.-Y., & Podsakoff, N. P. (2003). Common method biases in behavioral research: A critical review of the literature and recommended remedies. Journal of Applied Psychology, 88(5), 879.
Popovič, A., Coelho, P. S., & Jaklič, J. (2009). The impact of business intelligence system maturity on information quality. Information research, 14(4).
Popovič, A., Hackney, R., Coelho, P. S., & Jaklič, J. (2012). Towards business intelligence systems success: Effects of maturity and culture on analytical decision making. Decision Support Systems, 54(1), 729-739.

K. BOŽIČ, V. DIMOVSKI | THE RELATIONSHIP BETWEEN BUSINESS INTELLIGENCE ... 229
Popovič, A., Hackney, R., Coelho, P. S., & Jaklič, J. (2014). How information-sharing values influence the use of information systems: An investigation in the business intelligence systems context. The Journal of Strategic Information Systems, 23(4), 270-283.
Premkumar, G., & King, W. R. (1994). Organizational characteristics and information systems planning: An empirical study. Information Systems Research, 5(2), 75-109.
Rai, A., Lang, S. S., & Welker, R. B. (2002). Assessing the validity of IS success models: An empirical test and theoretical analysis. Information Systems Research, 13(1), 50-69.
Raisch, S., & Birkinshaw, J. (2008). Organizational ambidexterity: Antecedents, outcomes, and moderators. Journal of management, 34(3), 375-409. doi: 10.1177/0149206308316058
Ransbotham, S., Kiron, D., & Prentice, P. K. (2016). Beyond the Hype: The Hard Work Behind Analytics Success. MIT Sloan management review, 57(3).
Reinartz, W., Haenlein, M., & Henseler, J. (2009). An empirical comparison of the efficacy of covariance-based and variance-based SEM. International Journal of Research in Marketing, 26(4), 332-344.
Ringle, C. M., Sarstedt, M., & Straub, D. W. (2012). Editor's Comments: A Critical Look at the Use of PLS-SEM in" MIS Quarterly". MIS quarterly, iii-xiv.
Ringle, C. M., Wende, S., & Becker, J.-M. (2015). SmartPLS 3. Boenningstedt: SmartPLS GmbH, http://www.smartpls.com.
Rivard, S., Poirier, G., Raymond, L., & Bergeron, F. (1997). Development of a measure to assess the quality of user-developed applications. ACM SIGMIS Database: the DATABASE for Advances in Information Systems, 28(3), 44-58.
Roberts, N., Galluch, P. S., Dinger, M., & Grover, V. (2012). Absorptive Capacity and Information Systems Research: Review, Synthesis, and Directions for Future Research. MIS quarterly, 36(2), 625-648.
Rönkkö, M., & Ylitalo, J. (2011). PLS marker variable approach to diagnosing and controlling for method variance. Paper presented at the ICIS 2011 Proceedings. 8.
Sabherwal, R., Jeyaraj, A., & Chowa, C. (2006). Information system success: Individual and organizational determinants. Management science, 52(12), 1849-1864.

ECONOMIC AND BUSINESS REVIEW | VOL. 22 | No. 2 | 2020 230
Saeed, K. A., & Abdinnour-Helm, S. (2008). Examining the effects of information system characteristics and perceived usefulness on post adoption usage of information systems. Information & Management, 45(6), 376-386.
Saeed, K. A., Hwang, Y., & Mun, Y. Y. (2003). Toward an integrative framework for online consumer behavior research: a meta-analysis approach. Journal of Organizational and End User Computing (JOEUC), 15(4), 1-26.
Sangari, M. S., & Razmi, J. (2015). Business intelligence competence, agile capabilities, and agile performance in supply chain: An empirical study. The International Journal of Logistics Management, 26(2), 356-380.
Sarstedt, M., & Mooi, E. (2014). Cluster analysis A concise guide to market research (pp. 273-324): Springer.
Seddon, P. B. (1997). A respecification and extension of the DeLone and McLean model of IS success. Information Systems Research, 8(3), 240-253.
Sedera, D., & Gable, G. (2004). A factor and structural equation analysis of the enterprise systems success measurement model. Paper presented at the ICIS 2004 Proceedings, 36.
Sharma, R., Mithas, S., & Kankanhalli, A. (2014). Transforming decision-making processes: a research agenda for understanding the impact of business analytics on organisations. European Journal of Information Systems, 23(4), 433-441.
Shollo, A., & Galliers, R. D. (2016). Towards an understanding of the role of business intelligence systems in organisational knowing. Information Systems Journal, 26(4), 339-367. doi: 10.1111/isj.12071
Shuradze, G., & Wagner, H.-T. (2016). Towards a Conceptualization of Data Analytics Capabilities. Paper presented at the 2016 49th Hawaii International Conference on System Sciences (HICSS).
Siemens, G., & Long, P. (2011). Penetrating the fog: Analytics in learning and education. EDUCAUSE review, 46(5), 30.
Simsek, Z. (2009). Organizational ambidexterity: Towards a multilevel understanding. Journal of Management Studies, 46(4), 597-624.
K. BOŽIČ, V. DIMOVSKI | THE RELATIONSHIP BETWEEN BUSINESS INTELLIGENCE ... 231
Srivardhana, T., & Pawlowski, S. D. (2007). ERP systems as an enabler of sustained business process innovation: A knowledge-based view. The Journal of Strategic Information Systems, 16(1), 51-69.
Teece, D. J., Pisano, G., & Shuen, A. (1997). Dynamic capabilities and strategic management. Strategic Management Journal, 18(7), 509-533.
Torres, R., Sidorova, A., & Jones, M. C. (2018). Enabling firm performance through business intelligence and analytics: A dynamic capabilities perspective. Information & Management.
Trieu, V.-H. (2017). Getting value from Business Intelligence systems: A review and research agenda. Decision Support Systems, 93, 111-124. doi: https://doi.org/10.1016/j.dss.2016.09.019
Trkman, P., McCormack, K., De Oliveira, M. P. V., & Ladeira, M. B. (2010). The impact of business analytics on supply chain performance. Decision Support Systems, 49(3), 318-327.
Urbach, N., & Müller, B. (2012). The updated DeLone and McLean model of information systems success Information systems theory (pp. 1-18): Springer.
Venkatesh, V., Brown, S. A., Maruping, L. M., & Bala, H. (2008). Predicting different conceptualizations of system use: the competing roles of behavioral intention, facilitating conditions, and behavioral expectation. MIS quarterly, 483-502.
Venkatesh, V., Morris, M. G., Davis, G. B., & Davis, F. D. (2003). User acceptance of information technology: Toward a unified view. MIS quarterly, 425-478.
Verona, G., & Ravasi, D. (2003). Unbundling dynamic capabilities: an exploratory study of continuous product innovation. Industrial and corporate change, 12(3), 577-606.
Vidgen, R., Shaw, S., & Grant, D. B. (2017). Management challenges in creating value from business analytics. European Journal of Operational Research, 261(2), 626-639.
Volberda, H., & Van Bruggen, G. (1997). Environmental turbulence: A look into its dimensionality (Dynamiek in Bedrijfsvoering. NOBO ed.). Enschede, The Netherlands: M. T. A. Bemelmans.

ECONOMIC AND BUSINESS REVIEW | VOL. 22 | No. 2 | 2020 232
Wales, W. J., Parida, V., & Patel, P. C. (2013). Too much of a good thing? Absorptive capacity, firm performance, and the moderating role of entrepreneurial orientation. Strategic Management Journal, 34(5), 622-633.
Wang, C. L., & Ahmed, P. K. (2007). Dynamic capabilities: A review and research agenda. International journal of management reviews, 9(1), 31-51.
Weill, P., & Vitale, M. (1999). Assessing the health of an information systems applications portfolio: An example from process manufacturing. MIS quarterly, 601-624.
Wieder, B., & Ossimitz, M.-L. (2015). The impact of Business Intelligence on the quality of decision making–a mediation model. Procedia Computer Science, 64, 1163-1171.
Wieder, B., Ossimitz, M.-L., & Chamoni, P. (2012). The Impact of Business Intelligence Tools on Performance: A User Satisfaction Paradox? International Journal of Economic Sciences & Applied Research, 5(3), 7-32.
Wixom, B., Ariyachandra, T., Douglas, D. E., Goul, M., Gupta, B., Iyer, L. S., . . . Turetken, O. (2014). The current state of business intelligence in academia: The arrival of big data. CAIS, 34, 1.
Wixom, B. H., & Watson, H. J. (2001). An empirical investigation of the factors affecting data warehousing success. MIS quarterly, 17-41.
Yeoh, W., & Popovič, A. (2016). Extending the understanding of critical success factors for implementing business intelligence systems. Journal of the Association for Information Science and Technology, 67(1), 134-147.
Zahra, S. A., & George, G. (2002). Absorptive capacity: A review, reconceptualization, and extension. Academy of management review, 27(2), 185-203. doi: 10.5465/amr.2002.6587995