The Relationship Between Administrative Support And ...
125
Eastern Kentucky University Encompass Online eses and Dissertations Student Scholarship January 2015 e Relationship Between Administrative Support And Burnout In Turnaround Schools Kevin Sco Crosby Eastern Kentucky University Follow this and additional works at: hps://encompass.eku.edu/etd Part of the Educational Administration and Supervision Commons , and the Teacher Education and Professional Development Commons is Open Access Dissertation is brought to you for free and open access by the Student Scholarship at Encompass. It has been accepted for inclusion in Online eses and Dissertations by an authorized administrator of Encompass. For more information, please contact [email protected]. Recommended Citation Crosby, Kevin Sco, "e Relationship Between Administrative Support And Burnout In Turnaround Schools" (2015). Online eses and Dissertations. 355. hps://encompass.eku.edu/etd/355
Transcript of The Relationship Between Administrative Support And ...
Eastern Kentucky UniversityEncompass
Online Theses and Dissertations Student Scholarship
January 2015
The Relationship Between Administrative SupportAnd Burnout In Turnaround SchoolsKevin Scott CrosbyEastern Kentucky University
Follow this and additional works at: https://encompass.eku.edu/etd
Part of the Educational Administration and Supervision Commons, and the Teacher Educationand Professional Development Commons
This Open Access Dissertation is brought to you for free and open access by the Student Scholarship at Encompass. It has been accepted for inclusionin Online Theses and Dissertations by an authorized administrator of Encompass. For more information, please contact [email protected].
Recommended CitationCrosby, Kevin Scott, "The Relationship Between Administrative Support And Burnout In Turnaround Schools" (2015). Online Thesesand Dissertations. 355.https://encompass.eku.edu/etd/355
THE RELATIONSHIP BETWEEN ADMINISTRATIVE SUPPORT AND BURNOUT
IN TURNAROUND SCHOOLS
By
KEVIN S. CROSBY
Master of Science
Eastern Kentucky University
Richmond, Kentucky
2003
Bachelor of Science
Eastern Kentucky University
Richmond, Kentucky
1994
Submitted to the Faculty of the Graduate School of
Eastern Kentucky University
In partial fulfillment of the requirements
For the degree of
DOCTOR OF EDUCATION
December, 2015

Running head: BURNOUT IN TURNAROUND SCHOOLS
ii
Copyright © Kevin Crosby, 2015
All rights reserved
Running head: BURNOUT IN TURNAROUND SCHOOLS
iii
DEDICATION
This dissertation is dedicated to my family.
Running head: BURNOUT IN TURNAROUND SCHOOLS
iv
ACKNOWLEDGMENTS
I would like to thank my committee chair, Dr. Charles Hausman, for his guidance and
wisdom. I would also like to thank my other committee members, Dr. Robert Biggin, Dr.
James Bliss, and Dr. James Dantic, for their comments and assistance over during this
process. I would like to thank my wife, Donna, for her flexibility in this process. I would
also like to thank by two sons, David and Jonathan, for understanding when I was
unavailable. I would also like to express my gratitude to all my professors at Eastern
Kentucky University for helping me become a better teacher and leader in my school.
Running head: BURNOUT IN TURNAROUND SCHOOLS
v
ABSTRACT
This study looked at the relationship between administrative support and teacher burnout
in two federally funded turnaround middle schools. Teacher burnout indicators include
signs of lacking accomplishment, mental and physical fatigue, and depersonalization.
Administrative support factors include positive communication, vision, district support,
and school support. The major findings of this study showed that school level support
played a significant role in predicting teacher burnout. Professional development support
played a significant role in predicting teacher burnout, but not to the same extent as
school level support. Central office support was not a significant factor in predicting
teacher burnout or any burnout sub domains. Recommendations include maintain strong
school level administrative support. A school level administrator should focus on
implementing professional development that is data based, aligned with the school
improvement plan, time appropriate, and differentiated.
Running head: BURNOUT IN TURNAROUND SCHOOLS
vi
TABLE OF CONTENTS
Chapter 1 ............................................................................................................................. 1
Introduction ......................................................................................................................... 1
General Background ........................................................................................................ 1
Statement of Problem ...................................................................................................... 8
Purpose of Study ........................................................................................................... 13
Summary ....................................................................................................................... 14
Chapter 2 ........................................................................................................................... 15
Literature Review.............................................................................................................. 15
The Teacher ................................................................................................................... 15
Turnaround Schools ...................................................................................................... 18
Administrative Support Predictors ................................................................................ 20
Positive administrative communication..................................................................... 21
Vision setting. ............................................................................................................ 23
District support of teachers. ....................................................................................... 25
School level support .................................................................................................. 31
Teacher Burnout ............................................................................................................ 32
Chapter 3 ........................................................................................................................... 35
Methods............................................................................................................................. 35
Introduction ................................................................................................................... 35
Purpose .......................................................................................................................... 35
Research Question ......................................................................................................... 36
Context of Study............................................................................................................ 37
Setting ........................................................................................................................ 37
Sample ........................................................................................................................... 43
The Teacher Survey ...................................................................................................... 45
Running head: BURNOUT IN TURNAROUND SCHOOLS
vii
Research Design ............................................................................................................ 46
Analysis ......................................................................................................................... 47
Limitations of Study ...................................................................................................... 48
Chapter 4 ........................................................................................................................... 50
Results ............................................................................................................................... 50
Introduction ................................................................................................................... 50
Purpose. ..................................................................................................................... 50
Context of Study............................................................................................................ 50
Setting ........................................................................................................................ 50
Reliability of Survey Questions .................................................................................... 52
School Leadership Survey Questions ........................................................................ 53
Central Office Support Survey Questions ..................................................................... 57
Professional Development Survey Questions ............................................................... 61
Teacher Burnout ............................................................................................................ 64
Bivariate Correlations of Administrative Support Variables with Teacher Burnout
Items .............................................................................................................................. 64
Multiple Regressions ..................................................................................................... 66
Chapter 5 ........................................................................................................................... 73
Conclusion, Discussion, and Recommendations .............................................................. 73
Purpose of Study ........................................................................................................... 73
Findings and Discussion................................................................................................ 73
Recommendations ......................................................................................................... 81
Areas for Further Study ................................................................................................. 84
References ......................................................................................................................... 86
Appendix ......................................................................................................................... 101
Appendix A ..................................................................................................................... 102
School Improvement Grant (SIG) Teacher Survey ................................................. 102
Running head: BURNOUT IN TURNAROUND SCHOOLS
viii
LIST OF TABLES
Table 3. 1 Ethnic Groups in School District ..................................................................... 38
Table 3. 2 District Fall Enrollment ................................................................................... 38
Table 3. 3 Economic Status of Students ........................................................................... 39
Table 3. 4 English as a Learned Language ...................................................................... 40
Table 3. 5 Student Population in Each Middle School ..................................................... 40
Table 3. 6 Middle School Income Levels ......................................................................... 41
Table 3. 7 Middle School Ethnic Compositions ............................................................... 42
Table 3. 8 Middle School ELL ......................................................................................... 43
Table 3. 9 Education Level ............................................................................................... 44
Table 3. 10 Grade Level Taught ....................................................................................... 45
Table 4. 1 Cronbach’s Alpha of School Leadership Items ............................................... 52
Table 4. 2Cronbach’s Alpha of Burnout Items ................................................................. 52
Table 4. 3School Leadership Means (predictor variable) ................................................. 53
Table 4. 4 My principal is highly visible around the school ............................................. 54
Table 4. 5 The faculty and school administration have a shared vision ........................... 55
Table 4. 6 If I have a problem, the administration gives me the support I want .............. 56
Table 4. 7 Central Office Support (predictor variable) ................................................... 588
Table 4. 8 District office staff facilitate using data to improve student learning.............. 59
Table 4. 9 There is open, effective communication between district office staff ............. 60
Table 4. 10 Professional Development (predictor variable) ............................................. 61
Table 4. 11 Teachers are encouraged to reflect on their own practice. ............................ 63
Table 4. 12 Professional development is differentiated to meet the needs of individual
teachers. ............................................................................................................................ 63
Table 4. 13 Teacher Burnout Descriptive Statistics.......................................................... 64
Table 4. 14 Bivariate Correlations between Administrative Support and Burnout .......... 65
Table 4. 15 Regression on Teacher Burnout ..................................................................... 67
Table 4. 16 Regression on Emotional exhaustion ............................................................. 68
Table 4. 17 Regression on Low Personal Accomplishments ............................................ 70
Table 4. 18 Regression on Depersonalization................................................................... 72
Running head: BURNOUT IN TURNAROUND SCHOOLS
ix
LIST OF FIGURES
Figure 3. 1 Conceptual Framework for Study .................................................................. 37
Running head: BURNOUT IN TURNAROUND SCHOOLS
1
Chapter 1
Introduction
General Background
Each person born in the United States spends at least thirteen years of their
childhood in front of teachers. Depending on the state requirements, this time spent with
teachers could reach over 14,000 hours or 575 days. There is no doubt that teachers play
an important role in the life of a person. Most of the time, a teacher helps a child read,
write, compute, problem solve, and more. It would not be difficult to argue that teachers
play one of the most important roles of a person’s life. Since the teacher plays such an
important role, developing ways to recruit and train individuals to become great teachers
is needed. In addition to finding and training great teachers, an emphasis on retaining
great teachers is important.
Some teachers do not leave the profession, but their ability to teach has left. The
joy and passion of the profession has left, and they struggle every day. No parent wants
that type of teacher in their child’s class. They want a teacher who is full of energy and
passion for educating the students in their classes. Teachers who have lost the energy and
passion to teach often are burned out. Burned out teachers can be found anywhere. Just
like most schools, ones in low income communities have their fair share of burned out
Running head: BURNOUT IN TURNAROUND SCHOOLS
2
teachers. For years, schools in low income communities have been established but often
ignored.
Of the major industrialized countries, the United States is one of the top in
educating its youth population (Childinfo.org, 2012). Since the inception of the country,
laws were written to ensure the education of the entire population (Shurtleff, 1853-1854).
Compulsory education has served the country well by establishing one of the largest and
relatively stable economies in the modern world (Imf.org, 2013). The basic structure of
education in the United States is different from what some people might expect. With a
nation-wide focus on education, someone might expect the federal government to play a
primary role. To the contrary, the federal government plays a secondary role, and the
individual states play a primary role.
Individual states manage and provide the majority of the funding for their schools
through property taxes. Even though individual states play a primary role in funding
education, the federal government has stepped in to provide additional funding for some
of the most challenged schools. The Elementary and Secondary Education Act (1965)
provided federal funding for schools that have a large proportion of low socio-economic
students (Ed.gov, 2013). The most commonly associated name for this funding source is
Title 1. Since 1965, Title 1 funding has been applied for and used to help raise
achievement in schools across the country.
Running head: BURNOUT IN TURNAROUND SCHOOLS
3
Title 1 funding flows through states to districts, and then to individual schools. It
is designed to be distributed to individual schools in need. Building principals utilize
Title 1 funds and support additional teachers, tutoring services, and other educationally
related materials for their schools. Since Title 1 funding has been in place since 1965,
individual schools have become dependent upon the money. Without the funding,
principals would be forced to fire teachers and therefore greatly decrease the amount of
educational services each student at their school receives.
Since many American schools are utilizing Title 1 funds, the federal government
has decided to assess whether the funds are being used to help students with
disadvantages. However, it has become increasingly obvious that the schools serving the
poorest populations were not successful at teaching their economically disadvantaged
students. The No Child Left Behind Act was passed in 2002 to determine which Title 1
schools are making Adequate Yearly Progress (AYP) with their entire student population
(No Child Left Behind [NCLB], 2002). Each state was required to put in place a testing
system for each school and set benchmarks to determine if AYP was being made. If
schools were considered Title 1 schools, they faced intervention if they did not make
AYP.
Teachers in these schools are constantly being pressured to teach so that all their
students show AYP. If schools cannot show AYP, then the following consequences are
initiated (No Child Left Behind Interpretive Guide, 2011)
Running head: BURNOUT IN TURNAROUND SCHOOLS
4
District Improvement - Yr 1 (2 years not making AYP): Notify parents using
state provided information, revise district improvement plan, request technical
assistance if needed, and may be subject to corrective action from the State
Department of Education.
District Improvement - Yr 2 (3 years not making AYP): Notify parents using
state-provided information, revise district improvement plan, request technical
assistance if needed, and may be subject to corrective action from the State
Department of Education.
Corrective Action (4 years not making AYP): Notify parents using state-
provided information, revise district improvement plan, technical assistance is
provided by the state, and will be subject to corrective action from the State
Department of Education.
According to 2011 data (No Child Left Behind Adequate Yearly Progress Report for
Kentucky, 2011), only 52% of target goals have been reached in all K-12 schools across
Kentucky. Districts and their schools do not want to be placed under a corrective action
plan and therefore initiate many new structures and strategies designed to raise test
scores. These new structures and strategies are passed down to teachers, and they must
initiate them. In 2008, 12,599 schools in the United States were considered to be in
improvement, under a corrective action plan, or being restructured (US Department of
Education, 2013)
Running head: BURNOUT IN TURNAROUND SCHOOLS
5
The accountability to make AYP in the most struggling schools has created a
great deal of pressure for most teachers. Simply mentioning the phrase “NCLB” during
faculty meetings results in distaste amongst teachers. A casual observer will easily see
this in a school. Administration places a great deal of pressure on the teachers to close
achievement gaps. Even though the goals of NCLB seem valiant, the resulting pressure
on teachers and even administration can lead to a huge amount of stress that interferes
with teaching.
In 2009, the United States Congress passed and President Obama signed the
American Recovery and Reinvestment Act (ARRA). Included in the ARRA, was 3.5
billion dollars in grant money designed to help the lowest 5% performing Title 1 schools.
These schools were be awarded money in the form of School Improvement Grants (SIG).
SIG grants were awarded to the individual school and could be worth up to 2 million
dollars. The grants do not replace normal funding from the state. Schools who accepted
the SIGs were forced to follow one of four models designed to improve their academic
performance. The four models were turnaround, transformational, school closure, and
restart models (McNeil, 2009).
All four models have their similarities and differences. Schools implementing
school closure is rather self-explanatory. The school will close, and the affected students
and staff will move to other schools. Restart models essentially “restart” the school as a
charter school. This model was not widely accepted (Zehr, 2011; Klein 2011). The
Running head: BURNOUT IN TURNAROUND SCHOOLS
6
Transformational and Turnaround models are similar. The biggest difference between
transformational and turnaround is a drastic staff overhaul and autonomy.
Transformational schools do not have much staff changes, but there are mandated
changes initiated by a local educational agency. Approximately 70% of schools
accepting SIGs are choosing the transformational model (Cavanagh, 2011). Turnaround
schools have drastic teacher and staff overhauls but are given more autonomy once the
staffing changes are put in place. About 21% of schools have chosen the turnaround
model (Klein, 2011)
While turnaround schools were given very large amounts of funding, there were
many stipulations placed on acceptance of the money. The schools faced major structural
changes that were designed to help their populations achieve at higher rates. Principal
and teacher replacements coupled with tough teacher effectiveness evaluations were all
part of the turnaround restructuring models. The idea of the drastic restructuring
stemmed from the belief that the adults in the school had been unable to teach the student
population effectively. Since the adults cannot effectively teach the students, then most
of the adults must be replaced. Finding teachers who want to be in a struggling school is
challenging (Klein, 2012). Aladjem (2010) found that most turnaround schools do not
see drastic improvements until 3-5 years after implementation. Finding teachers who
want to be in struggling schools coupled with a 3-5 year wait period for improvements
could be a daunting task with huge long-term implications for the school.
Running head: BURNOUT IN TURNAROUND SCHOOLS
7
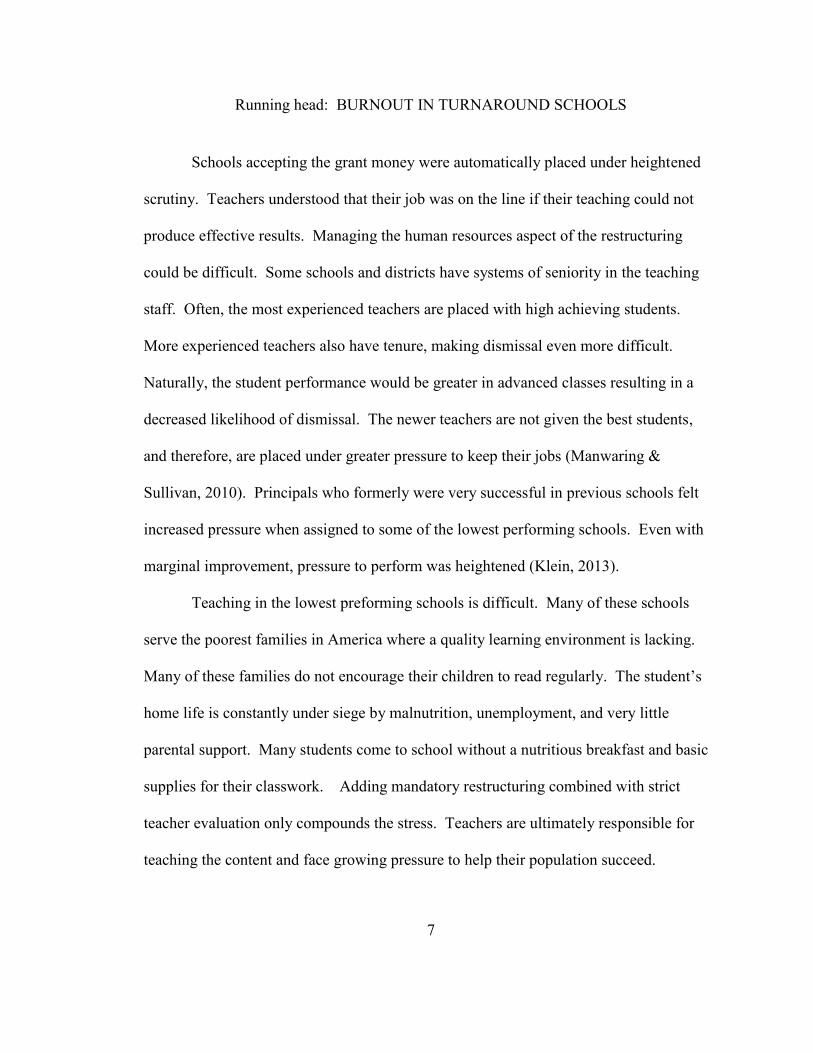
Schools accepting the grant money were automatically placed under heightened
scrutiny. Teachers understood that their job was on the line if their teaching could not
produce effective results. Managing the human resources aspect of the restructuring
could be difficult. Some schools and districts have systems of seniority in the teaching
staff. Often, the most experienced teachers are placed with high achieving students.
More experienced teachers also have tenure, making dismissal even more difficult.
Naturally, the student performance would be greater in advanced classes resulting in a
decreased likelihood of dismissal. The newer teachers are not given the best students,
and therefore, are placed under greater pressure to keep their jobs (Manwaring &
Sullivan, 2010). Principals who formerly were very successful in previous schools felt
increased pressure when assigned to some of the lowest performing schools. Even with
marginal improvement, pressure to perform was heightened (Klein, 2013).
Teaching in the lowest preforming schools is difficult. Many of these schools
serve the poorest families in America where a quality learning environment is lacking.
Many of these families do not encourage their children to read regularly. The student’s
home life is constantly under siege by malnutrition, unemployment, and very little
parental support. Many students come to school without a nutritious breakfast and basic
supplies for their classwork. Adding mandatory restructuring combined with strict
teacher evaluation only compounds the stress. Teachers are ultimately responsible for
teaching the content and face growing pressure to help their population succeed.
Running head: BURNOUT IN TURNAROUND SCHOOLS
8
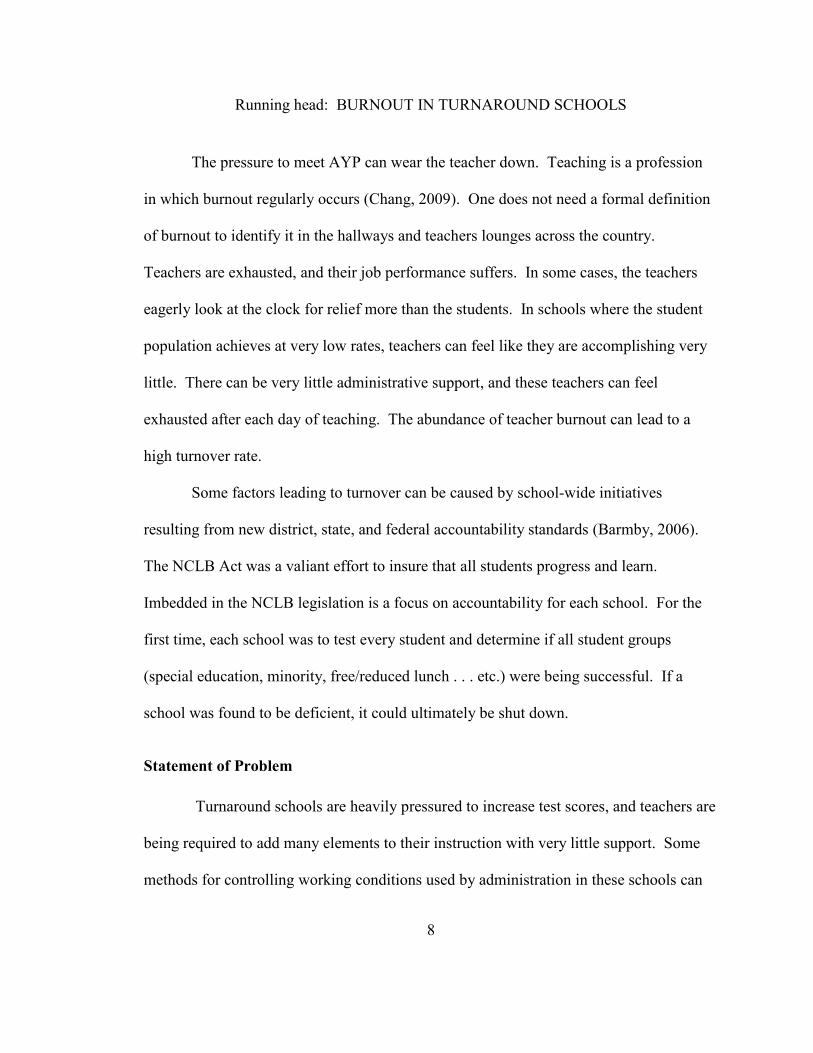
The pressure to meet AYP can wear the teacher down. Teaching is a profession
in which burnout regularly occurs (Chang, 2009). One does not need a formal definition
of burnout to identify it in the hallways and teachers lounges across the country.
Teachers are exhausted, and their job performance suffers. In some cases, the teachers
eagerly look at the clock for relief more than the students. In schools where the student
population achieves at very low rates, teachers can feel like they are accomplishing very
little. There can be very little administrative support, and these teachers can feel
exhausted after each day of teaching. The abundance of teacher burnout can lead to a
high turnover rate.
Some factors leading to turnover can be caused by school-wide initiatives
resulting from new district, state, and federal accountability standards (Barmby, 2006).
The NCLB Act was a valiant effort to insure that all students progress and learn.
Imbedded in the NCLB legislation is a focus on accountability for each school. For the
first time, each school was to test every student and determine if all student groups
(special education, minority, free/reduced lunch . . . etc.) were being successful. If a
school was found to be deficient, it could ultimately be shut down.
Statement of Problem
Turnaround schools are heavily pressured to increase test scores, and teachers are
being required to add many elements to their instruction with very little support. Some
methods for controlling working conditions used by administration in these schools can
Running head: BURNOUT IN TURNAROUND SCHOOLS
9
seem heavy handed. While some of these initiatives to increase test scores are probably
beneficial to initiate, many are thought to be meaningless.
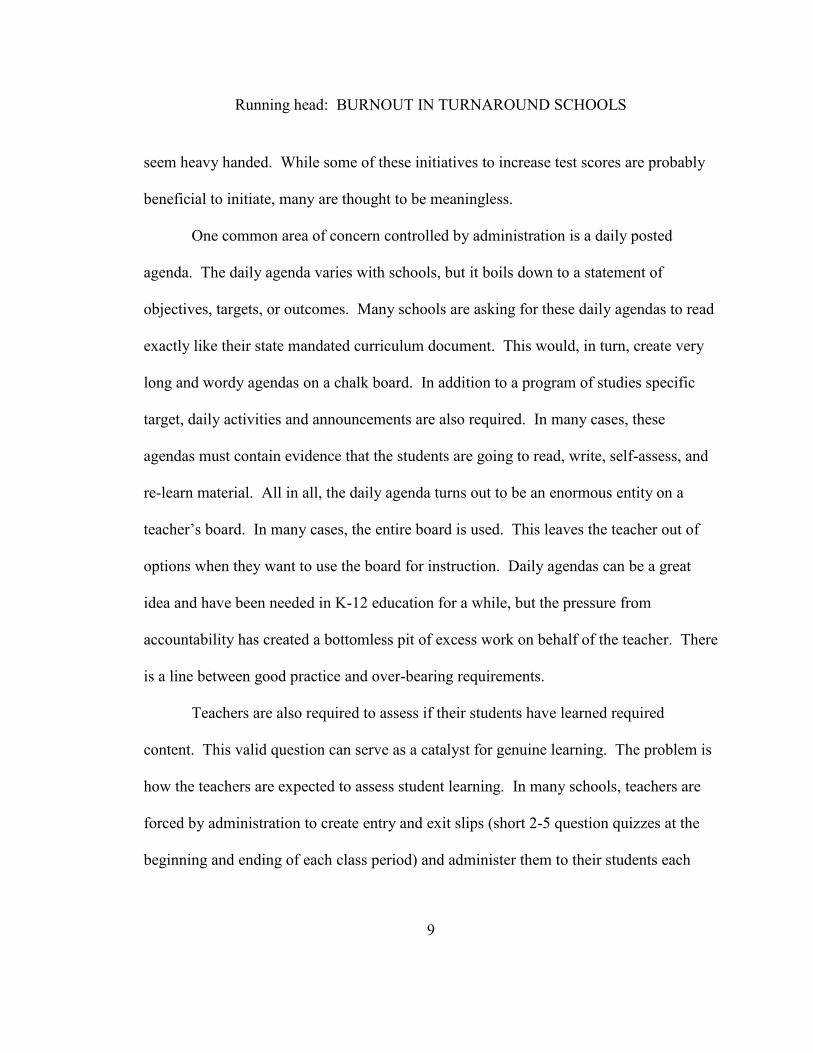
One common area of concern controlled by administration is a daily posted
agenda. The daily agenda varies with schools, but it boils down to a statement of
objectives, targets, or outcomes. Many schools are asking for these daily agendas to read
exactly like their state mandated curriculum document. This would, in turn, create very
long and wordy agendas on a chalk board. In addition to a program of studies specific
target, daily activities and announcements are also required. In many cases, these
agendas must contain evidence that the students are going to read, write, self-assess, and
re-learn material. All in all, the daily agenda turns out to be an enormous entity on a
teacher’s board. In many cases, the entire board is used. This leaves the teacher out of
options when they want to use the board for instruction. Daily agendas can be a great
idea and have been needed in K-12 education for a while, but the pressure from
accountability has created a bottomless pit of excess work on behalf of the teacher. There
is a line between good practice and over-bearing requirements.
Teachers are also required to assess if their students have learned required
content. This valid question can serve as a catalyst for genuine learning. The problem is
how the teachers are expected to assess student learning. In many schools, teachers are
forced by administration to create entry and exit slips (short 2-5 question quizzes at the
beginning and ending of each class period) and administer them to their students each
Running head: BURNOUT IN TURNAROUND SCHOOLS
10
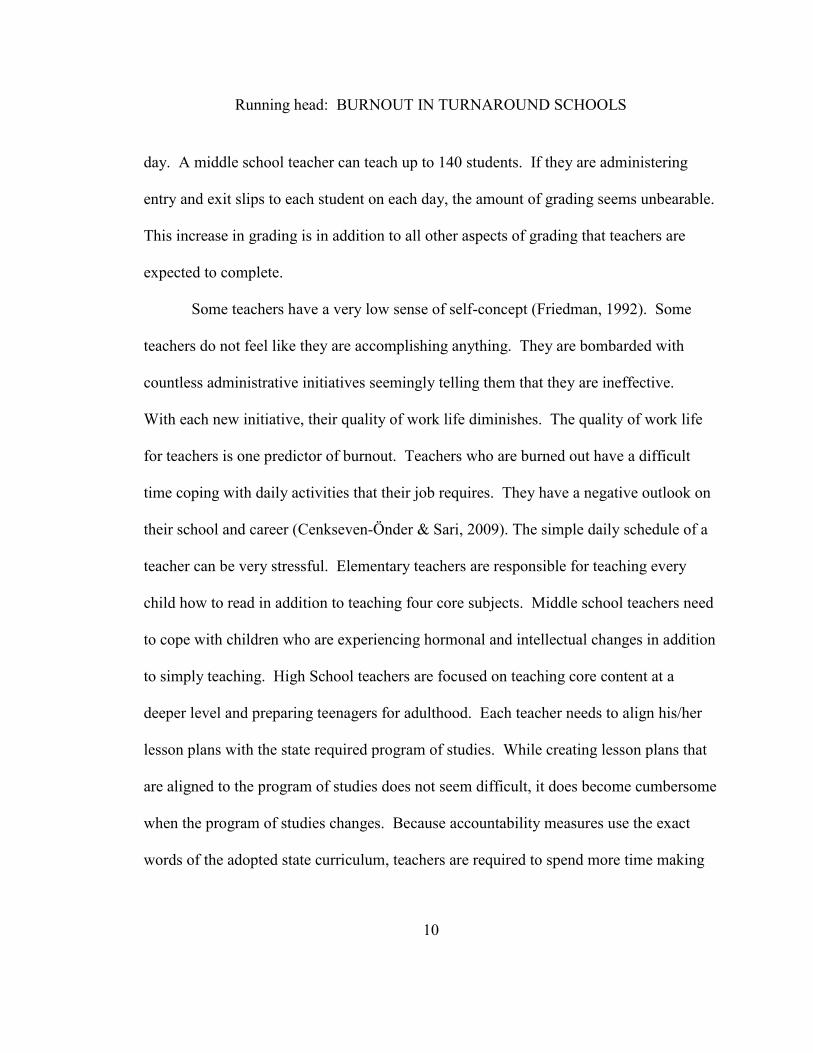
day. A middle school teacher can teach up to 140 students. If they are administering
entry and exit slips to each student on each day, the amount of grading seems unbearable.
This increase in grading is in addition to all other aspects of grading that teachers are
expected to complete.
Some teachers have a very low sense of self-concept (Friedman, 1992). Some
teachers do not feel like they are accomplishing anything. They are bombarded with
countless administrative initiatives seemingly telling them that they are ineffective.
With each new initiative, their quality of work life diminishes. The quality of work life
for teachers is one predictor of burnout. Teachers who are burned out have a difficult
time coping with daily activities that their job requires. They have a negative outlook on
their school and career (Cenkseven-Önder & Sari, 2009). The simple daily schedule of a
teacher can be very stressful. Elementary teachers are responsible for teaching every
child how to read in addition to teaching four core subjects. Middle school teachers need
to cope with children who are experiencing hormonal and intellectual changes in addition
to simply teaching. High School teachers are focused on teaching core content at a
deeper level and preparing teenagers for adulthood. Each teacher needs to align his/her
lesson plans with the state required program of studies. While creating lesson plans that
are aligned to the program of studies does not seem difficult, it does become cumbersome
when the program of studies changes. Because accountability measures use the exact
words of the adopted state curriculum, teachers are required to spend more time making
Running head: BURNOUT IN TURNAROUND SCHOOLS
11
sure their lesson plans use these exact words. The simple task of designing a great lesson
is substituted with hours of planning making sure it uses the correct words. Once an
effective lesson is created, the possibility of a new and revised curriculum looms in the
distance. For example, the science program of studies is currently being re-written and
all science teachers across the nation will need to align their lesson plans.
There are students who require special education services with individual
education plans, other disabled students with 504 plans, gifted and talented students with
individual plans and students who have limited English proficiency. Teachers need to
attend meetings to design these individual plans, and these meetings are often long and
time consuming. On many occasions, teachers can lose their planning period during the
school day that is supposed to be used for grading papers and setting up daily activities.
There are many other responsibilities that teachers are required to fulfill. For
example, because daily attendance is part of a school’s accountability index, teachers are
required to call parents when multiple absences occur and fill out truancy reports.
Teachers are also required to attend professional development activities for which they
may not be compensated. All of these activities take time from meaningful planning and
instruction. When one adds seemingly useless paperwork, evaluations, and state
mandated testing, the teacher can reach burnout very quickly.
A beginning teacher has an even more stressful life. In Kentucky for example,
first year teachers are required to go through the Kentucky Teacher Internship Program
Running head: BURNOUT IN TURNAROUND SCHOOLS
12
(KTIP). The KTIP is a rigorous set of requirements to which each new teacher must
adhere during his/her first year teaching in order to finalize his/her teaching certificate.
The requirements are heavy for an inexperienced teacher. Beginning teachers have no
real job experience. This lack of experience requires hours of developing daily lesson
plans in addition to the hours of observations, meetings, and everything else that a normal
teacher must endure. Many very good teachers end up leaving the profession early
because of all the seemingly meaningless hoops they need to jump through such as KTIP.
Many things in KTIP are good; the problem is that there are too many. Goddard,
O’Brien, and Goddard (2006) found that beginning teachers are frequently burned out if
they are restricted from being innovative. Instead of creating new and fresh learning
activities for their students, they are forced to follow a standard plan.
Some veteran teachers have been in the business long enough to see multiple core
content restructurings, principals with different leadership styles, teaching programs,
teacher evaluation methods, and required state/federal assessment programs. Many
veteran teachers would freely admit that most of these new required structures add up to
nothing except more stress in their lives. These veteran teachers are counting the days to
when they can retire and live a less stressful life. Betoret (2006) found that when
teachers feel like the structures in place inhibit their ability to teach, burnout occurred.
Self-efficacy is a very important aspect of a teacher’s life. He/she enter the field of
teaching desiring to make a difference in a child’s life. Any restriction to his/her desire
Running head: BURNOUT IN TURNAROUND SCHOOLS
13
leads to burnout. It is interesting to see that many required programs are designed to
make a positive impact on the student’s learning but actually make a negative impact on
the implementer of the initiative.
Purpose of Study
The purpose of this study is to determine the relationship between the
administrative support in turnaround schools and teacher burnout. Burnout amongst
teachers can happen at any school, but this study will determine the influence of
administrative support on burnout in schools that have been labeled as turnaround. The
three indicators of burnout as defined by the Maslach Burnout Inventory (MBI) are
emotional exhaustion, feelings of accomplishment, and depersonalization. This study
will take the three indicators of teacher burnout identified by Maslach and identify the
extent to which administrative support influence each and predict burnout as a whole.
My hypothesis is that the following forms of administrative support found in
turnaround schools will predict one or more of the MBI indicators for burnout and
burnout as a whole.
1. Administrative Support
a. Professional development
b. School leadership support
c. District support
Running head: BURNOUT IN TURNAROUND SCHOOLS
14
Summary
The poorest performing schools as defined by NCLB can apply for SIGs in order
to improve the school. The SIG mandates one of four models to be implemented. The
turnaround model is the focus of this paper. These SIG and turnaround models can create
working conditions in which teachers demonstrate burnout. This study will look at forms
of administrative support in turnaround schools to determine if they contribute to teacher
burnout.
Running head: BURNOUT IN TURNAROUND SCHOOLS
15
Chapter 2
Literature Review
The Teacher
Some teachers can have a very low sense of self-concept (Friedman, 1992) and
therefore do not feel like they are accomplishing anything. They are bombarded with
countless initiatives seemingly telling them that they are ineffective. With each new
initiative, their quality of work life diminishes. The quality of work life for teachers is
one predictor of burnout (Cenkseven-Önder, 2009). Teachers who are burned out have a
difficult time coping with daily activities that their job requires. They have a negative
outlook on their school and career (Cenkseven-Önder, 2009). These are areas in which
administrative support could help.
Teachers state they have administrative support when they believe the
administration is there to help them. This can be manifested by the building principal
implementing proper student discipline by supporting the teachers when students are
misbehaving in the classrooms. For example, if a student repeatedly misbehaves, they
would want the principal to help them by implementing some sort of behavior
modification system. A principal who supports the teacher will work with the teacher
and strictly enforce school rules so that the student does not harm a proper classroom
environment. To the contrary, if teachers feel like things are in their way or they are not
Running head: BURNOUT IN TURNAROUND SCHOOLS
16
free to do their job, burnout occurs. Any restriction to their desire to teach leads to
burnout (Betoret, 2006)
Administrative support is not only demonstrated by helping reduce the pressure
from federal and state accountability systems, it is also demonstrated by treating the
teachers as professionals. There are many school-wide initiatives that were created as a
result of the federal, state, and district pressures. Specifically, turnaround schools have
added pressure due to their turnaround status. The school administrator feels a great deal
of pressure and could therefore initiate programs that each teacher needs to implement.
Treating teachers like professionals and relieving pressure placed by various local, state,
and federal regulations can go a long way in supporting teachers.
Teachers often times have a different perspective on education than do policy
makers and the general public. Things like school choice and vouchers are prescribed by
programs in which accountability measures show inadequate progress. These programs
can be highly popular amongst the general public since informed parents often will not
want to send their child to a failing school. There are, however, many negative side
effects of these market driven systems. Many teachers can see through this ‘gaming’ and
‘window dressing’ (Wolf, 2007). They are forced to complete ‘window dressing’
activities and paperwork. These programs get in the way of a teacher’s desire to make a
difference in a child’s life. Teachers would rather be creating new and innovative lessons
than filling out paperwork and grading countless assessments. As a results, teachers can
Running head: BURNOUT IN TURNAROUND SCHOOLS
17
become frustrated and dissatisfied with their careers (Chang, 2009). Compound these
mandated programs with special education, and things can get worse (Talmor, 2005).
Many teachers feel like special need students are just being thrown into their classes
without adequate support in order to fit some new federal program. In all, some teachers
are so dissatisfied with their jobs that they decide to quit the profession altogether.
Of the quitting teachers, most are either at the very beginning of their career or at
the very end (Jianpeng, 1997). 46% of teachers quit after 5 years of service, and of the
46%, job dissatisfaction accounts for about 25% (National Commission of Teaching and
America’s Future [NCTAF], 2003). Barmby (2006) found that teachers leave the
profession due to reasons such as workload/grading, long hours, stress, and
bureaucracy/paperwork. Low salary and lack of administrative support are additional
reasons for teacher attrition (Curtis, 2012). When teachers felt like they worked too
many hours, they posed a greater risk for burnout (McCarthy, 2009). Teachers that are
subjected to poor administrative support are burning out and leaving their jobs. Teacher
dropout is a 7 billion dollar problem in America (NCTAF, 2007). If a typical teacher can
endure 27+ years of service, he/she can retire with a reliable retirement system complete
with health care in some states. A teacher receives modest pay and a schedule which is
friendly to the family. The benefits of teaching are substantial, but many teachers quit
early on in their career and fail to enjoy these perks.

Running head: BURNOUT IN TURNAROUND SCHOOLS
18
Teachers who have left the profession report an extensive list of reasons why they
left. Among other things, accountability and increased paperwork rank very high.
Teachers who are considering leaving the profession cite the exact reasons. The number
one reason for leaving the profession is accountability (Tye, 2002). The very
accountability structures that were put in place to increase student achievement have
pushed some of the best teachers away. Recent federal educational reforms such as
NCLB, have good intentions for student achievement. The problem with these initiatives
is that they require a tremendous amount of assessments and paperwork. Determining
which students groups are lacking quality instruction is worthwhile. Teachers have been
placed under a very large amount of pressure and stress with the addition of these
accountability structures.
Turnaround Schools
For the purposes of this study, a turnaround school will be defined as one of the
lowest 5% performing Title 1 schools, have accepted a SIG under ARRA, and chosen to
implement the turnaround model. To be eligible for Title 1 funds, a school must have a
low socioeconomic population. A low socioeconomic population is usually measured by
the percentage of students receiving free or reduced lunch. Research on federally funded
turnaround schools is emerging. There are, however, many schools that are called
“turnaround” which are similar to the federally funded schools. These schools are
consistently low performing and have initiated programs similar to the ones prescribed by
Running head: BURNOUT IN TURNAROUND SCHOOLS
19
ARRA. The unifying principle for these schools is simple; they want to “turn the school
around.” They want the students to demonstrate adequate progress in core subjects such
as math, english, reading, science, and the social studies.
Turning around a low income and high poverty schools is possible (Chenoweth,
2009). There have been countless successes and failures in turning these schools around.
Because it is possible to turnaround these schools, implementing resources to help
teachers is valid. Since SIG funds were initially issued in 2009 and 2010, data showing
gains and losses are emerging and mixed (Klein & McNeil, 2012). Funding for SIGs
expired at the end of the 2012-2013 school year. SIG funds were awarded to all types of
schools from rural to urban. Data have shown some improvement, but it is not
conclusive over time since most schools have just completed or are in their final year of
implementation (Brownstein, 2012).
In 2012, Thielman conducted research on a Boston area high school labeled
turnaround. The school was not designated as a turnaround school according to ARRA,
but demonstrated the same qualifiers. Thielman (2012) found many factors that
contributed to the success of the school. Some of the results showed that administration
must be accountable and committed to their school. This included allocation of resources.
Teachers were also encouraged to be innovative in their work. When the entire staff was
committed and given reasonable freedom to work, the school improved and began to
turnaround. Conversely, schools which showed poor academic performance had poor
Running head: BURNOUT IN TURNAROUND SCHOOLS
20
administrative support. The poor administrative support could be manifested by
improper training in professional development activities and preventing teachers from
being flexible in their schedules amongst other things (Duke, 2008).
School leadership plays a vital role in turning around a school. When school
leadership is intentional and involved in turning around schools, performance improves.
Intentional data analysis, creating a shared responsibility and instructional support all
play a role in academic improvements (Institute for Strategic Leadership and Learning,
2012; Leithwood, 2010) When school leadership has a thoughtful focus on instructional
strategies student achievement rises (Ferguson, Hackman, Hanna, & Ballantine, 2010).
Schmoker (2011) found that there is a temptation by school leadership to use grant
money as a foundational improvement plan, but instead, schools should focus on good
leadership with a focus on content intense literacy.
Administrative Support Predictors
Regardless of the profession, everybody has a superior. An airline pilot has a
CEO, a bank teller has a branch manager, and a corporation president has the board of
directors. When there is a positive relationship between a principal and a teacher, teacher
performance and school climate increases (Price, 2012). A teacher’s boss is a principal.
Teachers do not usually call the principal their “boss,” but principals are the supervisor
for school staff. According to policies in some states, each public school is managed by a
group of educators, parents, and principal called a site base council. Even with site based
Running head: BURNOUT IN TURNAROUND SCHOOLS
21
councils in schools, the building principal is responsible for the daily decision-making.
In addition to the building principal, there can be many more administrative staff in each
school and school district. Tickle (2011) found that administrative support was the most
significant predictor of job satisfaction amongst teachers. It was also found that
administrative support sets the stage for a great teaching experience. He found that a
teacher can be more satisfied with his/her salary if the administrative support is positive.
Positive administrative communication. Great leaders can communicate
effectively. Without them, effective change is unlikely (Fullan, 2010). The overall
school climate is dependent upon effective principal communication (Halawah, 2005).
The relationship between the principal and teacher must exhibit respect and trust. When
a positive relationship is built, the motivation for teachers to succeed increases
(Mikkelson & Joyner, 1982). The best ideas of leaders are worthless unless they can be
effectively communicated to their constituents. In a turnaround school model, drastic
change is expected. A building principal must be able to communicate changes to the
entire school community. Without effective and positive communication, the drastic
changes will have a hard time being initiated. One common characteristic of a good
teacher is their flexibility. There are constant interruptions in the school day that forces
them to adapt. Even though most good teachers are very flexible in day-to-day
occurrences, drastic structural changes can often be reluctantly adopted.
Running head: BURNOUT IN TURNAROUND SCHOOLS
22
Drastic structural changes like those found in the federal turnaround model take a
teacher out of his/her comfort zone and into new territory. As a part of the turnaround
model, many new teachers will be hired. These new teachers could lack experience and
be young. Reyes and Hoyle (1992) showed that the age and gender of teachers influences
the way that communication is received. If they retained their position after the
personnel changes required in turnaround models, their colleagues have undoubtedly
changed. They can only think about their future in the school. The anxiety that
accompanies a new and bold teacher evaluation system can place a huge burden on a
teacher. Teachers can feel that they have very little control over some aspects of the
evaluation system since it is, in part, based upon student performance on standardized
tests. A building principal can help reduce this anxiety with positive communication.
Teachers will feel less pressure on them. This positive communication can also attract
other great teachers to their school (Darling-Hammond, 2003).
Every teacher evaluation system includes a yearly conference with a principal.
These meetings are sometimes considered formalities, especially by veteran teachers.
With teacher evaluation, the building principal must be trusted and seen as someone who
will help teachers do a better job. One to three formal evaluations and a subsequent
conference does not convey meaning to the teacher. A building principal should know
the teacher in all aspects. To know and care for the best teachers, a principal must devote
precious time to observe. There needs to be many opportunities for the teacher and
Running head: BURNOUT IN TURNAROUND SCHOOLS
23
principal to interact with each other to discuss pedagogy and other aspects of the school
day. The more the principal is seen as a partner in education, the more likely great
teachers will grow and become even better (DePaul, 2006 and Hall, 2013).
Vision setting. Setting a vision for a turnaround school might seem simple. A
vision is important for a principal to recognize goals and all the variables involved
(Krüger, Witziers, & Sleegers, 2007). Creating a strong vision is one characteristic of an
effective principal (Spiro, 2013; Walker & Slear, 2011). The ultimate goal is to improve
the academic success of the school. At the surface, this simple goal is sufficient. How to
achieve the goal is another matter. Setting a vision complete with goals, objectives and
the methods needed to achieve goals presents a far more complicated picture. For
example, evidence shows that a clear vision, in part, can increase the academic success in
reading of a school (Mackey, Pitcher, & Decman, 2006). Current effective educational
practice includes the use of a shared vision or shared decision making process to form a
vision, school goals, and objectives. Teachers should want to play an important role in
decisions. When they are involved in the decision making process, they feel more
empowered and interact with each other more (Rafaeli, 1985). This can be especially true
when teachers can be resistant to embrace the changes in the turnaround model. Areas
that include budgeting, curriculum, policy for discipline, and even human resources could
be shared amongst an entire school community. When members of a community are all
participants in decision making, better job satisfaction occurs (Patchen, 1970). Kouzes
Running head: BURNOUT IN TURNAROUND SCHOOLS
24
and Posner (1997) developed a researched based Leadership Practices Inventory (LPI)
which includes shared vision making and involvement of all aspects of a community.
Even though decisions are formed by all members of the community, a leader is still
needed to initiate and coordinate.
Shared decision making involves all members of a school community. Two
major participants of the school community are the teachers and principal. The
relationship between these two participants can set the stage for school improvement.
When all members create environments for change which results in positive outcomes, it
is important for a leader to give recognition to all those involved. Teachers need to have
the resources and knowledge necessary to make informed decisions (Leech & Fulton,
2008). Giving teachers resources and information might be difficult for a principal since
it involves yielding power to those who are subject to his/her decisions. Acknowledging
credit for success is a very important motivator for teachers. They love to see the fruits
of their labor.
Complicating the shared decision making process, there could be three problems
that arise with administration. Principals might have a difficult time sharing their power
or relinquishing their autonomy. There is also an issue with the speed of the process.
When decisions are shared amongst multiple players, the process could slow down due to
the time required. Once a decision has been made, the question of accountability
becomes an issue. Is the building principal the one who is accountable, or is the entire
Running head: BURNOUT IN TURNAROUND SCHOOLS
25
staff since they helped shape the policy (Wildy & Lowden, 2000)? Building principals
might feel reluctant to initiate shared decision making due to these concerns. One must
consider each of these variables in when striving to improve the school through shared
governance (Casey, 2005). Reluctance to change might grow stronger in the midst of
drastic restructuring that is prescribed in the turnaround model considering the short
timeframe for turnaround schools. It is possible, however, to initiate a shared decision
process in struggling schools (Witte. Beemer, & Arjona, 2010).
District support of teachers. School districts can support the individual teacher
in many ways. Although this is often times ignored, this level of support has shown to
directly impact academic success at the school level (Waters & Marzano, 2006 and
Barber, Whelan, and Clark, 2010). In turnaround schools, district and system-wide
support are clearly important (Schaffer, Reynolds, & Stringfield, 2012). Some district
support can be found in the superintendent serving as an instructional leader in addition
to managing the district (Leithwood, 2010). The district can also serve by setting data
based goals and visions that can resonate throughout the entire district. This new and
developing role of district leadership is essential (Clarke & Wildy, 2011).
Besides providing instructional leadership at the district level, resource allocation
is a major function. Each public school district receives a sum of money from its tax base
and state allocation. The allocation is based upon the number of students in the district.
Even though the basic formula for providing funding for education is the same, districts
Running head: BURNOUT IN TURNAROUND SCHOOLS
26
spend the money very differently. Some districts can get more results from each dollar,
while others spend money with very little impact. A focus on utilizing each dollar to
reach its maximum impact is essential (Mascall & Leung, 2012). In large urban districts
with multiple schools composed of varying degrees of economic status, a disparity of
resource allocation has been found. The schools in the more affluent neighborhoods had
better teachers, more financial clout, and lower maintenance costs. (Darden &
Cavendish, 2012). Since the money is based upon taxes, the amount of money found in
more wealthy school districts seems to encourage an abundance of district resources
available to teachers. To categorize districts into small and large would be too broad.
There are many very small independent schools with a very high tax base while others
are very poor. The same goes for large and urban districts.
In urban schools, there is a direct relationship between effective schools and the
quality of teachers and their administration (Stotko, 2007). In many urban schools in
California, teacher turnover can increase with poor working conditions that could be
influenced by administrative support (Loeb, 2005). District administrative support could
help with teacher pay, resources, and extra duties. District support systems that focus on
quality teacher recruitment realize that supporting their current teaching staff speaks
volumes to their recruits (Tyler, 2008). One can only conclude the importance of
administrative support in rural schools as well. The foundation is the same,
Running head: BURNOUT IN TURNAROUND SCHOOLS
27
administrative support at the district level could lead to a better school for the
community.
In a study conducted to determine why special education teachers left their jobs,
Berry (2011) found that 21% left their positions due to variables related to administrative
support. Benefits and increased paperwork could all be controlled by an administration.
As stated previously, smaller communities could suffer from a personnel problem. Berry
also found that geographic isolation prevents special education teachers from staying in
smaller communities. Urban communities have the administrative resources along with
geographic location which prevents attrition amongst special education teachers.
Teachers in rural districts have less support and poorer working conditions and fewer
resources than their urban counterparts (Darling-Hammond, 2002).
Rural schools by definition can be small. One would think that rural districts are
more effective since smaller schools are often associated with higher achievement
(Sergiovanni, 1995). Smaller classes would create better teacher student ratios and
smaller learning communities. There are times in which teachers are recruited into a
rural community. These teachers are dependent upon administrative support to help them
become successful. A recent study done to determine what new teachers wish they had
known prior to accepting a rural teaching job found noted that 68% of respondents wish
they had more resources. Equally, 66% of teachers wish they would have more support
for times when individual specialists are not available. (Marrs, 1983). Administrators in
Running head: BURNOUT IN TURNAROUND SCHOOLS
28
rural communities have a more difficult time supporting their teachers when compared to
their urban counterparts. Rural communities are often times impoverished, and teacher
retention is low (Monk, 2007).
Urban schools are not immune from improper administrative support. There are
many urban schools with financial pressures that are similar to rural districts. In the case
of rural districts, a small population base could lead to poor funding and support. Urban
schools with a large low-income population could yield the same problem.
Administrative systems could feel this pressure and therefore help create environments
whose factors contribute to burnout. Harris (2002) found this true in some urban schools.
Teachers faced increasing pressure and very poor working conditions. They had all the
symptoms of burnout and wanted to leave the schools. Teacher turnover is 50% higher in
schools with high poverty (Ingersoll, 2001).
Professional development. Most states require teacher professional development
to be aligned with a comprehensive improvement plan. Since there is a high attrition rate
amongst beginning teachers, professional development designed to help and support new
teachers is important. In North Carolina, a mandatory teacher induction program was
initiated in 1997. There were many professional development activities that were
introduced by districts, but the programs that were more individually focused showed the
highest favorability. Of all respondents, 69% stated that the activities were effective
(Algozzine, Gretes, Queen, & Cowan-Hathcock, 2007). Other teacher induction plans
Running head: BURNOUT IN TURNAROUND SCHOOLS
29
have shown success in helping new teachers become satisfied with their career choice
(Smethem, 2005).
With professional development activities, the school and district can provide
support with follow-up. Based upon the 2013 Kentucky Teaching, Empowering,
Leading, and Learning (TELL) survey, only 55% of respondents stated that there was
sufficient follow-up after a professional development activity. District support in
professional development follow-up gets far worse ratings when asked if the professional
development is evaluated and communicated to teachers. A common complaint amongst
teachers is that there is very little district support after a professional development
activity is held.
Even when there is sufficient school level support for professional development,
effective learning is difficult to achieve without district level support (O’Connor &
Freeman, 2012). District level support is not only needed to initiate ideas, but developing
a framework needed to communicate the ideas is needed as well (Fullan, 2006). These
frameworks help the schools and teachers understand the rationale for dramatic change
and professional development offerings. The process must be systematic, data-based, and
include routine evaluation (Bernhardt, 2006, Bernhardt & Hebert, 2011). At the school
level, there is very little time for teachers and staff to analyze follow-up data. Teachers
are too busy providing instruction. At the district level, there are employees who have
Running head: BURNOUT IN TURNAROUND SCHOOLS
30
the time to analyze data and develop strategies for future professional development
activities.
Perception of district support in professional development is important. Even
with data supported professional development, if the teachers do not perceive district
support, they will not quickly initiate the new initiative (Bantwini, 2012). This means
that considerable and visible follow up is needed after each professional development
activity.
One of the major aspects of district support is establishment of teacher salary. Salary
schedules are determined by the local board of education. Given that turnaround schools
could have 50% teacher turnover, new teachers with very little experience could be
starting their career. One particular study found that frontloading teacher salaries led to
increased proficiency in reading and math (Grissom & Strunk, 2012). Struggling and
poor schools find themselves with the least experienced and lowest paid teachers (Houck,
2010; Ingersoll, 2001).
Kelly (2004) found that higher salaries for new teachers reduced the attrition rate.
Even though salaries are lower in some schools, working conditions seem to attract better
teachers. When keeping working conditions the same, there is minimal difference in
teacher attrition. There is evidence suggesting that teacher quality is decreasing due to
Running head: BURNOUT IN TURNAROUND SCHOOLS
31
starting salaries. This is because the percentage of non-teaching college graduates
earning less than starting teachers is decreasing (Hanushek, & Rivkin, 2007).
School level support. Administrators have most of the control in their schools
and/or districts. Specifically, building principals have control over resources, meetings,
and other structural aspects of the individual school. District level administrators have
control over some support systems that require a much broader approach. Regardless of
the administrator, they can influence the amount of paperwork, meetings, funding, and
other important parts of a school system. When teachers work for long hours with days
filled with increasing excess paperwork, they quickly become burned out (Barmby,
2006). Principals have the power to support their teaching staff and therefore keep their
retention high and burnout low (Brackett, 2010). District level administrators can also
communicate a broad message of support to all their teachers and therefore reduce
burnout (Corbell, 2010).
When a new teacher enters the profession, they especially need support.
Supportive programs that help new teachers have exerted a positive impact on teacher
retention. Some schools offer mentorship programs where an experienced teacher
provides an insider’s guide to the school. The mentor can help the new teacher with
his/her schedule, school specific technology, filling out discipline referrals, and more.
Many teachers enter the profession with the idea that their principal will support them
with student behavior and initiating student consequences. When teachers felt like their
Running head: BURNOUT IN TURNAROUND SCHOOLS
32
administration supported, respected, and appreciated them, they were more satisfied
(Prather-Jones, 2011). Beginning teachers are fresh out of college with new and creative
ways to teach. When they feel like things are restricting their innovation, they get burned
out and leave the profession (Goddard, 2006). When female teachers are not confident
and could not trust their school administration, burnout occurs (Timms, 2006). A casual
look at many primary schools will show an abundance of female teachers. This
abundance underlies the importance of a trustworthy school administration.
Teacher Burnout
Maslach (1981) developed the most accepted survey designed to identify burnout.
The survey asks a series of questions designed to determine the level of emotionally
exhaustion, depersonalization, and sense of low accomplishment in a person. The
Maslach Burnout Inventory (MBI) has been translated into many languages and is
internationally accepted (Tomic, 2008). The MBI has been used for a wide variety of
professions. Teachers, doctors, and even pastors have been studied to see if they exhibit
burnout. While many other surveys have been developed to explore subsections of
burnout, the MBI is the most accepted. Byrne (1993) administered the MBI to teachers
and determined that with very little modification, the instrument was a valid method of
measuring burnout amongst teachers. Other surveys have been used to identify burnout
such as the Classroom Appraisal of Resources and Demands (CARD) (Lambert, 2009)
and the Teacher Burnout Inventory. These surveys can base their foundation on the MBI.
Running head: BURNOUT IN TURNAROUND SCHOOLS
33
A teacher who is burned out can be emotionally, physically, and mentally drained
(Maslach & Jackson, 1981). In 1999, Weisberg studied a sample of teachers in Israel and
found significant burnout. Most factors for burnout identified in Weisberg’s study
resulted in physical and mental burnout. These two factors are correlated with the desire
to leave the profession. Physical burnout might come as a surprise. Teaching is not
considered a physical activity. They do not wear hard-hats, steel-toed boots, or carry
around a shovel, but if one were ask a burned out teacher about his/her physical stamina
at the end of a day, he/she would claim total exhaustion (Weisberg, 1999).
In addition to teacher attrition, the quality of education for special needs students
dramatically decreases with teacher burnout. Special needs students are not properly
referred to the administration for discipline reasons when their teachers show signs of
low-efficacy and burnout (Pas, 2010). In China, most of the factors that contributed to
teacher burnout were related to administrative support (student discipline, low salaries,
overpopulated classes, too many non-educational responsibilities, and administrative
pressure (Zhang, 2007).
Administrative support is one of the working conditions that can lead to teacher
burnout. Administration can be defined as any person or group who is not in the
classroom and manages the school. These people could be better described as building
principals, superintendents, or any other support personnel at the district/state level.
Running head: BURNOUT IN TURNAROUND SCHOOLS
34
Usually, the person with the most influence that is considered administration in a school
building is the principal.
Teacher burnout is a real problem and administrative support plays a part in it. A
review of the literature shows that there are many things that administrators can do which
can influence burnout. Since SIGs are relatively new, very little research has been
conducted which describes teacher burnout in turnaround schools. No literature was
found which details how school and district level administration influences teacher
burnout in turnaround schools. This study will determine if teacher burnout exists in
turnaround schools and describe the variables that can influence teacher burnout.
Running head: BURNOUT IN TURNAROUND SCHOOLS
35
Chapter 3
Methods
Introduction
This chapter begins with the purpose and research question the study addresses.
Next, the chapter explains the context of the study. The context includes descriptions of
the district, schools, and sample. The chapter concludes with descriptions of the teacher
survey, research design, analyses and limitations.
Purpose
Some federally funded Title 1 schools that have shown poor results on
standardized testing have applied for School Improvement Grants (SIGs). These SIGs
are designed to help struggling schools improve. SIGs have four models that a school
can implement. One of the four models is called “turnaround.” SIGs have developed
specific guidelines that each turnaround school must follow. The turnaround model
requires drastic teacher and staff overhaul and strict administrative structures.
Teachers in every school face risks of getting burned out. A burned out teacher
shows signs of lacking accomplishment, mental and physical fatigue, and
depersonalization. Job satisfaction, which is lower among teachers experiencing burnout,
is influenced by administrative support and can determine if a teacher quits the profession
Running head: BURNOUT IN TURNAROUND SCHOOLS
36
(Tice, 1991). Burnout can occur to any teacher and some burned out teachers choose to
stay in the profession (Cooley & Yovanoff, 1996). Even the best teachers can show signs
of burnout and therefore not be as effective as they once were. The implementation of
high stakes testing and federally funded restructuring projects increase the pressure and
drastically change the working conditions and administrative environment of the school.
This study analyzes teacher responses to a survey designed to determine if there is
burnout present. Furthermore, this study attempts to determine which forms of
administrative support can contribute to any observed burnout.
Research Question
This study addresses the following question. What is the relationship between
administrative support and teacher burnout in federally funded turnaround schools?
Teacher burnout indicators include signs of lacking accomplishment, mental and physical
fatigue, and depersonalization. Administrative support factors include professional
development, district support, and school support. Figure 3.1 illustrates the conceptual
framework for this study:
Running head: BURNOUT IN TURNAROUND SCHOOLS
37
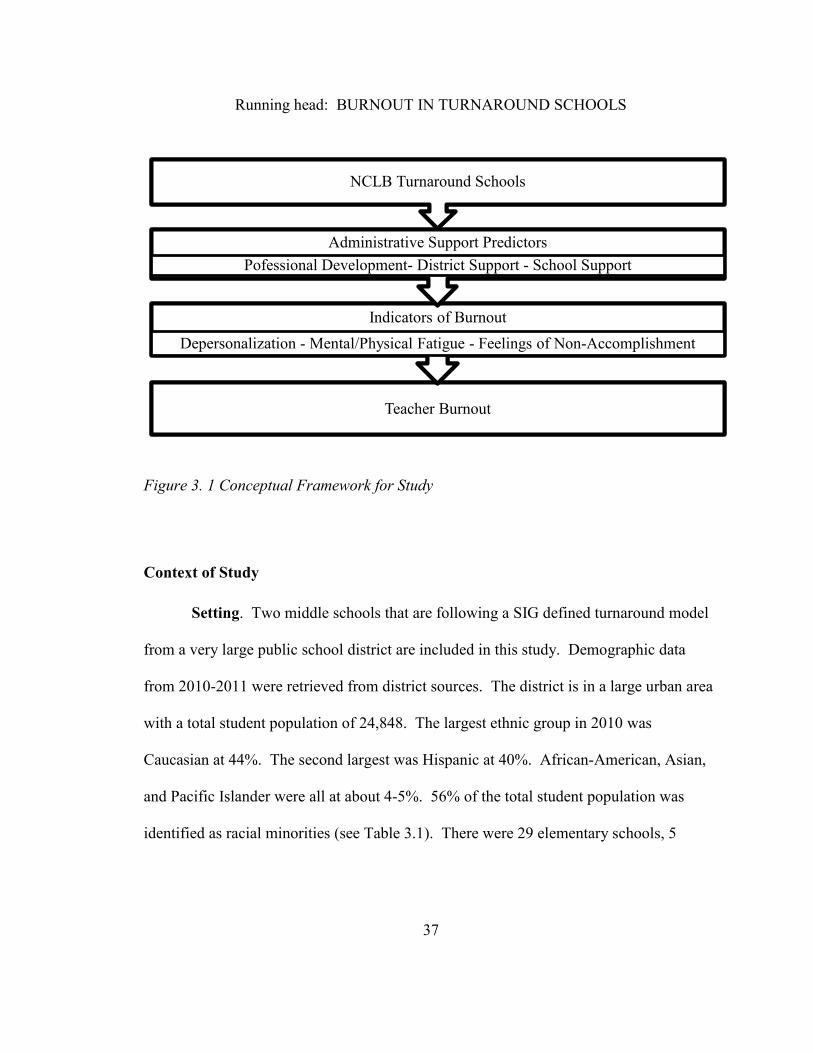
Figure 3. 1 Conceptual Framework for Study
Context of Study
Setting. Two middle schools that are following a SIG defined turnaround model
from a very large public school district are included in this study. Demographic data
from 2010-2011 were retrieved from district sources. The district is in a large urban area
with a total student population of 24,848. The largest ethnic group in 2010 was
Caucasian at 44%. The second largest was Hispanic at 40%. African-American, Asian,
and Pacific Islander were all at about 4-5%. 56% of the total student population was
identified as racial minorities (see Table 3.1). There were 29 elementary schools, 5
Teacher BurnoutTeacher Burnout
Indicators of BurnoutIndicators of Burnout
Depersonalization - Mental/Physical Fatigue - Feelings of Non-Accomplishment
Administrative Support PredictorsAdministrative Support Predictors
Pofessional Development- District Support - School Support
NCLB Turnaround SchoolsNCLB Turnaround Schools
Running head: BURNOUT IN TURNAROUND SCHOOLS
38
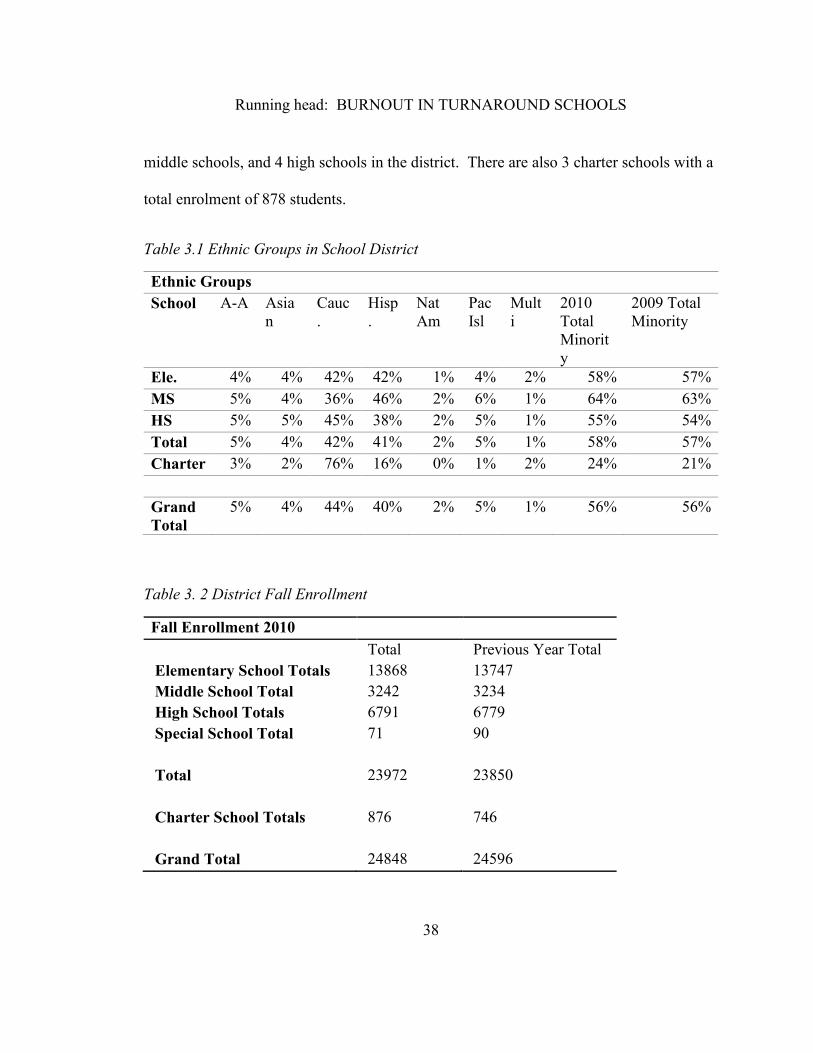
middle schools, and 4 high schools in the district. There are also 3 charter schools with a
total enrolment of 878 students.
Table 3.1 Ethnic Groups in School District
Ethnic Groups
School A-A Asia
n
Cauc
.
Hisp
.
Nat
Am
Pac
Isl
Mult
i
2010
Total
Minorit
y
2009 Total
Minority
Ele. 4% 4% 42% 42% 1% 4% 2% 58% 57%
MS 5% 4% 36% 46% 2% 6% 1% 64% 63%
HS 5% 5% 45% 38% 2% 5% 1% 55% 54%
Total 5% 4% 42% 41% 2% 5% 1% 58% 57%
Charter 3% 2% 76% 16% 0% 1% 2% 24% 21%
Grand
Total
5% 4% 44% 40% 2% 5% 1% 56% 56%
Table 3. 2 District Fall Enrollment
Fall Enrollment 2010
Total Previous Year Total
Elementary School Totals 13868 13747
Middle School Total 3242 3234
High School Totals 6791 6779
Special School Total 71 90
Total 23972 23850
Charter School Totals 876 746
Grand Total 24848 24596
Running head: BURNOUT IN TURNAROUND SCHOOLS
39
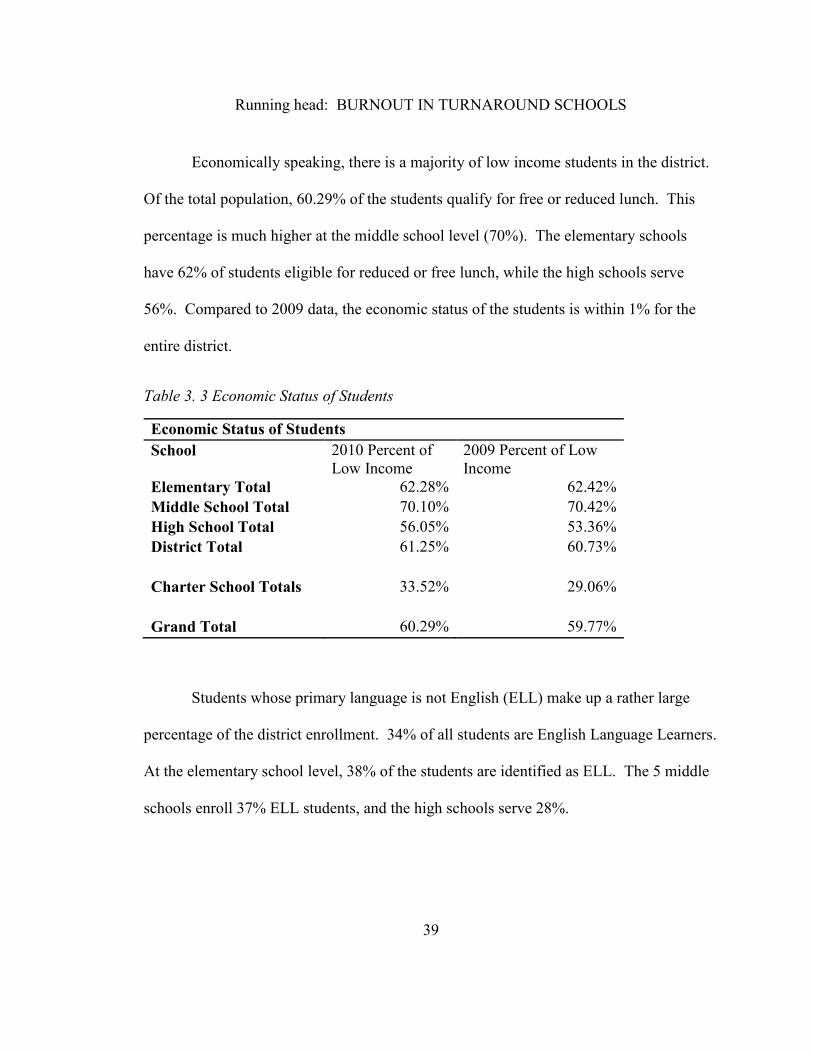
Economically speaking, there is a majority of low income students in the district.
Of the total population, 60.29% of the students qualify for free or reduced lunch. This
percentage is much higher at the middle school level (70%). The elementary schools
have 62% of students eligible for reduced or free lunch, while the high schools serve
56%. Compared to 2009 data, the economic status of the students is within 1% for the
entire district.
Table 3. 3 Economic Status of Students
Economic Status of Students
School 2010 Percent of
Low Income
2009 Percent of Low
Income
Elementary Total 62.28% 62.42%
Middle School Total 70.10% 70.42%
High School Total 56.05% 53.36%
District Total 61.25% 60.73%
Charter School Totals 33.52% 29.06%
Grand Total 60.29% 59.77%
Students whose primary language is not English (ELL) make up a rather large
percentage of the district enrollment. 34% of all students are English Language Learners.
At the elementary school level, 38% of the students are identified as ELL. The 5 middle
schools enroll 37% ELL students, and the high schools serve 28%.
Running head: BURNOUT IN TURNAROUND SCHOOLS
40
Table 3. 4 English as a Learned Language
English as a Learned Language
% ELL Total Enrolled
Elementary School Totals 38% 13868
Middle School Total 37% 3242
High School Totals 28% 6791
Total 35% 23972
Charter School Totals 8% 876
Grand Total 34% 24848
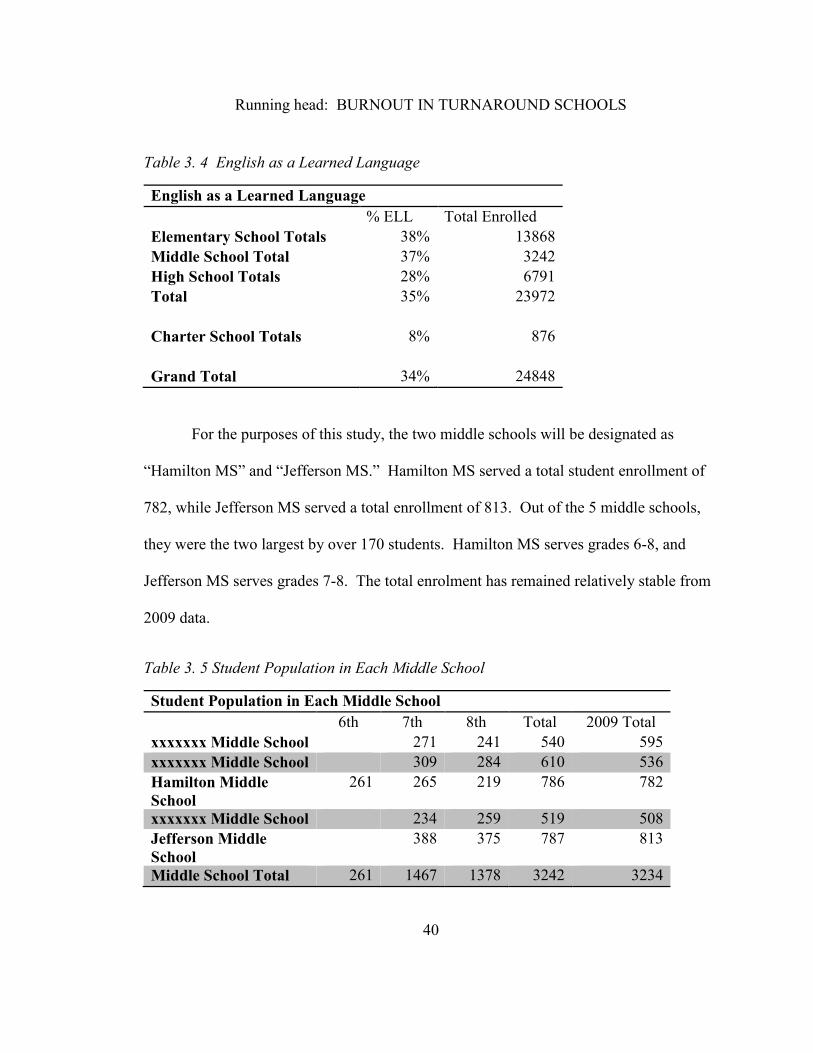
For the purposes of this study, the two middle schools will be designated as
“Hamilton MS” and “Jefferson MS.” Hamilton MS served a total student enrollment of
782, while Jefferson MS served a total enrollment of 813. Out of the 5 middle schools,
they were the two largest by over 170 students. Hamilton MS serves grades 6-8, and
Jefferson MS serves grades 7-8. The total enrolment has remained relatively stable from
2009 data.
Table 3. 5 Student Population in Each Middle School
Student Population in Each Middle School
6th 7th 8th Total 2009 Total
xxxxxxx Middle School 271 241 540 595
xxxxxxx Middle School 309 284 610 536
Hamilton Middle
School
261 265 219 786 782
xxxxxxx Middle School 234 259 519 508
Jefferson Middle
School
388 375 787 813
Middle School Total 261 1467 1378 3242 3234
Running head: BURNOUT IN TURNAROUND SCHOOLS
41
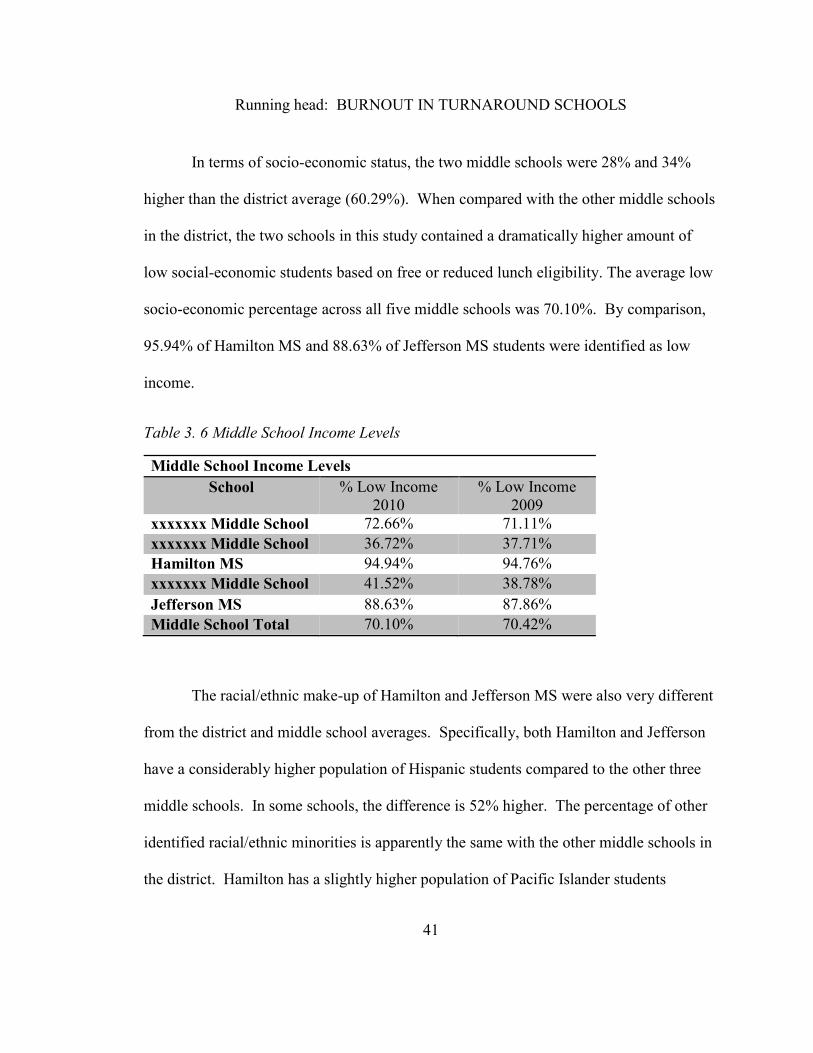
In terms of socio-economic status, the two middle schools were 28% and 34%
higher than the district average (60.29%). When compared with the other middle schools
in the district, the two schools in this study contained a dramatically higher amount of
low social-economic students based on free or reduced lunch eligibility. The average low
socio-economic percentage across all five middle schools was 70.10%. By comparison,
95.94% of Hamilton MS and 88.63% of Jefferson MS students were identified as low
income.
Table 3. 6 Middle School Income Levels
Middle School Income Levels
School % Low Income
2010
% Low Income
2009
xxxxxxx Middle School 72.66% 71.11%
xxxxxxx Middle School 36.72% 37.71%
Hamilton MS 94.94% 94.76%
xxxxxxx Middle School 41.52% 38.78%
Jefferson MS 88.63% 87.86%
Middle School Total 70.10% 70.42%
The racial/ethnic make-up of Hamilton and Jefferson MS were also very different
from the district and middle school averages. Specifically, both Hamilton and Jefferson
have a considerably higher population of Hispanic students compared to the other three
middle schools. In some schools, the difference is 52% higher. The percentage of other
identified racial/ethnic minorities is apparently the same with the other middle schools in
the district. Hamilton has a slightly higher population of Pacific Islander students
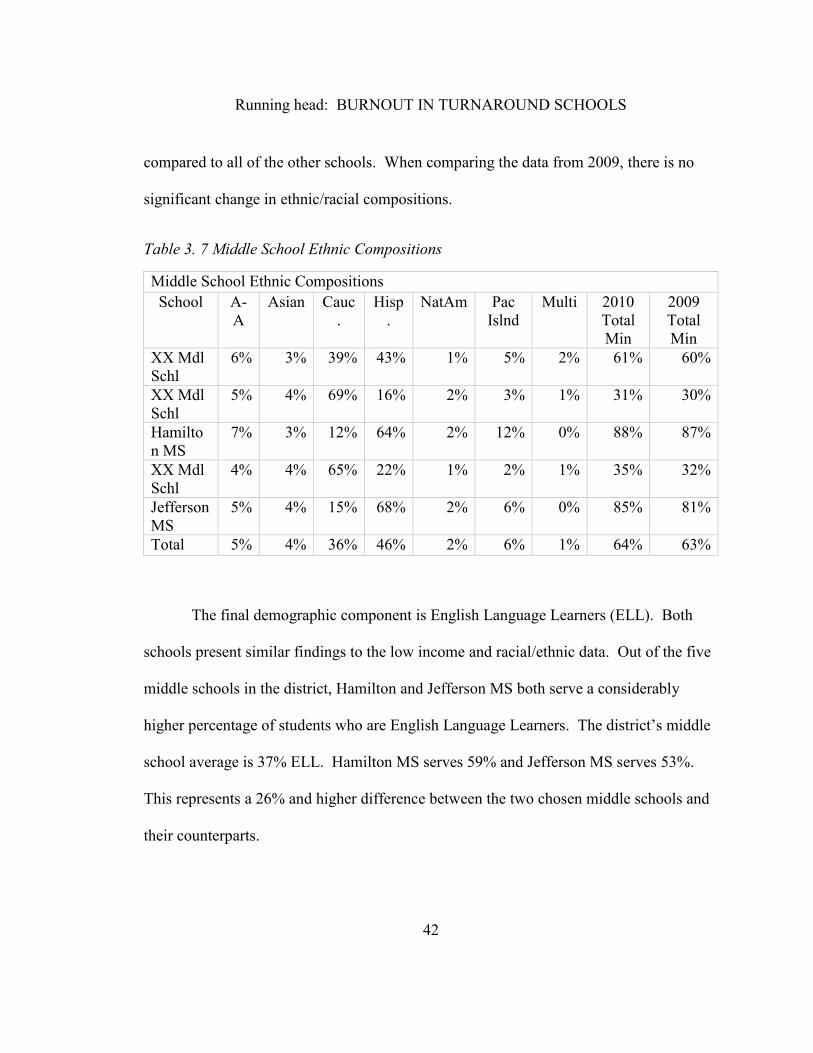
Running head: BURNOUT IN TURNAROUND SCHOOLS
42
compared to all of the other schools. When comparing the data from 2009, there is no
significant change in ethnic/racial compositions.
Table 3. 7 Middle School Ethnic Compositions
Middle School Ethnic Compositions
School A-
A
Asian Cauc
.
Hisp
.
NatAm Pac
Islnd
Multi 2010
Total
Min
2009
Total
Min
XX Mdl
Schl
6% 3% 39% 43% 1% 5% 2% 61% 60%
XX Mdl
Schl
5% 4% 69% 16% 2% 3% 1% 31% 30%
Hamilto
n MS
7% 3% 12% 64% 2% 12% 0% 88% 87%
XX Mdl
Schl
4% 4% 65% 22% 1% 2% 1% 35% 32%
Jefferson
MS
5% 4% 15% 68% 2% 6% 0% 85% 81%
Total 5% 4% 36% 46% 2% 6% 1% 64% 63%
The final demographic component is English Language Learners (ELL). Both
schools present similar findings to the low income and racial/ethnic data. Out of the five
middle schools in the district, Hamilton and Jefferson MS both serve a considerably
higher percentage of students who are English Language Learners. The district’s middle
school average is 37% ELL. Hamilton MS serves 59% and Jefferson MS serves 53%.
This represents a 26% and higher difference between the two chosen middle schools and
their counterparts.
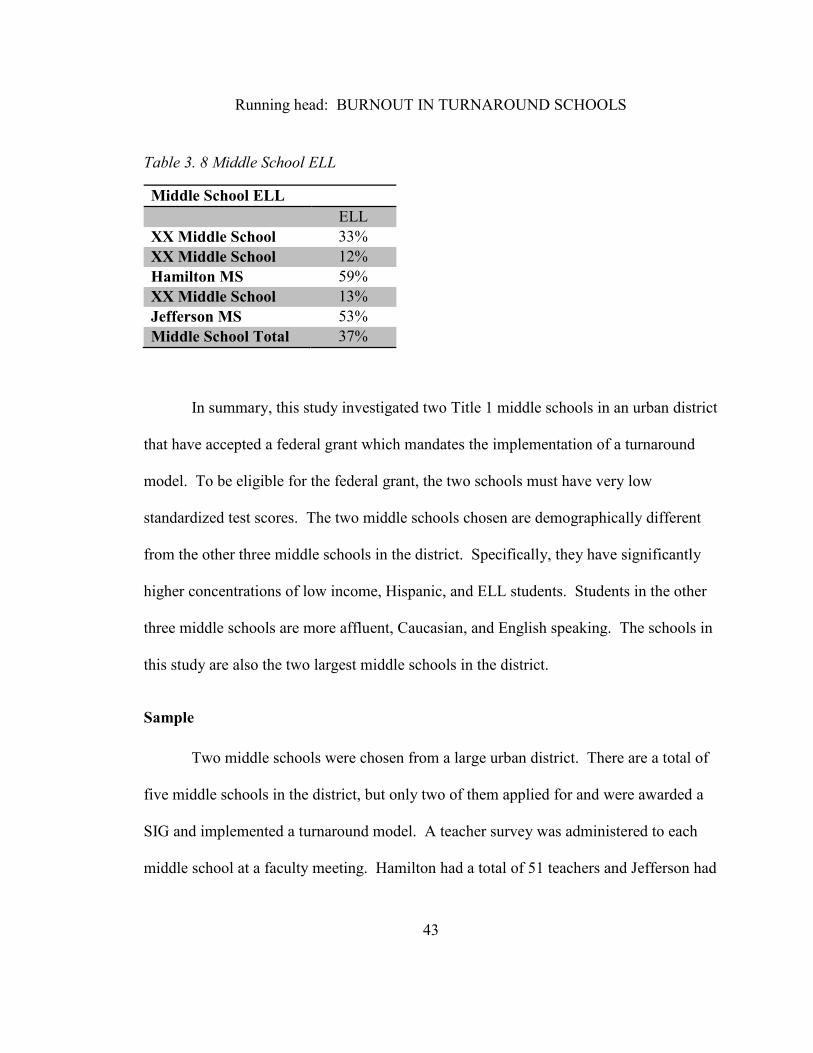
Running head: BURNOUT IN TURNAROUND SCHOOLS
43
Table 3. 8 Middle School ELL
Middle School ELL
ELL
XX Middle School 33%
XX Middle School 12%
Hamilton MS 59%
XX Middle School 13%
Jefferson MS 53%
Middle School Total 37%
In summary, this study investigated two Title 1 middle schools in an urban district
that have accepted a federal grant which mandates the implementation of a turnaround
model. To be eligible for the federal grant, the two schools must have very low
standardized test scores. The two middle schools chosen are demographically different
from the other three middle schools in the district. Specifically, they have significantly
higher concentrations of low income, Hispanic, and ELL students. Students in the other
three middle schools are more affluent, Caucasian, and English speaking. The schools in
this study are also the two largest middle schools in the district.
Sample
Two middle schools were chosen from a large urban district. There are a total of
five middle schools in the district, but only two of them applied for and were awarded a
SIG and implemented a turnaround model. A teacher survey was administered to each
middle school at a faculty meeting. Hamilton had a total of 51 teachers and Jefferson had
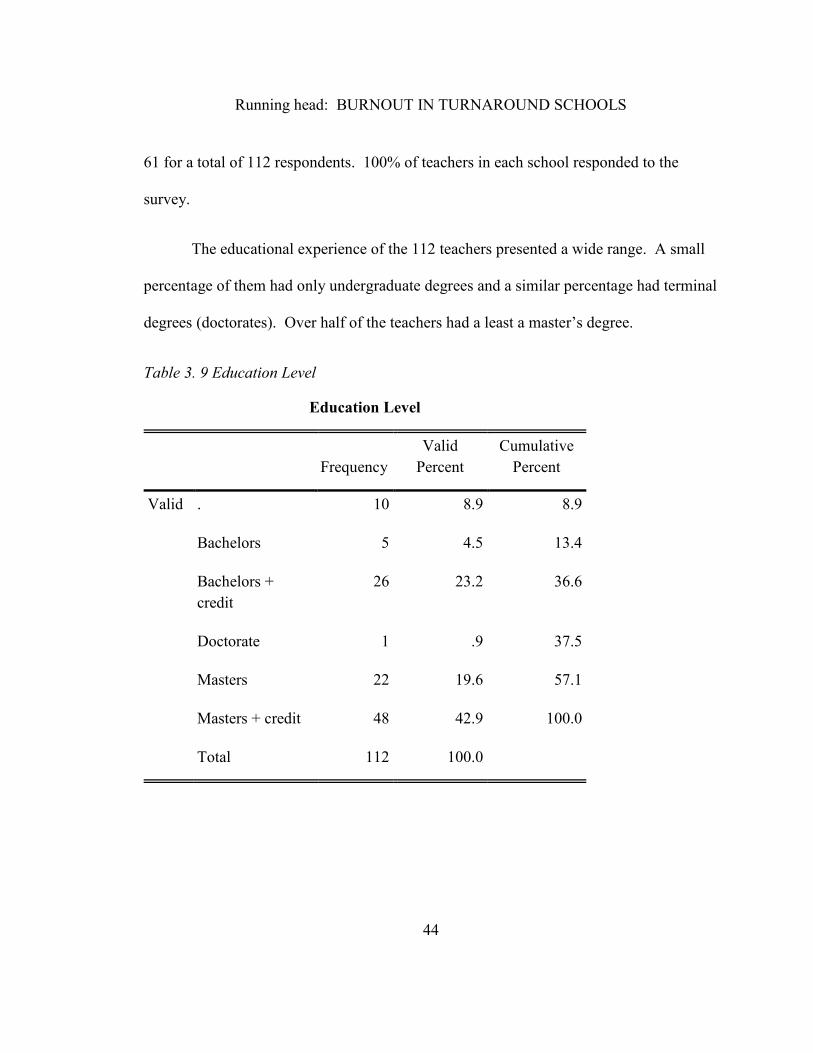
Running head: BURNOUT IN TURNAROUND SCHOOLS
44
61 for a total of 112 respondents. 100% of teachers in each school responded to the
survey.
The educational experience of the 112 teachers presented a wide range. A small
percentage of them had only undergraduate degrees and a similar percentage had terminal
degrees (doctorates). Over half of the teachers had a least a master’s degree.
Table 3. 9 Education Level
Education Level
Frequency
Valid
Percent
Cumulative
Percent
Valid . 10 8.9 8.9
Bachelors 5 4.5 13.4
Bachelors +
credit
26 23.2 36.6
Doctorate 1 .9 37.5
Masters 22 19.6 57.1
Masters + credit 48 42.9 100.0
Total 112 100.0
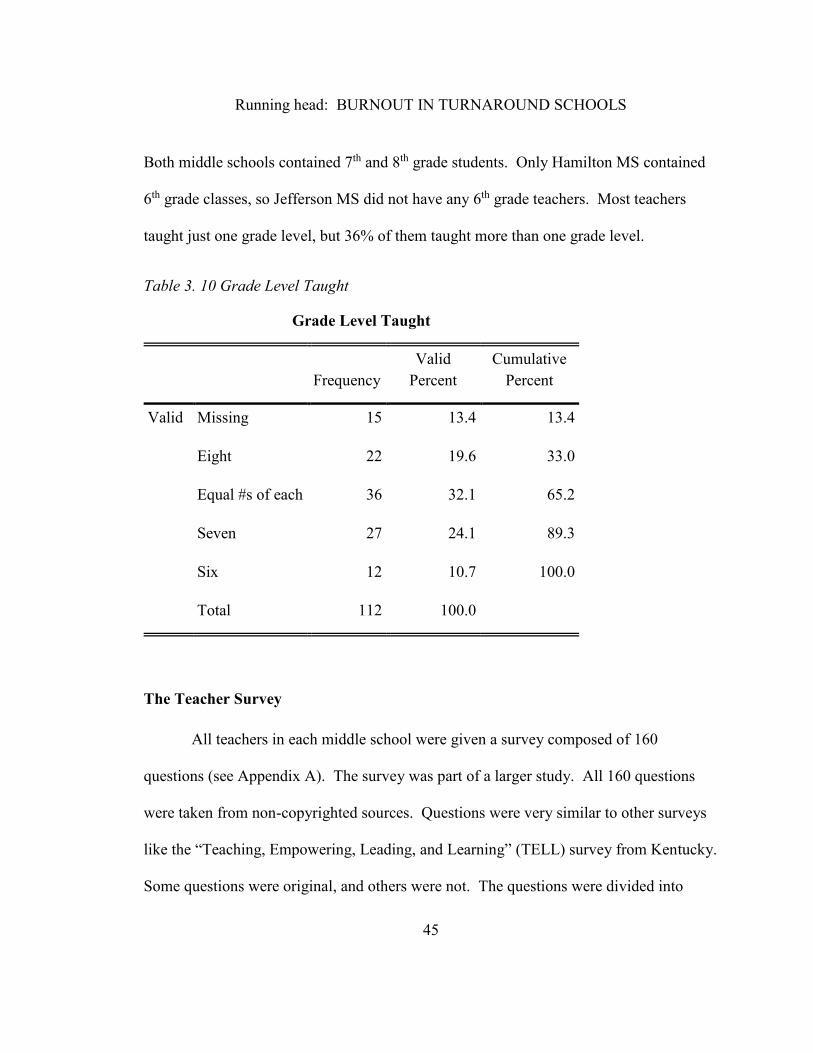
Running head: BURNOUT IN TURNAROUND SCHOOLS
45
Both middle schools contained 7th and 8th grade students. Only Hamilton MS contained
6th grade classes, so Jefferson MS did not have any 6th grade teachers. Most teachers
taught just one grade level, but 36% of them taught more than one grade level.
Table 3. 10 Grade Level Taught
Grade Level Taught
Frequency
Valid
Percent
Cumulative
Percent
Valid Missing 15 13.4 13.4
Eight 22 19.6 33.0
Equal #s of each 36 32.1 65.2
Seven 27 24.1 89.3
Six 12 10.7 100.0
Total 112 100.0
The Teacher Survey
All teachers in each middle school were given a survey composed of 160
questions (see Appendix A). The survey was part of a larger study. All 160 questions
were taken from non-copyrighted sources. Questions were very similar to other surveys
like the “Teaching, Empowering, Leading, and Learning” (TELL) survey from Kentucky.
Some questions were original, and others were not. The questions were divided into
Running head: BURNOUT IN TURNAROUND SCHOOLS
46
eight categories (Appendix A) and administered using a Likert format. A scale of 1-6
was used with “Strongly Disagree as 1 and Strongly Agree as 6. The broader categories
on the survey and the number of questions were:
School Leadership (23)
Teaching (16)
Curriculum and Assessment (10)
Professional Development (16)
School Climate and Working Conditions (59)
Alignment of Resources to Goals (6)
Engagement of Families (9)
The School Improvement Grant (21)
Research Design
Teachers from the two middle schools that were awarded a SIG and followed the
turnaround model were administered the 160 item survey. Items in the survey were
categorized into eight sections with sub-sections. To identify whether teachers were
showing signs of burnout, eleven questions from the survey were chosen according to the
three variables in Maslach’s Burnout Inventory. All eleven questions were found in the
School Climate and Working Conditions section. Questions 47 and 49 were reversed
Running head: BURNOUT IN TURNAROUND SCHOOLS
47
coded and adjusted for analysis purposes. The eleven questions were broken into the
following categories of burnout:
Emotional Exhaustion (questions 41, 42, 44, & 50)
Low Personal Accomplishment (questions 46, 47, & 50)
Depersonalization (questions 43, 45, 49, & 51)
Data from the survey were analyzed using Cronbach’s Alpha to determine internal
consistency. According to accepted values, a Cronbach’s Alpha value of .7 and higher
was used to determine reliability.
To analyze administrative support, all 160 questions from the survey were
reviewed. Questions that did not pertain to administrative support were not included.
Means lower than three were considered low administrative support variables. Questions
were reverse coded when necessary. After identifying low administrative support
variables, data were analyzed to determine the relationship between administrative
support and teacher burnout.
Analysis
After reporting descriptive statistics, data analyses included four multiple
regressions. The first regression was on burnout as a whole and the others were on the
three indicators of burnout. Specifically, the dependent or criterion variables were
burnout, emotional exhaustion, low personal accomplishment, and depersonalization.
Running head: BURNOUT IN TURNAROUND SCHOOLS
48
The predictor variables were positive district support, school level support, and
professional development. Significance was determined at the .05 level.
Limitations of Study
This study does not analyze data from all schools that accepted SIGs and followed
a turnaround model. Only two middle schools from one district were chosen. SIGs were
awarded to elementary, middle, and high schools across the United States. Many
turnaround schools in the United States have similar socio-economic and testing data, but
school demographics could be different. Not all turnaround schools have a large
Hispanic population like those in this study. This study could be used for application
purposes, but the population composition limits generalizability of the results.
Another limitation of this study originates in the nature of the topic. Teachers
who are burned out may not carefully or honestly take a 160 question survey. Since two
aspects of burnout are mental and physical burnout, teachers may not spend quality time
responding to the survey questions. Some teachers might respond to the survey with very
honest and thoughtful marks, while others might respond by marking “3” every time.
Coupled with the total number of respondents (N=112), this aspect of the study could
limit valid results. The relative small sample size may limit the power to find significant
relationships that actually exist.
Running head: BURNOUT IN TURNAROUND SCHOOLS
49
Teachers responding to the survey will have a wide range of experiences. Their
responses could be filtered through their experience lens. Teacher turnover in these two
schools could be very high. There might be very few teachers who have taught in the
schools for an extended period of time. This means that many teachers have wide
ranging experiences at other schools or no experience and are just out of college. Some
might respond to the questions according to different experiences in former educational
settings. Their concept of administrative support could differ as well. When a survey
question asks if they think the administration supports professional development, the
response could be based upon their experiences in previous settings.
Running head: BURNOUT IN TURNAROUND SCHOOLS
50
Chapter 4
Results
Introduction
Purpose. School Improvement Grants (SIGs) have been awarded to some Title 1
schools that were underperforming. Schools that accept SIGs must follow one of four
models designed to improve academic performance. The turnaround model requires
drastic teacher and staff overhaul and strict administrative structures. Due to the staff
overhaul and strict administrative structures, teacher burnout might occur at higher levels.
Teachers who are burned out may not be as effective as those who are not.
Administration could support teachers during the turnaround process and therefore
prevent some burnout. The goal of this study was to determine what kinds of
administrative support influences teacher burnout in turnaround schools. A survey was
given to all teachers in two turnaround middle schools. Bivariate correlations and
multiple regressions were used to identify administrative factors that can influence
teacher burnout.
Context of Study
Setting. To assess the research question, teachers from two middle schools that
were following a SIG defined turnaround model from an urban public school district
Running head: BURNOUT IN TURNAROUND SCHOOLS
51
were studied. The district is in a large urban area with a total student population of
24,848. The largest racial/ethnic group in 2010 was Caucasian at 44%. The second
largest was Hispanic at 40%. African American, Asian, and Pacific Islander were all at
about 4-5%. 56% of the total student population was identified as racial/ethnic
minorities. There were 29 elementary schools, 5 middle schools, and 4 high schools.
There were also 3 charter schools with a total enrolment of 878 students.
There are a total of five middle schools in the district, but only two of them
applied and were awarded a SIG and followed a turnaround model. A teacher survey was
administered to these two middle school. Hamilton Middle School had a total of 51
teachers, and Jefferson Middle School had 61 for a total of 112 respondents. 100% of
teachers in each school responded to the survey. The survey consisted of 160 questions
with a rating scale of 1-6. The survey was administered during the 3rd year of the
turnaround model. Survey questions were chosen to indicate three predictor variables:
School Leadership Support
Central Office Support
Professional Development
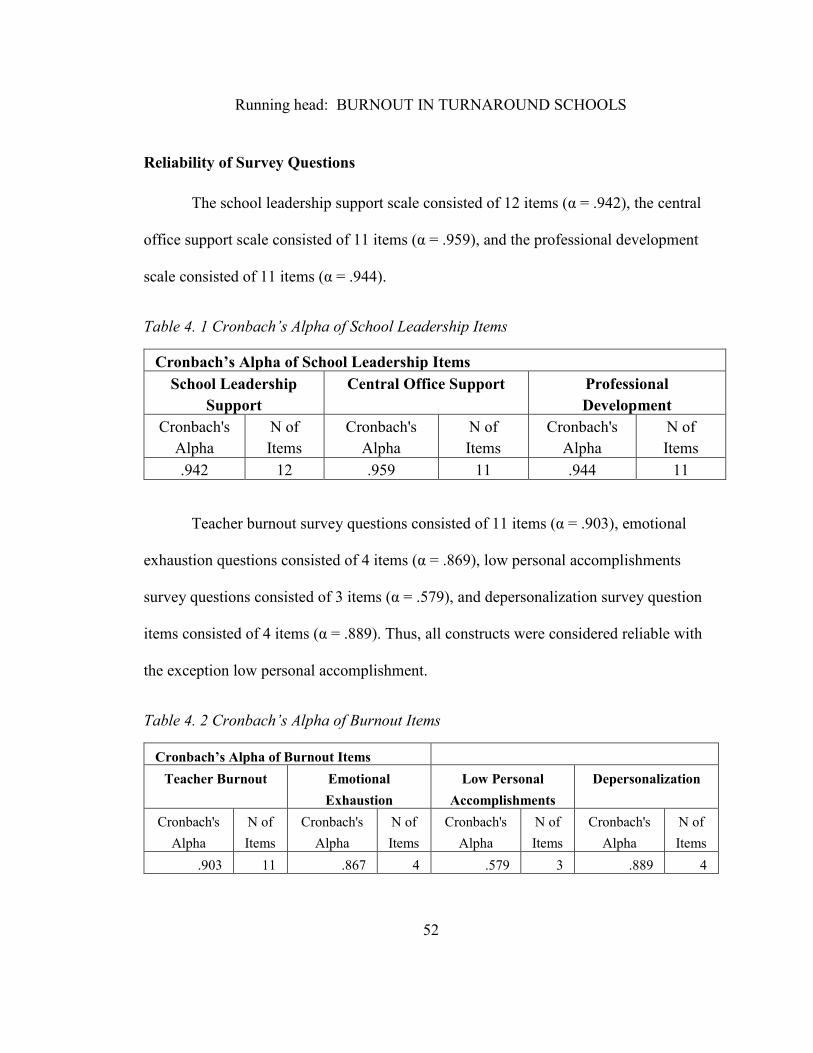
Running head: BURNOUT IN TURNAROUND SCHOOLS
52
Reliability of Survey Questions
The school leadership support scale consisted of 12 items (α = .942), the central
office support scale consisted of 11 items (α = .959), and the professional development
scale consisted of 11 items (α = .944).
Table 4. 1 Cronbach’s Alpha of School Leadership Items
Cronbach’s Alpha of School Leadership Items
School Leadership
Support
Central Office Support Professional
Development
Cronbach's
Alpha
N of
Items
Cronbach's
Alpha
N of
Items
Cronbach's
Alpha
N of
Items
.942 12 .959 11 .944 11
Teacher burnout survey questions consisted of 11 items (α = .903), emotional
exhaustion questions consisted of 4 items (α = .869), low personal accomplishments
survey questions consisted of 3 items (α = .579), and depersonalization survey question
items consisted of 4 items (α = .889). Thus, all constructs were considered reliable with
the exception low personal accomplishment.
Table 4. 2 Cronbach’s Alpha of Burnout Items
Cronbach’s Alpha of Burnout Items
Teacher Burnout Emotional
Exhaustion
Low Personal
Accomplishments
Depersonalization
Cronbach's
Alpha
N of
Items
Cronbach's
Alpha
N of
Items
Cronbach's
Alpha
N of
Items
Cronbach's
Alpha
N of
Items
.903 11 .867 4 .579 3 .889 4
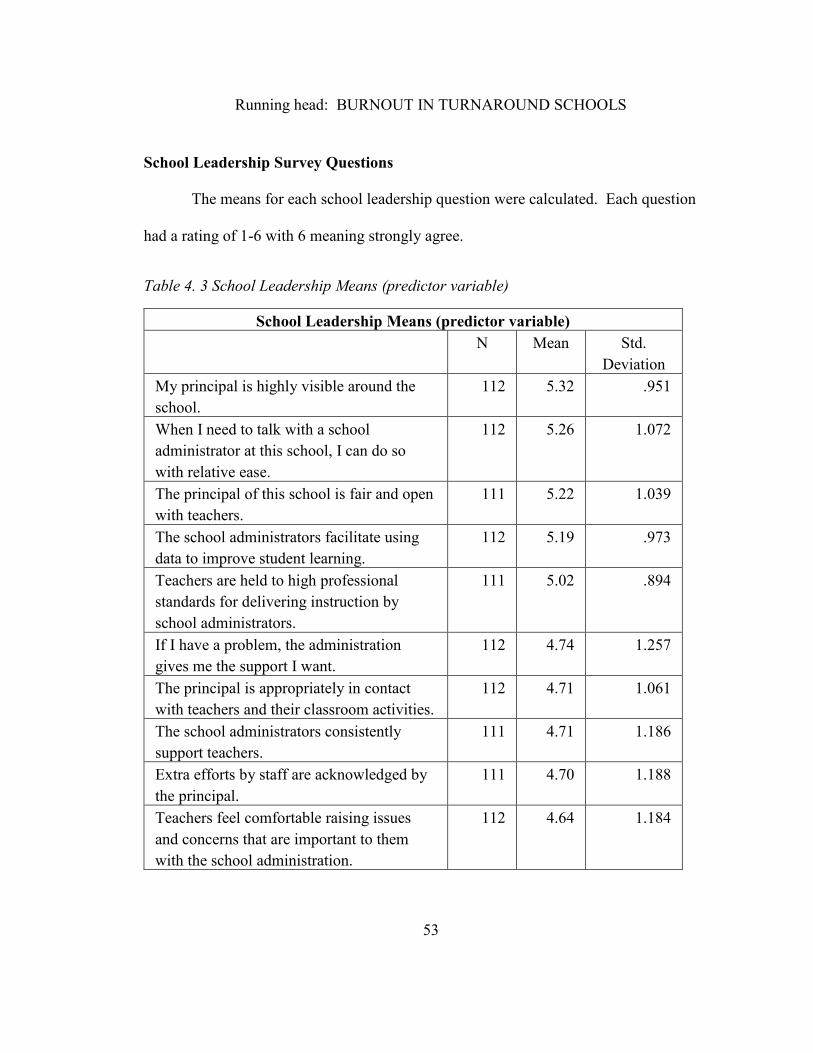
Running head: BURNOUT IN TURNAROUND SCHOOLS
53
School Leadership Survey Questions
The means for each school leadership question were calculated. Each question
had a rating of 1-6 with 6 meaning strongly agree.
Table 4. 3 School Leadership Means (predictor variable)
School Leadership Means (predictor variable)
N Mean Std.
Deviation
My principal is highly visible around the
school.
112 5.32 .951
When I need to talk with a school
administrator at this school, I can do so
with relative ease.
112 5.26 1.072
The principal of this school is fair and open
with teachers.
111 5.22 1.039
The school administrators facilitate using
data to improve student learning.
112 5.19 .973
Teachers are held to high professional
standards for delivering instruction by
school administrators.
111 5.02 .894
If I have a problem, the administration
gives me the support I want.
112 4.74 1.257
The principal is appropriately in contact
with teachers and their classroom activities.
112 4.71 1.061
The school administrators consistently
support teachers.
111 4.71 1.186
Extra efforts by staff are acknowledged by
the principal.
111 4.70 1.188
Teachers feel comfortable raising issues
and concerns that are important to them
with the school administration.
112 4.64 1.184
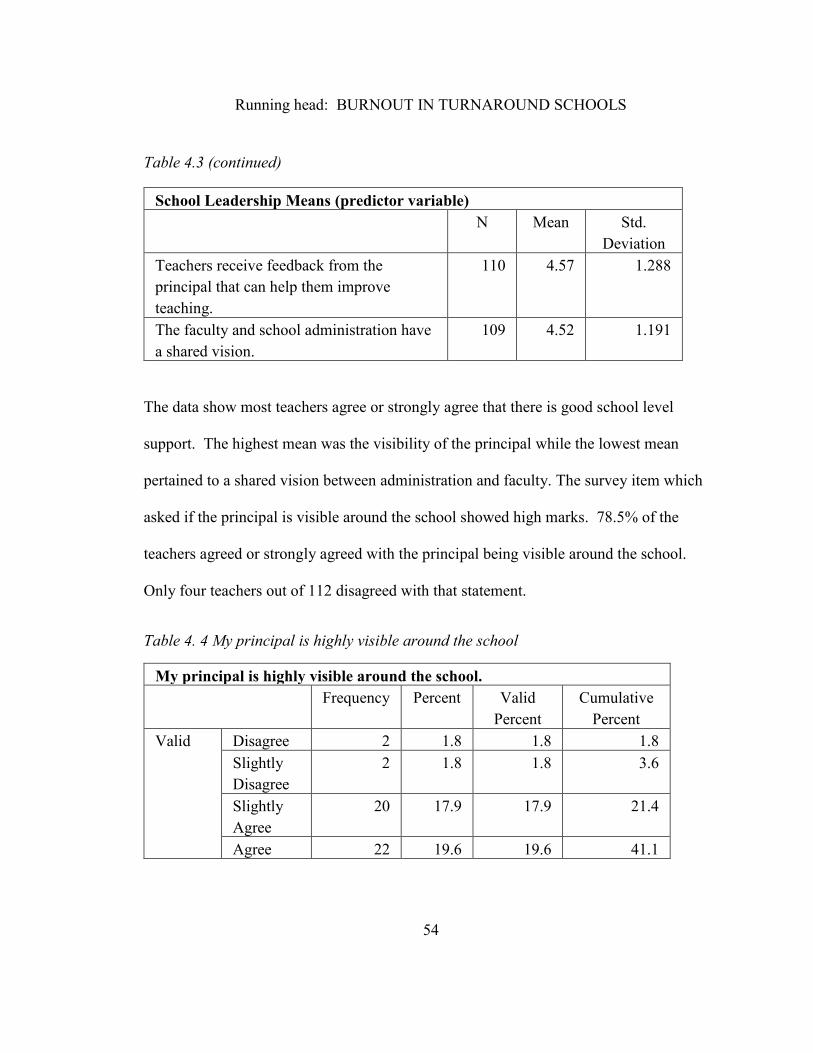
Running head: BURNOUT IN TURNAROUND SCHOOLS
54
Table 4.3 (continued)
School Leadership Means (predictor variable)
N Mean Std.
Deviation
Teachers receive feedback from the
principal that can help them improve
teaching.
110 4.57 1.288
The faculty and school administration have
a shared vision.
109 4.52 1.191
The data show most teachers agree or strongly agree that there is good school level
support. The highest mean was the visibility of the principal while the lowest mean
pertained to a shared vision between administration and faculty. The survey item which
asked if the principal is visible around the school showed high marks. 78.5% of the
teachers agreed or strongly agreed with the principal being visible around the school.
Only four teachers out of 112 disagreed with that statement.
Table 4. 4 My principal is highly visible around the school
My principal is highly visible around the school.
Frequency Percent Valid
Percent
Cumulative
Percent
Valid Disagree 2 1.8 1.8 1.8
Slightly
Disagree
2 1.8 1.8 3.6
Slightly
Agree
20 17.9 17.9 21.4
Agree 22 19.6 19.6 41.1
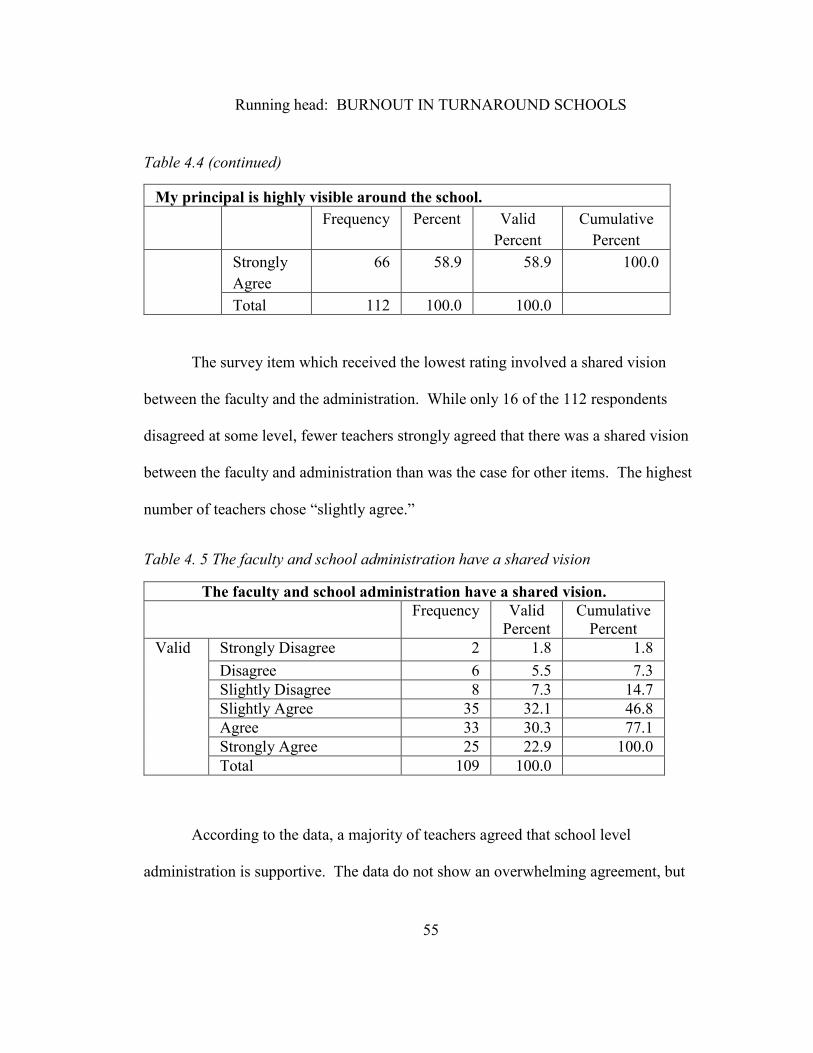
Running head: BURNOUT IN TURNAROUND SCHOOLS
55
Table 4.4 (continued)
The survey item which received the lowest rating involved a shared vision
between the faculty and the administration. While only 16 of the 112 respondents
disagreed at some level, fewer teachers strongly agreed that there was a shared vision
between the faculty and administration than was the case for other items. The highest
number of teachers chose “slightly agree.”
Table 4. 5 The faculty and school administration have a shared vision
The faculty and school administration have a shared vision.
Frequency Valid
Percent
Cumulative
Percent
Valid Strongly Disagree 2 1.8 1.8
Disagree 6 5.5 7.3
Slightly Disagree 8 7.3 14.7
Slightly Agree 35 32.1 46.8
Agree 33 30.3 77.1
Strongly Agree 25 22.9 100.0
Total 109 100.0
According to the data, a majority of teachers agreed that school level
administration is supportive. The data do not show an overwhelming agreement, but
My principal is highly visible around the school.
Frequency Percent Valid
Percent
Cumulative
Percent
Strongly
Agree
66 58.9 58.9 100.0
Total 112 100.0 100.0
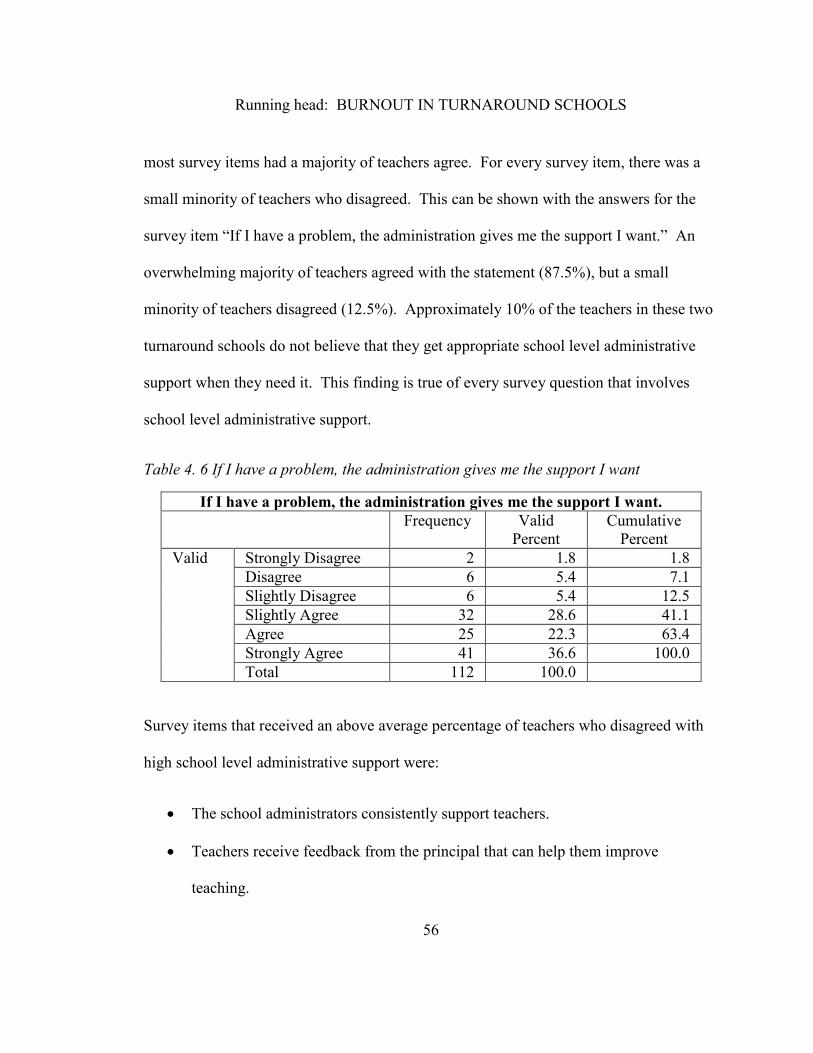
Running head: BURNOUT IN TURNAROUND SCHOOLS
56
most survey items had a majority of teachers agree. For every survey item, there was a
small minority of teachers who disagreed. This can be shown with the answers for the
survey item “If I have a problem, the administration gives me the support I want.” An
overwhelming majority of teachers agreed with the statement (87.5%), but a small
minority of teachers disagreed (12.5%). Approximately 10% of the teachers in these two
turnaround schools do not believe that they get appropriate school level administrative
support when they need it. This finding is true of every survey question that involves
school level administrative support.
Table 4. 6 If I have a problem, the administration gives me the support I want
If I have a problem, the administration gives me the support I want.
Frequency Valid
Percent
Cumulative
Percent
Valid Strongly Disagree 2 1.8 1.8
Disagree 6 5.4 7.1
Slightly Disagree 6 5.4 12.5
Slightly Agree 32 28.6 41.1
Agree 25 22.3 63.4
Strongly Agree 41 36.6 100.0
Total 112 100.0
Survey items that received an above average percentage of teachers who disagreed with
high school level administrative support were:
The school administrators consistently support teachers.
Teachers receive feedback from the principal that can help them improve
teaching.
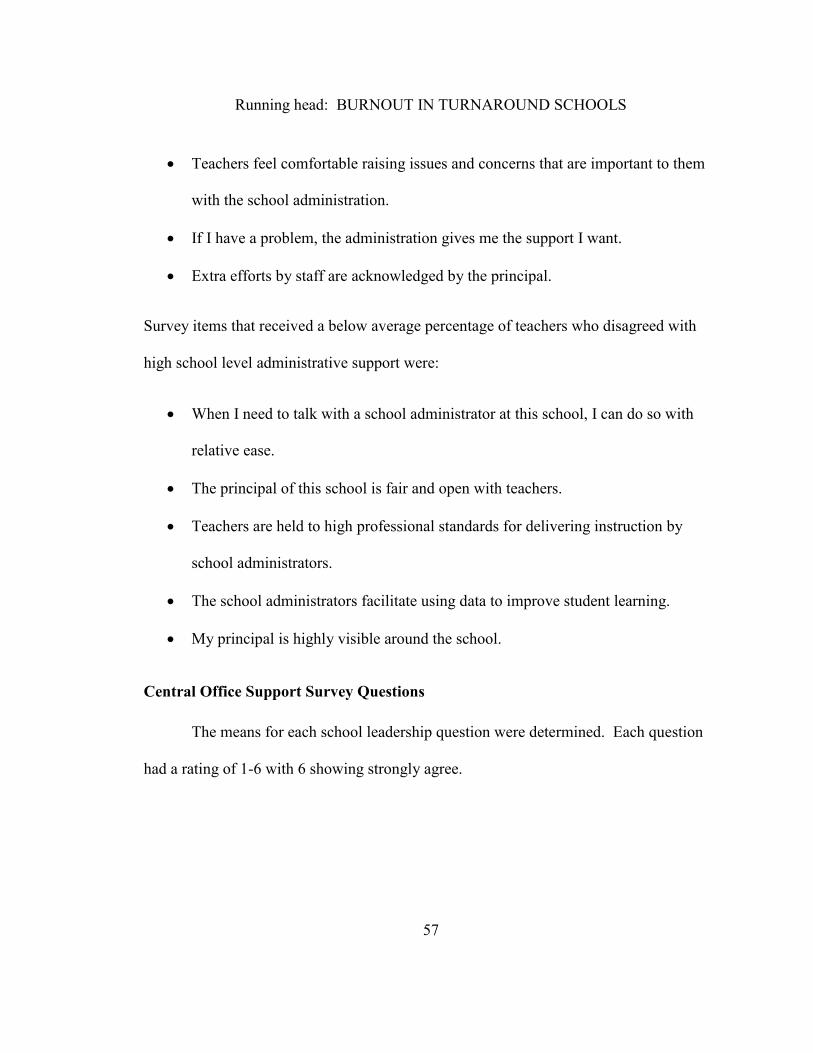
Running head: BURNOUT IN TURNAROUND SCHOOLS
57
Teachers feel comfortable raising issues and concerns that are important to them
with the school administration.
If I have a problem, the administration gives me the support I want.
Extra efforts by staff are acknowledged by the principal.
Survey items that received a below average percentage of teachers who disagreed with
high school level administrative support were:
When I need to talk with a school administrator at this school, I can do so with
relative ease.
The principal of this school is fair and open with teachers.
Teachers are held to high professional standards for delivering instruction by
school administrators.
The school administrators facilitate using data to improve student learning.
My principal is highly visible around the school.
Central Office Support Survey Questions
The means for each school leadership question were determined. Each question
had a rating of 1-6 with 6 showing strongly agree.
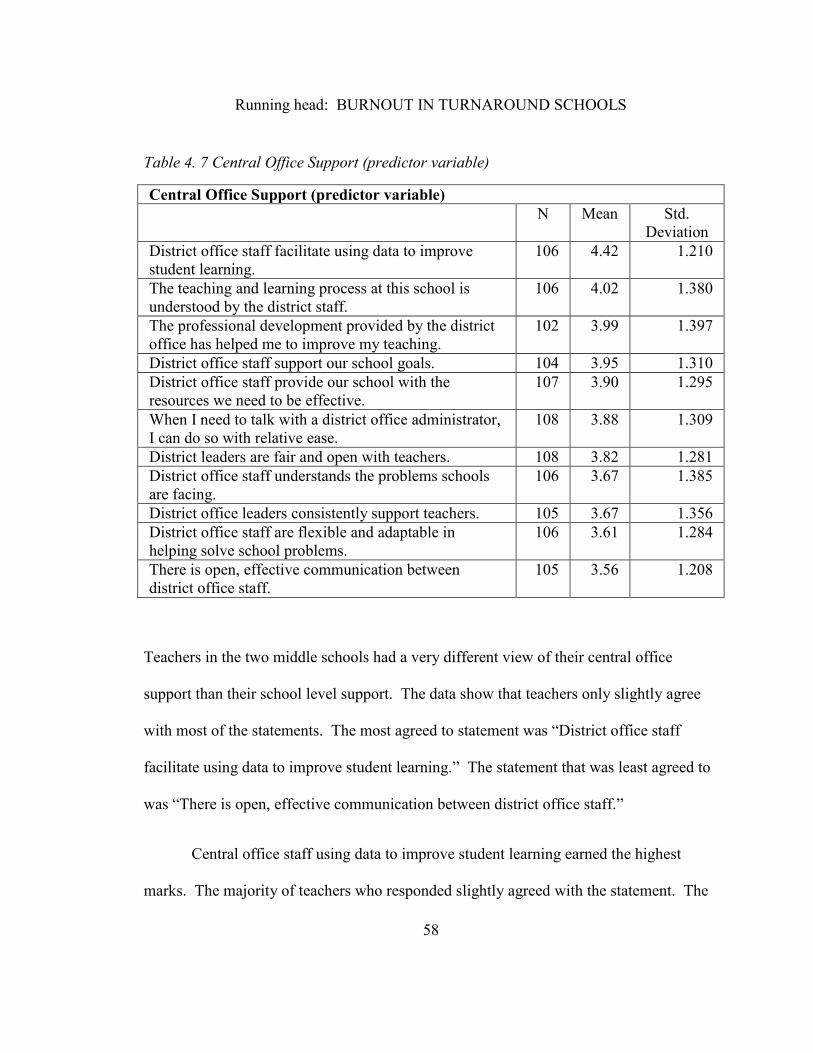
Running head: BURNOUT IN TURNAROUND SCHOOLS
58
Table 4. 7 Central Office Support (predictor variable)
Central Office Support (predictor variable)
N Mean Std.
Deviation
District office staff facilitate using data to improve
student learning.
106 4.42 1.210
The teaching and learning process at this school is
understood by the district staff.
106 4.02 1.380
The professional development provided by the district
office has helped me to improve my teaching.
102 3.99 1.397
District office staff support our school goals. 104 3.95 1.310
District office staff provide our school with the
resources we need to be effective.
107 3.90 1.295
When I need to talk with a district office administrator,
I can do so with relative ease.
108 3.88 1.309
District leaders are fair and open with teachers. 108 3.82 1.281
District office staff understands the problems schools
are facing.
106 3.67 1.385
District office leaders consistently support teachers. 105 3.67 1.356
District office staff are flexible and adaptable in
helping solve school problems.
106 3.61 1.284
There is open, effective communication between
district office staff.
105 3.56 1.208
Teachers in the two middle schools had a very different view of their central office
support than their school level support. The data show that teachers only slightly agree
with most of the statements. The most agreed to statement was “District office staff
facilitate using data to improve student learning.” The statement that was least agreed to
was “There is open, effective communication between district office staff.”
Central office staff using data to improve student learning earned the highest
marks. The majority of teachers who responded slightly agreed with the statement. The
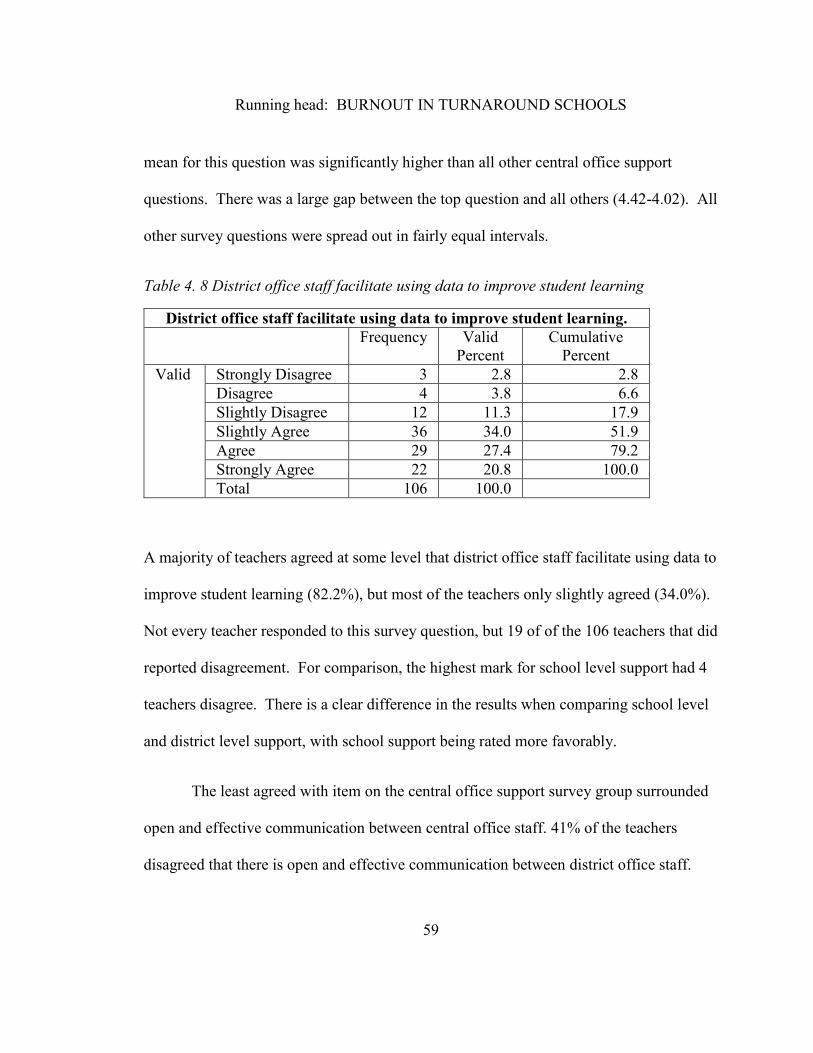
Running head: BURNOUT IN TURNAROUND SCHOOLS
59
mean for this question was significantly higher than all other central office support
questions. There was a large gap between the top question and all others (4.42-4.02). All
other survey questions were spread out in fairly equal intervals.
Table 4. 8 District office staff facilitate using data to improve student learning
District office staff facilitate using data to improve student learning.
Frequency Valid
Percent
Cumulative
Percent
Valid Strongly Disagree 3 2.8 2.8
Disagree 4 3.8 6.6
Slightly Disagree 12 11.3 17.9
Slightly Agree 36 34.0 51.9
Agree 29 27.4 79.2
Strongly Agree 22 20.8 100.0
Total 106 100.0
A majority of teachers agreed at some level that district office staff facilitate using data to
improve student learning (82.2%), but most of the teachers only slightly agreed (34.0%).
Not every teacher responded to this survey question, but 19 of of the 106 teachers that did
reported disagreement. For comparison, the highest mark for school level support had 4
teachers disagree. There is a clear difference in the results when comparing school level
and district level support, with school support being rated more favorably.
The least agreed with item on the central office support survey group surrounded
open and effective communication between central office staff. 41% of the teachers
disagreed that there is open and effective communication between district office staff.
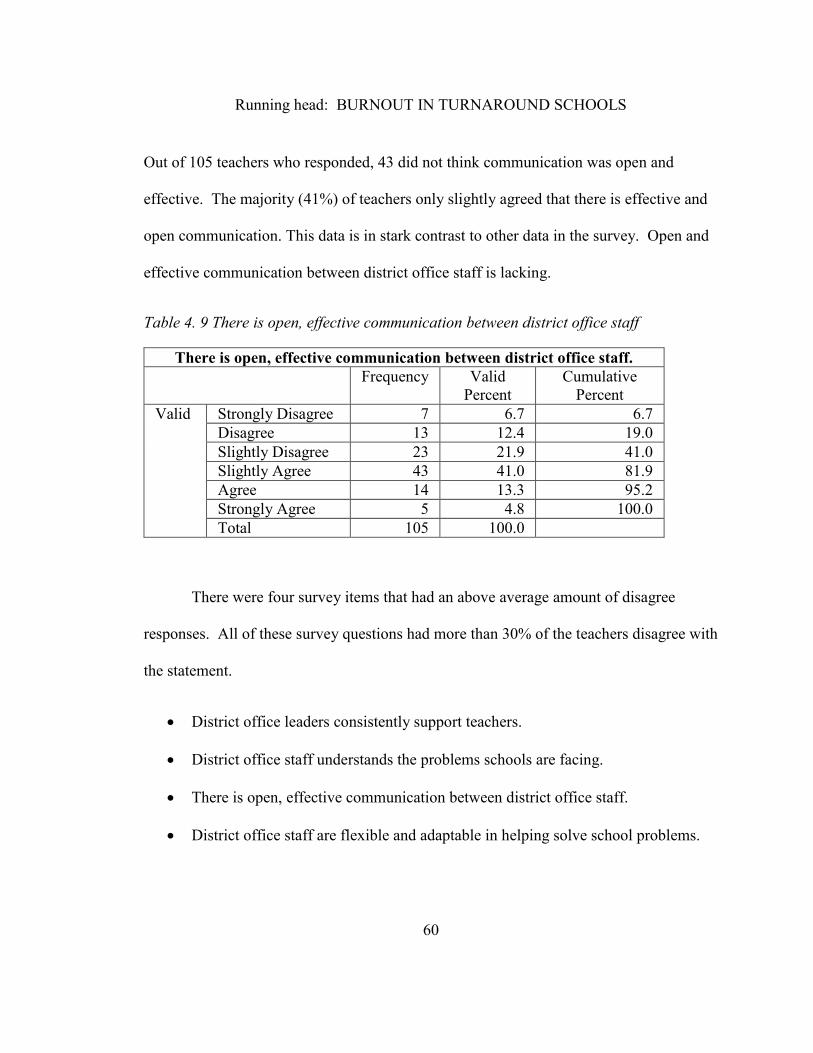
Running head: BURNOUT IN TURNAROUND SCHOOLS
60
Out of 105 teachers who responded, 43 did not think communication was open and
effective. The majority (41%) of teachers only slightly agreed that there is effective and
open communication. This data is in stark contrast to other data in the survey. Open and
effective communication between district office staff is lacking.
Table 4. 9 There is open, effective communication between district office staff
There is open, effective communication between district office staff.
Frequency Valid
Percent
Cumulative
Percent
Valid Strongly Disagree 7 6.7 6.7
Disagree 13 12.4 19.0
Slightly Disagree 23 21.9 41.0
Slightly Agree 43 41.0 81.9
Agree 14 13.3 95.2
Strongly Agree 5 4.8 100.0
Total 105 100.0
There were four survey items that had an above average amount of disagree
responses. All of these survey questions had more than 30% of the teachers disagree with
the statement.
District office leaders consistently support teachers.
District office staff understands the problems schools are facing.
There is open, effective communication between district office staff.
District office staff are flexible and adaptable in helping solve school problems.
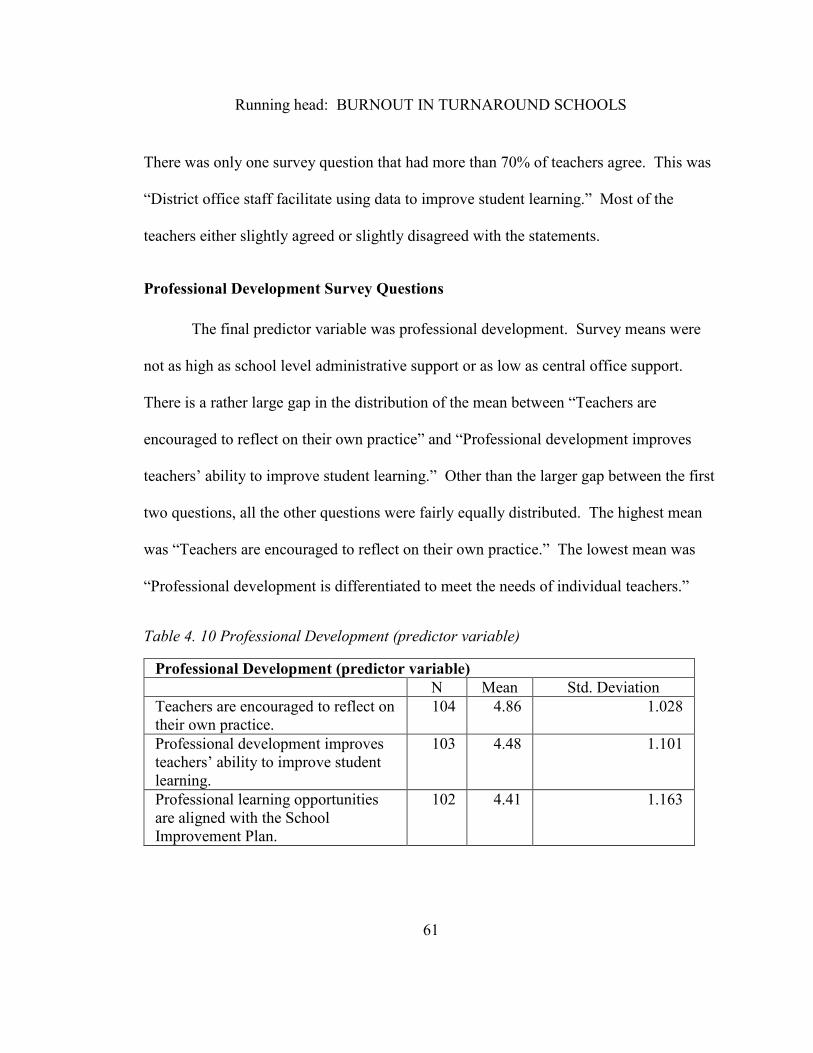
Running head: BURNOUT IN TURNAROUND SCHOOLS
61
There was only one survey question that had more than 70% of teachers agree. This was
“District office staff facilitate using data to improve student learning.” Most of the
teachers either slightly agreed or slightly disagreed with the statements.
Professional Development Survey Questions
The final predictor variable was professional development. Survey means were
not as high as school level administrative support or as low as central office support.
There is a rather large gap in the distribution of the mean between “Teachers are
encouraged to reflect on their own practice” and “Professional development improves
teachers’ ability to improve student learning.” Other than the larger gap between the first
two questions, all the other questions were fairly equally distributed. The highest mean
was “Teachers are encouraged to reflect on their own practice.” The lowest mean was
“Professional development is differentiated to meet the needs of individual teachers.”
Table 4. 10 Professional Development (predictor variable)
Professional Development (predictor variable)
N Mean Std. Deviation
Teachers are encouraged to reflect on
their own practice.
104 4.86 1.028
Professional development improves
teachers’ ability to improve student
learning.
103 4.48 1.101
Professional learning opportunities
are aligned with the School
Improvement Plan.
102 4.41 1.163
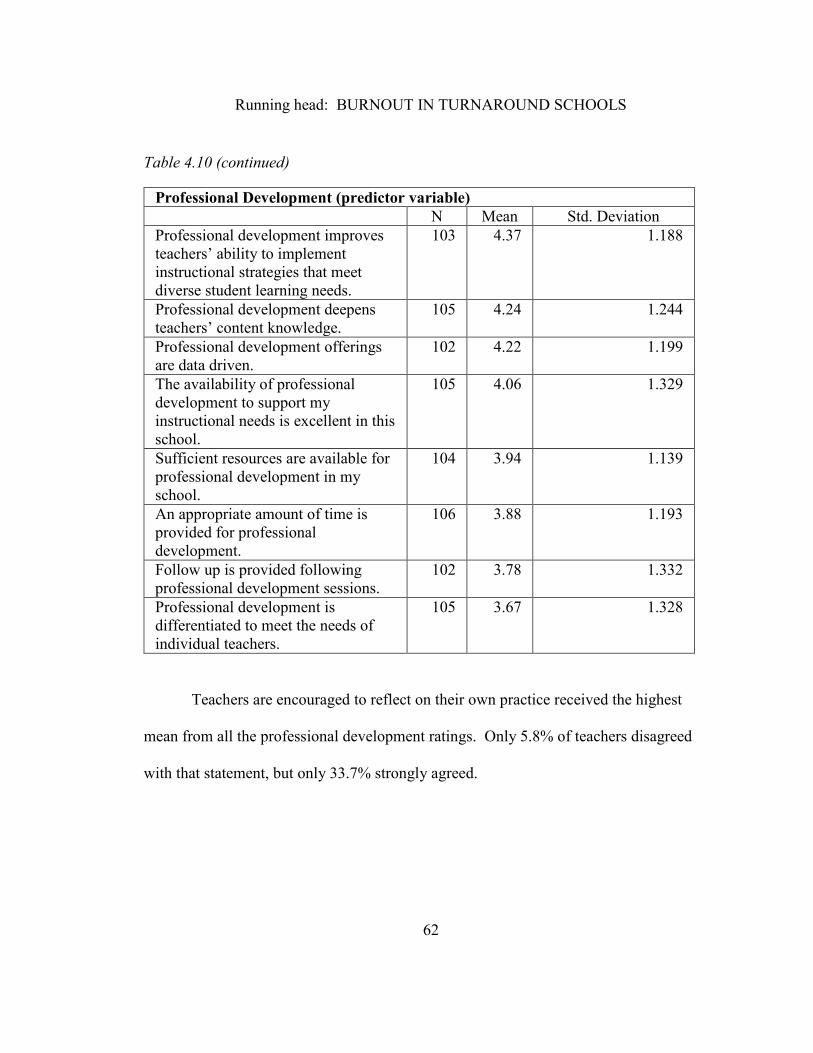
Running head: BURNOUT IN TURNAROUND SCHOOLS
62
Table 4.10 (continued)
Professional Development (predictor variable)
N Mean Std. Deviation
Professional development improves
teachers’ ability to implement
instructional strategies that meet
diverse student learning needs.
103 4.37 1.188
Professional development deepens
teachers’ content knowledge.
105 4.24 1.244
Professional development offerings
are data driven.
102 4.22 1.199
The availability of professional
development to support my
instructional needs is excellent in this
school.
105 4.06 1.329
Sufficient resources are available for
professional development in my
school.
104 3.94 1.139
An appropriate amount of time is
provided for professional
development.
106 3.88 1.193
Follow up is provided following
professional development sessions.
102 3.78 1.332
Professional development is
differentiated to meet the needs of
individual teachers.
105 3.67 1.328
Teachers are encouraged to reflect on their own practice received the highest
mean from all the professional development ratings. Only 5.8% of teachers disagreed
with that statement, but only 33.7% strongly agreed.
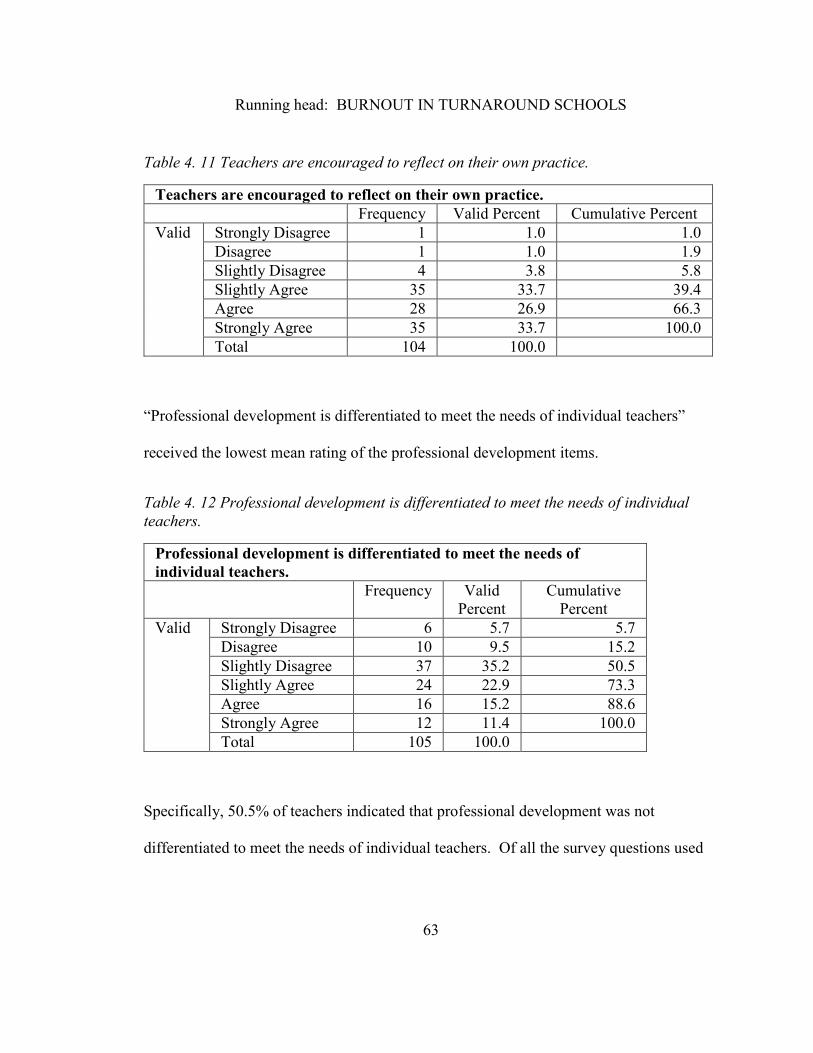
Running head: BURNOUT IN TURNAROUND SCHOOLS
63
Table 4. 11 Teachers are encouraged to reflect on their own practice.
Teachers are encouraged to reflect on their own practice.
Frequency Valid Percent Cumulative Percent
Valid Strongly Disagree 1 1.0 1.0
Disagree 1 1.0 1.9
Slightly Disagree 4 3.8 5.8
Slightly Agree 35 33.7 39.4
Agree 28 26.9 66.3
Strongly Agree 35 33.7 100.0
Total 104 100.0
“Professional development is differentiated to meet the needs of individual teachers”
received the lowest mean rating of the professional development items.
Table 4. 12 Professional development is differentiated to meet the needs of individual
teachers.
Professional development is differentiated to meet the needs of
individual teachers.
Frequency Valid
Percent
Cumulative
Percent
Valid Strongly Disagree 6 5.7 5.7
Disagree 10 9.5 15.2
Slightly Disagree 37 35.2 50.5
Slightly Agree 24 22.9 73.3
Agree 16 15.2 88.6
Strongly Agree 12 11.4 100.0
Total 105 100.0
Specifically, 50.5% of teachers indicated that professional development was not
differentiated to meet the needs of individual teachers. Of all the survey questions used
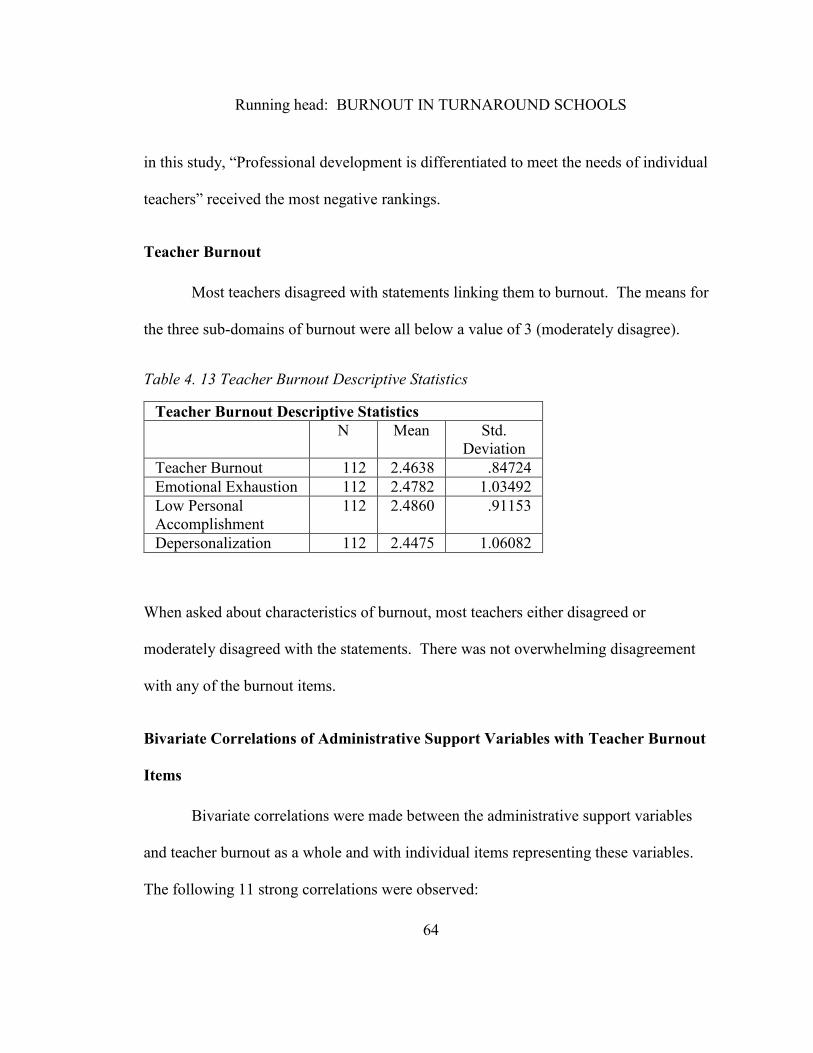
Running head: BURNOUT IN TURNAROUND SCHOOLS
64
in this study, “Professional development is differentiated to meet the needs of individual
teachers” received the most negative rankings.
Teacher Burnout
Most teachers disagreed with statements linking them to burnout. The means for
the three sub-domains of burnout were all below a value of 3 (moderately disagree).
Table 4. 13 Teacher Burnout Descriptive Statistics
Teacher Burnout Descriptive Statistics
N Mean Std.
Deviation
Teacher Burnout 112 2.4638 .84724
Emotional Exhaustion 112 2.4782 1.03492
Low Personal
Accomplishment
112 2.4860 .91153
Depersonalization 112 2.4475 1.06082
When asked about characteristics of burnout, most teachers either disagreed or
moderately disagreed with the statements. There was not overwhelming disagreement
with any of the burnout items.
Bivariate Correlations of Administrative Support Variables with Teacher Burnout
Items
Bivariate correlations were made between the administrative support variables
and teacher burnout as a whole and with individual items representing these variables.
The following 11 strong correlations were observed:
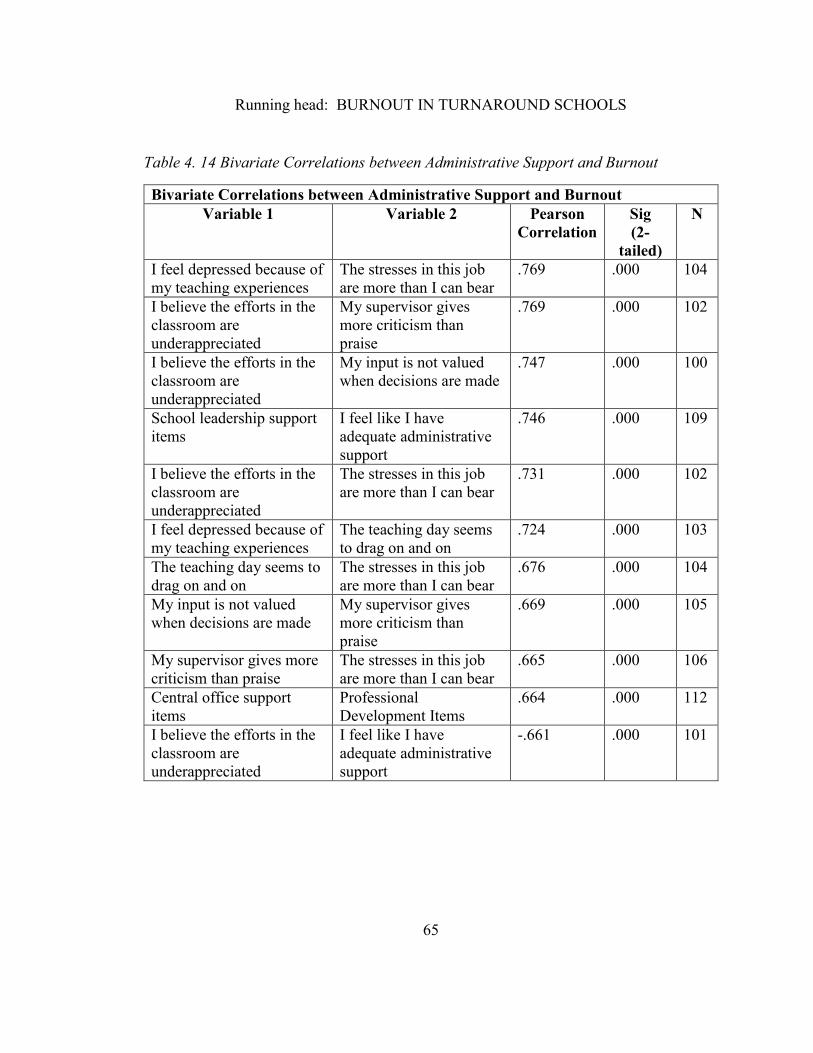
Running head: BURNOUT IN TURNAROUND SCHOOLS
65
Table 4. 14 Bivariate Correlations between Administrative Support and Burnout
Bivariate Correlations between Administrative Support and Burnout
Variable 1 Variable 2 Pearson
Correlation
Sig
(2-
tailed)
N
I feel depressed because of
my teaching experiences
The stresses in this job
are more than I can bear
.769 .000 104
I believe the efforts in the
classroom are
underappreciated
My supervisor gives
more criticism than
praise
.769 .000 102
I believe the efforts in the
classroom are
underappreciated
My input is not valued
when decisions are made
.747 .000 100
School leadership support
items
I feel like I have
adequate administrative
support
.746 .000 109
I believe the efforts in the
classroom are
underappreciated
The stresses in this job
are more than I can bear
.731 .000 102
I feel depressed because of
my teaching experiences
The teaching day seems
to drag on and on
.724 .000 103
The teaching day seems to
drag on and on
The stresses in this job
are more than I can bear
.676 .000 104
My input is not valued
when decisions are made
My supervisor gives
more criticism than
praise
.669 .000 105
My supervisor gives more
criticism than praise
The stresses in this job
are more than I can bear
.665 .000 106
Central office support
items
Professional
Development Items
.664 .000 112
I believe the efforts in the
classroom are
underappreciated
I feel like I have
adequate administrative
support
-.661 .000 101
Running head: BURNOUT IN TURNAROUND SCHOOLS
66
Multiple Regressions
A multiple regression was run to predict teacher burnout based upon school
leadership support, central office support, and professional development. There was a
significant effect of school leadership support, central office support, and professional
development on teacher burnout at the p<.05 level [F(3, 108) = 19.727, p = 0.000)] with
an R2 of .336. In others words, knowing school leadership support, central office support
and professional development allows one to predict teacher burnout better than cjance
alone, and collectively, these three predictors explain 33.6% of the variance in teacher
burnout. School leadership support significantly predicted teacher burnout, b = -.473, t =
-4.510, p = .000 as did professional development b = -.231, t = -2.092, p = .039. Teachers
that rated school administrative support and professional development more favorably
were less likely to report feeling burned out. School leadership support was almost two
times stronger as a predictor of teacher burnout than professional development Central
office support did not significantly predict teacher burnout, b = .069, t = .620, p = .536.
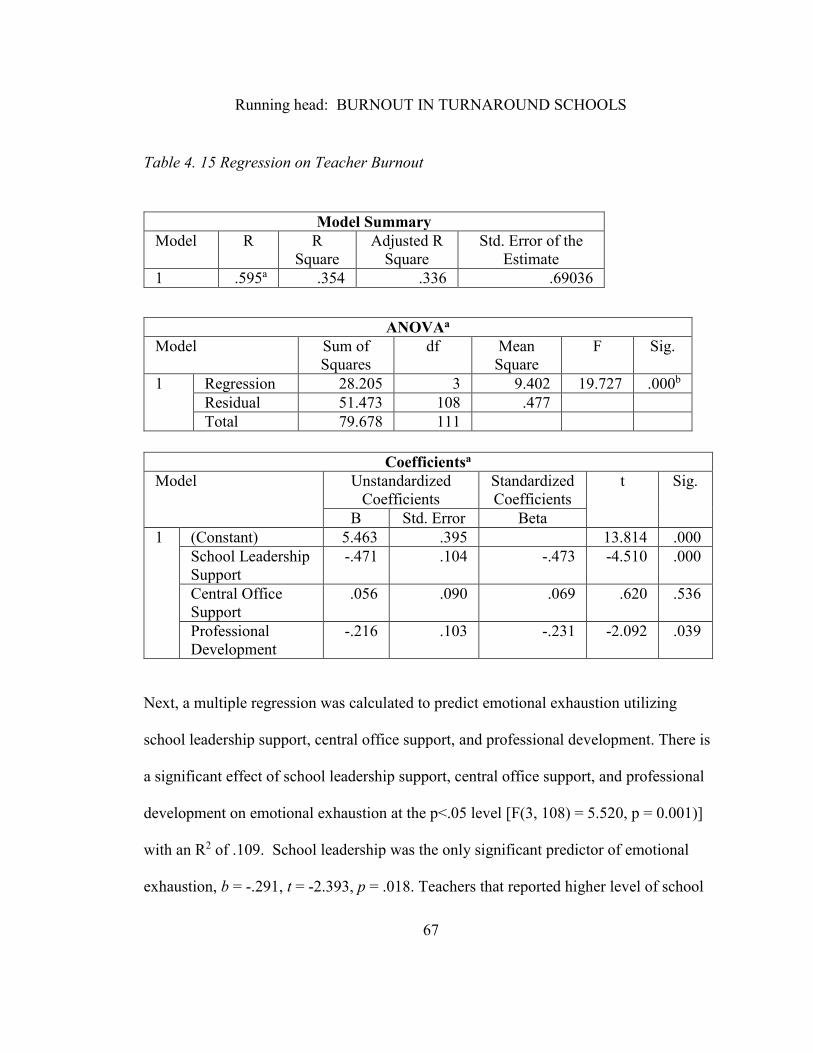
Running head: BURNOUT IN TURNAROUND SCHOOLS
67
Table 4. 15 Regression on Teacher Burnout
Next, a multiple regression was calculated to predict emotional exhaustion utilizing
school leadership support, central office support, and professional development. There is
a significant effect of school leadership support, central office support, and professional
development on emotional exhaustion at the p<.05 level [F(3, 108) = 5.520, p = 0.001)]
with an R2 of .109. School leadership was the only significant predictor of emotional
exhaustion, b = -.291, t = -2.393, p = .018. Teachers that reported higher level of school
Model Summary
Model R R
Square
Adjusted R
Square
Std. Error of the
Estimate
1 .595a .354 .336 .69036
ANOVAa
Model Sum of
Squares
df Mean
Square
F Sig.
1 Regression 28.205 3 9.402 19.727 .000b
Residual 51.473 108 .477
Total 79.678 111
Coefficientsa
Model Unstandardized
Coefficients
Standardized
Coefficients
t Sig.
B Std. Error Beta
1 (Constant) 5.463 .395 13.814 .000
School Leadership
Support
-.471 .104 -.473 -4.510 .000
Central Office
Support
.056 .090 .069 .620 .536
Professional
Development
-.216 .103 -.231 -2.092 .039
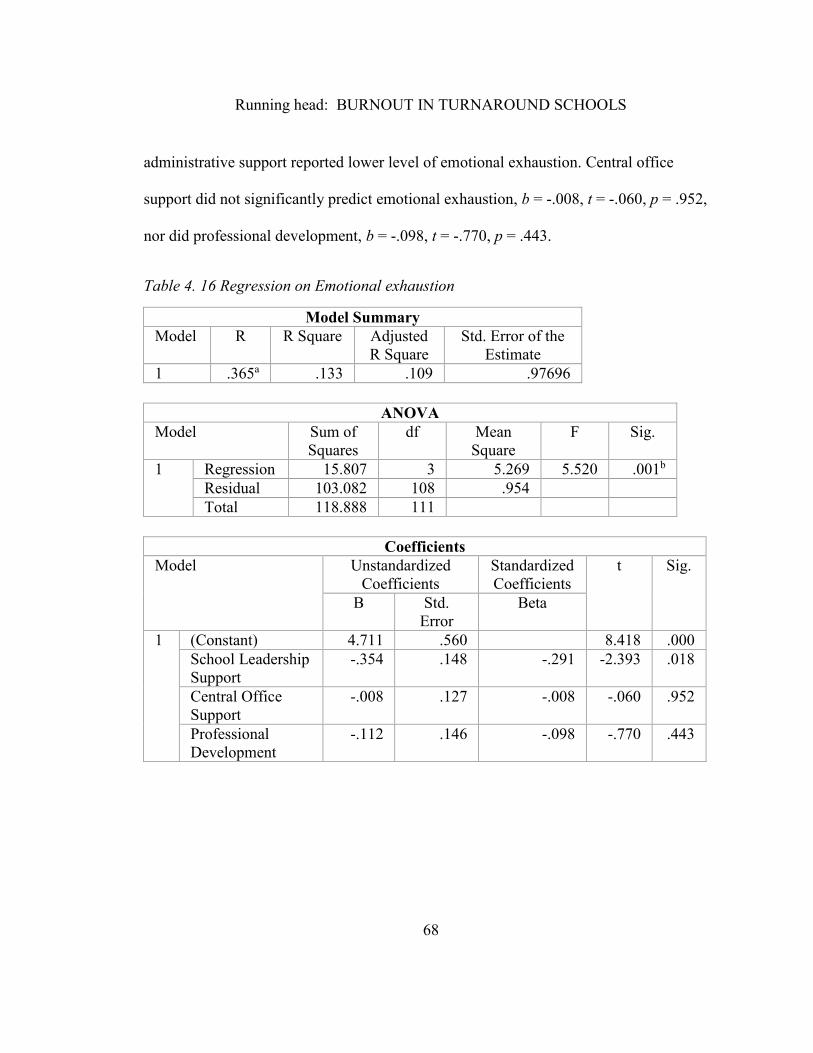
Running head: BURNOUT IN TURNAROUND SCHOOLS
68
administrative support reported lower level of emotional exhaustion. Central office
support did not significantly predict emotional exhaustion, b = -.008, t = -.060, p = .952,
nor did professional development, b = -.098, t = -.770, p = .443.
Table 4. 16 Regression on Emotional exhaustion
Model Summary
Model R R Square Adjusted
R Square
Std. Error of the
Estimate
1 .365a .133 .109 .97696
ANOVA
Model Sum of
Squares
df Mean
Square
F Sig.
1 Regression 15.807 3 5.269 5.520 .001b
Residual 103.082 108 .954
Total 118.888 111
Coefficients
Model Unstandardized
Coefficients
Standardized
Coefficients
t Sig.
B Std.
Error
Beta
1 (Constant) 4.711 .560 8.418 .000
School Leadership
Support
-.354 .148 -.291 -2.393 .018
Central Office
Support
-.008 .127 -.008 -.060 .952
Professional
Development
-.112 .146 -.098 -.770 .443
Running head: BURNOUT IN TURNAROUND SCHOOLS
69
A multiple linear regression also was run to predict low personal
accomplishments based upon school leadership support, central office support, and
professional development. There is a significant effect of school leadership support,
central office support, and professional development on low personal accomplishments at
the p<.05 level [F(3, 108) = 13.445, p = 0.000)] with an R2 of .252. School leadership
support significantly predicted low personal accomplishments, b = -.236, t = -2.122, p =
.036. Similarly, professional development significantly predicted low personal
accomplishments b = -.344, t = -2.936, p = .004. Teachers that rated professional
development and school leadership report more favorably were less likely to report low
personal accomplishments. In this case, professional development was a much stronger
predictor of low personal accomplishment than school leadership support. Central office
support did not significantly predict low personal accomplishments, b = -.002, t = -
.017, p = .987.
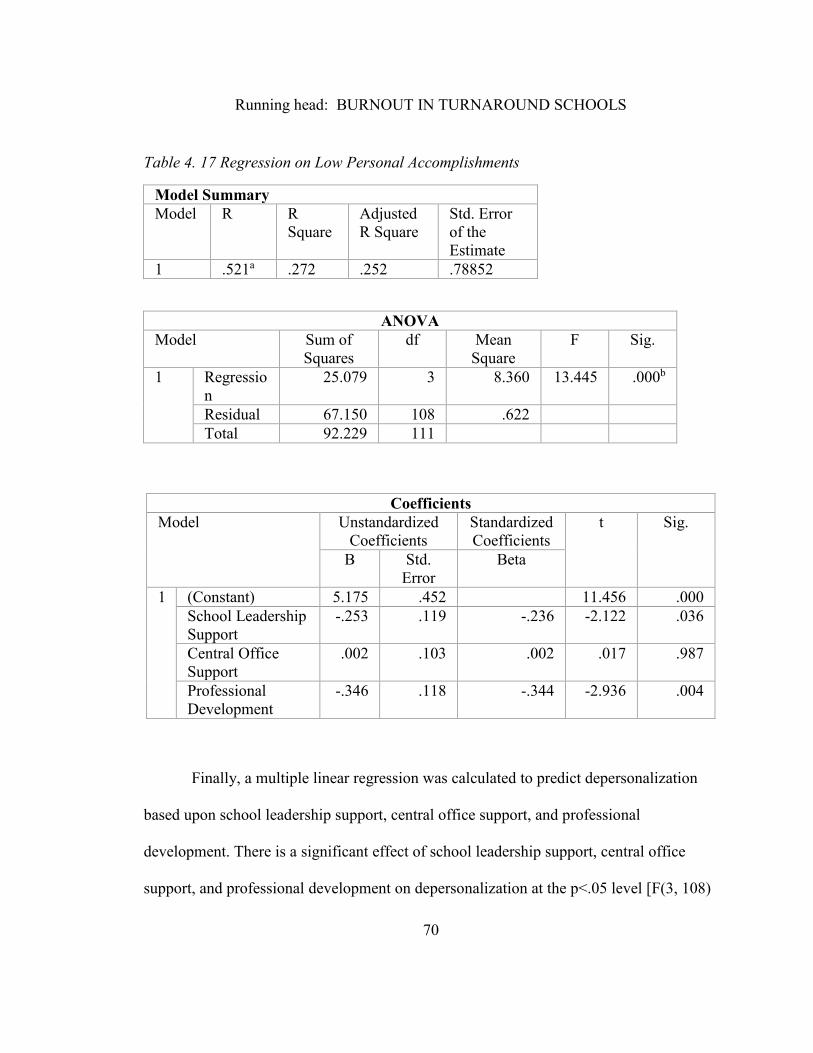
Running head: BURNOUT IN TURNAROUND SCHOOLS
70
Table 4. 17 Regression on Low Personal Accomplishments
ANOVA
Model Sum of
Squares
df Mean
Square
F Sig.
1 Regressio
n
25.079 3 8.360 13.445 .000b
Residual 67.150 108 .622
Total 92.229 111
Coefficients
Model Unstandardized
Coefficients
Standardized
Coefficients
t Sig.
B Std.
Error
Beta
1 (Constant) 5.175 .452 11.456 .000
School Leadership
Support
-.253 .119 -.236 -2.122 .036
Central Office
Support
.002 .103 .002 .017 .987
Professional
Development
-.346 .118 -.344 -2.936 .004
Finally, a multiple linear regression was calculated to predict depersonalization
based upon school leadership support, central office support, and professional
development. There is a significant effect of school leadership support, central office
support, and professional development on depersonalization at the p<.05 level [F(3, 108)
Model Summary
Model R R
Square
Adjusted
R Square
Std. Error
of the
Estimate
1 .521a .272 .252 .78852
Running head: BURNOUT IN TURNAROUND SCHOOLS
71
= 37.019, p = 0.000)] with an R2 of .493. School leadership support significantly
predicted depersonalization, b = -.634, t = -6.927, p = .000. Similarly, professional
development significantly predicted depersonalization b = -.266, t = -2.762, p = .007.
Teachers that ranked professional development and school leadership support more
positively also reported lower levels of depersonalization. School leadership support was
a much stronger predictor of depersonalization than professional development. Central
office support did not significantly predict depersonalization, b = .181, t = 1.871, p =
.064.
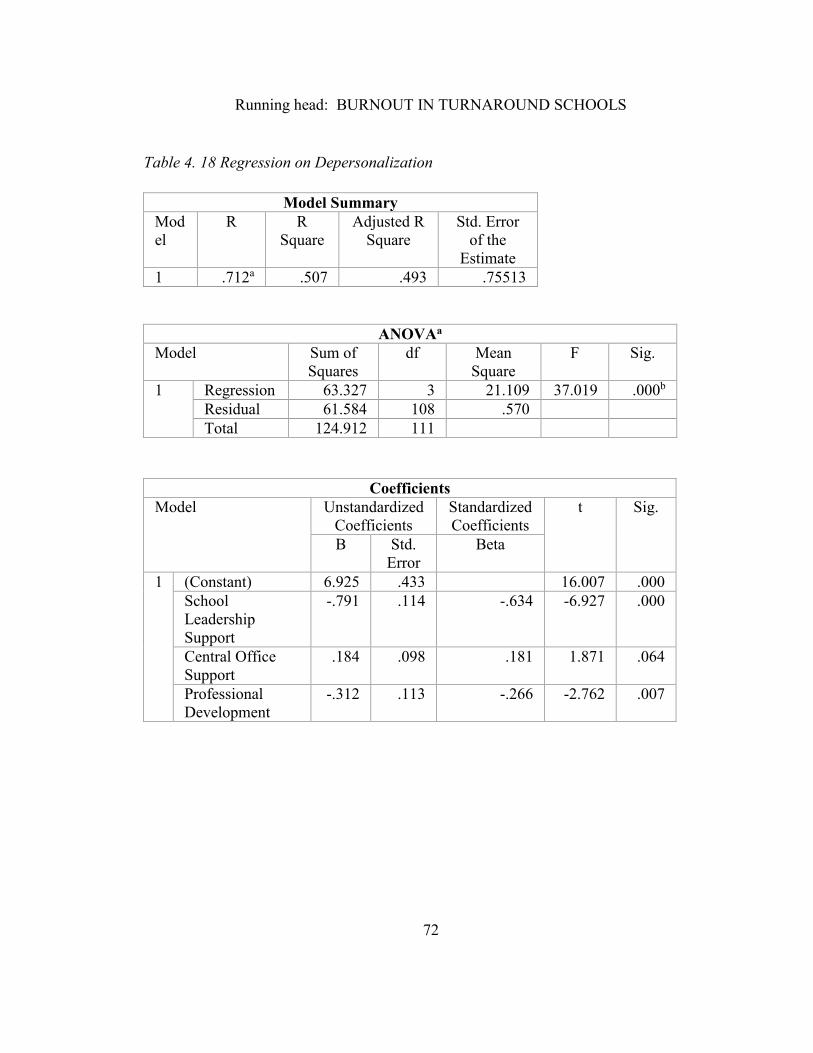
Running head: BURNOUT IN TURNAROUND SCHOOLS
72
Table 4. 18 Regression on Depersonalization
Model Summary
Mod
el
R R
Square
Adjusted R
Square
Std. Error
of the
Estimate
1 .712a .507 .493 .75513
ANOVAa
Model Sum of
Squares
df Mean
Square
F Sig.
1 Regression 63.327 3 21.109 37.019 .000b
Residual 61.584 108 .570
Total 124.912 111
Coefficients
Model Unstandardized
Coefficients
Standardized
Coefficients
t Sig.
B Std.
Error
Beta
1 (Constant) 6.925 .433 16.007 .000
School
Leadership
Support
-.791 .114 -.634 -6.927 .000
Central Office
Support
.184 .098 .181 1.871 .064
Professional
Development
-.312 .113 -.266 -2.762 .007
Running head: BURNOUT IN TURNAROUND SCHOOLS
73
Chapter 5
Conclusion, Discussion, and Recommendations
Purpose of Study
Many academically struggling schools have been awarded a SIG designed to help
achieve greater student success. The SIGs mandate that a school implement one of four
models. One of those models is called turnaround. The turnaround model requires
drastic teacher and administration overhaul. The purpose of this study was to determine
how administrative support in turnaround schools affects teacher burnout.
112 teachers from two middle schools in a large urban district were administered
a survey with 160 questions. Each question asked the teachers to rank whether they
agreed or disagreed on a scale of 1-6 (with 6 strong agreement). Survey questions that
were related to administrative support and teacher burnout were selected and analyzed
using descriptive statistics, bivariate correlations, and multiple regressions. Results of the
data analysis showed the relationship of school level support, central office support, and
professional development with teacher burnout in turnaround schools.
Findings and Discussion
Teachers at the two middle schools agreed that they have high levels school
administrative support. The twelve survey items representing school support had means
Running head: BURNOUT IN TURNAROUND SCHOOLS
74
between agree (4) and strongly agree (6). It is fairly obvious that the school level
administration is doing a good job in supporting the teachers. The survey was given
during the third year of the turnaround model. The school level administration has had
time to develop strong administrative support and positive relations with teachers
Indicatives of school level administrative support included being highly visible
and approachable. Additionally, teachers reported that they can discuss issues with their
administration with relative ease. When teachers want to become better at their
profession, the principal will give them support and helpful feedback. A shared vision
between administration and faculty received the lowest mean ratings. While having a
shared vision is the lowest in all the school level support items, the mean was not rated
below the agree level.
There were some survey items which received a higher than average amount of
disagree marks. A higher than average number of teachers did not think that school
administrators gave consistent or sufficient support when they needed it. The number of
these responses was low, but above the average for all the other survey items.
Conversely, there were five items that received a higher than normal amount of strongly
agree marks. These areas showed the strengths of the administration at the school level.
Many of the more favorable responses are similar to the ones that earned lower marks.
For example, a low area was “If I have a problem, the administration gives me the
support I want.” A similar high area was “When I need to talk with a school
Running head: BURNOUT IN TURNAROUND SCHOOLS
75
administrator at this school, I can do so with relative ease.” A teacher at these two
schools might be able to approach a highly visible administrator but feel like their
concerns are not being addressed. It is important to note that the lower items in the
school level support category had a very small minority of teachers respond with negative
marks. There were an overwhelming majority of teachers who thought that there was
strong administrative support.
The observation that a small minority (12%) of teachers felt like the
administration does not support them is an important aspect of administering a school.
Not every teacher is the same, and some might perceive actions by an administrator
differently from another teacher. One of the more negative items in the school level
support category was “Extra efforts by staff are acknowledged by the principal.”
Different teachers might require different types of recognition. There could be a very
effective teacher in the building who might require a slightly different type of recognition
by their principal.
Support from district administration received the lowest marks in the survey. The
average marks were one full point lower than school level support and slightly lower than
professional development. Not surprisingly, the strongest aspect of central office level
support came in the area of data analysis. Test results were sent to an office that is in a
different building and analyzed by people who do not know the teaching staff as well as
the school level administrator.
Running head: BURNOUT IN TURNAROUND SCHOOLS
76
District office support is needed by individual schools, especially the lowest
performing ones. A school usually does not have the resources to analyze large volumes
of testing data. District office staff is there to support the individual schools, but survey
data show that they do not understand school level issues as well as school principals.
Almost every survey item that centered on knowing individual people received lower
than average marks.
A constant theme in the data was a lack of understanding and being open by
district staff. The district was able to analyze testing data and tell teachers how they can
improve, but they were not able to relate to the teachers. Most teachers strongly agreed
that district office can analyze data to improve learning, but disagreed that there is open
and effective communication between teachers and district office staff. The data suggest
that district office staff is disconnected from the individual school when it comes to
support other than data analysis.
The differences between ratings of school administrative and central office
support may be in part due to proximity. Principals are visible and in schools and teacher
classrooms daily. Central office personnel are in schools far less frequently. This less
frequent visibility may result in assumptions by teachers that central personnel do not
understand the school and are not supportive. Furthermore, principals often act as middle
managers and buffer teachers from centralizing and localizing pressures, thus making it
more difficult for central office personnel to provide support. If central office
Running head: BURNOUT IN TURNAROUND SCHOOLS
77
communicates with principals, who are expected to share those communications with
teachers, then teachers may rate principals as effective communicators and central office
staff as poor ones. Finally, the discrepancy in ratings may be due in part to the context of
being in a turnaround. Turnaround models are very prescriptive, and district personnel are
accountable for full implementation of the model, which comes at the expense of teacher
autonomy and may lead to lower ratings of central office.
Professional development was rated more favorably than district office by less
favorably than school administration. Most states require hours of professional
development but leave the format of professional development up to the district and
school. This gives the district and school a degree of freedom to plan professional
development. The highest rating for professional development involved teachers
reflecting on their learning. There was a rather large gap in means between reflecting on
learning and the second highest survey question (professional development improves
teachers’ ability to improve student learning). In fact, most of the professional
development questions that dealt with the practical use of professional development were
rated lower than the other items.
Amount of quality time devoted to professional development is a constant theme
that is rated low. Teachers were asked to reflect on their professional development, but
sufficient follow-up and time are not allotted. The lowest rated question for professional
development involved differentiation. Teachers believe that professional development is
Running head: BURNOUT IN TURNAROUND SCHOOLS
78
not differentiated as well as it could be. Collectively, these results are consistent with the
professional development literature that documents that it is too often a one-shot
approach and a one-size fits all model.
District level support indicators showed that central office staff were unable to
understand the issues at the school level. Professional development indicators show that
differentiation is not sufficient. It could be that professional development run by the
district fails to meet the needs of the teachers because central office staff do not
understand the issues at the school level. Instead, there might be heavy handed policies
that might be data driven in content but not in pedagogy.
When administrative support variables were used to predict teacher burnout, it
was determined that school level support played the most important role in predicting
burnout. While not as powerful, professional development also predicted teacher
burnout. This is could be because professional development empowers teachers to have
greater success with students, thus enhancing their efficacy and reducing burnout.
The majority of teachers did not report high levels of burnout. On the contrary,
most disagreed with statements which would point to burnout. This finding was
surprising given that both schools in the sample were turnaround schools. They were
eligible for the SIG because of having student achievement levels in the bottom five
percent of the state. As a result, moving teachers to other schools and other highly
Running head: BURNOUT IN TURNAROUND SCHOOLS
79
prescriptive directives were required by the SIG. These teachers were under clear
directives and high levels of pressure to improve student outcomes. Despite this context,
burnout levels remained low. These low levels of burnout are likely primarily the result
of the high levels of school administrative support perceived by the teachers.
The individual burnout predictor values yielded more specific findings. The most
important predictor variable in the administrative support group is school level support.
The data support this conclusion in two different ways. First, school level support
received the highest marks when compared to professional development and central
office support. Second, school level support was the only variable to predict burnout and
all three subscales. Furthermore, it was the most powerful predictor of burnout, emotional
exhaustion, and depersonalization. Professional development was a more powerful
predictor of low personal accomplishment. In other words, professional development can
empower teacher to achieve more with their students. The fact that high levels of school
administrative support reduce burnout by decreasing emotional exhaustion and
depersonalization highlights the pivotal role that interpersonal skills play in school
leadership.
Contrary to some findings in the literature, central office support was not a critical
variable in this study. Central office support was not a significant predictor of teacher
burnout as a whole or of its three subscales. According to the data in this study, it is
completely possible for teachers to report low levels of burnout while feeling very little
Running head: BURNOUT IN TURNAROUND SCHOOLS
80
central office support. This observation demonstrates that strong school level
administrative support can overcome poor central office support.
There were mixed results with professional development. At the aggregate level,
support from professional development was able to predict teacher burnout. When
looking at each subscale of burnout, only emotional exhaustion was not predicted from
the professional development. This finding sheds light on the complexity of teaching and
the energy it requires, especially in an intense environment such as a low performing
turnaround school. It also raises the question of the duration of this exhaustion and how it
impacts teaching in the future. Teaching can be a stressful profession, and it is important
for teachers to have the intrapersonal awareness to take care of themselves so that factors
such as exhaustions do not lead to permanent burnout and increased exiting of the
profession. Principals share responsibility, there support reduces such exhaustion.
There was some indication in the literature that professional development support
is related to teacher burnout, but it was not specifically addressed as professional
development. Teachers need support, but when the support is too heavy handed or
irrelevant, some burnout occurs. As indicated by the survey results, some aspects of the
professional development provided received some relatively low marks. Differentiation
and appropriate time for professional development all received lower ratings. This lack of
differentiation could be due to insufficient resources for professional development,
centralized plans that standardize professional development, and high stakes assessments
Running head: BURNOUT IN TURNAROUND SCHOOLS
81
that are resulting in professional development being focused on what content teachers
should teach as opposed to improving relevant forms of instruction that meet the needs of
teachers teaching different subjects or serving students with unique needs.
Recommendations
The major findings of this study showed that school level support played a
significant role in predicting teacher burnout. Professional development support played a
significant role in predicting teacher burnout, but not to the same extent as school level
support. Central office support was not a significant factor in predicting teacher burnout
or any burnout subdomains.
Schools that are under a great amount of pressure to raise test scores and under a
turnaround program can create an environment in which burnout occurs at low levels.
Support from the local school administration and proper professional development
critical in this regard. By looking at the individual survey questions, a list of
recommended administrative practices can be found.
School level administrators should be visible and open. During a typical day,
teachers feel supported when their administrators are visible. Visible and approachable
administration can help the teachers see that they have a partner that is willing to support
them during some of the more pressing times of the school day. If a teacher is standing
outside their door between classes and observing poor student behavior from students
Running head: BURNOUT IN TURNAROUND SCHOOLS
82
they do not know, a nearby administrator can easily help in this situation. As a teacher is
out in the hallways, they know that it is easy to approach an administrator. The teachers
need to feel comfortable approaching their administration.
School level administrative support should be appropriate and can be delivered in
two fundamental ways. First, the administration can help the teachers during their
instruction. The administration can hold each teacher to a high standard and give them
the feedback and resources to be successful. Second, the administration can help teachers
by giving them other forms of support. Some experienced teachers may not need the
same level of administrative support as less experienced teachers. This means that
support can almost seem like no support. When an administrator has a master teacher,
their support can be found by letting them be autonomous. They can watch them from a
distance and support them from behind the scenes by eliminating seemingly irrelevant
items that interfere with their instructional day.
An interesting link between school level support and central office support can be
made. It is very possible for the school level support to overcome poor central office
support. If there is poor communication between central office staff and teachers, a
school level administrator can be more purposeful with communication with their staff.
If teachers believe that the central office staff do not understand their problems, a school
level administration can be more purposeful with understanding their problems.
Basically, since there is a relationship between the school level administration and the
Running head: BURNOUT IN TURNAROUND SCHOOLS
83
teachers, the school level administration determine how they can overcome the lack of
central office support or garner different forms of centralized support. The school level
administrator has the most power to control teacher burnout even when central office
support is lacking.
School level support can also influence the magnitude of professional
development support. A school level administrator could be offering very good support
to their teachers, but find some burnout. This could occur due to poor professional
development that is not enabling teachers to have the skills to enhance student learning.
A building administrator usually has significant influence over how professional
development is administred at their school. The survey items that received low marks
might be very powerful predictors of teacher burnout. To alleviate teacher burnout, a
school level administrator should make sure the professional development is meaningful,
data centered, timely, and differentiated.
School level administrators might be tempted to cover a wide range of topics for
their professional development activities. Their wide range of topics could be data based
and well intentioned. The survey results show that even though the professional
development is data based and aligned with the school improvement plan, sufficient time
may not be provided. Having too many professional development activities without
enough time for proper delivery and follow-up may lead to higher teacher burnout. A
school level administrator should focus on implementing professional development that is
Running head: BURNOUT IN TURNAROUND SCHOOLS
84
data based, aligned with the school improvement plan, time appropriate, and
differentiated.
Areas for Further Study
This study raises a number of questions that can be assessed in future studies. In
each of the survey questions, a small number of respondents indicated negative marks
towards administrative support. These teachers could develop burnout and all together
quit the profession or become ineffective teachers. Determining how administrative
support can differentiate to meet the needs of every teacher is warranted warranted.
While only 12% seems like a small percentage of teachers, that 12% is touching the lives
of a large number of students.
Central office support was not a significant predictor of teacher burnout. It
appeared as if school level administrative support can counter balance poor central office
support. Proper and effective central office support might still help teachers become
more effective. Therefore, a qualitative study of why and under what conditions central
office support is perceived as high and low would make a positive contribution to the
field. Furthermore, while this study focused on teacher burnout, school administrators
also are susceptible to burnout. Assessing the how central office support can influence it
principal burnout would also add to the body of knowledge on burnout. It is clear that
school level administration exerts a significant impact on teacher burnout. Effective
Running head: BURNOUT IN TURNAROUND SCHOOLS
85
teaching can be attributed to strong school level support. If school level administration is
burned out, their effectiveness would almost certainly be reduced, thereby increasing the
likelihood of greater teacher burnout.
This study should also be replicated in different levels of schools, schools serving
different student populations, and schools implementing models other than the
turnaround model. Finally, longitudinal studies should be conducted to look at the
relationships between administrative support and teacher burnout over time.
Closing
The results of this study suggested that a strong school level administrative
support can overcome poor central office support. A strong school level administrator
can protect their teachers from an over-powering central office with very little connection
to the individual teacher. Meaning professional development also reduces burnout and
leads to greater senses of personal accomplishment. The two schools in this study were
characterized by strong school administrative support. It will be important to ascertain
what levels of teacher burnout are typical of schools with low levels of school
administrative support. Could strong central office support overcome poor school level
support and minimize teacher burnout?
Running head: BURNOUT IN TURNAROUND SCHOOLS
86
References
Aladjem, D.K., Birman, B.F. , Orland M., Harr-Robins, Heredia, A., Parrish, T.B.
&Ruffini, S.J. (2010), Achieving Dramatic School Improvement: An Exploratory
Study (Washington, DC: US Department of Education).
Algozzine, B., Gretes, J., Queen, A. J., & Cowan-Hathcock, M. (2007). Beginning
Teachers' Perceptions of Their Induction Program Experiences. Clearing House,
80(3), 137-143.
American Recovery and Reinvestment Act (ARRA) of 2009, Pub L. No. 111-5, 123
Stat.115.516 (Feb 19, 2009)
Bantwini, B. D. (2012). Primary school science teachers’ perspectives regarding their
professional development: implications for school districts in South Africa.
Professional Development In Education, 38(4), 517-532.
doi:10.1080/19415257.2011.637224
Barber, M., Whelan, F., & Clark, M. (2010). Capturing the leadership premium: How the
world’s top school systems are building leadership capacity for the future.
London, UK: McKinsey & Co. Retrieved 27 December 2013 from
http://www.mckinsey.com
Barmby, P. (2006). Improving teacher recruitment and retention: the importance of
workload and pupil behaviour. Educational Research, 48(3), 247-
265.doi:10.1080/00131880600732314
Running head: BURNOUT IN TURNAROUND SCHOOLS
87
become exemplary: Ways that leadership raises achievement and narrows gaps
by improving instruction in 15 public high schools. Report on the 2009 Annual
Conference of the Achievement Gap Initiative at Harvard University. Retrieved
from http://www.agi.
Bernhardt, V. L. (2006). Using student data to improve student learning in school
districts. Larchmont, NY: Eye on Education.
Bernhardt, V. L., & Hebert, C. L. (2011). Response to intervention (RTI) and continuous
school improvement (CSI): Using data, vision, and leadership to design,
implement, and evaluate a schoolwide prevention system. Larchmont, NY: Eye
on Education
Betoret, F. (2006). Stressors, Self‐Efficacy, Coping Resources, and Burnout among
Secondary School Teachers in Spain. Educational Psychology, 26(4), 519-539.
doi:10.1080/01443410500342492
Brackett, M. A., Palomera, R., Mojsa-Kaja, J., Reyes, M., & Salovey, P. (2010).
Emotion-regulation ability, burnout, and job satisfaction among British
secondary-school teachers. Psychology In The Schools, 47(4), 406-417.
Brownstein, A. (2012). Aid to Low-Performing Schools Also a Budget Patch. Education
Week, 31(28), 18-19.
Byrne, B. M. (1993). The Maslach Burnout Inventory: Testing for factorial validity and
invariance across elementary, intermediate and secondary teachers. Journal of
Running head: BURNOUT IN TURNAROUND SCHOOLS
88
Occupational & Organizational Psychology, 66(3), 197-212. Retrieved from
EBSCOhost.
Casey, J. M. (2005). A practitioner's guide to creating a shared vision. Leadership, 35(1),
26-29.
Cavanagh, S. (2011). School Improvement Grants. Education Week, 30(30), 5.
Cenkseven-Önder, F., & Sari, M. (2009). The Quality of School Life and Burnout as
Predictors of Subjective Well-Being among Teachers. Educational Sciences:
Theory & Practice, 9(3), 1223-1235. Retrieved from EBSCOhost.
Chang, M. (2009). An Appraisal Perspective of Teacher Burnout: Examining the
Emotional Work of Teachers. Educational Psychology Review, 21(3), 193-218.
doi:10.1007/s10648-009-9106-y
Chenoweth, K. (2009). It Can Be Done, It's Being Done, and Here's How. Phi Delta
Kappan, 91(1), 38-43.
Childinfo.org (2012). Childinfo.org: Statistics by Area - Education - Secondary school
enrolment and attendance ratios. [online] Retrieved from:
http://www.childinfo.org/education_secondary.php [Accessed: 6 Jun 2013].
Clarke, S., & Wildy, H. (2011). Improving the small rural or remote school: The role of
the district. Australian Journal Of Education (ACER Press), 55(1), 24-36.
Running head: BURNOUT IN TURNAROUND SCHOOLS
89
Cooley, E. and Yovanoff, P. (1996). Supporting Professionals-at-Risk: Evaluating
Interventions to Reduce Burnout and Improve Retention of Special Educators,
Exceptional Children, 62: 336–55.
Corbell, K. A., Osborne, J., & Reiman, A. J. (2010). Supporting and retaining beginning
teachers: a validity study of the Perceptions of Success Inventory for Beginning
Teachers. Educational Research & Evaluation, 16(1), 75-96.
doi:10.1080/13803611003722325
Curtis, C. (2012). Why do they Choose to Teach - and Why do they Leave? A Study of
Middle School and High School Mathematics Teachers. Education, 132(4), 779-
788.
Darden, E. C., & Cavendish, E. (2012). Achieving Resource Equity within a Single
School District: Erasing the Opportunity Gap By Examining School Board
Decisions. Education & Urban Society, 44(1), 61-82.
doi:10.1177/0013124510380912
Darling-Hammond, L. (2000). Solving the dilemmas of teacher supply, demand, and
quality. New York: National Commission on Teaching and America's Future.
Darling-Hammond, L. (2003). Keeping Good Teachers. Educational Leadership, 60(8),
6.
Running head: BURNOUT IN TURNAROUND SCHOOLS
90
Darling-Hammond, L., Chung, R., & Frelow, F. (2002). Variation in teacher
preparation: How well do different pathways prepare teachers to teach?
Journal of Teacher Education, 53(4), 286-302.
de Wolf, I. F., & Janssens, F. G. (2007). Effects and side effects of inspections and
accountability in education: an overview of empirical studies. Oxford Review of
Education, 33(3), 379-396. doi:10.1080/03054980701366207
Dee, T. (2012). School Turnarounds: Evidence from the 2009 Stimulus. NBER Working
Paper Series. National Bureau of Economic Research.
DePaul, S. (2006). Who Evaluates Whom? American School Board Journal, 193(12),
34-36.
Duke, D. L. (2008). Diagnosing School Decline. Phi Delta Kappan, 89(9), 667-671.
Ed.gov (2013). U.S. Department of Education. [online] Retrieved from:
http://www.ed.gov/ [Accessed: 14 Jun 2013].
Elementary and Secondary Education Act, 20 U.S.C., 1965
Ferguson, R., Hackman, S., Hanna, R., & Ballantine, A. (June 2010). How high schools
Friedman, I. A., & Farber, B. A. (1992). Professional Self-Concept as a Predictor of
Teacher Burnout. Journal of Educational Research, 86(1), 28. Retrieved from
EBSCOhost.
Fullan, M. (2006). Turnaround leadership. San Francisco: John Wiley & Sons
Running head: BURNOUT IN TURNAROUND SCHOOLS
91
Fullan, M. (2010). Motion leadership: The skinny on becoming change savvy. Thousand
Oaks, CA: Corwin Press.
Goddard, R., O'Brien, P., & Goddard, M. (2006). Work environment predictors of
beginning teacher burnout. British Educational Research Journal, 32(6), 857-874.
Retrieved from EBSCOhost.
Grissom, J. A., & Strunk, K. O. (2012). How Should School Districts Shape Teacher
Salary Schedules? Linking School Performance to Pay Structure in Traditional
Compensation Schemes. Educational Policy, 26(5), 663-695.
Halawah, I. (2005). The Relationship between Effective Communication of High School
Principal and School Climate. Education, 126(2), 334-345.
Hall, C. J. (2013). Building a Culture of Growth and Evaluation in Schools. Independent
School, 73(1), 88-93.
Hanushek, E. A., & Rivkin, S. G. (2007). Pay, Working Conditions, and Teacher Quality.
Future of Children, 17(1), 69-86.
Hanushek, E. A., Kain, J. F., & Rivkin, S. G. (1999). Do higher salaries buy better
teachers? Working Paper No. 7082. Cambridge, MA: National Bureau of
Economic Research.
Harris, P. (2002). Survey of California teachers. Rochester, NY: Peter Harris
Research Group. harvard.edu.
Running head: BURNOUT IN TURNAROUND SCHOOLS
92
Houck, E. A. (2010). Teacher Quality and School Resegregation: A Resource Allocation
Case Study. Leadership & Policy in Schools, 9(1), 49-77.
doi:10.1080/15700760802630210
Imf.org (2013). IMF -- International Monetary Fund Home Page. [online] Retrieved
from: http://www.imf.org/external/index.htm [Accessed: 14 Jun 2013].
Ingersoll, R. M. (2001). Teacher turnover and teacher shortages: An organizational
analysis. American Educational Research Journal, 38(3), 499-534.
Institute for Strategic Leadership and Learning. (February 2012). Emerging practices in
rapid achievement gain schools: An analysis of 2010-2011 level 4 schools to
identify organizational and instructional practices that accelerate students’
academic achievement. Catonsville, MD: Author. Retrieved from
http://www.doe.mass.edu/boe/docs/2012-04/item2.docx.
Jianpeng S. (1997). Teacher Retention and Attrition in Public Schools: Evidence from
SASS ’91. Journal of Educational Research, vol. 91, pp. 81-88.
Kelly, S. (2004). An Event History Analysis of Teacher Attrition: Salary, Teacher
Tracking, and Socially Disadvantaged Schools. Journal Of Experimental
Education, 72(3), 195-220.
Klein, A. (2011). Turnaround-Program Data Seen as Promising, Though Preliminary.
Education Week, 30(15), 20-21.
Klein, A. (2012). School Improvement. Education Week, 31(21), 4.
Running head: BURNOUT IN TURNAROUND SCHOOLS
93
Klein, A. (2013). After Early Progress, SIG School Struggles to Improve. Education
Week, 32(35), 12-13.
Klein, A., & McNeil, M. (2012). SIG Program Sees Mixed Results In First Outing, Ed.
Dept. Finds. Education Week, 32(13), 28.
Kouzes, J. M., & Posner, B. Z. (1997). Leadership practices inventory [LPI]. (2nd
ed.). San Francisco: Jossey-Bass, Pfeiffer.
Krüger, M. L., Witziers, B., & Sleegers, P. (2007). The impact of school leadership on
school level factors: Validation of a causal model. School Effectiveness & School
Improvement, 18(1), 1-20. doi:10.1080/09243450600797638
Lambert, R. G., McCarthy, C., O'Donnell, M., & Wang, C. (2009). Measuring elementary
teacher stress and coping in the classroom: Validity evidence for the Classroom
Appraisal of Resources and Demands. Psychology in the Schools, 46(10), 973-
988. Retrieved from EBSCOhost.
Leech, D., & Fulton, C. (2008). Faculty Perceptions of Shared Decision Making and the
Principal’s Leadership Behaviors in Secondary Schools in a Large Urban
District.. Education, 128(4), 630-644.
Leithwood, K. (2010). Characteristics of school districts that are exceptionally effective
in closing the gap. Leadership and Policy in Schools, 9, 245–291.
Running head: BURNOUT IN TURNAROUND SCHOOLS
94
Loeb, S., Darling-Hammond, L., & Luczak, J. (2005). How Teaching Conditions Predict
Teacher Turnover in California Schools. Peabody Journal of Education
(0161956X), 80(3), 44-70. doi:10.1207/s15327930pje8003_4
Luk, A., Chan, B., Cheong, S., & Ko, S. (2010). An Exploration of the Burnout Situation
on Teachers in Two Schools in Macau. Social Indicators Research, 95(3), 489-
502. doi:10.1007/s11205-009-9533-7
Mackey, B., Pitcher, S., & Decman, J. (2006). The Influence of Four Elementary
Principals upon their Schools’ Reading Programs and Students’ Reading Scores.
Education, 127(1), 39-55.
Manwaring, R., & Sullivan, T. (2010). When School Improvement And Teacher
Seniority Collide. Education Week, 30(7), 32-27.
Marrs, L. (1983). A bandwagon without music: Preparing rural special educators.
Bellingham, WA: Western Washington University
Mascall, B., & Leung, J. (2012). District Resource Capacity and the Effects of
Educational Policy: The Case of Primary Class Size Reduction in Ontario.
Leadership & Policy In Schools, 11(3), 311-324.
doi:10.1080/15700763.2012.692428
Maslach, C., & Jackson, S. E. (1981). The measurement of experienced burnout. Journal
of Occupational Behavior, 2, 99–113.
Running head: BURNOUT IN TURNAROUND SCHOOLS
95
McCarthy, C. J., Lambert, R. C., O'Donnell, M., & Melendres, L. T. (2009). The Relation
of Elementary Teachers' Experience, Stress, and Coping Resources to Burnout
Symptoms. Elementary School Journal, 109(3), 282-300.
McNeil, M. (2009). Tight Leash Likely On Turnaround Aid. Education Week, 29(2), 1-
21.
Mikkelsen, V. P. & Joyner, W. (1982). Organizational climate of elementary schools and
reading achievement of sixth grade pupils. Reading Improvement, 19,67-73.
Monk, D. H. (2007). Recruiting and Retaining High-Quality Teachers in Rural Areas.
Future Of Children, 17(1), 155-174.
National Commission on Teaching and America’s Future. (2003). No dream denied: A
pledge to America’s children. Washington, DC: Author. Available from
www.nctaf.org No Child Left Behind Adequate Yearly Progress Report for
Kentucky (2011). www.education.ky.gov
No Child Left Behind Act of 2001, Pub. L. No. 107-110, Stat. 1425 (2002)
No Child Left Behind (NCLB) Interpretive Guide (2011). Retrieved June 7, 2012
O'connor, E. P., & Freeman, E. (2012). District-level considerations in supporting and
sustaining RtI implementation. Psychology In The Schools, 49(3), 297-310.
doi:10.1002/pits.21598
Ozan, M. (2009). A Study on Primary School Teacher Burnout Levels: The Northern
Cyprus Case. Education, 129(4), 692-703.
Running head: BURNOUT IN TURNAROUND SCHOOLS
96
Pas, E. T., Bradshaw, C. P., Hershfeldt, P. A., & Leaf, P. J. (2010). A Multilevel
Exploration of the Influence of Teacher Efficacy and Burnout on Response to
Student Problem Behavior and School-Based Service Use. School Psychology
Quarterly, 25(1), 13-27. doi:10.1037/a0018576
Patchen, M. (1970). Participation, achievement, and involvement on the job.
Englewood Cliffs, NJ: Prentice-Hall.
Prather-Jones, B. (2011). How School Administrators Influence the Retention of
Teachers of Students with Emotional and Behavioral Disorders. Clearing House,
84(1), 1-8. doi:10.1080/00098655.2010.489387
Price, H. E. (2012). Principal–Teacher Interactions: How Affective Relationships Shape
Principal and Teacher Attitudes. Educational Administration Quarterly, 48(1),
39-85. doi:10.1177/0013161X11417126
Rafaeli, A. D. (1985). Quality circles and employee attitudes. Personnel Psychology,
38, 603-615.
Reyes, P., & Hoyle, D. (1992). Teachers' Satisfaction with Principals' Communication.
Journal of Educational Research, 85(3), 163.
Schaffer, E., Reynolds, D., & Stringfield, S. (2012). Sustaining Turnaround at the School
and District Levels: The High Reliability Schools Project at Sandfields Secondary
School. Journal of Education For Students Placed At Risk, 17(1/2), 108-127.
doi:10.1080/10824669.2012.637188
Running head: BURNOUT IN TURNAROUND SCHOOLS
97
Schmoker, M. (2011). Turnaround: A Tale of Two Schools. Phi Delta Kappan, 93(2), 70-
71.
Sergiovanni, T. J. (1995). Small schools, great expectations. Educational Leadership,
53(3), 48.
Shurtleff, Nathaniel B. (1853-1854). Records of the Governor and Company of
Massachusetts Bay in New England. Vol. II, 6-7.
Skaalvik, E. M., & Skaalvik, S. (2007). Dimensions of Teacher Self-Efficacy and
Relations with Strain Factors, Perceived Collective Teacher Efficacy, and Teacher
Burnout. Journal of Educational Psychology, 99(3), 611-625. doi:10.1037/0022-
0663.99.3.611
Smethem, L., & Adey, K. (2005). Some effects of statutory induction on the professional
development of newly qualified teachers: a comparative study of pre‐ and post‐
induction experiences. Journal of Education For Teaching, 31(3), 187-200.
doi:10.1080/02607470500169014
Spiro, J. D. (2013). Effective principals in action. Phi Delta Kappan, 94(8), 27-31.
Stoeber, J., & Rennert, D. (2008). Perfectionism in school teachers: Relations with stress
appraisals, coping styles, and burnout. Anxiety, Stress & Coping, 21(1), 37-53.
doi:10.1080/10615800701742461
Running head: BURNOUT IN TURNAROUND SCHOOLS
98
Stotko, E. M., Ingram, R., & Beaty-O'Ferrall, M. (2007). Promising Strategies for
Attracting and Retaining Successful Urban Teachers. Urban Education, 42(1), 30-
51.
Talmor, R., Reiter, S., & Feigin, N. (2005). Factors relating to regular education teacher
burnout in inclusive education. European Journal of Special Needs Education,
20(2), 215-229. doi:10.1080/08856250500055735
Thielman, J. (2012). School Turnaround: Cristo Rey Boston High School Case Study.
Catholic Education: A Journal Of Inquiry & Practice, 16(1), 115-147.
Tice, T. N. (1991). Why Teachers Quit. Education Digest, 56(8), 37-38. Retrieved from
EBSCOhost.
Tickle, B. R., Chang, M., & Kim, S. (2011). Administrative support and its mediating
effect on US public school teachers. Teaching & Teacher Education, 27(2), 342-
349. doi:10.1016/j.tate.2010.09.002
Timms, C., Graham, D., & Caltabiano, M. (2006). Gender Implication of Perceptions of
Trustworthiness of School Administration and Teacher Burnout/Job Stress.
Australian Journal of Social Issues, 41(3), 343-358.
Tomic, W., & Tomic, E. (2008). Existential fulfillment and burnout among principals and
teachers. Journal of Beliefs & Values: Studies in Religion & Education, 29(1), 11-
27. doi:10.1080/13617670801928191
Running head: BURNOUT IN TURNAROUND SCHOOLS
99
Tye, B., & O'Brien, L. (2002). Why Are Experienced Teachers Leaving the Profession?
Phi Delta Kappan, 84(1), 24. Retrieved from EBSCOhost.
Tyler, C. E. (2008). Recruiting teachers for hard-to-fill positions. Leadership, 37(4), 37-
38
US Department of Education. (2013). [online] Retrieved from:
http://www2.ed.gov/programs/statestabilization/schooldata.pdf [Accessed: 2 Dec
2013].
Walker, J., & Slear, S. (2011). The Impact of Principal Leadership Behaviors on the
Efficacy of New and Experienced Middle School Teachers. NASSP
Bulletin, 95(1), 46-64.
Waters, J. T., & Marzano, R. J. (2006). School district leadership that works: The effect
of superintendent leadership on student achievement. A Working Paper. Denver,
CO: Mid- continent Research for Education and Learning (McREL).
Weisberg, J., & Sagie, A. (1999). Teachers' Physical, Mental, and Emotional Burnout:
Impact on Intention to Quit. Journal of Psychology, 133(3), 333. Retrieved from
EBSCOhost.
Wildy, H., & Louden, W. (2000). School Restructuring and the Dilemmas of Principals'
Work. Educational Management & Administration, 28(2), 173.
Witte, S., Beemer, J., & Arjona, C. (2010). "Re-Vision”: Our Journey in Developing a
Secondary Literacy Plan. American Secondary Education, 39(1), 15-26.
Running head: BURNOUT IN TURNAROUND SCHOOLS
100
Wolf, I & Janssens (2007). Effects and side effects of inspections and accountability in
education: an overview of empirical studies. Oxford Review of Education, 33(3),
379-396.
Zehr, M. (2011). Big Charters Not Vying for 'Restarts'. (Cover story). Education Week,
30(22), 1-15.
Zhang, Y., & Yu, Y. (2007). Causes for Burnout among Secondary and Elementary
School Teachers and Preventive Strategies. Chinese Education & Society, 40(5),
78-85. doi:10.2753/CED 1061-1932400508

Running head: BURNOUT IN TURNAROUND SCHOOLS
101
Appendix
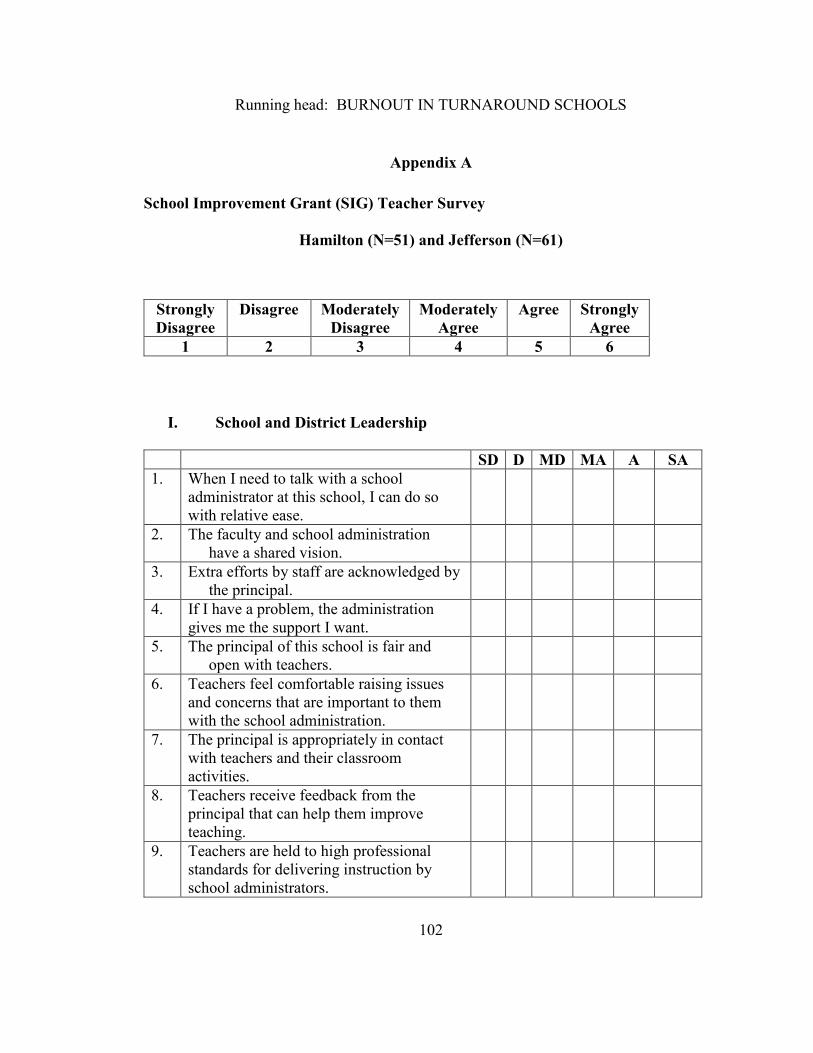
Running head: BURNOUT IN TURNAROUND SCHOOLS
102
Appendix A
School Improvement Grant (SIG) Teacher Survey
Hamilton (N=51) and Jefferson (N=61)
Strongly
Disagree
Disagree Moderately
Disagree
Moderately
Agree
Agree
Strongly
Agree
1 2 3 4 5 6
I. School and District Leadership
SD D MD MA A SA
1. When I need to talk with a school
administrator at this school, I can do so
with relative ease.
2. The faculty and school administration
have a shared vision.
3. Extra efforts by staff are acknowledged by
the principal.
4. If I have a problem, the administration
gives me the support I want.
5. The principal of this school is fair and
open with teachers.
6. Teachers feel comfortable raising issues
and concerns that are important to them
with the school administration.
7. The principal is appropriately in contact
with teachers and their classroom
activities.
8. Teachers receive feedback from the
principal that can help them improve
teaching.
9. Teachers are held to high professional
standards for delivering instruction by
school administrators.
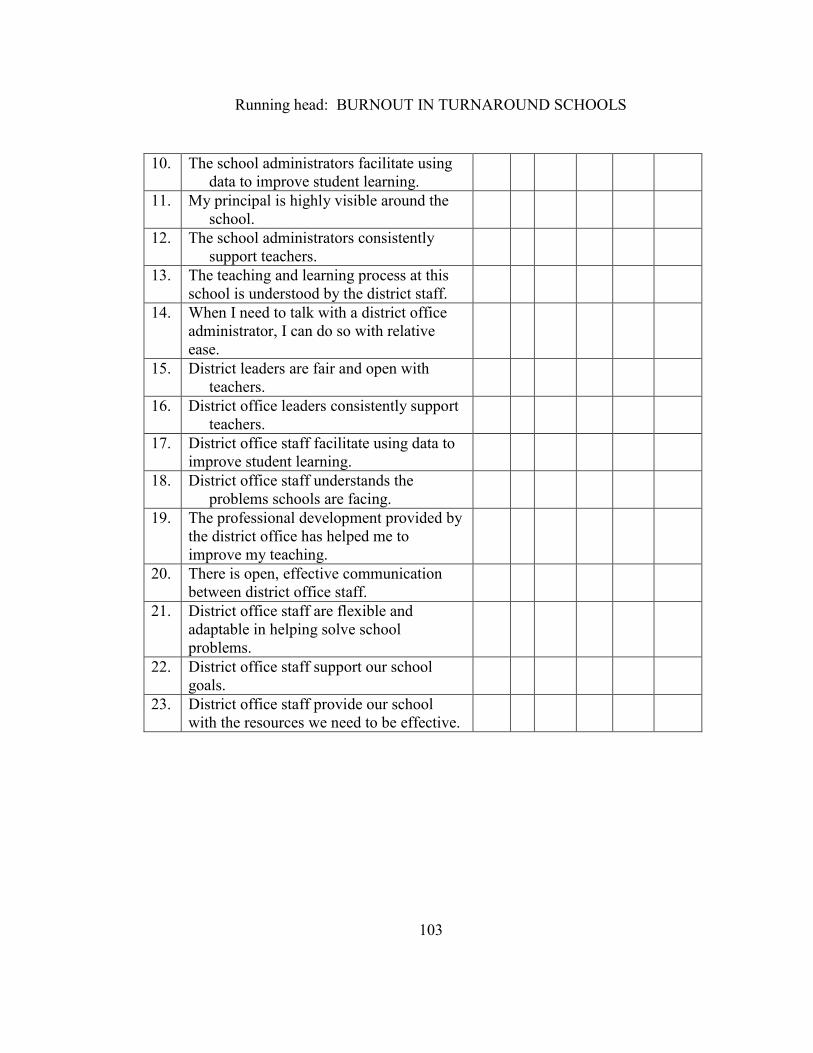
Running head: BURNOUT IN TURNAROUND SCHOOLS
103
10. The school administrators facilitate using
data to improve student learning.
11. My principal is highly visible around the
school.
12. The school administrators consistently
support teachers.
13. The teaching and learning process at this
school is understood by the district staff.
14. When I need to talk with a district office
administrator, I can do so with relative
ease.
15. District leaders are fair and open with
teachers.
16. District office leaders consistently support
teachers.
17. District office staff facilitate using data to
improve student learning.
18. District office staff understands the
problems schools are facing.
19. The professional development provided by
the district office has helped me to
improve my teaching.
20. There is open, effective communication
between district office staff.
21. District office staff are flexible and
adaptable in helping solve school
problems.
22. District office staff support our school
goals.
23. District office staff provide our school
with the resources we need to be effective.
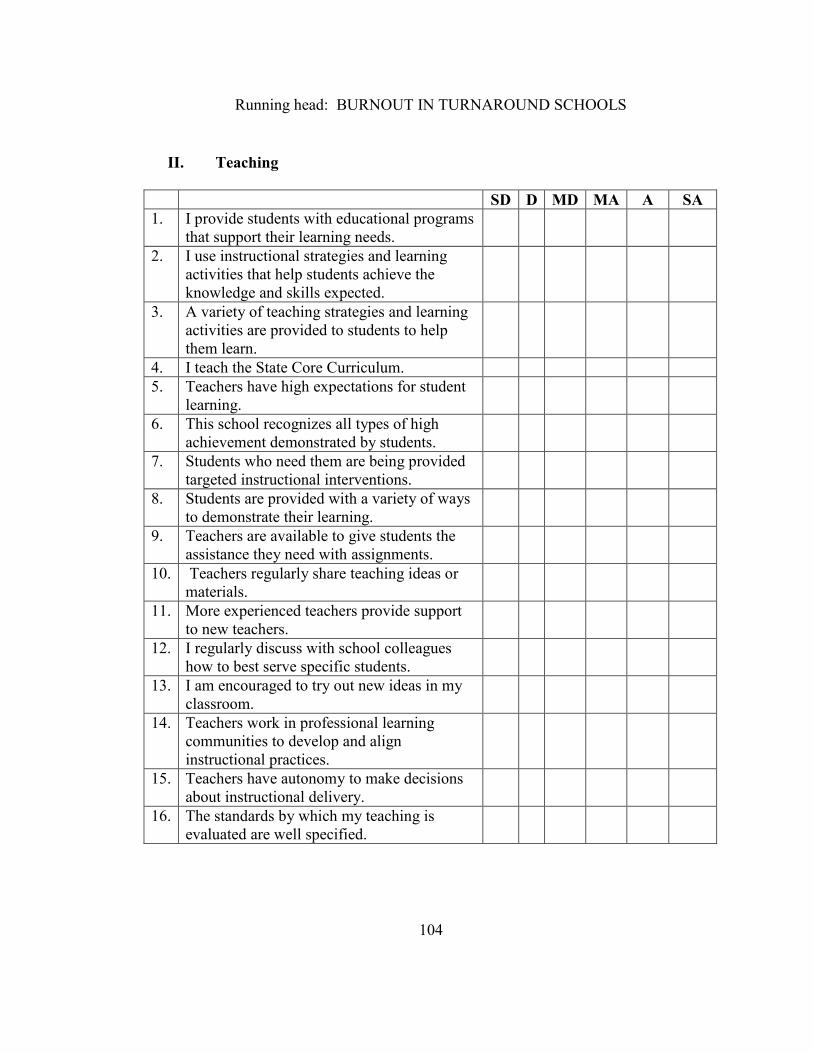
Running head: BURNOUT IN TURNAROUND SCHOOLS
104
II. Teaching
SD D MD MA A SA
1. I provide students with educational programs
that support their learning needs.
2. I use instructional strategies and learning
activities that help students achieve the
knowledge and skills expected.
3. A variety of teaching strategies and learning
activities are provided to students to help
them learn.
4. I teach the State Core Curriculum.
5. Teachers have high expectations for student
learning.
6. This school recognizes all types of high
achievement demonstrated by students.
7. Students who need them are being provided
targeted instructional interventions.
8. Students are provided with a variety of ways
to demonstrate their learning.
9. Teachers are available to give students the
assistance they need with assignments.
10. Teachers regularly share teaching ideas or
materials.
11. More experienced teachers provide support
to new teachers.
12. I regularly discuss with school colleagues
how to best serve specific students.
13. I am encouraged to try out new ideas in my
classroom.
14. Teachers work in professional learning
communities to develop and align
instructional practices.
15. Teachers have autonomy to make decisions
about instructional delivery.
16. The standards by which my teaching is
evaluated are well specified.
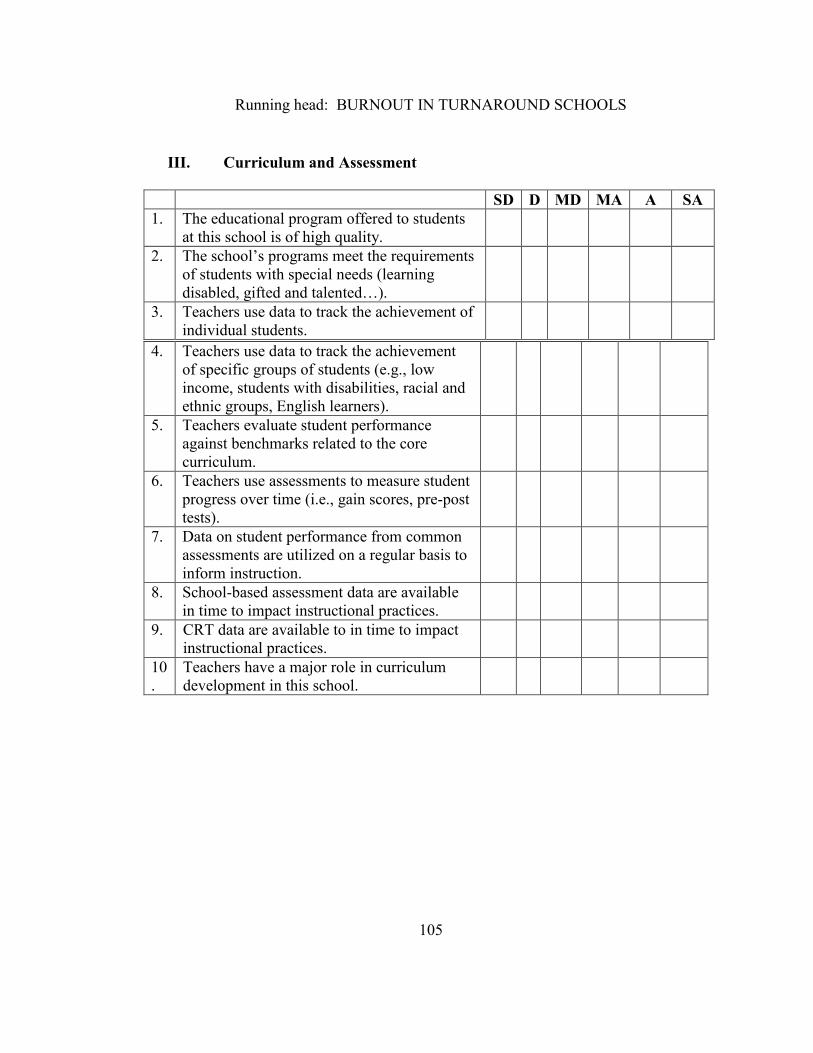
Running head: BURNOUT IN TURNAROUND SCHOOLS
105
III. Curriculum and Assessment
SD D MD MA A SA
1. The educational program offered to students
at this school is of high quality.
2. The school’s programs meet the requirements
of students with special needs (learning
disabled, gifted and talented…).
3. Teachers use data to track the achievement of
individual students.
4. Teachers use data to track the achievement
of specific groups of students (e.g., low
income, students with disabilities, racial and
ethnic groups, English learners).
5. Teachers evaluate student performance
against benchmarks related to the core
curriculum.
6. Teachers use assessments to measure student
progress over time (i.e., gain scores, pre-post
tests).
7. Data on student performance from common
assessments are utilized on a regular basis to
inform instruction.
8. School-based assessment data are available
in time to impact instructional practices.
9. CRT data are available to in time to impact
instructional practices.
10
.
Teachers have a major role in curriculum
development in this school.
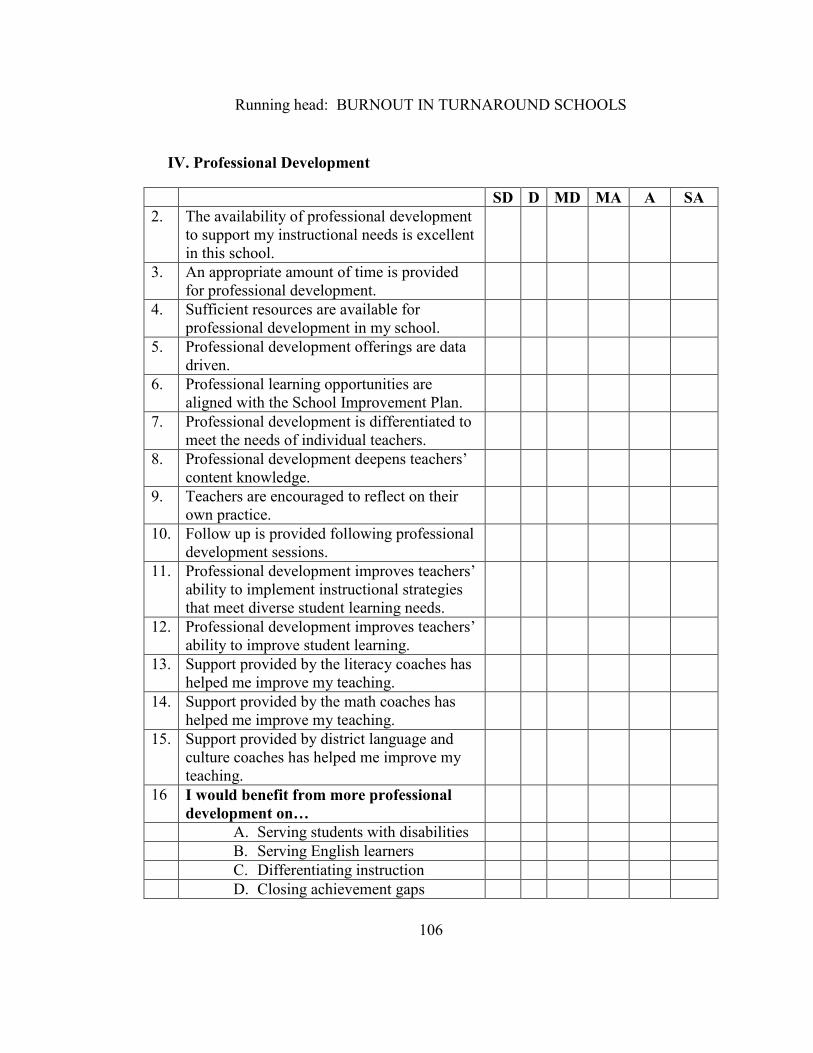
Running head: BURNOUT IN TURNAROUND SCHOOLS
106
IV. Professional Development
SD D MD MA A SA
2. The availability of professional development
to support my instructional needs is excellent
in this school.
3. An appropriate amount of time is provided
for professional development.
4. Sufficient resources are available for
professional development in my school.
5. Professional development offerings are data
driven.
6. Professional learning opportunities are
aligned with the School Improvement Plan.
7. Professional development is differentiated to
meet the needs of individual teachers.
8. Professional development deepens teachers’
content knowledge.
9. Teachers are encouraged to reflect on their
own practice.
10. Follow up is provided following professional
development sessions.
11. Professional development improves teachers’
ability to implement instructional strategies
that meet diverse student learning needs.
12. Professional development improves teachers’
ability to improve student learning.
13. Support provided by the literacy coaches has
helped me improve my teaching.
14. Support provided by the math coaches has
helped me improve my teaching.
15. Support provided by district language and
culture coaches has helped me improve my
teaching.
16 I would benefit from more professional
development on…
A. Serving students with disabilities
B. Serving English learners
C. Differentiating instruction
D. Closing achievement gaps
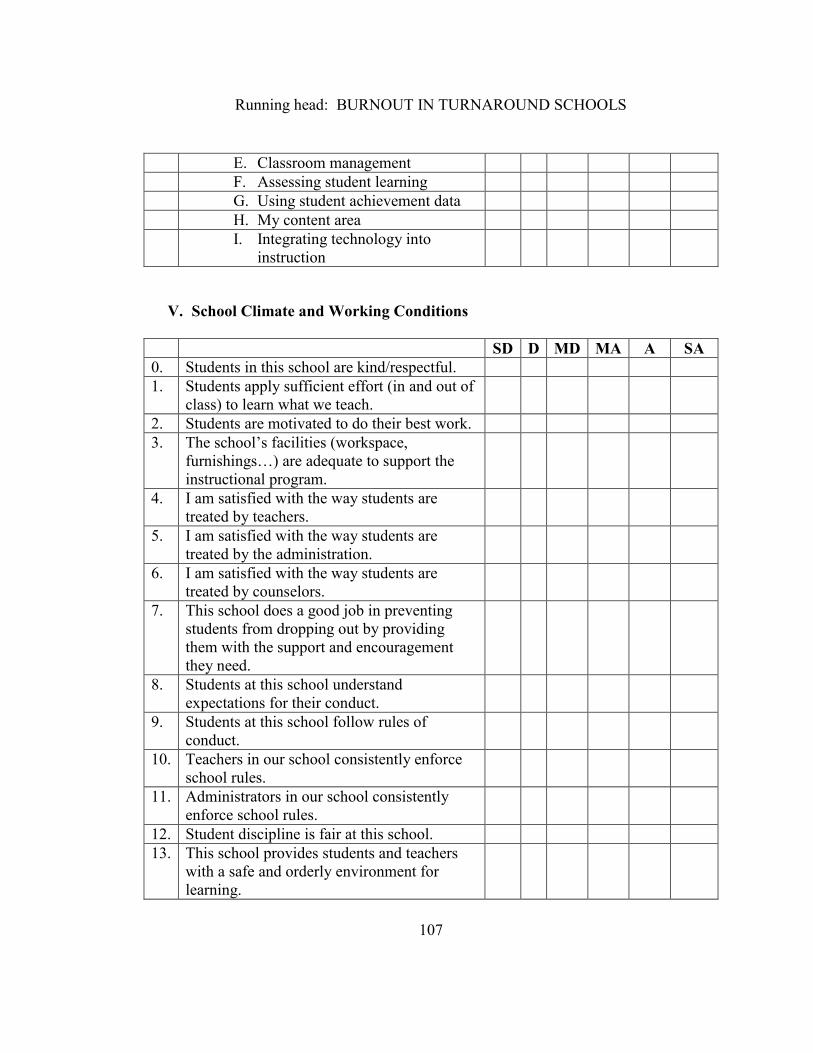
Running head: BURNOUT IN TURNAROUND SCHOOLS
107
E. Classroom management
F. Assessing student learning
G. Using student achievement data
H. My content area
I. Integrating technology into
instruction
V. School Climate and Working Conditions
SD D MD MA A SA
0. Students in this school are kind/respectful.
1. Students apply sufficient effort (in and out of
class) to learn what we teach.
2. Students are motivated to do their best work.
3. The school’s facilities (workspace,
furnishings…) are adequate to support the
instructional program.
4. I am satisfied with the way students are
treated by teachers.
5. I am satisfied with the way students are
treated by the administration.
6. I am satisfied with the way students are
treated by counselors.
7. This school does a good job in preventing
students from dropping out by providing
them with the support and encouragement
they need.
8. Students at this school understand
expectations for their conduct.
9. Students at this school follow rules of
conduct.
10. Teachers in our school consistently enforce
school rules.
11. Administrators in our school consistently
enforce school rules.
12. Student discipline is fair at this school.
13. This school provides students and teachers
with a safe and orderly environment for
learning.
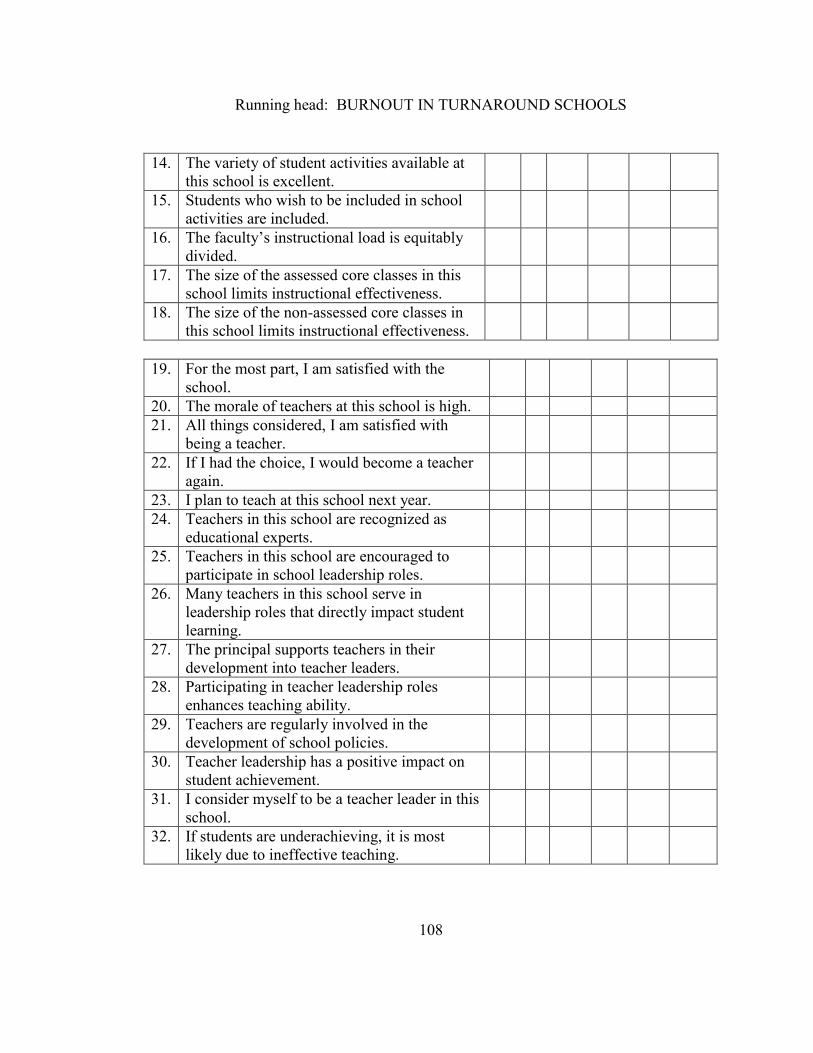
Running head: BURNOUT IN TURNAROUND SCHOOLS
108
14. The variety of student activities available at
this school is excellent.
15. Students who wish to be included in school
activities are included.
16. The faculty’s instructional load is equitably
divided.
17. The size of the assessed core classes in this
school limits instructional effectiveness.
18. The size of the non-assessed core classes in
this school limits instructional effectiveness.
19. For the most part, I am satisfied with the
school.
20. The morale of teachers at this school is high.
21. All things considered, I am satisfied with
being a teacher.
22. If I had the choice, I would become a teacher
again.
23. I plan to teach at this school next year.
24. Teachers in this school are recognized as
educational experts.
25. Teachers in this school are encouraged to
participate in school leadership roles.
26. Many teachers in this school serve in
leadership roles that directly impact student
learning.
27. The principal supports teachers in their
development into teacher leaders.
28. Participating in teacher leadership roles
enhances teaching ability.
29. Teachers are regularly involved in the
development of school policies.
30. Teacher leadership has a positive impact on
student achievement.
31. I consider myself to be a teacher leader in this
school.
32. If students are underachieving, it is most
likely due to ineffective teaching.
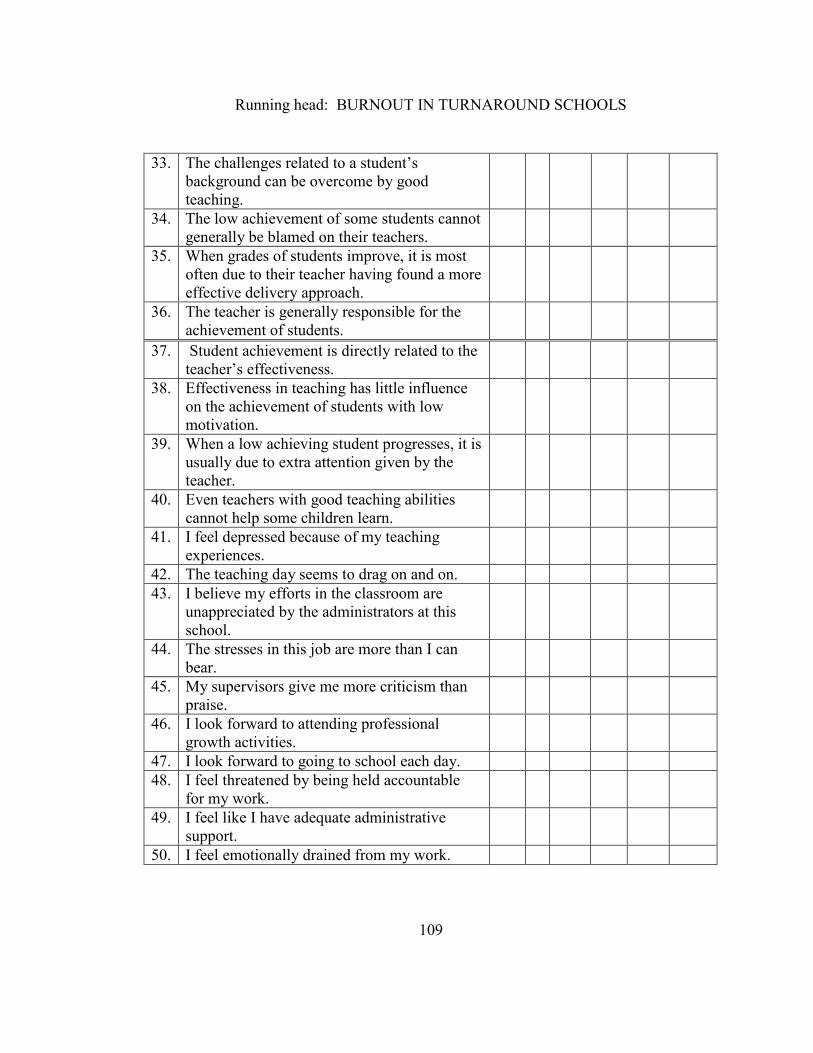
Running head: BURNOUT IN TURNAROUND SCHOOLS
109
33. The challenges related to a student’s
background can be overcome by good
teaching.
34. The low achievement of some students cannot
generally be blamed on their teachers.
35. When grades of students improve, it is most
often due to their teacher having found a more
effective delivery approach.
36. The teacher is generally responsible for the
achievement of students.
37. Student achievement is directly related to the
teacher’s effectiveness.
38. Effectiveness in teaching has little influence
on the achievement of students with low
motivation.
39. When a low achieving student progresses, it is
usually due to extra attention given by the
teacher.
40. Even teachers with good teaching abilities
cannot help some children learn.
41. I feel depressed because of my teaching
experiences.
42. The teaching day seems to drag on and on.
43. I believe my efforts in the classroom are
unappreciated by the administrators at this
school.
44. The stresses in this job are more than I can
bear.
45. My supervisors give me more criticism than
praise.
46. I look forward to attending professional
growth activities.
47. I look forward to going to school each day.
48. I feel threatened by being held accountable
for my work.
49. I feel like I have adequate administrative
support.
50. I feel emotionally drained from my work.
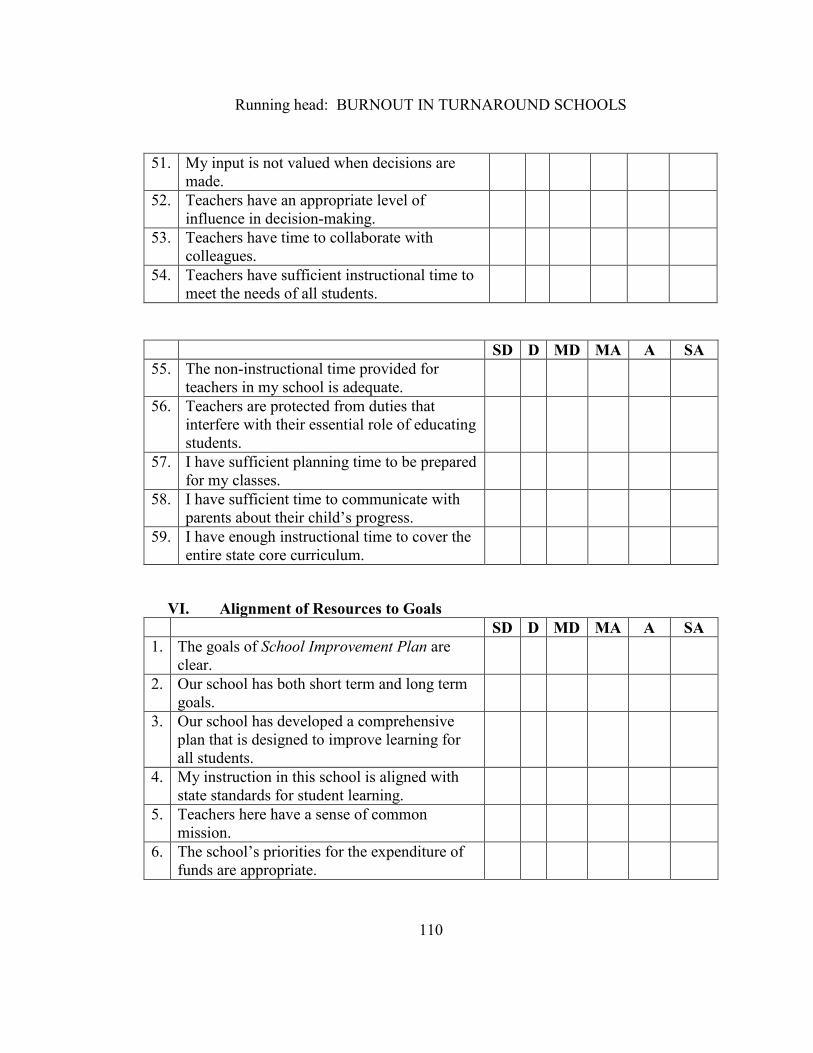
Running head: BURNOUT IN TURNAROUND SCHOOLS
110
SD D MD MA A SA
55. The non-instructional time provided for
teachers in my school is adequate.
56. Teachers are protected from duties that
interfere with their essential role of educating
students.
57. I have sufficient planning time to be prepared
for my classes.
58. I have sufficient time to communicate with
parents about their child’s progress.
59. I have enough instructional time to cover the
entire state core curriculum.
VI. Alignment of Resources to Goals
SD D MD MA A SA
1. The goals of School Improvement Plan are
clear.
2. Our school has both short term and long term
goals.
3. Our school has developed a comprehensive
plan that is designed to improve learning for
all students.
4. My instruction in this school is aligned with
state standards for student learning.
5. Teachers here have a sense of common
mission.
6. The school’s priorities for the expenditure of
funds are appropriate.
51. My input is not valued when decisions are
made.
52. Teachers have an appropriate level of
influence in decision-making.
53. Teachers have time to collaborate with
colleagues.
54. Teachers have sufficient instructional time to
meet the needs of all students.
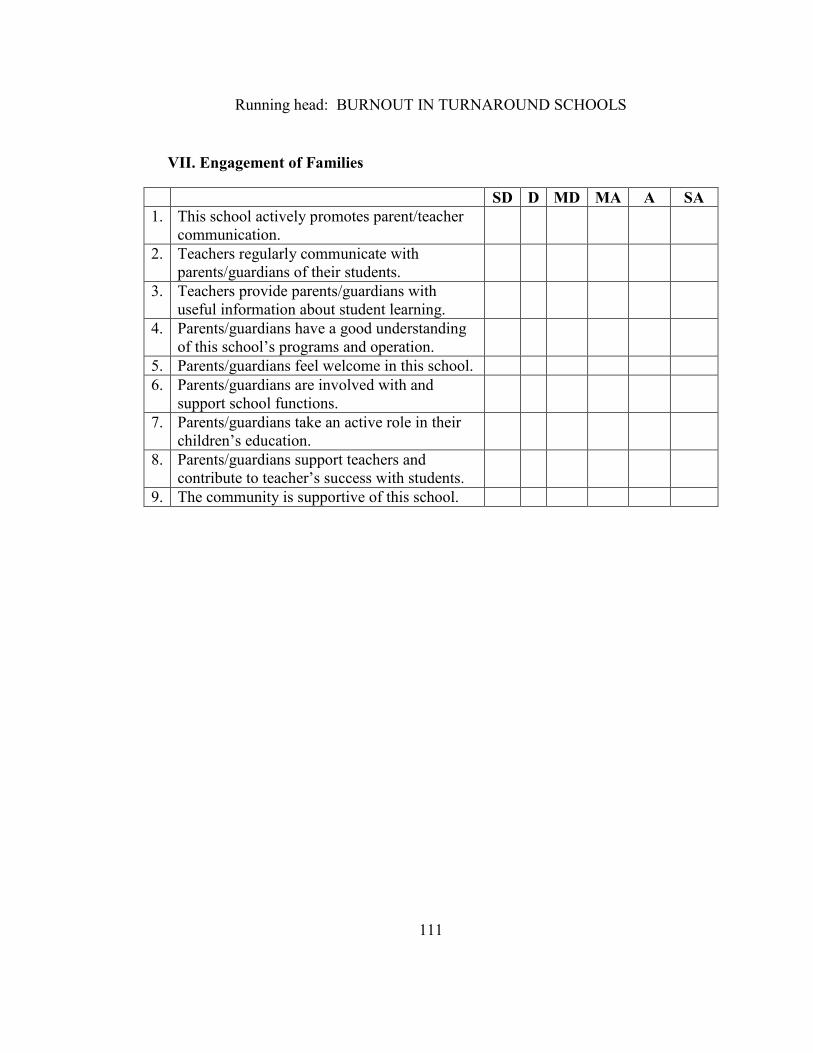
Running head: BURNOUT IN TURNAROUND SCHOOLS
111
VII. Engagement of Families
SD D MD MA A SA
1. This school actively promotes parent/teacher
communication.
2. Teachers regularly communicate with
parents/guardians of their students.
3. Teachers provide parents/guardians with
useful information about student learning.
4. Parents/guardians have a good understanding
of this school’s programs and operation.
5. Parents/guardians feel welcome in this school.
6. Parents/guardians are involved with and
support school functions.
7. Parents/guardians take an active role in their
children’s education.
8. Parents/guardians support teachers and
contribute to teacher’s success with students.
9. The community is supportive of this school.
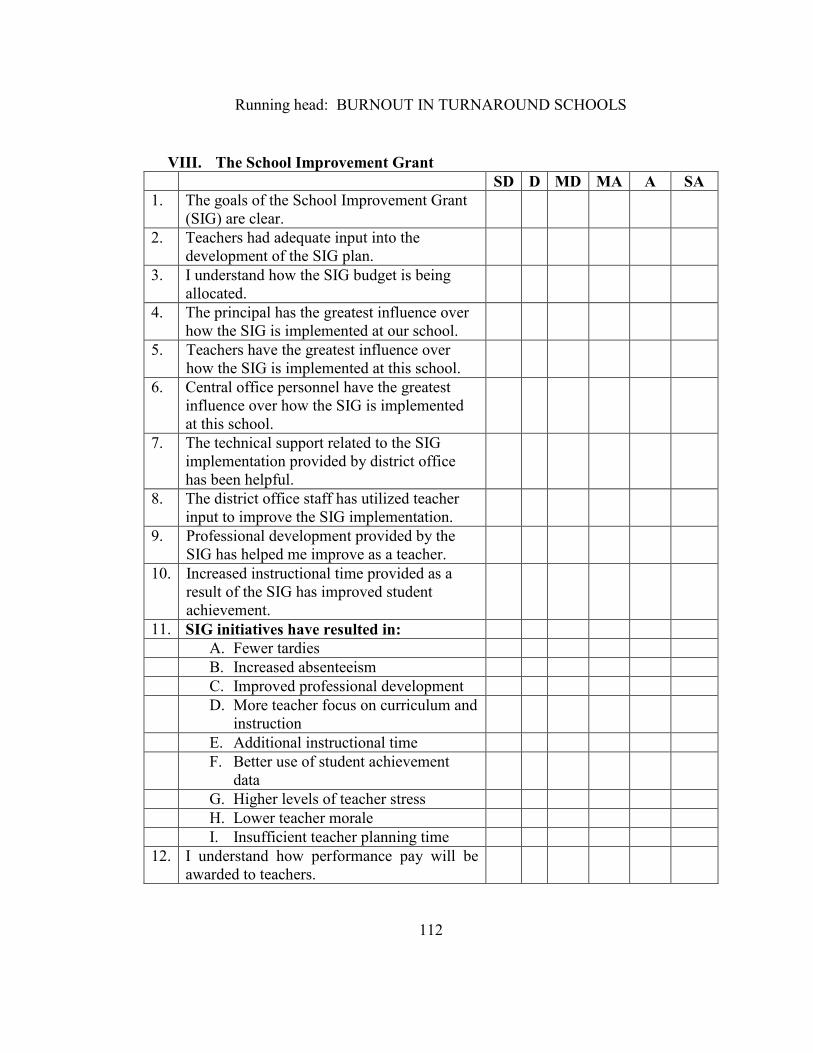
Running head: BURNOUT IN TURNAROUND SCHOOLS
112
VIII. The School Improvement Grant
SD D MD MA A SA
1. The goals of the School Improvement Grant
(SIG) are clear.
2. Teachers had adequate input into the
development of the SIG plan.
3. I understand how the SIG budget is being
allocated.
4. The principal has the greatest influence over
how the SIG is implemented at our school.
5. Teachers have the greatest influence over
how the SIG is implemented at this school.
6. Central office personnel have the greatest
influence over how the SIG is implemented
at this school.
7. The technical support related to the SIG
implementation provided by district office
has been helpful.
8. The district office staff has utilized teacher
input to improve the SIG implementation.
9. Professional development provided by the
SIG has helped me improve as a teacher.
10. Increased instructional time provided as a
result of the SIG has improved student
achievement.
11. SIG initiatives have resulted in:
A. Fewer tardies
B. Increased absenteeism
C. Improved professional development
D. More teacher focus on curriculum and
instruction
E. Additional instructional time
F. Better use of student achievement
data
G. Higher levels of teacher stress
H. Lower teacher morale
I. Insufficient teacher planning time
12. I understand how performance pay will be
awarded to teachers.
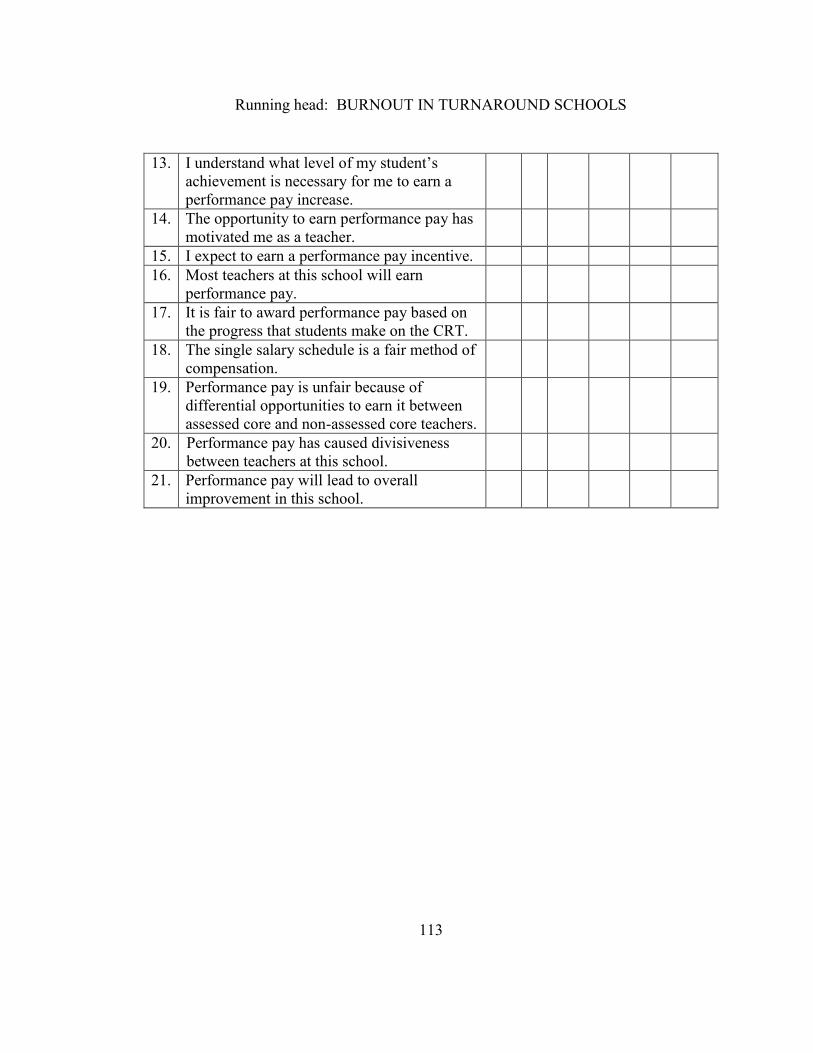
Running head: BURNOUT IN TURNAROUND SCHOOLS
113
13. I understand what level of my student’s
achievement is necessary for me to earn a
performance pay increase.
14. The opportunity to earn performance pay has
motivated me as a teacher.
15. I expect to earn a performance pay incentive.
16. Most teachers at this school will earn
performance pay.
17. It is fair to award performance pay based on
the progress that students make on the CRT.
18. The single salary schedule is a fair method of
compensation.
19. Performance pay is unfair because of
differential opportunities to earn it between
assessed core and non-assessed core teachers.
20. Performance pay has caused divisiveness
between teachers at this school.
21. Performance pay will lead to overall
improvement in this school.