The relation between organizational climate and performance: the
66
Organizational Climate and Performance ‘The relation between organizational climate and performance and an investigation of the antecedents of organizational climate’ Graduation thesis Master of Science in Management of Technology by Lars Putter Delft, March 2010
Transcript of The relation between organizational climate and performance: the

Organizational Climate and Performance
‘The relation between organizational climate and performance and an
investigation of the antecedents of organizational climate’
Graduation thesis Master of Science in Management of Technology
by Lars Putter
Delft, March 2010

2
Author:
Lars Putter
Exam committee:
Chairman/ First Supervisor: Robert Verburg
Second Supervisor: Ronald Dekker
Delft University of Technology
faculty of Technology, Policy and Management
Section: Technology, Strategy and Entrepreneurship
Jaffalaan 5, 2528 BX Delft
Delft, March 2010
3
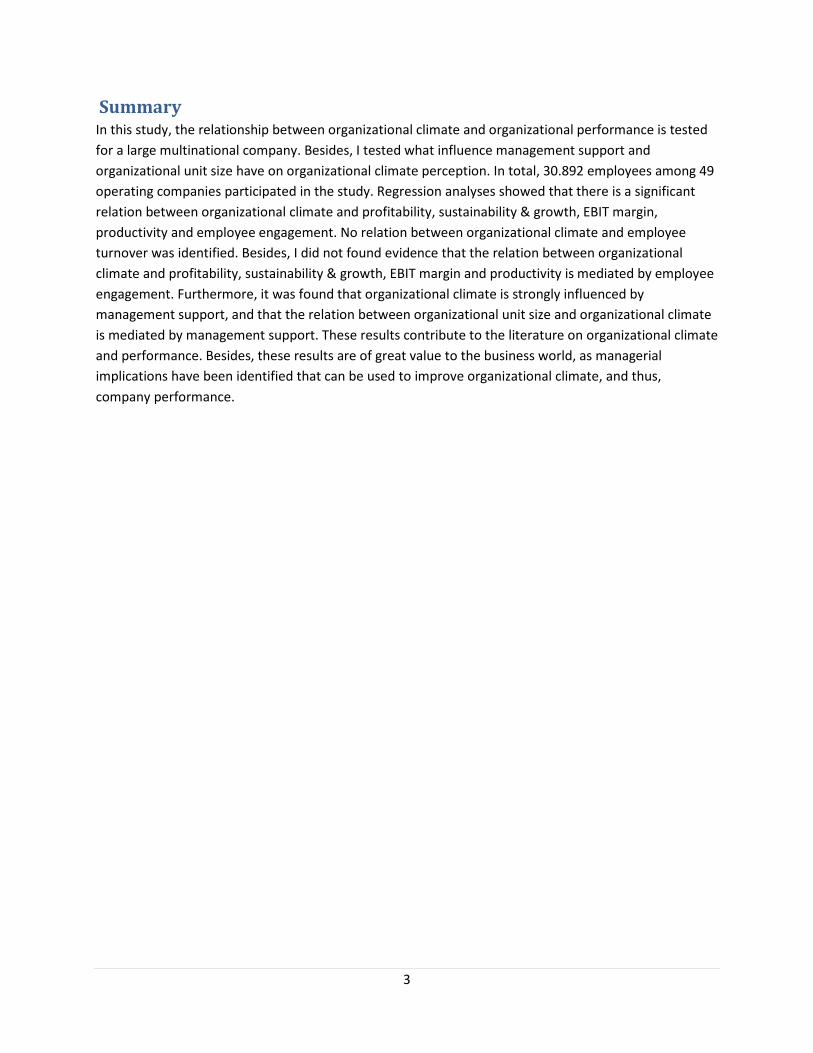
Summary
In this study, the relationship between organizational climate and organizational performance is tested
for a large multinational company. Besides, I tested what influence management support and
organizational unit size have on organizational climate perception. In total, 30.892 employees among 49
operating companies participated in the study. Regression analyses showed that there is a significant
relation between organizational climate and profitability, sustainability & growth, EBIT margin,
productivity and employee engagement. No relation between organizational climate and employee
turnover was identified. Besides, I did not found evidence that the relation between organizational
climate and profitability, sustainability & growth, EBIT margin and productivity is mediated by employee
engagement. Furthermore, it was found that organizational climate is strongly influenced by
management support, and that the relation between organizational unit size and organizational climate
is mediated by management support. These results contribute to the literature on organizational climate
and performance. Besides, these results are of great value to the business world, as managerial
implications have been identified that can be used to improve organizational climate, and thus,
company performance.

4
Contents
Summary .......................................................................................................................................................3
List of tables ..................................................................................................................................................6
List of Figures ................................................................................................................................................7
1. Introduction ..........................................................................................................................................8
2. Theoretical background ......................................................................................................................10
2.1 Organizational climate ......................................................................................................................10
2.2 Organizational climate: an outcome of human resource management...........................................11
2.3 Organizational climate and performance .........................................................................................13
2.4 Antecedents of organizational climate .............................................................................................16
2.5 Employee level and organizational climate perception....................................................................18
2.6 Theoretical framework .....................................................................................................................19
3. Methodology.......................................................................................................................................20
3.1 Sample and Procedure......................................................................................................................20
3.2 Employee survey...............................................................................................................................20
3.3 Organizational Climate measure.......................................................................................................21
3.4 Management support measure ........................................................................................................22
3.5 Organizational unit size measure......................................................................................................22
3.6 Performance measures.....................................................................................................................23
3.6.1. Financial performance measures..............................................................................................23
3.6.2 Operational performance measures..........................................................................................24
3.6.3 Employee engagement ..............................................................................................................24
3.7 Aggregation.......................................................................................................................................25
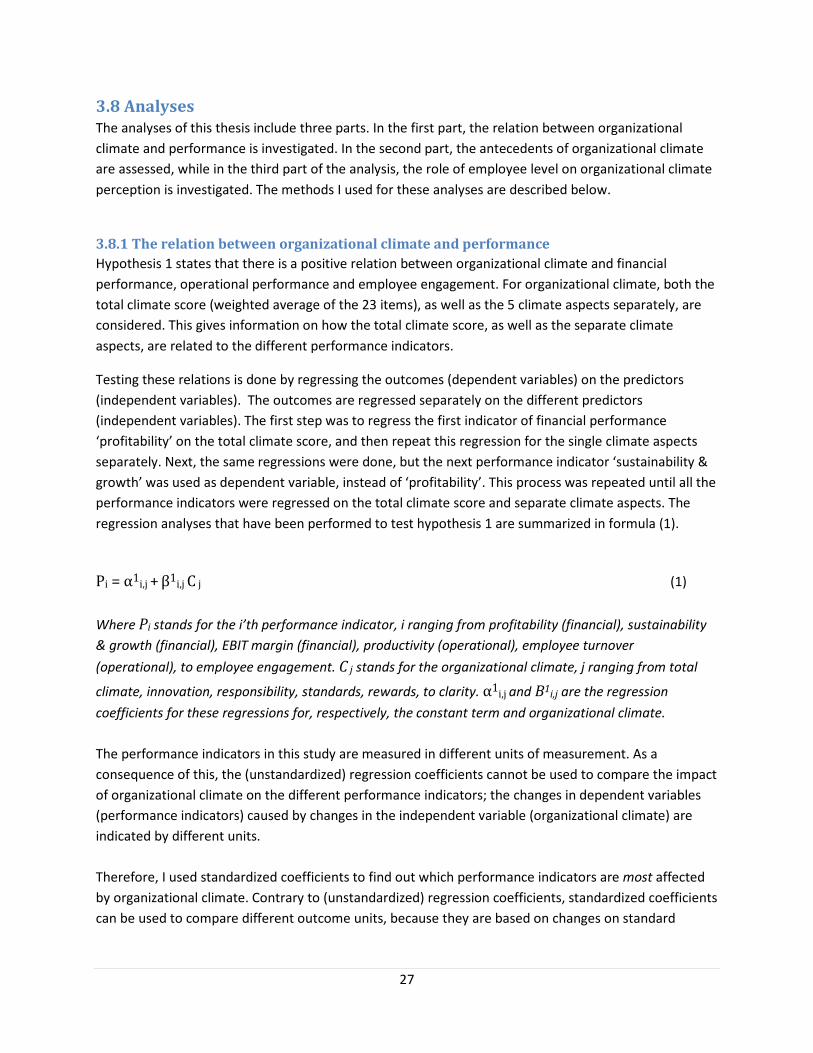
3.8 Analyses ............................................................................................................................................27
3.8.1 The relation between organizational climate and performance ...............................................27
3.8.2 Employee engagement: mediator between organizational climate and financial/operational
performance. ......................................................................................................................................30

5
3.8.3 The relation between organizational unit size, management support and organizational
climate.................................................................................................................................................31
3.8.4 Organizational climate perception of different employee levels ..............................................32
4. Results.....................................................................................................................................................33
4.1 Descriptive statistics, reliability and correlations of measures ........................................................33
4.2 The relation between organizational climate and performance ......................................................35
4.3 Employee engagement as mediator of the relation between organizational climate and
financial/operation performance. ..........................................................................................................41
4.4 The relation between organizational unit size, management support and organizational climate.43
4.5 The effect of hierarchical level on organizational climate perception .............................................48
5. Discussion............................................................................................................................................49
5.1 Strengths, limitations and conclusions .............................................................................................51
5.2 Recommendations ............................................................................................................................53
5.3 Managerial Implications....................................................................................................................53
References ..................................................................................................................................................56
Appendices..................................................................................................................................................60
Appendix 1: climate dimensions from the literature..............................................................................60
Appendix 2: items of the organizational climate aspects measures ......................................................63
A. Innovation..................................................................................................................................63
B. Responsibility.............................................................................................................................63
C. Standards...................................................................................................................................63
D. Rewards .....................................................................................................................................63
E. Clarity.........................................................................................................................................63
Appendix 3: items of the management support measure......................................................................65
F. Management Support ...............................................................................................................65
Appendix 4: items of the employee engagement measure....................................................................66
G. Employee Engagement..............................................................................................................66

6
List of tables
Table 1, climate aspects and total climate score........................................................................................21
Table 2, Organizational climate dimensions from literature ......................................................................22
Table 3, classification of organizational unit size........................................................................................22
Table 4, average interrater agreement for the measures. .........................................................................26
Table 5, ANOVA F ratios for the measures in this study.............................................................................26
Table 6, descriptive statistics and reliability for the measures of this study..............................................33
Table 7, correlations between the measures. ...........................................................................................34
Table 8, the relation between organizational climate and performance indicators. ................................36
Table 9, the (multiple) regression analyses from the performance indicators on organizational climate
and employee engagement. .......................................................................................................................41
Table 10, the relation between management support and organizational climate. .................................43
Table 11, the relation between organizational unit size and management support. ................................44
Table 12, the relation between organizational unit size, management support and organizational
climate.........................................................................................................................................................45
Table 13, mean scores on total climate score (and climate aspects) for top management, middle
management and non-management. ........................................................................................................48
Table 14. Definition of each of the eight dimensions of the Universe of psychological climate dimensions
(Koys & DeCotiis, 1991)...............................................................................................................................60
Table 15. The 11 scales to measure organizational climate by Pritchard and Karasick (1973) .................61
Table 16. The dimensions of organizational climate by Hay group/McBer (1995), definitions from Snow
(2002) (pp. 394) ..........................................................................................................................................62

7
List of Figures
Figure 1, theoretical framework .................................................................................................................19
Figure 2, path model to test mediation (Baron & Kenny, 1986) ................................................................30
Figure 3, the relation between total climate perception and several performance indicators. .............35
Figure 4, the relation between total climate (and the separate climate aspects) and profitability. ........37
Figure 5, the relation between total climate (and the separate climate aspects) and Sustainability &
Growth. ......................................................................................................................................................38
Figure 6, the relation between total climate (and the separate climate aspects) and EBIT margin. .........38
Figure 7, the relation between total climate (and the separate climate aspects) and Productivity. The
numbers in this figure are the unstandardized regression coefficients. ....................................................39
Figure 8, the relation between total climate (and the separate climate aspects) and Employee
engagement. ..............................................................................................................................................40
Figure 9, the (full) mediation of management support of the relation between organizational unit size
and total climate perception. .....................................................................................................................44
Figure 10, the (full) mediation of management support of the relation between organizational unit size
and clarity perception. ...............................................................................................................................45
Figure 11, the (partial) mediation of management support of the relation between organizational unit
size and innovation perception. .................................................................................................................46
Figure 12, the (partial) mediation of management support of the relation between organizational unit
size and rewards perception. .....................................................................................................................46
Figure 13, overview of the results of hypothesis 1, 2, 3,4 and 5 ................................................................47

8
1. Introduction Companies nowadays are more and more active in turbulent competitive environments, in which it has
become easier to imitate products, and it is necessary to adapt to changes fast. To survive within these
competitive environments, it is very important to generate sustainable competitive advantages.
Contrary to the industry-based strategic management perspective, which focuses on the external
environment of a company, the resource based strategic management perspective has a focus on the
internal environment of the company. In the resource based view of the firm, traditional sources of
competitive advantages, like natural resources and technology, are no longer sufficient; companies can
only develop sustained competitive advantage by building unique competencies (firm-wide capabilities).
Embracing this view on strategy, human resource strategies may be an important source of sustained
competitive advantage (Lado & Wilson, 1994). The human resource value creation process is complex,
making it a valuable, rare, inimitable, and non-substitutable source of competitive advantage (Barney,
1991).
Several studies examined the relationship between human resource management and organizational
performance (e.g. Becker & Gerhart, 1996; Huselid, 1995; Arthur, 1994). The common thought of these
studies is that human resource practices affect organizational performance. These studies focus on the
type of human resource practices, rather than on how these human resource practices are perceived by
organizational members. Wright and Nishii (2010), however, developed a model in which they state that
intended human resource (HR) practices of management are different from the perceived HR practices
by employees, and that these perceived HR practices have greater predictive value for organizational
performance than the intended HR practices. According to Bowen and Ostroff (2004) organizational
climate is the shared perception of what the organization is like in terms of practices, policies,
procedures, routines and rewards, based on shared perceptions of organizational members. Practices
and policies, procedures, and rewards are integrated aspects of the human resource management
practices of an organization. Organizational climate, thus, can be seen as a representation of the
perception of these human resource practices, making organizational climate of more predictive value
for organizational performance than only human resource practices themselves. In this thesis, therefore,
I consider organizational climate as the predictor for organizational outcomes.
Several authors have found links between organizational climate and organizational performance.
However, most of these studies only consider single aspects of organizational climate and outcomes
related to these aspects, for example, the relation between innovation climate and creativity (Pirola-
Merlo & Mann, 2004). However, to get insights in how the overall configuration of organizational
climate is related to overall performance of a company, additional research is required.
In this research project, organizational climate survey results of a large multinational company have
been used to test the relation between organizational climate and performance. The main research
question of this thesis is:
To what extend does organizational climate leads to organizational performance?

9
Management plays an important role on the organizational climate perceptions of organizational
members as they are responsible for the implementation of the human resource practices. Therefore, I
will also investigate the role management plays on organizational climate by examining how
management support perception of employees is related to their organizational climate perception.
There is some evidence that small organizations have a more positive organizational climate than large
organizations (Payne & Mansfield, 1974), however, how organizational unit size affects organizational
climate is less clear. Therefore, I will further investigate this relation by proposing management support
as mediator in the relation between organizational unit size and organizational climate.
This research project is valuable to the scientific community, because it further provides empirical
support on the relationship between organizational climate and performance. Besides, it also provides
valuable insights on the antecedents of organizational climate, a topic on which little information is yet
available. This study is also valuable to the business world, as a number of managerial implications are
discussed on how to create an organizational climate that leads to high performance.

10
2. Theoretical background
2.1 Organizational climate
Due to its multifaceted character a wide range of definitions is available for organizational climate.
Schneider and Reichers (1983) define organizational climate as a shared or summary perception that
people attach to particular features of the work setting. According to Watkin and Hubbard (2003)
organizational climate is ‘’how it feels to work in a particular environment and for a particular boss,
more precisely it is a measure of employees’ perception of those aspects of their environment that
directly impact how well they can do their jobs’’(pp. 380). Another, more elaborate, definition of
organizational climate is given by Bowen and Ostroff (2004):
‘’Organizational climate is a shared perception of what the organization is like in terms of practices,
policies, procedures, routines, and rewards- what is important and what behaviors are expected and
rewarded- and is based on shared perceptions among employees within formal organizational
units.‘’(pp.205)
In literature, organizational climate is conceptualized across different levels of analysis: individual, work,
and organization. In this thesis, I consider organizational climate as a construct that belongs to a group
of people (organization), rather than considering it as something that is assigned to an individual person.
Using this approach makes it possible to compare organizational climate with organizational outcomes
(instead of individual outcomes). As each organization has its own specific organizational climate and
organizational outcomes, different organizations can be compared to each other.
Organizational climate and organizational culture are closely related, but are certainly not the same.
Both deal with how individuals try to make sense of their environments, and are learned through
interaction among persons belonging to a certain group (Kuenzi & Schminke, 2009). However,
fundamental differences between these two phenomena exist. After an extensive research on both
climate and culture literature, Denison (1996) identified several differences between organizational
climate and culture. According to him, organizational culture refers to the underlying structure of an
organization, embedded in the values, beliefs, and assumptions of organizational members.
Organizational climate, on the other hand, is reflected in practices and procedures that are observable
at the surface of the organization. Organizational climate is emphasized to be temporary, subject to
direct control, and limited to aspects that are consciously perceived by members of an organization.
From a managerial point of view, therefore, organizational climate is a very interesting phenomenon. It
can be influenced relatively easily, and changes in organizational climate can be observed on a short
time span.

11
2.2 Organizational climate: an outcome of human resource management
Organizational success is largely dependent on the quality and effort of the people that work for the
organization. Flexible, productive and knowledgeable people within an organization are a source of
(sustainable) competitive advantage for companies. Top managers increasingly acknowledge that the
people within the organization make the difference by creating value for the organization (Verburg &
Den Hartog, 2006).
Human resource management concerns the management of people within organizations. Regardless of
the type of organization, all firms need to manage their workforce using appropriate policies and
practices. Policies and practices need to be coordinated with each other, as well as with the needs of the
organization. The latter is also known as strategic human resource management, and is based upon the
recognition that organizations can be more effective if they manage their human resources in such a
way that they deliver the right number of people with the appropriate behaviors, the necessary
competencies, and the right levels of motivation to the organization (Schuler & Jackson, 2007).
Human resource management involves the use of several policies and practices. Human resource
practices can be summarized into three specific groups: entry, performance, and exit practices (Verburg
& Den Hartog, 2006). Entry practices include practices that are aimed at the recruitment and selection
of new employees, performance practices at managing and developing employee performance, and exit
practices at managing the exit of employees.
Top and line management play a central role in human resource management (Verburg & Den Hartog,
2006). Top management uses human resource management as an integrated part of their business
strategy, translated in a human resource management strategy. Line management, on the other hand, is
responsible for managing the employment relations. Human resource professionals have an important
advisory role to line management supporting the management and helping to develop and distribute
human resource policies and practices. Line managers, however, recruit new employees, do the
performance appraisal, and are responsible for the development of the core employees, making them
the actual practitioners of human resource management.
Ideally, the HR strategy top management has in mind is transferred exactly as intended to the lower
employee levels, however, this is often not the case. Wright and Nishii (2010) developed a model to
represent the HR practices implementation process by making a distinction between intended HR
practices, actual HR practices and perceived HR practices. The intended HR practices are the outcomes
of the HR strategy developed by top management and intend to achieve employee reactions that are
necessary for organizational success. Middle management implements the intended HR practices. Often,
the intended practices are implemented in a different way as intended by top management or they are
not implemented at all. The practices that are actually implemented by middle management are the
actual HR practices. Actual HR practices are interpreted and perceived by employees, resulting in
perceived HR practices. Thus, top management is responsible for establishing the HR strategy of the
organization, while middle management interprets and distributes the HR strategy among the
organizational members using several HR practices.

12
Several studies examined the relationship between human resource management and organizational
performance (e.g. Becker & Gerhart 1996; Huselid, 1995; Arthur, 1994). The common thought of these
studies is that HR practices affect organizational performance. However, choosing the type of human
resource practices is only part of the total human resource management process. According to Wright
and Nishii (2010), not the human resource practices as intended by management will be determinative
for organizational outcomes, but the human resource practices as perceived by organizational members.
This is confirmed by Den Hartog, Boon and Verburg (2009) who found that perceived human resource
management mediates the relation between actual human resource management (what is
implemented) and performance. Thus, actual human resource management influences perceived
human resource management, and perceived HRM affects performance. According to the organizational
climate definition of Bowen and Ostroff (2004), organizational climate is ‘a shared perception of what
the organization is in terms of practices, policies, procedures, routines and rewards’. Practices and
policies, procedures, and rewards are integrated aspects of the human resource management practices
of the organization. Organizational climate, thus, is a representation of the employee perception of
these practices. This idea is supported by Rogg, Schmidt, Shull and Schmitt (2001) and Gelade and Ivery
(2003) who found the relationship between human resource practices and organizational outcomes is
mediated by organizational climate. Thus, rather than a direct relation between human resource
practices, their results indicate that human resource practices influence organizational climate, and that
organizational climate influences performance.
Management plays a crucial role on employee’s perception of organizational climate, as management is
responsible for implementing the human resource practices. Thus, management can create a desired
organizational climate using specific human resource practices, but employee perception of these
practices is crucial for realizing the organizational climate as intended. Therefore, I consider
organizational climate as predictor for organizational performance, rather than the human resource
practices themselves.

13
2.3 Organizational climate and performance
Several researchers have studied (and proved) the relation between organizational climate and
organizational performance. In the following part, I will give an overview of the available studies, and I
will discuss the differences between these studies in terms of climate approach and type of outcomes.
A large group of studies only considers certain aspects of organizational climate and outcomes that are
related to these aspects. For example, the relation between service climate and customer satisfaction
(Johnson, 1996; Dietz, Pugh & Wiley, 2004), the relation between safety climate and safety outcomes
(Hofmann & Mark, 2006; Wallace & Chen, 2006), the relation between risk taking climate and
knowledge creation in the unit (Smith, Collins, & Clark, 2005), and the relation between innovation
climate and creativity (Pirola-Merlo & Mann, 2004).
Others have studied the relation between certain aspects of organizational climate and more global
company outcomes. For example, Baer and Frese (2003) studied the relation between climates for
initiative and psychological safety, and company performance, at 47 mid-sized German companies. Their
results showed that climates for initiative and psychological safety are positively related to two
measures of firm performance: return on assets and firm goal achievement. Borucki and Burke (1999)
did a large research project among more than 30.000 employees at 594 stores of a large US retail
company. Their results indicated a positive relation between service climate, personnel service
performance, and store financial performance.
Studies on the relation between global climate (a broad range of climate aspects) and global
performance outcomes are limited. Patterson, Warr and West (2004) did a study on the mediating effect
of job satisfaction on the relationship between global organizational climate and productivity at 39
manufacturing companies containing 4503 employees in total. They found a positive significance
correlation between 5 of the 17 climate dimensions and company productivity. Another global climate
study has been performed by Gelade and Ivery (2003). In their study, conducted at the branch network
of a retail bank among 14.390 employees, they found global climate to be positively related to sales
against target, staff retention, clerical accuracy, customer satisfaction, and overall performance
(combination of previous indicators).
In this thesis, I conceptualize organizational climate as a global construct, covering a broad range of
climate aspects: innovation, responsibility, standards, rewards, and clarity. This provides a good
representation of the organizational climate within a company, and gives detailed information on how
specific climate aspects are related to company performance (and each other). Having this
representation of organizational climate will make it possible to implement actions that improve specific
climate aspects and global climate in the most effective way ( i.e. improvement in climate aspects of
innovation would be more effective than improvements in aspects of rewards, when innovation aspects
are stronger related to company performance then rewards aspects are). Furthermore, I use global
performance indicators that are crucial for business success: financial performance indicators,
operational performance indicators and employee engagement.

14
Hypothesis 1: Organizational climate is positively related to financial performance, operational
performance and employee engagement.
Relatively few is known on the underlying mechanisms that explain the relation between organizational
climate and these performance indicators. Patterson et al. (2004) suggest employee affect as mediator
between organizational climate and company performance, and found that the relation between
organizational climate and company performance is mediated by job satisfaction. Although they
highlight employee affect as mediator between organizational climate and organizational performance,
they do not explain why employee affect mediates the relation between organizational climate and
organizational performance.
The relation between organizational climate and organizational performance can be explained using the
Social Exchange Theory. This theory is based upon the assumption that social exchanges involve several
actions that create obligations, and that relationships evolve over time into trusting, loyal, and mutual
commitments (Cropanzano & Mitchell, 2005). These relationships can exist among two or several
persons, but also among persons and organizations. Reciprocity or repayment is the most common
exchange rule; the action of one party initiates a response of the other party that wants to ‘repay’ this
action. Employers can reward employees in two different ways using economic and socio-emotional
resources. Economic resources are tangible and often are financial rewards, socio-emotional resources
are intangible and address the social needs of employees. Employing these resources, employers can
create strong relationships with their employees, as employees have the tendency to repay these
rewards with ‘better’ work behavior and positive employee attitudes (Cropanzano & Mitchell, 2005).
Organizational climate is part of these socio-emotional and economic resources. Thus, when employers
establish an organizational climate that is perceived as positive by their employees, this will result in
better organizational performance and higher levels of commitment, motivation and job-satisfaction.
Employee engagement, which is an umbrella term for aspects of organizational commitment, job
satisfaction and job involvement, therefore, will also be affected positively by organizational climate.
Macey and Schneider (2008) propose that high states of employee engagement lead to discretionary
effort of employees. Discretionary effort on its turn will lead to better organizational performance
(Corporate Leadership Council, 2004). Thus, organizational climate does not only seem to have a direct
influence on financial and operational performance, but also indirectly via employee engagement.
Therefore, I hypothesize:
Hypothesis 2: The relationship between organizational climate and financial and operational
performance is partially mediated by employee engagement.
Employee engagement has rapidly become popular among human resource management practitioners.
The term has evolved from research on work attitudes (e.g. organizational climate research), and was
first introduced by (HR) consulting firms, in order to create a people oriented measure that could be
related to business performance. The speed of introduction of this term had a negative effect on the

15
theoretical foundation; the components of employee engagement have not been conceptualized very
well (Macey & Schneider).
Employee engagement both refers to psychological states and behaviors, as well as their antecedents.
Engagement as a psychological state represents some form of absorption, attachment, and enthusiasm
to the work and organization (Macey & Schneider, 2008), and is often an umbrella term for aspects of
organizational commitment, job satisfaction and job involvement. Behavioral aspects of engagement are
often referred to as discretionary effort: ‘’Employee willingness to go “above and beyond” the call of
duty, such as helping others with heavy workloads, volunteering for additional duties, and looking for
ways to perform the job more effectively’’ (Corporate Leadership Council, 2004). Antecedents concern
aspects that lead to the psychological states and behaviors of employee engagement, which often
include aspects very similar to organizational climate. For example, Towers Perrin (2005) measured
employee engagement by measuring rational and emotional engagement. Rational engagement
includes both behavioral aspects (i.e. discretionary effort), and aspects of what I would refer to as
organizational climate (i.e. the extent to which employees understand their role, and their unit’s role,
relative to the company objectives), while emotional engagement includes psychological state aspects
(e.g. pride, commitment, (job-) satisfaction). Harter, Hayes and Schmidt (2002) refer to employee
engagement as ‘the individual employees involvement and satisfaction with as well as enthusiasm for
work’’ (pp.269). They measure employee engagement using the Gallup Workplace Audit (GWA), which is
composed of 1 overall satisfaction item and 12 items that measure employee perceptions of work
characteristics. The 12 items include several items that are rather antecedents of employee engagement
than measures for psychological state and behavioral aspects of engagement, and are highly similar to
measures for organizational climate (e.g. ‘I know what is expected of me at work’, ‘I have the materials
and equipment I need to do my work right’).
In this thesis, I will refer to employee engagement as a psychological state only, rather than a
combination of antecedents, psychological states, and behavioral outcomes.

16
2.4 Antecedents of organizational climate
Organizational climate has an important influence on organizational outcomes. Therefore, it is of great
importance to know what factors influence organizational climate. Meanwhile, there is considerably less
information on the antecedents of organizational climate than on its consequences.
The influence leadership has on organizational climate has been established as the main driver for
organizational climate. Roughly, leadership can be divided in 3 types of behavior: consideration,
initiating structure and charismatic (transformational) leadership:
‘’Consideration is the degree to which a leader acts in a friendly and supportive manner, shows concern
for subordinates, and looks out for their well-being. Initiating structure is the degree to which a leader
defines and structures his or her own role and the roles of subordinates toward attainment of the group’s
formal goals. Transformational or charismatic leadership adds to these behaviors by introducing the
visionary aspect of leadership as well as the emotional involvement of employees within the
organization’’ (Koene, Vogelaar & Soeters, 2002, pp. 194)
Koene et al. (2002), in a study at 50 supermarket stores of a large supermarket chain, found
consideration to have a significant effect on organizational climate. Other studies identified the
relationship between transformational leadership and specific organizational climate aspects: for
example, climate for innovation (Jung, Cho & Wu, 2003), and involvement climate (Richardson &
Vandenberg, 2005).
Thus, the way management interacts with its subordinates has a significant effect on organizational
climate perception. This indicates that the way managers implement human resource practices will be of
great importance on organizational climate perception of organizational members. A supportive
manager, that shows concern and looks out for subordinates, while stimulating and making clear what is
expected, will be more successful in creating a favorable organizational climate than a manager who
does not employ these behaviors. These behaviors, which include aspects of both consideration and
initiating structure, I will refer to as management support. In line with the results from Koene et al.
(2002), management support will have a positive influence on organizational climate:
Hypothesis 3: there is a positive relation between management support and organizational
climate.
Organizational unit size has important implications for the structure and systems within an organization.
Large organizations are standardized, often mechanistically run, and complex (Daft, 2004). In small
organizations, communication is informal and face-to-face, because (top) management usually works
directly with employees on day-to-day operations. For larger organizations, the distance between
managers and workers in the non-managing functions increases; formal systems and procedures are
implemented to deal with the increase in information and complexity. This has far-reaching
consequences for management support perception; management support perception will be more
positive in small organizations than in large organizations.

17
Hypothesis 4: there is a negative relation between organizational unit size and management
support.
Payne and Mansfield (1973) studied the relationships among contextual, structural and climate
variables. They concluded that ‘’perhaps the best conclusion to draw is that organizational climate is
independent of organizational context and structure. However, accepting the present results as our best
estimates of these relationships, the pattern of relationships, using means and levels, between aspects
of size and dependence are strong enough to suggest that these variables do influence climate (pp.
525)’’. Thus, they did not found much evidence on the relationship between organizational structure
and context and organizational climate, but they did found preliminary evidence that organizational unit
size influences organizational climate. However, they do not provide any explanation on how
organizational unit size affects organizational climate.
Organizational unit size has a negative effect on management support (see hypothesis 4); it is more
difficult for management in large organizations to give the appropriate amount of management to its
subordinates. Management on its turn has a significant impact on organizational climate perception (see
hypothesis 3). Therefore, I expect management support to be the factor that explains the relation
between organizational unit size and organizational climate. Thus, rather than a direct relation between
organizational unit size and organizational climate, I expect management support to mediate the
relationship between organizational unit size and organizational climate. Therefore, I hypothesize:
Hypothesis 5: the relationship between organizational unit size and organizational climate is
mediated by management support perception.

18
2.5 Employee level and organizational climate perception
According to the model of Wright and Nishii (2010) top management is responsible for creating the HR
strategy, while middle managers are responsible for implementing the HR practices. This gives them
(especially top management) a principal impact on organizational climate. As a consequence of this,
their climate perceptions will be more positive than non-management’s climate perception. Evidence
for differences in climate perceptions among employee levels is found in the studies of Payne and
Mansfield (1973) and Patterson et al. (2004). Payne and Mansfield (1973) studied the effect of
hierarchical level on organizational climate perception and found that persons higher in the organization
tend to have a more positive climate perception than lower hierarchical levels. In their study, they
collected data in 14 different work organizations ranging in size from 262 employees to 4580 employees.
However, not all of the employees were questioned in their study, their results were only based on a
sample of 387 employees in total. Patterson et al. (2004) studied the relation between organizational
climate of management and non-management in 42 manufacturing companies ranging in size from 70 to
1150 employees. Their results indicate that management perceives climate more positive than non-
management.
In this thesis, I investigate climate perception of three employee levels: top-management, middle
management and non-management. Non-management consists of people performing the basic work of
producing the products and delivering services, top management includes managers overseeing the
whole organization, while middle management is a hierarchical line between non-management and top
management: managers of non-managers and managers of managers. The studies mentioned before do
not make a distinction between middle management and top-management. Results from top
management, however, are very interesting, as they are responsible for establishing the human
resource strategy. Therefore, it is plausible to assume that their results will give an indication of the
organizational climate that is desired within an organization.
Hypothesis 6: Organizational climate perception is more positive for employees higher in the
organization, such that, top management’s climate perception is more positive than middle
management’s climate perception, and middle management’s climate perception more positive
than non-management’s climate perception.

19
2.6 Theoretical framework
In Figure 1, the theoretical framework that is tested in this thesis is presented. I tested what influence
organizational climate has on several organizational outcomes: financial performance, operational
performance, and employee engagement. Besides, I investigated whether employee engagement
(partially) mediates the relation between organizational climate and financial/operational performance.
Additionally, antecedents of organizational climate are analyzed. In my model, I suggest organizational
climate is directly affected by management support, and indirectly by organizational unit size; the effect
of organizational unit size is (fully) mediated by management support.
Management
Support
Organizational Unit
Size
Organizational
Climate
Operational
Performance
Employee
EngagementH4
H2
Financial
Performance
H5
H1
H1;H2
H1
H3
H2
Figure 1, theoretical framework; the solid lines indicate direct relations, while the dashed line indicates an indirect relation
(fully mediated relation).

20
3. Methodology
3.1 Sample and Procedure The study is conducted in a large multinational company that is active in the fast moving consumer
goods market. The multinational’s activities are divided among several operating companies, active in
different countries and regions. The operating companies all perform comparable activities, but differ in
size. The smallest operating company has only 23 employees, while the largest has a workforce of about
6064 employees.
Employees on all levels (top management, middle management, and non-management) received a
questionnaire via either email or paper. A total of 41.693 questionnaires in 49 operating companies
were distributed of which 30.892 employees filled out usable questionnaires (approximately 75%
response rate), among them 469 top-managers, 3717 middle managers, and 17646 non-managers. For
9215 employees no employee level was specified.
For some operating companies detailed data on employee levels are available, while for others this is
less detailed. For 14 operating companies detailed information on three levels (Top Management,
Middle Management, and Non-Management ) is available, for 18 operating companies only non-
management and middle management scores’, and for 17 operating companies no employee level was
specified at all. The number of employees in top Management ranges from 5 to 163 employees, for
middle management this is from 12 to 491 employees, while the amount of employees in non-
management ranges from 18 to 2698.
Individual climate scorers are aggregated to provide operating companies level scores (see 3.7
aggregation), and company performance indicators are gathered from the company’s reporting systems.
Five different company performance indicators are used in this study: profitability, financial
sustainability & growth, EBIT margin, productivity. Not all of the 5 performance indicators were available
for each operating company. Productivity, profitability, financial sustainability & growth, and EBIT
margin is available for 42 operating companies, while numbers on employee turnover are only available
for 29 operating companies.
3.2 Employee survey
Measures for organizational climate, management support, and employee engagement were derived
from responses on an employee survey. As stated, the survey was spread among the employees of the
different operating companies. Each operating company (OpCo) had its personalized survey in its local
language. The employee survey consists of 49 items, asking employees their opinion about their
organizational climate, management support and engagement. A total of 35 items were on
organizational climate, 10 on management support, and 4 items on employee engagement.
Furthermore, each operating company was asked to specify questions that would allow for identification
of different demographic groups within an operating company (i.e. employee level, functional level, age,
gender, tenure). Each operating company asked these questions in their own preferred way. All
questions in the survey were answered on a 5 point Likert scale, ranging from 5) strongly agree, 4)

21
agree, 3) neither agree nor disagree, 2) disagree, 1) strongly disagree or from 5) very good, 4) good, 3)
average, 2) bad 1) very bad.
3.3 Organizational Climate measure
In this thesis, organizational climate is measured by 21 items of the employee survey on organizational
climate, divided into 5 aspects of total climate perception: innovation, responsibility, standards, rewards
and clarity. The total climate score is calculated by averaging the scores on the 5 climate aspects. This
approach is preferred above averaging the 21 units, because the number of items for each climate
aspects differs. Averaging the 23 units would give some climate aspects more weight than others,
something that is not preferred for this study. An overview of the dimensions, including the number of
items, reliability and sample items is presented in Table 1. The complete set of items that is used to
measure the organizational climate aspects is presented in Appendix 2.
Dimension Number
of items
Cronbach
alpha
Sample items
Innovation 4 0,799 ‘’I am encouraged to be innovative in my job (i.e., to come up with
new or better ways of doing things)’'
Responsibility 3 0,748 ‘’I have enough authority to carry out my job effectively’’
Standards 4 0,762 ‘’Within [Name OpCo] we compare ourselves to the external
market to perform better’’
Rewards 4 0,780 ‘’I receive recognition when I do a good job’’
Clarity 8 0,857 ‘’[Name OpCo] business strategy and goals are clear to me’’
Table 1, climate aspects and total climate score.
To get an operating company score for the separate climate aspects (and total climate score) individual
climate scores are averaged per operating company (see 3.7 aggregation). The scales for measuring
organizational climate in this study are in line with comparable dimensions in the literature. Table 2
provides an overview of dimensions from the literature. The definitions for the dimensions can be found
in appendix 1.

22
Koys and DeCotiis (1991) Pritchard and Karasick
(1973)
Hay Group/McBer (1995) Common dimensions
Innovation Flexibility/Innovation Flexibility Flexibility/Innovation
Autonomy Autonomy
Decision centralization Responsibility Autonomy
Level of rewards
Recognition Performance reward
dependency
Rewards Rewards
Cohesion Conflict vs. cooperation
Trust Social realtions Team Commitment Team Commitment
Support Supportiveness Support
Motivation to achieve Standards Standards
Pressure - -
Fairness - -
- - Clarity
- Structure -
- Status Polarization -
Table 2, Organizational climate dimensions from literature
3.4 Management support measure
Management support is measured by individually asking the employees how they perceive the
management support they get from their direct manager. In the employee survey, they filled out 8 items
covering accessibility, feedback, career support, trust, consistency and stimulation. Sample items are:
‘How would you rate your direct manager on: Being accesible/available when you need him or her’ and
‘My direct manager provides clear and regular feedback on my performance’. The other items are
presented in appendix 3. The questions were asked on 5 point Likert scale. Cronbach’s alpha is 0,940.
Again, to get an operating company score, the scores are averaged per operating company (see 3.7
aggregation).
3.5 Organizational unit size measure
Organizational unit size is measured by the amount of employees within an operating company. The
operating companies in this study differ in size considerably. As said, the largest operating company has
6064 employees, and the smallest has only 23 employees. Average number of employees is 851, with a
standard deviation of 1131. I classified organizational unit size in three groups: 1) small, 2) medium, 3)
large. Descriptive statistics for the classification are presented in Table 3.
Organizational unit size Employee range Number of OpCo’s Average Standard deviation
1.Small <250 17 74 50
2.Medium 250-1000 21 598 243
3.Large >1000 11 2535 1319
Table 3, classification of organizational unit size

23
3.6 Performance measures
Kaplan and Norton (1992) developed a measurement tool for company performance which they called
the balanced scorecard. Observing and working with many companies, they came to the conclusion that
both financial and operational measures are needed to monitor performance on critical areas. The
financial perspective indicates whether the tactics and strategies the company performs contribute to
the desired (financial) results. Typical financial indicators are related to profitability, growth and
shareholder value, while operational performance indicators are related to critical processes and
competencies.
In this research project, I employ both financial and operational performance measures. Furthermore, to
cover the employee-oriented perspective of company performance, I use employee engagement as a
measure for performance. Measures are selected on availability and relevance.
3.6.1. Financial performance measures
3.6.1.1 Profitability: EBIT per FTE (EBIT/FTE)
Earnings before interest and tax (EBIT) is a measure for the profitability of a company excluding interest
and tax expenses. To increase the comparability of the operating companies that are analyzed in this
research, EBIT is chosen above net profit, because the operating companies are active in different
countries with different tax rates and financial structures. EBIT is provided on yearly results. The
operating companies that are analyzed in this research differ in size. Therefore, EBIT is divided by the
number of employees in an operating company, to make a comparison between operating companies
possible.
3.6.1.2 Financial sustainability and growth: Revenue per FTE (Revenue/FTE)
Revenue is the income that a company generates from its operating activities, and is an important
indicator for financial sustainability and growth. On the long term a company’s revenue should grow (or
at least remain constant) to ensure its market position and income. Again, the measure is normalized by
dividing by the number of persons.
3.6.1.3 EBIT margin: EBIT divided by the number of units produced and sold (EBIT/#units
produced and sold)
This indicator gives an impression on how much a specific operating company earns per unit that is sold.
Thus, it is a measure on how effective an operating company is in conversing sales into profit.

24
3.6.2 Operational performance measures
3.6.2.1 Productivity: number of units produced and sold per FTE (# units produced and sold/FTE)
This measure gives an indication on the productivity of an operating company: how much is produced
and sold per full time equivalent within a year.
3.6.2.2 Employee turnover (# of persons that left the company voluntary within a year/ total
number of persons)
Skilled personnel is essential for company performance in terms of learning, innovation and task
accomplishment. When people leave the company part of these capabilities could be lost. This will
damage a company’s operational activities, having a negative influence on the performance of a
company. Furthermore, hiring new persons and getting them acquainted with the company’s practices
and activities is a costly process. People that are not valuable to the organization and left the company
involuntary are not included in this measure. The measure used in this work only measures voluntary
turnover. Voluntary leavers are employees who resigned from the company due to compensation
reasons, lack of career perspectives, job related and work environment issues, and other voluntary
leave.
3.6.3 Employee engagement
Employee engagement is measured by individually asking all employees to fill out 3 items covering
pride, well being, and satisfaction. Sample items are: ‘I feel proud to work for [Name OpCo]’ and
‘Considering everything, how would you rate your overall satisfaction working for [Name OpCo] at the
present time’ (see appendix 4). 5 point response scales were used. Cronbach’s alpha is 0.908.
Operating company scores are acquired by averaging the scores per operating company (see 3.7
aggregation).

25
3.7 Aggregation
Organizational climate, management support, and employee engagement are measured on individual
level, though the level of analysis of this thesis is on operating company level. Individual scores,
therefore, need to be aggregated to operating company level. Aggregation however is only justifiable
when the scores show certain within group agreement (Gonza’lez-Roma & Peiro, 2002). Burke,
Finkelstein and Dusig (1999) developed a model to test within group agreement by examining the
interrater agreement. In their model, interrater agreement is the degree to which judges (respondents)
assign the same raw scores to a rated object (i.e. organizational climate). Interrater agreement is
evaluated with the ‘’average deviation’’ (AD) index. Using this index, average deviation indices for each
of the organizational climate aspects (and total climate score), management support and employee
engagement scale can be assessed. First, the average deviations for each of the items in a scale are
computed:
1( )
N
jk jn
M j
x xAD
N=
−=∑
(A)
In this equation ( )M jAD is the average computed from the mean for an item j, N is the number of
respondents on that item, jkx is the kth
respondent’s score on item j, and jx is the the arithmetic mean
of the respondents’ scores on item j. Following, the average deviations for each of the measures can be
computed:
( )1
( )
J
M jj
M j
AD
ADJ
==∑
(B)
Where ( )M jAD is the average deviation computed from the mean for the J items of that measure.
( )M jAD is calculated as in (A).
Using the AD is a practical index to asses interrator agreement, as it is a measure of variability that only
uses the units of the original scale. Other indices to asses interrater agreement make use of estimates
and null hypothesis (e.g. James, Demaree & Wolf, 1993). The AD indices for the total climate scores (and
5 climate aspects), management support measure, and employee engagement measure are calculated
for each operating company. Average interrater agreement (and standard deviation), calculated from
the AD indices from each of the operating companies, are presented in Table 4.

26
ADM(Average) ADM(Standard deviation)
Total climate score 0.992 0.142
Innovation 1.000 0.169
Responsibility 0.982 0.173
Standards 0.901 0.121
Rewards 1.137 0.160
Clarity 0.983 0.152
Management support 1.049 0.153
Employee engagement 0.908 0.084
Table 4, average interrater agreement for the measures.
Most of the measures in my research have average deviation indices that are below the value of 1, while
some of them are slightly above the value of 1. A value of 1 stands for a 1 scale step in the ordinal likert
scale (i.e. strongly agree versus agree). I will accept aggregation of individual scores, when the rounded
value (zero decimals) of the average deviation index is equal or smaller than the value of 1. This is in
close agreement with the criteria of Burke et al. (2004) who specify an average deviation index below
the value of 1 (for 5-point likert scale) as acceptable for aggregation.
In addition, I tested whether the average operating company scores on the measures differ significantly
between operating companies. An F-test from a one-way analysis of variance (ANOVA) indicated that
significant differences exist between operating companies (see Table 5).
F-ratio
Total climate score 52.868***
Innovation 52.017***
Responsibility 40.143***
Standards 65.146***
Rewards 59.891***
Clarity 60.926***
Management support 37.617***
Employee engagement 107.774***
Table 5, ANOVA F ratios for the measures in this study.
***
p<.001
The F-tests (as well as the average interrator agreement) support aggregation of individual scores to
operating company level scores. Consequently, individual item scores of the surveys are aggregated to
total climate scores (and climate aspects scores), management supports scores, and employee
engagement scores for each operating company.
27
3.8 Analyses
The analyses of this thesis include three parts. In the first part, the relation between organizational
climate and performance is investigated. In the second part, the antecedents of organizational climate
are assessed, while in the third part of the analysis, the role of employee level on organizational climate
perception is investigated. The methods I used for these analyses are described below.
3.8.1 The relation between organizational climate and performance
Hypothesis 1 states that there is a positive relation between organizational climate and financial
performance, operational performance and employee engagement. For organizational climate, both the
total climate score (weighted average of the 23 items), as well as the 5 climate aspects separately, are
considered. This gives information on how the total climate score, as well as the separate climate
aspects, are related to the different performance indicators.
Testing these relations is done by regressing the outcomes (dependent variables) on the predictors
(independent variables). The outcomes are regressed separately on the different predictors
(independent variables). The first step was to regress the first indicator of financial performance
‘profitability’ on the total climate score, and then repeat this regression for the single climate aspects
separately. Next, the same regressions were done, but the next performance indicator ‘sustainability &
growth’ was used as dependent variable, instead of ‘profitability’. This process was repeated until all the
performance indicators were regressed on the total climate score and separate climate aspects. The
regression analyses that have been performed to test hypothesis 1 are summarized in formula (1).
Pi = α1i,j + β1
i,j C j (1)
Where Pi stands for the i’th performance indicator, i ranging from profitability (financial), sustainability
& growth (financial), EBIT margin (financial), productivity (operational), employee turnover
(operational), to employee engagement. C j stands for the organizational climate, j ranging from total
climate, innovation, responsibility, standards, rewards, to clarity. α1i,j and Β1
i,j are the regression
coefficients for these regressions for, respectively, the constant term and organizational climate.
The performance indicators in this study are measured in different units of measurement. As a
consequence of this, the (unstandardized) regression coefficients cannot be used to compare the impact
of organizational climate on the different performance indicators; the changes in dependent variables
(performance indicators) caused by changes in the independent variable (organizational climate) are
indicated by different units.
Therefore, I used standardized coefficients to find out which performance indicators are most affected
by organizational climate. Contrary to (unstandardized) regression coefficients, standardized coefficients
can be used to compare different outcome units, because they are based on changes on standard

28
deviation rather than on absolute values (see Textbox 1 ).
The performance indicators I used in this study are not only dependent on organizational climate.
Market position, intensity of competition, and other (external) factors are also of great importance on
company performance. Whereas regression coefficients indicate how the dependent variables
(performance indicators) change when the independent variable (organizational climate) is varied, the
coefficient of determination (R2) indicates which part of the variation in an outcome (performance
indicators) is accounted for by the predictor (organizational climate). Thus, the regression coefficient
indicates the magnitude of change in the dependent variable, caused by the independent variable, while
the coefficient of determination is a measure of which proportion of performance is predicted by
organizational climate, rather than by other factors. A higher coefficient of determination indicates that
organizational climate is of more predictable value for performance, and that the performance indicator
is likely to be influenced by less other variables. The coefficient of determination is determined by
comparing the total variance in the independent variable (performance indicators) to the variance
explained by the dependent variable (organizational climate) (see Textbox 2).
Standardized regression coefficients
A standardized regression coefficient is a regression coefficient that results from a regression
analysis when both the independent and dependent variables are standardized. Variables are
standardized by subtracting the mean value of the sample and dividing by the standard deviation
of the sample, so that the variables have variances of 1. Standardized regression coefficients
indicate the change in standard deviation in the dependent variable (performance indicator) that is
caused by the independent variable (organizational climate).
In a simple regression analysis, where the dependent variable is dependent on 1 independent
variable, the standardized regression coefficient has the same value as the correlation coefficient.
Standardized regression coefficients have values between -1 and 1. A value of 1 indicates a perfect
positive relation, a value of -1 a perfect negative relation, while a value of 0 indicates that there is
no relation between the independent and dependent variable (see illustration below).
1-1 0
Stronger positive relationStronger negative relation
No relation
Textbox 1, standardized regression coefficients

29
Coefficient of determination
The total variance in the dependent variable sample (performance indicators variances) is equal to
the total sum of squares:
2( )tot ii
SS p p= −∑
SStot stands for the total sum of squares, pi for the observed values (performance indicators of
different operating companies) and p for the average of the observed values (average of
performance indicators).
The variance that is explained by the dependent variable (organizational climate) is equal to the
regression sum of squares (explained sum of squares):
2( )reg ii
SS f f= −∑
SSreg stands for the explained sum of squares, fi for the predicted values of the regression analysis
and f for the average of the predicted values.
The coefficient of determination (for a linear regression model) is equal to:
2 reg
tot
SSR
SS=
The coefficient of determination has a value between 0 and 1. A value of 1 indicates that all
variance in the dependent variable is explained by the independent variable, while a value of 0
indicates that the dependent variable does not explain any variance in the dependent variable.
Textbox 2, the coefficient of determination

30
3.8.2 Employee engagement: mediator between organizational climate and
financial/operational performance.
Hypothesis 2 states that employee engagement (partially) mediates the relation between organizational
climate and financial/operational performance. To test this mediation hypothesis I used the approach
from Baron and Kenny (1986). In general, a variable functions as a mediator if it accounts for the relation
between a predictor and outcome. To clarify the meaning of mediation, they introduced a path diagram
(see Figure 2)
Figure 2, path model to test mediation (Baron & Kenny, 1986)
This model assumes a three variable path model, in which two variables impact the outcome variable.
The outcome variable is directly impacted by the independent variable (path c). In addition, the
mediator variable has an impact on the outcome variable (path b), and the mediator variable on his turn
is impacted by the independent variable (path a). According to Baron and Kenny (1986) a variable does
function as a mediator when three conditions are satisfied. First, the independent variable should be
significantly be associated with the mediator variable (path a). Second, the mediator variable should be
significantly be associated with the outcome variable (path b). Third, when paths a and b are controlled,
a previously significant relation between the independent variable and outcome variable is reduced. Full
mediation occurs when path c turns into a non-significant value, while partial mediation is present if
path c is reduced to a lower significant value.
Testing whether employee engagement functions as a mediator involves three steps. In the first step
employee engagement is regressed on organizational climate, while in the second step the
financial/operational performance indicators are regressed on organizational climate. These steps
involve the same regression analyses as hypothesis 1. In the third step, the financial/operational
performance indicators are regressed on organizational climate and employee engagement. These
multiple regression analyses are presented in formula (2).
Pi = α2i,j+ β2
i,j Cj + β3 ENG (2)
Where Pi stands for the i’th performance indicator, i ranging from profitability (financial), sustainability
& growth (financial), EBIT margin (financial), productivity (operational), employee turnover
(operational). C j stands for the organizational climate, j ranging from total climate, innovation,
responsibility, standards, rewards, to clarity. ENG stands for employee engagement. α2i,j , β2
i,j , β3 are

31
the regression coefficients of these multiple regression analyses for respectively the constant term,
organizational climate, and employee engagement.
The mediation hypothesis is supported when significant relations are found for the first two regression
analyses, and when in the third regression analysis, employee engagement is significantly related to the
financial/operational performance indicators. Additionally, the relation between organizational climate
and financial/operational performance in the third regression analysis, has to be reduced compared to
relation found in the second regression analysis.
3.8.3 The relation between organizational unit size, management support and
organizational climate.
Hypothesis 3 states that there is a positive relation between management support and organizational
climate, while hypothesis 4 specifies a negative relation between organizational unit size and
management support. These relations are tested using linear regression analyses. To test the first
relation, total organizational climate score (and the separate climate aspects) are regressed on
management support:
Cj = α3j + β4
j MS (3)
Where Cj stands for the organizational climate, j ranging from total climate, innovation, responsibility,
standards, rewards, to clarity. MS stands for management support perception. α3j and Β4
j are the
regression coefficients for these regression analyses for, respectively, the constant term and
management support.
The second relation, the relation between organizational unit size and management support, is tested
by regressing management support on organizational unit size:
MS = α4 + β5 S (4)
Where MS stands for management support and S for organizational unit size. α3 and β5 are the
regression coefficients for this regression analysis for, respectively, the constant term and organizational
unit size.
Hypothesis 5 indicates that management support acts as a mediator of the relation between
organizational unit size and organizational climate. Again, I will use the same approach as used to test
the mediating effect of hypothesis 2. Thus, first management support is regressed on organizational unit
size, which are the same regression analyses as for hypothesis 4. Second, organizational climate is
regressed on organizational unit size:
Cj = αj5
+ β6j S (5.1)

32
Where Cj stands for organizational climate, j ranging from total climate, innovation, responsibility,
standards, rewards, to clarity. S stands for organizational unit size. αj5
and β6j are the regression
coefficients for this regression analysis for, respectively, the constant term and organizational unit size.
Third, organizational climate is regressed on both management support and organizational unit size
(multiple regression analyses):
Cj = αj6 + β7
j S + β8j MS (5.2)
Where Cj stands for organizational climate , j ranging from total climate, innovation, responsibility,
standards, rewards, to clarity. S stands for organizational unit size and MS for management support
perception. αj6, β7
j , and β8j are the regression coefficients for this regression analysis for, respectively,
the constant term , organizational unit size and management support.
The mediation hypothesis is supported if significant relations are found for the first and second
regression analyses, and when in the third regression analysis, management support is significantly
related to organizational climate. Additionally, the relation between organizational unit size and
organizational climate, in the third regression analysis, should turn into a non-significant value.
3.8.4 Organizational climate perception of different employee levels
Hypothesis 5 states that organizational climate perception is more positive for employees higher in the
organization than for lower level employee levels’ climate perception. To examine the effects of
hierarchical level on organizational climate perception, one-way analyses of variances of the individual
climate scores, categorized by hierarchical level (top management, middle management, non-
management) are performed

33
4. Results
4.1 Descriptive statistics, reliability and correlations of measures
The data in the present study includes data on organizational climate (aspects), management support,
employee engagement and several financial and operational performance indicators. To give an
impression on the scores of these measures, as well as their reliability, descriptive statistics and
Cronbach alpha’s for these measures are presented in Table 6.
To get a first idea on how the different measures are related to each other, correlations between the
measures are presented in Table 7. In turns out that the organizational climate aspects are (strongly)
correlated to each other. Regarding the performance indicators commonly, it becomes clear that
profitability is significantly related to all of the other financial and operational performance indicators,
while sustainability & growth is significantly related to all the other financial and operational
performance indicators, except employee turnover. EBIT margin and Productivity are only significantly
related to profitability and sustainability & growth, and employee turnover is only significantly related to
profitability. Employee engagement is significantly related to profitability, sustainability & growth, and
productivity.
How the climate scores and performance indicators are related to each other, and how management
support and organizational unit size are related to the climate scores, is discussed in depth in the next
part of the results, where the hypotheses of this study are tested.
C
ron
Ba
ch A
lph
a
Av
era
ge
Sta
nd
ard
de
via
tio
n
Min
imu
m v
alu
e
Ma
xim
um
va
lue
1. Total climate 0.838 3.523 0.225 2.993 4.261
1.1 Innovation 0.799 3.555 0.278 2.981 4.290
1.2 Responsibility 0.748 3.672 0.261 3.077 4.274
1.3 Standards 0.762 3.544 0.292 2.459 4.179
1.4 Rewards 0.780 3.080 0.348 2.438 4.050
1.5 Clarity 0.857 3.762 0.231 3.125 4.515
2. Management support 0.940 3.697 0.256 2.913 4.317
3. Employee engagement 0.908 3.719 0.336 2.906 4.577
4.Financial Performance
4.1 Profitability - - - - -
4.2 Sustainability & Growth - - - - -
4.3 EBIT Margin - - - - -
5.1 Productivity - - - - -
5.2 Turnover - - - - -
Table 6, descriptive statistics and reliability for the measures of this study

34
To
tal
Cli
ma
te S
core
Inn
ov
ati
on
Re
spo
nsi
bil
ity
Sta
nd
ard
s
Re
wa
rds
Cla
rity
Org
an
iza
tio
na
l U
nit
Siz
e
Ma
na
ge
me
nt
Su
pp
ort
Em
plo
ye
e e
ng
ag
em
en
t
Pro
fita
bil
ity
Su
sta
ina
bil
ity
& G
row
th
EB
IT M
arg
in
Pro
du
ctiv
ity
Em
plo
ye
e T
urn
ov
er
Total Climate Score 1 .82**
.71**
.73**
.84**
.89**
.41**
.82**
.78**
.48**
.36* .36
* .32
* -.12
Innovation .82**
1 .47**
.43**
.74**
.60**
.50**
.63**
.66**
.31* .49
** .20 .31
* -.10
Responsibility .71**
.47**
1 .37**
.47**
.57**
.11 .71**
.71**
.27 .26 .19 .23 .02
Standards .73**
.43**
.37**
1 .39**
.77**
.11 .57**
.44**
.45**
.05 .39* .24 .00
Rewards .84**
.74**
.47**
.39**
1 .67**
.49**
.64**
.69**
.43**
.40**
.30* .25 -.14
Clarity .89**
.60**
.57**
.77**
.67**
1 .41**
.78**
.63**
.50**
.25 .37* .26 -.24
Organizational Unit Size .41**
.50**
.11 .11 .49**
.41**
1 .34* -.36
* .24 .16 .37
* -.24 -.11
Management Support .82**
.63**
.71**
.57**
.64**
.78**
.34* 1 .71
** .26 .21 .18 .16 -.30
Employee engagement .78**
.66**
.71**
.44**
.69**
.63**
-.36*
.71**
1 .37*
.40**
.28 .32*
-.22
Profitability .48**
.31* .27 .45
** .43
** .50
** .24 .26 .37
* 1 .62
** .85
** .37
* -.51
**
Sustainability & Growth .36*
.49**
.26 .05 .40**
.25 .16 .21 .40**
.62**
1 .32* .61
** -.09
EBIT Margin .36* .20 .19 .39
* .30
* .37
* .37
* .18 .28 .85
** .32
* 1 -.06 -.38
Productivity .32* .31
* .23 .24 .25 .26 -.24 .16 .32
* .37
* .61
** -.06 1 -.32
Employee Turnover -.12 -.10 .02 .00 -.14 -.24 -.11 -.30 -.22 -.51**
-.09 -.38 -.32 1
Table 7, correlations between the measures. **
p<.01 *p<.05

35
4.2 The relation between organizational climate and performance
Hypothesis 1 states that organizational climate is positively related to financial performance, operational
performance and employee engagement. To test this hypothesis, the performance indicators are
regressed on the organizational climate scores as described in 3.8.1. The results of these regression
analyses are presented in Table 8. The results of Table 8 Error! Reference source not found.show that
there are positive significant relations between organizational climate and organizational performance
indicators. There are significant relations between the total climate score and respectively profitability,
sustainability & growth, EBIT margin, productivity and employee engagement. These relations partly
confirm hypothesis 1, due to the lack of significant relations between total climate and employee
turnover, hypothesis 1 cannot fully be confirmed.
Organizational climate has most impact on employee engagement (β*= 0.781) and profitability (β
*=
0.481). An increase of one standard deviation in the total climate score will result in 0.613 standard
deviation increase in employee engagement. For profitability, this is an increase of 0.481 standard
deviation, while for the other performance indicator the relations are considerably less strong (or
insignificant); sustainability & growth (0.365), EBIT margin (0.357), productivity (0.316) and employee
turnover (insignificant). An overview of these relations is presented in Figure 3.
The coefficients of determination indicate that organizational climate has most predictive value for
employee engagement and profitability; total climate accounts for 61.0% of the variation in employee
engagement and for 23.1% of the variation in profitability. For the other performance indicators, the
total climate score accounts for considerably less of the variation; sustainability & growth (13.3%), EBIT
margin (2.7%), Productivity (10.0%) and employee turnover (1.3%). The coefficients of determination
are also presented in Figure 3.
Total Climate
Perception
Profitability
Sustainability & Growth
EBIT Margin
Productivity
Employee Turnover
Engagement
.481**
.781**
.365*
.357*
.316*
. 116
61.0%
23.1%
13.3%
12.8%
10.0%
1.3%
Figure 3, the relation between total climate perception and several performance indicators. The relations between total
climate perception and the performance measures are indicated with standardized coefficients.
**
p<.01 *p<.05

36
De
p.
Va
ria
ble
Independent variable
Em
plo
ye
e e
ng
ag
em
en
t
Pro
fita
bil
ity
Su
sta
ina
bil
ity
& G
row
th
EB
IT
Ma
rgin
Pro
du
ctiv
ity
Em
plo
ye
e T
urn
ov
er
Total climate score
β=1.165 **
SE=.136
β*=.781
α=.606
SE=.338
R2 =.610
β=75.149**
SE=21.417
β*=.481
**
α=-234.724**
SE=75.628
R2=.231
β=222.706*
SE=88.851
β*=.365
α=-536.462
SE=313.756
R2=.133
β=20.302*
SE=8.283
β*=.357
α=-58.466
SE=29.250
R2=.128
β=1.465*
SE=.687
β*=.316
α=-2.800
SE=2.427
R2=.100
β=.637
SE=1.052
β*=.116
α=-1.216
SE=3.701
R2=.013
Innovation
β=.791**
SE=.133
α=.347
SE=.328
R2=.429
β=41.176*
SE=19.468
α=-116.117
SE=69.326
R2=.098
β=253.308**
SE=69.653
α=-651.035*
SE=248.039
R2=.244
β=9.674
SE=7.291
α=-21.278
SE=25.964
R2=.041
β=1.203*
SE=.578
α=-1.908
SE=2.060
R2=.095
β=.355
SE=.673
α=-.227
SE=2.375
R2=.010
Responsibility
β=.915**
SE=.132
α=.152
SE=.308
R2=.507
β=36.114
SE=20.287
α=-102.348
SE=74.586
R2=.072
β=138.417
SE=79.378
α=-259.256
SE=291.832
R2=.069
β=9.533
SE=7.501
α=-21.885
SE=27.577
R2=.038
β=.913
SE=.608
α=-.985
SE=2.235
R2=.052
β= -.076
SE=.683
α=1.301
SE=2.508
R2=.000
Standards
β=.502**
SE=.151
α=1.048**
SE=.374
R2=.190
β=58.343**
SE=17.923
α=-177.810**
SE=64.060
R2=.205
β=25.683
SE=78.451
α=156.737
SE=280.406
R2=.003
β=18.019*
SE=6.738
α=-51.134*
SE=24.083
R2=.149
β=.930
SE=.578
α=-.951
SE=2.067
R2=.059
β= -.009
SE=.818
α=1.057
SE=2.947
R2=.000
Rewards
β=.660**
SE=.103
α=.353
SE=.301
R2=.469
β=42.646**
SE=14.178
α=-100.812*
SE=43.817
R2=0.181
β=155.454**
SE=56.179
α=-228.831
SE=173.623
R2=.157
β=11.081*
SE=5.419
α=-20.939
SE=16.748
R2=.093
β=.732
SE=.450
α=.188
SE=1.392
R2=.061
β=.397
SE=.554
α=-.182
SE=1.688
R2=.019
Clarity
β=.917**
SE= .164
α=.229
SE=.370
R2=.398
β=77.263**
SE=20.920
α=-261.148**
SE=79.006
R2=.250
β=148.820
SE=91.451
α=-312.672
SE=345.363
R2=.061
β=20.967*
SE=8.137
α=-65.961*
SE=30.728
R2=.139
β=1.213
SE=.691
α=-2.209
SE=2.609
R2=.070
β= 1.645
SE=.1.264
α=-5.149
SE=4.746
R2=.059
Table 8, the relation between organizational climate and performance indicators. *p<0.05
**p<0.01

37
A detailed analysis on the relation between the climate aspects of total organizational climate and the
performance indicators is presented below. In this analysis, aspects of organizational climate that have
most effect on each of the performance indicators are identified.
4.2.1 Financial performance indicators
The total climate score has a strong significant effect on profitability (β=75.149, SE=21.417, p<0.01). An
increase of 1 point on the total climate score will result in 75.149 increase in profitability. Considering
the separate climate aspects, it can be observed that clarity has most impact on profitability (β=77.263,
SE=20.920, p<0.01) and that innovation has the least strong impact on profitability (β=41.176,
SE=19.468, p<0.05). For responsibility, no significant relation with profitability could be identified. An
overview of these relations can be found in Figure 4.
The coefficient of determination indicates that clarity has most predictive value for profitability; 25.0%
of the variation in profitability is accounted for by clarity. This number is slightly higher than for total
climate score, which only clarifies 23.1% of the variation in profitability. Standards and rewards clarify,
respectively, 20.5% and 18.1% of the variation in profitability, while innovation and responsibility only
account for, respectively, 9.8% and 7.2%.
Profitability
Innovation
Responsibility
Standards
Rewards
Clarity
Total Climate Score 75.149**
41.176*
36.114
58.343**
42.646**
77.263**
23.1%
9.8%
7.2%
20.5%
18.1%
25.0%
Figure 4, the relation between total climate (and the separate climate aspects) and profitability. **
p<.01 *p<.05
Total climate score also significantly affects sustainability & growth (β=222.706, SE=88.851, p<0.05).
Innovation has the strongest impact on sustainability & growth (β=253.308, SE=69.653, p<0.01), which is
considerably stronger than the impact of rewards (β=155.454, SE=56.179, p<0.01). For the other climate
aspects, no significant relations with sustainability & growth could be identified. An overview of these
relations can be found in Figure 5.
Innovation has far the most predictive value for sustainability & growth; 24.4% of the variation in
sustainability & growth is explained by innovation. For rewards and total climate score these numbers

38
are, respectively, 15.7% and 13.3%. The other climate aspects have low predictive value for
sustainability & growth; responsibility (6.9%), clarity (6.1%) and standards (0.3%).
Sustainability & growth
Innovation
Responsibility
Standards
Rewards
Clarity
Total Climate Score 222.706*
253.308**
138.417
25.683
155.454**
148.820
13.3%
24.4%
6.9%
0.3%
15.7%
6.1%
Figure 5, the relation between total climate (and the separate climate aspects) and Sustainability & Growth. **
p<.01 *p<.05
For the third financial performance indicator, EBIT margin, I also identified a significant positive
association with total climate score (β=20.302, SE=8.283, p<0.05). Clarity (β=20.967, SE=8.137, p<0.05)
and standards (β=18.019, SE=6.738, p<0.05) have the most effect on EBIT margin, while rewards has the
least strong influence on EBIT margin (β=11.081, SE=5.419, p<0.05). For innovation and responsibility, I
did not identify any significant relations with EBIT margin.
Standards and clarity account for, respectively, 14.9% and 13.9% of the variation in EBIT margin. This
number is slightly lower for total climate (12.8%) and rewards (9.3%), while responsibility (3.8%) and
innovation (4.1%) clarify significantly less variation in EBIT margin.
EBIT margin
Innovation
Responsibility
Standards
Rewards
Clarity
Total Climate Score 20.302*
9.674
9.533
18.019*
11.081*
20.967*
12.8%
4.1%
3.8%
14.9%
9.3%
13.9%
Figure 6, the relation between total climate (and the separate climate aspects) and EBIT margin. **
p<.01 *p<.05

39
4.2.2 Operational performance indicators
The total climate score has a significant influence on productivity (β=1.465, SE=.687, p<0.05). From the
climate aspects, only innovation has a significant impact on productivity (β=1.203, SE=.578, p<0.05). For
the other climate aspect, I did not found any significant relations.
Total climate score accounts for the most variation in productivity (10.0%). Innovation, clarity, rewards,
standards and responsibility account for respectively 9.5%, 7.0%, 6.1%, 5.9% and 5.2% of the variation in
productivity. These relations are summarized in Figure 7.
Productivity
Innovation
Responsibility
Standards
Rewards
Clarity
Total Climate Score 1.465*
1.203*
0.913
0.930
0.732
1.213
10.0%
9.5%
5.2%
5.9%
6.1%
7.0%
Figure 7, the relation between total climate (and the separate climate aspects) and Productivity.
**
p<.01 *p<.05
No significant relations between organizational climate and employee turnover could be identified, nor
for the total climate score, neither for the separate climate aspects. Hardly none of the variation in
employee turnover is accounted for by organizational climate; total climate (1.3%), innovation (1.0%),
responsibility (0.0%), standards (0.0%), rewards (1.9%), clarity (5.9%).

40
4.2.3 Employee engagement
Total climate score has a strong impact on and employee engagement (β=1.165, SE=.136, p<0.01).
Considering the separate climate aspects, the strong influence of responsibility (β=0.915, SE=.132,
p<0.01) and clarity (β=.917, SE=.164, p<0.01) on employee engagement stands out. The other climate
aspects also have a significant impact on employee engagement; innovation (β=.791, SE=.133, p<0.01),
rewards (β=.660, SE=.103, p<0.01) and standards (β=.502, SE=.151, p<0.01).
The total climate score accounts for 61.0% of the variation in employee engagement. From the climate
aspects, responsibility and rewards have the most predictive value for employee engagement;
responsibility and rewards clarify, respectively, 50.7% and 46.9%, of the variation in employee
engagement. For innovation this percentage is 42.9 %, for clarity 39.8% and for standards only 19.0%.
An overview of these relations is presented in Figure 8.
Employee engagement
Innovation
Responsibility
Standards
Rewards
Clarity
Total Climate Score
.791**
1.165**
.502**
.660**
.917**
.915**
61.0%
42.9%
50.7%
19.0%
46.9%
39.8%
Figure 8, the relation between total climate (and the separate climate aspects) and Employee engagement. The numbers in
this figure are unstandardized regression coefficients.
**
p<.01 *p<.05

41
4.3 Employee engagement as mediator of the relation between organizational
climate and financial/operation performance.
Hypothesis 2 indicates that employee engagement functions as (partial) mediator of the relation
between organizational climate and financial/operational performance. The first condition that must be
satisfied for is that there is significant relation between organizational climate and employee
engagement, while the second condition prescribes a significant relation between organizational climate
and financial/operational performance. The first and second condition are satisfied for; there is a
significant positive relation between total climate and employee engagement and between total climate
score and profitability, sustainability & growth, EBIT margin and productivity (see Table 9). The third
condition requires employee engagement to be significantly related to financial/operational
performance when financial/operational performance is regressed on organizational climate and
employee engagement. The results of these regression analyses show that the third condition is not
satisfied for; employee engagement is not significantly related to profitability, sustainability & growth,
EBIT margin, or productivity. Employee engagement is significantly related to employee turnover,
however, this performance indicator is not significantly impacted by organizational climate (second
condition).
De
pe
nd
en
t va
ria
ble
Independent variable
Pro
fita
bil
ity
Su
sta
ina
bil
ity
& G
row
th
EB
IT
Ma
rgin
Pro
du
ctiv
ity
Em
plo
ye
e T
urn
ov
er
Total climate score
Employee engagement
constant term
coefficient of determination
β=84.414*
(37.741)
β=7.577
(25.276)
α=-239.152**
(77.895)
R2=.233
β=70.067
(153.955)
β=124.824
(103.106)
α=-463.515
(317.754)
R2=.164
β=22.395
(14.608)
β=-1.712
(9.783)
α=-59.467
(30.149)
R2=.128
β=.758
(1.205)
β=.578
(.807)
α=-2.462
(2.486)
R2=.111
β=2.532
(1.301)
β=-1.458*
(.656)
α=-2.472
(3.504)
R2=.171
Innovation
Employee engagement
constant term
coefficient of determination
β=12.371
(28.099)
β=31.528
(22.416)
α=-131.275
(69.356)
R2=.141
β=222.171*
SE=102.770
β= 34.081
(81.983)
α=-667.420*
(253.661)
R2=.247
β=.035
(10.576)
β= 10.550
(8.437)
α=-26.350
(26.104)
R2=.077
β=.629
(.846)
β= .629
(.675)
α=-2.210
(2.088)
R2=.115
β=1.113
(.770)
β=-1.110
(.608)
α=1.178
(2.410)
R2=121
Table 9, the (multiple) regression analyses from the performance indicators on organizational climate and employee
engagement. The values in parenthesis are the standard errors of the regression coefficients.

42
De
pe
nd
en
t va
ria
ble
Independent variable
Pro
fita
bil
ity
Su
sta
ina
bil
ity
& G
row
th
EB
IT
Ma
rgin
Pro
du
ctiv
ity
Em
plo
ye
e T
urn
ov
er
Responsibility
Employee engagement
constant term
coefficient of determination
β=-.350
(28.880)
β=38.918
(22.432)
α=-113.597
(73.110)
R2=.137
β=-30.910
(111.250)
β=180.726*
(86.412)
α=-311.493
(281.627)
R2=.161
β=-.789
(10.843)
β=11.017
(8.422)
α=-25.069
(27.449)
R2=.077
β=-.039
(.873)
β=1.016
(.678)
α=-1.279
(2.211)
R2=.102
β=.721
(.868)
β=-.980
(.678)
α=2.013
(2.508)
R2=.075
Standards
Employee engagement
constant term
coefficient of determination
β=46.041*
(20.796)
β=19.506
(16.917)
α=-206.625**
(68.524)
R2=.231
β=-104.881
(83.323)
β=207.024**
(67.781)
α=-149.079
(274.549)
R2=.191
β=15.408
(7.906)
β=4.141
(6.431)
α=-57.251
(26.051)
R2=.157
β=.412
(.663)
β=.822
(.539)
α=-2.166
(2.185)
R2=.111
β=.210
(.831)
β=-.652
(.543)
α=2.683
(3.222)
R2=.052
Rewards
Employee engagement
constant term
coefficient of determination
β=32.570
(19.716)
β=15.231
(20.586)
α=-126.613*
(56.192)
R2=.192
β=90.757
(77.250)
β=97.797
(80.659)
α=-394.501
(220.166)
R2=.187
β=7.818
(7.551)
β=4.933
(7.884)
α=-29.295
(21.520)
R2=.101
β=.142
(.616)
β=.892
(.643)
α=-1.394
(1.755)
R2=.104
β=.870
(.599)
β=-.998
(.572)
α=2.079
(2.082)
R2=.121
Clarity
Employee engagement
constant term
coefficient of determination
β=71.027*
(28.666)
β=6.257
(19.413)
α=-260.948**
(79.886)
R2=.252
β=-25.478
(118.641)
β=174.898*
(80.346)
α=-307.092
(330.629)
R2=.160
β=19.160
(11.156)
β=1.814
(7.555)
α=-65.903*
(31.089)
R2=.141
β=.408
(.929)
β=.808
(.629)
α=-2.183
(2.589)
R2=.107
β=2.538
(1.298)
β=-1.002
(.532)
α=-4.789
(4.542)
R2=.172
Table 9 (continued), the (multiple) regression analyses from the performance indicators on organizational climate and
employee engagement. The values in parenthesis are the standard errors of the regression coefficients.

43
4.4 The relation between organizational unit size, management support and
organizational climate
Hypothesis 3 indicates a positive relation between management support and organizational climate. To
test this hypothesis, the climate scores are regressed on management support as described in 3.8.3, and
are presented in Table 10. A strong significant relation is identified between management support and
total climate score (β=.724, SE=.073, p<.01). Management support has strong predictive value for total
climate perception; 67.8 % of the variation in total climate score is accounted for by the perception of
management support.
In addition, the separate climate aspects are influenced significantly by management support.
Management support has most impact on rewards (β=.866, SE=.153, p<.01), while the impact of
management support on the other climate aspects is comparable to the impact on the total climate
score. Management support accounts for most variation in clarity (60.6%), and for least variation in
standards (31.9%).
Hypothesis 3 is confirmed by the results of this study; there is a significant relation between
management support and organizational climate.
De
pe
nd
en
t va
ria
ble
Independent variable
To
tal
clim
ate
sco
re
Inn
ova
tio
n
Re
spo
nsi
bil
ity
Sta
nd
ard
s
Re
wa
rds
Cla
rity
Management Support
β=.724**
SE=.073
α=.847**
SE=.269
R2=.678
β=.679**
SE=.123
α=1.043*
SE=.457
R2=.392
β=.727**
SE=.104
α=.984*
SE=.386
R2=.509
β=.643**
SE=.137
α=1.165*
SE=.508
R2=.319
β=.866**
SE=.153
α=-.122
SE=.566
R2=.406
β=.702**
SE=.083
α=1.167**
SE=.306
R2=.606
Table 10, the relation between management support and organizational climate. **
p<.01 *p<.05

44
Hypothesis 4 states that there is negative relation between organizational unit size and management
support. This hypothesis is tested by regressing management support on organizational unit size. The
result of this regression analysis is presented in Table 11. The results of Table 11 indicate that there is a
significant negative relation between organizational unit size and management support (β=-.115,
SE=.047, p<.05). 11.4 % of the variation in management support perception is accounted for by the
organizational unit size.
Dependent variable:
Management support
Independent variable:
Organizational Unit Size
β=-.115* (.047)
α=3.913**
(.094)
R2=.114
According to hypothesis 5, management support acts as a mediator of the relation between
organizational unit size and organizational climate. The first step for testing this mediating effect is
satisfied for by the results of hypothesis 4; there is a significant relation between organizational unit size
and management support. The second requirement is that organizational unit size must be significantly
be associated with organizational climate. This requirement is satisfied for; organizational unit size has a
significant negative effect on total climate score (β=-.123, SE=.040, p<.01).
The third step involves the (multiple) regressions of organizational climate on organizational unit size
and management support. This regression analysis shows that management support has a significant
influence on total climate (β=.679, SE=.076, p<.01). Furthermore, it turns out that the previous
significant relation between organizational unit size and total climate scores is reduced to an
insignificant value (from β=-.123, SE=.040, p<.01 to β=-.045, SE=.026, p>.05). Therefore, the relation
between organizational unit size and total climate score is fully mediated by management support (see
Figure 9). The regression analyses involved to test hypothesis 5 are summarized in Table 12.
Management
Support
Organizational Unit
Size
Total Climate
Perception-.115*
.679**
Figure 9, the (full) mediation of management support of the relation between organizational unit size and total climate
perception. The dashed line indicates that there is only an indirect relation. **
p<.01 *p<.05
Table 11, the relation between organizational unit size and management support. The number in parenthesis is the standard
error of the regression coefficient. **
p<.01 *p<.05

45
De
pe
nd
en
t va
ria
ble
Independent variables
To
tal
clim
ate
sco
re
Inn
ova
tio
n
Re
spo
nsi
bil
ity
Sta
nd
ard
s
Re
wa
rds
Cla
rity
Organizational Unit Size β=-.123**
SE=.040
α=3.753**
SE=.080
R2=.169
β=-.184**
SE=.047
α=3.900**
SE=.094
R2=.248
β=-.039
SE=.050
α=3.746**
SE=.102
R2=.013
β=-.042
SE=.056
α=3.622**
SE=.113
R2=.012
β=-.225**
SE=.059
α=3.501**
SE=.119
R2=.236
β=-.125**
SE=.041
α=3.997**
SE=.082
R2=.167
Organizational Unit Size
Management support
Constant term
Coefficient of determination
β =-.045
SE=.026
β= .679
**
SE=.076
α=1.097**
SE=.300
R2=.699
β=-.120**
SE=.041 β=.561
**
SE=.122
α=1.706**
SE=.484
R2=.485
β =.050
SE=.037
β=.777**
SE=.110
α=.708
SE=.435
R2=.527
β =.036
SE=.050
β =.679**
SE=.146
α=.965
SE=.580
R2=.327
β=-.141**
SE=.029
β=.726**
SE=.152
α=.662
SE=.603
R2=.489
β =-.050
SE=.029
β= .652**
SE=.086
α=1.446**
SE=.341
R2=.630
Equally, full mediation by management support occurs for the relationship between organizational unit
size and clarity perception (from β=-.125, SE=.059, p<.01 to β=-.050, SE=.029, p>.05). This relation is
presented in Figure 10.
Management
Support
Organizational Unit
Size
Clarity Perception-.115*
.652**
Figure 10, the (full) mediation of management support of the relation between organizational unit size and clarity
perception. The dashed line indicates an indirect relation. **
p<.01 *p<.05
Table 12, the relation between organizational unit size, management support and organizational climate. the first value is
the parameter estimate, and the value in parentheses is the standard error.
**
p<.01 *p<.05

46
When entering management support to the relations between organizational unit size and innovation
perception, and organizational unit size and clarity perception, the previous significant relations turn
into significant lower values: innovation (from β=-.184, SE=.047, p<.01 to β=-.120, SE=.041, p<.01) and
rewards: (from β=-.225, SE=.059, p<.01 to β=-.141, SE=.029, p<.01). Thus, the relations between
organizational unit size and innovation perception, and organizational unit size and clarity perception,
are not (fully) mediated by management support, but management support functions as a partial
mediator of these relations. The partial mediation of management support of the relations between
organizational unit size and innovation perception, and organizational unit size and rewards perception,
are presented in Figure 11 and Figure 12.
Management
Support
Organizational Unit
Size
Innovation
Perception-.115*
.561**
-.120**
Figure 11, the (partial) mediation of management support of the relation between organizational unit size and innovation
perception. **
p<.01 *p<.05
Management
Support
Organizational Unit
Size
Rewards
Perception-.115*
.726**
-.141**
Figure 12, the (partial) mediation of management support of the relation between organizational unit size and rewards
perception. **
p<.01 *p<.05
Hypothesis 4 is supported by the results of this study; the relation between organizational unit size and
total climate is fully mediated by management support. The mediating effect has also been found for
the separate climate aspects: clarity (full mediation), innovation and rewards (partial mediation).

47
The results of hypothesis 1, 2, 3, 4 and 5 are summarized in Figure 13. Total climate perception is
directly significantly related to employee engagement, profitability, sustainability & growth, EBIT margin
and productivity (h1). Employee engagement does not mediate the relation organizational climate and
financial/operational performance indicators (h2) Regarding the antecedents of total climate
perception, I have found that management support is significantly related to total climate perception
(h3), and that organizational unit size only has an indirect effect on total climate perception; the relation
between organizational unit size and organizational climate is fully mediated by management support
(h4, h5).
Management
Support
Organizational Unit
Size
Total Climate
Perception
Profitability
Sustainability &
Growth
EBIT Margin
Productivity
Employee Turnover
Employee
Engagement-.115*
.679**
1.165 **(.781**)
Figure 13, overview of the results of hypothesis 1, 2, 3,4 and 5. The numbers in parenthesis are standardized coefficients. A
green line color indicates that there is a significant relation, while a red line indicates that there is no significant relation. The
dashed line indicates that there is not a direct relation, but only an indirect relation.
**
p<.01 *p<.05

48
4.5 The effect of hierarchical level on organizational climate perception
Hypothesis 5 states that organizational climate perception is more positive for employees higher in the
organization. In Table 13, the one-way ANOVA on the individual total climate scores (as well as on the
separate climate aspects), categorized by top management, middle- management and non-management
is presented. Mean total climate scores (as well as the mean separate climate aspects scores) show
significant differences. In general, top management scores are higher than middle management scores,
and middle management scores are higher than non-management scores. The only exception is the
climate aspect standards, for which middle management’s scores are slightly higher than top
management’s scores, but still higher than non-management’s scores. These results broadly support
hypothesis 5, which states that organizational climate perception is more positive for persons higher in
the organizational hierarchy.
Top Management
(N=469)
Middle Management
(N=3717)
Non-management
(N=17646)
F-Ratio
Total climate score 3.787 3.633 3,361 344.870**
Innovation 3.809 3.695 3.333 344.979**
Responsibility 4.021 3.815 3.619 121.539**
Standards 3.501 3.516 3.479 3.817*
Rewards 3.545 3.241 2.796 457.225**
Clarity 4.045 3.891 3.581 330.353**
Table 13, mean scores on total climate score (and climate aspects) for top management, middle management and non-
management. **
p<.01 *p<.05

49
5. Discussion The purpose of this thesis was to investigate the relation between organizational climate and
performance, and to increase the understanding on antecedents of organizational climate. This is tested
by examining how organizational climate affects company performance, and what influence
management support for employees and organizational unit size have on organizational climate
perception. This thesis is a valuable contribution to the literature, because it further establishes the
relation between organizational climate and performance, and it contributes to the understanding of
the antecedents of organizational climate. Additionally, the results of this thesis can be employed by
business managers to undertake focused improvement actions on organizational climate aspects that
have most influence on company performance (see managerial implications).
The results of this study show that total organizational climate perception is positively related to several
company performance indicators: profitability (EBIT per FTE), sustainability & growth (Revenue per FTE),
productivity (number of units produced and sold per FTE), EBIT margin (EBIT/number of units produced
and sold) and employee engagement. A relation between organizational climate and employee turnover
was not identified in this study.
Employee engagement has not been found to mediate the relation between organizational climate and
profitability, sustainability & growth, productivity and EBIT margin. Employee engagement is thus not
the underlying mechanism that clarifies the relation between organizational climate and company
performance. I only found a direct relation between organizational climate and company performance;
organizational climate itself leads to better company performance rather than via employee
engagement. Employee engagement is a (positive) side effect of organizational climate, but not the
explanatory variable for better financial/operational performance.
From the financial/operational performance indicators, profitability is most affected by organizational
climate. The strong impact of organizational climate on profitability is encouraging for climate
advocates; profitability is the main performance indicator for determining the success of a company’s
strategy. If all the other performance indicators are positive, but profitability is negative, company
strategy should be reexamined to see whether it is beneficial to continue the current strategy. Only if
the profitability expectations on the long term (due to the positive other performance indicators) can
compensate for the current unfavorable profitability, the company can continue with the executed
strategy.
Regarding the influence of the separate climate aspects (that build up to the total organizational climate
score), this study also delivers interesting insights. Profitability is most affected by clarity, and least
affected by innovation perception. If the business goals and objectives are clear to employees and they
know what their role is in reaching these business goals, profitability of the operating company seems to
be higher. The direct influence of innovation on profitability is less strong. However, of all the climate
aspects, innovation is strongest related to sustainability & growth. This tends to indicate that innovation
perception is crucial for sustainability and growth, but less important for profitability (on the short
term). The results of the relations between the separate climate aspects and the company performance

50
indicators also indicate that standards and clarity perception have the strongest association with EBIT
margin. Apparently, when ‘standards’ and clarity perception is high within an operating company, the
ratio between EBIT and products produced and sold is also higher, indicating that an operating company
has the ability to get more profit out of its sales. Employee engagement has found to be strongest
related to responsibility. Providing employees with the resources, information and authority to do their
jobs effectively, has important implications for engagement perception among employees.
Another finding of this thesis is that there is a positive relation between management support and
organizational climate, and that the relation between organizational unit size and organizational climate
is mediated by management support. For total organizational climate (and clarity), the impact of
organizational unit size is fully mediated by management support, while for innovation and rewards the
relation is only partially mediated. Thus, total climate score (and clarity perception) are not directly
influenced by organizational unit size, but via management support; management support is impacted
by organizational unit size and total climate (and clarity perception) by management support. For
innovation and rewards perception the relation is only partially mediated by management support,
indicating that other mechanisms than only management support mediate the relation between
organizational unit size and organizational climate. The impact of management support, however, is
significantly higher than the impact of organizational unit size, making management support, of these
two, the most important antecedent for organizational climate.
Additionally, I investigated what the role of employee hierarchy is on the perception of organizational
climate. The results indicate that people higher in the organizational hierarchy perceive organizational
climate more positive than people in lower hierarchical levels; top management has a more positive
climate perception than middle management, and middle management perceives organizational climate
more positive than non-management. This confirms what was found in earlier studies by Payne and
Mansfield (1973) and Patterson et al. (2004). These results have an important methodological
implication: when analyzing organizational climate you should always have a sample that represents the
ratio management non-management of that specific organization.

51
5.1 Strengths, limitations and conclusions
This thesis has several strengths, including the large sample that has been used. An additional strength
of my study is that the company performance indicators also include independent, fact based measures,
instead of only perceptions of company performance.
Nevertheless, this thesis also has some limitations. First, organizational unit size of the operating
companies differs considerably and the operating companies were active on markets in different
countries. This reduces the comparability of the operating companies. Likely, when operating companies
would have been more comparable, more significant relations between organizational climate and
performance would have been identified.
Another limitation of this study is that the model for testing the relation between organizational climate
and performance does not take into account the possible effect of reversed causality. Thus, that better
performance also could lead to a more positive organizational climate. To exclude this possibility for
once and forever, it is necessary to do longitudinal analyses. Including past company performance
indicators, as independent variable in the model to predict present company performance from present
organizational climate, can be used to exclude reversed causality. Results of other studies are
encouraging; for example, Patterson et al. (2004) considered reversed causality in their method, and
found that organizational climate affects company performance, indicating a causal relationship
between organizational climate and company performance.
The items I used to measure organizational climate are measured on a different level of analysis.
Whereas most items are asked on individual level (i.e. ‘ I receive recognition when I do a good job’ or
‘[Name OpCo] business strategy and goals are clear to me’), some items are asked on operating
company level (i.e. ‘Within [Name OpCo] we compare ourselves to the external market to perform
better’ or ‘Employees are encouraged to take reasonable risks’ ). Asking people to give their judgments
for the whole organization is different from only asking them about their own situation. Likely, some
employees are not able to give an accurate answer, as they do not always have a clear picture on the
whole organization. Therefore, it would have been better when the items were asked on individual level
only.
In this study, I considered employee engagement as a psychological state only. This type of engagement
appears to be strongly correlated to organizational climate. It seems that employee engagement has
substantial overlap with organizational climate and that when measuring organizational climate also
employee engagement is partly covered in this measure. To have a construct more distinct from
organizational climate, it would have been better to measure the behavioral aspect of employee
engagement (i.e. discretionary effort). In the line of reasoning I used for employee engagement to be
the mediator between organizational climate and company performance, I assumed that higher
(psychological) states of employee engagement automatically lead to discretionary effort, an
assumption that not has to be necessarily true. It is well possible that psychological state engagement
does not go hand in hand with the behavioral aspect of employee engagement. Possibly, when
considering the behavioral aspect of employee engagement, employee engagement does mediate the
relation between organizational climate and company performance.

52
For this study, it would have been interesting when organizational climate of operating companies could
have been identified for different functions (i.e. Supply chain, Marketing & Sales, Finance, HR). First, this
would give information on how organizational climate of different functions is related to each other.
Besides, organizational climate of different functions could have been related to performance. This
could have given interesting insights on which functional organizational climate has most influence on
bottom line performance.
All together, the results of this study are very meaningful. I have identified strong evidence that
organizational climate affects company performance in terms of profitability, sustainability & growth,
EBIT margin and productivity. Besides, I found that organizational climate leads to higher employee
engagement (psychological state), but that this type of employee engagement is not the explanatory
factor for the relation between organizational climate and company performance.
Regarding the antecedents of organizational climate, I can conclude that managers play an important
role on organizational climate perception of the organizational members. The extent to which
employees have a positive perception of their organizational climate depends strongly on the behaviors
of managers in an organization. Organizational members perceiving high management support, consider
organizational climate considerably better than organizational members with a low management
support perception. There is a relation between organizational unit size and organizational climate, but
this relation is mediated by management support. Not organizational unit size is determinative for
organizational climate perception, but management support for organizational members. Organizational
unit size only makes it more difficult for managers to deliver the management support desired by
organizational members.
Although the results of this study originate from a company active in the fast moving consumer goods
market, the results of this study can be generalized to all type of organizations. Each organization
consists out of people; the organizational climate in which they have to do their work, will affect how
good they perform their tasks, and contribute to business success. The effect of organizational climate
can be expected to be bigger for some type of organizations. For example, for innovative organizations,
for which human capital is the main and sometimes only resource of competitive advantage,
organizational climate will be even of more importance. Times that innovation only was something from
centralized R&D labs have long been gone. To keep pace with fast changing external environments,
innovation should come from employees on all levels and different departments. Organizational climate,
which concerns all employees within an company, therefore, is of main importance in creating the work
environment that stimulates innovative behavior and company performance.
Organizational climate is actually a representation of the perception of human resource practices
employed and implemented by management. This makes it at the same time a measure for both the
type of human resource practice and for how the human resource practice is implemented, giving an
impression of the success of the whole human resource management process. In the final part of this
thesis, I will identify managerial implications that can be used to increase organizational climate, and
thus business results. However, first I will present some recommendations for further research.

53
5.2 Recommendations
A valuable addition to this thesis would be to investigate the moderating role of geographical region on
the relationship between organizational climate and performance. Possibly, for operating companies in
different geographical regions (and cultures), organizational climate is of more importance on
performance than for others.
Another interesting research project would be to examine the moderating role of climate strength on
the relation between organizational climate and performance. Climate strength is the degree of within-
unit agreement among unit members’ climate perceptions. For an organizational climate that is widely
supported and shared among organizational members, the relation between organizational climate and
performance will probably be stronger than for organizational climates in which huge differences exist
among organizational members perceptions’. Preliminary evidence of the positive moderating role of
climate strength on the relation between organizational climate and performance is provided by
Gonza´lez-Roma & Peiro (2002), but additional research is needed to further establish this relation.
Additionally, to exclude effects of reversed causality, longitudinal research projects on the relation
between organizational climate and performance are of importance.
5.3 Managerial Implications
Organizations have to be well aware that organizational climate really matters for bottom line business
results. Therefore, I would first recommend to distribute the results of this report among all
organizational members. First, this will create awareness by (top) management that organizational
climate really matters and that it needs the appropriate degree of attention. Second, employees will feel
that they are of importance to the organization. Below, I summarized several remarks that should be
taken into account for creating a high performance organizational climate.
• Be aware that management must be responsible for organizational climate, rather than the HR
department. HR departments should facilitate actions and improvement, but business should
be in lead, as they are in direct contact with employees. Make managers responsible for
organizational climate perception by including it in part of their performance review. However,
take into account that managers are not the only factor influencing organizational climate.
Furthermore, be aware of the possibility that managers try to influence organizational climate
scores unfairly.
• Steering at organizational climate must be done by all management levels. Line management is
in direct contact with most of the employees in the organization. Though, the effect of senior
management on organizational climate perception should not be underestimated. Therefore,
involve senior management, and let employees feel that they are also valued and supported by
them. This can be done by arranging meetings, in which employees from lower hierarchical
levels get into touch with senior management. For example, let senior management take over

54
the work activities from a blue collar employee for a (part of the) day, or let senior
management have lunch with employees once in a while.
• It is crucial that management knows what is going on the work floor. If management wants their
support to be appreciated, it is indispensible that they know what is valued. Therefore, as a
manager, make free some time every week to chat with your subordinates. Do this in a
structure way, but try to avoid these chats seems planned. To make these chats most effective,
employees should have the idea that it is just an informal conversation.
• Steering on organizational climate must be an everyday business, rather than incidentally taking
improvement actions. Furthermore, it must be a tailored approach for different cultures and
persons; different people have different perceptions.
• Organizational climate is a measure of perception. Therefore, it is very important that
management takes visible actions; organizational members have to perceive that something
has changed/improved in their work environment.
• For large organizations, it cannot be an excuse for management to have a low(er) organization
climate just because of their size. Although, organizational size makes it harder for
management to create a more positive organizational climate, they are responsible their selves
for creating the organizational climate.
• The extent to which organizational members appreciate their organizational climate depends
strongly on the ability of management to provide the necessary management support for its
subordinates. Keep this in mind when assigning persons to managerial positions. A specialist on
a certain field does not have to be a good people manager.
• Employee engagement is only of importance on company performance when the psychological
state of employee engagement leads to discretionary effort. Therefore, introduce actions that
challenge engaged people to do extra work besides their normal activities.
This all looks simple, but in practice, often these ‘’simple’’ things are not that obvious for all
organizations. Great steps in organizational climate can already be made when taking into account these
remarks.
Due to limitations of time and resources, management has to choose which actions on organizational
climate will be most effective to reach desired outcomes. The results of my study are very valuable for
this purpose. Below, I will provide some focused improvement actions on specific aspects of
organizational climate that can be used to affect specific organizational outcomes:
• Employee engagement: Employee engagement can be best stimulated by increasing
organizational climate perception of responsibility. Thus, giving employees the authority,
information, and resources to do their jobs effectively, will be most effective for improving
employee engagement.
• Profitability: profitability of the organization can be improved most effectively by improving
organizational climate perception on clarity. Making clear to organizational members what the
business goals are and how their specific tasks relate to these goals will affect profitability most
effective.

55
• Sustainability & growth / productivity: Sustainability & growth and productivity can be
increased most effectively by improving organizational climate perception on innovation.
Encouraging employees to be innovative and to take reasonable risks will have important
implications for sustainability & growth (revenue generation) and productivity (produced and
sold goods).
• EBIT margin: EBIT margin can be increased most effectively by improving the organizational
climate on standards. Establishing a high standards organizational climate within an operating
company will increase EBIT margin most effectively.
Taking actions on specific climate aspects, always take into account, how much effort it will cost to
increase a certain climate aspect. Likely, it will be easier to improve a certain climate aspect from a low
score to an average score, than from an average score to a high score (diminishing returns). Besides, it is
well possible that certain climate aspects are easier to improve than others.

56
References
Arthur, J.B. (1994). Effects of human resource systems on manufacturing performance and turnover.
Academy of management journal. 37(3): 670-687.
Baer, M. & Frese, M. (2003). Innovation is not enough: climates for initiative and psychological safety,
process innovations, and firm performance. Journal of Organizational Behavior. 24(1):45-68.
Barney, J. (1991). Firm resources and sustained competitive advantage. Journal of Management. 17(1):
99–120.
Baron, R.M. & Kenny, D.A. (1986). The moderator-mediator variable distinction in social psychological
research: Conceptual, strategic and statistical considerations. Journal of Personality and Social
Psychology. 51(6): 1173-1182
Becker,B. & Gerhart,B. (1996). The impact of human resource management and organizational
performance: progress and prospects. Academy of Management Journal. 39(4): 779-801.
Borucki, C.C. & Burke, M.J. (1999). An examination of service-related antecedents to retail store
performance. Journal of Organizational Behavior. 20(6): 943-962.
Bowen, D.E. & Ostroff, C. (2004). Understanding HRM-frim performance linkages: the role of the
‘strength’ of the HRM system. Academy of Management review. 29(2): 203-221.
Burke, M.J., Finkelstein, L.M. & Dusig, M.S. (1999). On Average Deviation Indices for Estimating
Interrater Agreement. Organizational research Methods. 2(49): 49-68.
Corporate Leadership Council. (2004). Driving performance and retention through employee
engagement.
Corporate Research Forum. (2010). Employee engagement and organizational performance.
Cropanzano, R. Mitchell, M.S. (2005). Social Exchange Theory: An Interdisciplinary Review. Journal of
Management. 31(6): 874-900
Den Hartog, D.N., Boon, C.T. & Verburg, R.M. (2009). HRM, Satisfaction and performance: A multilevel
test, Paper presented at the 6th HRM Network Conference, Amsterdam, November, 13 - 14, 2009.
Denison, D.R. (1996). What is the difference between organizational culture and organizational climate?
A native’s point of view on a decade of paradigm wars. Academy of management review. 21(3): 619-654.
Dietz, J., Pugh, S. D. & Wiley, J. (2004). Service climate effects on customer attitudes: An examination of
boundary conditions. Academy of Management Journal. 47(1): 81-92.

57
Gallup (2006). Engagement predicts earnings per share.
Gelade, G.A. & Ivery, M. (2003). The impact of human resource management and work climate on
organizational performance. Personnel Psychology. 56(2): 383-404.
Gonza´lez-Roma, V. & Peiro, J.M.(2002). An Examination of the Antecedents and Moderator Influences
of Climate Strength. Journal of applied psychology. 87(3): 465-473.
Harter, J.K., Schmidt, F.L., & Hayes, T.L. (2002). Business-unit-level relationship between employee
satisfaction, employee engagement, and business outcomes: A meta-analysis. Journal of Applied
Psychology. 87(2): 268-279.
Hay/McBer. The Organizational Climate Dimensions (1995). Boston, Mass: McBer and Company.
Hofmann, D. & Mark, D. (2006). An investigation of the relationship between safety climate and
medication errors as well as other nurse patient outcomes. Personnel Psychology. 59(4): 847-869.
Huselid, M.A. (1995). The impact of human resource practices on turnover, productivity, and corporate
financial performance. Academy of Management journal. 38(3): 635-672.
James, L. R., Demaree, R. G. & Wolf, G. (1993). rwg: An assessment of within-group interrater
agreement. Journal of Applied Psychology. 78(2): 306-309.
Johnson, J.W. (1996). Linking employee perceptions of service climate to customer satisfaction.
Personnel psychology. 49(4): 831-851.
Kaplan, R.S. & Norton, D.P. (1992). The balanced scorecard :measures that drive performance. Harvard
Business review. Best of HBR 1992.
Jung, D.I., Chow, C. & Wu, A. (2003). The role of transformational leadership in enhancing organizational
innovation: Hypothesis and some preliminary findings. The Leadership Quaterly. 14(4-5):525-544.
Koene, B.A.S., Vogelaar, A.L.W. & Soeters, J.L. (2002). Leadership effects on organizational climate and
Financial performance: local leadership effect on chain organizations. The leadership quarterly. 13(3):
193-215.
Koys, D. J. & DeCotiis, T. A. (1991). Inductive measures of psychological climate. Human Relations.
44(3): 265–285.
Kuenzi, M. & Schminke, M. (2009). Research Agenda for the Organizational Work Climate Literature
Assembling Fragments Into a Lens: A Review, Critique, and Proposed. Journal of Management. 35(3):
634-717.
Lado, A. A. & Wilson, M. C. (1994). Human resource systems and sustained competitive advantage: A
competency-based perspective. Academy of Management Review. 19: 699-727.

58
Little, B. & Little, P. (2006). Employee engagement: conceptual issues. Journal of Organizational Culture,
Communications and Conflict. 10(1):111-120.
Litwin, G.H. & Stringer, R.A.(1968). Motivation and Organizational Climate. Boston, Mass: Harvard
University Press.
Macey, W.H. & Schneider, B. (2008). The meaning of employee engagement. Industrial and
Organizational Psychology. 1: 3-30.
MacLeod, D. & Clarke, N. (2009). Engaging for success: enhancing performance through employee
engagement. Department for Business, Information and Skills, London.
Mercer (2009). Engaging employee to drive global business success.
Patterson, M., Warr, P., West, M. (2004). Organizational climate and company productivity: The role of
employee affect and employee level. Journal of Occupational and Organizational Psychology. 77(2):
193-216.
Payne, R. L. & Mansfield, R. (1973). Relationships of perceptions of organizational climate to
organizational structure, context, and hierarchical position. Administrative Science Quarterly. 18(4):515–
526.
Pirola-Merlo, A. & Mann, L. (2004). The relationship between individual creativity and team creativity:
Aggregating across people and time. Journal of Organizational Behavior, 25(2): 235-257.
Pritchard, R.D. & Karasick, B.W. (1973) The Effects of Organizational Climate on Managerial Job
Performance and Job Satisfaction. Organizational Behavior and Human Performance. 9(1): 126-146.
Richardson, H. A. Vandenberg, R. J.(2005). Integrating managerial perceptions and transformational
leadership into a work-unit level model of employee involvement. Journal of Organizational Behavior.
26(5): 561-589.
Rogg, K.L., Schmidt, D.B., Shull,C. & Schmitt, N. (2001). Human resource practices, organizational
climate, and customer satisfaction. Journal of Management. 27(4): 431–449
Schneider, B. & Reichers, A.E. (1983). On the etiology of climates. Personnel Psychology. 36(1):19-40.
Schuler, R.S. & Jackson, S.E. (2007). Strategic Human Resource management (second edition). Blackwell
Publishing Ltd.
Smith, K. G., Collins, C. J., & Clark, K. D. (2005). Existing knowledge, knowledge creation capability, and
the rate of new product introduction in high-technology firms. Academy of Management Journal, 48:
346-357.
Snow, J.L. (2002). Enhancing Work Climate to Improve Performance and Retain Valued Employees.
JONA. 32(7-8): 393-397.

59
Towers Perrin-ISR (2006). ISR Employee Engagement Report.
Towers Perrin (2003). Working today: understanding what drives employee engagement. The 2003
Towers Perrin talent report.
Verburg, R.M. & Den Hartog, D.N. (2006). Human resource management for advanced technology.
Published in Verburg, R.M. Ortt, R.J. Dicke,W.M. (Eds.) (2006). Managing Technology and Innovation: an
introduction. London: Routledge.
Wallace, C. & Chen, G. (2006). A multilevel integration of personality, climate, self-regulation, and
performance. Personnel Psychology. 59(3): 529-557.
Watkin, C. Hubbard, B. (2003) Leadership motivation and the dirvers of share price: the business case for
measuring organizational climate. Leadership & Organization Development journal. 24(7): 380-386.
Wright, P.M. & Nishii, L.H. (2010). Strategic hrm and organizational behavior: Integrating multiple levels
of analysis. In D.E. Guest & J. Paauwe & P.M. Wright (Eds.), Human resource management and
performance: Progress and prospects. Oxford, UK: Blackwell Publishing.

60
Appendices
Appendix 1: climate dimensions from the literature
Koys and DeCotiis (1991) identified over 80 different separate labeled dimensions of climate in
literature. To reduce these number of dimensions to a manageable (and comprehensive) set of
dimensions they applied the following decision rules on these dimensions: the measure had to be a (1)
a measure of perception, (2) had to be a measure evaluating (not describing) activities, and (3) could not
be an aspect or task of organizational structure. After this first selection, they categorized the remaining
dimension into eight new dimensions, which can be found in Table 14.
Dimension Definition
Autonomy The perception of self-determination with respect to work procedures, goals
and priorities.
Cohesion The perception of togetherness or sharing within the organization setting,
including the willingness of member of provide material aid.
Trust The perception of freedom to communicate openly with members at higher
organizational levels about sensitive or personal issues with the expectation
that the integrity of such communications will not be violated.
Pressure The perception of time demands with respect to task completion and
performance standards.
Support The perception of the tolerance of member behavior by superiors, including
the willingness to let members learn from their mistakes without fear of
reprisal.
Recognition The perception that member contributions to the organization are
acknowledged.
Fairness The perception that organizational practices are equitable and non- arbitrary
or capricious.
Innovation The perception that change and creativity are encouraged, including risk taking
into new areas or areas where the member has little or no prior experience.
Table 14. Definition of each of the eight dimensions of the Universe of psychological climate dimensions (Koys & DeCotiis,
1991)
Another set of dimensions to measure organizational climate is presented by Pritchard and Karasick
(1973). Using a literature research and interviews with managers of several different organizations, they
selected the dimensions on: (1) expected stability and clarity, (2) theoretical relevance, and (3)
importance in light of past research. The eleven scales they used are presented in Table 15.

61
Dimension Definition
Autonomy degree of freedom managers have in day-to-day operating
decisions such as when to work, when not to work, and how to
solve job problems.
Conflict vs cooperation degree to which managers either compete with each other or work together in
getting things done and in the allocation of scarce resources such as materials,
clerical help, etc.
Social relations degree to which the organization has a friendly and warm social atmosphere.
Structure degree to which the organization specifies the methods and procedures used
to accomplish tasks; the degree to which the organization likes to specify and
codify, and write things down in a very explicit form.
Level of rewards degree to which managers are well rewarded; this includes salary, fringe
benefits, and other status symbols.
Performance-reward
dependency
extent to which the reward system (salary, promotions, benefits, etc.) is fair
and appropriate; degree to which these rewards are based on worth, ability,
and past performance rather than factors such as luck, who you know, how
well a manager can manipulate people, etc.
Motivation to achieve degree to which the organization attempts to excel; the strength of its desire to
be number one. A high rating reflects a lack of complacency even in the face of
good profits, growth, etc.
Status polarization degree to which there are definite physical distinctions (e.g., special parking
places and office decorations) as welt as psychological distinctions (informal
social boundaries, treatment of the subordinate as inferior, etc.) between
managerial levels in the organization.
Flexibility and innovation willingness to try new procedures and experiment with change which is not
really necessary due to some potential crisis situation, but rather to improve a
situation or process which
may currently be working satisfactorily.
Decision centralization extent to which the organization delegates the responsibility for making
decisions either as widely as possible or centralizes it as much as possible.
Decentralization includes the idea of shared authority in decision making.
Supportiveness: degree to which the organization is interested in and is willing to support its
managers in both job- and non-job-related matters. The organization's degree
of interest in the welfare of its managers.
Table 15. The 11 scales to measure organizational climate by Pritchard and Karasick (1973)
Interest for Organizational climate measures also arises from a managerial perspective, as it gives
valuable insights for focused performance improvement (Watkin & Hubbard, 2003). Hay group/McBer
(1995), inspired by the work of Litwin and Stringer (1968), identified 6 dimensions of organizational
climate that have consistently demonstrated a direct effect on individual and work-unit level
performance (Watkin & Hubbard, 2003). An overview of these dimensions is presented in Table 16.

62
Dimension Definition
Flexibility the feeling employees have about constraints in the workplace; the
degree to which they feel there are no unnecessary rules,
procedures, policies, and practices that interfere with task
accomplishment, and that new ideas are easy to get accepted.
Responsibility the feeling that employees have that a lot of authority has been
delegated to them. It is also the degree to which they can run their
jobs without having to check everything with their boss
and feel fully accountable for the outcome.
Standards the emphasis that employees feel management puts on improving
performance and doing one’s best, including the degree to which
people feel that challenging but attainable goals are set for both
the organization and its employees.
Rewards Rewards are the degree to which employees feel that they are
being recognized and rewarded for good work, and that such
recognition is directly and differentially related to levels of
performance.
Clarity the feeling that everyone knows what is expected of them and that
they understand how those expectations relate to the larger goals
and objectives of the organization.
Team Commitment the feeling that people are proud to belong to the organization and
will provide extra effort when needed. It is also the feeling that
people trust that everyone is working toward a common objective.
Table 16. The dimensions of organizational climate by Hay group/McBer (1995), definitions from Snow (2002) (pp. 394)

63
Appendix 2: items of the organizational climate aspects measures
A. Innovation
1. I am encouraged to learn from others (colleagues, other departments, comparison with other
companies)
2. I am encouraged to be innovative in my job (i.e., to come up with new or better ways of doing
things)
3. Employees are encouraged to take reasonable risks (e.g., try new ideas, new ways of doing
things)
4. My job provides me with the opportunity to learn new skills and develop new talents
B. Responsibility
1. I have the resources (tools, systems, et cetera) I need to do my job effectively
2. I have the information I need to do my job effectively
3. I have enough authority to carry out my job effectively
C. Standards
1. Within [Name OpCo] we compare ourselves to the external market to perform better
2. How would you rate [Name OpCo]on responding effectively to changes in the business
environment?
3. How would you rate [Name OpCo] on being customer focused (seeking to understand and meet
it's internal and external customers' needs and requirements)?
4. [Name OpCo] is effective in implementing decisions that have been made
D. Rewards
1. I believe I am paid fairly for the work I do
2. The better my performance, the better my pay will be
3. I receive recognition when I do a good job
4. The better my performance, the better my opportunity for career advancement
E. Clarity
1. [Name OpCo] business strategy and goals are clear to me
2. The objectives of my Department are clear to me

64
3. I understand the relationships between my job and [Name OpCo]'s overall direction and goals
4. I understand the relationships between my job and my Department's overall direction and goals
5. I believe the way [Name OpCo] operates on a day-to-day basis is consistent with its business
direction and goals
6. I believe the way my Department operates on a day-to-day basis is consistent with its business
goals
7. I have a clear picture on how [Name OpCo] sees my career
8. I have a clear understanding of how my job performance is judged

65
Appendix 3: items of the management support measure
F. Management Support
1. My direct manager keeps me informed keeps me informed about important company
developments
2. My manager stimulates me to improve my performance
3. I have trust and confidence in my direct manager
4. Day to day decisions of and actions of my direct manager are consistent with his/her words
5. My direct manager provides clear and regular feedback on my performance
6. How would you rate your direct manager on: dealing fairly with with everyone, playing no
favourites
7. How would you rate your direct manager on: Being accesible/available when you need him or
her
8. Rate your manager on coaching/counseling you in your career development

66
Appendix 4: items of the employee engagement measure
G. Employee Engagement
1. I feel proud to work for [Name OpCo]
2. How would you rate [Name OpCo] on taking a genuine interest in the well - being of its
employees
3. Considering everything, how would you rate your overall satisfaction working for [Name OpCo]
at the present time