The Redfern Review - BritainThinksbritainthinks.com/pdfs/TW082_RR_online_PDF.pdf · – 3 – THE...
68
e Redfern Review into the decline of home ownership
Transcript of The Redfern Review - BritainThinksbritainthinks.com/pdfs/TW082_RR_online_PDF.pdf · – 3 – THE...

The Redfern Review
into the decline of home ownershipT
HE
RE
DF
ER
N R
EV
IEW
INT
O T
HE
DE
CL
INE
OF
HO
ME
OW
NE
RS
HIP

“The report provides important information on the long-term link between housing supply and its affordability, and endorses the call for more housebuilding. It is vital that the government continues to invest into affordable homes, to open the door to both ownership and renting, by helping housing
associations to boost supply.
g15 strongly endorses the other main message of the inquiry that meeting housing needs is best achieved through a long-term partnership including government, housebuilders, local authorities, politicians and housing associations. By working together we can increase the number of homes we
build, and finally address the shortage of properties to buy and rent in the UK.”g15
“The Review is a welcome addition to the debate on housing. Home ownership is an aspiration for the majority of people who see it as a major stepping stone in life that provides them and
their family with security and confidence. As the Review identifies, the key to addressing housing need is developing policies that enable housing supply to match demand over the long term. If politicians can provide a consistently pro development policy framework, the industry can deliver the required number of homes, both for ownership and rent, and address the issues
Redfern highlights so clearly.” Home Builders Federation
“The very commissioning of the Redfern Review recognises the central role that home ownership plays in society, in the economy, in national life. Importantly the conclusions that Pete Redfern
and his Commissioners have reached show that this centrality is part of a much larger and multi-faceted picture – where people are living longer, settling down later, renting longer, struggling
with affordability, not just a huge cumulative housing deficit – and that short term solutions to grab headlines won’t make a strategic shift in house building, or truly help those buying or renting. We fully support the concept of a cross-party strategy to housing supply, and across all the tenures,
that looks ahead over decades rather than years.”RICS
“The conclusions of the Redfern Review are well timed and significant, with their focus on increased housing supply across all tenures to provide long term stability in the housing market.
This must be a fundamental way of preventing further erosion of access to home ownership. What resonates most is that we need long term planning and housing policies to achieve long term
housing market stability.”Savills
16 November 2016

ContentsF O R E W O R D
John Healey MP, Shadow Secretary of State for Housing 2Pete Redfern, CEO Taylor Wimpey 3
R E D F E R N R E V I E W
Acknowledgements 4Biographies 6Introduction and context 7The Oxford Economics model of the housing market 9Executive Summary 11Policy options 17
PA R T O N E : H O M E O W N E R S H I P
The causes of the decline in home ownership since its peak 19CHAPTER 1: What has been happening to home ownership
in England and the UK? 20CHAPTER 2: Why does the decline in home ownership matter? 23CHAPTER 3: What have been the causes of the decline in home ownership? 27CHAPTER 4: Would more housing supply increase home ownership? 33CHAPTER 5: What can be done to increase home ownership? 34CHAPTER 6: Policy challenges to increasing home ownership 36CHAPTER 7: Policy discussion – home ownership 42Policy options – Part one 45
PA R T T W O : T H E H O U S I N G M A R K E T
The causes of the increase in house prices since 1996 46CHAPTER 8: What have been the causes of the increase in house prices? 47CHAPTER 9: House prices, affordability and availability 50CHAPTER 10: Challenges to increasing housing supply and availability 56CHAPTER 11: Policy discussion – the housing market and supply 59Policy options – Part two 62References 64
– 1 –THE REDFERN REVIEW INTO THE DECLINE OF HOME OWNERSHIP

– 2 –THE REDFERN REVIEW INTO THE DECLINE OF HOME OWNERSHIP
R E D F E R N R E V I E W
The Redfern Review is the first major inquiry into home ownership in over a decade. It sets out the causes of the recent decline in home ownership with unprecedented analytical rigour and detail, drawing on extensive new modelling done by Oxford Economics, as well as bespoke national polling, focus groups and wide-ranging input from housing professionals and experts.
This is an independent review. Its work and conclusions are the Review’s own rather than mine or Labour’s. But it sets the basis for my determination to put widening the opportunity for home ownership at the heart of Labour’s approach to housing.
Under the Labour government between 1997 and 2010 a million more households became home owners, but since 2010 the number of home owners has fallen by 200,000, with the decline particularly sharp for young people.
This isn’t a problem for one Party, it’s a problem for our country. Most of us own a home or want to, and want the same for our children. But increasingly young people on modest incomes who can’t rely on significant financial help from parents or grandparents are locked out of owning a home.
Wanting to help boost ownership is in Labour’s DNA. In our 1965 housing White Paper, on which Harold Wilson would fight the 1966 general election, Labour promised that: “The expansion of building for owner occupation… reflects a long-term social advance which should gradually pervade every region.”
In 1971 Tony Crosland, a former Cabinet Minister with responsibility for housing, boasted that it was “under a Labour government [that] more than half the householders in England and Wales were home-owners”, and pledged that “both as Party and as individuals we are strongly in favour of home ownership”.
The seminal 1977 Labour Green Paper on housing led by Peter Shore, later Michael Foot’s Shadow Chancellor, set out as a founding objective of Labour housing policy that “people should have a reasonable chance of getting the kind of house they want” and vowed that “this will involve widening the way into home ownership”.
And it was the Labour government in which I served for nine years under Tony Blair and Gordon Brown that prioritised home ownership. Our shared ownership and equity share schemes, under the umbrella of ‘HomeBuy’, became the post-2010 Coalition government’s ‘Help to Buy’ programme.
At root, the decline in home ownership matters for Labour because it matters to so many people in this country that we are determined to serve. And it matters too because the shrinking opportunity for young people on ordinary incomes to own a home is at the centre of the growing gulf between housing ‘haves’ and housing ‘have-nots’. Housing is at the heart of widening wealth inequality in our country. Labour is determined to tackle this and this Review gives us, and politicians of all parties, the foundation to do that.
My huge thanks to Pete Redfern and his team. He has put so much work into this Review over the last year. And my thanks also to the expert Advisory Panel of Terrie Alafat CBE, Dame Kate Barker CBE, Andy Gray and Ian Mulheirn, to the Smith Institute who hosted the Review, and to all those who have helped with or fed in to the Review.
John Healey MP,SHADOW SECRETARY OF STATE FOR HOUSING
John Healey MPShadow Secretary of State for Housing

– 3 –THE REDFERN REVIEW INTO THE DECLINE OF HOME OWNERSHIP
R E D F E R N R E V I E W
Pete RedfernCEO Taylor Wimpey
This Review has been one of the most challenging tasks that I have ever undertaken. We have distilled a huge amount of information and analysis, whilst trying to stay true to our scope, our underlying principles and a genuine desire to make suggestions for areas of discussion and policy that have the potential to improve the opportunities for home ownership for young people, and the overall health and fairness of our housing market.
This is an incredibly important area. Housing affects us all in a myriad of ways, from financial security to relationships and health and wellbeing, and affects the life choices that people are able to make. We all know that there are no silver bullets that will change the affordability and accessibility of housing in our country.
At the beginning of this Review, I was inevitably asked whether I could be independent, given my ‘day job’ as a developer. I will not pretend that my experience as a developer does not give me a particular set of experiences and beliefs, and I have tried to make sure as we go through this process that we have used analysis and rigour to reach our conclusions, and that I challenge my own preconceptions. I am absolutely confident that in our intent in this Review, we have remained true to our goal – to put forward thoughts that help us to understand the drivers of home ownership and the housing market in a way that will enable us to benefit current and future first time buyers and home owners in a more sustainable way.
We have divided our conclusions between those that directly impact on home ownership, and those that have a more general effect on the housing market. The two must be taken together to have real meaning and impact.
On home ownership, our key finding is that the drivers of the reduction in home ownership over the last 12 years are macroeconomic, and closely connected with the relative financial strength of young people compared to older generations. We can make policy changes in housing that help mitigate some of these impacts, but if these trends continue, then the long-term impacts will not be limited purely to housing. We also conclude that it is vital that policy focuses consistently on all tenures rather than just private home ownership.
On the broader housing environment, our unsurprising conclusion is that it is supply that can make the difference. However it is supply over the long-term – the very long-term. Our policy suggestions in this area therefore are heavily weighted towards long-term strategy and cross-party and independent support for sustainable policies. I do believe that short-termism is the biggest problem that we have to deal with in policy setting.
Beyond these two headline conclusions, I have also been struck by the damage that is done to delivering long-term solutions and consistency by the tendency to play a ‘blame game’. Whether we are blaming local authority planners, housing developers, ‘NIMBY’ neighbours or Government departments, this approach is rarely productive, often unsubstantiated and distracts from the common goal.
Lastly, I would thank John Healey for giving me the opportunity to undertake this important work, and I offer my eternal thanks to the Panel and Review team for their time, effort and support, and for bearing with me as I worked out what a Review of this nature was actually about and as we together tried to create a report that was honest, interesting and could genuinely make a difference.
Pete Redfern,CEO TAYLOR WIMPEY

– 4 –THE REDFERN REVIEW INTO THE DECLINE OF HOME OWNERSHIP
R E D F E R N R E V I E WR E D F E R N R E V I E W
The Review has come together through the hard work of a number of people, to whom I would like to extend my sincere thanks and appreciation for their contribution.
First and foremost I must thank John Healey MP, Shadow Secretary of State for Housing, for commissioning the Review.
Special thanks go to the Panel who have been a constant source of expertise, support and enthusiasm. It has been a pleasure to work with you all.
Panel Terrie Alafat CBE (President CIH)
Dame Kate Barker CBE
Andy Gray
Ian Mulheirn (Oxford Economics)
Review teamSpecial thanks also go to our Review team, who either on formal secondment, or by giving up their own time have formed the back bone of the work done. These are: Lara Jane Bell, Anthony Codling, Jennie Daly, James Hall, Katie Jones, Ravail Marwaha, Jess Miln, George Playford, John-Paul Stichbury, and Chris Walker. Our thanks go to KPMG, Jefferies and Taylor Wimpey for allowing their members of staff to spend time on the Review.
I would also like to thank the following:
Financial contributors Bond Dickinson
DAC Beachcroft
大成 Dentons
Eversheds
G15
Gateley
Gowling WLG
Osborne Clarke
ContributorsAffinity Sutton
Anchor
Lord Richard Best
Britain Thinks
Capital Economics
CML
High Fliers Research
Hometrack
Jefferies
KPMG
London First
Geoff Meen
Notting Hill Housing
Osborne Clarke
Oxford Economics
Resolution Foundation
RICS
Savills
Smith Institute
Lord Matthew Taylor
Yorkshire Building Society
RoundtablesLondon, kindly hosted by SavillsNicholas Yeeles – A2 Dominion Group
Richard McCarthy CBE – Capita
Rod Cahill – Catalyst Housing Group
Jennet Siebrits – CBRE
Mark Rogers – Circle Housing Group
John Beresford – Grainger plc
Jan Crosby – KPMG
Acknowledgments

– 5 –THE REDFERN REVIEW INTO THE DECLINE OF HOME OWNERSHIP
R E D F E R N R E V I E WR E D F E R N R E V I E W
Jerome Geoghegan – L&Q Housing Group
Richard Cook – Lendlease
John Dickie – London First
Brian Johnson – Metropolitan Housing Group
Killian Hurley – Mount Anvil Limited
Joe Sarling – Nathaniel Litchfield & Partners
Kate Davies – Notting Hill Housing Group
Mick Sweeney – One Housing Group
Stephen Howlett – Peabody
Phil Hooper – RBS
Neal Hudson – Savills
John Synnuck – Swan Housing Association
Katy Warrick – Savills
Nick de Lotbiniere – Savills
Birmingham, kindly hosted by KPMGWaheed Nazir – Birmingham City Council
Ian Burns – Cameron Homes Ltd
Bob Pannell – CML
Andy Cardoza – KPMG
Harry Mears – KPMG
Lindsay Judge – Resolution Foundation
Leeds, kindly hosted by Yorkshire Building SocietyAtam Verdi – Aspinall Verdi
Andy Radcliffe – ESH Group
Glen Bramley – Heriot-Watt University
Chris Brown – Igloo
Greg Robinson – Incommunities
Andrew Kempston-Parkes – Kempston-Parkes Chartered Surveyors
Ian Dunsire – Legal & General Homes
Justin Gartland – Nathaniel Litchfield & Partners
Kris Brewster – Skiption Building Society
Lauren Pyrah – Yorkshire Building Society
Call for Evidence submissions Ashlar Group
Ian Campbell
Cluttons
Jonathan Davis Wealth Management
Equity Release Council
Geoff Meen
Generation Rent
HBF
Hometrack
The Housing Forum
Joseph Roundtree Foundation
Simon Lynton-Jenkins
Dermot McKibbin
Nathaniel Litchfield & Partners
NHF
Luke Peckham
The Peel Group
RentPlus
RIBA
RICS Member Survey
Rural Solutions
Savills
Shelter
Chris Sleazakowski
Thirteen Group
Unite
Adam Wyn-Jones

– 6 –THE REDFERN REVIEW INTO THE DECLINE OF HOME OWNERSHIP
R E D F E R N R E V I E WR E D F E R N R E V I E W
Pete RedfernPete Redfern was appointed to the post of Chief Executive of Taylor Wimpey plc in July 2007, following the merger between George Wimpey plc and Taylor Woodrow plc, and has full day to day operational responsibility for the business. Prior to the merger, Pete was Group Chief Executive of George Wimpey plc and before that, successively held the posts of Finance Director and Chief Executive of George Wimpey’s UK Housing business.
Pete is a non-executive director and member of the Remuneration Committee of Travis Perkins plc, a trustee of the homelessness charity CRISIS, a member of the Board of the Home Builders Federation and a Fellow of the Royal Institution of Chartered Surveyors.
Pete is married to Claire, they have five children and live in Oxford. His interests include furniture making and other woodwork, running, playing football, watching rugby, trekking, painting and history.
The Panel MembersTerrie Alafat CBETerrie Alafat CBE is the Chief Executive at the Chartered Institute of Housing. Terrie joined CIH in April 2015 from the Department for Communities and Local Government, where she was Director of Housing.
Terrie worked in the Civil Service from 2003, covering various housing policies including homelessness, supporting people, affordable housing and housing supply. Before moving to the UK 30 years ago, she was involved in educational research and evaluation in Chicago schools.
She started her career in the UK in social services policy development at a local authority and she was Director of Housing and Corporate Strategy at Kensington and Chelsea until 2002, before moving to the Government Office for London where she was responsible for housing and local government.
Dame Kate Barker CBEDame Kate Barker CBE is presently a member of the Jersey Fiscal Policy Panel, and an independent non-executive director of Taylor Wimpey plc and the Yorkshire Building Society. Kate is also Chairman of Trustees for the British Coal Staff Superannuation Fund.
Previously, Kate Barker was a member of the Monetary Policy Committee of the Bank of England from 2001 until May 2010. During this period, she also led two major policy reviews for Government, on housing supply and on land use planning.
Before joining the MPC she was Chief Economic Adviser at the CBI (1994-2001) and in 1996-1997 a member of HM Treasury’s Panel of Economic Advisors. Prior to this, Kate has worked as a Research Officer at the National Institute of Economic and Social Research and was Chief European Economist at the Ford Motor Company in Brentwood, from 1985-1994.
Andy GrayAndy Gray was most recently the Managing Director of Mortgage Lending at Barclays Bank, from 2004-2015, and was previously Head of Products, UK Mortgages, a post he held from 2001.
Andy originally joined Barclays in 1997 from Bank of Ireland where he was Marketing Manager, having worked in both savings and mortgage business. Prior to Bank of Ireland, he spent 6 years working for Abbey National.
Andy was responsible for designing and introducing Barclays’ flexible mortgage products including the UK high streets first offset and flexible mortgages.
Andy has also held the positions of Deputy Chairman of the CML and is a member of the Executive Committee.
In August 2015 Andy’s contribution to the mortgage industry was recognised when he received the British Mortgage Awards Lifetime Achievement Award.
Ian MulheirnIan Mulheirn has been Director of Consulting at Oxford Economics, a global economics consultancy, since 2013. Before moving to Oxford Economics Ian was Director of the Social Market Foundation, a Westminster economics and public policy think tank, from 2008-2013.
Prior to the SMF, Ian was an economic adviser at HM Treasury where, as well as providing policy advice, he undertook extensive labour market and tax analysis.
Ian has worked in a variety of policy areas including savings and investment, welfare to work and child poverty. He was a specialist adviser to the House of Commons Work and Pensions Committee inquiry into the Work Programme, and until recently he sat on the Mayor of London’s Employment and Skills Working Group. In 2014 Ian won the Society of Business Economists’ Rybczynski Prize.
Biographies

– 7 –THE REDFERN REVIEW INTO THE DECLINE OF HOME OWNERSHIP
R E D F E R N R E V I E WR E D F E R N R E V I E W
Introduction and context
1. The Redfern Review was commissioned by Shadow Secretary of State for Housing, John Healey MP, in October 2015. The Review is an independent review of the causes of falling home ownership, and associated housing market challenges, and highlights areas for debate and future policy development. It is not a policy review for the Labour Party. The Review has been led by Pete Redfern, the Chief Executive of Taylor Wimpey plc, assisted by a team of informed analysts working on a personal or seconded basis. The Review team has been supported and challenged by a strong independent Advisory Panel with external modelling for the Review commissioned from Oxford Economics. All the views expressed in this report are those of the Review team.
2. The starting point for the Advisory Panel and Review team was to challenge the extent to which home ownership is a positive. There is no absolute answer to this question. The rate of home ownership peaked in England at 71% and home ownership rates in excess of 70% are sustained in a number of countries today. However, the conditions needed to achieve and sustain high rates of home ownership can be artificial and undesirable. Subsidising home ownership can increase economic volatility by increasing demand; it can also weaken financial stability as lenders are encouraged to take greater risks with mortgage lending.1 However, following consideration, we take the view that a long-term decline towards 60% and below frustrates the legitimate desire of most people to own a home.
The key questions asked:3. The scope of the Review has focused on three main
areas. The first is our main ‘textbook’ question: What were the main causes of the decline in home ownership from its peak to 2015?
The second question is broader and focuses on the main aim of the Review, which is to stimulate constructive and cross-party debate: How can we reframe the debate to enable development of better policies that will sustainably raise the rate of home ownership in the housing market?
Lastly, the Review team was aware from the very beginning of the review process that dealing with home ownership in isolation from the wider housing market is unlikely to be fruitful. It therefore turned the above question on its head by asking: What areas for discussion and specific policies can government(s) focus on to support a housing market in which sustainable home ownership can thrive, alongside a range of other affordable housing options?
The key principles:1. The first key principle, established before the
formal launch of the Review in February 2016, is that any meaningful change in the rate of home ownership has to be sustainable. We are strongly of the view that one of the chief weaknesses in housing policy is short-termism. This appears to have been an increasing tendency over the last fifteen years, as the issue of housing has moved further and further up the political agenda. This view was expressed repeatedly in responses to our call for evidence. Quick wins and short-lived improvements, in either the rate of home ownership or in the accessibility of housing, are often not meaningful and frequently serve to exacerbate the volatility of the housing market and consequential unfairness between different participants.
2. The second key principle is that solutions seeking to improve home ownership without giving consideration to the consequential impacts on other housing tenures are unlikely to be successful. It is inevitable, and acceptable, that governments make trade-offs. But these need to be carefully considered and tested, to ensure that the entire system is not distorted or damaged in the process. A healthy housing market needs stable conditions in all main tenures.
3. In addition, the Review has been conducted with the view that for some housing is a service, whereas for others it is a capital investment for security and growth. For others it falls somewhere in between. For different home buyers and users at different life stages, these issues interplay and drive behaviour. The balance between them is of significant importance.

– 8 –THE REDFERN REVIEW INTO THE DECLINE OF HOME OWNERSHIP
R E D F E R N R E V I E W
The methodology:1. As part of the evidence base for this Review, we have
created a new housing market model to uncover the drivers of past changes in house prices and home ownership, challenge our assumptions, generate forecasts of the likely future path for home ownership, and test some policy scenarios. The model has been built by Oxford Economics and its outputs are drawn on extensively throughout this report. No modelling can ever fully represent real world conditions, but we believe that it offers new perspectives which are useful. We also conducted a series of data and opinion gathering exercises including, but not limited to:
• Round table events with industry professionals in London, Birmingham and Leeds
• Focus groups with renters and owner occupiers• Polls of the general population ascertaining their
attitudes to home ownership• A call for evidence to industry professionals and
the general public• A survey of RICS members• A series of meetings with housing and
industry experts
2. Whilst the issue of home ownership is a complex socio-economic and political one, it is important to remember that it is also a deeply personal issue that affects everyone, impacting on lifestyle and life choices. Our aim is to improve the housing options for all, with a particular focus on young people. We have tried to keep that personal angle at the forefront of our minds in conducting this Review.
Nature of outputs:3. The intention of this Review is to stimulate and add to
a healthy debate. We hope it will make a long-lasting impact. As already alluded to, as housing has become more and more politically important, the debate risks becoming focused purely on short-term solutions, targets and, most destructively of all, point-scoring. Whilst we draw up policy options for consideration, we believe that the most important outputs are our two underlying conclusions. If we approach housing market issues in a long-term, principle-driven way, being clear about our objectives and underlying drivers of the market, then policy development will improve significantly.
4. We do believe that all of the major political parties take the issue of housing very seriously and understand many of the key underlying issues. However, the lack of a proper, long-term strategy has often resulted in insufficient sustainability, continuity and coherence of housing policy. So the aim of this Review is to try to reframe the debate to enable a stronger focus on meaningful long-term solutions. The precise sharing of the benefits and challenges of housing in the UK will remain a political and market issue, but it is in all of our interests to have a housing market that can provide for the reasonable requirements and aspirations of all.
Political and market environment 1. During the latter stages of the Review, the result of
the EU Referendum in June 2016 changed the outlook for the country, and we now have a new Prime Minister and refreshed Cabinet. This presents an opportunity for this Review to make a real impact as our work is launched to all political parties.
2. The Referendum result highlights that it is very easy for debate and policy to become derailed. In an area of long-term infrastructure investment like housing, this can only be avoided by establishing and sticking to key principles rather than succumbing to kneejerk reactions in our policy approach.
3. Many believed that the Referendum result would impact immediately and negatively on the housing market. However, at the time of writing, the immediate Referendum impacts look less dramatic than originally feared, although most commentators expect the economy to be weaker while the uncertainties play out. This could of course take many years. The clear signal is that the voting public care about the practical issues that affect their everyday lives. This suggests that we all need to focus on real long-term policies rather than press soundbites. This Review is therefore very timely.
4. Finally, we note and are supportive of recent indications that, after the changes resulting from the EU Referendum, our current Government is looking more broadly at all tenure types and is starting to see home ownership as one important component of a healthy housing environment, rather than as an isolated priority in itself. We encourage this challenging of the previous policy and would like to see it extended to a genuinely long-term approach with long-term target setting.

The Oxford Economics model of the housing market The Review presents new and original analysis into the drivers of house prices and home ownership rates in the UK. Often in the public debate, statements about why house prices have risen or why home ownership rates have declined are based on little rigorous evidence. On home ownership in particular, little is known about the relative importance of different factors that influence its level. Yet these assumptions inevitably determine the policy response and can therefore lead to poor policymaking. This Review sets out to fill that evidence vacuum, bringing new clarity and rigour to our understanding of the determinants of house prices and home ownership as the platform for effective policy debate.
To this end, Oxford Economics was commissioned to develop an integrated macroeconomic model of the UK housing market. The model allows us to understand what lies behind the radical changes we have seen in house prices and home ownership in recent years, as well as to develop forecasts for each. Full details of the methodology, its results and some of their implications are set out in Oxford Economics’ supplementary document to this Review Forecasting UK house prices and home ownership: a report for the Redfern Review, available on the Review website.
In undertaking this analysis, Oxford Economics sets out an entirely new approach to modelling the macroeconomic drivers of house prices and home ownership. The study is based on data from 1992 to 2014, the latest available year for which all the necessary official data are available. The analysis draws on a wide variety of data sources, including the ONS, Bank of England, Land Registry, DCLG, HMRC and more.
The housing market is a complicated system of separate, but closely linked, markets for renting and buying houses. Consequently, changes that influence the level of rent people pay in the private rented sector tend to influence house prices. Similarly, some drivers of house prices have no impact on rent. Meanwhile, it is the interaction of house prices and rent levels that is a crucial determinant of home ownership rates.
In order to unpick these complicated interrelationships, Oxford Economics has developed a three-part model of rent, prices and home ownership rates. The results of the model illustrate the sensitivity of house prices and home ownership rates to different macroeconomic drivers including the supply of housing, mortgage rates and household incomes, among other things. The model also allows us to diagnose the underlying causes of recent trends, with important implications for the appropriate policy response. Finally, we can use the results to form a view about whether the precipitous decline in home ownership rates over the past 12-13 years is set to continue or has come to an end.
To our knowledge, this is the first time UK home ownership rates have been modelled within a ‘system of equations’ describing the interactions in the housing market and within a macroeconomic framework. The results offer a number of surprising and unique insights that challenge some commonly-held assumptions about the UK housing market.
– 9 –THE REDFERN REVIEW INTO THE DECLINE OF HOME OWNERSHIP
R E D F E R N R E V I E W


– 11 –THE REDFERN REVIEW INTO THE DECLINE OF HOME OWNERSHIP
R E D F E R N R E V I E W
1. During the year of work on this Review, it has been a continual challenge to genuinely separate issues of home ownership from issues surrounding the broader housing market and the financial situation of the age group of ‘twenty or thirtysomethings’ who make up the potential home owners of the future. In writing this report, we have had to work hard to maintain focus on our scope, which was to identify the reasons for the significant decline in home ownership over the last 12-13 years and to recommend areas for new discussion of how to improve home ownership levels. We continue to be convinced that this objective only makes sense if the home ownership that we promote is healthy and sustainable – and therefore in the interests of the families and individuals concerned.
2. In this Executive Summary, we define the problem that we face with home ownership and answer our root ‘exam’ question, of why home ownership has fallen since its peak. We also go on to analyse an additional question – what have been the key drivers of house price growth over a similar period? We believe this is in some ways more important to potential home owners, who are balanced at the point between renting and buying, than the exact timing of the choice or ability to purchase.
3. We then set out areas that, based on our analysis and research, we believe need to be fully debated if we are ever to resolve some of the serious limitations of home ownership and the wider housing market. We examine in more detail the findings split between home ownership and the wider housing market.
We also go on to suggest a series of largely supply-oriented policy options, but these should only be approached in the wider context of the two fundamental conclusions around home ownership and the housing market, set out below.
Defining the problemsThe rise in house prices is a major, but not sole, driver of the decline in home ownership in the longer term. We therefore talk about these as two distinct problems.
Problem 1: a decline in home ownership4. The rate of home ownership has fallen significantly in
England and the UK as a whole since it peaked in the early 2000s. In England the rate of home ownership has fallen from 70.9% in 2003 to 63.6% in 2014/15. The decline has been steepest amongst young people. Whilst the rate of home ownership fell from 70.9% in 2003 to 63.6% today overall (-7.3 percentage points), for those ages 25-34 it fell from 58.6% to 36.7% (-21.9 percentage points).
5. Falling home ownership is a problem for a number of reasons. The first is that home ownership is desirable – for individual families, it brings additional home stability, security, financial strength and the ability to plan ahead, in a way that renting cannot readily achieve. Home ownership often brings a greater sense of personal responsibility for the home, the community, and our ability to be financially independent post retirement. Security, both financial and social, for current and future generations was a recurrent theme in our focus groups:
Settled
Hard work
Privacy
Choice
ProvidingResponsibility
�e king
Space
Making it your own
Retirement
MortgageMake money
Relieved
Neighbours
Less stress
Savings
Roof over your head
Long term
Pension
Mine future
Own space
Peace of mind
Money well spent
Comfortable
OpportunityWorry
Pass on to childrenControl
Safe future
Safe
Buy to let
Easier for us
Value
Big deposit
Can develop it Happiness
Home improvements
Renting for pro�t
Scared Motivation
Freedom
Ful�lment
Getting on the proper ladder
Space to grow
Comfort
Solution
My castle
Foundations
Big deposit
Adult
Family
Hopeful
Achievement
Executive summary
Source: Redfern Review focus groups

– 12 –THE REDFERN REVIEW INTO THE DECLINE OF HOME OWNERSHIP
R E D F E R N R E V I E W
6. The second reason is that home ownership remains an aspiration for most: home ownership is a reasonable and often natural aspiration for people to have at some point in their lives and most surveys show around 80% of people want to own.2 The significant majority of people in work should have the ability to own a home of their own during their lifetime. This does not mean, however, that we should target or expect the equivalent 80% home ownership rate. That, in our view, would be too high, given there are clearly stages of our lives when home ownership is neither relevant nor desirable. So, there needs to be a good alternative for households in the private rented sector. Further, there will always be some households unable to access a home in either part of the private market. In a decent society we need to provide a fair and reasonable safety net for them, and so a vibrant affordable housing sector is an important part of a healthy housing market.
7. Housing is also the easiest and most accessible way for most ordinary households to accumulate wealth. This is particularly due to the behavioural aspect of ‘enforced saving’, given that mortgages are generally repayment mortgages. It is also because a mortgage allows households to leverage in a way that they cannot usually do with other asset classes, which benefits them so long as house prices continue to rise. This of course carries risk, but generally this is contained by regulation and mortgage lenders so that households cannot borrow beyond their means and the risk is managed. This is even more true since the Mortgage Market Review (2014), and from the end of 2014 there were limitations on how individual lenders could lend to customers on a loan-to-income multiple greater than 4.5. In the UK, 35% of household wealth is housing wealth. Given the rise in house prices over recent decades, those excluded from home ownership have been less able to accumulate equivalent wealth. However, there is no guarantee that in the future owning a home will be such a good way to accumulate wealth. Indeed, the home owner can end up in negative equity, even if they can still pay their mortgage. Nevertheless, for the option to own not to be available to a large group of people can be seen as unfair.
8. In comparing home ownership rates across different countries (see Chapter 1), clear ‘groupings’ emerge with the highest rates of home ownership in the 70%s and 80%s – in the former Soviet bloc countries and those in Southern Europe, which have a number of economic challenges. In both of these ‘groupings’ there are serious housing market issues, and it is difficult to believe that these are conditions which we should aspire to overall. At the other end of the scale, we have Germany on 52%, where a deep-rooted culture of government support for the rented sector has created a very different market. There are some indications that this is changing with an increasing desire for private home ownership, and even if we wished to emulate this approach it would be a challenging goal to achieve. The remaining countries show a range of home ownership rates between 63% and 72% – very similar to the range in which the UK has remained over the last 30 years.
Problem 2: an increase in house prices9. Real house prices rose 151% from the end of 1996 to
the end of 2006, while real earnings have risen only about a quarter as much as that (39%). While rapidly rising house prices do not necessarily affect the annual costs faced by either owners or renters, they do raise barriers for people who want to become home owners because of the bigger deposit required. This has recently presented a significant challenge for young people looking to access home ownership for the first time. Accordingly, our focus in this Review has been on the position of people in the 28-40 age group, who make up the bulk of first time buyers.
10. The term ‘crisis’ is an emotive one and not always constructive, but it does reflect the frustration of young people in particular, who now feel they are unable to buy their first home. In our polling, 53% of people acknowledged that buying a home has become ‘much more difficult’ in the last 10 years. Home ownership amongst the under-45s has fallen by nearly 860,000 people, not to mention a real crisis among the homeless and those who are badly housed. Their situation would be improved if more housing was available.
– 13 –THE REDFERN REVIEW INTO THE DECLINE OF HOME OWNERSHIP
R E D F E R N R E V I E W
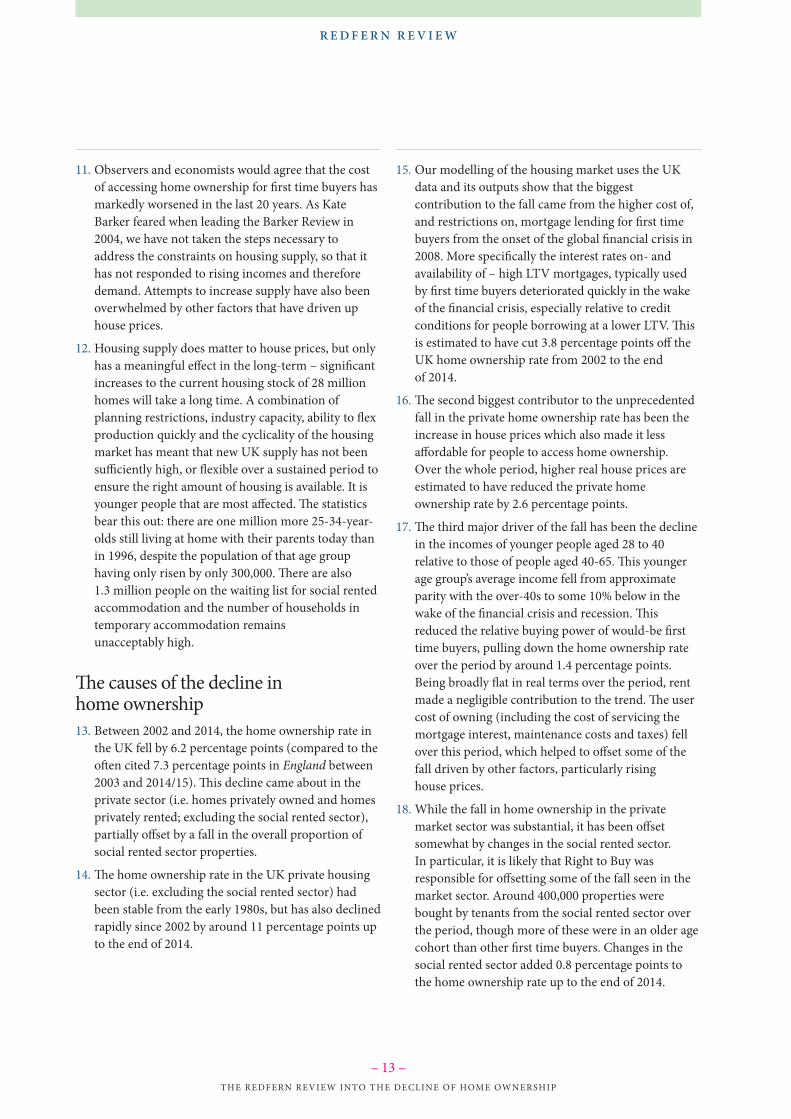
11. Observers and economists would agree that the cost of accessing home ownership for first time buyers has markedly worsened in the last 20 years. As Kate Barker feared when leading the Barker Review in 2004, we have not taken the steps necessary to address the constraints on housing supply, so that it has not responded to rising incomes and therefore demand. Attempts to increase supply have also been overwhelmed by other factors that have driven up house prices.
12. Housing supply does matter to house prices, but only has a meaningful effect in the long-term – significant increases to the current housing stock of 28 million homes will take a long time. A combination of planning restrictions, industry capacity, ability to flex production quickly and the cyclicality of the housing market has meant that new UK supply has not been sufficiently high, or flexible over a sustained period to ensure the right amount of housing is available. It is younger people that are most affected. The statistics bear this out: there are one million more 25-34-year-olds still living at home with their parents today than in 1996, despite the population of that age group having only risen by only 300,000. There are also 1.3 million people on the waiting list for social rented accommodation and the number of households in temporary accommodation remains unacceptably high.
The causes of the decline in home ownership13. Between 2002 and 2014, the home ownership rate in
the UK fell by 6.2 percentage points (compared to the often cited 7.3 percentage points in England between 2003 and 2014/15). This decline came about in the private sector (i.e. homes privately owned and homes privately rented; excluding the social rented sector), partially offset by a fall in the overall proportion of social rented sector properties.
14. The home ownership rate in the UK private housing sector (i.e. excluding the social rented sector) had been stable from the early 1980s, but has also declined rapidly since 2002 by around 11 percentage points up to the end of 2014.
15. Our modelling of the housing market uses the UK data and its outputs show that the biggest contribution to the fall came from the higher cost of, and restrictions on, mortgage lending for first time buyers from the onset of the global financial crisis in 2008. More specifically the interest rates on- and availability of – high LTV mortgages, typically used by first time buyers deteriorated quickly in the wake of the financial crisis, especially relative to credit conditions for people borrowing at a lower LTV. This is estimated to have cut 3.8 percentage points off the UK home ownership rate from 2002 to the end of 2014.
16. The second biggest contributor to the unprecedented fall in the private home ownership rate has been the increase in house prices which also made it less affordable for people to access home ownership. Over the whole period, higher real house prices are estimated to have reduced the private home ownership rate by 2.6 percentage points.
17. The third major driver of the fall has been the decline in the incomes of younger people aged 28 to 40 relative to those of people aged 40-65. This younger age group’s average income fell from approximate parity with the over-40s to some 10% below in the wake of the financial crisis and recession. This reduced the relative buying power of would-be first time buyers, pulling down the home ownership rate over the period by around 1.4 percentage points. Being broadly flat in real terms over the period, rent made a negligible contribution to the trend. The user cost of owning (including the cost of servicing the mortgage interest, maintenance costs and taxes) fell over this period, which helped to offset some of the fall driven by other factors, particularly rising house prices.
18. While the fall in home ownership in the private market sector was substantial, it has been offset somewhat by changes in the social rented sector. In particular, it is likely that Right to Buy was responsible for offsetting some of the fall seen in the market sector. Around 400,000 properties were bought by tenants from the social rented sector over the period, though more of these were in an older age cohort than other first time buyers. Changes in the social rented sector added 0.8 percentage points to the home ownership rate up to the end of 2014.
– 14 –THE REDFERN REVIEW INTO THE DECLINE OF HOME OWNERSHIP
R E D F E R N R E V I E W
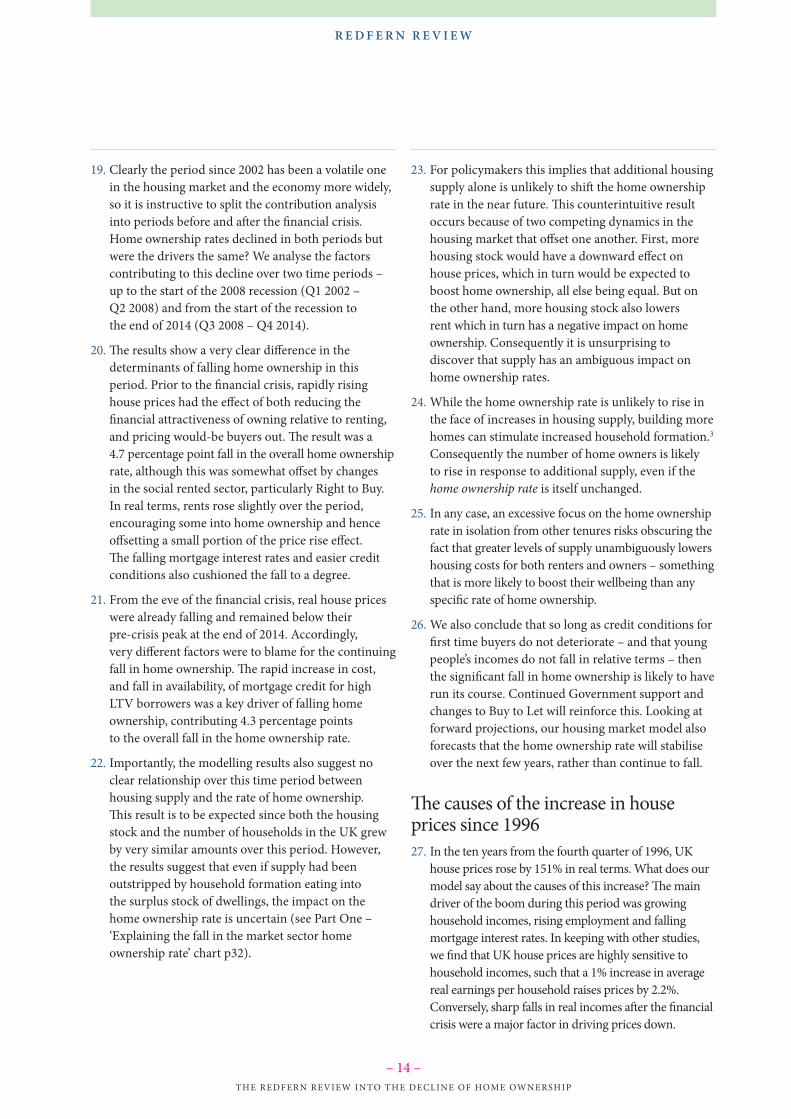
19. Clearly the period since 2002 has been a volatile one in the housing market and the economy more widely, so it is instructive to split the contribution analysis into periods before and after the financial crisis. Home ownership rates declined in both periods but were the drivers the same? We analyse the factors contributing to this decline over two time periods – up to the start of the 2008 recession (Q1 2002 – Q2 2008) and from the start of the recession to the end of 2014 (Q3 2008 – Q4 2014).
20. The results show a very clear difference in the determinants of falling home ownership in this period. Prior to the financial crisis, rapidly rising house prices had the effect of both reducing the financial attractiveness of owning relative to renting, and pricing would-be buyers out. The result was a 4.7 percentage point fall in the overall home ownership rate, although this was somewhat offset by changes in the social rented sector, particularly Right to Buy. In real terms, rents rose slightly over the period, encouraging some into home ownership and hence offsetting a small portion of the price rise effect. The falling mortgage interest rates and easier credit conditions also cushioned the fall to a degree.
21. From the eve of the financial crisis, real house prices were already falling and remained below their pre-crisis peak at the end of 2014. Accordingly, very different factors were to blame for the continuing fall in home ownership. The rapid increase in cost, and fall in availability, of mortgage credit for high LTV borrowers was a key driver of falling home ownership, contributing 4.3 percentage points to the overall fall in the home ownership rate.
22. Importantly, the modelling results also suggest no clear relationship over this time period between housing supply and the rate of home ownership. This result is to be expected since both the housing stock and the number of households in the UK grew by very similar amounts over this period. However, the results suggest that even if supply had been outstripped by household formation eating into the surplus stock of dwellings, the impact on the home ownership rate is uncertain (see Part One – ‘Explaining the fall in the market sector home ownership rate’ chart p32).
23. For policymakers this implies that additional housing supply alone is unlikely to shift the home ownership rate in the near future. This counterintuitive result occurs because of two competing dynamics in the housing market that offset one another. First, more housing stock would have a downward effect on house prices, which in turn would be expected to boost home ownership, all else being equal. But on the other hand, more housing stock also lowers rent which in turn has a negative impact on home ownership. Consequently it is unsurprising to discover that supply has an ambiguous impact on home ownership rates.
24. While the home ownership rate is unlikely to rise in the face of increases in housing supply, building more homes can stimulate increased household formation.3 Consequently the number of home owners is likely to rise in response to additional supply, even if the home ownership rate is itself unchanged.
25. In any case, an excessive focus on the home ownership rate in isolation from other tenures risks obscuring the fact that greater levels of supply unambiguously lowers housing costs for both renters and owners – something that is more likely to boost their wellbeing than any specific rate of home ownership.
26. We also conclude that so long as credit conditions for first time buyers do not deteriorate – and that young people’s incomes do not fall in relative terms – then the significant fall in home ownership is likely to have run its course. Continued Government support and changes to Buy to Let will reinforce this. Looking at forward projections, our housing market model also forecasts that the home ownership rate will stabilise over the next few years, rather than continue to fall.
The causes of the increase in house prices since 199627. In the ten years from the fourth quarter of 1996, UK
house prices rose by 151% in real terms. What does our model say about the causes of this increase? The main driver of the boom during this period was growing household incomes, rising employment and falling mortgage interest rates. In keeping with other studies, we find that UK house prices are highly sensitive to household incomes, such that a 1% increase in average real earnings per household raises prices by 2.2%. Conversely, sharp falls in real incomes after the financial crisis were a major factor in driving prices down.

– 15 –THE REDFERN REVIEW INTO THE DECLINE OF HOME OWNERSHIP
R E D F E R N R E V I E W
28. The other significant determinant was the falling user cost of capital, primarily falling mortgage interest rates. Typical nominal mortgage interest rates fell from over 11% in 1992 to around 2% by the end of 2014, pushing up on house prices.
29. It is often suggested that the biggest contribution to this increase in house prices was a shortage of supply in the decade or more leading up to the peak of the market in 2007; however this is a misleading view. The results show that a 1% increase in the number of dwellings, or a 1% fall in the number of households, would reduce house prices by approximately 1.8%. This result is in line with the results of similar past modelling exercises, including a recent paper from the Office for Budget Responsibility.
30. But looking at the housing stock per household, we can see that the increase in household numbers over the period was more than offset by increases in the number of dwellings. In the ten years from the end of 1996, 1.83 million new households were created, while the dwelling stock rose by 1.98 million units. Consequently, despite the sensitivity of prices to changes in ratio of dwellings to households, this variable actually increased slightly, and hence did not contribute to price growth over the decade. However, we cannot conclude from this an absence of pressures surrounding the availability of housing during this time, and more is said on the distinction between ‘prices’ and ‘availability’ later on.
31. Although over the 1996-2006 period new supply outstripped the rate of household formation, since the financial crisis this picture has reversed. The results therefore also have implications for the contribution of supply constraints to house prices in recent years, as price growth has again gathered pace.
32. For example, between 2013 and 2014 270,000 new households are estimated to have formed in the UK, while net new supply was 159,000 in the year to 31 March 2014. The shortfall of new supply in this case was therefore around 110,000 dwellings or around 0.4% of the stock of dwellings in the UK in 2013, which stood at 28 million. Our modelling suggests that the shortfall was responsible for pushing up prices by around 0.7% over the course of that year. In total overall prices rose by 4.6% in real terms, indicating that even in the year to early 2014, an unusually large shortfall of supply was not a particularly large driver of recent house price inflation.
33. For policymakers the implications of this analysis are very relevant. Restrictions on new housing supply have not been the main culprit when it comes to price rises over the past 25 years, although they have constrained availability. But looking forward, if the number of households in the UK were to grow at around 200,000 per year, new supply of 300,000 dwellings per year over a decade would be expected to cut house price inflation by around 5 percentage points (0.5 percentage points a year). This could be further reinforced by changing house price expectations (not modelled). In other words boosting housing supply will have a material impact on house prices, but only if sustained over a long period.
34. Our housing market model forecasts that house prices will continue to rise modestly over the next few years.
Conclusion 1 – Home ownership35. As set out above, the key drivers of the fall in home
ownership have been a combination of macro-economic issues, including the changes in the relative earning and borrowing power of young people – the key group who will contribute to and benefit from increases in home ownership. These are issues arising from outside of the housing market. Even with a significant increase in supply, our analysis shows that home ownership rates will not necessarily increase – although such a supply increase would definitely be in the interests of the younger age group of potential home buyers.
36. If we genuinely want to increase home ownership rates then we need to challenge either relative wage rates (which is clearly beyond the scope of this Review), or mortgage lending standards, or provide specific subsidies for certain ‘qualifying’ groups. We can and should also look at improving the flexibility of transitions into home ownership by providing advice and structures which assist young people. However, this is unlikely to counter the macroeconomic trends we have identified.
37. We find it hard to recommend a return to mortgage lending standards that do not differentiate sufficiently on risk – even though this would help encourage home ownership by levelling the playing field. To remove the changes to lending criteria for low-deposit borrowers that have developed over the last 12 years – since the Mortgages and Home Finance Conduct of Business

– 16 –THE REDFERN REVIEW INTO THE DECLINE OF HOME OWNERSHIP
R E D F E R N R E V I E W
Sourcebook (MCOB) in 2004 – is effectively asking lenders to cross subsidise just to support home ownership. It would also effectively move us away from the new Basel standards. From past experience and international comparison (for example with the US), we have already learnt that this is to the risk and eventual cost to all. Nevertheless, as financial and economic conditions normalise, we may see credit conditions ease somewhat for these groups, despite the safeguards now in place.
38. Our first fundamental conclusion is that targeting a specific home ownership rate is not only difficult but also may damage the underlying interests of both the individuals that we are trying to help and the wider market, by encouraging both unsustainable house price growth and unsustainable home ownership rates. Our modelling predicts that current trends have largely run their course and that the home ownership rate should stabilise over the near future. We should accept this short-term reality.
39. We also conclude however that we must continue to focus on the housing situation of individuals in our potential home owning group. We believe that Help to Buy Equity Loan is a useful tool to help young people into first time home ownership. We remain concerned however about the inflationary aspects of Help to Buy Equity Loan and would recommend that it is slowly tapered to focus solely on first time buyers and in a way that will encourage its use to secure a ‘normal’ first home rather than to join the ladder half way up. This should reduce both the inflationary risk and its cost to Government, and target those for whom it is most appropriate. In the longer term, Help to Buy Equity Loan can also be a useful counter cyclical tool, used to provide support when conditions are weak.
40. We also believe that far more should and could be done to provide a healthy and stable renting environment, which would provide both a better opportunity for young people to save and a better set of conditions for longer term tenants.
Conclusion 2 – Housing market and supply41. Our second conclusion stems from the belief that the
biggest housing issue for young people is not the ongoing cost of home ownership but the cost of accessing it – i.e. high house prices and therefore deposits. Further, house prices do not always closely reflect the availability of housing – prices can be affected be many different factors. All long-term sustainable solutions to high house prices and availability depend on increasing long-term supply.
42. However, as we have argued above, increased new supply does not directly improve the home ownership rate and though it will have a suppressing effect on house prices (and therefore improve affordability), it is a slow, cumulative process.
43. We do believe that there needs to be a change in attitude to supply. We are not questioning whether politicians, both national and local, and increasingly the general public, accept the need for increased supply. We strongly believe that, particularly since the Barker Review in 2004, they do. This is not about one political party being ‘the party of home ownership’ or ‘the party that will build more houses’, but about how to effectively deliver the result that we all want, regardless of short-term politics.
44. The issue is that what is needed is not greater supply over a couple of years, or even a five-year political term of increased production. What is needed is decades of consistent improved supply, in both quantum and particularly location, and that can only be achieved with a long-term plan, whose principles are agreed by all main political parties, and where short-term decisions are taken, but are taken in line with those principles and that plan.
45. Our second conclusion is therefore, that whilst there is no silver bullet for supply, we can significantly improve supply where it is needed – in the long-term, in a sustainable way but only if we adopt a long-term principle-driven approach. This has to include a stable and supportive environment for all main housing tenures. We set out more detail of what we believe this would involve in our policy options. We believe that without a shift to a long-term, cross-party plan that supports all key housing tenures, we will be asking the same questions in 10 years’ time that we ask today.

– 17 –THE REDFERN REVIEW INTO THE DECLINE OF HOME OWNERSHIP
R E D F E R N R E V I E W
Policy optionsBelow we provide a list of policy options that could support the rate of home ownership and housing supply in a sustainable way going forward. These are not necessarily recommendations, but serve to illustrate what could be done on the back of the evidence we present in this Review. They are designed to stimulate further debate and discussion, and as far as possible command cross party support.
Promoting home ownership and improving the housing position of young people
1.
Our focus is on improving the position of first time buyers and those who remain
in rented accommodation, rather than driving a maximum, short-term
home ownership rate.
The Help to Buy Equity Loan scheme is an effective tool in supporting both new home owners and new housing supply. It is there to offset the disadvantages faced by first time buyers in accessing mortgages since the global financial crisis. However it does bear inflationary risk. Consideration should be given to targeting it more exclusively to first time buyers and lower price points on a regional basis, whilst extending its term beyond 2021 for this restricted group. Retaining its use on an ‘unrestricted’ basis as today can then be considered as a countercyclical action by government.
2. Starter homes should be retained but on exception sites only and with the first time buyer discount retained in perpetuity.
3. More support should be given to programmes that promote saving amongst young people. The maximum scale of the Lifetime ISA should be increased and consideration given to increasing the level of government contribution, making a more significant impact on the deposit required by first time buyers. Whilst this is not the fastest path to home ownership, it is one of the most sustainable, and the long-term benefits are significant.
4. The Right to Buy ‘one for one’ replacement policy should be extended so that all council homes sold through the scheme are replaced, rather than just some of them as under the current policy; to ensure that affordable rented housing remains available to those who need it and to sustain Right to Buy sales in the future.
5. Consideration should be given to improving the position for tenants, taking into account the increasing number of tenants who are long-term renters, and/or are young families. This should be focused on improving conditions without unnecessarily increasing landlords’ costs.
Improving the wider housing market and increasing supply
1.
Our policy options have a strong underlying theme that our housing market solutions must be planned, consistent, long-term
and accept the fact that there is no single short-term silver bullet that can bring supply
and demand back into a healthy balance overnight. We must also make sure that we support the most vulnerable in the here and
now, through targeted affordable housing and improvements in the stability
of rented housing. The following policy options are split into three areas:
the first block is around stability of supply the second around governance; and the third about ensuring the planning system in its current form works effectively and efficiently.
We must develop a long-term strategy for the housing market that is based on principles that can be agreed across the main political parties. The core principles of that strategy should be:
a. Long-term increases in supply, sustained over 20+ years will be needed to reduce overall housing market pressure, increasing the ‘size of the cake’ and resulting in a ‘positive sum’ gain. Government’s primary role is in guiding the long-term environment that will support its objectives.
– 18 –THE REDFERN REVIEW INTO THE DECLINE OF HOME OWNERSHIP
R E D F E R N R E V I E W
b. Government should take short-term actions when and only when it is necessary to protect the most vulnerable, and must ensure that these actions do not increase market volatility or damage longer term supply.
c. Both maximising long-term supply and optimising the fairness in the housing market require balanced efforts to promote a healthy environment for the three key subsectors: construction for private home ownership; construction for a private rented sector; and, construction of affordable housing.
d. Government (including the Bank of England) has a key role to mitigate market swings over the cycle, reducing the impact on individuals and reducing the effect of housing market volatility.
e. Government has a key role to promote a saving culture in young people and help people to help themselves attain home ownership.
f. A recognition that house price stability, and particularly house price growth in line with earnings growth would be good for social, economic and financial stability. Growth consistently above this level is not the sign of a healthy economy.
2. In creating a healthy long-term framework for long-term housing policy decisions, it would aid good decision-making to have a genuinely independent review process for Government policy. Individual policy decisions should state clearly their goals against the strategic framework and then be transparently assessed over time for their success in achieving their goals. Due to supply-based decisions – such as changes to the planning system – only being effective on a far longer time horizon than certain demand side measures including fiscal and monetary policy, these should be assessed separately, requiring:
a. An independent review of the impact of policy changes on long-term supply quantum, quality and effectiveness to meet future demand.
b. An independent review of the reasons for key house price trends and the effectiveness of fiscal and monetary policy in maximising stability.
The Infrastructure Commission fulfils a role for major infrastructure projects, and whilst we acknowledge that the emerging view that housing as infrastructure has merit, we believe that there are too many differences for the housing remit to be dealt with within this body. Establishing a parallel Housing Commission would require both housing skills and the need to assess the market impacts in a way that is much less relevant for infrastructure.
3. It is our belief that recent policy changes to the planning system will, over time, have a significant beneficial effect on the quantum and relevance of new housing supply. However, the full, positive effects of these changes are yet to be felt. Further significant changes are more likely to have a negative than positive effect on long-term supply. However, we believe that there remain specific focus areas that can be improved within the current system, namely:
a. The resourcing of planning departments.
b. The effective operation of the Duty to Cooperate and the interaction between urban, suburban and rural authorities.
c. The interaction between neighbourhood plans and local plans, which remains unclear.
d. The data used to assess the effectiveness of the supply system at a national, regional and local level which is often poor.
e. Diversion of funding (from initiatives such as Starter Homes and Modern Methods of Construction) to housing infrastructure and affordable housing should be considered.

PART ONE: Home Ownership
The causes of the decline in home ownership since
its peak
R E D F E R N R E V I E W

– 20 –THE REDFERN REVIEW INTO THE DECLINE OF HOME OWNERSHIP
PA R T O N E : H O M E O W N E R S H I P
CHAPTER 1:
What has been happening to home ownership in England and the UK?1. The rate of home ownership in England peaked at
70.9% in 2003 and has fallen to 63.6% in 2014/15.4 The picture for the UK as a whole is similar: the rate of home ownership peaked at 69.3% in 2002 and had fallen to 63.1% in 2014.5 The decline in the rate of home ownership is widely considered to be undesirable and the Government has been trying to stop any further decline and reverse it. The latest EHS offered some encouragement in this regard, showing a slight uptick in the rate of home ownership in the latest year (by 0.3 percentage points). But it remains unclear whether this is a blip – even a sampling error – or the start of a new upward trend.
2. When we set out on this Review, we decided that we should not try to set a target for the ‘right’ level of home ownership. The Review team did form the view, however, that the long-term structural decline in the rate of home ownership has negative implications for the economic wellbeing and social cohesion of the country as a whole. Both very high and very low levels (towards 60% and below) of home ownership can cause problems.
3. Implicitly, the Government sees a rate of home ownership of around 70% as a sign of success. This Review does not take a view of what the rate of home ownership should be, however it is useful to look at home ownership rates in other Western countries.
RATES OF HOME OWNERSHIP IN SELECTED EU AND ANGLOSPHERE COUNTRIES, 20156
Hungary 86%
Poland 84%
Czech Republic 78%
Spain 78%
Portugal 75%
Greece 75%
Italy 73%
Belgium 71%
Sweden 71%
Ireland 69%
Netherlands 68%
Canada 67%
Australia 67%
New Zealand 65%
USA 64%
UK 64%
France 64%
Denmark 63%
Germany 52%
Source: Eurostat (EU countries), Trading Economics (Anglosphere countries)
4. In comparing home ownership rates across different countries clear ‘groupings’ emerge, with the highest rates of home ownership apparent in the former Soviet bloc countries and in the challenged economies of Southern Europe. In both of these ‘groupings’ there are serious housing market issues, and it is difficult to believe that these are conditions which we should aspire to overall. At the other end of the scale, we have Germany, where a deep-rooted culture of Government support for the rented sector has created a very different market. There are some indications that this is changing with an increasing desire for private home ownership, however even if we wished to emulate this approach it would be a challenging goal to achieve.

– 21 –THE REDFERN REVIEW INTO THE DECLINE OF HOME OWNERSHIP
PA R T O N E : H O M E O W N E R S H I P
5. The rest of the countries show a range between 63% and 72% – very similar to the range in which the UK has remained over the last 30 years. We draw a cautious conclusion that this is a ‘natural’ level for most Western economies.
6. Today’s rate of home ownership is not low in historical context. The rate of home ownership in England stood at only 56.6% in 1980 but it had been rising long before that, largely at the expense of the private rented sector as we moved further beyond the post-war era. The home ownership rate continued to rise throughout the 1980s to 67.0% in 1990, propelled upwards by the Right to Buy and almost entirely at the expense of social renting. Increases in mortgage lending and tax incentives such as Mortgage Interest Relief at Source (MIRAS) also supported this rise.7 It continued to nudge higher over the next decade and stood at 70.6% in the year 2000, before hitting the peak three years later.
7. The rate of home ownership in England then began to decline steadily from 2003. Correspondingly, from around 2000, there has been a renaissance in the private rented sector, which has been associated with the advent of the Buy to Let mortgage (1999). This helped to drive the rate of private renting up from 10.0% in 2000 to 19.0% in 2014/15 – a near-doubling – largely at the expense of home ownership. The rate of social renting also fell but only slightly, continuing the longer term decline that began in the 1980s.
8. Importantly for this Review as we start to consider the reasons for the fall in the rate of home ownership, the steepest fall in home ownership has been amongst younger households. Whilst the rate of home ownership fell from 70.9% in 2003 to 63.6% today overall (-7.3 percentage points), for those aged 25-34 it fell from 58.6% to 36.7% (-21.9 percentage points).8 It would appear therefore that the fall in the rate of home ownership has occurred almost entirely amongst younger people.
RATE OF HOME OWNERSHIP IN ENGLAND, 1980 – 2014/15
50
60
70
1980
1985
1990
1995
2000
2005
2010
2015
% of households in the Owner Occupied Sector
Source: DCLG, English Housing Survey
HOME OWNERSHIP RATES OF ALL VS 25-34 YEAR OLDS IN ENGLAND, PEAK TO CURRENT
2014/152003
70.9%
58.6%
25-34 y/o
0
10
20
30
40
50
60
70
80
All
63.6%
36.7%
Source: DCLG, English Housing Survey

– 22 –THE REDFERN REVIEW INTO THE DECLINE OF HOME OWNERSHIP
PA R T O N E : H O M E O W N E R S H I P
9. The trends in the rate of home ownership have been similar across the regions, with the exception of London which has seen far steeper falls in home ownership, from 61.1% in 2003 to 49.5% in 2014/15 (minus 11.6 percentage points) compared to the rest of England – 73.7% in 2003 to 66% in 2014/15 (minus 7.3 percentage points). The London contrast gives further clues as to why the rate of home ownership has fallen since the peak.
RATES OF HOME OWNERSHIP ACROSS THE ENGLISH REGIONS, 2004 AND 2014/159
2004 2014/15
North East 64.7% 60.8%
North West 72.0% 64.7%
Yorkshire & Humber 70.8% 62.6%
East Midlands 75.2% 66.6%
West Midlands 72.0% 65.7%
East of England 75.0% 67.0%
South East 75.4% 68.1%
London 57.6% 49.5%
South West 73.6% 69.2%
England 70.8% 63.6%
Source: DCLG, English Housing Survey
10. Delving deeper into home owner households, we see a further contrast in the trends between those that own outright and those that own with a mortgage. In 2003, 38.8% of households in London owned with a mortgage but by 2014/15 this had fallen to 26.7% (minus 12.1 percentage points) whereas the percentage owning outright remained virtually the same. Outside London the story is very similar: those owning with a mortgage fell from 43.4% to 31.1%. (minus 12.3 percentage points) whereas the percentage owning outright actually rose moderately.10
11. There were a number of important events and policy developments leading up to the early 2000s and since, which may have contributed to the fall in the rate of home ownership. These include the growth of the Buy to Let mortgage from 1999 (the emergence of new wholesale funded lenders slightly before this was also significant); the Mortgages and Home Finance Conduct of Business Sourcebook (MCOB) in 2004, which may have acted to quell home ownership rates; and the Mortgage Market Review of 2014.11 The decade leading up to the global financial crisis in 2008 was also one of rapidly rising house prices as a result of easier lending which may also have had an impact. The global financial crisis of 2008 is likely to have slammed the foot on the brakes: from 2008, mortgages became very difficult to get for first time buyers and households faced slow or negative real earnings growth, coupled with the effect of fiscal austerity.
12. Viewed in the context of what was going on around the time, it is perhaps hardly surprising that the peak in home ownership was in the early 2000s. But it also raises the question about the extent to which home ownership can be affected through targeted policy measures and how much it is ultimately down to macroeconomic drivers.

– 23 –THE REDFERN REVIEW INTO THE DECLINE OF HOME OWNERSHIP
PA R T O N E : H O M E O W N E R S H I P
• Housing stability: “Security in the sense that if you’re renting, you never know when you are going to be chucked out”;
• Financial security in older age: “Knowing that when you are ready to retire, you can settle down in peace and not have to worry about paying rent”; and
• Security for the children’s future: “When I die I want my little boy to have something, even if he doesn’t like the house and sells it, he still has a head start.”
4. As well as security, our focus group participants also associated home ownership with investment, achievement, responsibility, family, freedom, and choice. Achievement in particular has clear links to aspiration and is picked up again in the next section. There were a number of notable perceptions:
5. Moreover, non-owning participants had particular concerns about having to retire later to pay rent in retirement, feeling unsettled, and even the health impact of worrying about the instability of renting in older age. “You would have to work far past retirement [age]. I would not stop worrying about it.” This reinforces the earlier point about home ownership providing real or perceived financial security.
CHAPTER 2:
Why does the decline in home ownership matter?1. This chapter asks why it matters that home ownership
has declined. The answer comes in three parts. The first concerns the desirability of home ownership and what it is about home ownership that makes it the preferred tenure for many. The second is that home ownership is overwhelmingly the tenure of choice and that most people – around 80% – aspire to own their own home one day, even if many ultimately cannot. The third is about home ownership as an asset and a way of accumulating wealth, which also has implications for the equality of wealth in our society.
The desirability of home ownership2. Home ownership is desirable for many reasons.
For individual families, it brings additional home stability, security, financial strength and the ability to plan ahead, in a way that renting cannot achieve. Home ownership often brings a greater sense of personal responsibility for the home, the community, and our ability to be financially independent post retirement.
3. As part of this Review, we held two focus groups on home ownership, with a balance of home owners and non-home owners.12 The security of home ownership, for current and future generations, was a recurrent theme of these focus groups. Security has a number of facets:
“When you are paying rent, it’s just dead money”“It shows you have worked hard and achieved
something to be really proud of ”“Being able to put down roots and build
a family home”“Freedom to express yourself in your own home”
Source: Redfern Review focus groups

– 24 –THE REDFERN REVIEW INTO THE DECLINE OF HOME OWNERSHIP
PA R T O N E : H O M E O W N E R S H I P
6. One of the most comprehensive quantitative surveys of home ownership in recent years was the British Social Attitudes (2010) survey.13 The BSA surveys around 3,000 people each year. According to a study of the survey data commissioned by DCLG, the main advantages of owning a home are that it is a good investment (26%), it is more secure than renting (23%) and gives you freedom to do want you want with your home (21%), strongly echoing the themes that emerged from our focus group work.14
Home ownership aspiration7. Home ownership is the tenure of choice for most and it
is a reasonable and often natural aspiration for people to have at some point in their life. Most surveys show around 80% of people want to own their own home and this percentage appears highly stable over time.
8. The British Social Attitudes survey (2010) showed there was a continued and strong preference for home ownership among the vast majority of the public. It found that 86% of the public would prefer to buy. It similarly found that 85% would prefer to buy back in 1996. The appetite to get onto the housing ladder was shown to be very strong among non-owners too: 68%, the majority of private and social renters combined, would choose to buy if they could.15
9. More recent surveys have reinforced this. In a survey by the Yorkshire Building Society of just over 2,000 home owners and non home owners aged 18-40 at the beginning of 2016, 77% of respondents stated that longer term they would prefer to own their own home, either outright or with a mortgage. This rose to 80% amongst the 25-40 year olds and fell correspondingly to 72% amongst 18-24 year olds. For all home owners the figure was 96% and all non home owners 61%.16
10. Further, the annual English Housing Survey (2014/15) found that 57% of private renters and 24% of social renters expect to buy at some point in the future.17 These figures are slightly lower than the aspiration figures, which could reflect the fact that households’ do not always feel that their aspirations are attainable. While expectation is slightly different to aspiration, it is arguably a stronger statement of intent. Again these percentages have been broadly stable since the EHS started asking the question in 2006.
11. Finally, and picking up again on the theme of achievement, attaining home ownership is clearly seen as an important lifetime milestone. Even with the changes in attitudes of Generation Y, a high level of importance is still placed on home ownership. The Yorkshire Building Society survey asked respondents to rank five lifetime ‘milestones’ in order of importance:18
Owning a property | Getting married | Having or adopting children | Achieving
their career aims | Achieving their educational aims
12. Of these, 24% of respondents ranked ‘owning a property’ as the most important, higher than any of the other lifetime milestones. However, attaining their educational aims ran a close second (23%) and was most important amongst younger people and non home owners. Fewer than one-in-six 18-24-year-olds ranked owning a property top.
Overall, respondents ranked the milestonesin the following order, with owning a propertyas most important and having children as least important
Source: Yorkshire Building Society and Nat Cen, First-time buyers, An early life crisis (2016)
YORKSHIRE BUILDING SOCIETY SURVEY RESPONDENTS: LIFE EVENTS RANKED IN ORDER OF IMPORTANCE19

– 25 –THE REDFERN REVIEW INTO THE DECLINE OF HOME OWNERSHIP
PA R T O N E : H O M E O W N E R S H I P
Home ownership as an asset15. Total wealth in Great Britain stands at £11.1 trillion
– around £430,000 per household – according to the last figures for 2012-14.20 This falls to £6.1 trillion or around £265,000 per households when the wealthiest 10% are excluded. It is important to remember that the distribution of wealth is not simply just a rich versus poor dynamic, it is also an older people versus young people one. That is, older people will generally have accumulated more wealth over their lifetime than younger people of similar incomes.
16. Of total wealth, pension wealth is the biggest component of household wealth at £4.5 trillion (40%). This is closely followed by housing wealth at £3.9 trillion (35%). Other sources of financial and physical wealth make up the remainder. However, housing becomes the biggest component of wealth when, again, the wealthiest 10% are excluded. That pension wealth ranks first overall perhaps shouldn’t be too surprising, given that people in retirement especially have the most pension wealth. Housing is therefore an important source of wealth – the most important for all but the wealthiest.
PA R T O N E : H O M E O W N E R S H I P
13. Arguably reaching educational and career aims are intrinsic in achieving home ownership but clearly people see owning a property as one of the main milestones in life. Further, 69% of young adults (18-40) felt that owning their own home was essential to feeling they have succeeded in life. Our focus groups found similarly:
“If I am 60 years old and I am still paying for rented accommodation, I would wonder what has gone wrong in my life. I would
be devastated”14. The Review team believes that most people in
work should have the ability to own a home of their own during their lifetime. This does not mean, however, that we should target or expect an 80% home ownership rate to chime with the aspiration – that, in our view, would be too high and could present risks to the wider market. Further, there are clearly stages of our lives where home ownership is neither relevant nor desirable. The Yorkshire Building Society survey findings affirm other research that has found that younger adults are less likely to want to own a home and more likely to feel positively about renting. So there needs to be a good alternative for households in the private rented sector.
HOUSEHOLD WEALTH IN THE UK, 2012-2014 (£)
All households Wealthiest 10% households Everyone else
Total wealth 11.1trn 5.0trn 6.1trn
Pension wealth 4.5trn (40%) 2.2trn (43%) 2.3trn (38%)
Housing wealth 3.9trn (35%) 1.5trn (31%) 2.4trn (39%)
Source: Wealth and Assets Survey (July 2012 – June 2014)
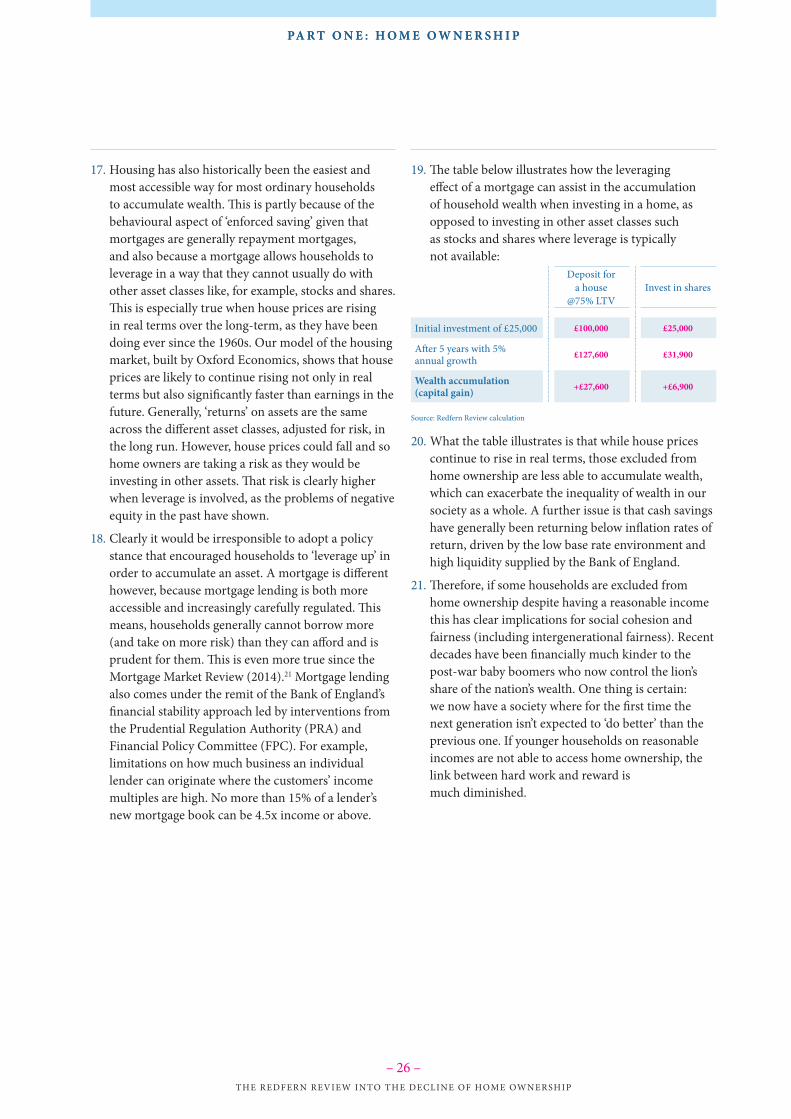
– 26 –THE REDFERN REVIEW INTO THE DECLINE OF HOME OWNERSHIP
PA R T O N E : H O M E O W N E R S H I PPA R T O N E : H O M E O W N E R S H I P
17. Housing has also historically been the easiest and most accessible way for most ordinary households to accumulate wealth. This is partly because of the behavioural aspect of ‘enforced saving’ given that mortgages are generally repayment mortgages, and also because a mortgage allows households to leverage in a way that they cannot usually do with other asset classes like, for example, stocks and shares. This is especially true when house prices are rising in real terms over the long-term, as they have been doing ever since the 1960s. Our model of the housing market, built by Oxford Economics, shows that house prices are likely to continue rising not only in real terms but also significantly faster than earnings in the future. Generally, ‘returns’ on assets are the same across the different asset classes, adjusted for risk, in the long run. However, house prices could fall and so home owners are taking a risk as they would be investing in other assets. That risk is clearly higher when leverage is involved, as the problems of negative equity in the past have shown.
18. Clearly it would be irresponsible to adopt a policy stance that encouraged households to ‘leverage up’ in order to accumulate an asset. A mortgage is different however, because mortgage lending is both more accessible and increasingly carefully regulated. This means, households generally cannot borrow more (and take on more risk) than they can afford and is prudent for them. This is even more true since the Mortgage Market Review (2014).21 Mortgage lending also comes under the remit of the Bank of England’s financial stability approach led by interventions from the Prudential Regulation Authority (PRA) and Financial Policy Committee (FPC). For example, limitations on how much business an individual lender can originate where the customers’ income multiples are high. No more than 15% of a lender’s new mortgage book can be 4.5x income or above.
19. The table below illustrates how the leveraging effect of a mortgage can assist in the accumulation of household wealth when investing in a home, as opposed to investing in other asset classes such as stocks and shares where leverage is typically not available:
Deposit for a house
@75% LTVInvest in shares
Initial investment of £25,000 £100,000 £25,000
After 5 years with 5% annual growth £127,600 £31,900
Wealth accumulation (capital gain) +£27,600 +£6,900
Source: Redfern Review calculation
20. What the table illustrates is that while house prices continue to rise in real terms, those excluded from home ownership are less able to accumulate wealth, which can exacerbate the inequality of wealth in our society as a whole. A further issue is that cash savings have generally been returning below inflation rates of return, driven by the low base rate environment and high liquidity supplied by the Bank of England.
21. Therefore, if some households are excluded from home ownership despite having a reasonable income this has clear implications for social cohesion and fairness (including intergenerational fairness). Recent decades have been financially much kinder to the post-war baby boomers who now control the lion’s share of the nation’s wealth. One thing is certain: we now have a society where for the first time the next generation isn’t expected to ‘do better’ than the previous one. If younger households on reasonable incomes are not able to access home ownership, the link between hard work and reward is much diminished.

– 27 –THE REDFERN REVIEW INTO THE DECLINE OF HOME OWNERSHIP
PA R T O N E : H O M E O W N E R S H I PPA R T O N E : H O M E O W N E R S H I P
CHAPTER 3:
What have been the causes of the decline in home ownership?1. As noted in Chapter 1, the decline in home ownership
has been most pronounced amongst young people. This also reflects a significant and prolonged decline in the number of first time buyers, especially since the credit crunch in 2008. The number of first time buyers fell sharply following the credit crunch to around 200,000 a year (UK figure), from around 400,000 in 2006 and 600,000 a year at the various peaks during the 1980s, 1990s and early 2000s.22 The number of first time buyers has since recovered to around 300,000 in 2014 and a similar number in 2015. The average number of first time buyers over the last 35 years has been around 400,000 a year.
2. Without a healthy inflow of first time buyers, home ownership levels overall are, of course, likely to fall. It is interesting to note, that with around 400,000 first time buyers a year on average during the 1980s, 1990s, and early 2000s, home ownership reached around 69% in the UK (and plateaued there for a while). This suggests a return to a 69%+ rate of home ownership would require around this number of first time buyers each year.
ANNUAL FIRST TIME BUYERS IN THE UK, 1979-2015
0
100
200
300
400
500
600
700
1980
1985
1990
1995
2000
2005
2010
2014
Average annual number of FTB Transactions (’000)
Average over period (1979-2014)
Source: CML, Je�eries estimates (house prices derived using CML LTV and size of mortgage data)
3. It is clear from our work that the housing market of the last 10-15 years has relatively disadvantaged younger, potential home owners, particularly those from poorer backgrounds who have less likelihood of help from family, either through support in a home purchase or from a future inheritance. This will always be true to some extent, and views about whether this is fair will differ. The Review team’s contention is that this trend has already done damage to social cohesion, faith in the political system and the sense of a generation that they can and should control their own destiny. We must address it.
4. As part of the Review, Oxford Economics was commissioned to build a model of the housing market to understand what has driven home ownership and house prices in recent decades. Details of the model and full results are available in the supplementary document ‘Forecasting UK house prices and home ownership: a report for the Redfern Review’.
5. The model was used to break down the determinants of the rapid 6.2 percentage point fall in the rate of home ownership in the UK from Q1 2002 to Q4 2014. The model identifies three leading causes of the fall, in order of importance: tougher first time buyer credit conditions; a rise in real house prices; and falling first time buyer incomes relative to those of non-first time buyers. Of course, any model will never totally represent the real world and therefore our results must be taken as indicative of the key trends rather than absolute. However we do believe that its conclusions offer interesting insights.
6. The modelling indicated that the biggest contribution to the fall came from the higher cost of and restrictions on mortgage lending for first time buyers after the financial crisis – namely tougher first time buyer credit constraints. This appears to have cut 3.8 percentage points off the home ownership rate by early 2014.
7. The second biggest contributor to the fall in the home ownership rate was the increase in house prices in the years before the financial crisis. Over the period, higher real house prices are estimated to have reduced the private home ownership rate by 2.6 percentage points.

– 28 –THE REDFERN REVIEW INTO THE DECLINE OF HOME OWNERSHIP
PA R T O N E : H O M E O W N E R S H I PPA R T O N E : H O M E O W N E R S H I P
8. The third driver of the fall has been the decline in the incomes of younger people, aged 28 to 40, relative to people aged 40-65. Namely the income of first time buyers relative to that of non-first time buyers. Younger people’s average income fell from approximate parity with the over-40s to almost 10% below in the wake of the financial crisis and recession. This reduced the relative buying power of would-be first time buyers, pulling down the home ownership rate over the period by around 1.4 percentage points.
9. Two other causes were found to have a statistically significant impact on the home ownership rate: real rents and the overall cost of mortgage capital (i.e. mortgage interest rates). Being broadly flat over the period, real rents had a negligible impact on the rate of home ownership. However, the fall in mortgage interest rates supported the rate of ownership by around 1.3 percentage points.
10. Finally, while the fall in home ownership in the market sector was substantial, it was ameliorated somewhat by changes in the social rented sector. In particular, it is likely that Right to Buy was responsible for offsetting some of the fall seen in the market sector. This increased the home ownership rate by around 0.8 percentage points. Around 400,000 properties were bought by tenants from the social rented sector over the period concerned.
Cause #1: Tougher first time buyer credit constraintsFirst time buyer credit constraints have caused 3.8 percentage points of the 6.2 percentage point fall in home ownership.
A 1 percentage point increase in the first time buyer credit constraint reduces the rate of home ownership by 2.2%.
11. First time buyer credit constraints have a couple of dimensions. The first is the size of deposit requirement and the second, related to this, is the high mortgage interest rate first time buyers must pay for a higher loan-to-value(LTV) mortgage compared to that of other borrowers (with lower LTV mortgages). In our modelling, the ‘credit constraint’ variable is capturing the conditions people face given that they are able to borrow, whereas the house price variable (see cause #2) is capturing the deposit dynamic.
12. In essence, our modelling captures the ease with which first time buyers are able to borrow the necessary funds to buy a home. This is proxied by the difference in the mortgage interest rate between 95% LTV mortgages and 75% LTV mortgages. This difference jumped from a nearly negligible level before the financial crisis to a spread of some 3% in its wake.
13. This divergence occurred when interest rates on 75% LTV mortgages fell with the sharp reductions in the Bank of England base rate in late 2008, while interest rates on high LTV mortgages actually rose. Initially, post crisis, the funding challenge also limited first time buyer mortgages as the limited funding available was focused on those with a larger deposit. The causes of the divergence in borrowing costs beyond that include changes in lenders’ appetite for risk, as well as numerous recent regulatory reforms, including Basel III and the UK’s Mortgage Market Review, which constrained high LTV lending. These constraints are likely to have manifested themselves in terms of both higher mortgage interest rates (prices) and volumes of lending to this segment of the market (quantities). So Oxford Economics’ measure of first time buyer credit constraints – ’Difference’ in the chart – should be thought of as a proxy for both price and quantity restrictions.
DRIVERS OF THE FALL IN HOME OWNERSHIP RATES BETWEEN Q1 2002 AND Q4 2014
(PERCENTAGE POINT CHANGE IN HO RATE)
Rent User cost of mortgage capital
First time buyer income ratio
First time buyer credit availability
Real house prices Social rented sector changes
-0.4%
1.3%
-1.4%
-3.8%
-2.6%
0.8%
Source: Oxford Economics model of the housing market

– 29 –THE REDFERN REVIEW INTO THE DECLINE OF HOME OWNERSHIP
PA R T O N E : H O M E O W N E R S H I P
DIVERGENT MORTGAGE RATES
0
5
10
15
Q1
1992
Q1
1993
Q1
1994
Q1
1995
Q1
1996
Q1
1997
Q1
1998
Q1
1999
Q1
2000
Q1
2001
Q1
2002
Q1
2003
Q1
2004
Q1
2005
Q1
2006
Q1
2007
Q1
2008
Q1
2009
Q1
2010
Q1
2011
Q1
2012
Q1
2013
Q1
2014
Q1
2015
Q1
2016
95% LTV average rate 75% LTV average rateDi�erence
Source: Bank of England
PA R T O N E : H O M E O W N E R S H I P
Cause #2: Rising real house pricesThe rise in real house prices has caused 2.6 percentage points of the 6.2 percentage point fall in home ownership.
A 10% increase in real house prices reduces the home ownership rate by 1.3%.
14. The period 1996 to 2006 in particular is noted for its boom in house prices which rose by 151% in real terms. Conversely, real earnings rose by ~39%. In other words, real house prices have risen at four times the rate of real earnings. Consequently, house prices today are around ten times average (single) earnings compared to around four times in the 1980s.
Many commentators have pointed to the rising house price to earnings ratio as a barrier to potential first time buyers trying to access home ownership. This will also have arisen through the mortgage lending requirements where loan to income restrictions and, later, the Mortgage Market Review affordability tests, will have meant relatively lower incomes to house prices have reduced mortgage accessibility. It is also clear that rising house prices will raise the size of deposit required (as will lender changes in loan to value requirements).
15. Higher loan-to-value mortgages carry greater risk for lenders (and borrowers) because they are more vulnerable to capital losses if house prices fall. Following the credit crunch, lenders became highly risk averse and high LTV mortgages of 90% or more all but disappeared from the mortgage market. In the 1980s, 1990s and 2000s preceding the credit crunch, the most common mortgages for first time buyers were at 90% or 95% LTV with a 10% or 5% deposit
HOUSE PRICES RELATIVE TO INCOME, UK
100
150
200
250
300
350
2015201220092006200320001997
Source: CML
FTB homes All homesMedian wages

– 30 –THE REDFERN REVIEW INTO THE DECLINE OF HOME OWNERSHIP
PA R T O N E : H O M E O W N E R S H I PPA R T O N E : H O M E O W N E R S H I P
requirement accordingly. However, immediately following the credit crunch, 75% or 80% LTV mortgages with a 25% or 20% deposit requirement became the norm. This had an immediate and dramatic impact on the number of first time buyers.
16. For many of those looking to buy their own home, this deposit requirement was insurmountable, given also the high level of house prices and the lack of a significant house price ‘correction’ in the wake of the credit crunch. This is best illustrated by looking at deposit requirements as a percentage of first time buyer incomes. At the depths of the financial crisis, the deposits which first time buyers paid was equivalent to 100% of annual income.
17. As a result, many pointed to the delay this would cause first time buyers in entering home ownership and the rising average age of the first time buyer became politically charged – so much so the figures are hotly disputed. According to the English Housing Survey (2014/15), the average age of first time buyers has risen from 31 to 33 over the decade from 2004-05.23
Halifax claims differing but also unexpectedly low changes to the average age of first time buyers (28 in 1983 to 30 in 2016 across the UK).24 It should be noted that this of course only counts those lucky enough to become first time buyers in the first place.
UK DEPOSIT LEVELS AS A % OF INCOME
0
20
40
60
80
100
120
Q2
1979
Q2
2015
Q2
1980
Q2
1981
Q2
1982
Q2
1983
Q2
1984
Q2
1985
Q2
1986
Q2
1987
Q2
1988
Q2
1989
Q2
1990
Q2
1991
Q2
1992
Q2
1993
Q2
1994
Q2
1995
Q2
1996
Q2
1997
Q2
1998
Q2
1999
Q2
2000
Q2
2001
Q2
2002
Q2
2003
Q2
2004
Q2
2005
Q2
2006
Q2
2007
Q2
2008
Q2
2009
Q2
2010
Q2
2011
Q2
2012
Q2
2013
Q2
2014
Source: CML (First time buyer deposit divided by their median income; income used by the mortgage lender when arranging mortgage)
UK FIRST TIME BUYER TRANSACTION LEVELS AND LOAN TO VALUE RATIO
0
20
40
60
80
100
120
140
160
180
70
80
90
100
Average quarterly number of FTB Transactions ('000)
Average FTB LTV (%)
Q1
1980
Q1
1995
Q1
2000
Q1
2005
Q1
2010
Q1
2015
Q1
1985
Q1
1990
Source: CML

– 31 –THE REDFERN REVIEW INTO THE DECLINE OF HOME OWNERSHIP
PA R T O N E : H O M E O W N E R S H I PPA R T O N E : H O M E O W N E R S H I P
18. ‘Generation Rent’, a study by the Halifax, found that one of the top three barriers to buying a home perceived by first time buyers was low income. In the study 53% of participants noted that wages are not keeping pace with increasing house prices.25
19. However, it is also notable that real rents rose by only 25% during 1996-2006, compared to the aforementioned 151% increase in real house prices. Although real house prices rose, a mitigating factor in the cost of home ownership was the rapid and marked fall in mortgage interest rates from a spike of just over 11% in 1992 to around 2% in 2014.
20. In summary, prior to the financial crisis, rapidly rising house prices had the effect of both reducing the financial attractiveness of owning (compared to renting) and pricing would-be first time buyers out.
Cause #3: fall in first time buyer incomes relative to non-first time buyer incomesFalling first time buyer incomes relative to non-first time buyer incomes have caused 1.4 percentage points of the 6.2 percentage point fall in home ownership.
A 10% increase in first buyer incomes relative to non-first time buyer incomes increases the home ownership rate by 1.67%.
21. As just discussed, average real earnings overall have not increased in line with average real house prices since 1996 (and indeed before that). But the position of first time buyers relative to other buyers – their ability to compete with them – is hugely important. We have already seen that first time buyers are at a competitive disadvantage compared to other buyers because they have less equity: but, whilst this has always been true, it has been exacerbated by rising house prices and stamp duty (SDLT), as well as the heightened mortgage deposit requirements in the wake of the financial crisis.
22. However, the competitive position of first time buyers relative to other buyers also depends on their relative earnings levels. Oxford Economics measure the earnings of would-be first time buyers relative to the earnings of older people, who typically already own a property, in order to measure their relative purchasing power. If the income of would-be first time buyers increases by more than that of existing owners, one would expect first time buyers to have more purchasing power in the housing market leading to an increase in home ownership.
23. Clearly the average earnings of first time buyers will depend on how old they are. Various studies (Meen, 2011; IFS 2012) find that first time buyers are overwhelmingly to be found in the age band 28-40.26 The income of would-be first time buyers and existing owners can therefore be proxied with the average income of individuals between 28 and 40, and 40-65, respectively.
24. As the graph below shows, this ratio of earnings was fairly constant prior to the financial crisis, hovering at around one (i.e. the average incomes of people in these two groups were very close), but has suffered a sharp fall since then. The incomes of people in the younger age band are now between 5% and 10% lower than those of their older counterparts.
RATIO OF INCOME (28-40 AND 40-65 YEAR OLDS)
0.8
0.9
1.0
1.1
Source: Labour Force SurveyAverage gross weekly income of employees aged 18-40 as a proportion of that for people aged 40-65
1992
1993
1994
1995
1996
1997
1998
1999
2000
2001
2002
2003
2004
2005
2006
2007
2008
2009
2010
2011
2012
2013
2014

– 32 –THE REDFERN REVIEW INTO THE DECLINE OF HOME OWNERSHIP
PA R T O N E : H O M E O W N E R S H I PPA R T O N E : H O M E O W N E R S H I P
Causes pre and post financial crisisThe rise in real house prices was the main cause of the fall in the home ownership rate before the financial crisis. First time buyer credit constraints were the main cause after.
Clearly the period since 2002 has been a volatile one in the housing market and the economy more widely, so it is interesting to split the contributions to the decline in the rate of home ownership into two periods: before and after the financial crisis. Home ownership rates declined in both periods, but were the drivers different? We analyse the factors contributing to this decline over two time periods – up to the start of the 2008 recession (Q1 2002-Q2 2008) and from the start of the recession to the end of 2014 (Q1 2008-Q4 2014). The results are shown in below.
25. The results show a very clear difference in the determinants of the falling rate of home ownership in each period. Prior to the financial crisis, rapidly rising house prices were overwhelmingly the main cause of the decline, accounting for more than twice the 2 percentage point fall, but being somewhat offset by other factors. The result was a 4.7 percentage point fall in the overall home ownership rate, although there was a modest offset from the rise in real rents, a shrinking social rented sector, and the fall in mortgage interest rates.
26. However, from the eve of the financial crisis, real house prices were already falling and remained below their pre-crisis peak at the end of 2014. Accordingly, other factors were to blame for the continuing fall in home ownership from 2008. Specifically the contribution chart shows that first time buyer credit constraints made a very large contribution to the fall in home ownership from this point, contributing 4.3 percentage points to the overall fall in the home ownership rate. Another significant contributor was the fall in first time buyer incomes relative to non-first time buyer incomes. A modest impact of falling real rents also contributed to the fall, with these forces being somewhat offset by falling house prices and mortgage interest rates.
EXPLAINING THE FALL IN THE MARKET SECTOR HOME OWNERSHIP RATE, Q1 2002-Q4 2014
Rent First Time Buyer Income Ratio
Social Rented Sector changes
First Time Buyer Credit Constraint
Cost of Mortgage Capital
Real House Price
2.10.5-1.1-1.2-4.3-0.2
Source: Oxford Economics model of the housing market
1.00.4
0.8
-0.3-4.7
0.7
Q2 2008-Q1 2014
Q1 2002-Q2 2008

– 33 –THE REDFERN REVIEW INTO THE DECLINE OF HOME OWNERSHIP
PA R T O N E : H O M E O W N E R S H I PPA R T O N E : H O M E O W N E R S H I P
CHAPTER 4:
Would more housing supply increase home ownership?Our modelling identifies no clear relationship between housing supply and the rate of home ownership.
1. In the public policy debate the fall in the rate of home ownership is often attributed to restrictions on (or a lack of) new housing supply. However, the new housing supply driver is conspicuous by its absence amongst the drivers of the decline in the rate of home ownership since its peak, identified in the modelling discussion in the previous chapter.
2. This could be for one of two reasons. The first reason could be that new housing supply has not actually fallen short of underlying household growth and so has not had an effect on the rate of home ownership. The second reason could be that new housing supply has fallen short of household growth, but that this still has not affected the rate of home ownership.
3. The official data says that both the housing stock and the number of households in the UK grew by a very similar amount over the period since the peak in home ownership. That does not exclude the possibility that households were unable to form during this time – i.e. that there was an underlying shortage (such as hidden households) – just that surplus stock of dwellings remained roughly constant. On the second reason, however, our results suggest that when surplus stock has increased or decreased from one year to the next, this has had no discernible impact on home ownership rates.
4. Importantly, our modelling results suggest there is no clear relationship between new housing supply and the rate of home ownership. One way of expressing the reason for this is that when supply has grown, this has tended to put downward pressure on both rents and prices in roughly equal measure, improving the attractiveness of both simultaneously. A 1% increase in the housing stock per household was found to reduce real house prices by 1.8% and real rents by 1.7%. The result therefore is no change in the home ownership rate. Consequently, it is less surprising to discover that increased house building is unlikely to have a clear effect either way on the rate of home ownership.
5. Another way to look at the dynamic effect of new supply on home ownership is to the extent that new supply allows the formation of a new private household (through affordability or availability) then that will either be an owner occupied home or a rented home. Which tenure of household is formed will depend on very similar social and economic factors at play for the existing housing stock – and if roughly 64% (the current home ownership level) of these new households are owner occupied then the home ownership rate will remain broadly stable.
6. At least two aspects of the modelling results overall are striking. First, the model reveals just how sensitive home ownership rates are to a divergence in credit constraints for first time buyers compared to other buyers with more housing equity (see previous chapter). Second, and contrary to common perception, additional housing stock does not appear to improve home ownership rates. For policymakers this implies that boosting new housing supply is unlikely to shift the home ownership rate. This counterintuitive result occurs because of two competing dynamics in the housing market (prices and rents) that offset one another.
7. Nevertheless, and as already touched on, our modelling shows that greater levels of new housing supply unambiguously lowers housing costs for both renters and owners – something that is more likely to boost their wellbeing than any specific rate of home ownership. It is also relevant to note that while the home ownership rate is unlikely to rise in the face of increases in housing supply, building more homes can stimulate increased household formation and improve availability.27 Consequently the absolute number of home owners is likely to rise in response to additional supply, even if the rate itself is unchanged. The scale of this increase and its responsiveness to new supply has been an area of real challenge for our team, with the Review team and some of the Panel believing that the vast majority of new supply will allow new household formation, but some of the Panel believing that this relationship is less responsive.

– 34 –THE REDFERN REVIEW INTO THE DECLINE OF HOME OWNERSHIP
PA R T O N E : H O M E O W N E R S H I PPA R T O N E : H O M E O W N E R S H I P
CHAPTER 5:
What can be done to increase home ownership?1. Housing can be thought of as two things: a ‘service’
and an ‘investment’. At the simplest level, a tenant in a rented home is paying rent solely for the benefit of housing services – they are entitled to none of the risks and rewards of housing as an investment. A landlord is largely interested in housing as an investment, having sold the benefits of housing as a service to their tenant. An owner occupier has both the benefits of housing as a service and as an investment, but also bears the costs and risks of both. This perspective on housing is useful because it helps to explain and analyse the relationship between home ownership and renting and therefore the rate of home ownership.
2. Examining some of these causal links, some of the following factors in isolation would increase the home ownership rate. Many of these have to be balanced against other often competing policy objectives:
a. An improvement in the borrowing position of first time buyers compared to existing owner occupiers and Buy to Let landlords would cause an increase in home ownership as more potential first time buyers were able to compete for and access home ownership. Such an improvement could occur through an easing of credit constraints for first time buyers – either through easing the prudential regulation or through first time buyer deposit assistance (Government or parental), as well as supporting potential first time buyers to save. It is also worth noting that, following the Mortgage Market Review, student loan repayments will be taken into account in assessing a first time buyers’ affordability, which will adversely affect the amount of mortgage they can borrow.
THE HOUSING MARKET AS A SYSTEM
Source: Oxford Economics model of the housing market
Housingsupply
Supply and demand for housing services Supply and demand for housing as investment
FTB bargaining power
Number ofhouseholds
Rentalprices
Home ownershiprate
Relative creditavailability for FTBs
Relative incomesof FTBs
Houseprices
Realincomes Base rate
Taxes
Mortgagerate
Expectedcapital gain
User cost ofowning
Othercosts
Expectedin�ation
Depreciation &
Maintenance
– 35 –THE REDFERN REVIEW INTO THE DECLINE OF HOME OWNERSHIP
PA R T O N E : H O M E O W N E R S H I PPA R T O N E : H O M E O W N E R S H I P
b. A decrease in the cost of becoming a home owner for first time buyers is likely to cause an increase in home ownership, as they are more able to afford the deposit and taxes needed to become a home owner. Such a cost reduction could include a reduction in real house prices, or preferential first time buyer stamp duty (SDLT) treatment.
c. An improvement in the relative incomes of first time buyers compared to existing owner occupiers and potential landlords would cause an increase in home ownership as more potential first time buyers are able to compete with non-first time buyers to afford the upfront and ongoing costs of home ownership. It is beyond the scope of this Review, but clearly policies to support a strong and buoyant labour market (and reducing the severity and effect of recessions on jobs) are important.
3. Of course many of these factors are not completely isolated and they inevitably overlap. A reduction in the costs of owning a house will also benefit potential landlords, increasing the number of rented properties and reducing the cost of renting. What is more important therefore is reducing the relative cost for potential first time buyers relative to that of potential landlords.
4. There are also many factors where the impacts will work both ways. For example, expectations of an increase in house prices will increase the desire of new home owners to buy their first home (i.e. before the goal posts move out of sight), but also the desire of landlords to buy for a good investment (i.e. capital gain).
5. In addition, not all of the factors that could potentially increase home ownership are desirable in themselves. For example, relaxing the prudential regulation to help credit constrained first time buyers could also jeopardise financial stability objectives and increase housing market risk.

– 36 –THE REDFERN REVIEW INTO THE DECLINE OF HOME OWNERSHIP
PA R T O N E : H O M E O W N E R S H I PPA R T O N E : H O M E O W N E R S H I P
CHAPTER 6:
Policy challenges to increasing home ownership1. Reversing the decline in home ownership is a huge
policy challenge. It will certainly require policies to address the specific causes of the decline we have identified, but there are additional challenges besides. We explore some these in what follows in the context of first time buyers – clearly a big part of the story – but also, later on, in the context of the Right to Buy.
First time buyers2. What is it that makes buying a first home such a
barrier for young (and not so young) people today? And what are the challenges that the Government face in trying to help them?
3. As our modelling of the housing market has uncovered, the relative position of potential first time buyers to other buyers in the market – including existing home owners and Buy to Let landlords – has a crucial bearing on the rate of home ownership (see Chapter 3). Ensuring that there is a level playing field between first time buyers and other market participants is therefore vital in preventing a further decline in the rate of home ownership, let alone reversing it. But there are further challenges besides ensuring a level playing field.
Challenge #1: A low awareness of Government schemes to support people into home ownership4. Our modelling suggests that policies such as the Help
to Buy Equity Loan and Mortgage Guarantee have helped to mitigate tougher first time buyer credit constraints and have supported the rate of home ownership since they were introduced. The recent tax increases for Buy to Let landlords – namely the 3% stamp duty (SDLT) surcharge and reduction in income tax relief on mortgage interest – have also probably aided a rebalancing.28 However, although these policies are likely to have been a positive for the rate of home ownership, we are concerned about the accompanying hostility to landlords and increasing uncertainty about their tax treatment could reduce investment in the private rented sector. This threatens to damage the position of future tenants and their ability to access rented accommodation as well as the housing market more widely.
5. In addition, our work has also uncovered a lack of awareness and understanding amongst young people of the Government support available to them when it comes to housing. During one of the independent focus groups commissioned by the Review, a low to non-existent level of knowledge of schemes such as Help to Buy, was apparent.29 Notably, there was a general assumption that finding information would be long and complex, as was the perception of the policies themselves. This left the focus group participants unable to conclude whether or not the Government is doing enough to help first time buyers. Further, participants were sceptical of the benefits of the schemes even when these were explained to them, with the common belief that there would be a ‘catch’ at some point. Indeed, unhelpfully, there did ultimately prove to be a catch with the Help to Buy ISA.30
6. Ironically though, our polls showed that people felt the UK Government had the most power to help those struggling to get onto the housing ladder, as discussed in the next section.
7. But this lack of awareness runs wider than just the Government schemes. Very few participants had any knowledge of the house buying process and where to even begin saving for a deposit. This suggests a need to provide the public with much more information and a stronger but simpler public awareness campaign.
Challenge #2: Young people are not saving enough8. First time buyers wanting to access home ownership
require a deposit – even with the Government Help to Buy schemes a 5% deposit is required, and given current house prices this is a significant amount of money in many locations. Barring help from family and friends, young people will need to be willing and able to save enough for their deposit in order to become first time buyers.
9. Encouraging people to save is clearly difficult in the current low savings rate environment. Our work also picked up the attitudes of people towards saving in order to become future home owners. Amongst our poll only 4% of current and prospective home owners felt that young people not saving enough was the top barrier to first time buyers getting onto the property ladder.31 Further, only 13% stated that first time

– 37 –THE REDFERN REVIEW INTO THE DECLINE OF HOME OWNERSHIP
PA R T O N E : H O M E O W N E R S H I PPA R T O N E : H O M E O W N E R S H I P
buyers had the power to help themselves onto the property ladder by saving more. In contrast, 36% saw ‘the UK Government’ and 24% the ‘Banks and Building Societies’ as having the most power to help those struggling to buy their first home.
10. Finally, participants in our research mentioned there was too much uncertainty in the markets – both labour and housing – to be able to firmly predict when they would be able to buy and how much they would need to save. Clearly rising house prices also render the deposit requirement a moving target, which can lead many to question the point of saving. However, one positive was that the youngest age bracket (18-34) in our poll, on average reported saving the highest proportion (20%) of their income.32
11. The ability to save is also clearly important and the rising cost of living makes it more difficult for young people to put money aside. Those in our poll aged 18-34 reported spending a higher proportion of their income on rent or mortgage payments than older age groups: 18% of respondents reported that they spend between half and three-quarters of their household income on accommodation costs; whilst 52% claimed that they couldn’t save any more than they currently do.
12. Given high house prices and in turn the high associated deposit requirement, it can take young people many years to save for their deposit. The sacrifices that young people must make in order to save (asides from negligible savings rates) will have a
bearing on their morale and lifestyle choices. Shelter have modelled how many years it would take for different household types to save in different parts of the country using earnings data and projected earnings growth as well as rents and house prices, assuming that 20% of discretionary income33 is saved. They find that even a couple without children (the household type most able to save) would need an average 6.6 years to save for a deposit in the UK, ranging from 4.3 years in the North East to 13.5 years in London.
WHICH OF THE FOLLOWING DO YOU THINK HAS THE MOST POWER TO MAKE IT EASIER FOR PEOPLE
TO BUY THEIR FIRST HOME?
Source: Redfern Review polls
�e UK Government (36%)
Banks and Building Societies (24%)
Families helping �rst time buyers with their deposit (14%)
First time buyers themselves (13%)
Property developers (7%)
Local government planning departments (6%)
AVERAGE LENGTH OF TIME TO SAVE FOR A DEPOSIT IN EACH REGION (YEARS)34
Region Couple without children
Couple with one child Single individual
Extra time that families need over couples
England 6.6 12.3 13.3 5.7
North East 4.3 8.8 9.3 4.6
North West 4.6 9.3 9.8 4.7
Yorkshire and The Humber 5.0 9.3 10.3 4.3
East Midlands 5.5 10.5 11.1 5.0
West Midlands 5.8 10.8 11.6 5.1
East 7.1 13.0 13.9 5.9
London 13.5 25.8 29.1 12.3
South East 8.3 15.3 16.3 6.9
South West 8.0 14.6 15.8 6.6
Source: Shelter, A Home of Their Own, January 2015

– 38 –THE REDFERN REVIEW INTO THE DECLINE OF HOME OWNERSHIP
PA R T O N E : H O M E O W N E R S H I P
Challenge #3: ‘Generation debt’13. Recent research into ‘Generation debt’ found that
just under half of young people questioned (48%) had debts which didn’t include a student loan or mortgage, with the average amount owed being £3,109. Worryingly, it also concluded that there was a broad consensus that significant debt has become a normal state of affairs; one fifth of people surveyed struggled to pay their mortgage some months.35
14. The charity StepChange, which provides debt advice, found that those under 25 are more likely to have payday loans, be in arrears on council tax and water bills, and be behind with rent payments. They reported that those in rented accommodation needed the most help with their debt; in 2015 over 75% of StepChange clients were renting, compared with a little over 50% five years ago.36 Contrary to the belief that young people are living beyond their means, StepChange argues that this debt is driven by volatile incomes, with casual work, short-term jobs and zero-hours contracts becoming the norm.37
Many no longer have the ‘luxury’ of a regular guaranteed income, and turn to credit cards, overdrafts and payday loans to fill the gaps. In November 2015, the Bank of England marked the highest ever monthly total borrowing on credit cards, overdrafts and loans since June 2005.38 Being in debt is fast becoming a normal state of affairs for many.
15. University tuition fees and student debt are another big part of the ‘Generation debt’ story. University tuition fees are now capped at £9,000 under the ‘Plan 2 system’, compared to £3,345 per year under the ‘Plan 1’ system in place until 2012. The first student cohort to have graduated under the ‘Plan 2’ system of £9,000 per year maximum tuition fees became liable to start repayment from April 2016. It has been estimated that the average graduate student loan debt from 2016 will be around £44,000, significantly more than that of a student graduating under the previous system.39
PA R T O N E : H O M E O W N E R S H I P
STUDENT LOAN REPAYMENT PLAN THRESHOLDS
Repayment thresholds
Annual income before tax (£)
Monthly Salary before tax (£) Interest structure Repayment
structureDebt write off
period
Plan 1 (pre 2012) 17,495 1,457 RPI 9% of gross income above threshold 25 years
Plan 2 (post 2012) 21,000 1,750 RPI + 0-3% 9% of gross income above threshold 30 years
Source: Student Loans Company
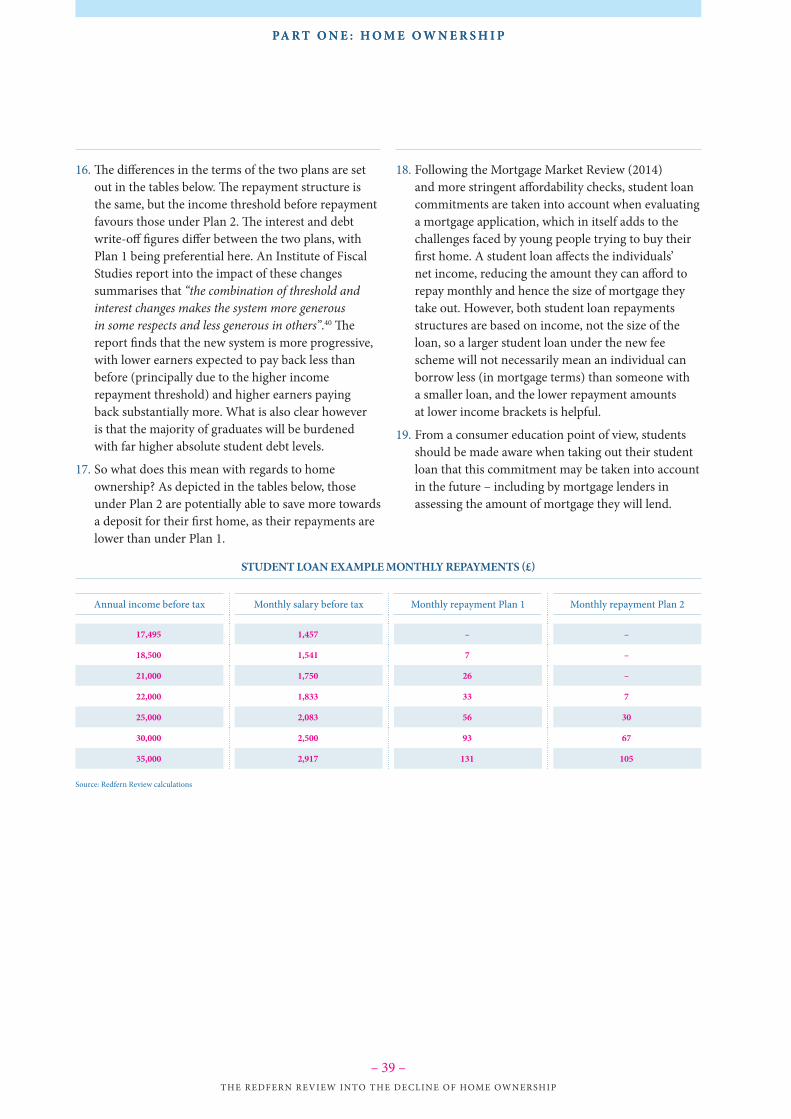
– 39 –THE REDFERN REVIEW INTO THE DECLINE OF HOME OWNERSHIP
PA R T O N E : H O M E O W N E R S H I P
16. The differences in the terms of the two plans are set out in the tables below. The repayment structure is the same, but the income threshold before repayment favours those under Plan 2. The interest and debt write-off figures differ between the two plans, with Plan 1 being preferential here. An Institute of Fiscal Studies report into the impact of these changes summarises that “the combination of threshold and interest changes makes the system more generous in some respects and less generous in others”.40 The report finds that the new system is more progressive, with lower earners expected to pay back less than before (principally due to the higher income repayment threshold) and higher earners paying back substantially more. What is also clear however is that the majority of graduates will be burdened with far higher absolute student debt levels.
17. So what does this mean with regards to home ownership? As depicted in the tables below, those under Plan 2 are potentially able to save more towards a deposit for their first home, as their repayments are lower than under Plan 1.
PA R T O N E : H O M E O W N E R S H I P
18. Following the Mortgage Market Review (2014) and more stringent affordability checks, student loan commitments are taken into account when evaluating a mortgage application, which in itself adds to the challenges faced by young people trying to buy their first home. A student loan affects the individuals’ net income, reducing the amount they can afford to repay monthly and hence the size of mortgage they take out. However, both student loan repayments structures are based on income, not the size of the loan, so a larger student loan under the new fee scheme will not necessarily mean an individual can borrow less (in mortgage terms) than someone with a smaller loan, and the lower repayment amounts at lower income brackets is helpful.
19. From a consumer education point of view, students should be made aware when taking out their student loan that this commitment may be taken into account in the future – including by mortgage lenders in assessing the amount of mortgage they will lend.
STUDENT LOAN EXAMPLE MONTHLY REPAYMENTS (£)
Annual income before tax Monthly salary before tax Monthly repayment Plan 1 Monthly repayment Plan 2
17,495 1,457 – –
18,500 1,541 7 –
21,000 1,750 26 –
22,000 1,833 33 7
25,000 2,083 56 30
30,000 2,500 93 67
35,000 2,917 131 105
Source: Redfern Review calculations

– 40 –THE REDFERN REVIEW INTO THE DECLINE OF HOME OWNERSHIP
PA R T O N E : H O M E O W N E R S H I PPA R T O N E : H O M E O W N E R S H I P
20. Crucially for this Review, it appears that undergraduate expectations with regards to home ownership have declined significantly in the last 10 years. From a survey of over 18,000 students graduating in 2016, 67% expected to own their own house by the age of 30; a reduction of 10 percentage points since 2006, as shown below.41 The biggest decline in the numbers expecting to own a home by the age of 30 was seen between 2014 and 2015, which coincides with the tuition fee increase, though other factors may have been at play.
21. If these expectations come to pass then it will clearly result in a further increase in the average age of first time buyers, and could consequently exert downwards pressure on first time buyer numbers and the home ownership rate.
The Right to BuyChallenge #4: sustaining the number of Right to Buy sales22. As our earlier commentary noted, the Right to Buy
was a big driver of the rise in the home ownership rate in the 1980s and 1990s, propelling the home ownership rate upwards towards its peak. Even in the period we are concerned with, namely since the
peak in the rate of home ownership, our modelling of the housing market shows that changes in the social rented sector – including the Right to Buy – boosted the rate of home ownership by 0.8 percentage points, helping to offset the decline overall.
23. However, the decline in the rate of home ownership since its peak must be viewed in a longer term context. Margaret Thatcher’s Right to Buy policy (and its subsequent iterations42) created an additional stream of new home owners alongside other first time buyers. Following the enactment of the Housing Act 1980, the Right to Buy generated 970,558 new home owners in its first 10 years, or nearly 100,000 a year. However, because the council houses sold at this time were not replaced with new ones, the original policy led to a commensurate depletion of council housing stock. What is also interesting about this time was the near constancy of the rate of private renting. Therefore, the rise in the rate of home ownership in the 1980s and 1990s was mirrored almost exactly by a corresponding fall in the rate of social renting (see line chart in chart below).43
0
20
40
60
80
100
20162015201420132012201120102009200820072006
Source: High Fliers Research (�e UK Graduate Careers Survey 2006-2016)
77% 77% 78% 77% 77% 75% 74% 73% 72%67% 67%
FINAL YEAR UNIVERSITY STUDENTS EXPECTING TO OWN THEIR OWN HOUSE OR FLAT
BY AGE 30, 2006-2016 (%)OWNER OCCUPIER AND
SOCIAL RENTER SHARES 1980-2015
10
20
30
40
50
60
70
80
1980
1985
1990
1995
2000
2005
2009
-10
2014
-15
Source: DCLG, English Housing Survey 2014/15
Split Owner occupiersSocial renters%

– 41 –THE REDFERN REVIEW INTO THE DECLINE OF HOME OWNERSHIP
PA R T O N E : H O M E O W N E R S H I P
26. The Right to Buy scheme in its original form has been a short-term boost to home ownership but one which could not be sustained longer term. Some research has suggested that as many as 40% of the homes sold under the Right to Buy subsequently ended up in the private rented sector45 – resulting in a policy that was intended to boost home ownership having a contradictory effect. This lesson of sustainability should be carried forward in any new policies, including Help to Buy and Starter Homes initiatives.
Challenge #5: barriers to tenure transitions27. Finally, as part of the Review we have considered the
challenges of moving between different tenures and the cost implications of this. We have also assessed moving up and down the housing ladder and how this affects the housing market. The work is set out in a separate document entitled ‘Barriers to Tenure Transitions’, available on the Review website.
PA R T O N E : H O M E O W N E R S H I P
24. However, as the more desirable council homes were sold off to those social tenants most able to buy, the stock of council houses fell, and so, the number of homes left to sell (and of those able to buy them) diminished. Therefore, this was inevitably a story of ever-diminishing Right to Buy sales: during the 1990s, the number of Right to Buy sales had more than halved to 469,428, and fell further to 414,053 in the 10 years to 2010. Between 2010 and 2015 only 48,061 homes were sold through the Right to Buy.44
25. It is interesting that the number of Right to Buy sales fell markedly from 2004/05, close to the peak in the rate of home ownership. It is indisputable that the decline in Right to Buy sales has reduced the growth in the rate of home ownership, given it was such a large contributor in the 1980s and 1990s. There have been some important reforms to the Right to Buy since, most notably the policy to replace some of the homes sold on a one-for-one basis, which will help to slow the depletion of the social rent housing stock (but will not stop it).
TOTAL RIGHT TO BUY SALES IN ENGLAND (‘000)
0
200
400
600
800
1,000
1,200
1,400
1,600
1,800
2,000
2014
-15
2009
-10
2004
-05
1999
-00
1994
-95
1989
-90
1984
-85
1980
-81
Source: DCLG

– 42 –THE REDFERN REVIEW INTO THE DECLINE OF HOME OWNERSHIP
PA R T O N E : H O M E O W N E R S H I PPA R T O N E : H O M E O W N E R S H I P
CHAPTER 7:
Policy discussion – home ownership1. It is clear from our analysis and modelling that
first time buyers have faced significant challenges and disadvantages in the housing market in the last 10-15 years, lacking the ability to compete with other purchasers in the market on the basis of their earnings and access to credit (i.e. deposit). These disadvantages have been exacerbated by rising house prices and this has clearly adversely impacted on home ownership rates. These are however macroeconomic factors that are very hard to address through specific housing market measures.
2. The often insurmountable challenges to building a sufficiently big deposit has also led many to rely on external help to finance their first home. It is expected that in 2016, the ‘Bank of Mum and Dad’ will be involved in a quarter of all mortgage transactions, helping 305,900 of their family members with an average £17,500, to fund the purchase of £77 billion worth of property.46 Obviously the quantum of this help varies dependent on individual circumstances, but the fact that help is available for some and not others immediately creates a division. What is considered ‘fair’ in this instance is subjective. On one hand exists the incredibly rational and reasonable choice for a parent, family member or friend to help a loved one, if they have the ability to do so, especially if they have accumulated wealth through property ownership. On the other hand, this support is not available to the most vulnerable.
3. Without some form of government support towards first time buyer deposits, we are faced with the stark possibility that if your parents do not own a home, you probably won’t either. Such disparity would entrench intergenerational inequality, cutting the traditional connection between hard work and rewards, isolating a portion of society. This goes some way towards justifying the Government’s Help to Buy Equity Loan and Mortgage Guarantee schemes, as well as the Help to Buy ISA and Lifetime ISA, designed to provide home buyers with a deposit boost in one form or another.
4. However, if we genuinely want to increase home ownership rates then we either need to challenge relative wage rates (which is clearly beyond the scope of this Review), mortgage lending standards or provide specific subsidies for certain ‘qualifying’ groups.
5. We find it hard to recommend a return to mortgage lending standards that do not differentiate on risk – even though this would help encourage home ownership by levelling the playing field. To remove the changes to lending criteria for low deposit borrowers that have developed over the last eight years is effectively asking lenders to cross-subsidise just to support home ownership. From past experience and international comparison (for example with the US), we have already learnt that this is to the risk and eventual cost of all. We note that the introduction of tighter lending criteria following the Mortgage Market Review does not appear to have affected the number of first time buyers; though any effect could have been muddied by the near-simultaneous introduction of the Help to Buy schemes.
6. There have been many direct attempts to subsidise different potential home buyers. The Right to Buy and the various Help to Buy schemes are the most obvious. These have been partially successful and arguably more could be done. But equally we must recognise the limitations of these schemes (as well as some of the challenges in making the public aware of them).
7. For example, the number of Right to Buy purchases remains relatively low and despite the reinvigoration of the policy in 2012 and the recent extension to housing association tenants, the total number of Right to Buy sales is unlikely to reach anywhere near the 100,000 sales each year in the 1980s, or even the 400,000 a year seen in the 1990s. These are the sorts of numbers which helped propel the home ownership rate in England to its peak of just over 70% in the past. The rate of home ownership could be increased by larger subsidy to sell off the social housing stock, but without replacement it is clearly not sustainable and diminishes the availability of affordable housing, impacting the poorest needing to access shelter. So policy should be determined by considerations other than the single-minded pursuit of the home ownership rate.

– 43 –THE REDFERN REVIEW INTO THE DECLINE OF HOME OWNERSHIP
PA R T O N E : H O M E O W N E R S H I PPA R T O N E : H O M E O W N E R S H I P
8. In similar vein, there have been only 92,000 purchases through Help to Buy: Equity Loan during the first 39 months of the scheme, of which 74,000 (81%) were first time buyers – 65% of whom had no more than a 5% deposit.47 So it has helped just over 22,500 first time buyers a year (in the context of an average 400,000 first time buyers a year over the last 35 years). Some of the 22,500 would have bought their first home anyway without the scheme. Further, Help to Buy Equity Loan, is due to close in 2021. So on its current timeline it will only have a fairly small effect on total home ownership levels, and if in place permanently it risks having some inflationary effect which disadvantages future first time buyers, especially as we move further beyond the recovery phase of the economic cycle.
9. Ultimately, Help to Buy: Equity Loan will inflate house prices to the extent it does not create incremental supply. A recent report by DCLG put the additionality of the scheme at 43%.48 That means that for every 100 homes built through the support of Help to Buy Equity Loan, 57 would have been built anyway.
10. We also observe that the uptake of the Help to Buy Equity Loan has been greater in the North of England where on average properties are cheaper. Only 1.8% of Help to Buy Equity Loans nationally are taken up in London, where the average house price to household income ratio is said to be 10.4. This partly explains why the Government has moved to increase the generosity of the scheme by introducing London Help to Buy. Conversely, 6.7% of loans nationally are taken up in the North East, where the average house price to income ratio is said to be 5.0.49 This suggests that the Equity Loan is supporting buyers (and house building) in more affordable parts of the country, as opposed to those in more expensive areas such as London and the South East – also where less housing is available.
The Review team believe that there is a place for Help to Buy in helping first time buyers access home ownership. It has the dual impact of improving the borrowing capacity of young people and providing a potential countercyclical boost to supply. However, to achieve these roles over the long-term without being price inflationary, it needs to be more carefully targeted – to first time buyers only and to either lower income groups or to lower bands of house prices on a regional basis. It would be reasonable to use it in its current ‘unrestricted form’ as a countercyclical tool to maintain supply, and it would be helpful for this to be a pre-planned and signalled intention.
11. Turning to Starter Homes, the Starter Homes Exception Sites policy is already in place, aiming to encourage the development of Starter Homes on under-used or unviable brownfield land, that has yet to be identified for housing. Local authorities are charged with securing a pipeline of suitable sites and approving applications unless there are demonstrable conflicts with the National Planning Policy Framework (NPPF). The developer is incentivised via a CIL exemption, though amendments to relevant regulations have not yet been forthcoming. Anecdotally there has been little planning activity around Exception Sites.
12. Given its audience, the Starter Homes scheme is likely to compete with other schemes such as Help to Buy and Shared Ownership; which begs the question of whether the policy will bring additional homes to the market, or result in the cannibalisation of other products aimed at first time buyers and those on the housing waiting lists.50
13. The Government’s preferred position, as set out in the Starter Homes Regulations Technical Consultation (March 2016), is a 20% Starter Home requirement across all reasonably sized sites in England, displacing a significant number of traditional affordable housing units. Starter Homes are likely to compete directly for funding with affordable rent and shared ownership when developers negotiate a Section 106 agreement. As such, in terms of units delivered through Section 106, it is difficult to see how Starter Homes will result in any additional new supply which would not have been delivered anyway in the form of other tenures, even though they will boost home ownership to the degree they displace affordable rent.

– 44 –THE REDFERN REVIEW INTO THE DECLINE OF HOME OWNERSHIP
PA R T O N E : H O M E O W N E R S H I PPA R T O N E : H O M E O W N E R S H I P
The Exception Sites policy may have more success in this regard, as some brownfield sites may come forward for Starter Homes development that might not otherwise have done. However, it remains to be seen whether the policy provides sufficient incentive for both developers and local authorities.
14. Worryingly, in many regions where house prices and demand are the highest – London, the South East and the East of England – delivering Starter Homes will be more challenging due to the price thresholds. This could however simply drive local authorities to require a bigger than 20% discount, in turn driving a smaller unit typology and more pressure to scale back other affordable housing provision.
15. In theory Starter Homes may make good sense, particularly when considering our findings on the reasons behind the decline in home ownership. However, looking at this from a moral and social point of view, is it fair that a select few benefit from a 20% discount that they can cash in on after the cut off period, with no recycling of the benefit for future investment into housing delivery? The Review recommends that the Starter Home discount should be in perpetuity. If this was the case, the Starter Homes scheme would become more acceptable in principle, but even then, is likely to displace other types of ‘affordable’ housing, particularly shared ownership, rather than provide supply that is genuinely additional.
16. Given how difficult it is for many young people to save and the debt placed on many of our graduates, it is clearly important that young people should be supported to save as far as they can, including for a deposit. This appears to be the most sustainable policy to directly support home ownership in a way that does not create significant additional house price inflation. The Office for Budget Responsibility expects the Help to Buy ISA to have “no impact on house prices or transactions”. The Help to Buy ISA and Lifetime ISA are sensible ways of enabling young people to build a deposit for their first home more quickly than otherwise, helping to level the playing field compared to older people and current home owners who have more equity.
17. Although in its infancy, the Help to Buy ISA encourages a saving mentality and is an incentive less focused on the immediate purchase of a home, but on potential purchasers being given support and encouragement to build the deposit required. Whilst we don’t believe that the Lifetime ISA/Help to Buy ISA in their current form are likely to have a material short-term impact, directionally the principles of the scheme are very positive, so we would encourage a review aimed at improving the amount that can be saved and the quantum of government support.
18. For first time buyers saving for a deposit, stamp duty (SDLT) must be built into their savings budget, along with the other associated moving costs, essentially adding time to their period of saving before they can look to purchase. For anyone else looking to move up or indeed down the property ladder, SDLT is “essentially a charge on moving house”.51 Interestingly, the Yorkshire Building Society has suggested charging SDLT to sellers rather than buyers. Although this might not alter who actually bears the tax (this depends on the so-called tax incidence – which can shift the sale price to accommodate the tax), it could ease the upfront cash requirement for first time buyers in particular.
19. Finally, we note the effect that the original Right to Buy policy has had on the rate of home ownership. This has ultimately proved to be unsustainable because of the falling council house stock – as a result of not replacing every council home sold with a new council home. Full one-for-one replacement of all council homes sold through the Right to Buy would sustain the council housing stock and the level of Right to Buy sales in the future.

– 45 –THE REDFERN REVIEW INTO THE DECLINE OF HOME OWNERSHIP
PA R T O N E : H O M E O W N E R S H I PPA R T O N E : H O M E O W N E R S H I P
Policy options – Part onePromoting home ownership and improving
the housing position of young people
Our focus is on improving the position of first time buyers and those who remain
in rented accommodation, rather than driving a maximum, short-term home
ownership rate.1. The Help to Buy Equity Loan scheme is an effective
tool in supporting both new home owners and new housing supply. It is there to offset the disadvantages faced by first time buyers in accessing mortgages since the global financial crisis. However it does bear inflationary risk. Consideration should be given to targeting it more exclusively to first time buyers and lower price points on a regional basis, whilst extending its term beyond 2021 for this restricted group. Retaining its use on an ‘unrestricted’ basis as today can then be considered as a countercyclical action by government.
2. The Starter Homes policy should be retained but on exception sites only and with the first time buyer discount retained in perpetuity.
3. More support should be given to programmes that promote saving amongst young people. The maximum scale of the Lifetime ISA should be increased and consideration given to increasing the level of Government contribution, making a more significant impact on the deposit required by first time buyers. Whilst this is not the fastest path to home ownership, it is one of the most sustainable, and the long-term benefits are significant.
4. The Right to Buy one-for-one replacement policy should be extended so that all council homes sold through the scheme are replaced rather than just some of them under the current policy; to ensure that affordable rented housing remains available to those who need it and to sustain Right to Buy sales in the future.
5. Consideration should be given to improving the position for tenants, taking into account the increasing number of tenants who are long-term renters, and/or are young families. This should be focused on improving conditions without unnecessarily increasing landlords’ costs.

PART TWO: Th e Housing Market
Th e causes of the increase in house
prices since 1996
R E D F E R N R E V I E W

– 47 –THE REDFERN REVIEW INTO THE DECLINE OF HOME OWNERSHIP
PA R T T W O : T H E H O U S I N G M A R K E T
CHAPTER 8:
What have been the causes of the increase in house prices?1. The relatively simple ‘supply and demand’ model
whereby increasing supply will reduce prices, which fits most commodities, just doesn’t work for housing. That is principally (and very simplistically!) because housing lasts a long time: new housing supply relative to the housing stock is very small. But it is also because housing is unique and is essentially local. This can mean that changes in house prices do not always reflect changes in supply and indeed the availability of housing. A myriad or other factors driving house prices are often at play.
2. To take the example of the Republic of Ireland from Saunders:
“Between 1996 and 2006, house prices there spiralled much higher than Britain despite
a feverish construction boom. A total of 700,000 new homes were built in Ireland in those 10 years – one for every six people in the country. Yet the average price of new
houses still went up by 250 per cent between 1996 and 2006, and that of existing houses increased by 300 per cent. The scale of this house price boom was vastly greater than in Britain, despite all that new building.After 2008, when the bubble burst, house
prices in Ireland fell by 50 per cent over the next four years, although they have been
recently recovering. Thousands of newly-built homes were left empty and 20,000 homes on
‘ghost estates’ are now being demolished. Clearly, Ireland’s problem in the early years of this century was not limited by supply; it was
profligate lending by banks for real estate purchases which over-stretched demand.” 52
3. In his historical analysis of the UK housing market, Saunders estimates that in the period from 1960–1999, the House Price Index rose from 123.2 to 3,947.5 (+3,104%); average earnings increased from £545.06/annum to £15,825 (2,803%); and general retail prices (of goods and services) rose by ‘just’ 1,228%.53 Therefore, whilst house prices and earnings increased almost in tandem, other prices in the economy rose much more slowly. In other words, house prices stayed flat relative to wages. In short, there was stability of house prices to earnings.
4. Such stability also implies that first time buyers spent much the same proportion of their earnings on their home as previous generations. Owner occupiers benefited from the real capital growth in their homes, “but because houses were no more expensive relative to earnings than before, they were able to make these gains without new buyers losing [out].”
5. From the end of 1996 to the end of 2006 there was a sustained house price boom in the UK, and over the decade UK house prices rose by 151% in real terms. Excluding the very peak of the bubble, we examined the drivers of price growth over the 10 years from 1996 to 2006. It is often suggested that the biggest contribution to this increase was a shortage of supply. However, this is a misleading, or at least over simplistic view of this period.
AVERAGE UK HOUSE PRICE, 2016 PRICES (‘000)
50
70
90
110
130
150
170
190
210
230
250
£
Q1
1992
Q1
1993
Q1
1994
Q1
1995
Q1
1996
Q1
1997
Q1
1998
Q1
1999
Q1
2000
Q1
2001
Q1
2002
Q1
2003
Q1
2004
Q1
2005
Q1
2006
Q1
2007
Q1
2008
Q1
2009
Q1
2010
Q1
2011
Q1
2012
Q1
2013
Q1
2014
Q1
2015
Q1
2016
Source: UK House Price Index

– 48 –THE REDFERN REVIEW INTO THE DECLINE OF HOME OWNERSHIP
PA R T T W O : T H E H O U S I N G M A R K E T
9. As already discussed, during the boom period new housing supply outstripped the rate of household formation. But since the financial crisis this picture has reversed. Our modelling results therefore also have implications for the contribution of supply constraints to house prices in recent years, as price growth has again gathered pace. For example, between 2013 and 2014 270,000 new households are estimated to have formed in the UK, while net new supply was 159,000 in the year to 31 March 2014. The shortfall of new supply in this case was therefore around 110,000 dwellings or around 0.4% of the stock of dwellings in the UK in 2013, which stood at 27.91 million. Our modelling suggests that the shortfall was responsible for pushing up prices by around 0.7% over the course of that year. In total overall prices rose by 4.6% in real terms, indicating that even in the year to early 2014, an unusually large shortfall of supply was not a particularly large driver of recent house price inflation.
10. Applying the results of our model to the historical data reveals the contributions of various factors to the boom in house prices in the 1996 – 2006 period:
DRIVERS OF THE HOUSE PRICE BOOM BETWEEN Q4 1996 AND Q4 2006
(PERCENTAGE POINT CHANGE IN REAL HOUSE PRICES)
Number of households Housing supply Earnings
Credit availability User cost
22%
-24%
107%
6%
38%
Source: Oxford Economics model of the housing market
Our model suggests that housing supply constraints contributed little to price growth between 1996 and 2006
6. Much like the Saunders prognosis, our model of the housing market suggests that much of the increase in real house prices was driven not by driven by an acute lack of overall supply. Looking at the housing stock per household, we can see that the increase in household numbers over the period was more than offset by increases in the number of dwellings. In the ten years from the end of 1996 1.88 million new households appeared, while the dwelling stock rose by 2.04 million units. Consequently, despite the sensitivity of prices to changes in the ratio of dwellings to households, this variable actually increased slightly, and hence did not contribute to price growth over the decade. However, again, we cannot conclude from this an absence of pressures surrounding the availability of housing, and more is said on the distinction between ‘prices’ and ‘availability’ later in this chapter.
Rising incomes and falling interest rates, were the major drivers of the boom in house prices between 1996 and 2006…
7. Our economic model suggests instead that the main driver of the house price boom during the decade was growing real household incomes, rising employment and falling user costs driven primarily by declining mortgage interest rates. In keeping with other studies, we find that house prices are highly sensitive to household incomes, such that a 1% increase in average real average income per household raises prices by 2.2%. Sharp falls in real incomes after the financial crisis were a factor driving prices down.
8. The other significant determinant was the falling user cost of capital, primarily falling mortgage interest rates. Typical nominal mortgage interest rates fell from just over 11% in 1992 to around 2-3% by the end of 2014, sustaining a further increase in house prices.

– 49 –THE REDFERN REVIEW INTO THE DECLINE OF HOME OWNERSHIP
PA R T T W O : T H E H O U S I N G M A R K E T
15. In particular, the Review team would remind readers of Kate Barker’s assertion in 2004: “New supply only accounts for 1 per cent of the housing stock, and so even measures which change new supply significantly would not have much effect on prices were it not for the role of expectations.”54
Additional supply will reduce prices only if maintained over the long-term
16. The results of our modelling show that a 1% increase in the number of dwellings, or a 1% fall in the number of households, would reduce real prices by only 1.8%. This result is in line with the results of similar past modelling exercises, including a recent paper from the Office for Budget Responsibility.
17. For policymakers the implications of this analysis are very relevant. Restrictions on new housing supply have not been the main culprit when it comes to price rises over the past 25 years. Looking forward, if the number of households in the UK were to grow at around 200,000 per year, net new supply of 300,000 dwellings per year over a decade could be expected to cut real house prices by around 5 percentage points (0.5 percentage points a year). In other words, boosting housing supply is only likely to have a material impact on house prices if sustained over a long period. This does not take account of the role of expectations which could be expected to accentuate the house price effect of increased supply.
18. Of course, this doesn’t prove that supply isn’t an issue, it just illustrates that in the short-term, supply can increase and prices will continue to rise, often based on optimistic projections of future house price trends.
19. In reality housing supply and house prices are only connected in the very short-term and the very long-term. In the long-term as our modelling demonstrates. In the short-term at a local market level week by week, based on the absolute availability of individual homes for sale, set against real, financed prospective buyers and what they are willing or able to pay, directly impacts price – this dynamic in particular has impacted heavily on central London prices over recent years.
11. Looking beyond the house price boom of 1996 to 2006 and to the future, these results can also be used to find out which of the determinants were responsible for past changes in house prices and home ownership. This in turn helps to shed light on the nature of the policy challenge. We find:
• A 1% increase in housing stock, or 1% fall in household numbers (i.e. increased housing availability) lowers real house prices by 1.8%;
• A 1% increase in real earnings per household raises real house prices by 2.2% in total; and
• A 1% increase in the cost of capital – i.e. the mortgage interest rate (e.g. from 4% to 4.04%) lowers real house prices by 0.19%.
12. This has important implications for the stability of house prices to earnings. In order for real house prices to rise in line with real earnings in the longer run, with current low interest rates, we would have to substantially ‘out build’ the growth in the number of households, assuming that in this scenario all the elasticities remained the same. With real earnings growing at 1.5% per year, real house price rises would be in the order of 3% annually, all other things being equal. This implies we would have to ‘out build’ the growth in households to trim the real house price rate increases back to anything near 1.5% – i.e. the same as real earnings growth – and so stabilise prices relative to earnings.
13. However, our modelling results suggest that if mortgage interest rates returned to past norms, this would largely offset any likely house price growth from incomes over the next decade.
14. There could of course be a possible further ‘tailwind’ effect on house price inflation if house price inflation expectations adjusted. This is similar to what happened to general RPI inflation expectations during the 1990s as the Government and later the independent Bank of England brought general (RPI) inflation under control and, over many years, built the credibility of its policy stance. As part of that virtuous circle, for example, reduced house price inflation expectations would also reduce the attractiveness of housing as an investment (i.e. diminished expected capital gains) so quelling demand (and prices).

– 50 –THE REDFERN REVIEW INTO THE DECLINE OF HOME OWNERSHIP
PA R T T W O : T H E H O U S I N G M A R K E T
4. The biggest variance in the cost of owning a home is likely to come from changes in the cost of the mortgage interest (maintenance costs are broadly constant over time). This will depend on the size of the mortgage, which is determined largely by the purchase house price and the prevailing level of mortgage interest rate. For example, a £200,000 house at a 2% mortgage interest rate has the same ‘user cost’ as a £100,000 house at 4% mortgage interest rate – i.e. both £4,000 p.a.
5. In the last 20 years or so, house prices have risen rapidly while interest rates have plummeted – high house prices have been sustained by very low costs of capital. The net result for all existing home owners, including those becoming home owners for the first time during the last 20 years, is that the user cost of home ownership (on aggregate) has fallen in real terms, as shown in the chart opposite. However, home owners who got onto the housing ladder more recently, for example, within the last five years, will not have benefitted from rising house prices as much as those who got onto the ladder 20 years ago. This means there will be a distribution of gainers and losers even amongst existing home owners.
6. The chart opposite shows that the ‘affordability of housing’ in either tenure has actually improved on aggregate since 2007. So we have to be careful about simply saying that affordability of housing has worsened, even though the affordability of buying a house has done. It is still entirely correct to point out that given the need for a deposit (combined with tighter mortgage restrictions), getting onto the housing ladder is now ‘less affordable’ for first time buyers. It is also right to point out that ownership might appear more affordable than it is, given very low mortgage interest rates which could rise unexpectedly.
CHAPTER 9:
House prices, affordability and availabilityHas affordability worsened?1. This chapter briefly considers whether affordability
worsened with rapidly rising real house prices from 1996 to 2006. To answer this, we consider the question: Affordability for whom? For first time buyers the answer is that higher real house prices (compared to earnings) means that affordability has worsened because they must save longer for a deposit in order to access home ownership. Even with a constant deposit requirement, the amount of deposit that a first time buyer needed rose along with rising real house prices (making it less affordable for them). In other words, we have been moving the goal posts. And, as we have seen, the deposit requirement actually became much tougher with the onset of the financial crisis in 2008 with the withdrawal of high LTV mortgages.
2. However, for existing home owners and renters the answer is less clear-cut. The main way that researchers think about affordability – how it compares between the tenures, and whether it has become worse or not over time – is to look at the total annual costs of owning a house against the annual cost of renting it.
3. The cost of owning a house includes the cost of repaying the mortgage plus the mortgage interest on it, as well as maintenance costs and tax such as stamp duty (SDLT). It also includes the foregone income on the housing equity that that home owner could have earned by putting that equity (capital) into an alternative investment. However, to compare the cost of owning a house to the cost of renting we have to strip out the cost of repaying the capital on the mortgage. In doing so, we get the cost of using the house – namely the ‘user cost of owning’ which broadly should be equivalent to the cost of renting it.

– 51 –THE REDFERN REVIEW INTO THE DECLINE OF HOME OWNERSHIP
PA R T T W O : T H E H O U S I N G M A R K E T
household growth – implicitly, to enable all of these new households to form and to avoid ‘hidden’ households and/or worsened availability.
3. However, new housing supply in England in recent years has been well below 200,000 a year.56 We also observe that even had annual new housing supply kept pace with household growth at 240,000 a year, it would still represent a mere ~1% of the housing stock. The scale of the existing housing stock relative to new supply effectively means that supply side policy measures – and especially any surplus of new housing supply over underlying household growth – will always impact slowly on the overall availability of housing.
4. As discussed in Part One, our modelling of the housing market shows no clear relationship between new housing supply and the rate of home ownership. However, new supply clearly increases the amount of housing available to all households, and it helps to make it more affordable in the long run by reducing real rents and house prices across the tenures.
5. So is there actually already enough housing available in the right parts of the country to meet our reasonable housing requirements? In one sense the answer is yes. Housing is available – so if one has the capital for a deposit and a steady income, one can go and buy a home, in most size brackets, in most geographic markets. As pointed out in our focus groups “there [are] houses still out there but it's just getting a house, getting a mortgage, getting it sorted.” 57
7. A further interesting point about this chart is worth noting, picking up on the cause of the decline in home ownership from Part I. Namely, it indicates why home ownership started to fall in the mid-2000s as the cost of owning rose above that of renting – i.e. the peak in the ‘cost of owning’ line, which was driven by rising house prices. After the crash the ‘cost of owning’ line dips back below the ‘rent’ line indicating that home ownership fell back below the cost of renting. This should have pushed home ownership rates up again, but increased mortgage restrictions on first time buyers and their deteriorating incomes kicked in, stopping that from happening.
Is there a lack of housing available?1. When enough housing is available, households are able
to form and their reasonable housing requirements are met.55 This in turn depends on whether new housing supply equals household growth currently, and whether it has been true in the past. What such a situation does not necessarily preclude is ‘high’ house prices as already discussed.
2. Since 2004 and the conclusion of the Barker Review, it has been widely accepted that the long-term constraints on UK housing supply, and the fact that it has in recent decades been relatively unresponsive to fluctuations in demand, are the biggest constraints on housing availability. According to the household projections at the time, we needed net housing supply of 240,000 homes a year in England to keep pace with
USER COST VS RENT (AVERAGE ANNUAL COST, £, 2016 PRICES)
4,000
6,000
8,000
10,000
12,000
14,000
16,000
18,000
Q1
1992
Q3
1992
Q1
1993
Q3
1993
Q1
1994
Q3
1994
Q1
1995
Q3
1995
Q1
1996
Q3
1996
Q1
1997
Q3
1997
Q1
1998
Q3
1998
Q1
1999
Q3
1999
Q1
2000
Q3
2000
Q1
2001
Q3
2001
Q1
2002
Q3
2002
Q1
2003
Q3
2003
Q1
2004
Q3
2004
Q1
2005
Q3
2005
Q1
2006
Q3
2006
Q1
2007
Q3
2007
Q1
2008
Q3
2008
Q1
2009
Q3
2009
Q1
2010
Q3
2010
Q1
2011
Q3
2011
Q1
2012
Q3
2012
Q1
2013
Q3
2013
Q1
2014
Q3
2014
Cost of owningRent
Source: Oxford Economics (compiled from ONS, Bank of England, Land Registry, HMRC, Your Move, Reeds Rain)

– 52 –THE REDFERN REVIEW INTO THE DECLINE OF HOME OWNERSHIP
PA R T T W O : T H E H O U S I N G M A R K E T
9. However, this does really tell us anything about the availability of housing and how availability has changed over time. That it because it looks at population rather than households. It therefore ignores the long-term trend towards smaller households (and smaller homes), driven by reductions in the number of children per family, increases in divorce and separation, and increases in single-person households in older generations. In 1961 the average household size for the UK was 3.0 people. Between 1961 and 2001 the average UK household size decreased steadily to 2.4, although it has fallen less rapidly between 2001 and 2011 from 2.4 to 2.3.60
10. As is to be expected, the ratio of homes to households is close to 1:1 and this is broadly constant over time.61 However, the surplus of houses over households starts at 800,000 in 1992 and peaks at 1.2 million in 2008-09, which is a reasonable variable but not huge in the context of a housing stock of over 28 million.62 The aggregate figures also don’t take account of the fact that there may be a larger surplus in parts of the country where people simply don’t want to live and huge pressures elsewhere.
11. Unfortunately, the ratio of houses to households can only tell us so much about the availability of housing. This is ultimately because household formation is limited by the available housing stock. The ratio doesn’t tell us about the households that would have formed had there been more homes available for them to live in – the so-called ‘hidden household’ problem. This is pertinent to this Review, which has already uncovered that younger people have not been able to access the housing market as freely as others, as a result of tougher deposit requirements and falling relative incomes. This could mean that the price signal does not fully reflect what is occurring in the market (i.e. there is an element of allocation through a ‘rationing’ effect).
6. The problem, however, is that in many markets the amount of deposit and income required to buy (or rent) is beyond the reach of many on decent incomes. And so people are shut out. Further, the more closely we segment product size, design, style, floorplan etc. the more markets are affected. This would imply that there are not enough houses.
7. But to a degree this has always been true and what constitutes reasonable expectations about housing requirements is subjective. Being able to buy is not just a yes – no binary decision, as there are considerations around space, quality and locality which households can trade off. Furthermore, as real household incomes rise, households tend to demand proportionately more housing.58
8. It is interesting that when we look at the number of homes per 1,000 population over the last 50 years or so, we actually find that there are more homes per population than there have ever been (though noting a slight fall between 2011 and 2013).
HOMES PER 1000 POPULATION IN THE UK, 1961 TO 201359
Year Total homes per 1000 population
1961 315
1971 345
1981 383
1991 411
2001 431
2011 441
2013 435
Source: Saunders, Restoring a Nation of Home Owners

– 53 –THE REDFERN REVIEW INTO THE DECLINE OF HOME OWNERSHIP
PA R T T W O : T H E H O U S I N G M A R K E T
13. It is notable too that more and more young adults living at home will bolster household sizes: we saw above that the long-term trend of falling household sizes eased up markedly from 2001, when we would otherwise have expected it to continue.
14. Another way of establishing whether we have a shortage of houses is by looking at Strategic Housing Market Assessments (SHMAs). These are produced by local authorities (and the Greater London Authority) to objectively assess housing need in order to inform their Local Plans. The latest London SHMA for example helpfully produces an estimate not only of the new housing supply needed to cope with London’s growing number of households, but also an estimate of the current shortage – i.e. the number of households that are not currently housed (including our ‘hidden households’). It estimates this figure to be 180,000 for London.65 Broadly consistent with this, many housing experts and commentators believe there is a current shortage of at least 1 million homes UK-wide – with much of this in the South East. Therefore, we need a net supply of new housing sufficient not only to cope with the projected growth in the number of households in the future, but more besides to address the current backlog.
12. The most obvious example of the hidden household in the context of this Review is young adults living at home with mum and dad because they cannot afford to move out – either to buy or to rent.63 Indeed, looking at data for the UK, the number of 25-34-year-olds living at home with parents increased by 1 million between 1997 and 2015, from 5.6 million to 6.6 million, despite the population of that age group rising by only 300,000.64 It is difficult to believe that, all of a sudden, the preference of 25-34-year-olds has changed so that they want to stay at home. Their decisions must be being influenced by the changing availability of housing and the changing affordability constraints faced by this group. However, the increased numbers are surprising in the context of only modest rises in rents, though perhaps partly explained by the relative fall in the incomes of young people.
YOUNG ADULTS AGED 15 TO 34 LIVING WITH THEIR PARENTS IN THE UK, 1996 TO 2015 (MILLION)
Source: Labour Force Survey – O�ce for National Statistics
5.25
5.50
5.75
6.00
6.25
6.50
6.75
7.00
1996
1997
1998
1999
2000
2001
2002
2003
2004
2005
2006
2007
2008
2009
2010
2011
2012
2013
2014
2015

– 54 –THE REDFERN REVIEW INTO THE DECLINE OF HOME OWNERSHIP
PA R T T W O : T H E H O U S I N G M A R K E T
16. Alan Holmans in his regional assessment of English housing need in 2013 concluded that 60% of the nation’s housing requirement was in the South.68 Of course that still means we need to build new houses in the Midlands and the North, just not to the same extent as in London and the South. If we look at house building completions regionally since 1990, we find that a slight majority of homes were built in the South.69 This is not massively out of kilter with the Holmans analysis of where the housing is required. Further, completions are likely to provide an underestimate of new housing supply, particularly so in London, given that London is highly land-constrained and relies more heavily on other forms of new housing supply such as the conversion of houses into flats and offices to residential use.
15. Clearly, different parts of the country have different degrees of housing availability. It is widely perceived that because of the far higher house price to earnings ratios in London and the South that the housing ‘crisis’ is worst in these parts of the country. This is true up to a point and indeed since the National Planning Policy Framework (NPPF) came into being in 2012, SHMAs must take some account of housing market signals (e.g. house prices) in their objective assessment of housing need.66 The house price to earnings ratios vary markedly, not only from one region to the next, but also from one local authority to the next, as the following chart shows, which compares single average earnings to house prices:
PRICE: EARNINGS RATIOS BY REGION (2015)67
0
5
10
15
20
25
LondonSouth EastEast of EnglandSouth WestWest MidlandsEast MidlandsYorkshire & HumberNorth WestNorth East
6.25.2
Source: Land Registry and ONS (derived using LR and AHSE - average earnings for single person not household)
7.3 6.9 7.2
10.1
45.5 5.8
11.2
24
7.5 7.9
10.3 10.1 9.610.7
15.116.9
15.914.5
11
5.37.4 6.8 7.6
8.9
Average Local authority with lowest Local authority with highest
– 55 –THE REDFERN REVIEW INTO THE DECLINE OF HOME OWNERSHIP
PA R T T W O : T H E H O U S I N G M A R K E T
20. Not making housing available in the locations where people need it has implications for the labour market and economy more widely. In research commissioned by Quidco, the cashback site, it was found that commuting is taking a large chunk of monthly salaries, costing nearly £2,000 per year, with a third of workers admitting they were forced to turn down a job due to the costs associated with the commute.73
21. The latest Census data from 2011 also shows us that people are commuting further than ever before, with the average distance increasing from 8.3 miles (13.4km) in 2001 to 9.32 miles (15km) in 2011.74 No doubt much of this daily trudge is through green belts. This suggests that homes are not being built in the locations where they are needed most, with access to transport, jobs, good schools and other factors which contribute to a good quality of life.
22. In short, building enough new homes is not enough. We need to build them in the right places right down to the local level, to ensure good availability of housing up and down the country. That inevitably means ensuring land for housing is made available accordingly, with proper respect for valuable sites of environmental importance and local use, but with an honest assessment of the pros and cons of each decision.
17. The issues around housing availability are also less black and white than a simple regional analysis conveys. More locally we see, for example, a dearth of family homes in the North West, a shortage of homes in the most attractive markets in the North East, and an oversupply of less desirable product in many locations, particularly inner cities. Housing markets and indeed house prices are highly localised. A study by HouseSimple revealed that the value of the average home in Blackpool and Middlesbrough has fallen by almost 30% since the 2007 financial crash.70 No market is perfect – but housing is an extreme, given the financing constraints and the fact that every home is unique.
18. Fundamentally, increasing the availability of housing – new housing supply – comes down to the availability of land to build it on. Many of our cities with a lack of housing availability are bounded by green belt. Oxford is an obvious example of this: with restricted availability of land for new housing supply, it is also one of the least affordable cities in the UK.
19. Green belt land is often but not always green or environmentally valuable. That of course is as intended – the green belt is not an environmental policy tool but a mechanism to prevent urban coalescence. However, green belt is often in locations where new housing supply is needed the most. Hilber (2014) notes “In London, for example, three tube stations are situated within the green belt, as are several Crossrail stations.” 71 Stringer (2014) estimates there are 20,000 hectares of land within 800 metres of a station in London’s green belt that do not have markers of environmental quality – i.e. are not one of the following: an area of outstanding natural beauty; a site of special scientific interest; a designated wildlife site; or an area that is used for recreation purposes. If only half of that area was re-designated, there would be space for 500,000 houses taking up less than 2% of London’s green belt.72

– 56 –THE REDFERN REVIEW INTO THE DECLINE OF HOME OWNERSHIP
PA R T T W O : T H E H O U S I N G M A R K E T
of house building ‘bouncing back’ and following ‘V-shaped’ recovery out of the recessions, house building instead ‘bumped along the bottom’ for a prolonged period: for a good 10 years in the 1990s and a good five years in the 2010s.76 These periods are illustrated on the chart below (encircled). This equates to periods of ‘lost output’ which reduced new housing supply over the economic cycle. What the chart also conveys is a ‘ratcheting-down’ effect in house building capacity after each successive recession, reinforcing the point that building capacity is a long time in the making.
ANNUAL HOUSING BUILDING COMPLETIONS, UK 1980-2015 (‘000)
0
50
100
150
200
250
Source: DCLG
1980
1982
1984
1986
1988
1990
1992
1994
1996
1998
2000
2002
2004
2006
2008
2010
2012
2014
4. So what is happening at the individual business level? In response to the immediate reduction in housing supply, firms must enact sharp reductions in staff levels, in subcontractor resourcing, in investment in infrastructure, in regional management capacity and in the payment and progression of future land. Historically, these have not been choices – without radical action, having lost up to 60% of their cash inflows, companies would have been put out of business, leaving unpaid creditors and unsupported employee pension schemes.
5. The recovery process then tends to be slow. Confidence among customers and lenders does not return overnight, and if the housing recession is linked to a major economic recession, the underlying economics can take a long time to recover.
CHAPTER 10:
Challenges to increasing housing supply and availability
Challenge #1: housing market cyclicality (boom and bust)1. In a major recession, house building tends to be an
early casualty, due largely to the significant impact of confidence on private housing sales. Although housing is a fundamental need, many people are able in the short-term to remain in existing accommodation with their parents, or in shared and/or rented accommodation. In most recessions, the cost and availability of finance also drives immediate and sometimes dramatic changes in sales rates and prices. For example, in the late 1980s, the rapid increase in the cost of debt meant that many existing home owners were unable to fund their mortgages and that many potential home buyers were unable to fund a purchase. In the most recent recession, the significant reduction in the availability of finance – most notably for first time buyers – meant that once again many potential buyers were unable to purchase.
2. Any dramatic reduction in effective demand at the onset of a recession tends to be met with a dramatic reduction in house prices and subsequently in supply. In the two most recent recessions, the combined reduction in price and volume meant that the cost of production was greater than the potential sale price, at least in the short-term. No business can afford to produce in such a reduced-demand environment – particularly in a capital-intensive industry like house building. The reductions in output over 18 months in both of these most recent recessions were significant and swift. Between 2007 and 2009 total industry output nearly halved, even with some demand being supplemented by additional funding for affordable housing. At a site-by-site level, this reduction was even more rapid – concentrated in the six months between April and October 2008.
3. Looking at annual house building levels in the UK during the last two recessions, the long-term damage caused by cyclicality becomes self-evident. In both recessions, annual house building slumped dramatically – by 30% from the peak in 1988 and by 40% from the peak in 2007.75 Worse than that, instead

– 57 –THE REDFERN REVIEW INTO THE DECLINE OF HOME OWNERSHIP
PA R T T W O : T H E H O U S I N G M A R K E T
10. To illustrate how short-termism can negatively impact on supply (and so ultimately damage affordability in the long-term), we use four examples:
a. New settlements are a valid and effective way to add incremental supply with direct support and intervention from central Government. However, over recent years a combination of policy changes and party changes have resulted in the focus moving from eco-towns to sustainable urban extensions, and to garden cities and villages. With each change, the focus shifts and an entire industry of experts and effort goes back to the drawing board.
b. Demand-focused policies can have a more significant short-term impact, which can be appealing. However, as discussed, these often tend to increase cyclicality which damages supply over the long-term, since major supply reductions in a downturn damage underlying capacity and investment which take time to rebuild.
c. One of the long-term brakes on supply is the nature and structure of our planning system. Successive governments have tried to improve this over the last 15 years, with partial success, seeking to balance the benefits and costs of development, and national and local politics. However, it remains the case that the appetite to invest in projects that are long-term but deliver essential value – such as infrastructure and social housing – is limited compared to projects with a quicker payback. This is even more true since the financial crisis.
d. When government objectives are not met, a tendency to look for someone to ‘blame’ creates future policy uncertainty for key sectors in the overall market. Recent negativity towards the Buy to Let sector risks delaying investment trends, and particularly in the important development of a fledgling ‘professional’ private rented sector. This can only be unhelpful.
11. Historically, governments have also introduced annual targets, often focusing on a five-year period (the length of a parliament), or even shorter. This ignores the reality of how investment in housing works. At its most basic, a five-year investment period is likely to be the shortest project life of most potential housing schemes.
Production capacity that can take 6-12 months to cut back can take 4-5 years to recover. Historically both the cutting back of capacity and the slowness of the recovery have been exacerbated by aggressive growth into the peak of the cycle and generally weaker balance sheets subsequently in the house building sector. This has meant more severe cutbacks, often accompanied by a phase of expensive debt refinancing and equity raising. More generally this contributes to a high cost of capital for the industry and investor caution towards the sector.
6. Structurally, the impact of the economic cycle is very important and impacts on everything from total long-term production levels to the level of investment in research and development or new staff development. The industry today is more cautious about this dynamic than it has been historically, not least as many firms had a ‘near-death’ experience following the credit crunch. One would therefore hope that the impact of any future downturn would be less, and that we would be quicker to recover, but it would be very optimistic to believe that the impact would not still be very significant.
Challenge #2: policy short termism7. A common cry in many of the call for evidence
submissions to this Review was for governments to ‘stop fiddling’.77 We can optimise the current system, but only if we don’t keep making major changes to it. Besides which, we have yet to see the increased housing supply benefits of the reforms in recent years.
8. Governments, politicians, and indeed most of us operate in the medium term of two to three years – whether this be our planning horizon for our families and finances, or the clock ticking before we are up for re-election. But almost all economists and analysts agree that housing supply at a national or regional level will impact on the availability (and affordability) of homes only over a much longer time frame – at least 10 to 20 years.
9. For this reason, we need the best long-term policy solutions, which lie in improving the quantity, quality and appropriateness of supply in particular where it is needed the most. Just as importantly, there is no short-term solution to new housing supply and the availability of housing, and a continual obsession with finding one can lead to incoherent and damaging policies.

– 58 –THE REDFERN REVIEW INTO THE DECLINE OF HOME OWNERSHIP
PA R T T W O : T H E H O U S I N G M A R K E T
Challenge #3: inconsistent application of the planning system16. The plan-led system such as the ours requires a
consistent application of the system across the different local planning authorities.78 Unfortunately, the planning system is not always applied consistently by local planning authorities and this can result in unexpected delays and financial prejudice to the delivery of a site. This can often create a setback to the construction timetable for much-needed new homes, hence reducing new housing supply.
17. This is important when we look at the natural and undeniable complexity of the decisions that a planning application involves. We have an unhelpful tendency to ‘demonise’ different groups as ‘NIMBYs’, ‘self-interested developers’, or ‘ineffective planners’. This belittles the reality that a large-scale application is inevitably very complicated as the valid concerns and objectives of disparate groups are balanced.
18. This doesn’t mean that pace doesn’t matter: it does. But what matters more, is consistency and reliability and risk. Over the last six or seven years, the consistency of individual applications has improved as the rules have been simplified. This has led to increased applications granted, but is yet to work its way through fully to increased housing delivery.
12. To illustrate, we could usefully group potential new housing projects into two scheme types. First, schemes that are basically ready to make a planning application and are independent of major infrastructure requirements, with a site size of up to around 400 homes (including small sites of 10 homes and fewer). Second, schemes which are new settlements, major urban extensions and any larger, infrastructure-heavy schemes, which can be anywhere between 400 and 6,000 homes.
13. The development lifespan of the first type of scheme tends to be around 5-6 years, of which roughly two years is spent in the ‘planning process’ in its widest sense, followed by between six and 12 months on delivering site clearance and local infrastructure. The balance of up to around three years is spent on delivering and selling the homes, dependent on location and site size.
14. The development lifespan, if we take a ‘range’, of the second type of scheme tends to be between six years and 15 years. Historically the planning process part of that alone could be upwards of 10 years. Today, however, the planning process part can be as short as 3-4 years for ‘acceptable’ major schemes. Putting in place the initial enabling infrastructure necessary to start housing construction generally takes a minimum of 12 months, although of course this investment continues while the house building process is underway. A development of between 1,000 and 2,000 units may be built out in around eight years at a rate of between 125 and 250 homes per year, depending on the depth of the local market. This gives a total life cycle of around 12-13 years. Of course for major new settlements, composed of many large schemes, the life cycle can be even longer than this.
15. So even with significantly accelerated ’build’ and ‘sale’ phases, the life cycle of these projects – particularly where they involve significant infrastructure – is longer than a ‘normal’ political cycle. If we then also layer on top of this the impact of the economic cycle (17 years historically), which impacts significantly on both public and private investment and the rate of short-term housing sales, it is not hard to understand why a five-year political cycle and targets set over associated periods is too short to drive meaningful improvements in housing supply.

– 59 –THE REDFERN REVIEW INTO THE DECLINE OF HOME OWNERSHIP
PA R T T W O : T H E H O U S I N G M A R K E T
5. The Review team has come to the important but unsurprising conclusion that the only way to improve the healthiness of the housing market is through increased supply. Our focus should be long-term and resolute, and ideally it needs to agree some common, cross-party elements, including:
• A common view on 10 and 20-year housing targets, with a flight path;
• An agreement to invest in new settlements – small and big – and urban extensions;
• Common agreement that a set of readily deployable countercyclical tools should be in place before the onset of a downturn;
• A commitment to consistent investment in affordable housing.
6. It is a cliché, but up to a point it is true that ‘what gets measured gets done’. Put differently, targets matter, and good targets can generate behaviour to help achieve a particular goal, whereas bad targets tend to either have little meaningful effect, distract from the main goal, or, worst of all, create behaviour which acts against what they were trying to achieve in the first place. Our belief is that historically we have suffered from having ‘bad targets’ set in a short-term political environment rather than properly considered.
7. As significant increases in housing supply only have a small short-term effect on prices and therefore affordability, our supply goals must be fundamentally long-term, looking at the conditions in which long-term supply can be maximised, rather than focussing primarily on goals two to three years (or even five years) ahead.
8. At least 10 years and ideally 20 years would be more appropriate target setting periods for housing supply. Of course, it will be unpalatable for any improvement to take this long – there is a risk of spending decades waiting for ‘jam tomorrow’ or political ‘kicking into the long grass’. We therefore need to build in to these targets a reasonable ‘flight path’ for new housing supply so that we can assess progress. In addition to allowing us to plan properly to create new communities and invest in infrastructure, this longer term planning will force us to take into account the potential impact of the economic cycle and plan mitigation in advance, rather than on the hoof.
CHAPTER 11:
Policy discussion – the housing market and supply1. The biggest issue for young people is not home
ownership but the affordability of housing services, and all long-term sustainable solutions to high house prices and availability depend on increasing supply. However, as we have argued above, increased new supply does not directly improve the home ownership rate and though it will have a suppressing effect on house prices (and therefore improving affordability), it is a very slow, cumulative process.
2. There have been some positive policy steps towards housing supply for the long-term since 2010 and the formation of the Coalition Government. From a planning perspective, the Localism Act 2011 introduced new powers for people to make neighbourhood plans and neighbourhood development orders.79 The Community Infrastructure Levy came into force, providing local authorities with the power to set their own spending priorities and receive a more predictable funding stream. Further modification in the form of the National Planning Policy Framework (NPPF) in March 2012 further changed the face of planning.80
3. We do believe that there needs to be a further change in attitude to supply to increase the availability of housing. We do not question whether politicians, both national and local, and increasingly the general public, accept the need for increased supply. We strongly believe that, particularly since the Barker Review in 2004, they do. This conclusion is not about one political party or another being ‘the party of home ownership’ or ‘the party that will build more houses’.
4. The issue ultimately is that what is needed is not a couple of years of greater supply, or even a five-year political term of increased production. What is needed is decades of consistent supply improvements, in both quantum and particularly location, and that can only be achieved with a long-term plan, whose principles are agreed by all main political parties, and where short-term decisions are taken, but are taken in line with those principles and that plan.

– 60 –THE REDFERN REVIEW INTO THE DECLINE OF HOME OWNERSHIP
PA R T T W O : T H E H O U S I N G M A R K E T
where they cause the least political noise. In reality, large new settlements offer a poor short-term investment on volume versus investment – but assessed longer term, they are an essential part of housing growth, particularly in the South East.
12. It would be naïve to believe either that either economic or housing market cyclicality were a thing of the past, or could ever be completely eradicated. However, housing market cyclicality can be managed to reduce its impact on house prices and, perhaps more importantly, its impact on total long-term supply.
13. During the course of this Review, it has become increasingly clear that past policies have reacted only retrospectively to a housing market collapse and have often come too late (e.g. Help to Buy). There is also a danger that policies can actually exaggerate the cycle rather than dampen it.
14. We believe that there needs to be a clear plan for different stages of the cycle, and most importantly a contingency plan for a recession. Many recessions are, by their nature, not anticipated or predictable and they are highly damaging to housing supply. Such a contingency plan is particularly relevant in the context of supporting housing supply in the longer term as discussed above.
This cyclical plan would include early and swift intervention to provide demand side support as a recession breaks, and possibly even before, as a pre-emptive move. Help to Buy Equity Loan could be a candidate for a countercyclical tool with an equity loan share or regional house price threshold that varied over the economic cycle. Countercyclical government investment in affordable housing with greater flexibility for housing associations and councils on the tenures they build during distressed times could be another countercyclical tool. We also note that more investment in the large-scale private rented sector which is less dependent on short-term – and sometimes volatile – house price movements would be a useful automatic stabiliser.
9. The chart below shows the illustrative impact of a slightly more cautious short-term strategy that includes cyclical planning, compared with an aggressive short-term approach. Whilst over a five year period the more cautious approach results in approximately 10% lower total production, over 10 years, assuming a downturn at some point in this period, the more cautious, long-term plan results in circa 12.5% more homes being built.
ILLUSTRATIVE IMPACT OF LONGER STRATEGY CYCLES
0
30
60
90
120
150
180
210
240
270
300
202720262025202420232022202120202019201820172016
10 year target 20 year target5 year target
‘000 new homesSource: Redfern Review calculation
10. Much is often said about garden villages, garden cities, or eco-towns. Sadly, much of this is because they are handy buzzwords. What we really mean is creating new, high-quality stand-alone settlements, big or small, as part of an overall housing strategy to increase new housing supply.
11. We argue that these new settlements are an important and valid component of a valid housing strategy. However, so often the potential for real long-term growth is squandered to short-termism. The way in which new settlements have been assessed over recent cycles has tended to be on the basis of how much volume they can deliver in a few short years and

– 61 –THE REDFERN REVIEW INTO THE DECLINE OF HOME OWNERSHIP
PA R T T W O : T H E H O U S I N G M A R K E T
15. Turning to public investment in affordable housing, we need fresh clarity around the scale of need for genuine affordable housing, with a mix of tenures and allowing councils and housing associations greater tenure flexibility for the housing they build with government subsidy.
16. As already discussed in Part One, the sale of local authority homes through the Right to Buy has diminished social housing stock. The discounts given to buyers reduce the amount of money available to replace those sold off; and initially capital receipts went to Central Government rather than the local authority, with money not ring-fenced for further investment in housing provision and no policy to replace sold dwellings.
17. There have since been a number of changes to the Right to Buy, including its reinvigoration in 2012.81 This introduced a one-for-one replacement policy of homes sold, but only for the extra homes sold as a result of the more generous discount it brought in. In other words, the policy was to continue not replacing the Right to Buy sales that would have happened anyway without the reinvigoration policy. The Voluntary Right to Buy (VRTB), which extends the Right to Buy to housing association tenants, will also see all housing association homes replaced one for one and this is welcome.

– 62 –THE REDFERN REVIEW INTO THE DECLINE OF HOME OWNERSHIP
PA R T T W O : T H E H O U S I N G M A R K E T
Policy options – Part twoImproving the wider housing market and increasing supply
Our policy options have a strong underlying theme that our housing market
solutions must be planned, consistent, long-term and accept the fact that there is no single short-term silver bullet that can
bring supply and demand back into a healthy balance overnight. We must also
make sure that we support the most vulnerable in the here and now, through
targeted affordable housing and improvements in the stability of
rented housing.The following policy options are split into three areas: the first block is around stability of supply; the second around governance; and the third about ensuring the planning system in its current form works effectively and efficiently.
1. We must develop a long-term strategy for the housing market that is based on principles that can be agreed across the main political parties. The core principles of that strategy should be:
a. Long-term increases in supply, sustained over 20+ years will be needed to reduce overall housing market pressure, increasing the ‘size of the cake’ and resulting in a ’positive sum’ gain. Government’s primary role is in guiding the long-term environment that will support its objectives.
b. Government should take short-term actions when and only when it is necessary to protect the most vulnerable, and must ensure that these actions do not increase market volatility or damage longer term supply.
c. Both maximising long-term supply and optimising the fairness in the housing market require balanced efforts to promote a healthy environment for the three key subsectors: construction for private home ownership; construction for a private rented sector; and, construction of affordable housing.
d. Government (including the Bank of England) has a key role to mitigate market swings over the cycle, reducing the impact on individuals and reducing the effect of housing market volatility.
e. Government has a key role to promote a saving culture in young people and help people to help themselves attain home ownership.
f. A recognition that house price stability, and particularly house price growth in line with earnings growth would be good for social, economic and financial stability. Growth consistently above this level is not the sign of a healthy economy.
2. In creating a healthy long-term framework for long-term housing policy decisions, it would aid good decision-making to have a genuinely independent review process for Government policy. Individual policy decisions should state clearly their goals against the strategic framework and then be transparently assessed over time for their success in achieving their goals. Due to supply-based decisions – such as changes to the planning system - only being effective on a far longer time horizon than certain demand side measures including fiscal and monetary policy, these should be assessed separately, requiring:
a. an independent review of the impact of policy changes on long-term supply quantum, quality and effectiveness to meet future demand.
b. an independent review of the reasons for key house price trends and the effectiveness of fiscal and monetary policy in maximising stability.
The Infrastructure Commission fulfils a role for major infrastructure projects, and whilst we acknowledge that the emerging view that housing as infrastructure has merit, we believe that there are too many differences for the housing remit to be dealt with within this body. Establishing a parallel Housing Commission would require both housing skills and the need to assess the market impacts in a way that is much less relevant for infrastructure.

– 63 –THE REDFERN REVIEW INTO THE DECLINE OF HOME OWNERSHIP
PA R T T W O : T H E H O U S I N G M A R K E T
3. It is our belief that recent policy changes to the planning system will, over time, have a significant beneficial effect on the quantum and relevance of new housing supply. However, the full, positive effects of these changes are yet to be felt. Further significant changes are more likely to have a negative than positive effect on long-term supply. However, we believe that there remain specific focus areas that can be improved within the current system, namely:
a. The resourcing of planning departments.
b. The effective operation of the Duty to Cooperate and the interaction between urban, suburban and rural authorities.
c. The interaction between neighbourhood plans and local plans, which remains unclear.
d. The data used to assess the effectiveness of the supply system at a national, regional and local level, which is often poor.
e. Diversion of funding (from initiatives such as Starter Homes and Modern Methods of Construction) to housing infrastructure and affordable housing should be considered.

– 64 –THE REDFERN REVIEW INTO THE DECLINE OF HOME OWNERSHIP
R E D F E R N R E V I E W
Please note that a large proportion of our figures have been generated by the Oxford Economics housing market model. Full details of the accompanying report ‘Forecasting UK house prices and home ownership: a report for the Redfern Review’ can be found at: www.redfernreview.org 1. The Economist, Home ownership, Shelter or Burden?, 16th April 2009
Website link: http://www.economist.com/node/134919332. Yorkshire Building Society & NatCen, First time buyers, An early life
crisis, 2016 77% of respondents stated “longer term, they would prefer to own their own home, either outright or with a mortgage or loan” Website link: http://www.ybs.co.uk/media-centre/new-report-explores-first time-buyer-challenges.html NatCen, British Social Attitudes Survey 28, 2010 British Social Attitudes survey (2010) found that 86% of the public would prefer to buy. Website link: http://www.bsa.natcen.ac.uk/media/38952/bsa28_8housing.pdf
3. G. Meen, “Ten new propositions in UK housing macroeconomics: an overview of the first years of the century”, Urban Studies, 45(13) (2008): p. 2759-2781.
4. DCLG, English Housing Survey: Headline report 2014-15, Chapter 1 figure & annex tables Website link: https://www.gov.uk/government/statistics/english-housing-survey-2014-to-2015-headline-report
5. DCLG, Statistical data set, Live tables on dwelling stock (including vacants), Live Table 101 Website link: https://www.gov.uk/government/statistical-data-sets/live-tables-on-dwelling-stock-including-vacants
6. Eurostat, Distribution of population by tenure status, type of household and income group, EU-SILC survey – 2015 data Website link: http://appsso.eurostat.ec.europa.eu/nui/show.do?dataset=ilc_lvho02&lang=en; Trading Economics, Home Ownership Rate (used for ‘Anglosphere’ countries) USA (2015), Canada (2014), Australia (2011), New Zealand (2013) Website link: http://www.tradingeconomics.com/country-list/home-ownership-rate
7. Rupert Jones, ‘Time is right’ for mortgage relief to end, the guardian, 10th March 1999 Website link: https://www.theguardian.com/uk/1999/mar/10/budget1999.budget3
8. Ibid9. Survey of English Housing 2002/03 and English Housing Survey 2014/15
(data extract)10. Ibid11. For a synopsis of the MMR (2014) see: https://www.theguardian.com/
money/2014/apr/25/mortgage-rules-homebuyers-fca-rules 12. Redfern Review Focus Groups were hosted by Britain Thinks in May 2016.
Discussions were split into a groups consisting of either renters or owner occupiers, who had been selected to take part based on them forming a representative sample. Peterborough was chosen as a location, due to its position in the Midlands but under an hour’s travel from London by rail.
13. NatCen, British Social Attitudes Survey, 2010 Website link: https://discover.ukdataservice.ac.uk/catalogue/?sn=6969,
14. DCLG, Public attitudes to housing in England: Report based on the results of the British Social Attitudes survey, July 2011 Website link: https://www.gov.uk/government/uploads/system/uploads/attachment_data/file/6362/1936769.pdf
15. NatCen, British Social Attitudes Survey 28|8. Housing, 2010 Website link: http://www.bsa.natcen.ac.uk/media/38952/bsa28_8housing.pdf
16. Yorkshire Building Society & NatCen, First time buyers, An early life crisis, 2016 Website link: http://www.ybs.co.uk/media-centre/new-report-explores-first time-buyer-challenges.html
17. Ibid18. Ibid
19. Yorkshire Building Society & NatCen, First time buyers, An early life crisis, 2016 Website link: http://www.ybs.co.uk/media-centre/new-report-explores-first time-buyer-challenges.html
20. ONS, Main results from the Wealth and Assets survey (July 2012 – June 2014), 18 December 2015 Website link: http://webarchive.nationalarchives.gov.uk/20160105160709/http://www.ons.gov.uk/ons/dcp171776_428683.pdf
21. For a synopsis of the MMR (2014) see: https://www.theguardian.com/money/2014/apr/25/mortgage-rules-homebuyers-fca-rules
22. The 1988 peak especially was probably driven by the removal of multiple Mortgage Interest Relief at Source (MIRAS). See http://www.independent.co.uk/news/business/personal-finance-how-the-house-market-lost-its-miras-touch-1148693.html
23. DCLG, English Housing Survey: First Time Buyers and Potential Home Owners Report, 2014-15 Website link: https://www.gov.uk/government/uploads/system/uploads/attachment_data/file/539256/First_Time_Buyers_and_Potential_Home_Owners_Report.pdf
24. See https://www.theguardian.com/money/2016/sep/23/first-time-buyers-south-east-london-seven-year-wait
25. Halifax, ‘Generation Rent, Five years of Generation Rent: Perceptions of the first-time buyer housing market 2015’, 2015 Website link: https://static.halifax.co.uk/assets/pdf/mortgages/pdf/Generation-Rent-2015-Dont-stop-believing-full-report-7th-April-2015-Housing-Release.pdf
26. G. Meen, “A long-run model of housing affordability”, Housing Studies, 26 (7-8) (2011): p. 1081-1103 C. Emmerson, P. Johnson and H. Miller, “Institute for Fiscal Studies Green Budget”, 2012
27. G. Meen, “Recent developments in the Communities and Local Government Affordability Model”, Communities and Local Government Publications, 2008
28. For more on these tax changes see http://www.bbc.co.uk/news/business-34922738 and https://www.theguardian.com/money/2015/jul/11/buy-to-let-budget-tax-profits-mortgage
29. Redfern Review Focus Groups were hosted by Britain Thinks in May 2016. Discussions were split into a groups consisting of either renters or owner occupiers, who had been selected to take part based on them forming a representative sample. Peterborough was chosen as a location, due to its position in the Midlands but under an hour’s travel from London by rail.
30. For more information see https://www.ftadviser.com/2016/08/22/mortgages/mortgage-products/help-to-buy-isa-flaw-makes-it-useless-for-deposit-rCK6V69sLTEhTMaNP3N0UP/article.html
31. Redfern Review polls were undertaken online by Britain Thinks in May 2016; a sample of 2046 was used, 56% of whom owned their own home.
32. Ibid33. Discretionary income is calculated by subtracting the cost of tax and
essentials from the household’s gross income. Assumed that 20% of discretionary income is saved except when a discretionary incomes are zero or negative, when saving is assumed to be zero
34. Shelter, A Home of Their Own, January 2015 Website link: https://england.shelter.org.uk/__data/assets/pdf_file/0004/1053994/2015_AbilityToBuy_Report_FINALv2.pdf
35. Go Compare, Generation Debt: How living with debt is becoming the norm for the nation’s youth, 2015 Website link: http://www.gocompare.com/generationdebt/
36. Step Change Debt Charity, Personal Debt 2015 Statistics Yearbook, 2015 Website link: https://www.stepchange.org/Portals/0/documents/media/Stats_Yearbook_2015.pdf
37. Ibid38. Hilary Osborne, Consumer borrowing shows biggest increase for a decade,
the guardian, 29th February 2016 Website link: https://www.theguardian.com/money/2016/feb/29/consumer-borrowing-biggest-increase-decade-bank-of-england-credit-cards-loans
39. Institute for Fiscal Studies, ‘Payback time? Student debt and loan repayments: what will the 2012 reforms mean for graduates?’, IFS Report R93, April 2014 Website link: https://www.ifs.org.uk/comms/r93.pdf
References

– 65 –THE REDFERN REVIEW INTO THE DECLINE OF HOME OWNERSHIP
40. Ibid41. High Fliers Research, The UK Graduate Careers Survey 2006 - 201642. Including the Reinvigoration policy from April 2012 and the Voluntary Right
to Buy piloted from January 201643. DCLG, English Housing Survey 2014/15, Chapter 1 figures & annex tables
Website link: https://www.gov.uk/government/statistics/english-housing-survey-2014-to-2015-headline-report
44. DCLG, Statistical data set, Live tables on social housing sales, Table 671 Website link: https://www.gov.uk/government/statistical-data-sets/live-tables-on-social-housing-sales
45. Pete Apps, Right to Buy to Let, 14 August 2015 Website link: http://www.insidehousing.co.uk/right-to-buy-to-let/7011233.article
46. Legal and General, The Bank of Mum and Dad, 2016 Website link: http://www.legalandgeneralgroup.com/assets/portal/files/pdf_216.pdf
47. DCLG, Help to Buy (Equity Loan scheme) and Help to Buy: NewBuy statistics: Date to 30 June 2016, England, 29 September 2016 Website link: https://www.gov.uk/government/statistics/help-to-buy-equity-loan-scheme-and-help-to-buy-newbuy-statistics-april-2013-to-30-june-2016
48. DCLG, Evaluation of Help to Buy Equity Loan Scheme, February 2016 Website link: https://www.gov.uk/government/uploads/system/uploads/attachment_data/file/499701/Evaluation_of_Help_to_Buy_Equity_Loan_FINAL.pdf
49. Shelter, How much help is Help to Buy?, September 2015 Website link: https://england.shelter.org.uk/__data/assets/pdf_file/0010/1188073/2015_09_how_much_help_is_Help_to_Buy.pdf
50. Savills, ‘Policy Response, Starter Homes’, April 2016 Website link: http://pdf.euro.savills.co.uk/uk/residential---other/policy-response-starter-homes-2016.pdf
51. Kayte Lawton and Howard Reed, Property and Wealth Taxes in the UK, the context for reform, IPPR, March 2013 Website link: http://www.ippr.org/files/images/media/files/publication/2013/03/wealth-taxes-context_Mar2013_10503.pdf?noredirect=1
52. Peter Saunders, Restoring a Nation of Home Owners, Civitas, June 2016 Website link: http://www.civitas.org.uk/content/files/Restoring-a-Nation-of-Home-Owners.pdf
53. Ibid54. Kate Barker, Review of Housing Supply, Delivering Stability: Securing our
Future Housing Needs, March 2004 Website link: http://news.bbc.co.uk/nol/shared/bsp/hi/pdfs/17_03_04_barker_review.pdf
55. Requirements both in terms of dwelling size for the household’s needs and in terms of location
56. DCLG, Statistical data set, Live tables on net supply of housing, Live Table 120 Website link: https://www.gov.uk/government/statistical-data-sets/live-tables-on-net-supply-of-housing
57. Redfern Review Focus Groups were hosted by Britain Thinks in May 2016. Discussions were split into a groups consisting of either renters or owner occupiers, who had been selected to take part based on them forming a representative sample. Peterborough was chosen as a location, due to its position in the Midlands but under an hour’s travel from London by rail.
58. In the economic jargon, housing is a ‘luxury good’59. Peter Saunders, Restoring a Nation of Home Owners, Civitas, June 2016
Website link: http://www.civitas.org.uk/content/files/Restoring-a-Nation-of-Home-Owners.pdf
60. ONS, 2011 Census: Population and household estimates for the United Kingdom, March 2011 Website link: http://www.ons.gov.uk/peoplepopulationandcommunity/populationandmigration/populationestimates/ bulletins/populationandhousehold estimatesfortheunitedkingdom/2011-03-21
61. Oxford Economics, Forecasting UK house prices and home ownership: a report for the Redfern Review, November 2016 Website link: www.redfernreview.org
62. Oxford Economics, Forecasting UK house prices and home ownership: a report for the Redfern Review, November 2016 Website link: www.redfernreview.org
63. Another less than perfect measure is the local authority waiting lists. DCLG, Statistical data set, Live tables on rents, lettings and tenancies, Live Table 600 Website link: https://www.gov.uk/government/statistical-data-sets/live-tables-on-rents-lettings-and-tenancies
64. ONS, Statistical bulletin: Families and Households: 2015 Website link: http://www.ons.gov.uk/peoplepopulationandcommunity/birthsdeathsandmarriages/families/bulletins/familiesandhouseholds/2015-11-05
65. For the 2013 London Strategic Housing Market Assessment, see https://www.london.gov.uk/what-we-do/planning/london-plan/current-london-plan/london-plan-chapter-3/london%E2%80%99s-housing
66. DCLG, National Planning Policy Framework, March 2012 Website link: https://www.gov.uk/government/publications/national-planning-policy-framework--2
67. Compiled using Land Registry and ONS Annual Survey of Hourly Earnings (ASHE) data (both 2015)
68. Alan Holmans, ‘New Estimates of Housing Need and Demand in England 2011-31’ , Cambridge Centre for Housing and Planning research Website link: http://www.cchpr.landecon.cam.ac.uk/Downloads/HousingDemandNeed_TCPA2013.pdf
69. DCLG, Statistical data set, Live tables on house building, Live Table 232 Website link: https://www.gov.uk/government/statistical-data-sets/live-tables-on-house-building
70. Tom Knowles, It’s grim up north for those left out of the house boom, The Times, 25 April 2016 Website link: http://www.thetimes.co.uk/article/its-grim-up-north-for-thousands-left-out-of-house-boom-zkslppnxx
71. Christian Hilber ‘Uk Housing and Planning Policies, the evidence from economic research’ LSE, 2015 Website link: http://cep.lse.ac.uk/pubs/download/EA033.pdf
72. Barney Stringer, cited by Paul Cheshire, Where should we build on the Greenbelt? LSE, 2014 Website link: http://blogs.lse.ac.uk/politicsandpolicy/building-on-greenbelt-land/
73. Quidco, Cost of Working, 1st January 2013 Website link: https://www.maplesyrupmedia.com/cost-of-working/
74. ONS, 2011 Census Analysis – Distance Travelled to Work, 26 March 2014 Website link: http://webarchive.nationalarchives.gov.uk/20160105160709/http://www.ons.gov.uk/ons/rel/census/2011-census-analysis/distance-travelled-to-work/2011-census-analysis---distance-travelled-to-work.html
75. DCLG, Statistical data set, Live tables on house building, Live Table 209 Website link: https://www.gov.uk/government/statistical-data-sets/live-tables-on-house-building
76. ibid77. The Redfern Review call for evidence was launched in February 2016 to
industry professionals and the general public. 78. It also requires that up to date local plans are in place without exception79. For further information on the Localism Act, see: https://www.gov.uk/
government/uploads/system/uploads/attachment_data/file/5959/1896534.pdf
80. DCLG, National Planning Policy Framework, March 2012 Website link: https://www.gov.uk/government/publications/national-planning-policy-framework--2
81. DCLG, Reinvigorating Right to Buy and One for One Replacement, March 2012 https://www.gov.uk/government/uploads/system/uploads/attachment_data/file/5937/2102589.pdf

TH
E R
ED
FE
RN
RE
VIE
W IN
TO
TH
E D
EC
LIN
E O
F H
OM
E O
WN
ER
SH
IP