
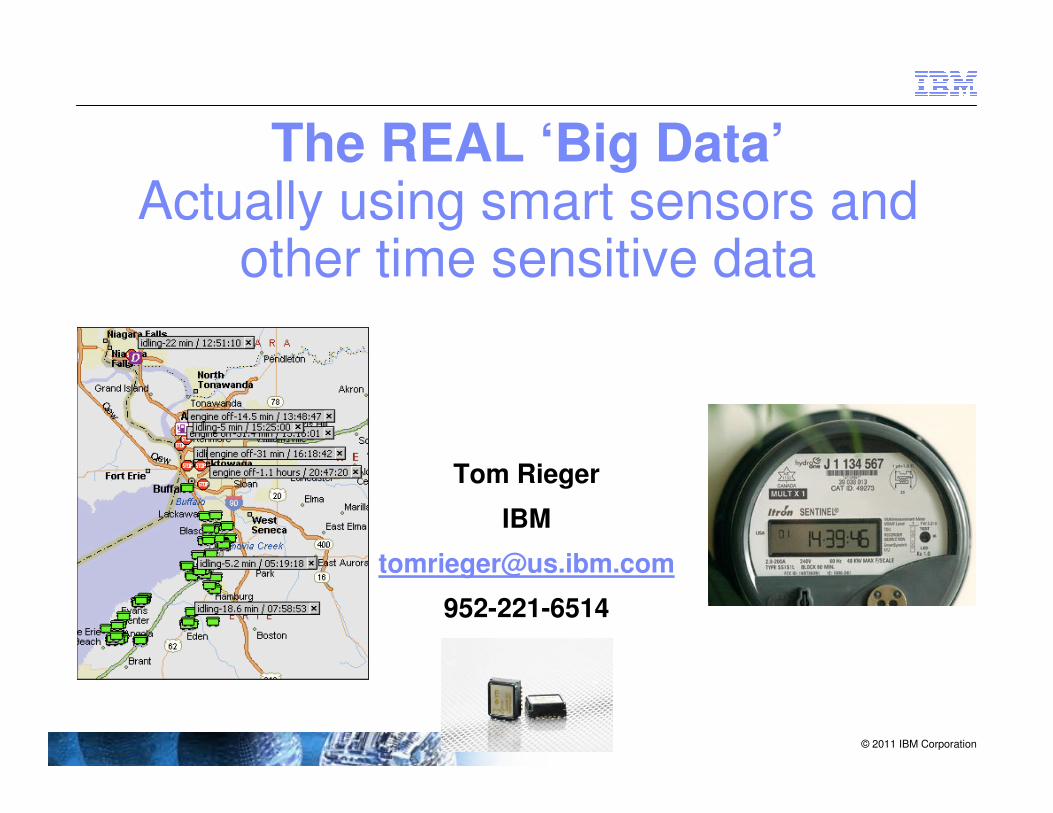
The REAL ‘Big Data’ Actually using smart sensors and other ...
17
© 2011 IBM Corporation The REAL ‘Big Data’ Actually using smart sensors and other time sensitive data Tom Rieger IBM [email protected] 952-221-6514
Transcript of The REAL ‘Big Data’ Actually using smart sensors and other ...
© 2011 IBM Corporation
The REAL ‘Big Data’Actually using smart sensors and
other time sensitive data
Tom Rieger
IBM
952-221-6514

© 2011 IBM Corporation
A CASE STUDY: Smart Sensor data: The next BIG DATA challenge with always-on data generators
GPS devices on moving vehicles (buses, trains, trucks, cars), smart meters for utilities and all kinds of
remote sensing equipment.
This is not just an incremental increase; this is 1000x of times
increase.
How do you load it, process it, query it and gain the insight? And
how do you do it economically?
THIS IS NOT A SOLUTION TRADITIONAL RELATIONAL
MODELS SOLVE
© 2011 IBM Corporation
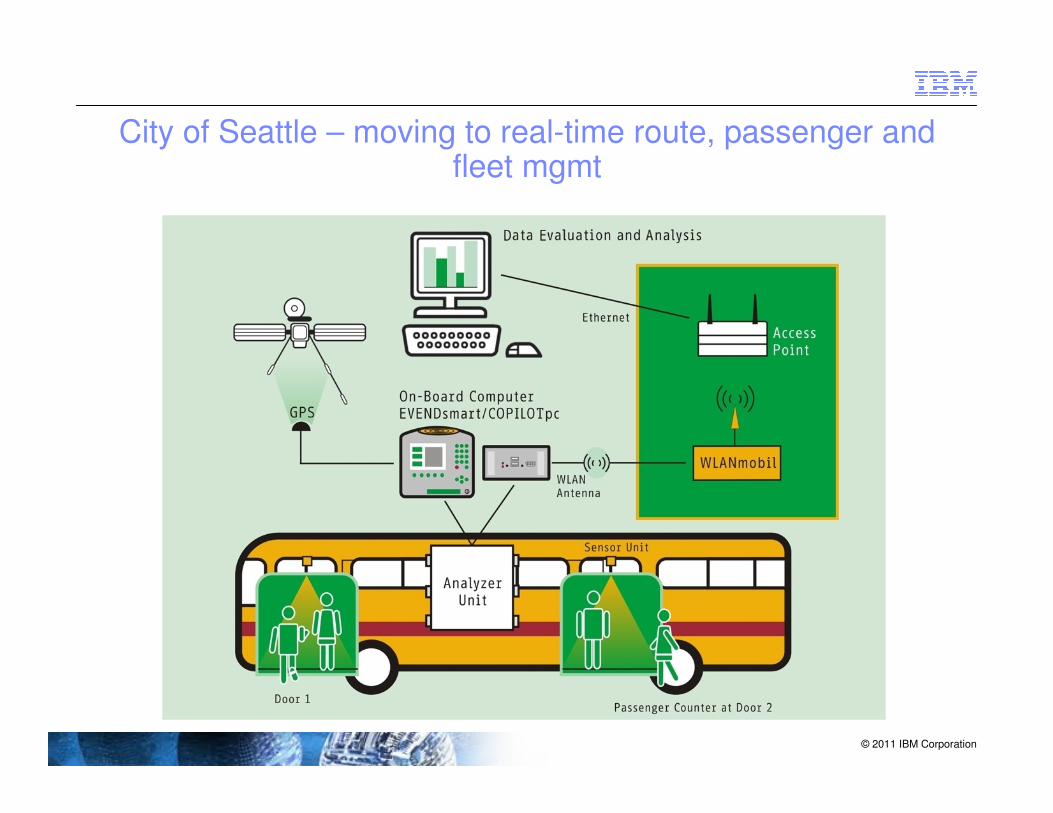
City of Seattle – moving to real-time route, passenger and fleet mgmt
© 2011 IBM Corporation
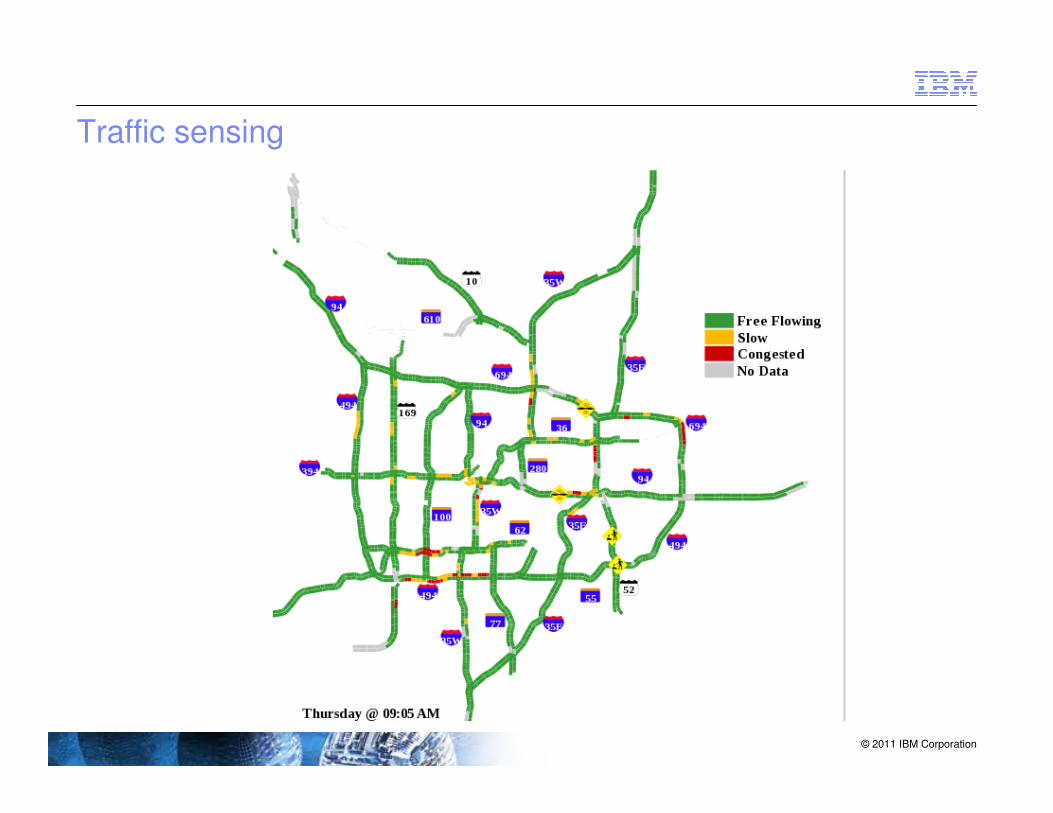
Traffic sensing

© 2011 IBM Corporation
Traffic sensing
© 2011 IBM Corporation
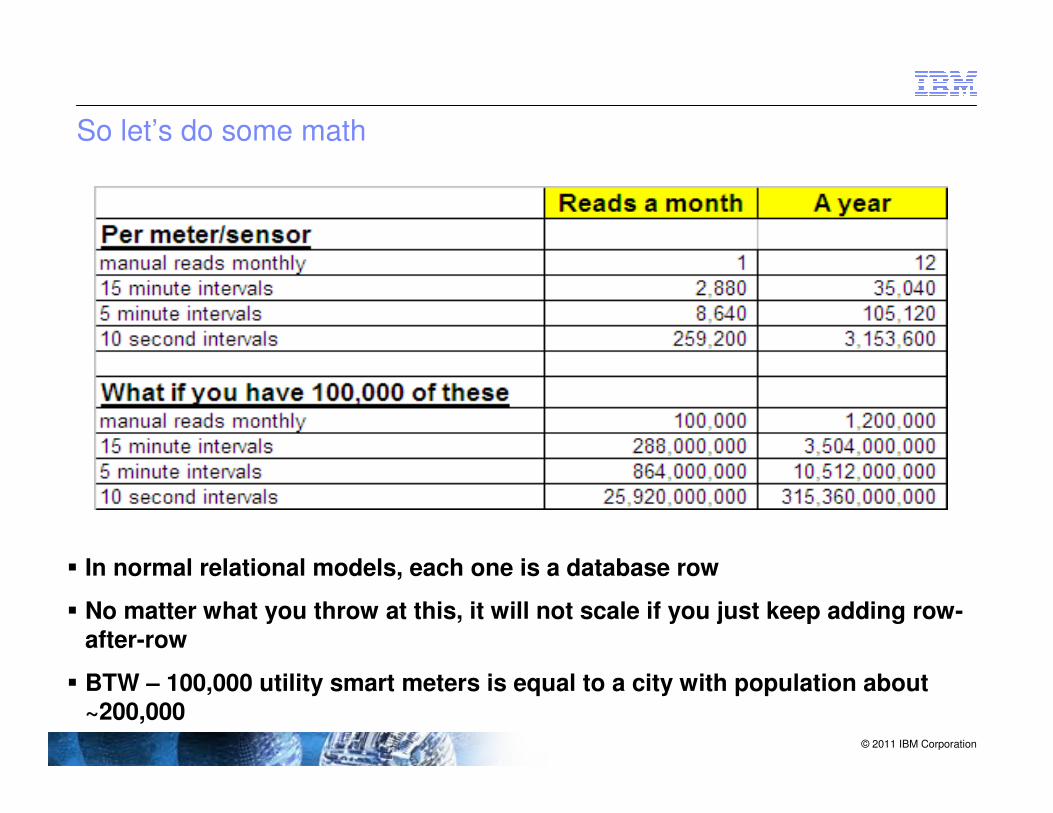
So let’s do some math
� In normal relational models, each one is a database row
� No matter what you throw at this, it will not scale if you just keep adding row-
after-row
� BTW – 100,000 utility smart meters is equal to a city with population about ~200,000
© 2011 IBM Corporation
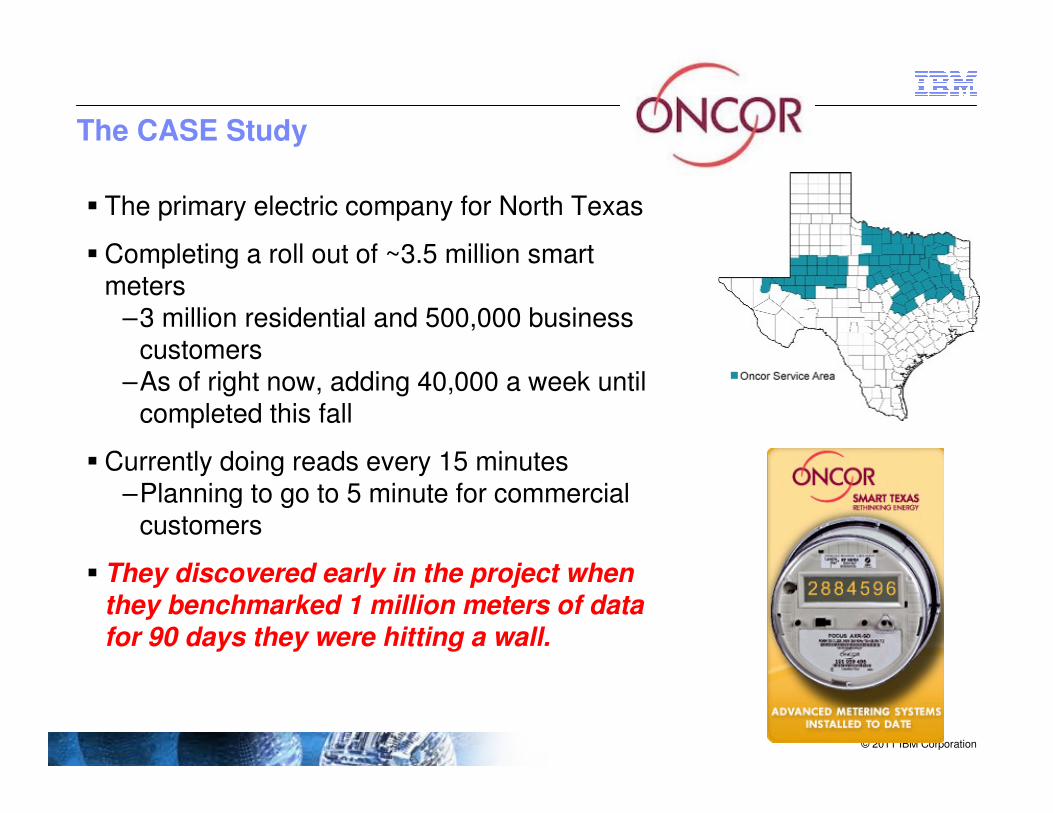
The CASE Study
� The primary electric company for North Texas
� Completing a roll out of ~3.5 million smart meters
–3 million residential and 500,000 business customers
–As of right now, adding 40,000 a week until completed this fall
� Currently doing reads every 15 minutes–Planning to go to 5 minute for commercial
customers
� They discovered early in the project when
they benchmarked 1 million meters of data
for 90 days they were hitting a wall.

© 2011 IBM Corporation
The problem
� Traditional Database was barely keeping up with the data
– Original database taking about 7 hours to read in the data
for 1 million meters
– Reports taking between 2 and 7 hours to run
– Problems with reading and writing data simultaneously
� What happens when they hit 3.5 million meters?
– 73 billion records stored will grow to 220 billion records
– Even with linear scaling performance inadequate
• not be enough time in the day to read and process
all this data
� Client is looking for ways to cut their costs
– 90 days of data for 1 million meters was ~1.3TB.
– What happens when they hit full roll out and look to store it
for 3 years?
– They would like to do more with the hardware they have
• Process the data more quickly
• Allow other applications to run against the data

© 2011 IBM Corporation
The Solution - Informix with TimeSeries
� Informix performance and storage comparison is linear with more meter data
� Informix gives even better results if you increase CPUs and storage
INFORMIX Oracle
Time to Load 1,000,000 Meters 18 Minutes 7 Hours
Reports Seconds to 11 min 2-7 HOURS
Storage Requirements 1,000,000 Meters 350GB 1.3 TB
© 2011 IBM Corporation
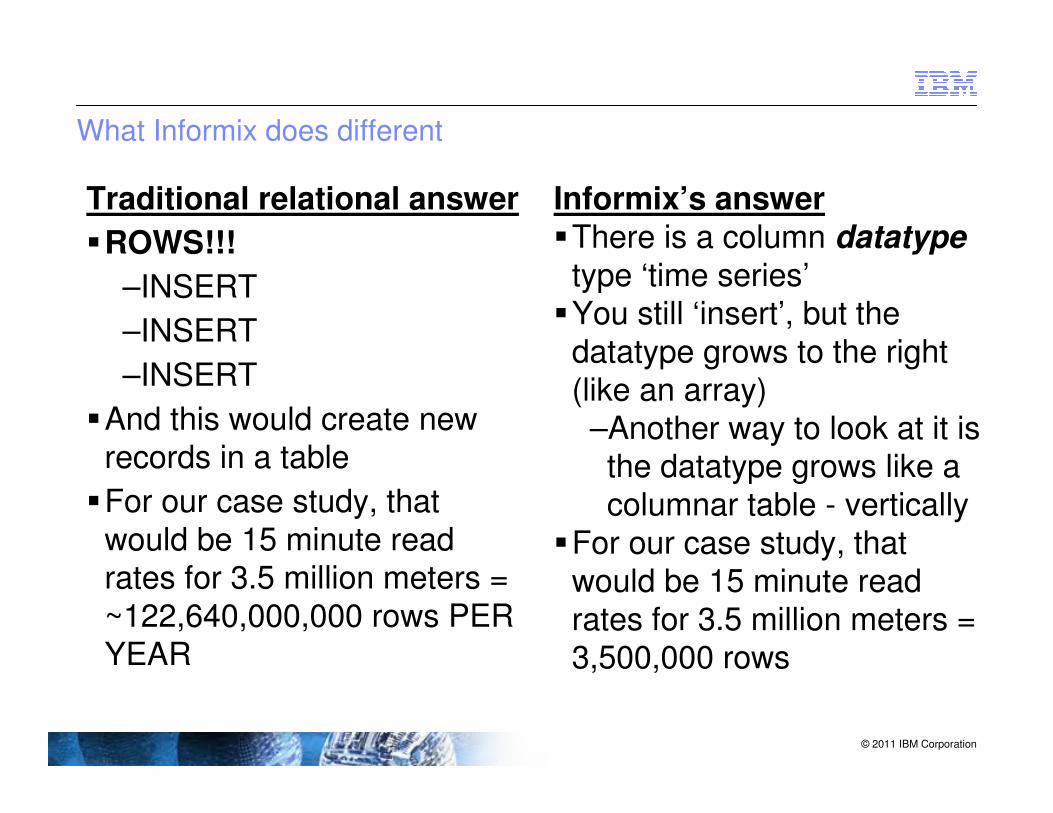
What Informix does different
Traditional relational answer
�ROWS!!!
–INSERT
–INSERT
–INSERT
�And this would create new records in a table
�For our case study, that would be 15 minute read rates for 3.5 million meters = ~122,640,000,000 rows PER YEAR
Informix’s answer�There is a column datatype
type ‘time series’�You still ‘insert’, but the
datatype grows to the right (like an array)
–Another way to look at it is the datatype grows like a columnar table - vertically
�For our case study, that would be 15 minute read rates for 3.5 million meters = 3,500,000 rows
© 2011 IBM Corporation
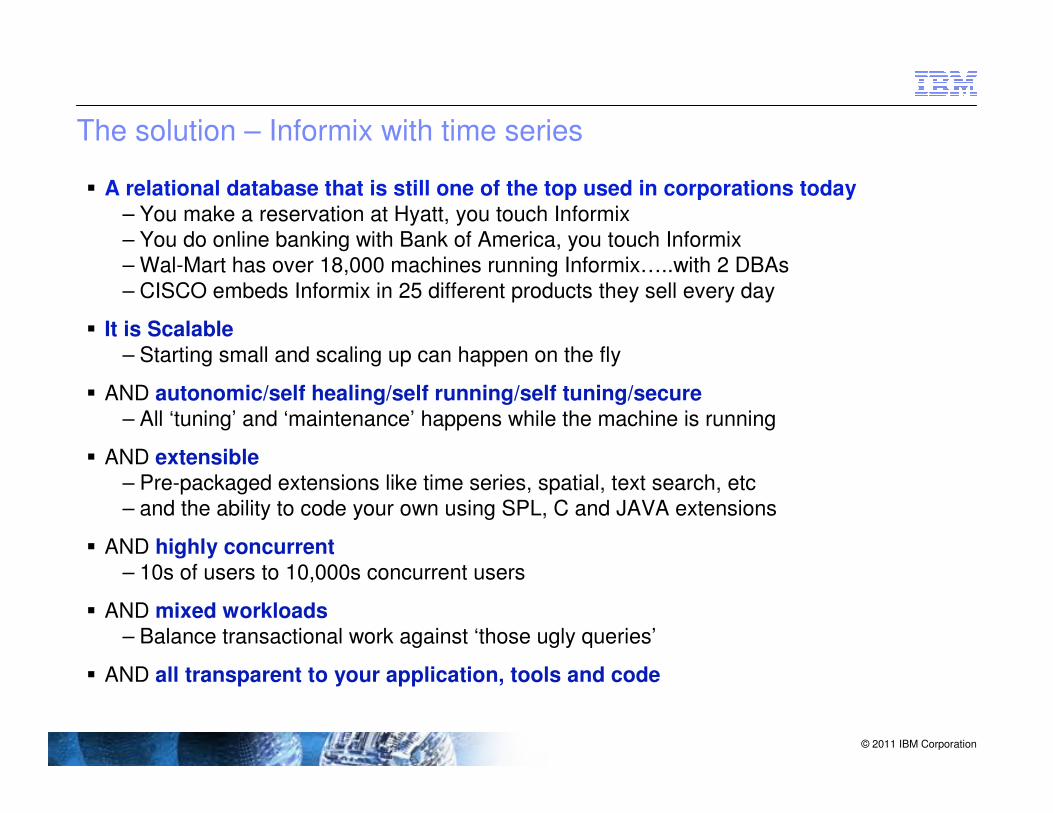
The solution – Informix with time series
� A relational database that is still one of the top used in corporations today
– You make a reservation at Hyatt, you touch Informix
– You do online banking with Bank of America, you touch Informix
– Wal-Mart has over 18,000 machines running Informix…..with 2 DBAs
– CISCO embeds Informix in 25 different products they sell every day
� It is Scalable
– Starting small and scaling up can happen on the fly
� AND autonomic/self healing/self running/self tuning/secure– All ‘tuning’ and ‘maintenance’ happens while the machine is running
� AND extensible– Pre-packaged extensions like time series, spatial, text search, etc
– and the ability to code your own using SPL, C and JAVA extensions
� AND highly concurrent– 10s of users to 10,000s concurrent users
� AND mixed workloads– Balance transactional work against ‘those ugly queries’
� AND all transparent to your application, tools and code
© 2011 IBM Corporation
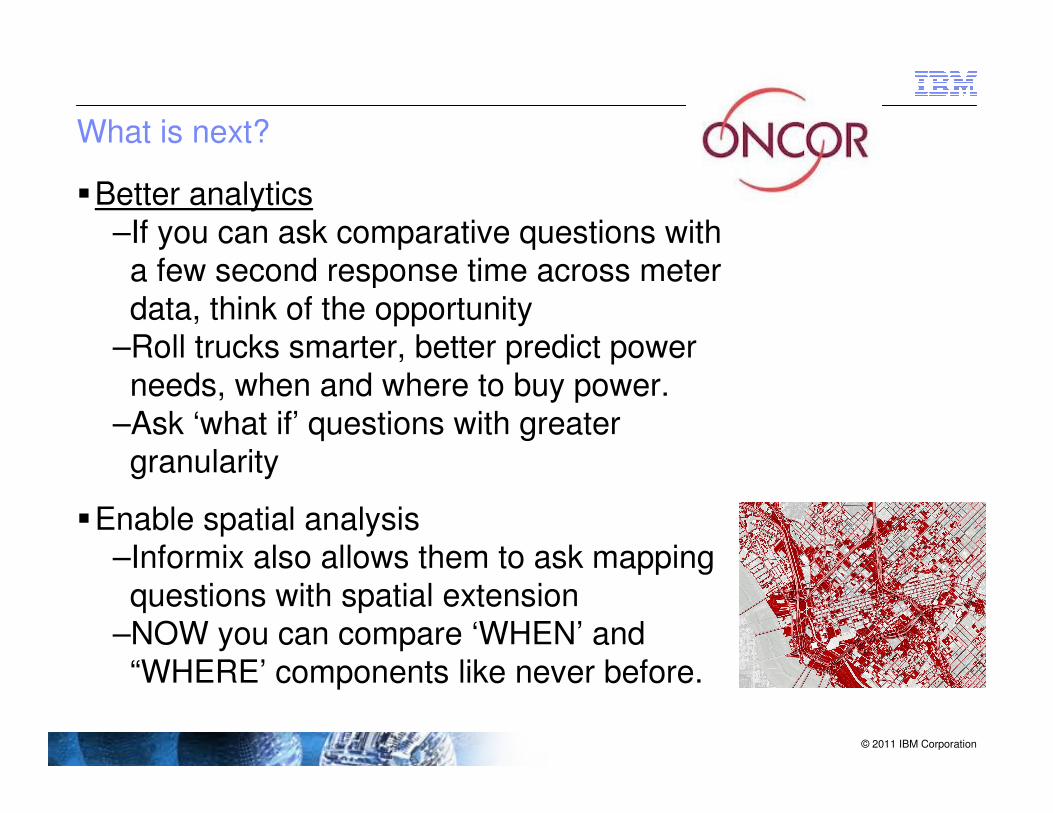
What is next?
�Better analytics–If you can ask comparative questions with a few second response time across meter data, think of the opportunity
–Roll trucks smarter, better predict power needs, when and where to buy power.
–Ask ‘what if’ questions with greater granularity
�Enable spatial analysis–Informix also allows them to ask mapping questions with spatial extension
–NOW you can compare ‘WHEN’ and “WHERE’ components like never before.
© 2011 IBM Corporation
So – everyone loves a good comparison………..
�Oracle published a benchmark around their ability to process smart meter data in September 2011
� IBM published a benchmark around Informix’s ability to process smart meter data in October, 2011
�The solution did this using a meter data management (MDM) solution over the respective databases:
–Loading of smart meter data from millions of meters–Ran the data thru a VEE (Validation, Estimation and Editing) phase
–Processed a set of meters thru a billing cycle
�So I felt compelled to show the results
© 2011 IBM Corporation
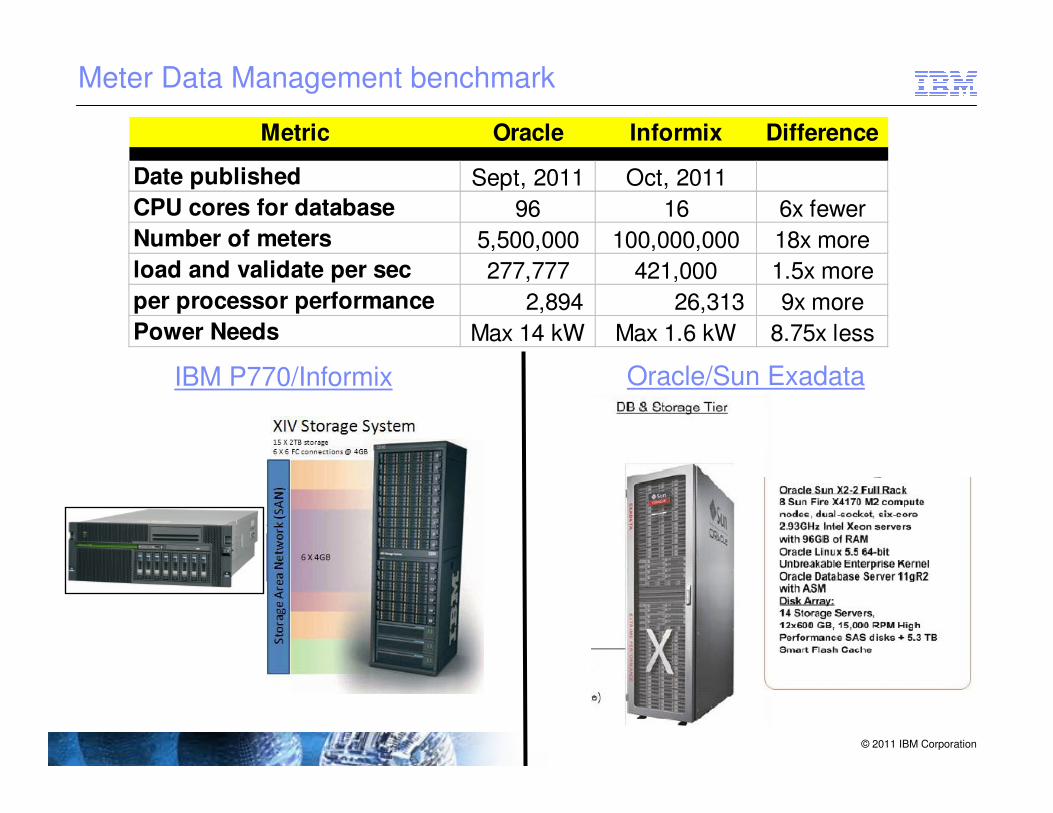
Meter Data Management benchmark
Metric Oracle Informix Difference
Date published Sept, 2011 Oct, 2011
CPU cores for database 96 16 6x fewer
Number of meters 5,500,000 100,000,000 18x more
load and validate per sec 277,777 421,000 1.5x more
per processor performance 2,894 26,313 9x more
Power Needs Max 14 kW Max 1.6 kW 8.75x less
IBM P770/Informix Oracle/Sun Exadata
© 2011 IBM Corporation
So what is my point?
� It is possible for any sized organization to capture and analyze sensor data
� It does not take a refrigerator to process it and scary storage subsystems to manage it.
�You can go from automation to anticipation–Based on X, you get Y–Greater amps pulled by a motor, means a filter needs cleaning–Lower MPG means tune up is needed–After X miles, time to get tires checked–If tomorrow’s weather is 92F and sunny, this city will consume
200MW/hr of power through this substation–If across a product line, a consistent product failure takes place, re-
adjust Y (maint, usage, replace bad part, some combination).

© 2011 IBM Corporation
Key Takeaways
�Traditional relational database structures do not manage sensor data well
–Load–Query–Cost to store–Non-scalable
� IBM Informix with time series solves this problem–Open relational database–Extends to store, access and secure ‘other’ data
• Like time series, spatial and others.–66% less storage – this pays for it by itself
–Load data 100x times faster–Over 100 functions in the database for time series

© 2011 IBM Corporation
Next steps and questions
� Download and try it anytime– www.ibm.com/informix and click ‘trials and demos’
and download the ‘Developer Edition’– The sample database has time series data in it to walk
you through the capabilities� Check out www.youtube.com and search on ‘Informix
time series’� Ask me for further details
Tom Rieger
IBM
952-221-6514