The Reading Gap - Sutton Trust · The Reading Gap: The socio-economic gap in children’s reading...
12
The Reading Gap: The socio-economic gap in children’s reading skills: A cross-national comparison using PISA 2009 John Jerrim July 2013 Improving social mobility through education
Transcript of The Reading Gap - Sutton Trust · The Reading Gap: The socio-economic gap in children’s reading...
0
The Reading Gap: The socio-economic gap in children’s reading skills: A cross-national
comparison using PISA 2009
John Jerrim
July 2013
Improving social mobility
through education
1
Foreword 3
Executive Summary 4
Recommendations 5
Overview, data and methodology 6
Socio-economic differences in children’s reading skills 7
The test-score gap between the highest achieving children from the most advantaged
and least advantaged backgrounds 9
Conclusions 11
Appendix 12
Contents
2
Ensuring that the brightest pupils fulfil their potential goes straight to the heart of social mobility, of basic
fairness and economic efficiency. Last year, the Sutton Trust published research into the performance of able
students in mathematics in England, showing that our brightest students lag behind not only the powerhouses
of Asia but also many European countries in performance at the highest levels.
This new report by Dr John Jerrim highlights an even more worrying issue: the gap in achievement between
high achieving boys from disadvantaged backgrounds and their better off peers. Not only are the brightest
boys from poor families thirty months behind high achievers from the most advantaged backgrounds, this gap
places England near the bottom of the OECD league tables.
This matters for two important reasons. First, it is clearly economically inefficient not to tap into talent
wherever it exists. By not stretching our most able students from all backgrounds, we are not only failing them,
we are reducing our ability to compete globally. Second, such under-achievement perpetuates those
inequalities which make it so hard for bright children to move up in society.
The Sutton Trust supports many programmes that help able young people from low and middle income homes
to achieve their potential. But if the high achieving young people who underperform in tests such as this are to
succeed, proper provision for the most able across the whole education system is critical.
Part of the solution lies in the Sutton Trust’s 'Open Access' scheme which would democratise entry to the
country’s leading independent day schools – opening them up to bright pupils from all backgrounds, not just
those able to afford fees.
But we also need to improve the support for the broader group of highly able children in comprehensive
schools and academies. That is why it is so important that there is a targeted scheme that ensures that those
with high potential from low and middle income backgrounds are identified and helped to thrive.
Although some schools have kept a gifted and talented strand, following the initiatives introduced by the
previous Government, such provision is patchy. Parents and students need to know that highly able young
people will be given the backing they need to succeed regardless of which school they attend. That’s why the
chief inspector of schools was right recently to urge such provision and it is why Government should give it
their backing too.
This report recommends that there should be a targeted scheme for highly able pupils from low and middle
income homes, and that there should be clearer recognition of their attainment in the revised school league
tables.
I am extremely grateful to Dr Jerrim for this new analysis. I hope it will reinforce the need for a new emphasis
on the provision and policy for the highly able.
Sir Peter Lampl
Chairman
The Sutton Trust and Education Endowment Foundation
Foreword
3
High achieving boys from the most advantaged family backgrounds in England are roughly two and a half
years ahead of their counterparts in the least advantaged households by the age of 15. In Scotland, the
gap is almost three years.
This places England 31st
in the ranking out of 32 developed nations that take the OECD PISA survey.
Although the estimated confidence intervals are quite wide, England performs poorly relative to countries
like Finland (ranked 2nd
), Germany (3rd
) and Canada (5th
), where the gap is just one and a quarter years
or less.
Helping disadvantaged boys to obtain higher level skills would help improve university participation,
particularly to elite institutions, and improve access to the professions.
The Office for Fair Access (OFFA 2013, page 51
) and the Higher Education Funding Council for England
(HEFCE) have recently stated that “to make significant progress in WP [widening participation] requires a
targeted focus on individual learners over a number of years. When working with young people,
interventions are most effective when they start early, and are then delivered consistently throughout time
at school and college”. The author agrees that early and sustained intervention is likely to be vital to
raising high potential disadvantaged children’s educational attainment.
Effective interventions may be needed to achieve this, including a well-targeted “gifted and talented”
programme along with initiatives to raise aspirations.
1 See http://www.offa.org.uk/wp-content/uploads/2013/03/National-strategy-interim-report-January-2013.pdf
Executive Summary
4
The major problem underlying socio-economic differences in higher education participation is that, by the
end of compulsory education, even the most able children from disadvantaged homes lag a long way
behind their more advantaged peers. Raising the attainment of this group should therefore be a priority in
efforts to widen participation and reduce socio-economic inequalities in England.
A targeted scheme for highly able pupils should be introduced, where high potential children from low
and middle income backgrounds are identified at the start of compulsory education and receive sustained
interventions throughout their time at school. Less advantaged children who have reached school age
doing relatively well should thus be in a particularly strong position to benefit from a period of such
sustained investment. Schemes of this nature could be piloted in the most deprived parts of the country
and undergo a thorough evaluation (e.g. a Randomised Control Trial) before being rolled out on a
national scale.
The coalition government has demonstrated its commitment to disadvantaged pupils by establishing the
Education Endowment Foundation (educationendowmentfoundation.org.uk/). A key part of this
Foundation’s future work should be to ensure highly able children from disadvantaged backgrounds
succeed in school and have the opportunity to enter top universities and professional jobs. The
government should provide additional resources to the foundation to trial interventions that specifically
target already high achieving children from disadvantaged homes. These should be evaluated using
robust evaluation methodologies (e.g. randomised control trials) so that policymakers develop a better
understanding of what schemes really have the potential to work.
The coalition government has announced that the league tables will use an average point score rather
than 5 A*-Cs as the key measurement of a school’s success in the future. Floor targets will reflect results
in English and Maths, and progress made between the age of 11 and 16 linked to eight subjects. The
Government is also considering tracking pupils in receipt of the pupil premium directly. Within the league
tables, there should also be a measure of the progress made by the top ten per cent of pupils in each
secondary school, and schools should be held accountable by Ofsted for the progress made.
Recommendations
5
This short report supplements Jerrim (2012)2
, where I investigated the link between family background and
children’s reading tests across a series of OECD countries. Previous studies for the Sutton Trust (e.g.
Smithers 20123
) have suggested that “policy and provision for the highly able in England is in a mess” and that
England has only 1.7% of children in the top PISA math performance level, compared to 15.6% in Hong Kong
and 15.6% in Singapore. This report builds upon this work, using a different methodological approach to
investigate the link between family background and high reading performance.
The data are drawn from the 2009 round of the Programme for International Student Assessment (PISA); a
study of 15 year-olds’ achievement held every three years.4
In 2009, PISA was conducted in November, when
children in England were in their final year of compulsory schooling and just six months away from taking their
GCSEs. The PISA consortia state that the test measures children's 'functional ability' (how well they can use
the concepts examined in 'real life' situations) in three domains (reading, maths and science). In 2009, reading
was assigned as the major domain, with the vast majority of questions asked on this topic. The overall reading
score for England was 495, compared to 533 in Hong Kong, 536 in Finland and 493 as the OECD average.
Overall, England was ranked 25th
out of the 65 countries that participated. This report focuses on socio-
economic differences in children’s reading skills. If readers are interested in taking sample questions from the
PISA test, they can follow the link provided here: http://pisa-sq.acer.edu.au/
My focus is on two particular groups of children: (i) those from ‘advantaged’ family backgrounds (ii) those from
disadvantaged family backgrounds. Family background refers to the International Socioeconomic Index (ISEI)
index in the PISA dataset. This is a continuous measure based upon the highest occupational status of a
child’s mother or father. Within each country, children are divided into quintiles (five equal groups, with each
group containing 20% of the 15 year old population). PISA test scores are then compared between the top
quintile (most advantaged 20% of the population) and the bottom quintile (least advantaged 20% of the
population). Put simply, results refer to the difference in test scores between children who have parents
working in occupations like managers, doctors, lawyers and engineers and those whose parents work in
unskilled or semi-skilled jobs such as cleaners, waiters / waitresses or labourers.
Further methodological details can be found in the Appendix.
2 http://onlinelibrary.wiley.com/doi/10.1111/j.1475-5890.2012.00157.x/abstract 3 See http://www.suttontrust.com/research/educating-the-highly-able/ 4 Throughout my analysis I treat the England and Scotland as separate countries (‘England’ includes Wales and Northern Ireland).
Overview, data and methodology
6
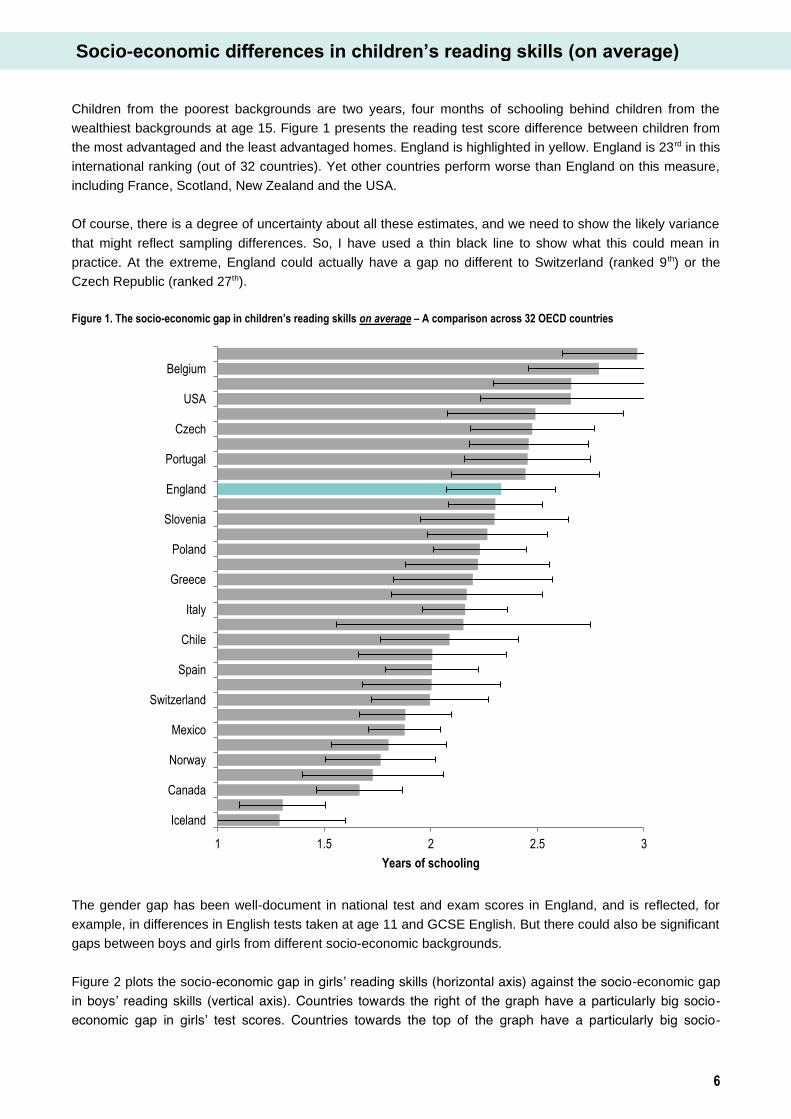
Children from the poorest backgrounds are two years, four months of schooling behind children from the
wealthiest backgrounds at age 15. Figure 1 presents the reading test score difference between children from
the most advantaged and the least advantaged homes. England is highlighted in yellow. England is 23rd
in this
international ranking (out of 32 countries). Yet other countries perform worse than England on this measure,
including France, Scotland, New Zealand and the USA.
Of course, there is a degree of uncertainty about all these estimates, and we need to show the likely variance
that might reflect sampling differences. So, I have used a thin black line to show what this could mean in
practice. At the extreme, England could actually have a gap no different to Switzerland (ranked 9th
) or the
Czech Republic (ranked 27th
).
Figure 1. The socio-economic gap in children’s reading skills on average – A comparison across 32 OECD countries
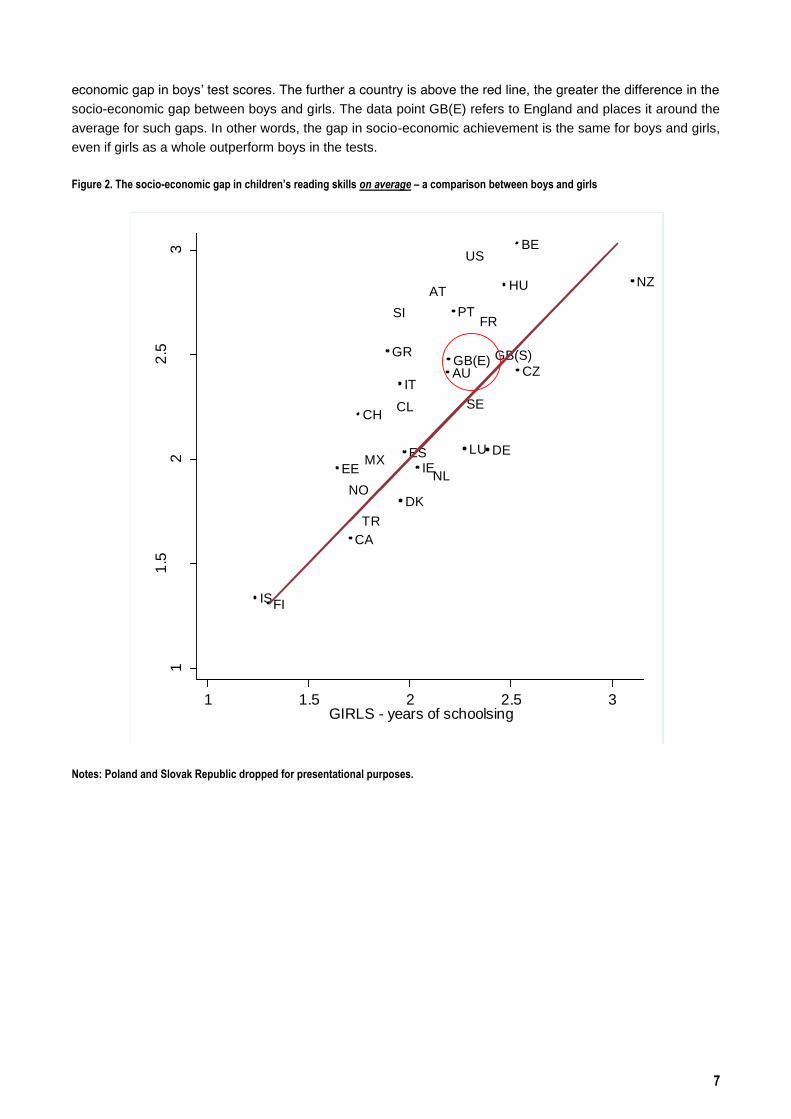
The gender gap has been well-document in national test and exam scores in England, and is reflected, for
example, in differences in English tests taken at age 11 and GCSE English. But there could also be significant
gaps between boys and girls from different socio-economic backgrounds.
Figure 2 plots the socio-economic gap in girls’ reading skills (horizontal axis) against the socio-economic gap
in boys’ reading skills (vertical axis). Countries towards the right of the graph have a particularly big socio-
economic gap in girls’ test scores. Countries towards the top of the graph have a particularly big socio-
1 1.5 2 2.5 3
Iceland
Canada
Norway
Mexico
Switzerland
Spain
Chile
Italy
Greece
Poland
Slovenia
England
Portugal
Czech
USA
Belgium
Years of schooling
Socio-economic differences in children’s reading skills (on average)
7
economic gap in boys’ test scores. The further a country is above the red line, the greater the difference in the
socio-economic gap between boys and girls. The data point GB(E) refers to England and places it around the
average for such gaps. In other words, the gap in socio-economic achievement is the same for boys and girls,
even if girls as a whole outperform boys in the tests.
Figure 2. The socio-economic gap in children’s reading skills on average – a comparison between boys and girls
Notes: Poland and Slovak Republic dropped for presentational purposes.
AU
AT
BE
CA
CL
CZ
DK
EE
FI
FR
DE
GR
HU
IS
IE
IT
LUMX
NL
NZ
NO
PTSI
ES
SECH
TR
GB(E) GB(S)
US
11
.52
2.5
3
BO
YS
- y
ea
rs o
f scho
ols
ing
1 1.5 2 2.5 3GIRLS - years of schoolsing
8
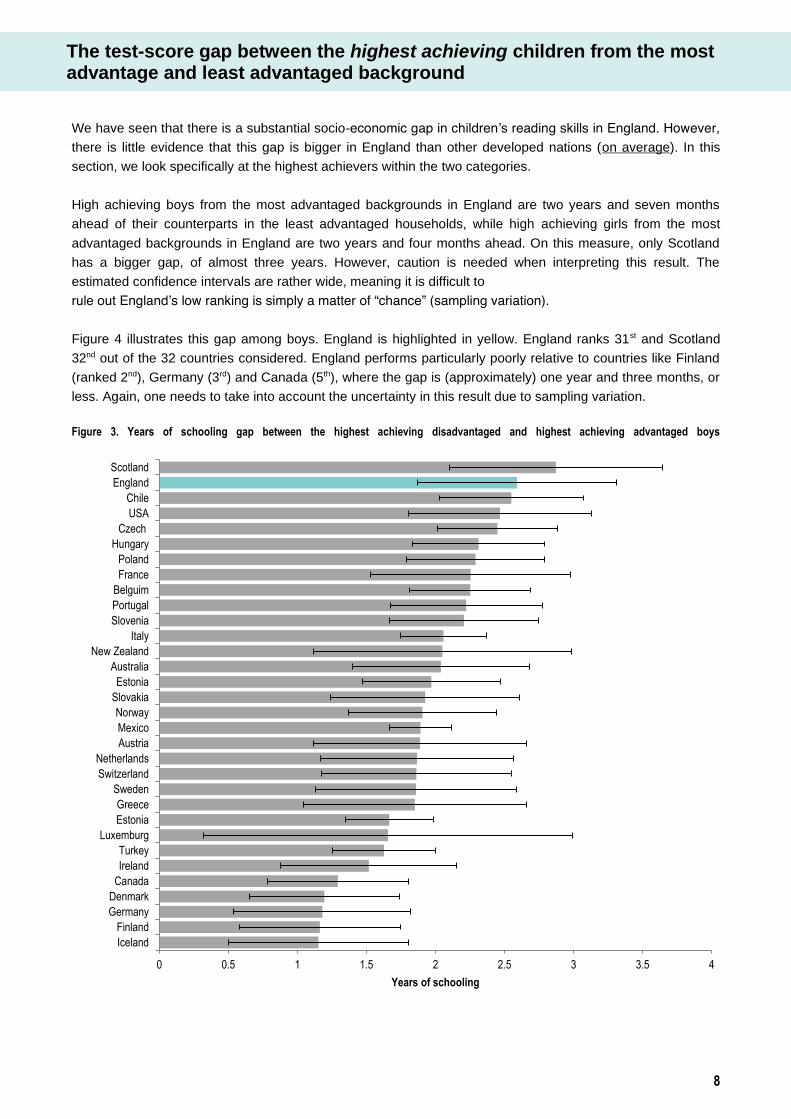
We have seen that there is a substantial socio-economic gap in children’s reading skills in England. However,
there is little evidence that this gap is bigger in England than other developed nations (on average). In this
section, we look specifically at the highest achievers within the two categories.
High achieving boys from the most advantaged backgrounds in England are two years and seven months
ahead of their counterparts in the least advantaged households, while high achieving girls from the most
advantaged backgrounds in England are two years and four months ahead. On this measure, only Scotland
has a bigger gap, of almost three years. However, caution is needed when interpreting this result. The
estimated confidence intervals are rather wide, meaning it is difficult to
rule out England’s low ranking is simply a matter of “chance” (sampling variation).
Figure 4 illustrates this gap among boys. England is highlighted in yellow. England ranks 31st
and Scotland
32nd
out of the 32 countries considered. England performs particularly poorly relative to countries like Finland
(ranked 2nd
), Germany (3rd
) and Canada (5th
), where the gap is (approximately) one year and three months, or
less. Again, one needs to take into account the uncertainty in this result due to sampling variation.
Figure 3. Years of schooling gap between the highest achieving disadvantaged and highest achieving advantaged boys
0 0.5 1 1.5 2 2.5 3 3.5 4
Iceland
Finland
Germany
Denmark
Canada
Ireland
Turkey
Luxemburg
Estonia
Greece
Sweden
Switzerland
Netherlands
Austria
Mexico
Norway
Slovakia
Estonia
Australia
New Zealand
Italy
Slovenia
Portugal
Belguim
France
Poland
Hungary
Czech
USA
Chile
England
Scotland
Years of schooling
The test-score gap between the highest achieving children from the most advantage and least advantaged background
9
Notes: Thin black lines refer to estimated 99% confidence intervals. Note that 99% confidence
intervals have been used as the PISA complex survey design (clustering of children within schools)
has not been taken into account. ‘High achieving’ refers to the 90th
percentile.
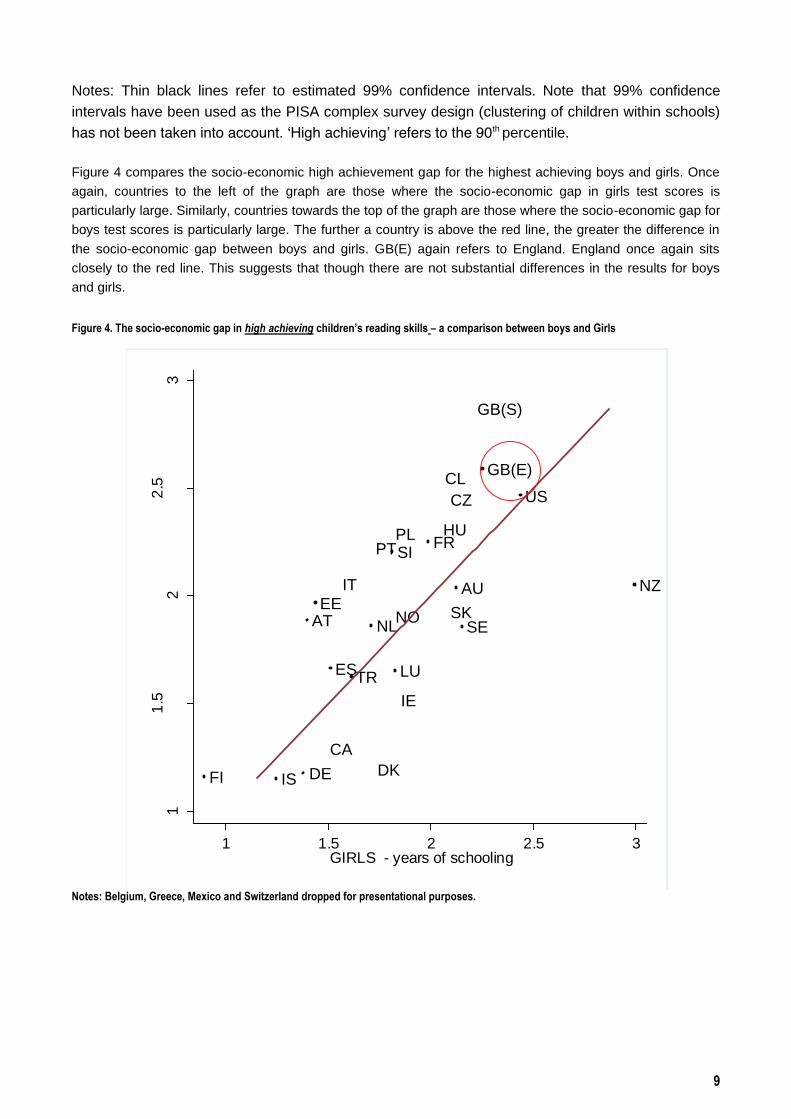
Figure 4 compares the socio-economic high achievement gap for the highest achieving boys and girls. Once
again, countries to the left of the graph are those where the socio-economic gap in girls test scores is
particularly large. Similarly, countries towards the top of the graph are those where the socio-economic gap for
boys test scores is particularly large. The further a country is above the red line, the greater the difference in
the socio-economic gap between boys and girls. GB(E) again refers to England. England once again sits
closely to the red line. This suggests that though there are not substantial differences in the results for boys
and girls.
Figure 4. The socio-economic gap in high achieving children’s reading skills – a comparison between boys and Girls
Notes: Belgium, Greece, Mexico and Switzerland dropped for presentational purposes.
ISFI DE DK
CA
IE
TR LUES
SENLAT NO SKEE
AU NZIT
SIPT FRPL HU
CZ USCL
GB(E)
GB(S)
11
.52
2.5
3
BO
YS
- y
ea
rs o
f scho
olin
g
1 1.5 2 2.5 3GIRLS - years of schooling
10
This report has built upon Jerrim (2012). In that report I found that, although English children’s reading skills
are heavily linked to their socio-economic background, there was not a stronger association in this country
than most other developed nations (on average). England did, however, stand out in international
comparisons when considering the link between family background and high achievement.
In this report I have extended this work by considering differences between boys and girls. For both genders,
the socio-economic gap in PISA test scores in England is broadly in-line with the OECD average (in terms of
average test scores).
However, the association between family background and high achievement does seem to be strong in
England relative to other developed nations. For boys, this relationship is stronger in England and Scotland
than any of the other countries considered. Policymakers should interpret these results cautiously, however,
as there remains a great deal of uncertainty surrounds England’s exact position due to sampling variation.
Conclusions

11
I divide the ISEI index into five equally sized groups within each country of interest. This then enters as the
key covariate in my Ordinary Least Squares (OLS) and quantile regression models of children's reading
achievement. The intuition behind these techniques is shown in Figure 1. This presents hypothetical test score
distributions for low socio-economic status (SES) and high SES children5
. ML
and MH
represent the mean test
score for these two groups. OLS regression that includes a binary indicator for socio-economic status (low
versus high) captures the difference between these two points (conditional upon any other factors that have
been included in the model). Quantile regression can be thought of in a similar way. The points QL
and QH
in
Figure 2 represent the 90th
percentile of the low SES distribution and the 90th
percentile of the high SES
distribution. A quantile regression analysis at the 90th
percentile will capture the difference between these two
points (again, conditional upon any other factors that have been included in the model). Throughout this
report, I refer to pupils scoring at the 90th
percentile of the PISA reading test distribution as ‘high achievers’.
All models were estimated separately for boys and girls, and control for whether the child was an immigrant or
not. Results will be presented in terms of ‘years of schooling’. This is based on OECD (2010:110)6
which
suggests that 40 PISA test points equals one year of schooling. Readers should note, however, that this is a
fairly crude approximation.
Hypothetical distribution of test scores for low and high SES children – an illustration of the difference between OLS and quantile regression estimates
5 In this example, I have set the shape of the high SES and low SES test score distributions to be different for illustration purposes. 6 OECD (2010), ‘PISA 2009 results: learning to learn: student engagement strategies and practices volume III”, Paris: OECD.
Low SES
High SES
M
M
OLS
Q Q
QREG
L
L
H
H
0.
1.
2.
3.
4
- 5 . 0 0 . 0 5 . 0 1 0 . 0
x
Low SES High SES
Appendix: A note on methodology