
The Rational Synthesis of Supported Noble Single Or ...
125
University of South Carolina Scholar Commons eses and Dissertations 1-1-2013 e Rational Synthesis of Supported Noble Single Or Bimetallic Catalysts by Electrostatic Adsorption HYEN CHO University of South Carolina - Columbia Follow this and additional works at: hps://scholarcommons.sc.edu/etd Part of the Chemical Engineering Commons is Open Access Dissertation is brought to you by Scholar Commons. It has been accepted for inclusion in eses and Dissertations by an authorized administrator of Scholar Commons. For more information, please contact [email protected]. Recommended Citation CHO, H.(2013). e Rational Synthesis of Supported Noble Single Or Bimetallic Catalysts by Electrostatic Adsorption. (Doctoral dissertation). Retrieved from hps://scholarcommons.sc.edu/etd/2484
Transcript of The Rational Synthesis of Supported Noble Single Or ...
University of South CarolinaScholar Commons
Theses and Dissertations
1-1-2013
The Rational Synthesis of Supported Noble SingleOr Bimetallic Catalysts by Electrostatic AdsorptionHYERAN CHOUniversity of South Carolina - Columbia
Follow this and additional works at: https://scholarcommons.sc.edu/etd
Part of the Chemical Engineering Commons
This Open Access Dissertation is brought to you by Scholar Commons. It has been accepted for inclusion in Theses and Dissertations by an authorizedadministrator of Scholar Commons. For more information, please contact [email protected].
Recommended CitationCHO, H.(2013). The Rational Synthesis of Supported Noble Single Or Bimetallic Catalysts by Electrostatic Adsorption. (Doctoraldissertation). Retrieved from https://scholarcommons.sc.edu/etd/2484
The Rational Synthesis of supported Noble Single or Bimetallic
Catalysts by Electrostatic Adsorption
by
Hye-Ran Cho
Bachelor of Engineering
Chung-Ang University, 2003
______________________________________________________
Submitted in Partial Fulfillment of the Requirements
For the Degree of Doctor of Philosophy in
Chemical Engineering
College of Engineering and Computing
University of South Carolina
2013
Accepted by:
John R. Regalbuto, Major Professor
John R. Monnier, Committee Member
Miao Yu, Committee Member
Douglas Blom, Committee Member
John W. Weidner, Committee Member
Lacy Ford, Vice Provost and Dean of Graduate Studies

ii
© Copyright by Hye-Ran Cho, 2013
All Rights Reserved

iii
DEDICATION
I dedicate this thesis to my parents for raising me as an independent and enthusiastic
woman with countless love and affection. They never say no whenever I want to discuss
about my future with them and always encourage me not to afraid my choice.
I also dedicate this thesis to my lovely friends and colleagues at UIC and at USC. I
would not handle lonely PhD student life without them. Especially my old friends
(Siyeon and Jungeun), they had given me a dream and never stop cheer me up until I
achieve it.
I would like to thank to Shin who support my dreams all the way and makes me
happy smile.
iv
ACKNOWLEDGEMENTS
First of all, I am earnest grateful to my advisor, Dr. John R. Regalbuto, for guide me to
achieve my dream.
I wish to express my sincere thanks to committee members; Dr. John. R. Monnier,
Dr. Miao Yu, Dr. John W. Weidner and Dr. Douglas Blom,
I place on record, my sincere gratitude to Johnson Matthey Technology Centre at UK for
supporting my chapter 3 work of this thesis and evaluating my Pt-Pd bimetallic catalysts.
I also thank Dr. Hutchings group in Cardiff University at UK for the reaction work
of benzyl alcohol oxidation and Steven A. Bradley in UOP Honeywell for STEM images
of Au-Pd bimetallic catalysts.
I am extremely grateful and indebted to Ke-Bin Low in RRC at UIC who suffered
to catch the good images of tiny particles of my Pt-Pd bimetallic catalysts and finally got
sick.
v
ABSTRACT
Many catalysts are today prepared by impregnation (also called incipient wetness or dry
impregnation) in which nominal amounts of metals are placed into the amount of solution
just necessary to fill the pore volume of the support material. While dry impregnation (DI)
is simple and the amounts of metals easily controlled, no attention is paid to metal-
support or metal-metal interaction. When DI-deposited metal precursors are reduced, the
particles tend to be large in size and there is often ppor contact between two metals in a
bimetallic system. In this work we demonstrate the application of “strong electrostatic
adsorption” (SEA) for the rational synthesis of inorganic metallic catalysts with high
metal dispersion and intimate metal1-metal2 interaction of bimetallic catalysts. For
monometallic catalysts, we suggested charge-enhanced dry impregnation (CEDI) which
can produce highly dispersed single metal catalysts by inducing electrostatic interaction
between dissolved precursor and support while using a simple DI method.
Two variations will be demonstrated that produce bimetallic catalysts: using simultaneous
or co-SEA, two metal precursors are simultaneously placed in solution and
electrostatically adsorbed onto a support in a mixed monolayer of precursors. This
produces homogeneously alloyed bimetallic particles when the precursor layer is reduced.
On the other hand, SEA can be applied in a two step sequence (seq-SEA); the core metal
precursor is electrostatically adsorbed onto the support and oxidized, and then the shell
metal precursor is selectively adsorbed onto the core metal oxide and not onto the support.
vi
A core-shell morphology persists after the reduction step.
Pt/Pd bimetallic catalysts supported by oxidized and unoxidized carbon, alumina and
silica have been synthesized by co-SEA. Seq-SEA has been used to produce Pd cores/Pt
shell (Pd@Pt) on silica and alumina, and Pt cores/Pd shell (Pt@Pd) on alumina. These
are compared with DI-prepared catalysts of the same nominal composition. Seq-SEA can
also produce well-dispersed uniform Pd@Au catalysts for Benzyl alcohol oxidation.
Catalysts synthesized using this method, have 10 times the activity of comparable DI-
prepared catalysts, while using 25 times less gold. The materials were characterized by
powder XRD, STEM, EDXS nanoparticle mapping, and TPR. Au/Pd/C catalysts were
evaluated by benzyl alcohol oxidation reaction at Cardiff University, England.
vii
TABLE OF CONTENTS
DEDICATION ................................................................................................................... iii
ACKNOWLEDGEMENT ................................................................................................. iv
ABSTARCT .........................................................................................................................v
LIST OF TABLES ............................................................................................................. ix
LIST OF FIGURES .............................................................................................................x
CHPATER 1: INTRODUCTION .........................................................................................1
1.1 PREPARATION OF SUPPORTED METAL CATALYSTS ..............................1
1.2 STRONG ELECTROSTATIC ADSORPTION .................................................2
1.3 EXTENSION OF THE SEA APPROACH TO BIMETALLIC CATALYSTS
............................................................................................................................6
CHAPTER 2: SUPPORTED Pt CATALYSTS PREPARED BY DI AND CEDI ................9
2.1 EXPERIMENTS .............................................................................................. 11
2.2 RESULTS .........................................................................................................12
2.3 DISCUSSION ..................................................................................................18
CHAPTER 3: PZC OF NOBLE METAL OXIDES AND ADSOPRTION OF NOBLE
METAL PRECURSOR ......................................................................................................25
3.1 EXPERIMENTS ..............................................................................................26
3.2 RESULT ...........................................................................................................30
3.3 DISCUSSION ..................................................................................................40
viii
3.4 CONCLUSION ................................................................................................47
CHAPTER 4: BIMETALLIC Pt/Pd CATALYSTS ..........................................................49
4.1 SINGLE Pt OR Pd METAL CATALYST BY SEA AND Pt/Pd ALLOY
CATALYST BY CO-SEA ......................................................................................52
4.2 Pd/Pt CORE-SHELL BIMETALLIC CATALYST BY SEQ-SEA ..................74
4.3 CONCLUSION…… ........................................................................................90
CHAPTER 5: CARBON SUPPORTED Au-Pd BIMETALLIC CATALYSTS FOR
BENZYL ALCOHOL OXIDATION .................................................................................92
5.1 EXPERIMENTS ..............................................................................................94
5.2 RESULT AND DISCUSSION .........................................................................97
5.3 CONCLUSION ..............................................................................................108
REFERENCES ................................................................................................................109
ix
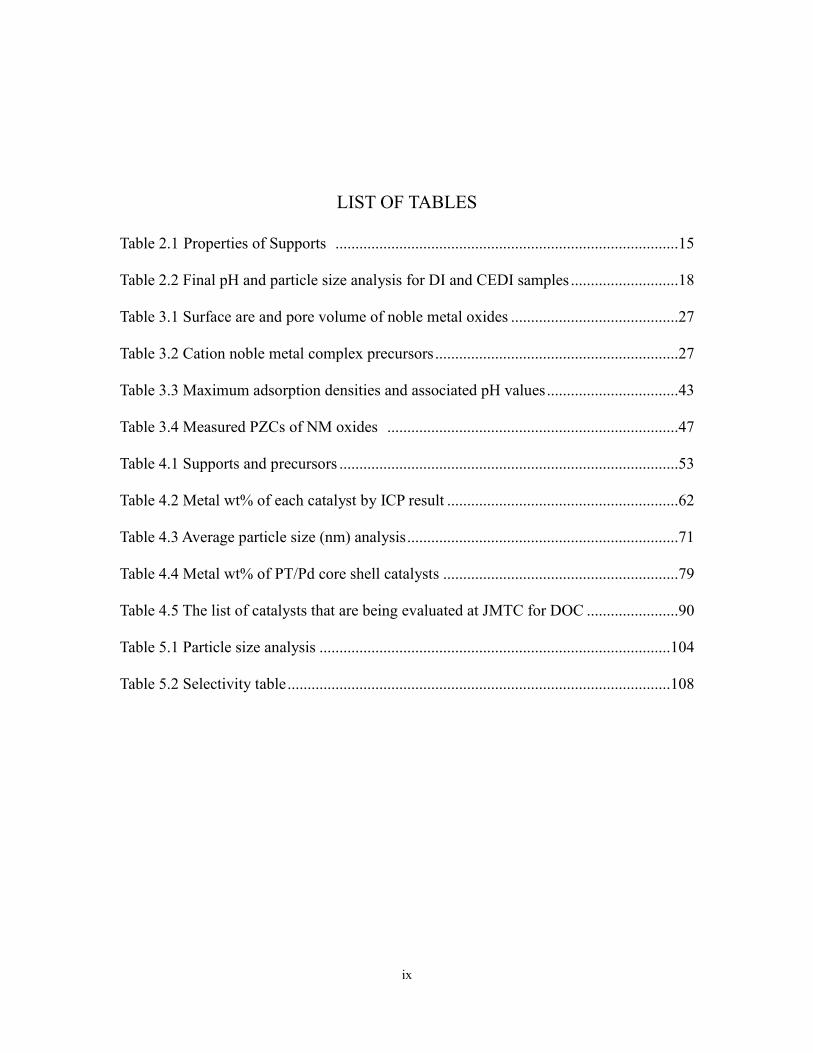
LIST OF TABLES
Table 2.1 Properties of Supports ......................................................................................15
Table 2.2 Final pH and particle size analysis for DI and CEDI samples ...........................18
Table 3.1 Surface are and pore volume of noble metal oxides ..........................................27
Table 3.2 Cation noble metal complex precursors .............................................................27
Table 3.3 Maximum adsorption densities and associated pH values .................................43
Table 3.4 Measured PZCs of NM oxides .........................................................................47
Table 4.1 Supports and precursors .....................................................................................53
Table 4.2 Metal wt% of each catalyst by ICP result ..........................................................62
Table 4.3 Average particle size (nm) analysis ....................................................................71
Table 4.4 Metal wt% of PT/Pd core shell catalysts ...........................................................79
Table 4.5 The list of catalysts that are being evaluated at JMTC for DOC .......................90
Table 5.1 Particle size analysis ........................................................................................104
Table 5.2 Selectivity table ................................................................................................108
x
LIST OF FIGURES
Figure 1.1 Electrostatic Adsorption Mechanism ..................................................................3
Figure 1.2 Simulation of SEA at high surface loadings .......................................................5
Figure 1.3 RPA simulation of Pt adsorption over supports with different PZC ...................6
Figure 1.4 Schematic of proposed selective adsorption.......................................................7
Figure 2.1 Simulation of SEA at high surface loadings .....................................................13
Figure 2.2 Illustration of SEA, DI, and CEDI impregnations ...........................................14
Figure 2.3 STEM image of supported Pt catalysts after reduced at 200oC ........................16
Figure 2.4 XRD pattern of supported Pt catalysts prepared by DI and CEDI ...................17
Figure 2.5 RPA prediction of Pt adsorption over oxides of various PZC surface with
different surface loading from 500-200,000 m2/L .................................................21
Figure 2.6 Example for how to predict initial pH for optimal adsorption .........................23
Figure 3.1 Example of XRD (PdO·H2O) ...........................................................................29
Figure 3.2 XPS survey of NM oxides ................................................................................33
Figure 3.3 3 points measurement for PZCs of NM oxide ..................................................34
Figure 3.4 Uptake survey of NM cation precursors with PtO2 ..........................................35
Figure 3.5 Uptake survey of NM cation precursors with Rh2O3 .......................................37
Figure 3.6 Uptake survey of NM cation precursors with RuO2 .........................................38
Figure 3.7 Uptake survey of NM cation precursors with PdO ........................................39
Figure 3.8 Uptake survey of NM cation precursors with IrO2 ...........................................40
xi
Figure 3.9 Schematic of the adsorption over small or big size support .............................44
Figure 3.10 Max. shell metal ratio vs particles size of core metal oxide ...........................47
Figure 4.1 Schematic of working hypothesis for bimetallic catalyst preparation..............52
Figure 4.2 Single metal adsorption on SiO2, oxC, Al2O3 and C ......................................59
Figure 4.3 Two metals co-SEA adsorption SiO2, oxC, Al2O3 and C ...............................62
Figure 4.4 TPR result of silica, oxC, Mass-spec of PdTA on oxC, alumina and C ...........66
Figure 4.5 XRD result of silica, oxCarbon, alumina, and Carbon .....................................68
Figure 4.6 STEM and EDXS of silica, oxCarbon, alumina, and Carbon ..........................74
Figure 4.7 Sequential SEA for the synthesis of a) Pt core@Pd shell particle and b) Pd
core@Pt shell particle ............................................................................................76
Figure 4.8 SEA/reduction cycles to build shell metal loading ...........................................76
Figure 4.9 seq-SEA uptake graph a) PdTA b) PTA c) PHC ...............................................78
Figure 4.10 XRD patterns of seq-SEA vs co-DI ................................................................81
Figure 4.11 STEM and EDXS of seq-SEA vs co-DI .........................................................85
Figure 4.12 Catalytic Activity for DOC a) CO b) THC and c) NO ...................................88
Figure 5.1 Schematic of seq-SEA ......................................................................................94
Figure 5.2 Metal uptake surveys of PdTC on Darko G60 carbon, AuBen on carbon,
PdO, and PdO/carbon.............................................................................................97
Figure 5.3 X-ray Diffraction patterns of carbon support, 2.5Pd/C by SEA,
0.5Au/2.5Pd/C and 0.1Au/2.5Pd/C by seq-SEA, 2.5Au/2.5Pd/C by co-DI ..........99
Figure 5.4 STEM images of 2.5Pd/C by SEA, 0.1Au/2.5Pd/C and 0.5Au/2.5Pd/C
by seq-SEA, 2.5Au/2.5Pd/C by co-DI .................................................................100
Figure 5.5 Chemical mapping and STEM images of Au/Pd/C ........................................103
Figure 5.6 Benzyl alcohol conversion .............................................................................105
Figure 5.7 X-ray Diffraction patterns of 0.1wt% Au DI catalysts ...................................107
1
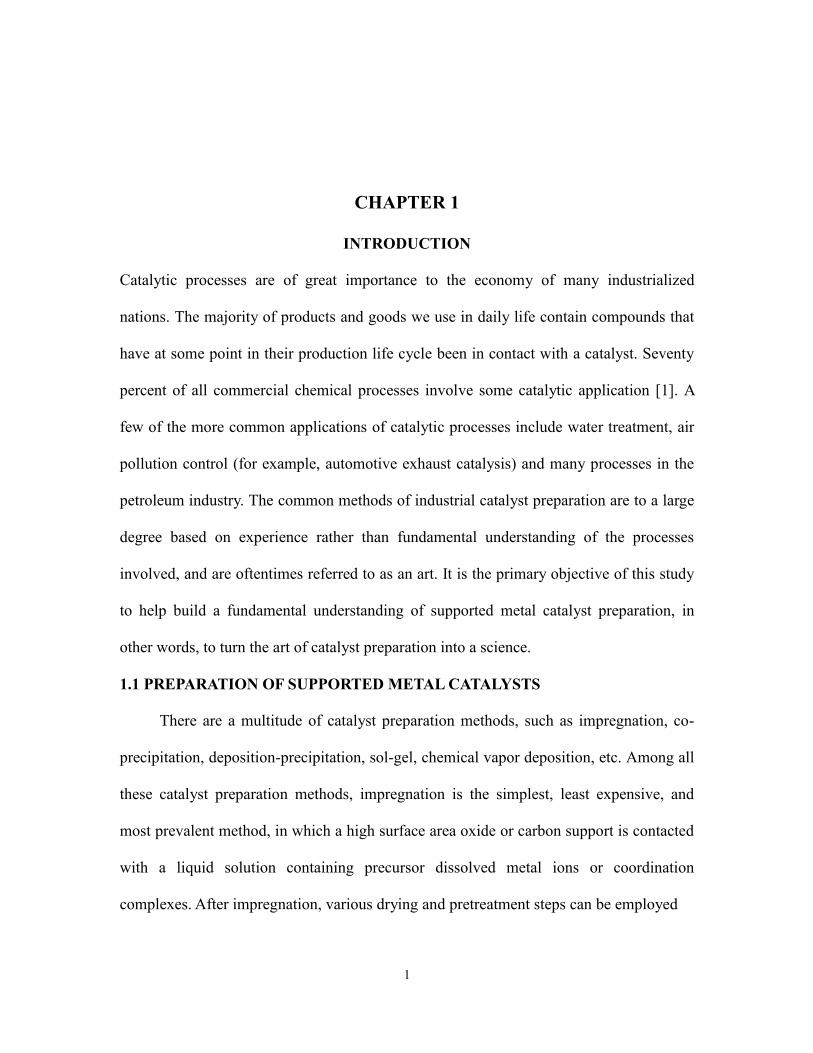
CHAPTER 1
INTRODUCTION
Catalytic processes are of great importance to the economy of many industrialized
nations. The majority of products and goods we use in daily life contain compounds that
have at some point in their production life cycle been in contact with a catalyst. Seventy
percent of all commercial chemical processes involve some catalytic application [1]. A
few of the more common applications of catalytic processes include water treatment, air
pollution control (for example, automotive exhaust catalysis) and many processes in the
petroleum industry. The common methods of industrial catalyst preparation are to a large
degree based on experience rather than fundamental understanding of the processes
involved, and are oftentimes referred to as an art. It is the primary objective of this study
to help build a fundamental understanding of supported metal catalyst preparation, in
other words, to turn the art of catalyst preparation into a science.
1.1 PREPARATION OF SUPPORTED METAL CATALYSTS
There are a multitude of catalyst preparation methods, such as impregnation, co-
precipitation, deposition-precipitation, sol-gel, chemical vapor deposition, etc. Among all
these catalyst preparation methods, impregnation is the simplest, least expensive, and
most prevalent method, in which a high surface area oxide or carbon support is contacted
with a liquid solution containing precursor dissolved metal ions or coordination
complexes. After impregnation, various drying and pretreatment steps can be employed
2
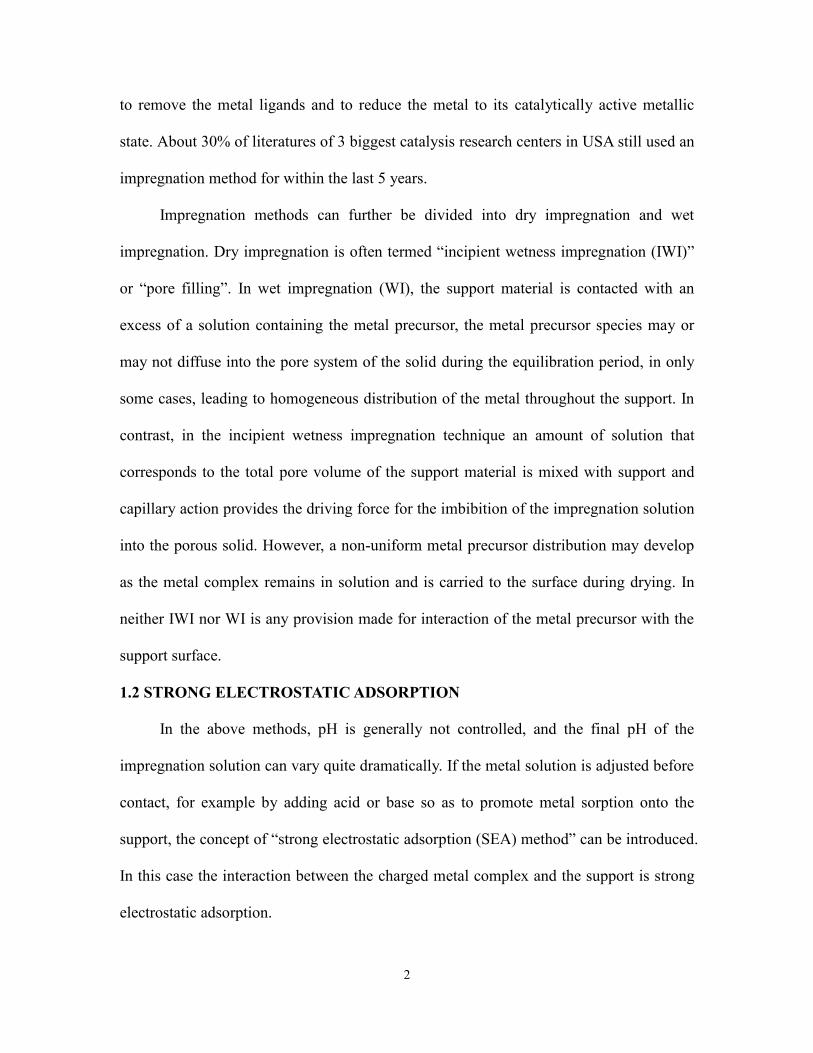
to remove the metal ligands and to reduce the metal to its catalytically active metallic
state. About 30% of literatures of 3 biggest catalysis research centers in USA still used an
impregnation method for within the last 5 years.
Impregnation methods can further be divided into dry impregnation and wet
impregnation. Dry impregnation is often termed “incipient wetness impregnation (IWI)”
or “pore filling”. In wet impregnation (WI), the support material is contacted with an
excess of a solution containing the metal precursor, the metal precursor species may or
may not diffuse into the pore system of the solid during the equilibration period, in only
some cases, leading to homogeneous distribution of the metal throughout the support. In
contrast, in the incipient wetness impregnation technique an amount of solution that
corresponds to the total pore volume of the support material is mixed with support and
capillary action provides the driving force for the imbibition of the impregnation solution
into the porous solid. However, a non-uniform metal precursor distribution may develop
as the metal complex remains in solution and is carried to the surface during drying. In
neither IWI nor WI is any provision made for interaction of the metal precursor with the
support surface.
1.2 STRONG ELECTROSTATIC ADSORPTION
In the above methods, pH is generally not controlled, and the final pH of the
impregnation solution can vary quite dramatically. If the metal solution is adjusted before
contact, for example by adding acid or base so as to promote metal sorption onto the
support, the concept of “strong electrostatic adsorption (SEA) method” can be introduced.
In this case the interaction between the charged metal complex and the support is strong
electrostatic adsorption.
3
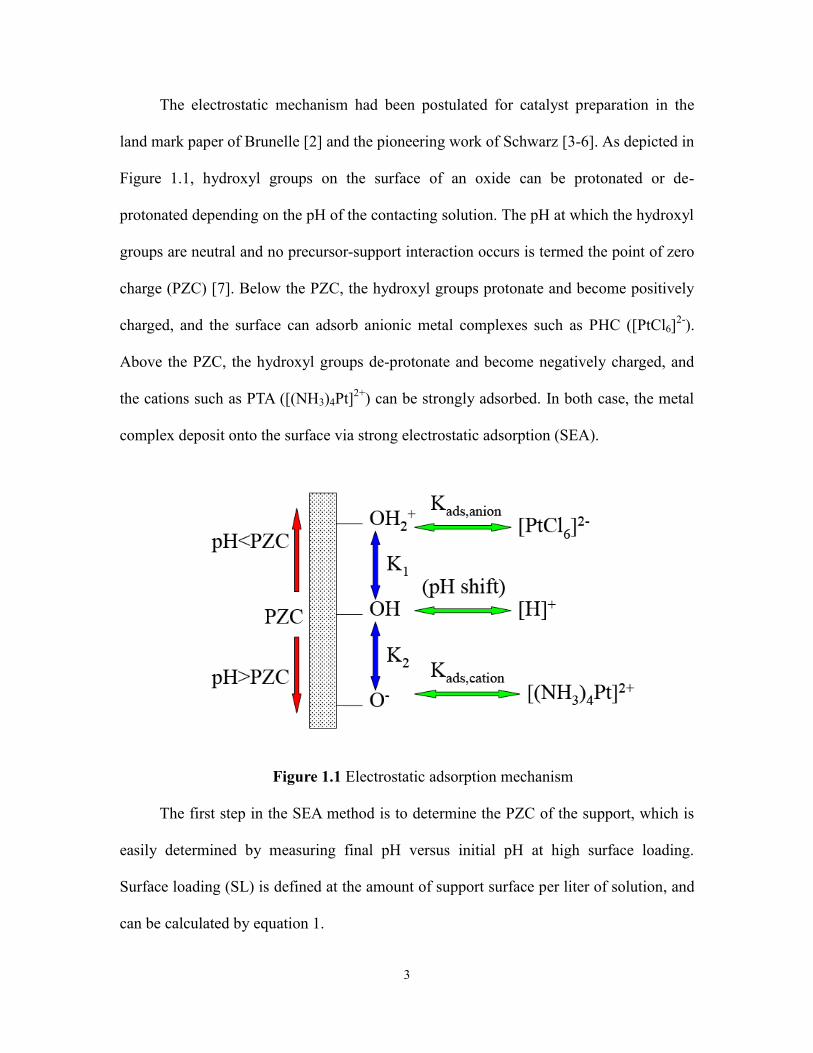
The electrostatic mechanism had been postulated for catalyst preparation in the
land mark paper of Brunelle [2] and the pioneering work of Schwarz [3-6]. As depicted in
Figure 1.1, hydroxyl groups on the surface of an oxide can be protonated or de-
protonated depending on the pH of the contacting solution. The pH at which the hydroxyl
groups are neutral and no precursor-support interaction occurs is termed the point of zero
charge (PZC) [7]. Below the PZC, the hydroxyl groups protonate and become positively
charged, and the surface can adsorb anionic metal complexes such as PHC ([PtCl6]2-
).
Above the PZC, the hydroxyl groups de-protonate and become negatively charged, and
the cations such as PTA ([(NH3)4Pt]2+
) can be strongly adsorbed. In both case, the metal
complex deposit onto the surface via strong electrostatic adsorption (SEA).
Figure 1.1 Electrostatic adsorption mechanism
The first step in the SEA method is to determine the PZC of the support, which is
easily determined by measuring final pH versus initial pH at high surface loading.
Surface loading (SL) is defined at the amount of support surface per liter of solution, and
can be calculated by equation 1.
4
Surface loading (m2/L) =
Surface Area of support (𝑚2
g)∗grams of support(g)
Volume of Precursor Solution (L) (eqn 1)
The second step of SEA is to perform an uptake-pH survey to determine the pH of
strongest interaction. The overriding hypothesis of the SEA approach is that with metals,
the simplest and most effective way to synthesize highly dispersed metal particles is to
achieve a high dispersion of the metal precursors on the support during impregnation.
Once strongly adsorbed, the idea is to perform the pretreatment steps of calcinations or
reduction, often referred to in industry as catalyst finishing, in such a way that the
monolayer morphology of the precursor is maintained as the metal is reduced, such that
high metal dispersion is achieved [8,9].
Our research group has proposed a parameter-free Revised Physical Adsorption
Model (RPA) based on a purely physical adsorption scheme, as opposed to a chemical
mechanism [11]. The pH shift model was put forward by Park and Regalbuto [7], who
were the first to simulate the pH shifts in bulk solution which occur when aqueous
solutions are contacted with various amounts of oxides. This model was proposed as a
simple and novel technique to determine the PZC of oxides. This PZC measurement
method differs from traditional titration experiments in that the initial solutions of
varying pH are contacted with oxides at various surface loadings. The equilibrium pH of
the solution is then measured. Thus the model predicts the pH buffering effects of oxides
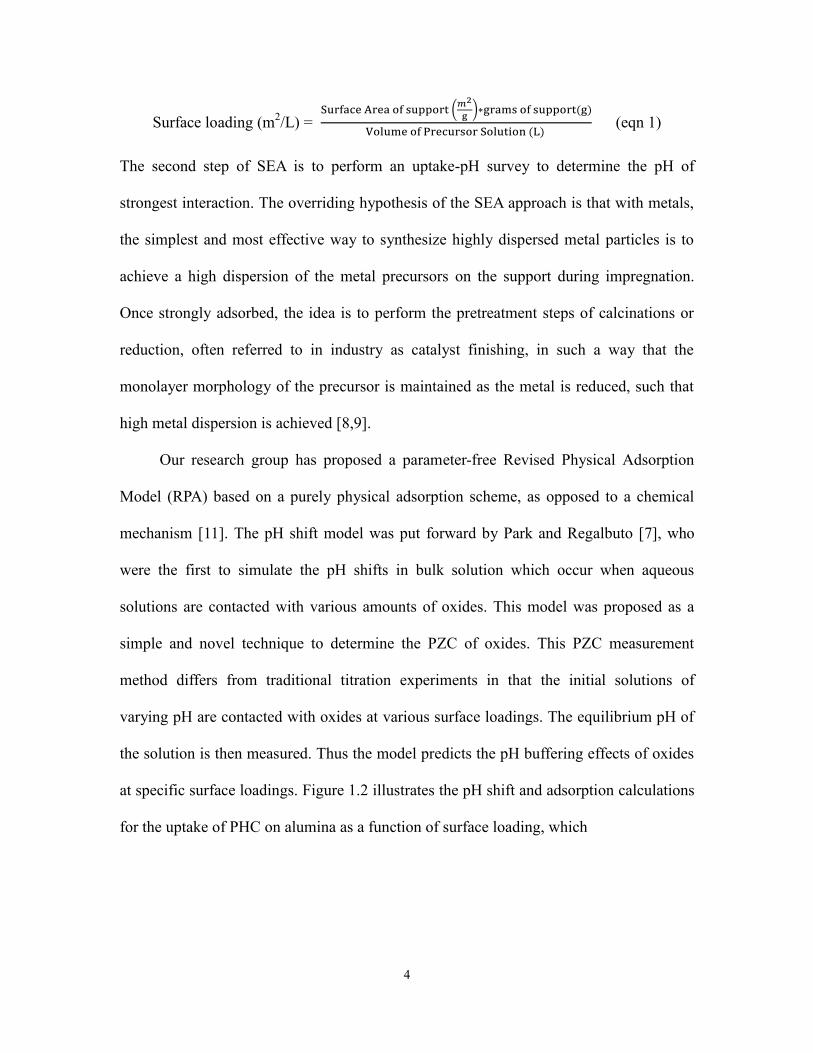
at specific surface loadings. Figure 1.2 illustrates the pH shift and adsorption calculations
for the uptake of PHC on alumina as a function of surface loading, which
5
Figure 1.2 Simulation of SEA at high surface loadings (a) pH shift simulation, (b)
uptake-pH simulation [20]
is the area of support per volume of solution.
From the pH shift plot in figure 1.2a, the plateaus of final pH are seen to widen at
higher surface loading. Uptake curves figure in 1.2b, at all SLs, show a typical
characteristic of SEA, being a volcano shape in metal uptake. An optimal pH exists at
which point has the strongest electrostatic attraction. This occurs far enough from the
PZC so that the surface is strongly charged. The maximum obtainable uptake decreases at
the highest SL due to the higher concentration of Pt, which must be employed to achieve
the same surface density. It also decreases at extremely acidic (and basic) pH when the
ionic concentration of the solution is high which causes the adsorption equilibrium
constant to become very small due to electric double layer screening.
The RPA model shows different adsorption survey curve depended on different
PZC support materials (Figure1.3).
6
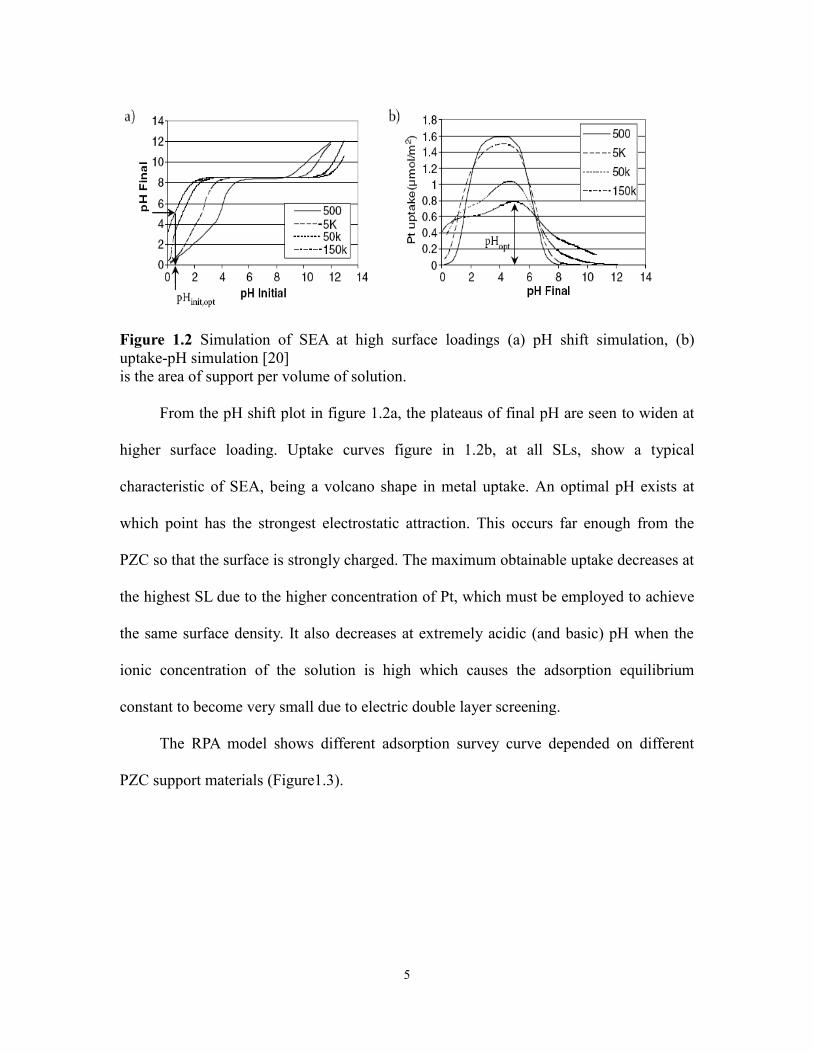
Figure 1.3 RPA simulation of Pt adsorption over supports with different PZC [10]
Supports with very low PZC have a broad PTA adsorption plateau from the PZC to pH12
since it has electrostatic potential just after the PZC [11]. Maximum adsorption density of
PHC is double that of PTA because PHC is assumed to have one hydration sheath, and
PTA two.
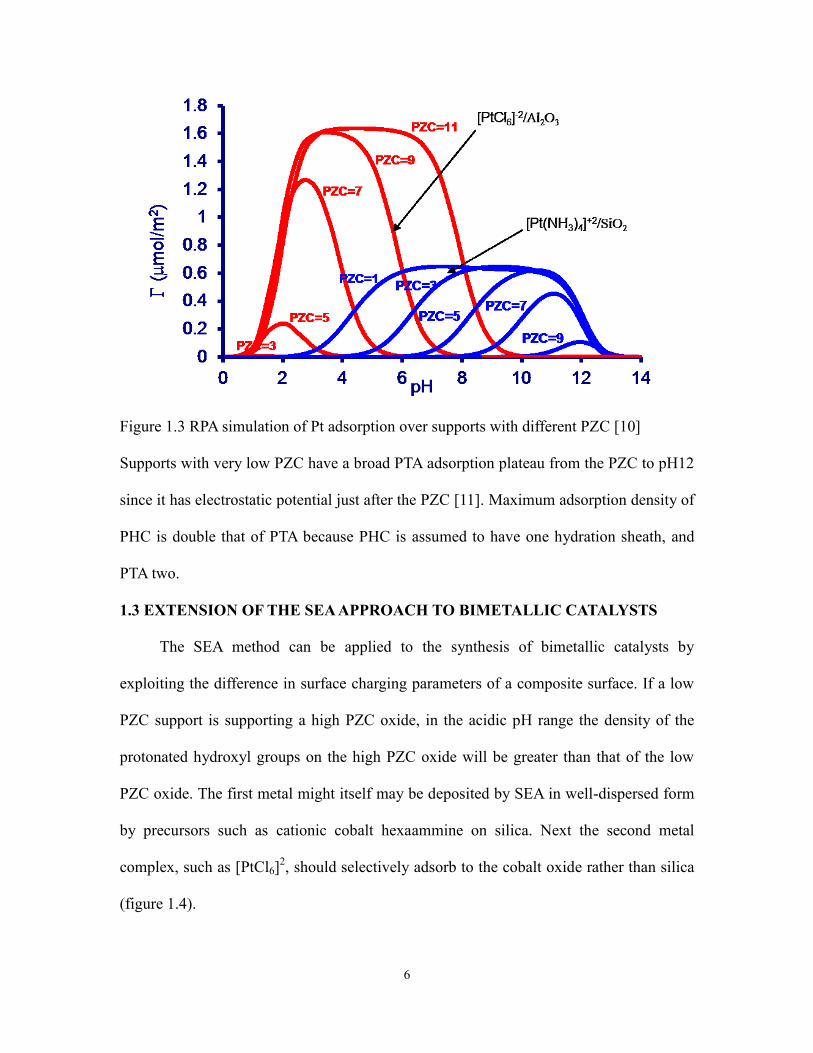
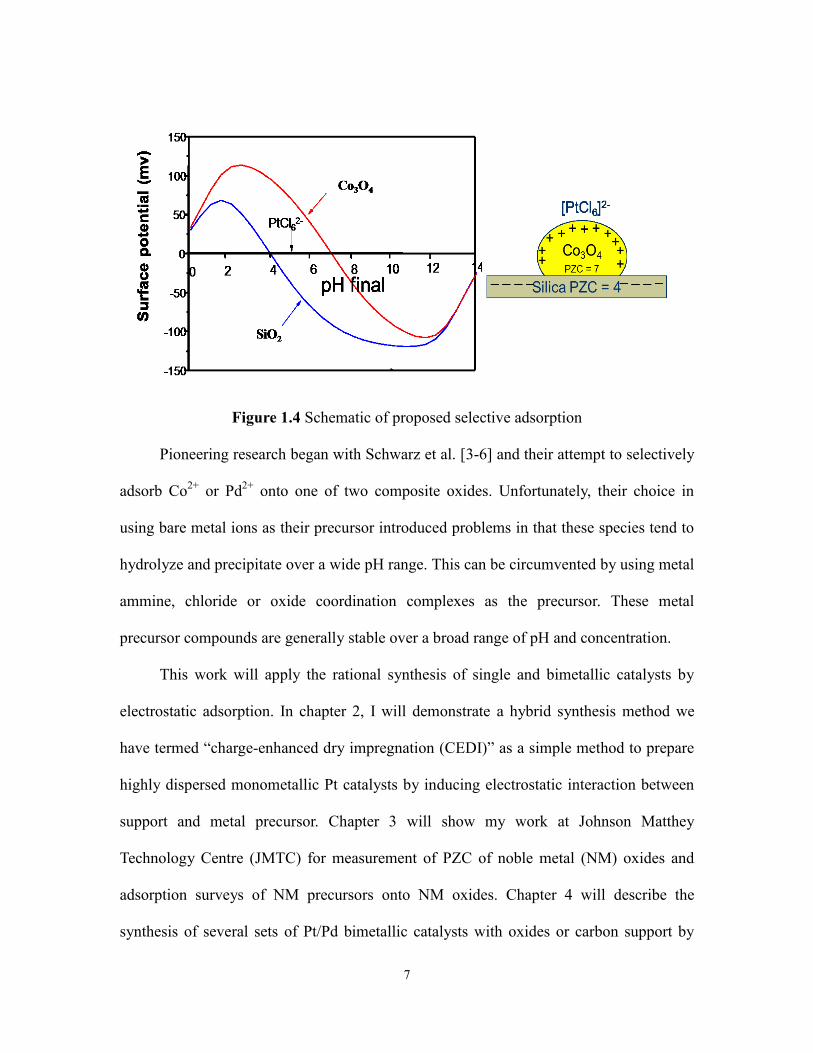
1.3 EXTENSION OF THE SEA APPROACH TO BIMETALLIC CATALYSTS
The SEA method can be applied to the synthesis of bimetallic catalysts by
exploiting the difference in surface charging parameters of a composite surface. If a low
PZC support is supporting a high PZC oxide, in the acidic pH range the density of the
protonated hydroxyl groups on the high PZC oxide will be greater than that of the low
PZC oxide. The first metal might itself may be deposited by SEA in well-dispersed form
by precursors such as cationic cobalt hexaammine on silica. Next the second metal
complex, such as [PtCl6]2, should selectively adsorb to the cobalt oxide rather than silica
(figure 1.4).
7
Figure 1.4 Schematic of proposed selective adsorption
Pioneering research began with Schwarz et al. [3-6] and their attempt to selectively
adsorb Co2+
or Pd2+
onto one of two composite oxides. Unfortunately, their choice in
using bare metal ions as their precursor introduced problems in that these species tend to
hydrolyze and precipitate over a wide pH range. This can be circumvented by using metal
ammine, chloride or oxide coordination complexes as the precursor. These metal
precursor compounds are generally stable over a broad range of pH and concentration.
This work will apply the rational synthesis of single and bimetallic catalysts by
electrostatic adsorption. In chapter 2, I will demonstrate a hybrid synthesis method we
have termed “charge-enhanced dry impregnation (CEDI)” as a simple method to prepare
highly dispersed monometallic Pt catalysts by inducing electrostatic interaction between
support and metal precursor. Chapter 3 will show my work at Johnson Matthey
Technology Centre (JMTC) for measurement of PZC of noble metal (NM) oxides and
adsorption surveys of NM precursors onto NM oxides. Chapter 4 will describe the
synthesis of several sets of Pt/Pd bimetallic catalysts with oxides or carbon support by

8
simultaneous SEA and sequential SEA. The final chapter will utilize seq-SEA to
synthesis Au-Pd/carbon catalyst for benzyl alcohol oxidation.
9
CHAPTER 2
SUPPORTED PLATINUM CATALYSTS PREPARED BY DI AND CEDI
Dry impregnation (also called pore filling or incipient wetness) is the simplest, least
expensive, and most prevalent way to prepare supported metal catalysts. In this method a
desired amount of metal precursor, typically a coordination complex such as platinum
hexachloride (PHC, [PtCl6]-2
) or platinum tetraammine (PTA, [(NH3)4Pt]-2
), is dissolved
in water and the solution added to an oxide or carbon support in the amount just sufficient
to fill the pore volume of the support. The thick slurry/paste is dried and then heated in
oxidizing and/or reducing gases to remove the ligands of the precursor and to reduce the
metal to its active elemental state. This method requires no filtration, eliminates wasted
metal and yields a precise metal loading. The most common catalysis metric of metal
utilization is dispersion: the fraction of metal atoms appearing at the surfaces of metal
crystallites (and available as catalytically active sites), divided by the total number of
atoms. Metal nanoparticles one nanometer in diameter have a dispersion of
approximately 100%; high dispersion is very often the goal of synthesis.
In dry impregnations no provision is made for the metal precursor complexes to
interact with the support surface, and without such interaction, metal complexes
agglomerate into large particles either before or during reduction. Unlike supported metal
oxides, which can be easily dispersed on oxide supports by thermal spreading from
mixtures of bulk oxide powders [12], obtaining high dispersion of supported
10
metals requires high dispersion of metal precursors.
Precursor - support interactions in many common catalyst preparations can be
envisioned in light of the electrostatic adsorption mechanism [2-6] depicted in figure 1.1.
Oxide and carbon surfaces terminate in functional groups such as hydroxyls and
carboxylic acids which can protonate or deprotonate as a function of solution pH. At
these conditions the surface can electrostatically adsorb precursors of opposite charge;
anions adsorb over a protonated surface below the PZC, cations over a deprotonated
surface above the PZC.
While it is easy to understand electrostatic adsorption as a function of pH in figure
1.1, appreciating the extent of proton transfer in dry impregnation is much less intuitive.
Consider, for example, impregnating a typical alumina with a surface area 200 m2/g, pore
volume 1.0 ml/g and a hydroxyl density of 8 OH/nm2, with a pH 3 solution. This is five
pH units below alumina’s PZC of about 8.5; it may be assumed that the low pH solution
will protonate the surface and enable adsorption of anions per figure 1.1. The number of
protons in 1.0 ml (1.0 x 10⁻³
L) of pH 3 (10-3
molar) solution is 1.0 x 10⁻⁶
moles. The
number of hydroxyl groups on the surface of one gram of alumina support is
1 g x 200 m2/g x 1018 nm
2/m
2 x 8 OH/nm
2 x 1 mole/(6.02 x 10
23 OH)
= 2660 x 10-6
moles.
With only 1/2660 hydroxyl groups protonated, the surface will be negligibly
charged. Enough acid in 1.0 ml of solution to protonate all the surface OH groups would
require a concentration of 2.67 mol H/L, or an initial pH of -0.41.
The strong buffering capacity of oxide surfaces at incipient wetness has been
pointed out in the past [13]; at this condition the final pH of impregnating solution is
11
almost always at the PZC of the surface and no electrostatic metal precursor - support
interaction occurs unless the impregnation solution is made extremely acidic or basic.
2.1 EXPERIMENTS
2.1.1 Catalysts Preparation
Oxidized carbon (Darco G-60, BET area: 617 m2/g) and SiO2 (BET area: 330 m
2/g)
were used as low PZC supports with which platinum tetraammine (PTA, [Pt(NH3)4]Cl2,
99.9%) was used as the precursor. Sodium tetrachloroplatinate(ll) (PTC, Na2PtCl4 nH2O,
99.9%) from Aldrich were used as the platinum precursor on the high PZC support, a
gamma-alumina (BET area: 274 m2/g) support.
The water accessible pore volume was measured with one gram of oxide and
deionized water (pH of 5.6). pH measurements at incipient wetness were made with a
spear tip combination pH probe.
DI samples were prepared by adding metal precursor solution for 2 wt% Pt loading.
The pastes were dried at room temperature in air and then reduced in hydrogen for 1 hr at
200°C. The same process was used to prepare CEDI samples, with the exception that
optimal initial pH values were used (as described later).
2.1.2 Catalysts Characterization
BET surface area measurements were obtained using an automated adsorption
system (ASAP, 2100, Micromeritics). After degassing at 150ºC, the samples were
transported from degassing port to analysis port and doping with N2 in liquid nitrogen
pool. Surface area were calculated by the linear relation between P/Po and 1/ [v(P/Po-1)]
with 8 points from 0~0.35 of P/Po values.
Powder X-ray diffraction analysis was performed using a Siemens D5000
12
diffractometer with Cu Kα radiation (λ = 1.5406 Å) operated at 30kV and 40mA,
operating in Bragg–Brentano geometry. Scans were made in the 10o-90
o 2θ range, with
step size of 0.02o, and 2s exposure at each step. Z-contrast STEM imaging for particle
size determination in the materials was conducted with a JEOL JEM-2010F FasTEM
with a probe size of 0.14-0.2 nm. The catalyst samples were sonicated in isopropanol for
15 min and the slurry was deposited onto a carbon-coated copper grid (200 mesh, Cu
PK/100), supplied by SPI, USA. The applied voltage was 200 kV and extracting voltage
of 4500 V. Approximately 500 particles were counted for size distribution. Carbon
monoxide chemisorption was used to determine the accessible Pt surface using a
Micromeritics ASAP 2020 instrument. The samples were first dried at 110 °C in a He
flow for 30min and subsequently reduced in a 50% H2/He flow at 350 °C for 2 h (ramp =
10°C/min).
Carbon monoxide chemisorptions was used to determine the accessible Pt surface
(Micromeritics ASAP 2020). The samples were first dried at 110 °C in a He flow for
30min and subsequently reduced in a 50% H2/He flow at 350 °C for 2 h (ramp =
10°C/min).
2.2 RESULT
The amount of acid or base needed to sufficiently charge a surface at incipient
wetness, and the effect of the high concentrations of acid and base on metal precursor
uptake, can be estimated with the revised physical adsorption (RPA) model [7].
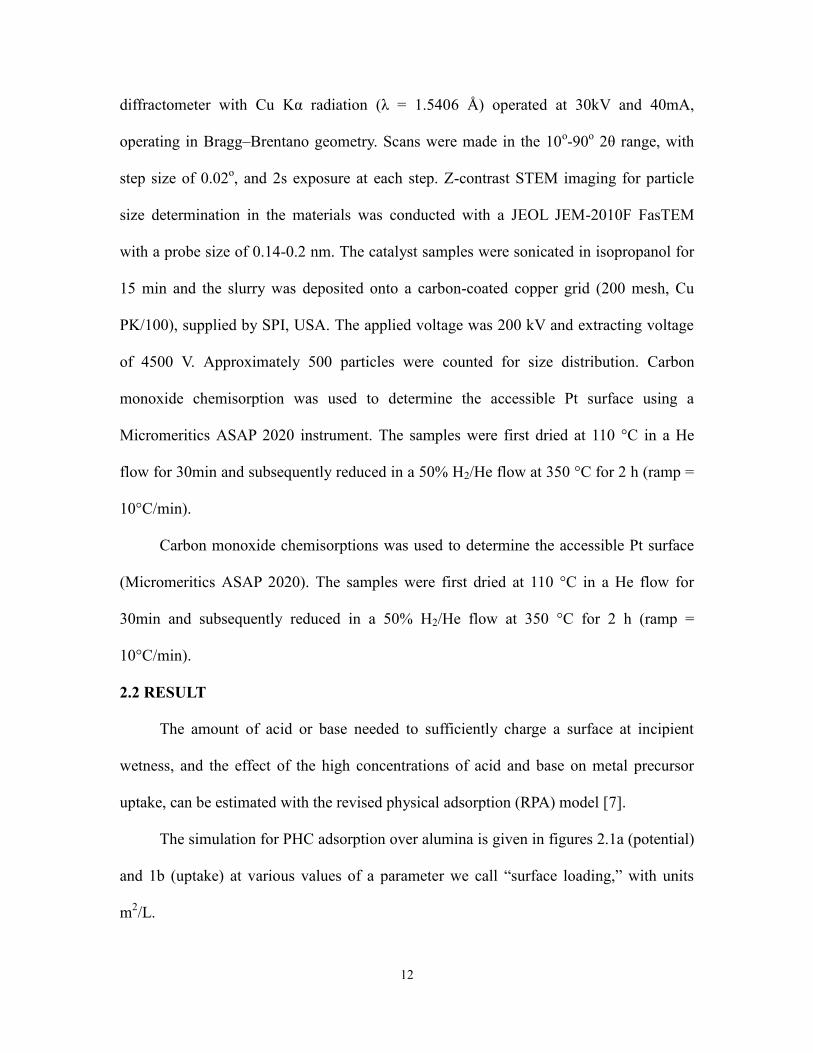
The simulation for PHC adsorption over alumina is given in figures 2.1a (potential)
and 1b (uptake) at various values of a parameter we call “surface loading,” with units
m2/L.
13
a) b)
c) d)
Figure 2.1 Simulation of SEA at high surface loadings; (a) alumina surface potential (b)
PHC uptake (PHC adsorption, PZC 8.5, dpk=5 and Ns= 8 OH/nm2) (c) silica surface
potential (d) uptake (PTA adsorption, PZC= 4.8, dpk=8 and Ns= 8 OH/nm2) [14]
For any value of surface loading, surface potential and metal uptake are zero at the
PZC of 8.5. As the pH decreases, uptake initially increases as the surface potential rises,
but at the pH extreme, high ionic strength drastically diminishes the adsorption
equilibrium constant by electric screening [3-5]. Thus metal uptake is a volcano-shaped
curve and there exists an optimal pH at which adsorption is strongest. An analogous set of
potential and uptake curves are seen for PTA uptake over silica in figures 2.1c and 1d.
Now we consider the effect of surface loading. Thin slurries and correspondingly
low surface loadings are convenient for laboratory studies, as low loadings minimize the
pH shifts from buffering and make it easy to sample the liquid phase for pH and metal
concentration. Most of our studies of “strong electrostatic adsorption” (SEA) [15-19]
have employed surface loadings of 500 - 1000 m2/L.
14
There is no reason why electrostatic SEA cannot be employed at higher surface
loadings with incipient wetness representing the highest obtainable surface loading for a
particular solid. In figure 2.1 it is seen that for both alumina and silica, surface potential
and metal uptake decrease as surface loading is increased. This decrease is again the
result of high ionic strength caused by the balancing electrolytes from the higher
concentrations of metal and acid or base. Nonetheless, the simulations predict a final pH
at which electrostatic adsorption is strongest at high surface loading.
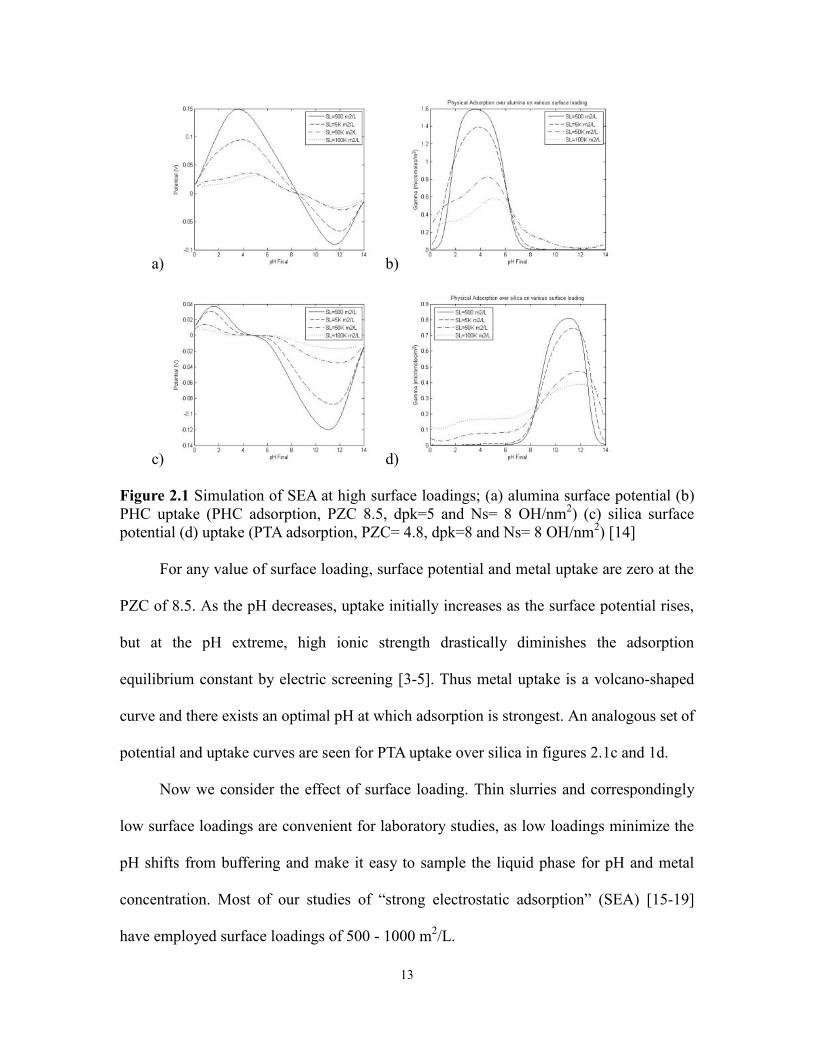
The new method is illustrated in figure 2.2. SEA has traditionally featured the thin
slurry/low surface loading depicted in figure 2.2, with pH controlled to the optimal value.
(The more general case of “wet impregnation” would be that employing excess solution,
but without controlling pH; solution pH still tends greatly to the PZC [13].)
Figure 2.2 Illustration of a)SEA, b) DI, and c) CEDI impregnations.
Dry impregnation has no excess solution and the pH is almost always at the PZC
(figure 2.2b). However, with enough acid or base, final pH can be taken to the optimal
value. We call this “charge-enhanced dry impregnation” (CEDI) (figure 2.2c).
Dry Impregnation Pore Filling
CEDI Pore Filling
SEA Excess Liquid
pH PZC
pH pHopt
pH pHopt
Excess Liquid
15
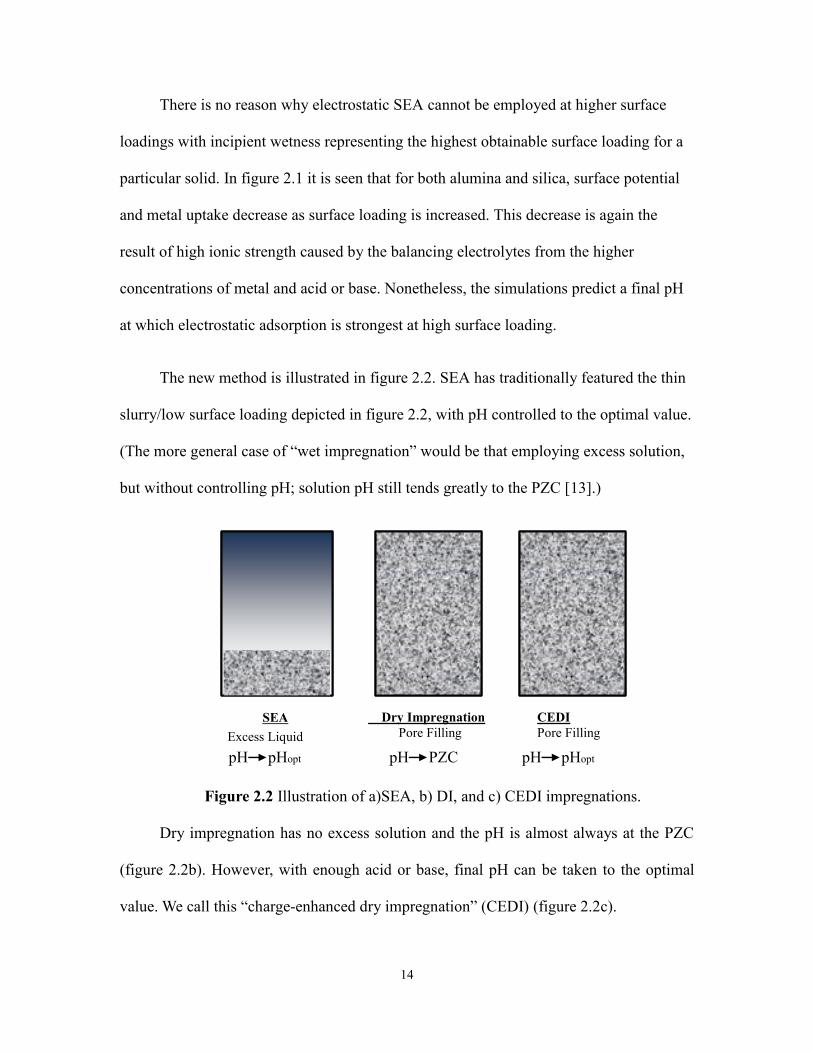
We have demonstrated CEDI for improving metal dispersion with three catalyst
supports and two metal complexes. Table 2.1 gives the properties of these materials. For
the oxidized carbon and silica surfaces that have low PZC, cationic PTA was chosen as
the metal precursor, and for alumina, which has a high PZC, the anionic PTC complex
was used.
Table 2.1 Properties of Supports
Supports
BET Surface
area (m2/g)
Pore Volume
(ml/g)
PZC
Optimal pH
(Final pH)
Carbon 617 1.46 1.5 11
SiO2 330 0.55 3.9 11
Al2O3 274 1.85 8.3 3
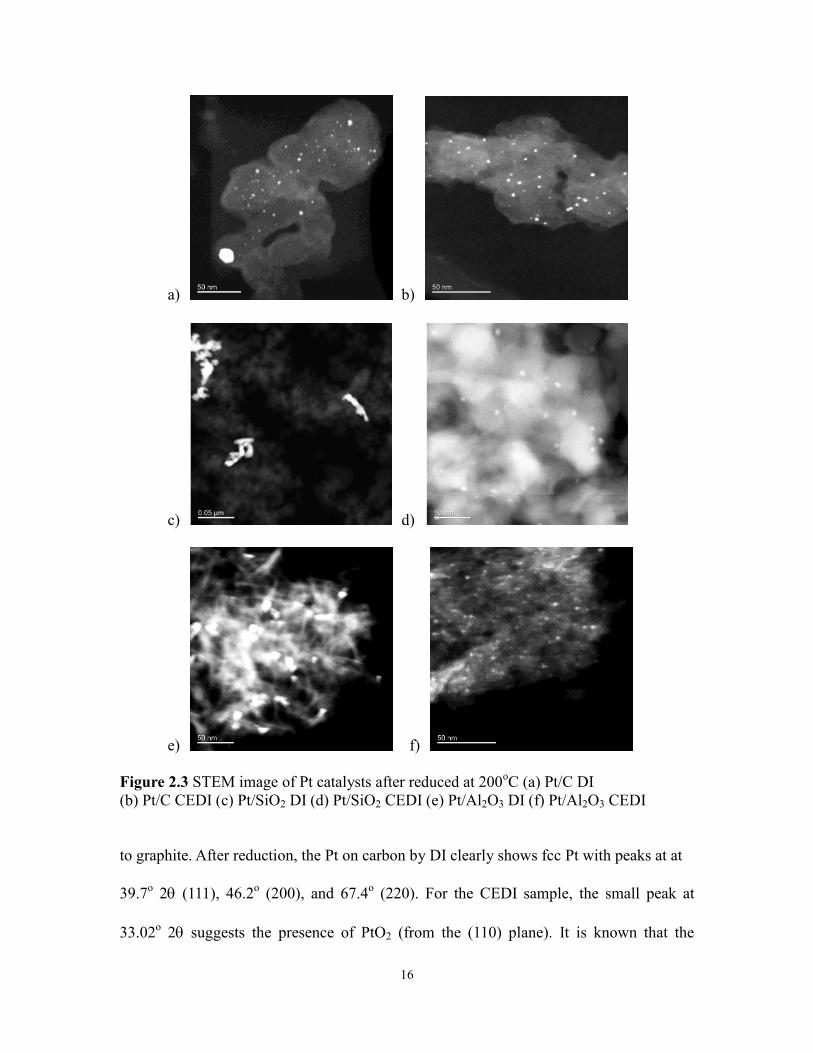
STEM analysis was performed on the supported 2wt% Pt catalysts after
impregnation, drying, and reduction at 200oC for 1 hour at a ramp rate of 5
oC/min. Figure
2.3 shows the respective Z contrast STEM images for synthesis by DI and CEDI and
particle sizes with standard deviations are given in table 2.2. The average size of
nanoparticles prepared by CEDI are 1.5 nm for carbon, 1.8 for silica, and 2.9 for alumina,
and are much smaller particles than those prepared by DI, 10.3, 10, and 10 nm,
respectively.
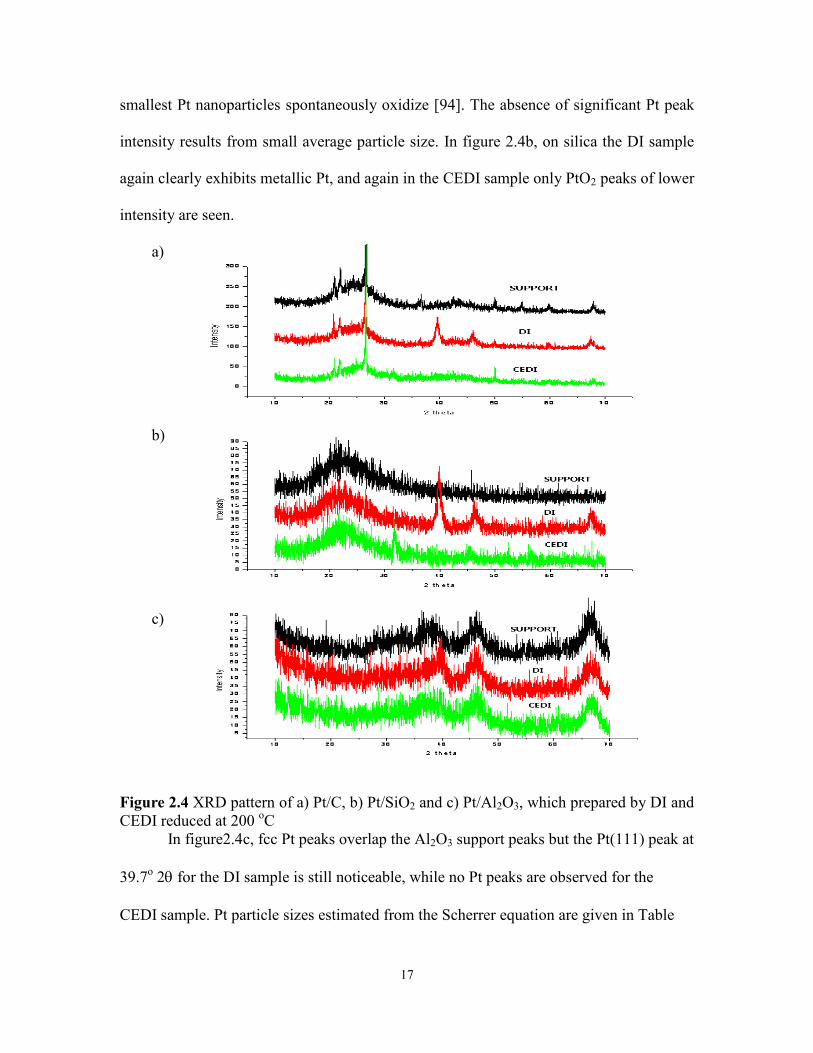
Particle size was also characterized by powder XRD; these results are shown in
figures2.4a, b, and c for carbon, silica and alumina, respectively. The upper diffractogram
of each set is the pure support. Peaks at 21, 22.5 and 27o 2 in figure 2.4a can be assigned
16
a) b)
c) d)
e) f)
Figure 2.3 STEM image of Pt catalysts after reduced at 200oC (a) Pt/C DI
(b) Pt/C CEDI (c) Pt/SiO2 DI (d) Pt/SiO2 CEDI (e) Pt/Al2O3 DI (f) Pt/Al2O3 CEDI
to graphite. After reduction, the Pt on carbon by DI clearly shows fcc Pt with peaks at at
39.7o 2 (111), 46.2
o (200), and 67.4
o (220). For the CEDI sample, the small peak at
33.02o 2 suggests the presence of PtO2 (from the (110) plane). It is known that the
17
smallest Pt nanoparticles spontaneously oxidize [94]. The absence of significant Pt peak
intensity results from small average particle size. In figure 2.4b, on silica the DI sample
again clearly exhibits metallic Pt, and again in the CEDI sample only PtO2 peaks of lower
intensity are seen.
a)
b)
c)
Figure 2.4 XRD pattern of a) Pt/C, b) Pt/SiO2 and c) Pt/Al2O3, which prepared by DI and
CEDI reduced at 200 oC
In figure2.4c, fcc Pt peaks overlap the Al2O3 support peaks but the Pt(111) peak at
39.7o 2 for the DI sample is still noticeable, while no Pt peaks are observed for the
CEDI sample. Pt particle sizes estimated from the Scherrer equation are given in Table
18
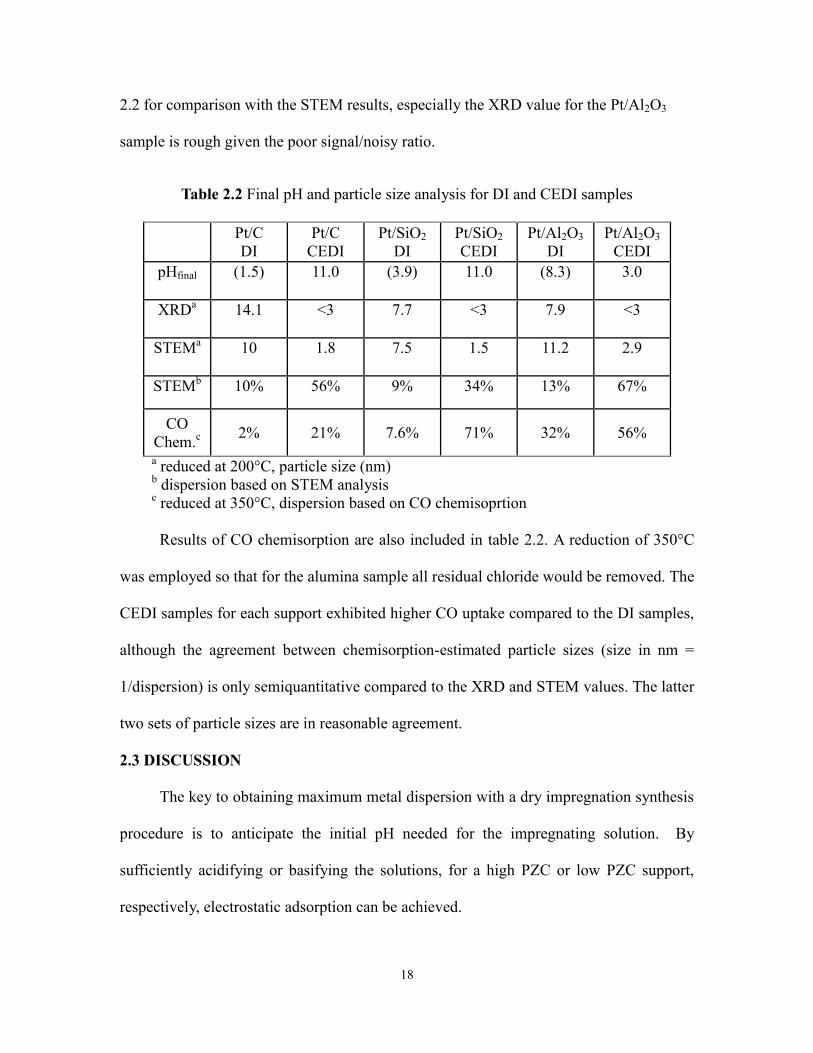
2.2 for comparison with the STEM results, especially the XRD value for the Pt/Al2O3
sample is rough given the poor signal/noisy ratio.
Table 2.2 Final pH and particle size analysis for DI and CEDI samples
Pt/C
DI
Pt/C
CEDI
Pt/SiO2
DI
Pt/SiO2
CEDI
Pt/Al2O3
DI
Pt/Al2O3
CEDI
pHfinal (1.5) 11.0 (3.9) 11.0 (8.3) 3.0
XRDa 14.1 <3 7.7 <3 7.9 <3
STEMa 10 1.8 7.5 1.5 11.2 2.9
STEMb 10% 56% 9% 34% 13% 67%
CO
Chem.c
2% 21% 7.6% 71% 32% 56%
a reduced at 200°C, particle size (nm)
b dispersion based on STEM analysis
c reduced at 350°C, dispersion based on CO chemisoprtion
Results of CO chemisorption are also included in table 2.2. A reduction of 350°C
was employed so that for the alumina sample all residual chloride would be removed. The
CEDI samples for each support exhibited higher CO uptake compared to the DI samples,
although the agreement between chemisorption-estimated particle sizes (size in nm =
1/dispersion) is only semiquantitative compared to the XRD and STEM values. The latter
two sets of particle sizes are in reasonable agreement.
2.3 DISCUSSION
The key to obtaining maximum metal dispersion with a dry impregnation synthesis
procedure is to anticipate the initial pH needed for the impregnating solution. By
sufficiently acidifying or basifying the solutions, for a high PZC or low PZC support,
respectively, electrostatic adsorption can be achieved.
19
A potential concern when working with highly acidic or basic solutions is the
dissolution of the support at pH extremes. It should be noted, however, that pH
equilibration is relatively rapid, typically on the order of minutes, and the support surface
will quickly buffer the pH up or down to levels at which the certain charge is high
enough for the strong electrostatic adsorptions, but moderate enough so that no
dissolution occurs. In practice, the dropwise or sprayed application of the solution with
reasonable mixing of the support should prevent significant support dissolution.
Electrostatic adsorption has been shown to occur over a wide variety of oxides and
carbon support materials [21,22]. In many cases, it is the sole adsorption mechanism or it
can occur in the conjunction with other mechanism such as ion exchange and deposition
[23]. CEDI can be generalized to all materials by employing the RPA model to anticipate
the correct initial pH necessary for a particular support material. What needs to be known
are the support PZC, which is easily found with pH shift measurements [24,25], the BET
surface area, and the water-accessible pore volume which can be done with a quick water
titration. The latter two properties determine the surface loading at dry impregnation,
where
SL (m2/L) = [BET surface area (m
2/g)]/[pore volume (L/g)]
Once the PZC and surface loading of the impregnation system are known, the RPA
model, which predicts both pH shifts and metal uptake, can be consulted for the proper
selection of initial pH. In figure 2.5 are presented pH shifts and metal uptakes for a range
of PZC materials from 2 to 12 (figures 2.5a-f). Over the low PZC materials (2, 4, and 6 in
figure 2.5a, b, and c), representative of niobia, silica, and anatasetitania, a cationic
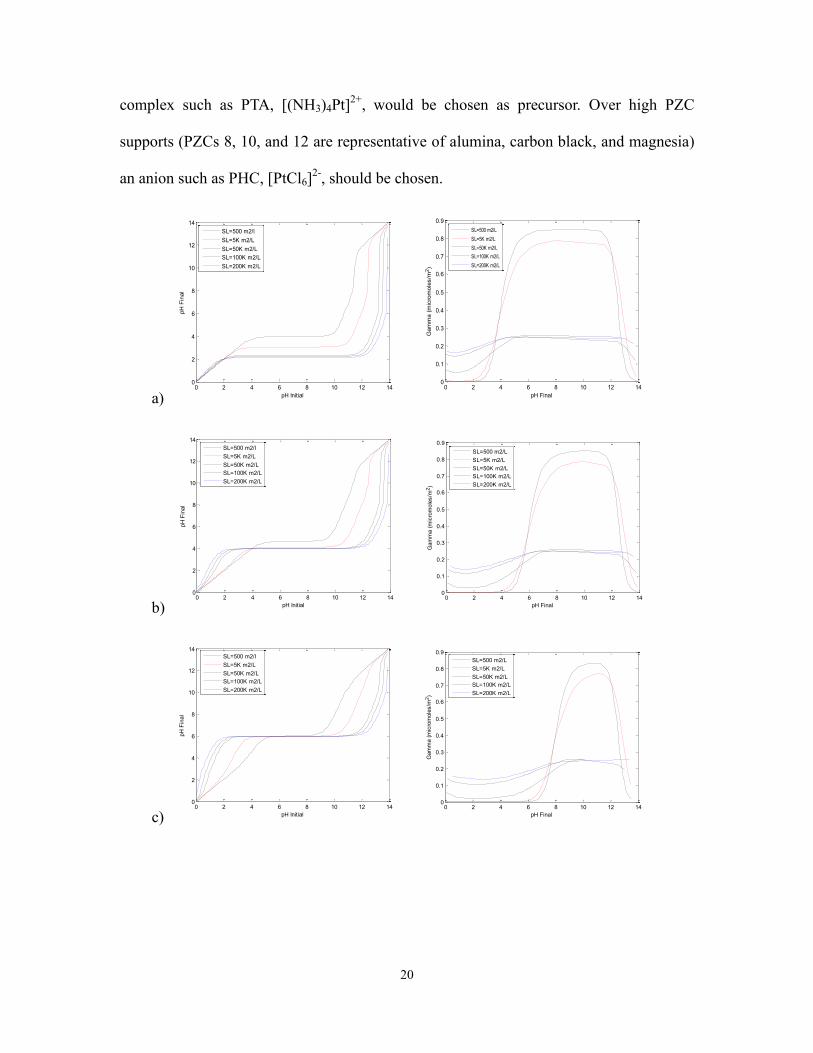
20
complex such as PTA, [(NH3)4Pt]2+
, would be chosen as precursor. Over high PZC
supports (PZCs 8, 10, and 12 are representative of alumina, carbon black, and magnesia)
an anion such as PHC, [PtCl6]2-
, should be chosen.
a)
b)
c)
0 2 4 6 8 10 12 140
2
4
6
8
10
12
14
pH Initial
pH
Fin
al
SL=500 m2/l
SL=5K m2/L
SL=50K m2/L
SL=100K m2/L
SL=200K m2/L
0 2 4 6 8 10 12 140
0.1
0.2
0.3
0.4
0.5
0.6
0.7
0.8
0.9
pH Final
Gam
ma (
mic
rom
ole
s/m
2)
SL=500 m2/L
SL=5K m2/L
SL=50K m2/L
SL=100K m2/L
SL=200K m2/L
0 2 4 6 8 10 12 140
2
4
6
8
10
12
14
pH Initial
pH
Fin
al
SL=500 m2/l
SL=5K m2/L
SL=50K m2/L
SL=100K m2/L
SL=200K m2/L
0 2 4 6 8 10 12 140
0.1
0.2
0.3
0.4
0.5
0.6
0.7
0.8
0.9
pH Final
Gam
ma (
mic
rom
ole
s/m
2)
SL=500 m2/L
SL=5K m2/L
SL=50K m2/L
SL=100K m2/L
SL=200K m2/L
0 2 4 6 8 10 12 140
2
4
6
8
10
12
14
pH Initial
pH
Fin
al
SL=500 m2/l
SL=5K m2/L
SL=50K m2/L
SL=100K m2/L
SL=200K m2/L
0 2 4 6 8 10 12 140
0.1
0.2
0.3
0.4
0.5
0.6
0.7
0.8
0.9
pH Final
Gam
ma (
mic
rom
ole
s/m
2)
SL=500 m2/L
SL=5K m2/L
SL=50K m2/L
SL=100K m2/L
SL=200K m2/L
21
d)
e)
f)
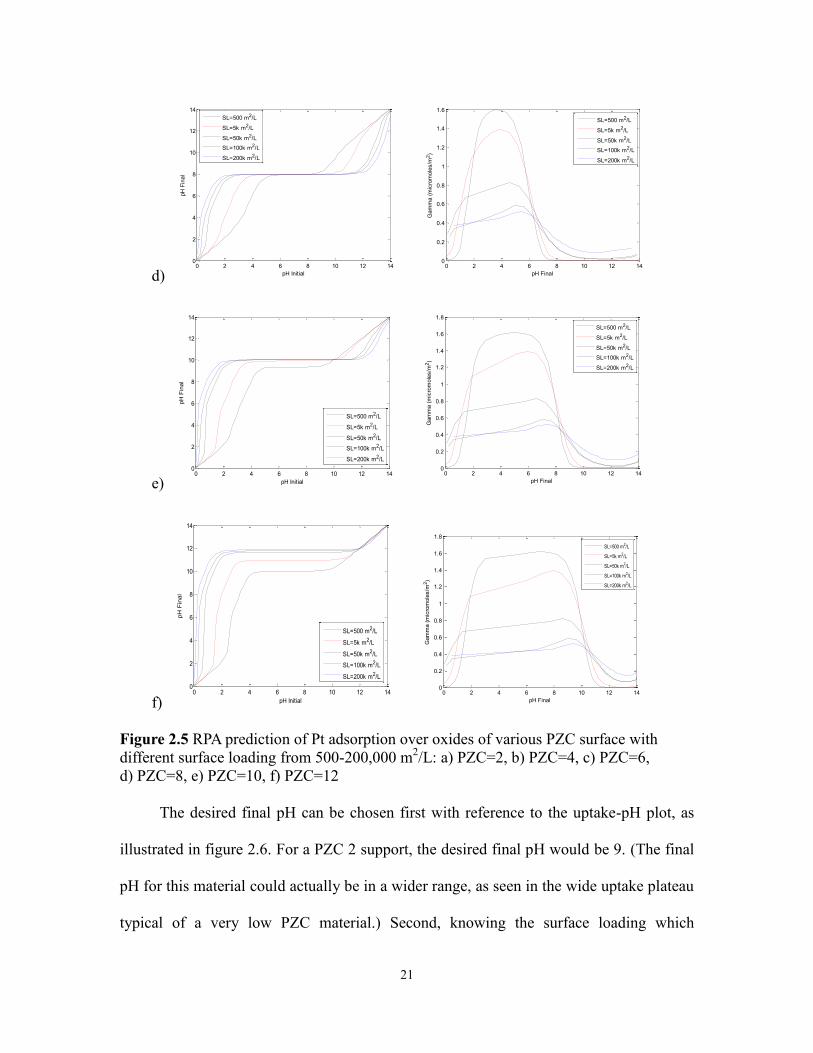
Figure 2.5 RPA prediction of Pt adsorption over oxides of various PZC surface with
different surface loading from 500-200,000 m2/L: a) PZC=2, b) PZC=4, c) PZC=6,
d) PZC=8, e) PZC=10, f) PZC=12
The desired final pH can be chosen first with reference to the uptake-pH plot, as
illustrated in figure 2.6. For a PZC 2 support, the desired final pH would be 9. (The final
pH for this material could actually be in a wider range, as seen in the wide uptake plateau
typical of a very low PZC material.) Second, knowing the surface loading which
0 2 4 6 8 10 12 140
2
4
6
8
10
12
14
pH Initial
pH
Fin
al
SL=500 m2/L
SL=5k m2/L
SL=50k m2/L
SL=100k m2/L
SL=200k m2/L
0 2 4 6 8 10 12 140
0.2
0.4
0.6
0.8
1
1.2
1.4
1.6
pH Final
Gam
ma (
mic
rom
ole
s/m
2)
SL=500 m2/L
SL=5k m2/L
SL=50k m2/L
SL=100k m2/L
SL=200k m2/L
0 2 4 6 8 10 12 140
2
4
6
8
10
12
14
pH Initial
pH
Fin
al
SL=500 m2/L
SL=5k m2/L
SL=50k m2/L
SL=100k m2/L
SL=200k m2/L
0 2 4 6 8 10 12 140
0.2
0.4
0.6
0.8
1
1.2
1.4
1.6
1.8
pH Final
Gam
ma (
mic
rom
ole
s/m
2)
SL=500 m2/L
SL=5k m2/L
SL=50k m2/L
SL=100k m2/L
SL=200k m2/L
0 2 4 6 8 10 12 140
2
4
6
8
10
12
14
pH Initial
pH
Fin
al
SL=500 m2/L
SL=5k m2/L
SL=50k m2/L
SL=100k m2/L
SL=200k m2/L
0 2 4 6 8 10 12 140
0.2
0.4
0.6
0.8
1
1.2
1.4
1.6
1.8
pH Final
Gam
ma (
mic
rom
ole
s/m
2)
SL=500 m2/L
SL=5k m2/L
SL=50k m2/L
SL=100k m2/L
SL=200k m2/L
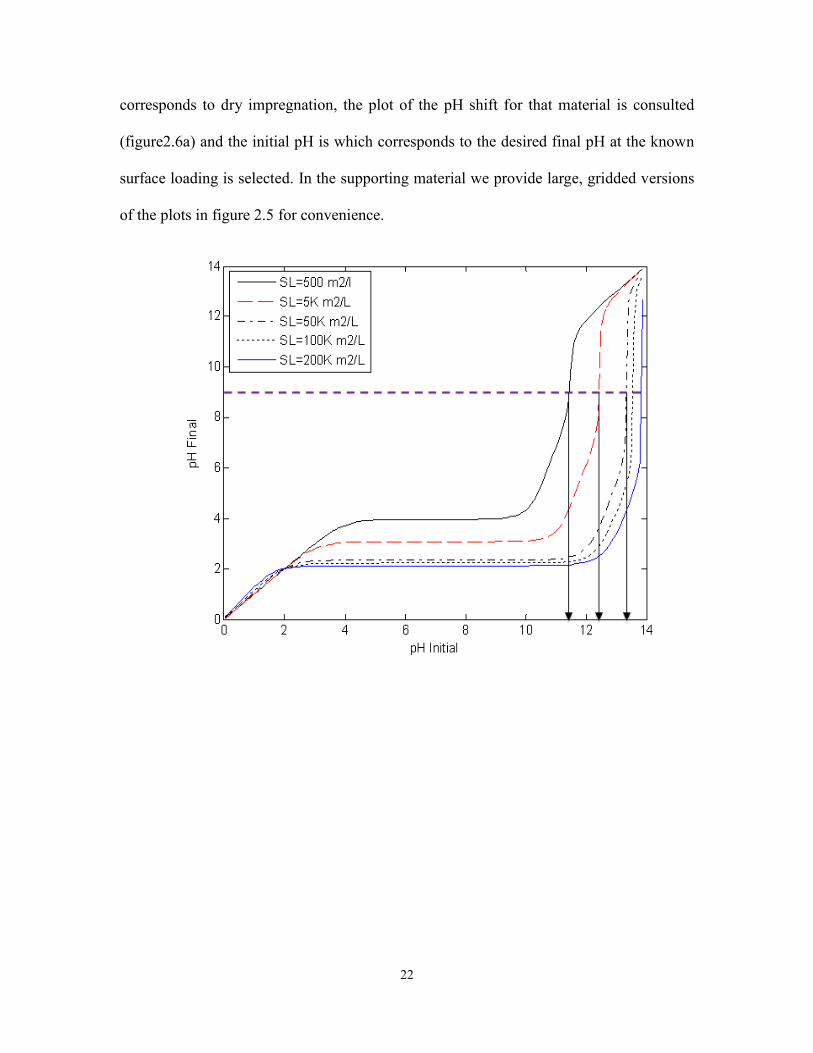
22
corresponds to dry impregnation, the plot of the pH shift for that material is consulted
(figure2.6a) and the initial pH is which corresponds to the desired final pH at the known
surface loading is selected. In the supporting material we provide large, gridded versions
of the plots in figure 2.5 for convenience.
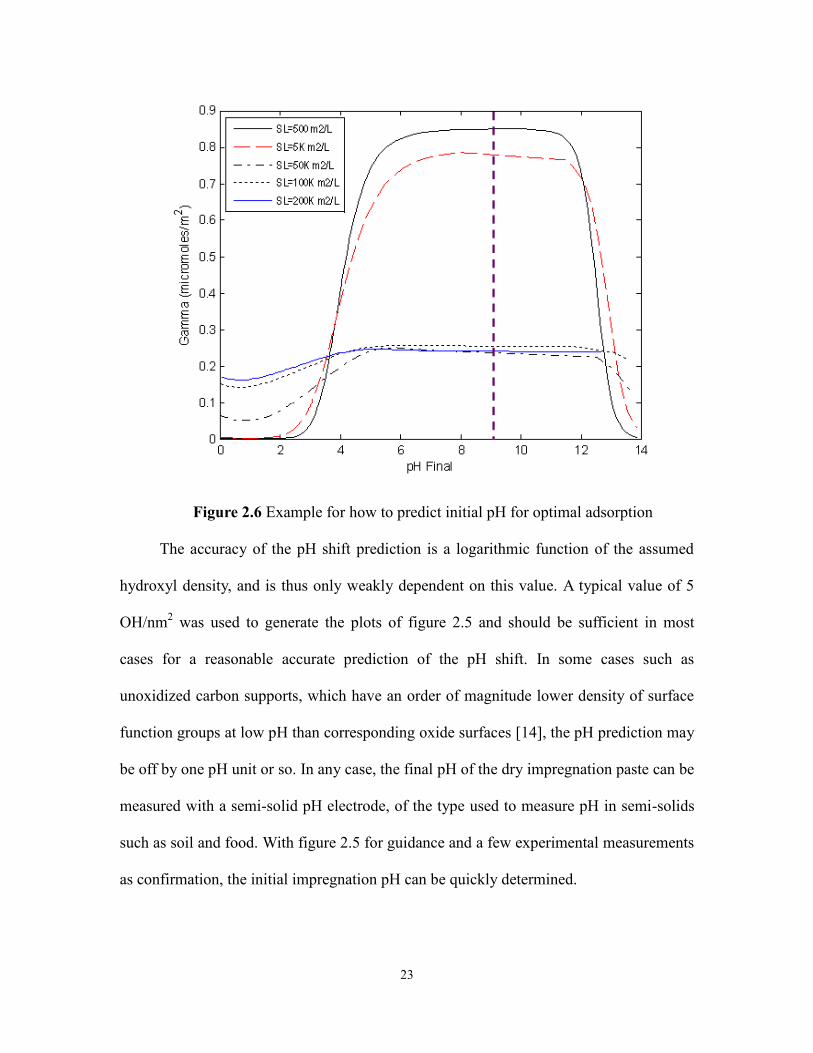
23
Figure 2.6 Example for how to predict initial pH for optimal adsorption
The accuracy of the pH shift prediction is a logarithmic function of the assumed
hydroxyl density, and is thus only weakly dependent on this value. A typical value of 5
OH/nm2 was used to generate the plots of figure 2.5 and should be sufficient in most
cases for a reasonable accurate prediction of the pH shift. In some cases such as
unoxidized carbon supports, which have an order of magnitude lower density of surface
function groups at low pH than corresponding oxide surfaces [14], the pH prediction may
be off by one pH unit or so. In any case, the final pH of the dry impregnation paste can be
measured with a semi-solid pH electrode, of the type used to measure pH in semi-solids
such as soil and food. With figure 2.5 for guidance and a few experimental measurements
as confirmation, the initial impregnation pH can be quickly determined.

24
In this way, charged enhanced dry impregnation can be simply applied to many
metals and carbon and oxide supports to optimize metal dispersion in laboratory scale as
well as industrial preparations.
25
CHAPTER 3
NOBLE METAL OXIDES PZCS AND ADSORPTION OF
NOBLE METAL PRECURSORS
Strong electrostatic adsorption (SEA) has been established for the synthesis of single
metal catalysts with a multitude of common supports [16,26]. Job et al. demonstrated that
the method of SEA allows for fine control of both the structure and morphology of
supported metal nanoparticles (average particle size, size distribution, degree of
agglomeration) and it may then be used to minimize the amount of metallic Pt used in
PEM fuel cells [26]. Jiao et al. demonstrated that SEA appears to be a rational procedure
for the cost effective, repeatable and scalable preparation of highly dispersed mono-
metallic supported catalysts for all metal ammine complexes adsorbed on multiple
varieties of silica [16].
More recently, SEA has been applied to selective adsorption over promoted oxides
[17,27]. Feltes et al. investigated the fundamental surface charging properties of an oxide
in solution to achieve the selective adsorption of a Mn promoter onto the supported
Co3O4 and not onto the TiO2 support material for Fisher-Tropsch synthesis [17]. Zhao et
al. also confirmed Mn is selectively adsorbed on Co and not on SiO2 support with the
impregnation of Mn onto Co/SiO2 by selective SEA of the Mn [27].
Noble metal bimetallic catalysts have been chosen as the materials to be
investigated for this proposal. Noble metals were chosen to maximize impact among the
catalysis community and for ease of experimentation through the use of SEA, especially
26
the use of a core-shell structure of noble metals (referred by NMs) which has been shown
to significantly increase reactivity for reactions such as oxygen reduction reaction and
oxidation of carbon monoxide [28-31]. Pd core@Pt shell catalysts synthesized by the
method of electroless deposition have demonstrated better activity for the oxygen
reduction reaction when compared to a 20wt% commercial Pt catalyst [28]. Ru@Pt and
Rh@Pt nanoparticles (NPs) show increased performance for CO oxidation than
traditional PtRu and PtRh alloy catalyst [29,30] Au metal core covered by PdO thin shells
by deposition-precipitation (DP) demonstrated a synergetic effect in the selective
arabinose oxidation by molecular oxidation [31].
Although SEA also has the potential for the preparation of noble bimetallic
catalysts, the point of zero charge (PZC) of NM oxides To determine an appropriate
precursor to selectively adsorb noble metals, the PZC value of the noble metal oxides
involved are required. For an accurate measurement, large quantities of noble metal
oxides are needed to measure PZCs at high surface loading. The problem in experimental
determination is the cost of materials such as Pt which costs in excess of $50,000
(USD)/kg.
Johnson Matthey provided access to the large amounts of NM oxide powders
needed to perform there measurements at the JMTC in the UK. We measured the PZCs of
many NM oxides and in addition conducted uptake surveys of NM cationic complexes
over the NM oxides which neutral to acidic PZCs.
3.1 EXPERIMENTS
3.1.1 Materials
All chemicals and characterization equipment were graciously provided by JMTC,
27
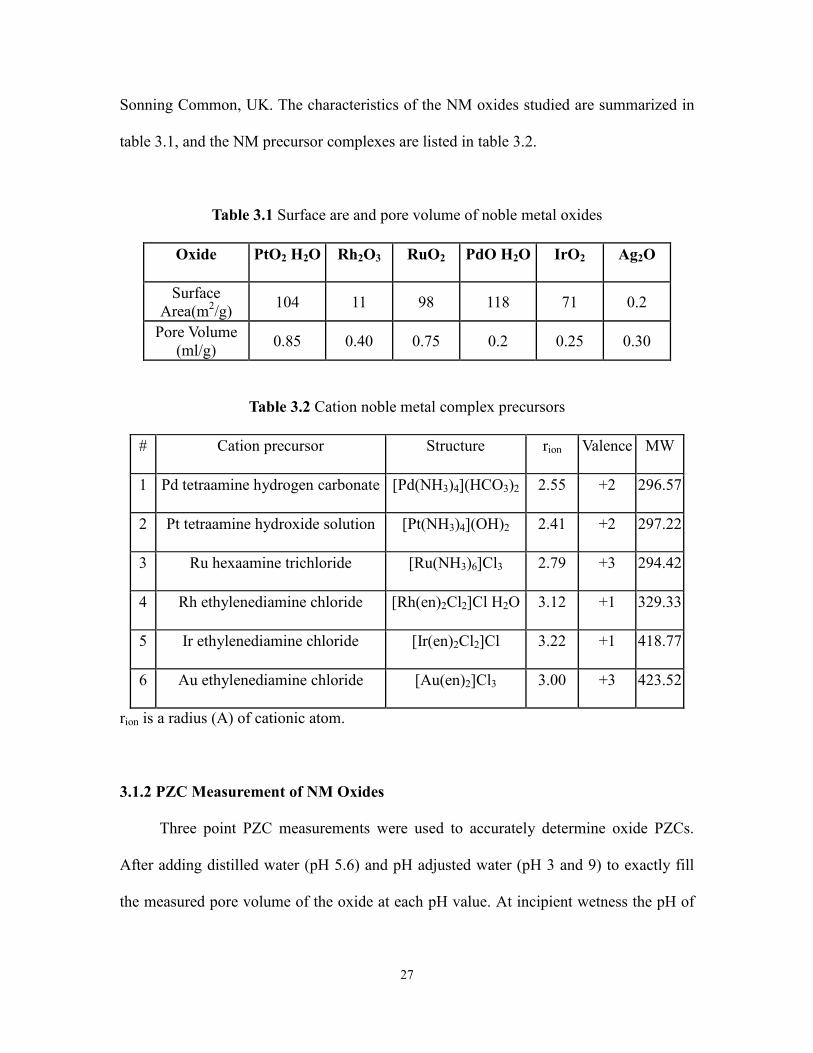
Sonning Common, UK. The characteristics of the NM oxides studied are summarized in
table 3.1, and the NM precursor complexes are listed in table 3.2.
Table 3.1 Surface are and pore volume of noble metal oxides
Oxide PtO2 H2O Rh2O3 RuO2 PdO H2O IrO2 Ag2O
Surface
Area(m2/g)
104 11 98 118 71 0.2
Pore Volume
(ml/g) 0.85 0.40 0.75 0.2 0.25 0.30
Table 3.2 Cation noble metal complex precursors
# Cation precursor Structure rion Valence MW
1 Pd tetraamine hydrogen carbonate [Pd(NH3)4](HCO3)2 2.55 +2 296.57
2 Pt tetraamine hydroxide solution [Pt(NH3)4](OH)2 2.41 +2 297.22
3 Ru hexaamine trichloride [Ru(NH3)6]Cl3 2.79 +3 294.42
4 Rh ethylenediamine chloride [Rh(en)2Cl2]Cl H2O 3.12 +1 329.33
5 Ir ethylenediamine chloride [Ir(en)2Cl2]Cl 3.22 +1 418.77
6 Au ethylenediamine chloride [Au(en)2]Cl3 3.00 +3 423.52
rion is a radius (A) of cationic atom.
3.1.2 PZC Measurement of NM Oxides
Three point PZC measurements were used to accurately determine oxide PZCs.
After adding distilled water (pH 5.6) and pH adjusted water (pH 3 and 9) to exactly fill
the measured pore volume of the oxide at each pH value. At incipient wetness the pH of
28
thick NM oxide slurry was measured through the use of a spear tip combination pH probe.
The pH meter was calibrated at pH values of 4, 7 and 10 before measurements.
3.1.3 Uptake Survey of NM Oxides with NM Cation Precursors
20ml of each precursor solution was prepared in HDPE bottles and pH of the
solutions was adjusted over the range 2 to 13. NM oxides (except Ag2O) were then added
to the pH adjusted solutions to achieve a surface loading of 1000m2/L. The slurries were
filtered after 1 hour contact time and then the NM concentration was determined pre and
post oxide contact by the ICP-OES (Thermo iCAP 6500).
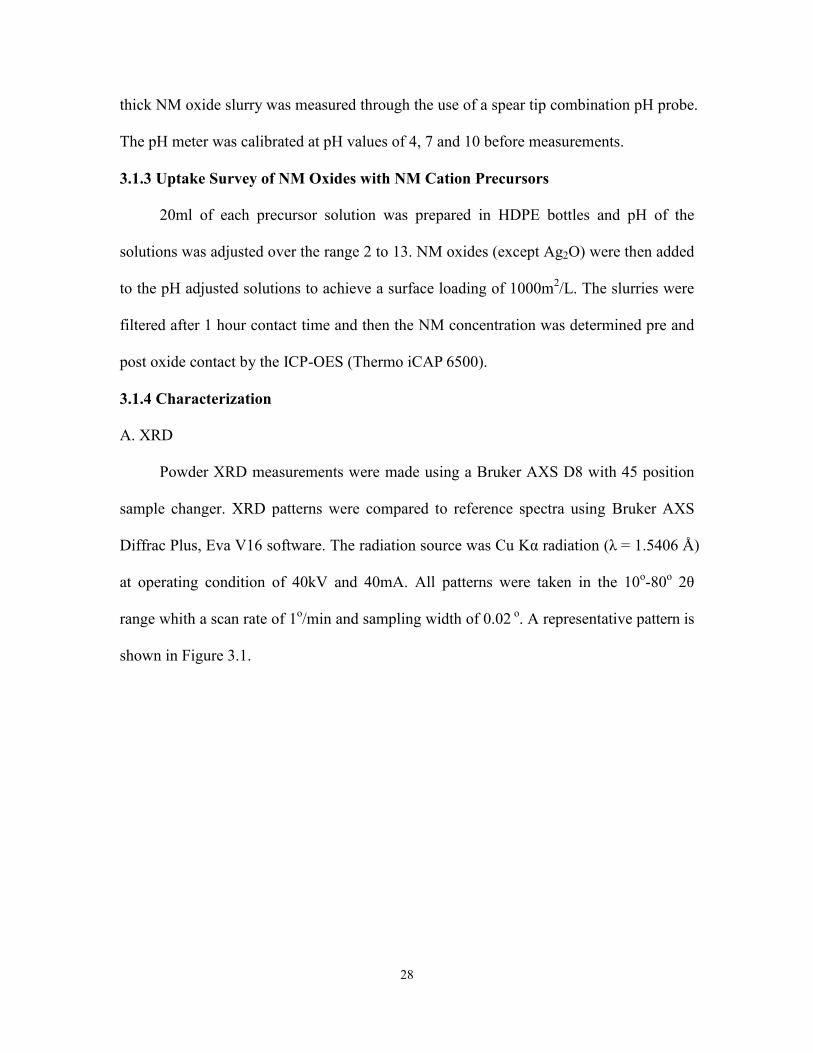
3.1.4 Characterization
A. XRD
Powder XRD measurements were made using a Bruker AXS D8 with 45 position
sample changer. XRD patterns were compared to reference spectra using Bruker AXS
Diffrac Plus, Eva V16 software. The radiation source was Cu Kα radiation (λ = 1.5406 Å)
at operating condition of 40kV and 40mA. All patterns were taken in the 10o-80
o 2θ
range whith a scan rate of 1o/min and sampling width of 0.02
o. A representative pattern is
shown in Figure 3.1.
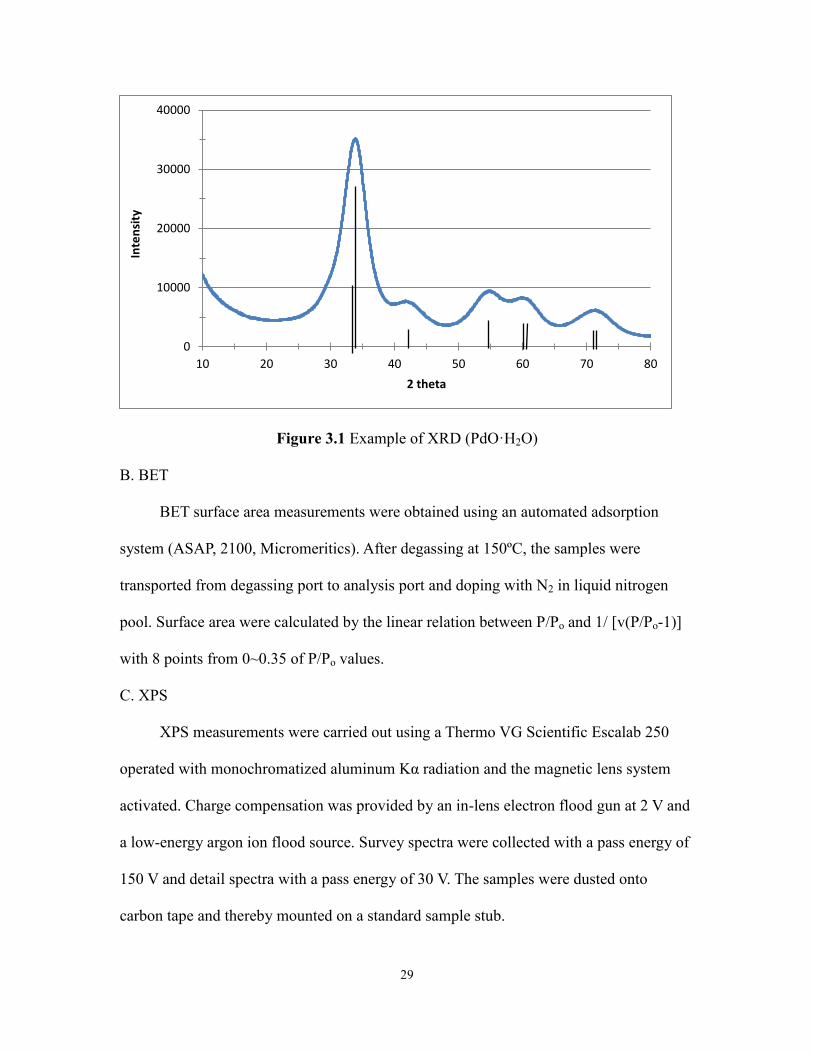
29
Figure 3.1 Example of XRD (PdO·H2O)
B. BET
BET surface area measurements were obtained using an automated adsorption
system (ASAP, 2100, Micromeritics). After degassing at 150ºC, the samples were
transported from degassing port to analysis port and doping with N2 in liquid nitrogen
pool. Surface area were calculated by the linear relation between P/Po and 1/ [v(P/Po-1)]
with 8 points from 0~0.35 of P/Po values.
C. XPS
XPS measurements were carried out using a Thermo VG Scientific Escalab 250
operated with monochromatized aluminum Kα radiation and the magnetic lens system
activated. Charge compensation was provided by an in-lens electron flood gun at 2 V and
a low-energy argon ion flood source. Survey spectra were collected with a pass energy of
150 V and detail spectra with a pass energy of 30 V. The samples were dusted onto
carbon tape and thereby mounted on a standard sample stub.
0
10000
20000
30000
40000
10 20 30 40 50 60 70 80
Inte
nsi
ty
2 theta
30
3.2 RESULT
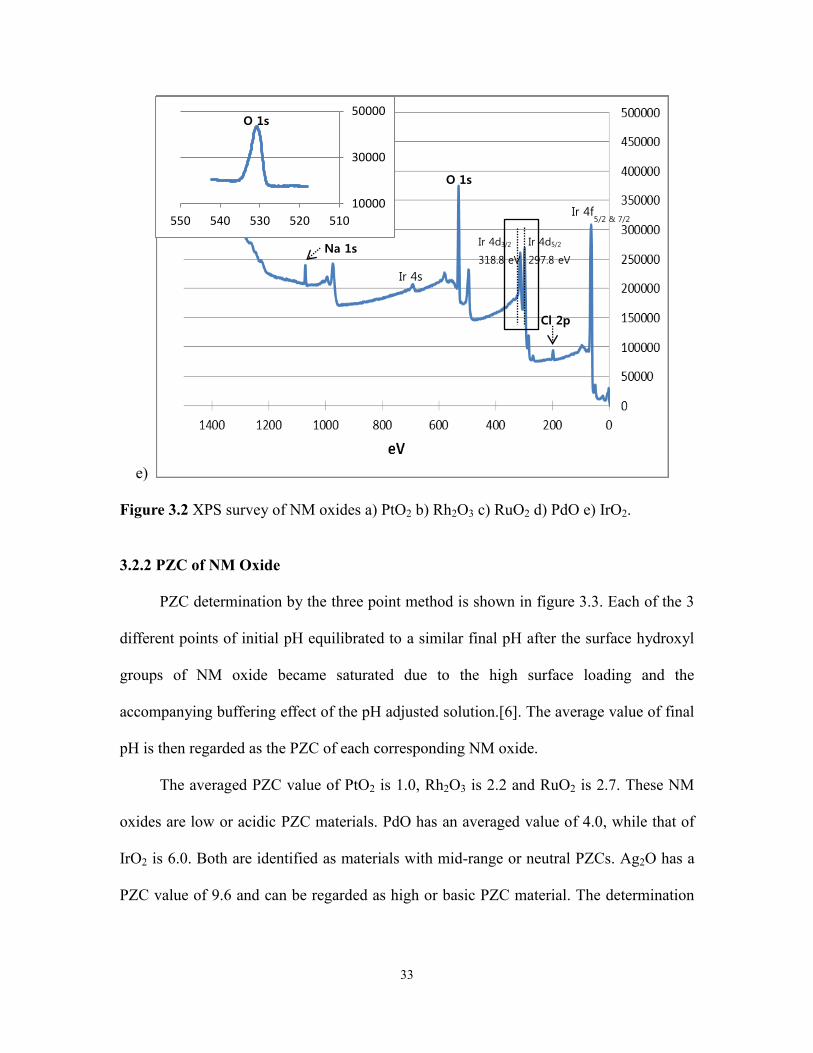
3.2.1 XPS
XPS analysis of the NM oxides was performed to confirm the oxidation state of the
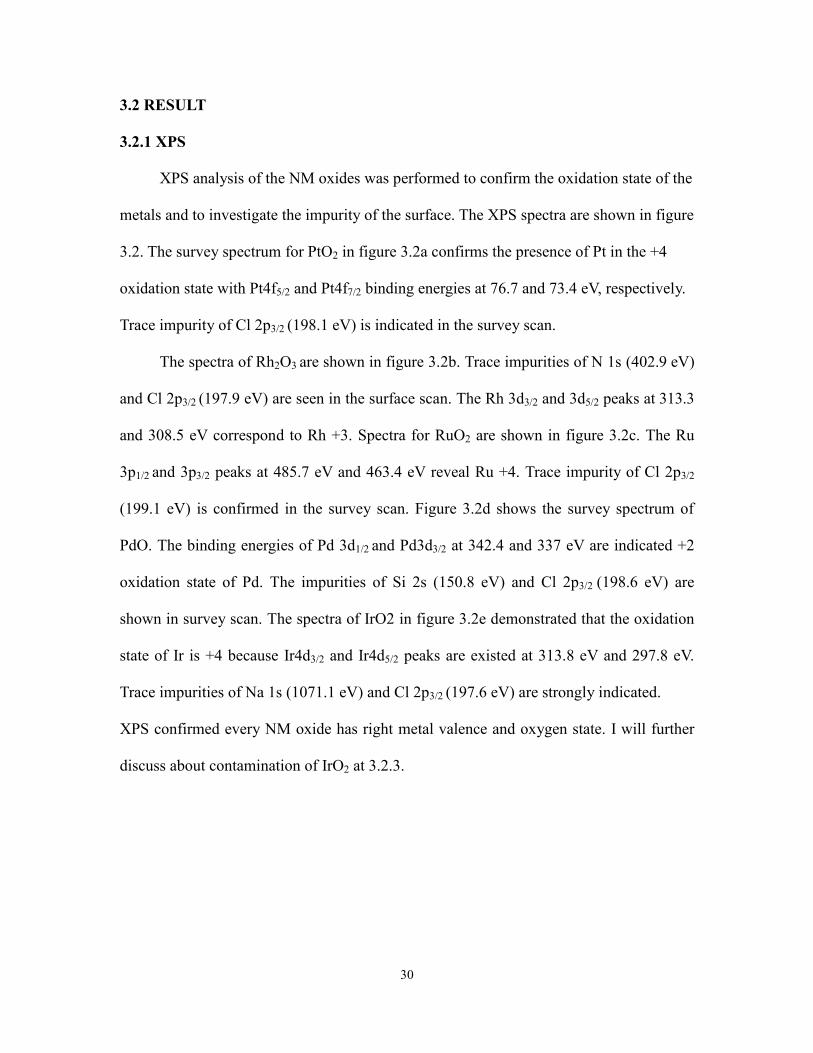
metals and to investigate the impurity of the surface. The XPS spectra are shown in figure
3.2. The survey spectrum for PtO2 in figure 3.2a confirms the presence of Pt in the +4
oxidation state with Pt4f5/2 and Pt4f7/2 binding energies at 76.7 and 73.4 eV, respectively.
Trace impurity of Cl 2p3/2 (198.1 eV) is indicated in the survey scan.
The spectra of Rh2O3 are shown in figure 3.2b. Trace impurities of N 1s (402.9 eV)
and Cl 2p3/2 (197.9 eV) are seen in the surface scan. The Rh 3d3/2 and 3d5/2 peaks at 313.3
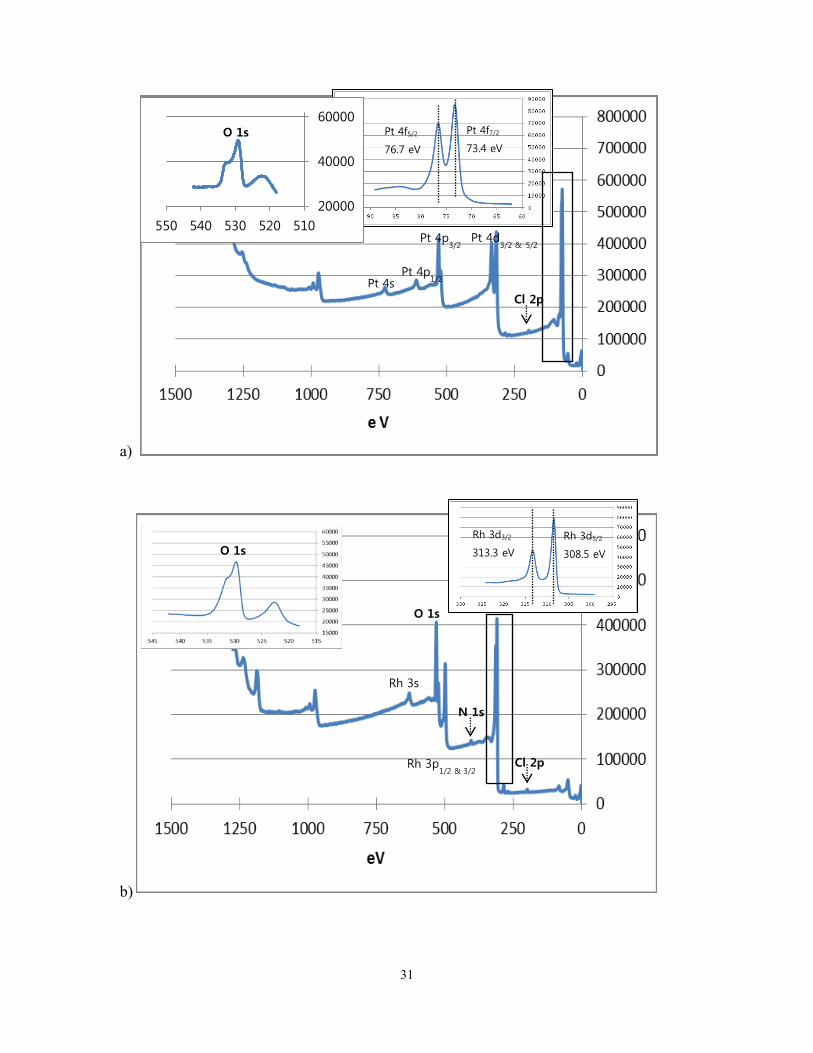
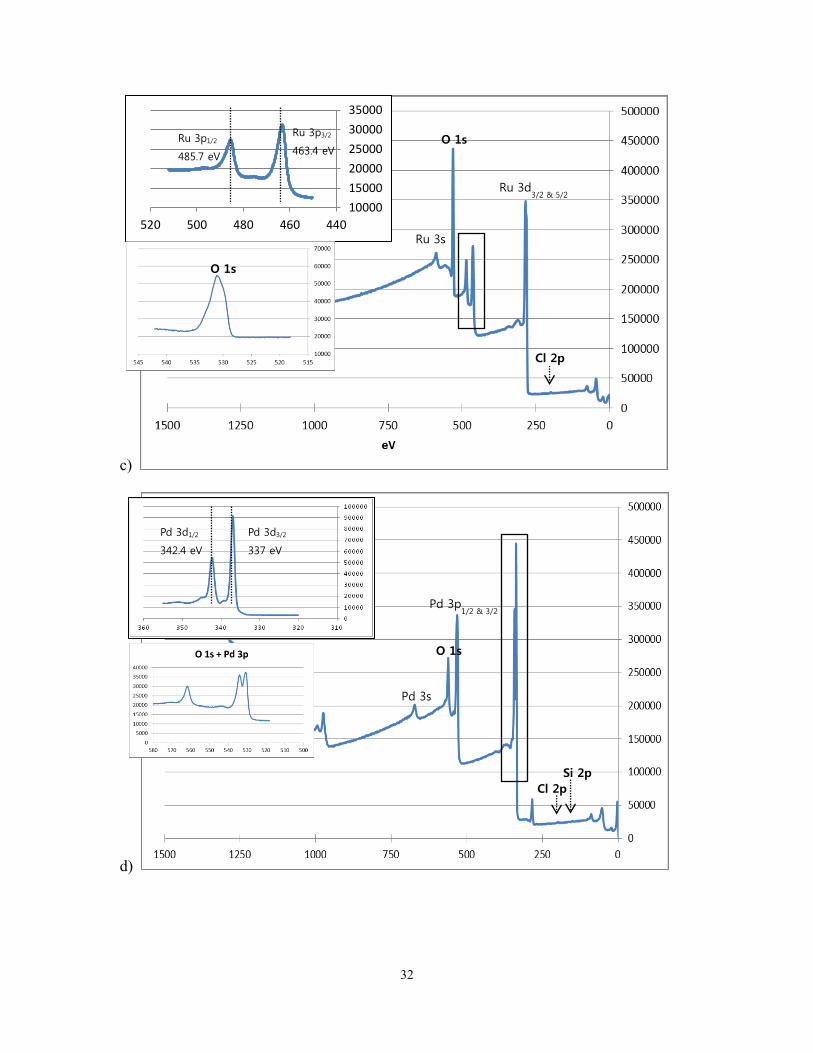
and 308.5 eV correspond to Rh +3. Spectra for RuO2 are shown in figure 3.2c. The Ru
3p1/2 and 3p3/2 peaks at 485.7 eV and 463.4 eV reveal Ru +4. Trace impurity of Cl 2p3/2
(199.1 eV) is confirmed in the survey scan. Figure 3.2d shows the survey spectrum of
PdO. The binding energies of Pd 3d1/2 and Pd3d3/2 at 342.4 and 337 eV are indicated +2
oxidation state of Pd. The impurities of Si 2s (150.8 eV) and Cl 2p3/2 (198.6 eV) are
shown in survey scan. The spectra of IrO2 in figure 3.2e demonstrated that the oxidation
state of Ir is +4 because Ir4d3/2 and Ir4d5/2 peaks are existed at 313.8 eV and 297.8 eV.
Trace impurities of Na 1s (1071.1 eV) and Cl 2p3/2 (197.6 eV) are strongly indicated.
XPS confirmed every NM oxide has right metal valence and oxygen state. I will further
discuss about contamination of IrO2 at 3.2.3.
31
a)
b)
20000
40000
60000
510520530540550
Pt 4f5/2
76.7 eV
Pt 4f7/2
73.4 eV
Pt 4d3/2 &
5/2
Pt 4p3/2
Pt 4p1/2
Pt 4s
Cl 2p
O 1s
Rh 3d3/2
313.3 eV
Rh 3d5/2
308.5 eV
Rh 3p1/2 & 3/2
Rh 3s
Cl 2p
O 1s
N 1s
O 1s
32
c)
d)
10000
15000
20000
25000
30000
35000
440460480500520
Ru 3d3/2 & 5/2
Ru 3s
Cl 2p
Ru 3p1/2
485.7 eV
Ru 3p3/2
463.4 eV O 1s
O 1s
Pd 3p1/2 & 3/2
Pd 3s
Cl 2p
Pd 3d1/2
342.4 eV
Pd 3d3/2
337 eV
O 1s
Si 2p
33
e)
Figure 3.2 XPS survey of NM oxides a) PtO2 b) Rh2O3 c) RuO2 d) PdO e) IrO2.
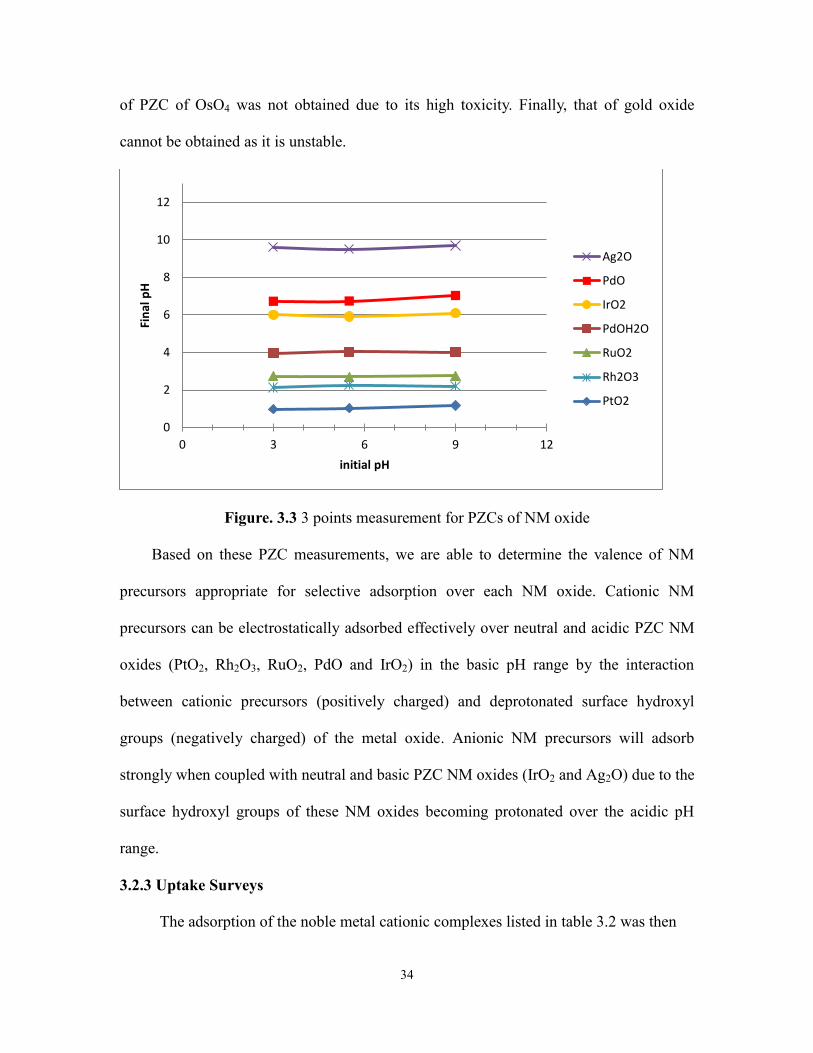
3.2.2 PZC of NM Oxide
PZC determination by the three point method is shown in figure 3.3. Each of the 3
different points of initial pH equilibrated to a similar final pH after the surface hydroxyl
groups of NM oxide became saturated due to the high surface loading and the
accompanying buffering effect of the pH adjusted solution.[6]. The average value of final
pH is then regarded as the PZC of each corresponding NM oxide.
The averaged PZC value of PtO2 is 1.0, Rh2O3 is 2.2 and RuO2 is 2.7. These NM
oxides are low or acidic PZC materials. PdO has an averaged value of 4.0, while that of
IrO2 is 6.0. Both are identified as materials with mid-range or neutral PZCs. Ag2O has a
PZC value of 9.6 and can be regarded as high or basic PZC material. The determination
10000
30000
50000
510520530540550
O 1s
Ir 4f5/2 & 7/2
Ir 4s
Ir 4d3/2
318.8 eV
Ir 4d5/2
297.8 eV
Cl 2p
O 1s
Na 1s
34
of PZC of OsO4 was not obtained due to its high toxicity. Finally, that of gold oxide
cannot be obtained as it is unstable.
Figure. 3.3 3 points measurement for PZCs of NM oxide
Based on these PZC measurements, we are able to determine the valence of NM
precursors appropriate for selective adsorption over each NM oxide. Cationic NM
precursors can be electrostatically adsorbed effectively over neutral and acidic PZC NM
oxides (PtO2, Rh2O3, RuO2, PdO and IrO2) in the basic pH range by the interaction
between cationic precursors (positively charged) and deprotonated surface hydroxyl
groups (negatively charged) of the metal oxide. Anionic NM precursors will adsorb
strongly when coupled with neutral and basic PZC NM oxides (IrO2 and Ag2O) due to the
surface hydroxyl groups of these NM oxides becoming protonated over the acidic pH
range.
3.2.3 Uptake Surveys
The adsorption of the noble metal cationic complexes listed in table 3.2 was then
0
2
4
6
8
10
12
0 3 6 9 12
Fin
al p
H
initial pH
Ag2O
PdO
IrO2
PdOH2O
RuO2
Rh2O3
PtO2
35
measured as a function of pH over each noble metal oxide. The results are plotted for
each NM oxide.
A. PtO2 (PZC=1.0)
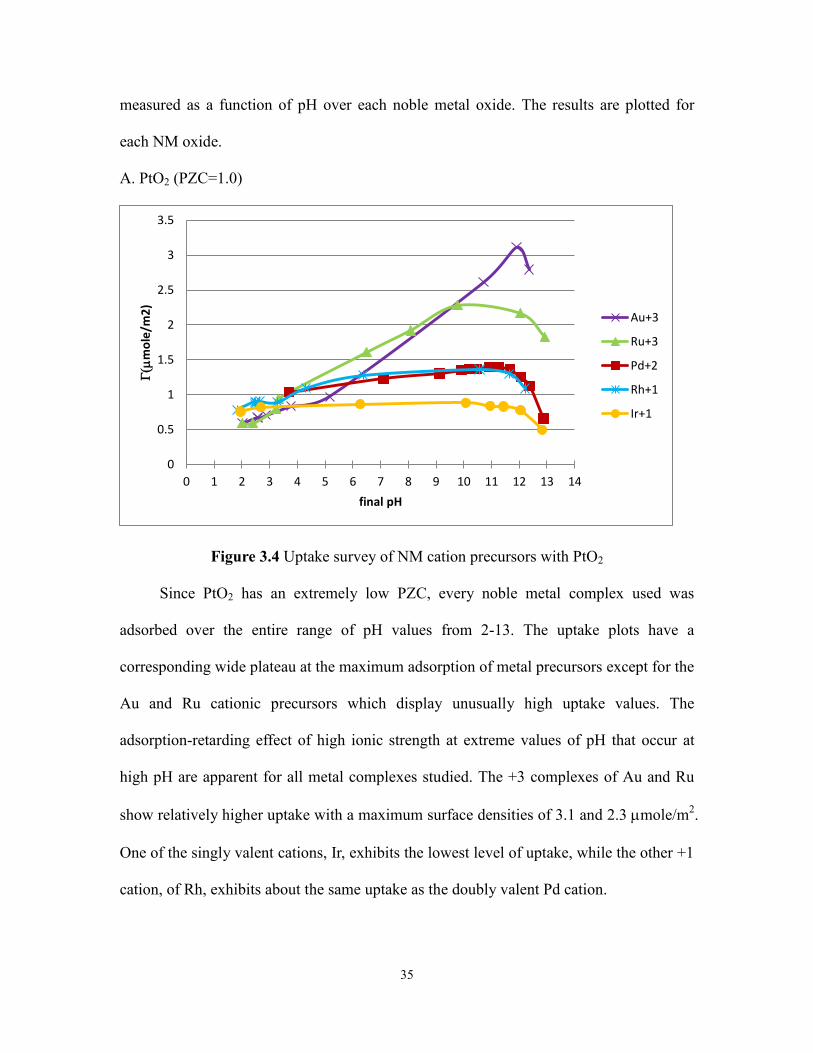
Figure 3.4 Uptake survey of NM cation precursors with PtO2
Since PtO2 has an extremely low PZC, every noble metal complex used was
adsorbed over the entire range of pH values from 2-13. The uptake plots have a
corresponding wide plateau at the maximum adsorption of metal precursors except for the
Au and Ru cationic precursors which display unusually high uptake values. The
adsorption-retarding effect of high ionic strength at extreme values of pH that occur at
high pH are apparent for all metal complexes studied. The +3 complexes of Au and Ru
show relatively higher uptake with a maximum surface densities of 3.1 and 2.3 mole/m2.
One of the singly valent cations, Ir, exhibits the lowest level of uptake, while the other +1
cation, of Rh, exhibits about the same uptake as the doubly valent Pd cation.
0
0.5
1
1.5
2
2.5
3
3.5
0 1 2 3 4 5 6 7 8 9 10 11 12 13 14
G(
mo
le/m
2)
final pH
Au+3
Ru+3
Pd+2
Rh+1
Ir+1
36
The maximum surface density of each species might be related to the degree of
hydration retained by each respective complex. The maximum density of the Ir complex,
at about 0.88 mole/m2, corresponds to a close packed monolayer of Ir complexes which
retains one or two hydration sheaths. Given the size of the complex at 3.22 Å (table 2.2)
and the diameter of water, 2.76 Å, this maximum value with two hydration sheaths is
calculated to be 0.64mole/m2. The maximum surface density of the +2 Pd complex and
the +1 Rh complex, on the other hand, are closer to a layer of complexes which retain one
hydration sheath. For the 2.55 Å Pd tetraammine complex, this value is 1.87 mole/m2
and for the approximately 3.12 Å diameter Rh ethylenediammine complex, this value is
1.53 mole/m2. The very high values of the +3 Au and Ru complexes are between the
values expected for one and zero hydration sheathes. For example, the maximum
adsorption density of the cationic Au precursor is 5.9 mole/m2, if no hydration sheaths
are retained among the adsorbed complexes. The number of hydration sheaths can be
used as an adjustable parameter to fit the maximum surface density. The average number
of hydration sheaths of the Au complex is calculated to be 0.4, while the average number
of sheaths retained by the Ru complex is calculated to be 0.7. Over PtO2 it appears in
general that the higher the valence, the lower the number of hydration sheaths retained by
the adsorbing complex.
B. Rh2O3 (PZC=2.2)
Rh2O3 is an optimal support for the adsorption of noble metal cation precursors
over the pH range of 3 – 13 because Rh2O3 also has an acidic PZC. The +3 Ru cation
again displays a relatively high maximum uptake and achieves about the same surface
density (2.3 mole/m2) as over PtO2, corresponding to an average number of hydration
37
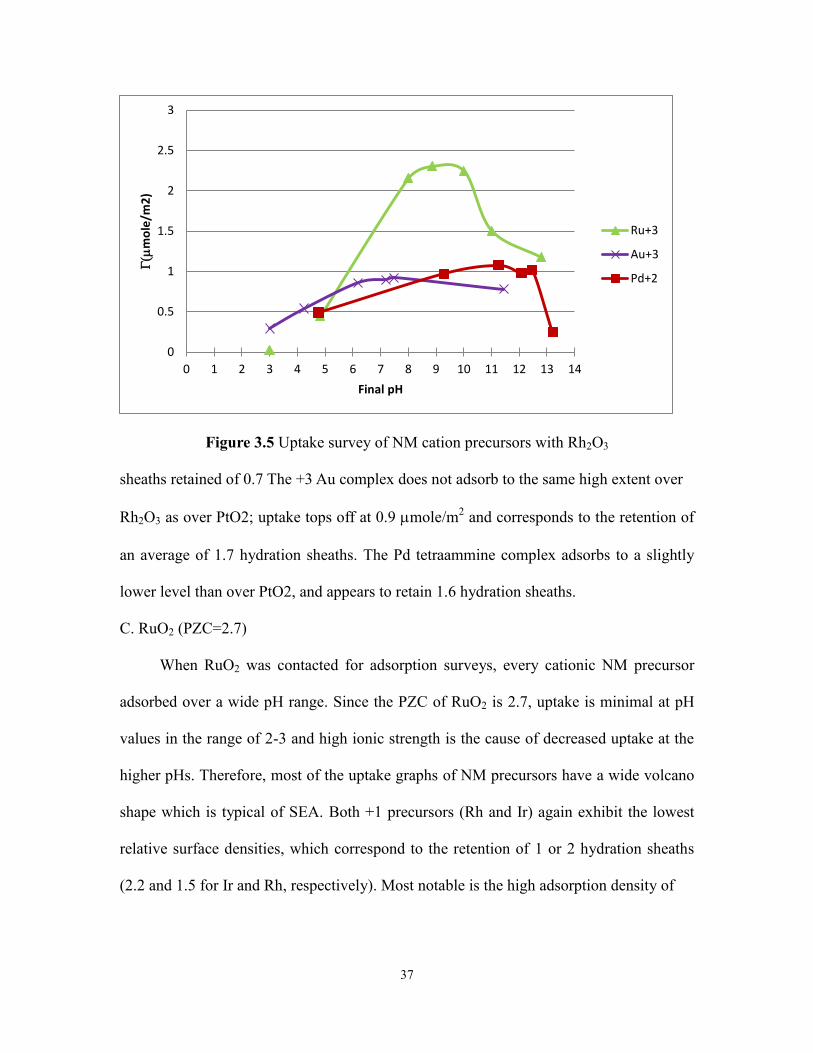
Figure 3.5 Uptake survey of NM cation precursors with Rh2O3
sheaths retained of 0.7 The +3 Au complex does not adsorb to the same high extent over
Rh2O3 as over PtO2; uptake tops off at 0.9 mole/m2 and corresponds to the retention of
an average of 1.7 hydration sheaths. The Pd tetraammine complex adsorbs to a slightly
lower level than over PtO2, and appears to retain 1.6 hydration sheaths.
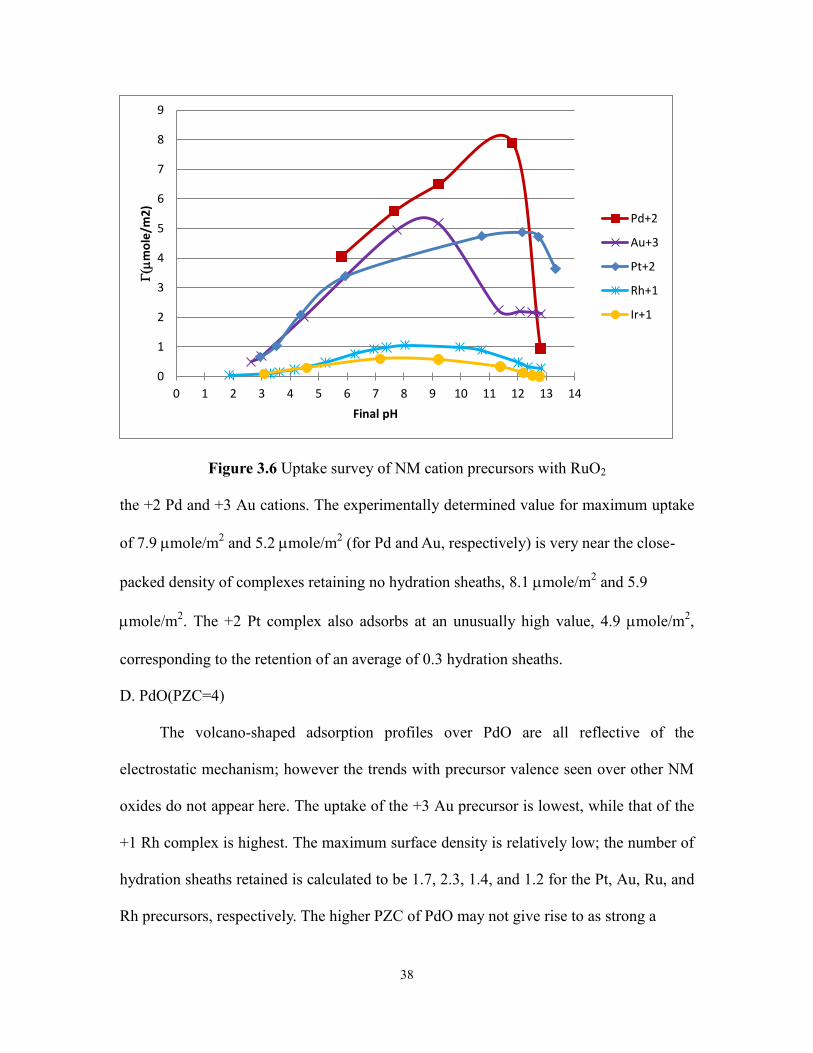
C. RuO2 (PZC=2.7)
When RuO2 was contacted for adsorption surveys, every cationic NM precursor
adsorbed over a wide pH range. Since the PZC of RuO2 is 2.7, uptake is minimal at pH
values in the range of 2-3 and high ionic strength is the cause of decreased uptake at the
higher pHs. Therefore, most of the uptake graphs of NM precursors have a wide volcano
shape which is typical of SEA. Both +1 precursors (Rh and Ir) again exhibit the lowest
relative surface densities, which correspond to the retention of 1 or 2 hydration sheaths
(2.2 and 1.5 for Ir and Rh, respectively). Most notable is the high adsorption density of
0
0.5
1
1.5
2
2.5
3
0 1 2 3 4 5 6 7 8 9 10 11 12 13 14
G(
mo
le/m
2)
Final pH
Ru+3
Au+3
Pd+2
38
Figure 3.6 Uptake survey of NM cation precursors with RuO2
the +2 Pd and +3 Au cations. The experimentally determined value for maximum uptake
of 7.9 mole/m2 and 5.2 mole/m
2 (for Pd and Au, respectively) is very near the close-
packed density of complexes retaining no hydration sheaths, 8.1 mole/m2 and 5.9
mole/m2. The +2 Pt complex also adsorbs at an unusually high value, 4.9 mole/m
2,
corresponding to the retention of an average of 0.3 hydration sheaths.
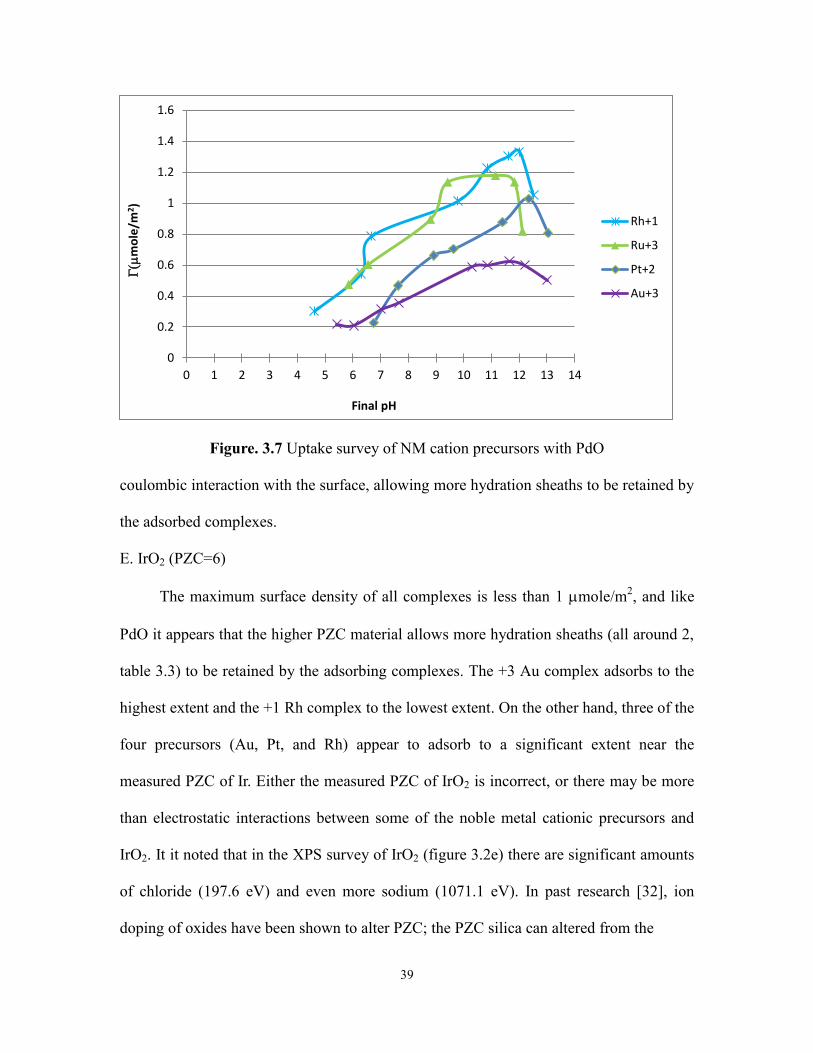
D. PdO(PZC=4)
The volcano-shaped adsorption profiles over PdO are all reflective of the
electrostatic mechanism; however the trends with precursor valence seen over other NM
oxides do not appear here. The uptake of the +3 Au precursor is lowest, while that of the
+1 Rh complex is highest. The maximum surface density is relatively low; the number of
hydration sheaths retained is calculated to be 1.7, 2.3, 1.4, and 1.2 for the Pt, Au, Ru, and
Rh precursors, respectively. The higher PZC of PdO may not give rise to as strong a
0
1
2
3
4
5
6
7
8
9
0 1 2 3 4 5 6 7 8 9 10 11 12 13 14
G(
mo
le/m
2)
Final pH
Pd+2
Au+3
Pt+2
Rh+1
Ir+1
39
Figure. 3.7 Uptake survey of NM cation precursors with PdO
coulombic interaction with the surface, allowing more hydration sheaths to be retained by
the adsorbed complexes.
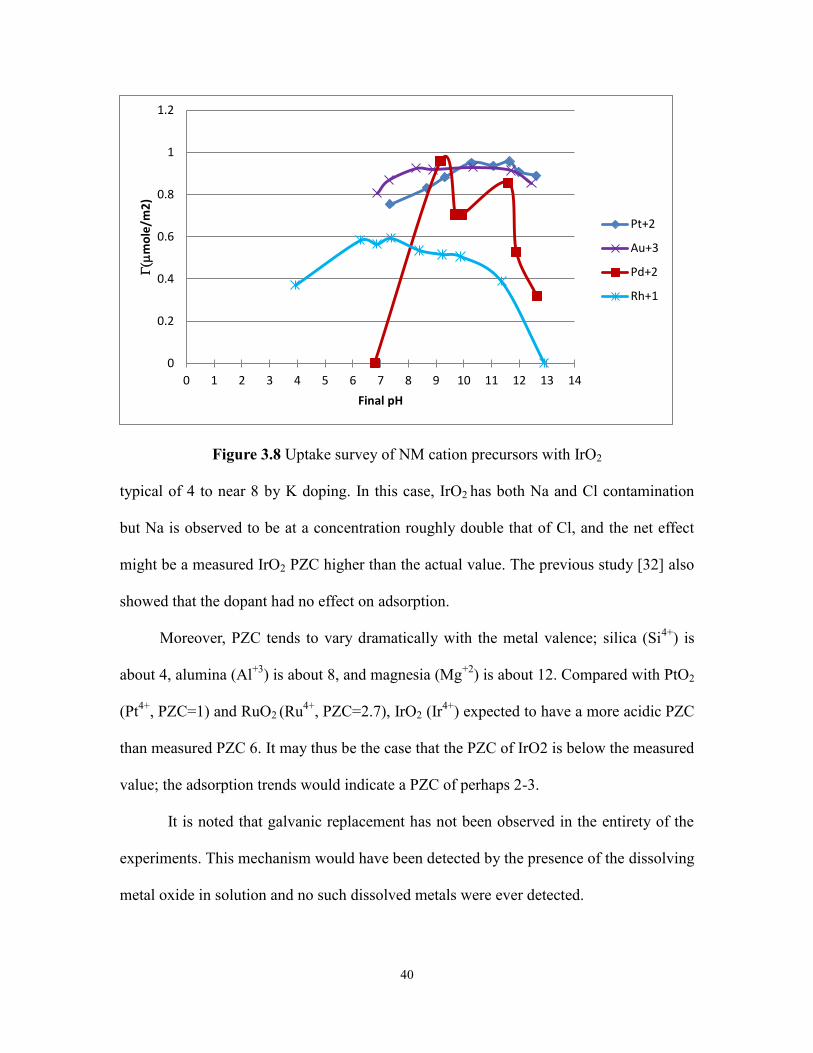
E. IrO2 (PZC=6)
The maximum surface density of all complexes is less than 1 mole/m2, and like
PdO it appears that the higher PZC material allows more hydration sheaths (all around 2,
table 3.3) to be retained by the adsorbing complexes. The +3 Au complex adsorbs to the
highest extent and the +1 Rh complex to the lowest extent. On the other hand, three of the
four precursors (Au, Pt, and Rh) appear to adsorb to a significant extent near the
measured PZC of Ir. Either the measured PZC of IrO2 is incorrect, or there may be more
than electrostatic interactions between some of the noble metal cationic precursors and
IrO2. It it noted that in the XPS survey of IrO2 (figure 3.2e) there are significant amounts
of chloride (197.6 eV) and even more sodium (1071.1 eV). In past research [32], ion
doping of oxides have been shown to alter PZC; the PZC silica can altered from the
0
0.2
0.4
0.6
0.8
1
1.2
1.4
1.6
0 1 2 3 4 5 6 7 8 9 10 11 12 13 14
G(
mo
le/m
2 )
Final pH
Rh+1
Ru+3
Pt+2
Au+3
40
Figure 3.8 Uptake survey of NM cation precursors with IrO2
typical of 4 to near 8 by K doping. In this case, IrO2 has both Na and Cl contamination
but Na is observed to be at a concentration roughly double that of Cl, and the net effect
might be a measured IrO2 PZC higher than the actual value. The previous study [32] also
showed that the dopant had no effect on adsorption.
Moreover, PZC tends to vary dramatically with the metal valence; silica (Si4+
) is
about 4, alumina (Al+3
) is about 8, and magnesia (Mg+2
) is about 12. Compared with PtO2
(Pt4+
, PZC=1) and RuO2 (Ru4+
, PZC=2.7), IrO2 (Ir4+
) expected to have a more acidic PZC
than measured PZC 6. It may thus be the case that the PZC of IrO2 is below the measured
value; the adsorption trends would indicate a PZC of perhaps 2-3.
It is noted that galvanic replacement has not been observed in the entirety of the
experiments. This mechanism would have been detected by the presence of the dissolving
metal oxide in solution and no such dissolved metals were ever detected.
0
0.2
0.4
0.6
0.8
1
1.2
0 1 2 3 4 5 6 7 8 9 10 11 12 13 14
G(
mo
le/m
2)
Final pH
Pt+2
Au+3
Pd+2
Rh+1
41
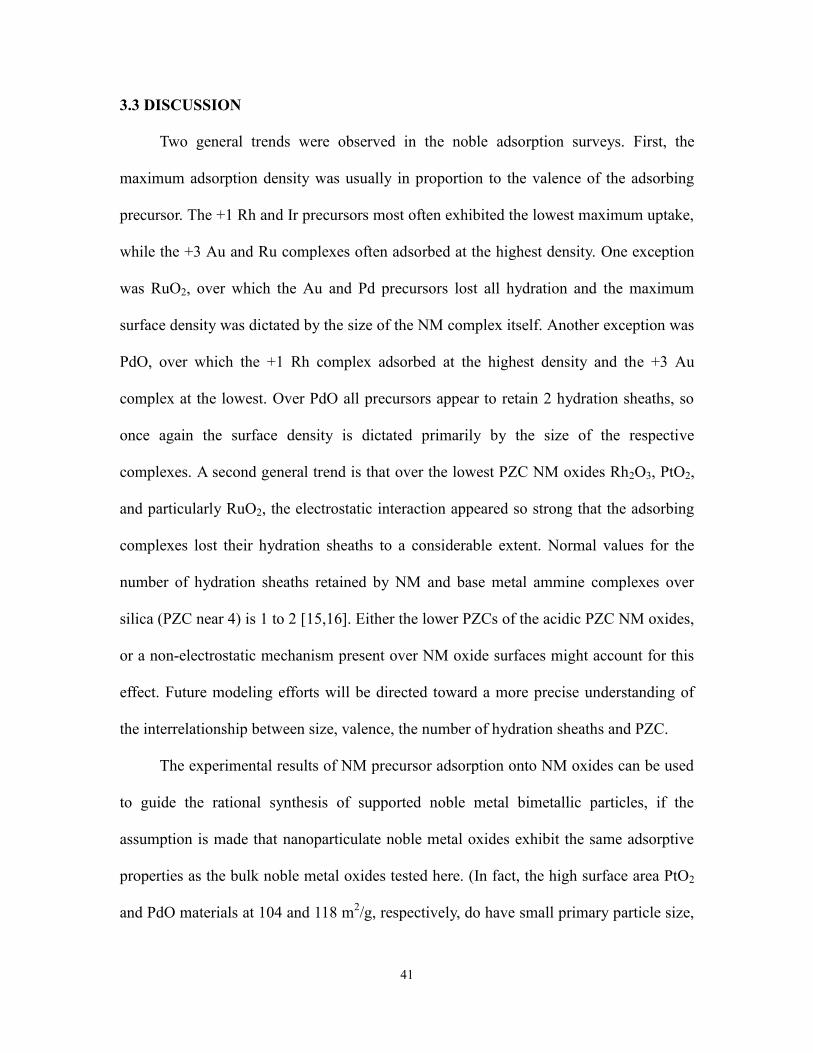
3.3 DISCUSSION
Two general trends were observed in the noble adsorption surveys. First, the
maximum adsorption density was usually in proportion to the valence of the adsorbing
precursor. The +1 Rh and Ir precursors most often exhibited the lowest maximum uptake,
while the +3 Au and Ru complexes often adsorbed at the highest density. One exception
was RuO2, over which the Au and Pd precursors lost all hydration and the maximum
surface density was dictated by the size of the NM complex itself. Another exception was
PdO, over which the +1 Rh complex adsorbed at the highest density and the +3 Au
complex at the lowest. Over PdO all precursors appear to retain 2 hydration sheaths, so
once again the surface density is dictated primarily by the size of the respective
complexes. A second general trend is that over the lowest PZC NM oxides Rh2O3, PtO2,
and particularly RuO2, the electrostatic interaction appeared so strong that the adsorbing
complexes lost their hydration sheaths to a considerable extent. Normal values for the
number of hydration sheaths retained by NM and base metal ammine complexes over
silica (PZC near 4) is 1 to 2 [15,16]. Either the lower PZCs of the acidic PZC NM oxides,
or a non-electrostatic mechanism present over NM oxide surfaces might account for this
effect. Future modeling efforts will be directed toward a more precise understanding of
the interrelationship between size, valence, the number of hydration sheaths and PZC.
The experimental results of NM precursor adsorption onto NM oxides can be used
to guide the rational synthesis of supported noble metal bimetallic particles, if the
assumption is made that nanoparticulate noble metal oxides exhibit the same adsorptive
properties as the bulk noble metal oxides tested here. (In fact, the high surface area PtO2
and PdO materials at 104 and 118 m2/g, respectively, do have small primary particle size,
42
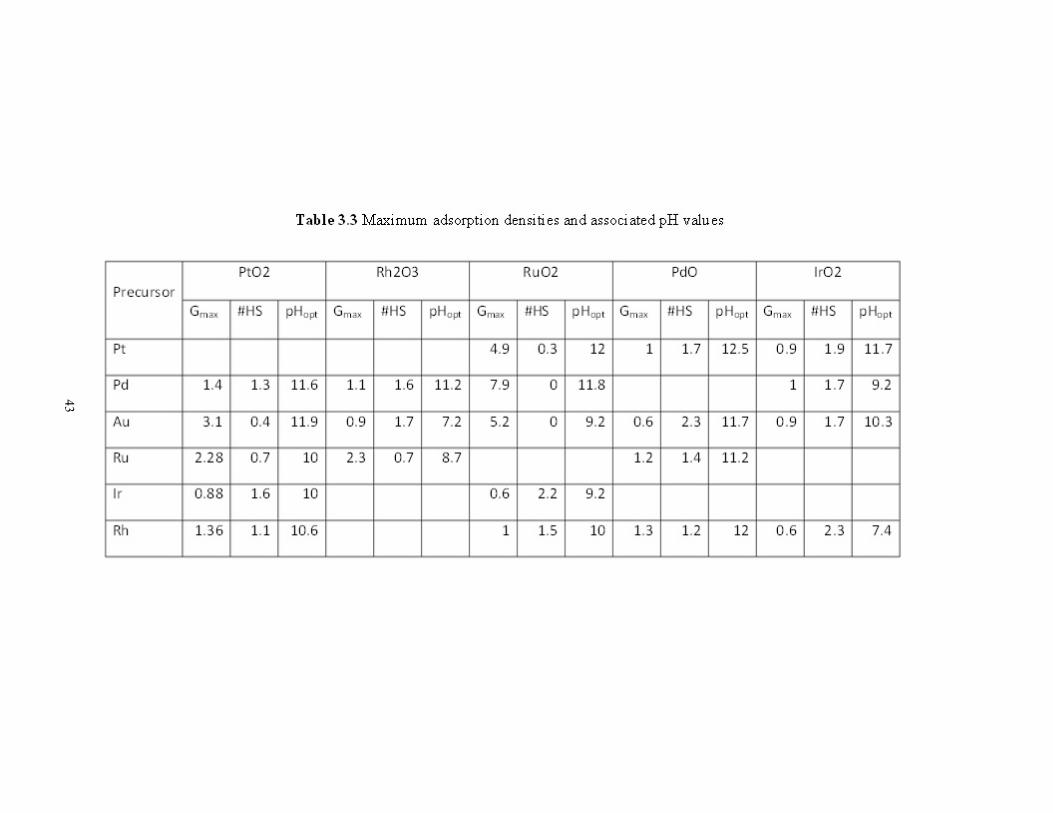
on the order of 5.7 and 6.1 nm.) The maximum adsorption density achievable over a
particular NM oxide by another NM precursor and the final solution pH at which this
occurs, are known. These data are collected in table 3.3. Thus the amount of NM
precursor deposited onto a NM oxide nanoparticle surface is known, and accounting for
the dispersion of the NM oxide nanoparticle, the amount of NM precursor adsorbed per
total NM oxide particle can be calculated. Assuming that NM oxides shrink about 20% as
they are reduced, the shellNM/coreNM molar (or atomic) ratio for various core NM
particle sizes can be further calculated.
43
44
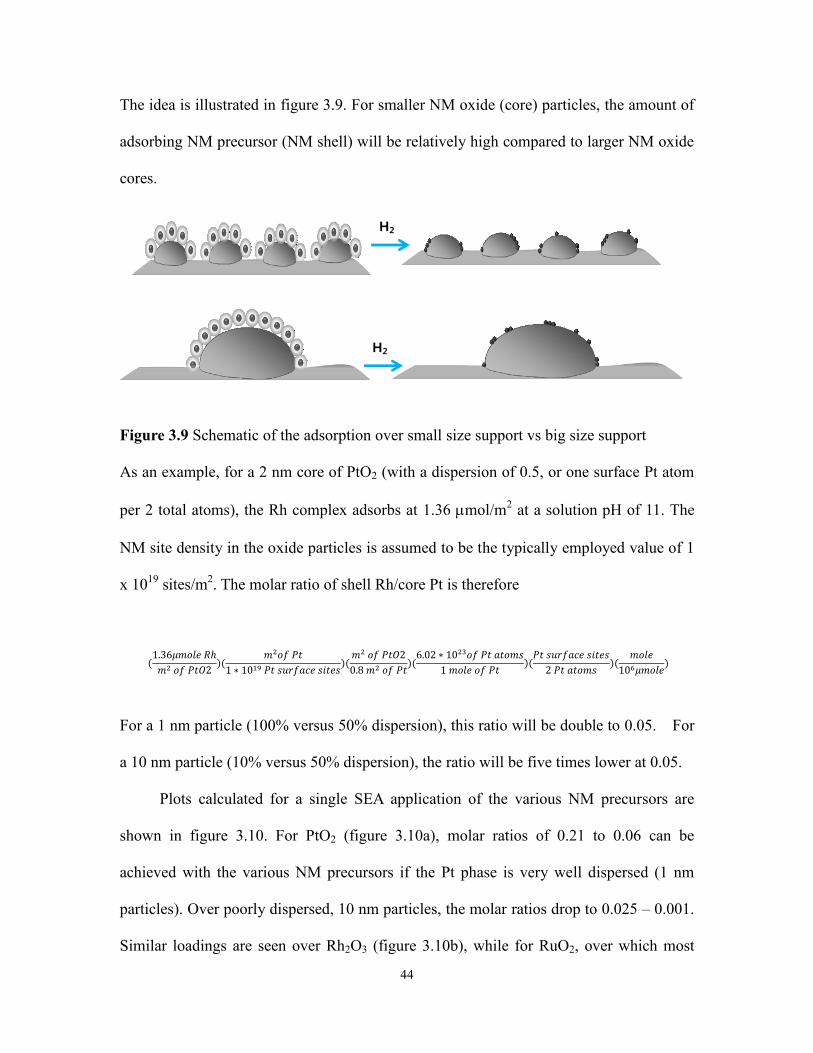
The idea is illustrated in figure 3.9. For smaller NM oxide (core) particles, the amount of
adsorbing NM precursor (NM shell) will be relatively high compared to larger NM oxide
cores.
Figure 3.9 Schematic of the adsorption over small size support vs big size support
As an example, for a 2 nm core of PtO2 (with a dispersion of 0.5, or one surface Pt atom
per 2 total atoms), the Rh complex adsorbs at 1.36 mol/m2 at a solution pH of 11. The
NM site density in the oxide particles is assumed to be the typically employed value of 1
x 1019
sites/m2. The molar ratio of shell Rh/core Pt is therefore
(1.36𝜇𝑚𝑜𝑙𝑒 𝑅ℎ
𝑚2 𝑜𝑓 𝑃𝑡𝑂2)(
𝑚2𝑜𝑓 𝑃𝑡
1 ∗ 1019 𝑃𝑡 𝑠𝑢𝑟𝑓𝑎𝑐𝑒 𝑠𝑖𝑡𝑒𝑠)(
𝑚2 𝑜𝑓 𝑃𝑡𝑂2
0.8 𝑚2 𝑜𝑓 𝑃𝑡)(
6.02 ∗ 1023𝑜𝑓 𝑃𝑡 𝑎𝑡𝑜𝑚𝑠
1 𝑚𝑜𝑙𝑒 𝑜𝑓 𝑃𝑡)(
𝑃𝑡 𝑠𝑢𝑟𝑓𝑎𝑐𝑒 𝑠𝑖𝑡𝑒𝑠
2 𝑃𝑡 𝑎𝑡𝑜𝑚𝑠)(
𝑚𝑜𝑙𝑒
106𝜇𝑚𝑜𝑙𝑒)
For a 1 nm particle (100% versus 50% dispersion), this ratio will be double to 0.05. For
a 10 nm particle (10% versus 50% dispersion), the ratio will be five times lower at 0.05.
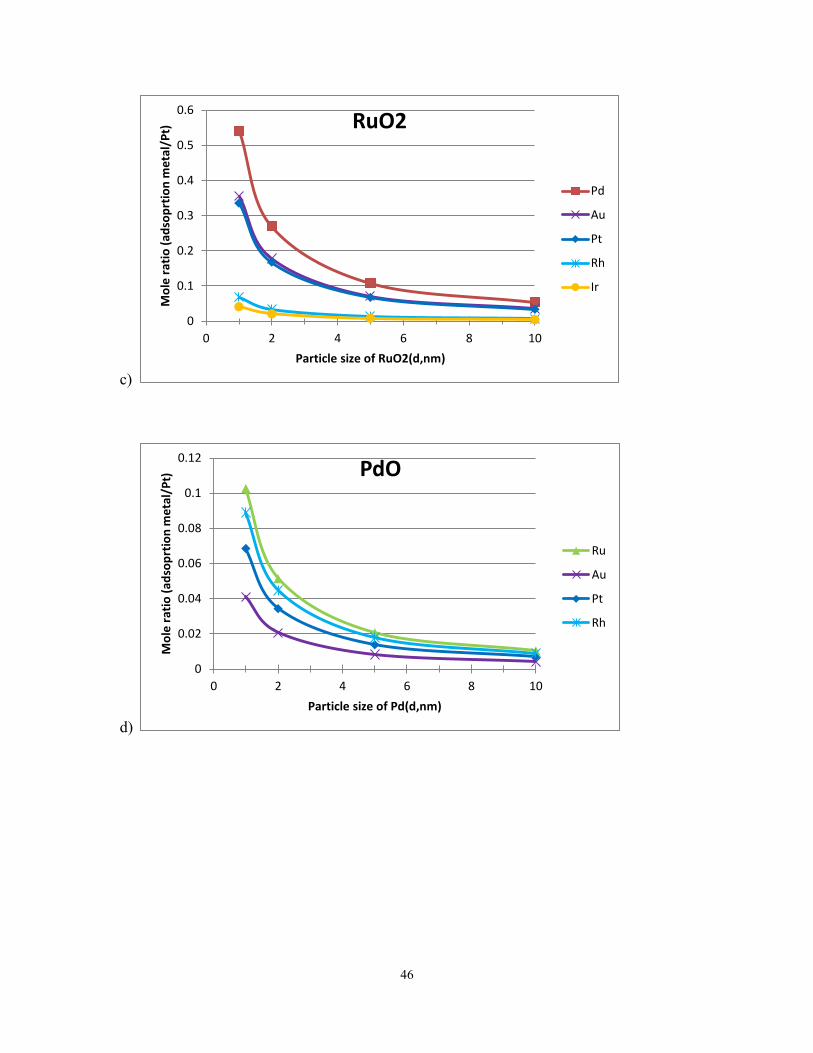
Plots calculated for a single SEA application of the various NM precursors are
shown in figure 3.10. For PtO2 (figure 3.10a), molar ratios of 0.21 to 0.06 can be
achieved with the various NM precursors if the Pt phase is very well dispersed (1 nm
particles). Over poorly dispersed, 10 nm particles, the molar ratios drop to 0.025 – 0.001.
Similar loadings are seen over Rh2O3 (figure 3.10b), while for RuO2, over which most
H2
H2
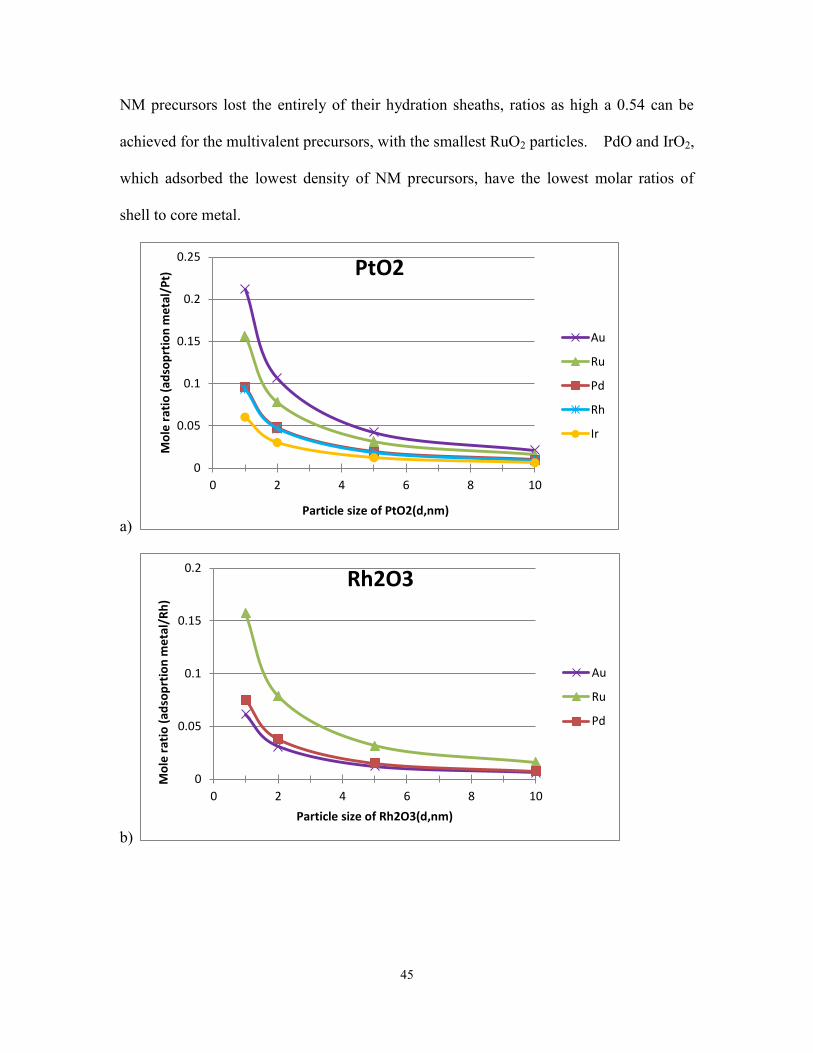
45
NM precursors lost the entirely of their hydration sheaths, ratios as high a 0.54 can be
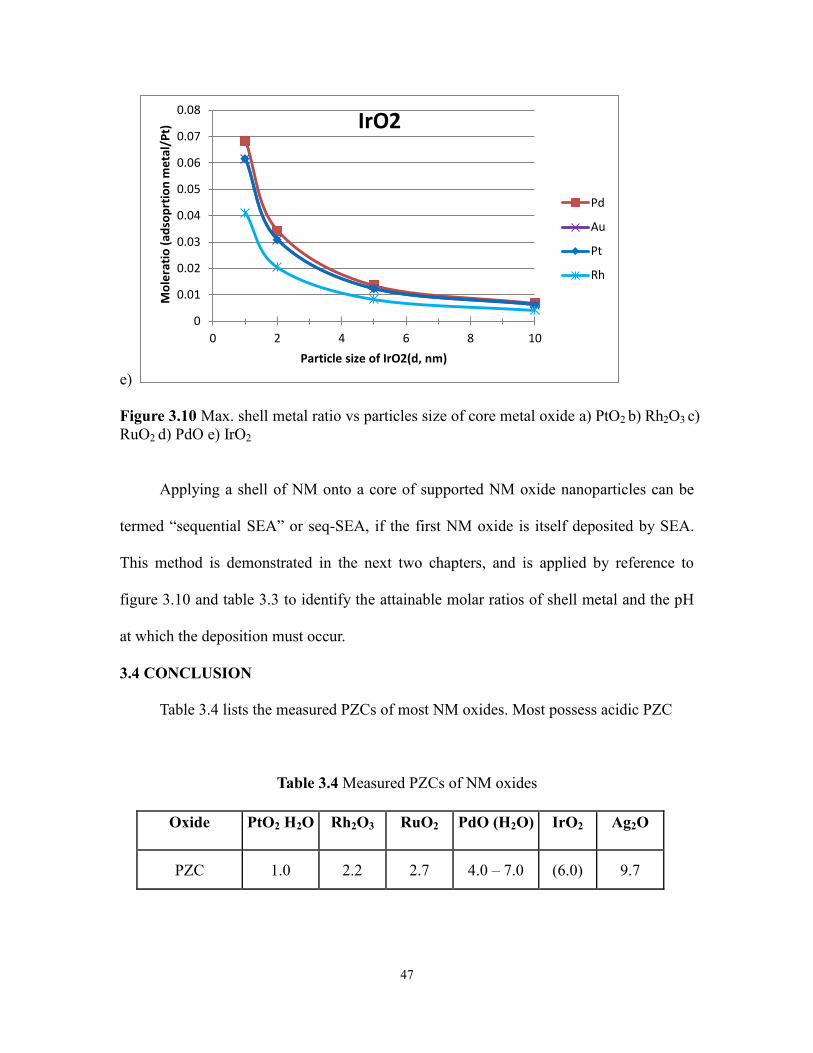
achieved for the multivalent precursors, with the smallest RuO2 particles. PdO and IrO2,
which adsorbed the lowest density of NM precursors, have the lowest molar ratios of
shell to core metal.
a)
b)
0
0.05
0.1
0.15
0.2
0.25
0 2 4 6 8 10
Mo
le r
atio
(ad
sop
rtio
n m
eta
l/P
t)
Particle size of PtO2(d,nm)
PtO2
Au
Ru
Pd
Rh
Ir
0
0.05
0.1
0.15
0.2
0 2 4 6 8 10
Mo
le r
atio
(ad
sop
rtio
n m
eta
l/R
h)
Particle size of Rh2O3(d,nm)
Rh2O3
Au
Ru
Pd
46
c)
d)
0
0.1
0.2
0.3
0.4
0.5
0.6
0 2 4 6 8 10
Mo
le r
atio
(ad
sop
rtio
n m
eta
l/P
t)
Particle size of RuO2(d,nm)
RuO2
Pd
Au
Pt
Rh
Ir
0
0.02
0.04
0.06
0.08
0.1
0.12
0 2 4 6 8 10
Mo
le r
atio
(ad
sop
rtio
n m
eta
l/P
t)
Particle size of Pd(d,nm)
PdO
Ru
Au
Pt
Rh
47
e)
Figure 3.10 Max. shell metal ratio vs particles size of core metal oxide a) PtO2 b) Rh2O3 c)
RuO2 d) PdO e) IrO2
Applying a shell of NM onto a core of supported NM oxide nanoparticles can be
termed “sequential SEA” or seq-SEA, if the first NM oxide is itself deposited by SEA.
This method is demonstrated in the next two chapters, and is applied by reference to
figure 3.10 and table 3.3 to identify the attainable molar ratios of shell metal and the pH
at which the deposition must occur.
3.4 CONCLUSION
Table 3.4 lists the measured PZCs of most NM oxides. Most possess acidic PZC
Table 3.4 Measured PZCs of NM oxides
Oxide PtO2 H2O Rh2O3 RuO2 PdO (H2O) IrO2 Ag2O
PZC 1.0 2.2 2.7 4.0 – 7.0 (6.0) 9.7
0
0.01
0.02
0.03
0.04
0.05
0.06
0.07
0.08
0 2 4 6 8 10
Mo
lera
tio
(ad
sop
rtio
n m
eta
l/P
t)
Particle size of IrO2(d, nm)
IrO2
Pd
Au
Pt
Rh
48
values are readily adsorb cationic precursors over a wide pH range. The PZC
measurement is questionable for IrO2, which contained significant Na+ and Cl
- impurities;
adsorption trends suggest a PZC of 2-3. PdO is unusual in that its hydrated and non-
hydrated forms appear to exhibit different PZCs (4 and 7 respectively).
Two general trends were observed in the noble adsorption surveys. First, the
maximum adsorption density was usually in proportion to the valence of the adsorbing
precursor. Second, over the lowest PZC NM oxides Rh2O3, PtO2, and particularly RuO2,
the electrostatic interaction appeared so strong that the adsorbing complexes lost their
hydration sheaths to a considerable extent.
Continuing work includes surveys of noble metal anions onto neutral and basic
PZC materials. The PZC and adsorption results presented here will give great guidance to
those who wish to employ SEA to synthesize bimetallic catalysts. Future modeling
efforts will be directed toward a more precise understanding of the interrelationship
between size, valence, the number of hydration sheaths and PZC.
49
CHAPTER 4
Pd-Pt BIMETALLIC CATALYSTS
Noble bimetallic catalysts are ubiquitous in both academia and industry. A survey of the
literature covering catalysis reveals over two hundreds articles and a similar number of
patents pertaining to a multitude of bimetallic systems, with applications in air pollution
abatement, petroleum refining, Fisher Tropsch synthesis, as well as fuel cell catalysts for
both reactions occurring at the anodes and cathodes. A system of great interest are Pt-Pd
bifunctional catalysts that impart improved performance for methane combustion [33-38],
improved sulfur tolerance in the hydrogenation of aromatics [39-50], destruction of
volatile organic compounds (VOCs) which are considered to be one of the major
contributors to industrial air pollution [51-53], electrocatalysts for fuel cell [54-56] and
hydrodeoxygenation of benzonfuran for biomass conversion [57]. In almost all cases just
referenced, Pt-Pd bimetallic catalysts show increased activity and improved catalyst
stability when compared with single Pt or Pd catalysts.
More than 50% of the literature surveyed employed dry impregnation to synthesize
Pt-Pd bimetallic catalysts. Dry impregnation is used most often for the synthesis of
bimetallic catalysts due to the simplicity of synthesis; two metal precursors are dissolved
into the amount of solution just necessary to fill the pore volume of the support. The
solution is contacted with the support, and the thick paste formed is dried and pretreated.
However, when using dry impregnation, the intimate interaction of the two cannot be
50
well controlled and usually occurs only to a minimal extent.
Several types of catalyst synthesis methods have been developed to ensure metal-
metal interaction. First, bimetallic particles can be produced as colloids [58-59] or in
dendrimers [60-62]. The advantage of these preparations is that bimetallic particles of a
precisely controlled composition and size can be synthesized. However, problems exist
even with these “template” preparations since thermochemical treatments are needed to
react away the template and this treatment invariably leads to sintering of the supported
metal particles.
Direct metal-metal interactions can be arranged electrochemically [63]; yet a more
ingenious method is that of electroless deposition or surface redox preparations [28,63-
65], in which a reduced metal surface has sufficient reduction potential to reduce a
dissolved cation of a second metal which in turn can form core-shell particles. High
loading of the shell metal can be achieved, however, the depositing metal can also absorb
onto itself and this autocatalytic deposition can make the formation of a contiguous
metallic shell difficult. Another minor practical drawback of this method is the
complexity in establishing a metastable deposition bath in some systems.
In this chapter it will be demonstrated that Strong Electrostatic Adsorption (SEA)
can be applied to the synthesis of bimetallic nanoparticles. The manner in which SEA
can be applied to bimetallic catalysts is depicted in figure 4.1. For the sake of
completeness, in figure 4.1a dry impregnation (DI) is shown. In this method, two metal
precursors are placed in solution but no provision is made for the metal precursors to
interact with the support surface, and often the result is large, poorly dispersed and poorly
distributed aggregates of separate metal particles. On the other hand if a mixture of
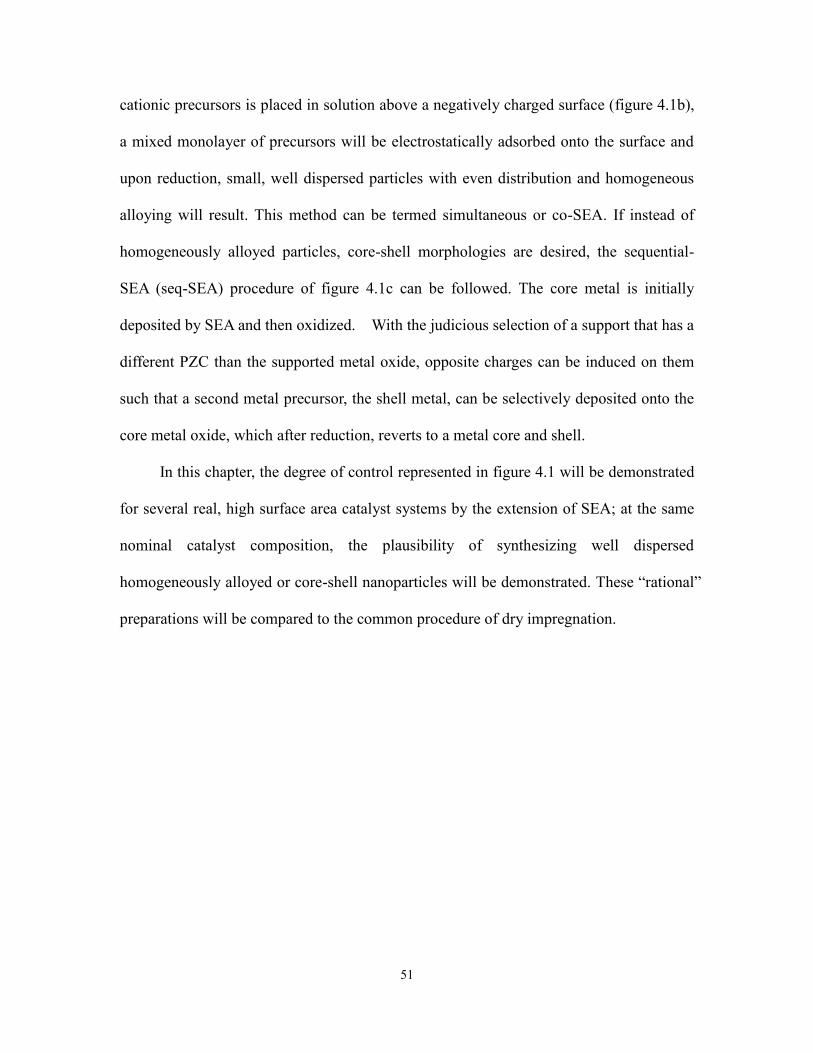
51
cationic precursors is placed in solution above a negatively charged surface (figure 4.1b),
a mixed monolayer of precursors will be electrostatically adsorbed onto the surface and
upon reduction, small, well dispersed particles with even distribution and homogeneous
alloying will result. This method can be termed simultaneous or co-SEA. If instead of
homogeneously alloyed particles, core-shell morphologies are desired, the sequential-
SEA (seq-SEA) procedure of figure 4.1c can be followed. The core metal is initially
deposited by SEA and then oxidized. With the judicious selection of a support that has a
different PZC than the supported metal oxide, opposite charges can be induced on them
such that a second metal precursor, the shell metal, can be selectively deposited onto the
core metal oxide, which after reduction, reverts to a metal core and shell.
In this chapter, the degree of control represented in figure 4.1 will be demonstrated
for several real, high surface area catalyst systems by the extension of SEA; at the same
nominal catalyst composition, the plausibility of synthesizing well dispersed
homogeneously alloyed or core-shell nanoparticles will be demonstrated. These “rational”
preparations will be compared to the common procedure of dry impregnation.
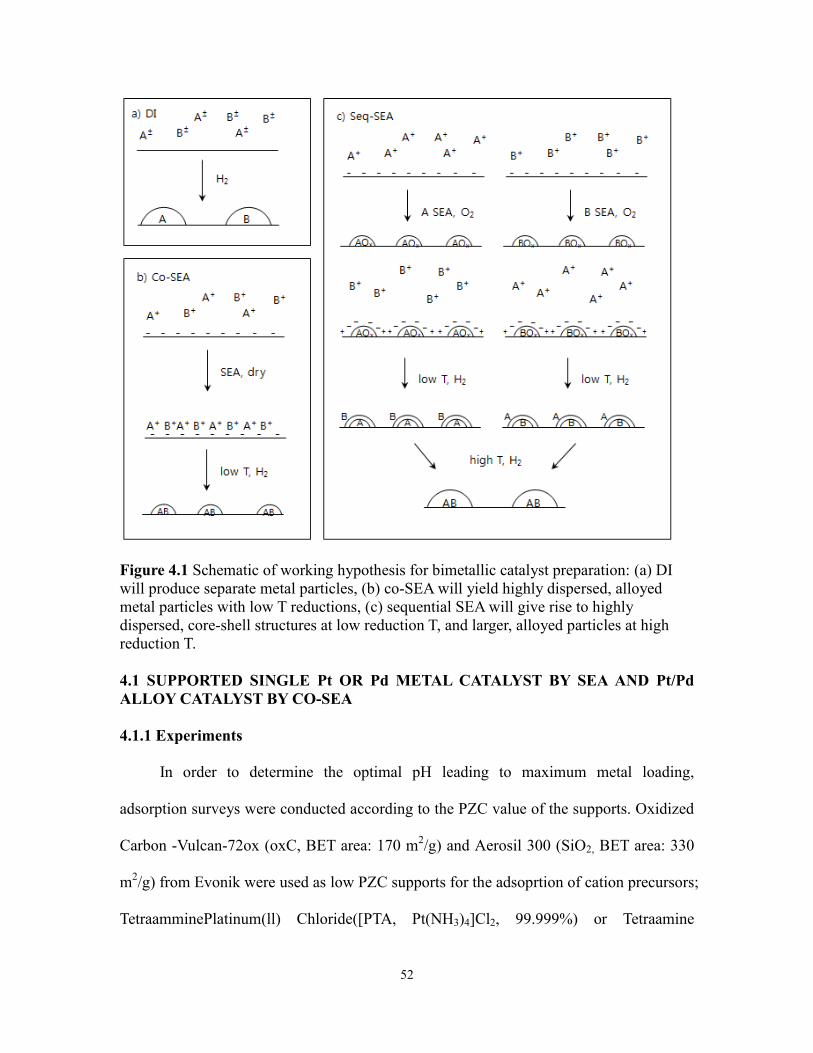
52
Figure 4.1 Schematic of working hypothesis for bimetallic catalyst preparation: (a) DI
will produce separate metal particles, (b) co-SEA will yield highly dispersed, alloyed
metal particles with low T reductions, (c) sequential SEA will give rise to highly
dispersed, core-shell structures at low reduction T, and larger, alloyed particles at high
reduction T.
4.1 SUPPORTED SINGLE Pt OR Pd METAL CATALYST BY SEA AND Pt/Pd
ALLOY CATALYST BY CO-SEA
4.1.1 Experiments
In order to determine the optimal pH leading to maximum metal loading,
adsorption surveys were conducted according to the PZC value of the supports. Oxidized
Carbon -Vulcan-72ox (oxC, BET area: 170 m2/g) and Aerosil 300 (SiO2, BET area: 330
m2/g) from Evonik were used as low PZC supports for the adsoprtion of cation precursors;
TetraamminePlatinum(ll) Chloride([PTA, Pt(NH3)4]Cl2, 99.999%) or Tetraamine
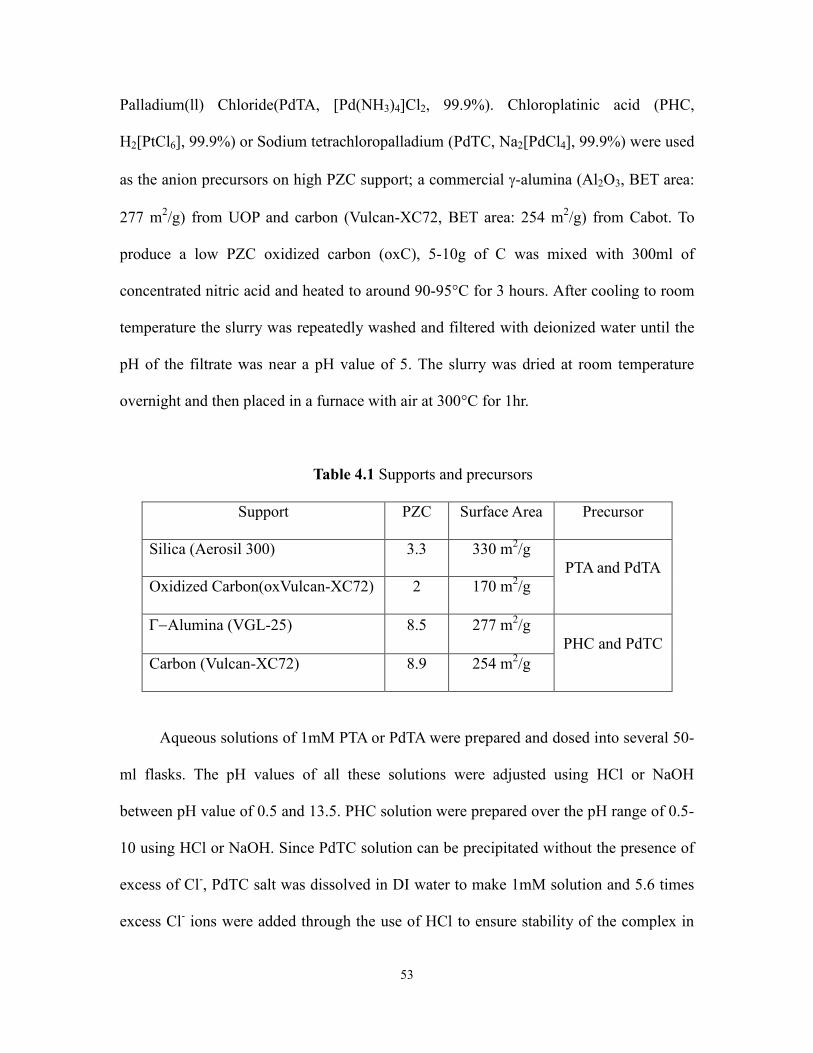
53
Palladium(ll) Chloride(PdTA, [Pd(NH3)4]Cl2, 99.9%). Chloroplatinic acid (PHC,
H2[PtCl6], 99.9%) or Sodium tetrachloropalladium (PdTC, Na2[PdCl4], 99.9%) were used
as the anion precursors on high PZC support; a commercial -alumina (Al2O3, BET area:
277 m2/g) from UOP and carbon (Vulcan-XC72, BET area: 254 m
2/g) from Cabot. To
produce a low PZC oxidized carbon (oxC), 5-10g of C was mixed with 300ml of
concentrated nitric acid and heated to around 90-95°C for 3 hours. After cooling to room
temperature the slurry was repeatedly washed and filtered with deionized water until the
pH of the filtrate was near a pH value of 5. The slurry was dried at room temperature
overnight and then placed in a furnace with air at 300°C for 1hr.
Table 4.1 Supports and precursors
Support PZC Surface Area Precursor
Silica (Aerosil 300) 3.3 330 m2/g
PTA and PdTA
Oxidized Carbon(oxVulcan-XC72) 2 170 m2/g
GAlumina (VGL-25) 8.5 277 m2/g
PHC and PdTC
Carbon (Vulcan-XC72) 8.9 254 m2/g
Aqueous solutions of 1mM PTA or PdTA were prepared and dosed into several 50-
ml flasks. The pH values of all these solutions were adjusted using HCl or NaOH
between pH value of 0.5 and 13.5. PHC solution were prepared over the pH range of 0.5-
10 using HCl or NaOH. Since PdTC solution can be precipitated without the presence of
excess of Cl-, PdTC salt was dissolved in DI water to make 1mM solution and 5.6 times
excess Cl- ions were added through the use of HCl to ensure stability of the complex in
54
solution over the required pH range [66]. HNO3 and NH4OH were used to adjust the pH
of the PdTC solutions from 0.5 to 5, being careful to maintain a maximum pH value of 5
with NH4OH since the anionic palladium chloride complex converts to cationic Pd
ammine complex which will not electrostatically adsorb over the support surface [66].
For the co-SEA uptake survey, a mixture of 1mM of Pt and 1mM Pd solution was used.
A high PZC support was weighed out to obtain the desired 1000 m2/L surface
loading (SL) in 50 mL of solution. The low PZC support was weighed out for 500 m2/L
surface loading with 50mL solutions.
)L( solution of Volume
)g/m( area surface oxide )g( solid of mass)L/(m SL
22
Each support powder was added to 50mL of each pH adjusted solution and shaken
for 1 hour. Final pH values were measured and 5mL of slurry solution was filtered for
Inductively Coupled Plasma (ICP, Perkin-Elmer Optima 2000DV) analysis. Initial
solutions which were not contacted with support, at each pH value, were also measured
with ICP to establish initial concentrations. Pt and Pd calibration standards were diluted
from a 10,000 ppm Pd and 10,000 ppm Pt stock solutions. The calibration curves were
obtained for 200 and 500ppm of Pt and Pd solutions.
Adsorption data is plotted with the final pH values along the x-axis and platinum
(or palladium) adsorption along the y-axis as G (μmol/m2). The optimal final pH was
obtained by the above adsorption experiments.
)/(1000*)/(*)/(
)/(10)/)(()/(
2
62
gmgmolgMetalofMwLmLoadingSurface
molmolLmgConcConcmmol finalinital
G
To synthesis the amount of catalyst needed for characterization and reactivity
evaluation, the adsorption survey experiment was simply scaled up to 1L at optimal pH;
55
3.0 g of silica or 5.9 g of oxC was added into 1 mM PTA solution or 1 mM PdTA solution.
After shaking 1 hour, the slurry was filtered, dried and reduced to make Pt/SiO2, Pd/SiO2,
Pt/oxC and Pd/oxC. Pt/Al2O3, Pd/Al2O3, Pt/C and Pd/C were also made by same process
with either 1 mM PHC solution or 1 mM PdTC solution.
Samples prepared by co-SEA were produced in the same manner with mixed
solution of 1 mM Pt and 1 mM Pd at the optimal uptake pH. All samples were dried at
room temperature overnight and then reduced for 1hr with 10%H2/He at the appropriate
temperature based on TPR with a ramp rate 2.5°C /min.
4.1.2 Characterization
A. XRD
Powder XRD measurements were made using a Rigaku MiniFlexII bench-top
system. XRD patterns were compared to reference spectra using PDXL 2.0 (Rigaku
Corporation) software. The radiation source was Cu Kα radiation (λ = 1.5406 Å) at
operating condition of 30kV and 15mA. All spectra were taken at a scan rate of 0.5o/min
and sampling width of 0.02 o.
B. TPR
Micromeritics Autochem ll 2920 used for TPR, the flow rate was 50cc of 10%
H2/He, the temp range from 25°C to 800°C and ramp rate was 5°C/min. TCD signal
recorded every 0.1sec. Mass spec used fixed-bed quartz reactor and dried in He at 110 °C
for 60 min then, the sample was cool down to RT and TPR profiles were obtained by
flowing 1% H2/Ar gas mixture form 25 to 500 °C with a ramp of 5 °C/min.
C. STEM and EDXS
Scanning transmission electron microscopy (STEM) at USC was used to obtain
56
images of co-SEA and co-DI catalysts with a JEOL 2100F 200kV FEG-STEM/TEM
equipped with a CEOS Cs corrector on the illumination system. The geometrical
aberrations were measured and controlled to provide less than a π/4 phase shift of the
incoming electron wave over the probe-defining aperture of 17.5 mrad. High angle
annular dark-field (HAADF) STEM images were acquired on a Fischione Model 3000
HAADF detector with a camera length such that the inner cut-off angle of the detector
was 50 mrad. The scanning acquisition was synchronized to the 60 Hz AC electrical
power to minimize 60Hz noise in the images and a pixel dwell time of 15.8µs was used.
The JEM-ARM200CF at the U. Illinois at Chicago was used for images and
elemental mappings of seq-SEA and co-DI catalysts. The JEM-ARM200CF is a probe
aberration corrected 200kV STEM/TEM with a cold field emission source with 0.35eV
energy resolution. For HADF imaging at 200kV this instrument has a resolution of less
than 0.08nm. STEM images can be collected from up to four of the five STEM detectors
simultaneously. For microanalysis the microscope is equipped with an Oxford X-max 80
SDD X-ray detector. Probe size 1A, probe current 14 Pa, 20um aperture. 256 pixel
resolution, pixel dwell time is microseconds, using oxford instruments X-Max TLE
100mm2 detector with about 0.7 Sr solid angle of collection, most of maps collected
within 5min, short collection time to ensure core-shell maintains integrity.
D. Catalytic Activity: Oxidation of Diesel Exhausted Gas
JMTC in the UK has evaluated several Pt/Pd catalysts for abatement of a model
diesel exhaust mixture. They used 0.1g catalyst in a ‘Diesel 4HC' test. Gas composition is
5% CO2, 5% H2O, 14% O2, 1500ppm CO, 150ppm NO, 40ppm CH4, 37ppm propylene,
26ppm decane and 16ppm toluene in N2 carrier. The bed of catalyst pellets is maintained
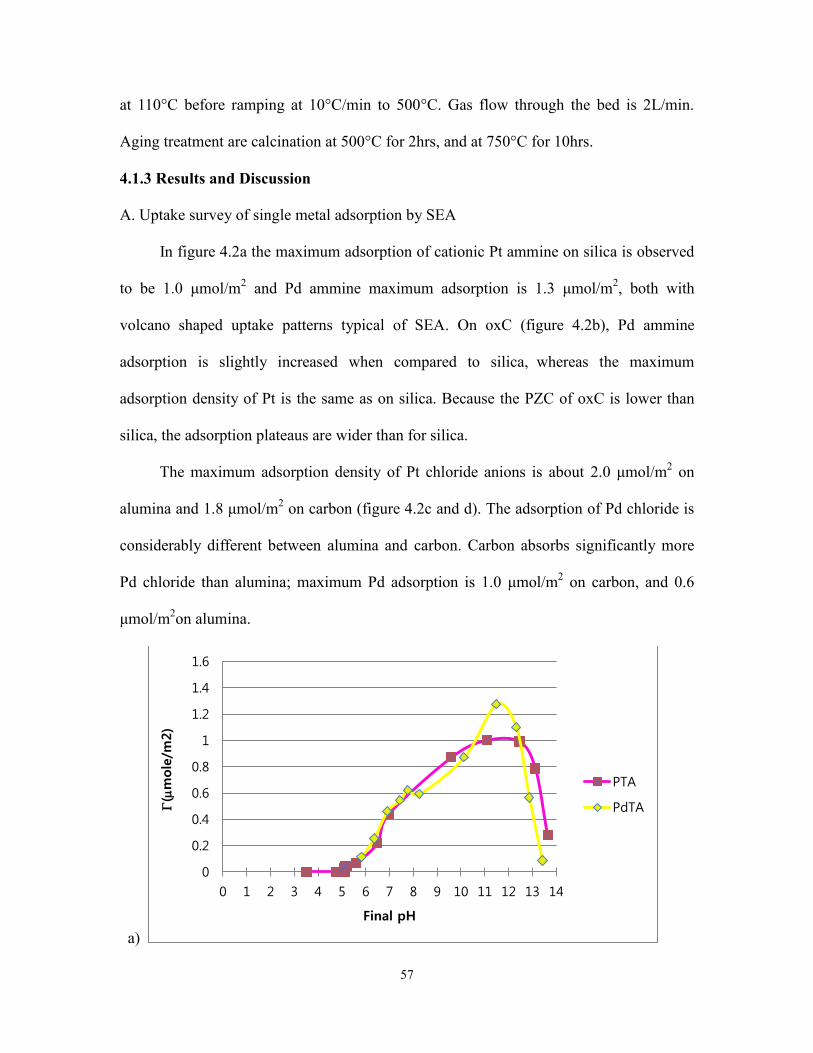
57
at 110°C before ramping at 10°C/min to 500°C. Gas flow through the bed is 2L/min.
Aging treatment are calcination at 500°C for 2hrs, and at 750°C for 10hrs.
4.1.3 Results and Discussion
A. Uptake survey of single metal adsorption by SEA
In figure 4.2a the maximum adsorption of cationic Pt ammine on silica is observed
to be 1.0 μmol/m2 and Pd ammine maximum adsorption is 1.3 μmol/m
2, both with
volcano shaped uptake patterns typical of SEA. On oxC (figure 4.2b), Pd ammine
adsorption is slightly increased when compared to silica,
whereas the maximum
adsorption density of Pt is the same as on silica. Because the PZC of oxC is lower than
silica, the adsorption plateaus are wider than for silica.
The maximum adsorption density of Pt chloride anions is about 2.0 μmol/m2 on
alumina and 1.8 μmol/m2 on carbon (figure 4.2c and d). The adsorption of Pd chloride is
considerably different between alumina and carbon. Carbon absorbs significantly more
Pd chloride than alumina; maximum Pd adsorption is 1.0 μmol/m2 on carbon, and 0.6
μmol/m2on alumina.
a)
0
0.2
0.4
0.6
0.8
1
1.2
1.4
1.6
0 1 2 3 4 5 6 7 8 9 10 11 12 13 14
G(
mole
/m2)
Final pH
PTA
PdTA
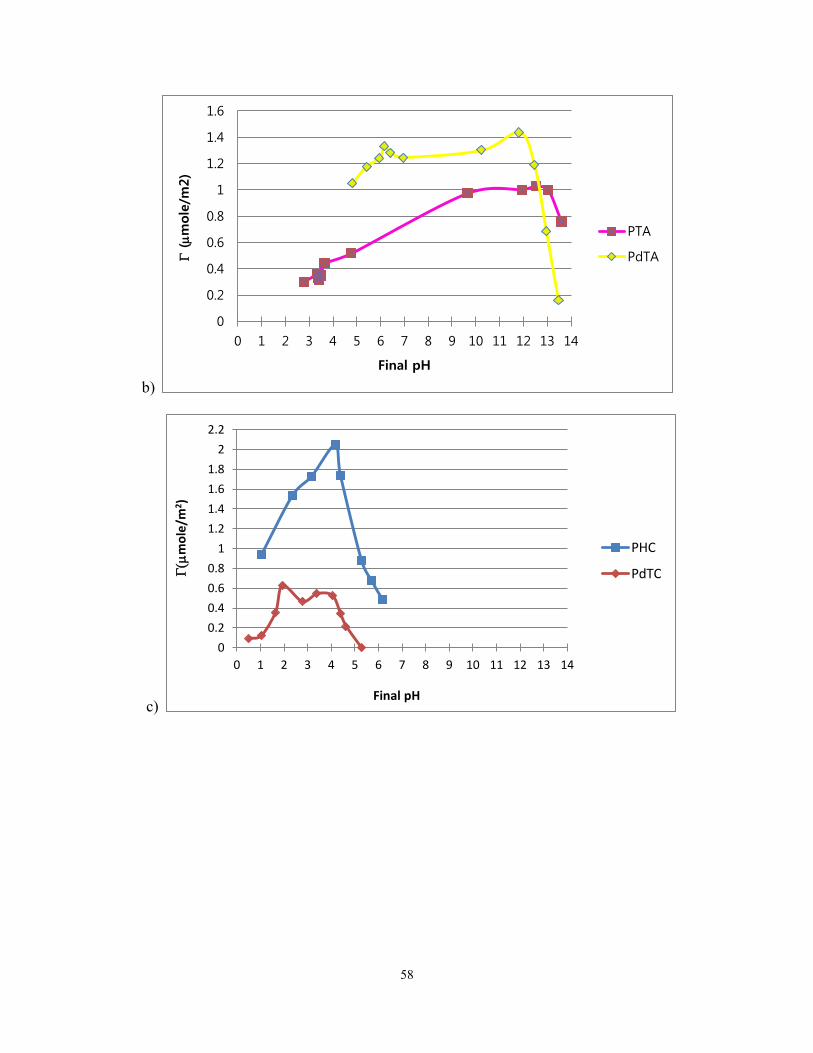
58
b)
c)
0
0.2
0.4
0.6
0.8
1
1.2
1.4
1.6
0 1 2 3 4 5 6 7 8 9 10 11 12 13 14
G (m
ole
/m2)
Final pH
PTA
PdTA
0
0.2
0.4
0.6
0.8
1
1.2
1.4
1.6
1.8
2
2.2
0 1 2 3 4 5 6 7 8 9 10 11 12 13 14
G(
mo
le/m
2 )
Final pH
PHC
PdTC
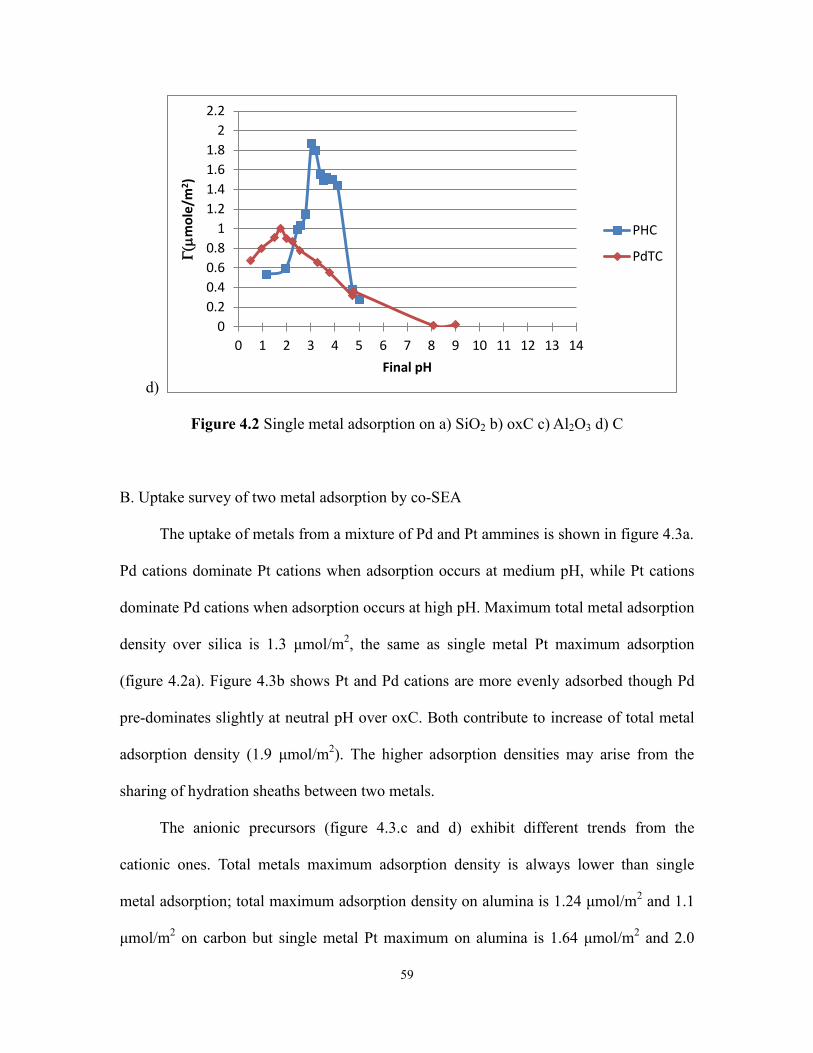
59
d)
Figure 4.2 Single metal adsorption on a) SiO2 b) oxC c) Al2O3 d) C
B. Uptake survey of two metal adsorption by co-SEA
The uptake of metals from a mixture of Pd and Pt ammines is shown in figure 4.3a.
Pd cations dominate Pt cations when adsorption occurs at medium pH, while Pt cations
dominate Pd cations when adsorption occurs at high pH. Maximum total metal adsorption
density over silica is 1.3 μmol/m2, the same as single metal Pt maximum adsorption
(figure 4.2a). Figure 4.3b shows Pt and Pd cations are more evenly adsorbed though Pd
pre-dominates slightly at neutral pH over oxC. Both contribute to increase of total metal
adsorption density (1.9 μmol/m2). The higher adsorption densities may arise from the
sharing of hydration sheaths between two metals.
The anionic precursors (figure 4.3.c and d) exhibit different trends from the
cationic ones. Total metals maximum adsorption density is always lower than single
metal adsorption; total maximum adsorption density on alumina is 1.24 μmol/m2 and 1.1
μmol/m2 on carbon but single metal Pt maximum on alumina is 1.64 μmol/m
2 and 2.0
0
0.2
0.4
0.6
0.8
1
1.2
1.4
1.6
1.8
2
2.2
0 1 2 3 4 5 6 7 8 9 10 11 12 13 14
G(
mo
le/m
2)
Final pH
PHC
PdTC
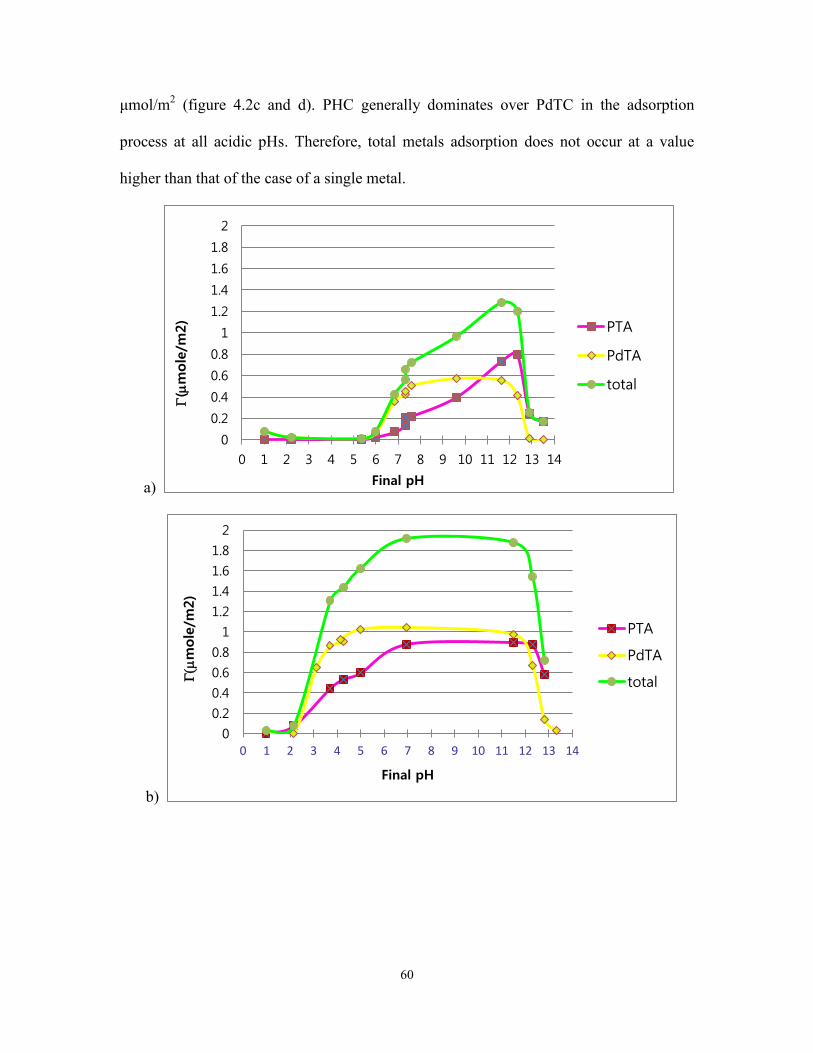
60
μmol/m2 (figure 4.2c and d). PHC generally dominates over PdTC in the adsorption
process at all acidic pHs. Therefore, total metals adsorption does not occur at a value
higher than that of the case of a single metal.
a)
b)
0
0.2
0.4
0.6
0.8
1
1.2
1.4
1.6
1.8
2
0 1 2 3 4 5 6 7 8 9 10 11 12 13 14
G(
mole
/m2)
Final pH
PTA
PdTA
total
0
0.2
0.4
0.6
0.8
1
1.2
1.4
1.6
1.8
2
0 1 2 3 4 5 6 7 8 9 10 11 12 13 14
G(
mole
/m2)
Final pH
PTA
PdTA
total
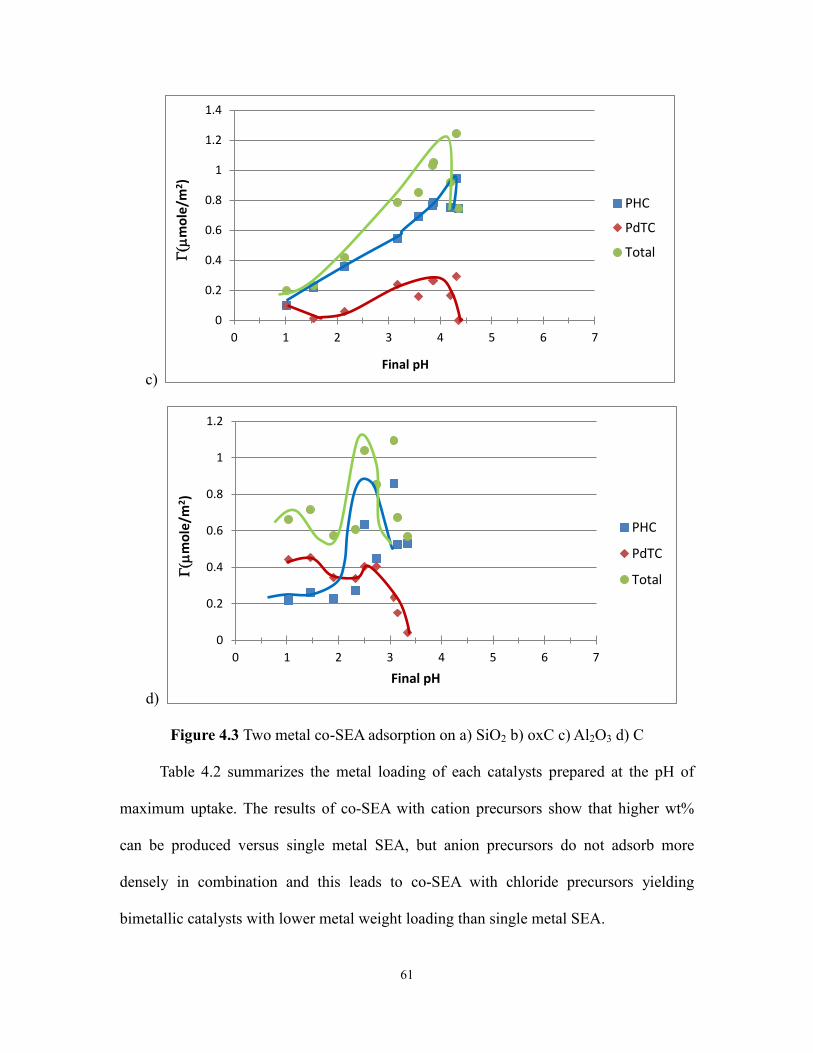
61
c)
d)
Figure 4.3 Two metal co-SEA adsorption on a) SiO2 b) oxC c) Al2O3 d) C
Table 4.2 summarizes the metal loading of each catalysts prepared at the pH of
maximum uptake. The results of co-SEA with cation precursors show that higher wt%
can be produced versus single metal SEA, but anion precursors do not adsorb more
densely in combination and this leads to co-SEA with chloride precursors yielding
bimetallic catalysts with lower metal weight loading than single metal SEA.
0
0.2
0.4
0.6
0.8
1
1.2
1.4
0 1 2 3 4 5 6 7
G(
mo
le/m
2)
Final pH
PHC
PdTC
Total
0
0.2
0.4
0.6
0.8
1
1.2
0 1 2 3 4 5 6 7
G(
mo
le/m
2)
Final pH
PHC
PdTC
Total
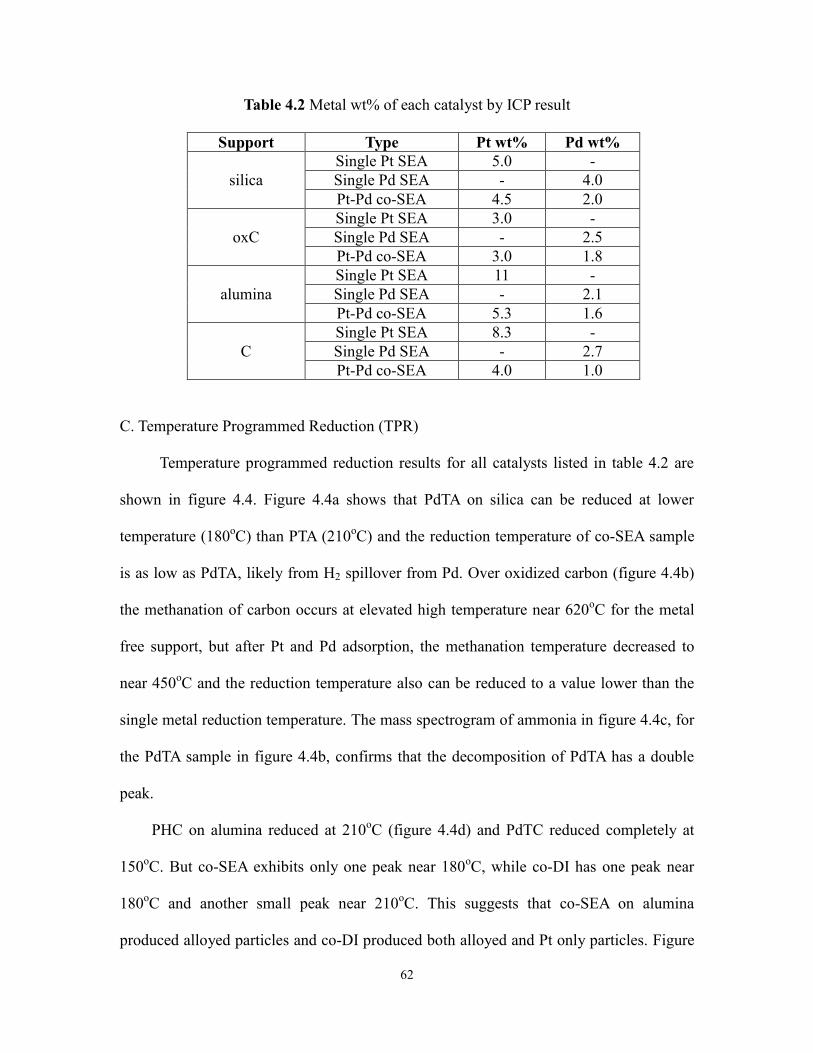
62
Table 4.2 Metal wt% of each catalyst by ICP result
Support Type Pt wt% Pd wt%
silica
Single Pt SEA 5.0 -
Single Pd SEA - 4.0
Pt-Pd co-SEA 4.5 2.0
oxC
Single Pt SEA 3.0 -
Single Pd SEA - 2.5
Pt-Pd co-SEA 3.0 1.8
alumina
Single Pt SEA 11 -
Single Pd SEA - 2.1
Pt-Pd co-SEA 5.3 1.6
C
Single Pt SEA 8.3 -
Single Pd SEA - 2.7
Pt-Pd co-SEA 4.0 1.0
C. Temperature Programmed Reduction (TPR)
Temperature programmed reduction results for all catalysts listed in table 4.2 are
shown in figure 4.4. Figure 4.4a shows that PdTA on silica can be reduced at lower
temperature (180oC) than PTA (210
oC) and the reduction temperature of co-SEA sample
is as low as PdTA, likely from H2 spillover from Pd. Over oxidized carbon (figure 4.4b)
the methanation of carbon occurs at elevated high temperature near 620oC for the metal
free support, but after Pt and Pd adsorption, the methanation temperature decreased to
near 450oC and the reduction temperature also can be reduced to a value lower than the
single metal reduction temperature. The mass spectrogram of ammonia in figure 4.4c, for
the PdTA sample in figure 4.4b, confirms that the decomposition of PdTA has a double
peak.
PHC on alumina reduced at 210oC (figure 4.4d) and PdTC reduced completely at
150oC. But co-SEA exhibits only one peak near 180
oC, while co-DI has one peak near
180oC and another small peak near 210
oC. This suggests that co-SEA on alumina
produced alloyed particles and co-DI produced both alloyed and Pt only particles. Figure
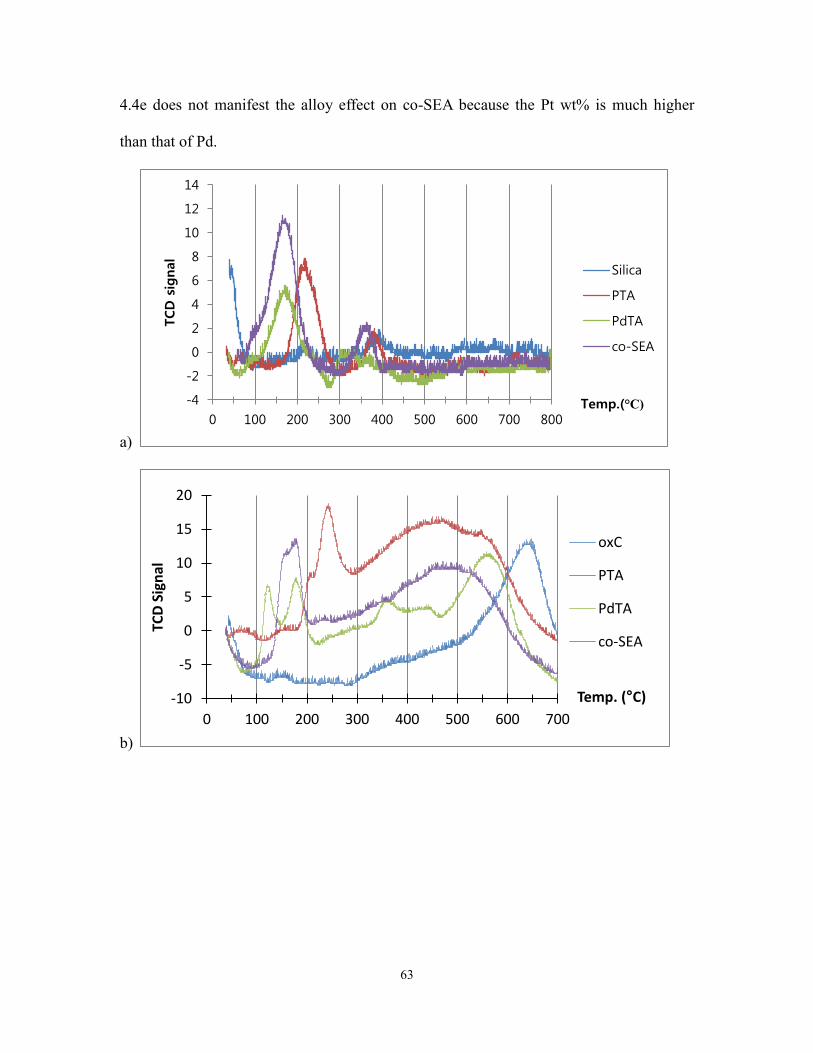
63
4.4e does not manifest the alloy effect on co-SEA because the Pt wt% is much higher
than that of Pd.
a)
b)
-4
-2
0
2
4
6
8
10
12
14
0 100 200 300 400 500 600 700 800
TCD
sig
nal
Temp.(°C)
Silica
PTA
PdTA
co-SEA
-10
-5
0
5
10
15
20
0 100 200 300 400 500 600 700
TCD
Sig
nal
Temp. (°C)
oxC
PTA
PdTA
co-SEA
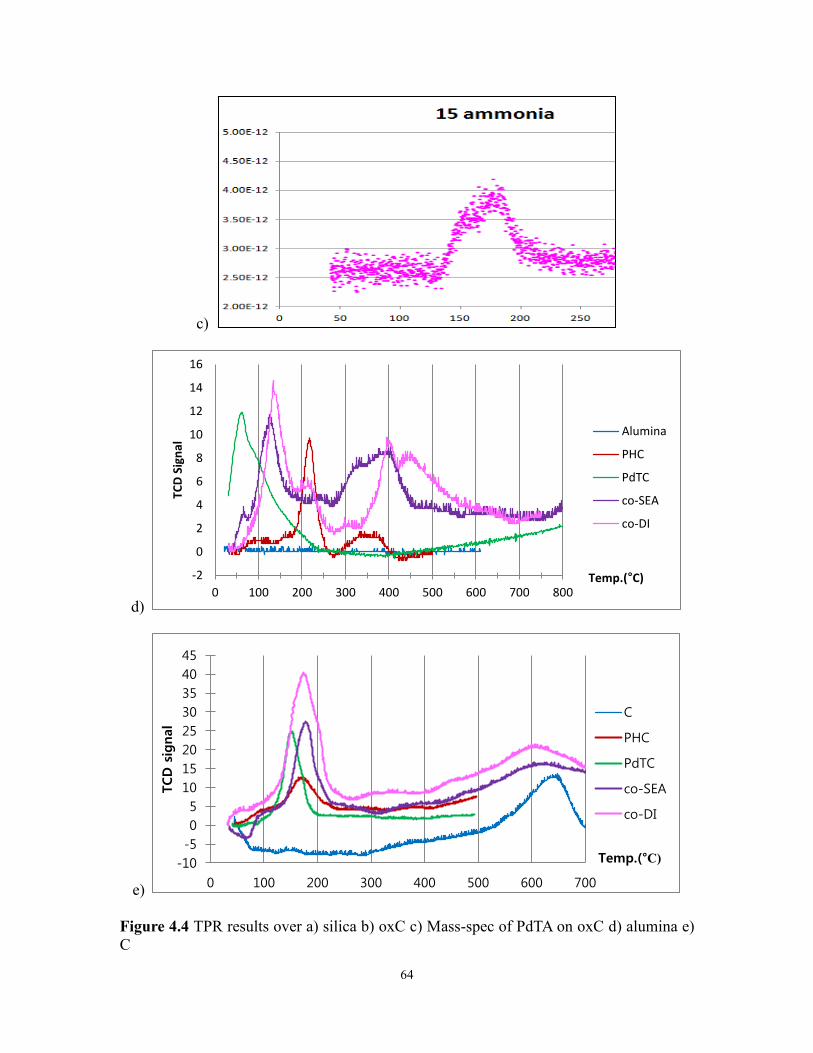
64
c)
d)
e)
Figure 4.4 TPR results over a) silica b) oxC c) Mass-spec of PdTA on oxC d) alumina e)
C
-2
0
2
4
6
8
10
12
14
16
0 100 200 300 400 500 600 700 800
TCD
Sig
nal
Temp.(°C)
Alumina
PHC
PdTC
co-SEA
co-DI
-10
-5
0
5
10
15
20
25
30
35
40
45
0 100 200 300 400 500 600 700
TCD
sig
nal
Temp.(°C)
C
PHC
PdTC
co-SEA
co-DI
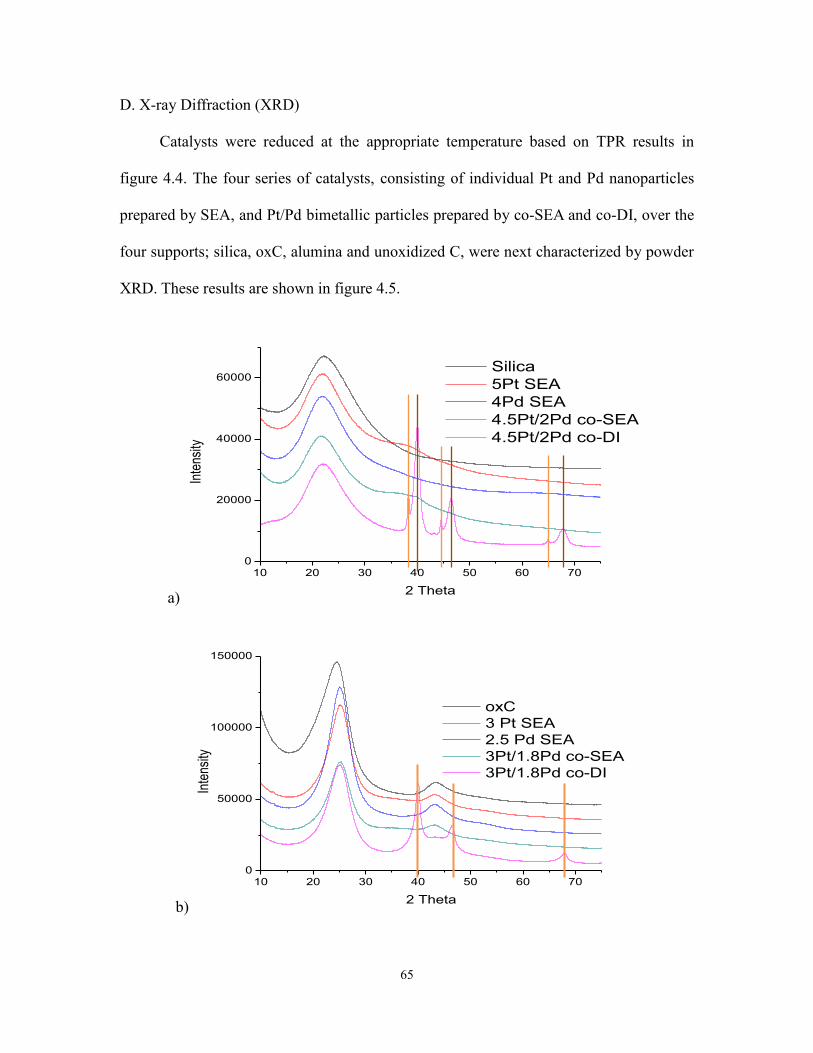
65
D. X-ray Diffraction (XRD)
Catalysts were reduced at the appropriate temperature based on TPR results in
figure 4.4. The four series of catalysts, consisting of individual Pt and Pd nanoparticles
prepared by SEA, and Pt/Pd bimetallic particles prepared by co-SEA and co-DI, over the
four supports; silica, oxC, alumina and unoxidized C, were next characterized by powder
XRD. These results are shown in figure 4.5.
a)
b)
10 20 30 40 50 60 700
20000
40000
60000 Silica
5Pt SEA
4Pd SEA
4.5Pt/2Pd co-SEA
4.5Pt/2Pd co-DI
Inte
nsity
2 Theta
10 20 30 40 50 60 700
50000
100000
150000
oxC
3 Pt SEA
2.5 Pd SEA
3Pt/1.8Pd co-SEA
3Pt/1.8Pd co-DI
Inte
nsity
2 Theta
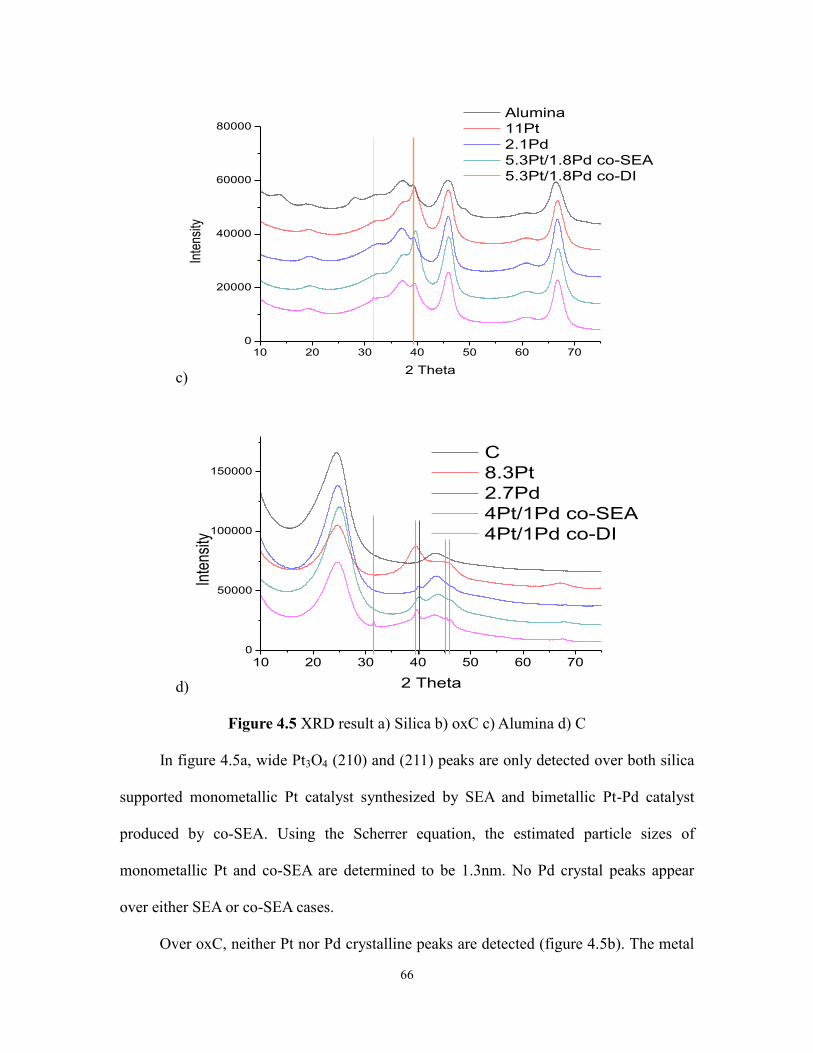
66
c)
d)
Figure 4.5 XRD result a) Silica b) oxC c) Alumina d) C
In figure 4.5a, wide Pt3O4 (210) and (211) peaks are only detected over both silica
supported monometallic Pt catalyst synthesized by SEA and bimetallic Pt-Pd catalyst
produced by co-SEA. Using the Scherrer equation, the estimated particle sizes of
monometallic Pt and co-SEA are determined to be 1.3nm. No Pd crystal peaks appear
over either SEA or co-SEA cases.
Over oxC, neither Pt nor Pd crystalline peaks are detected (figure 4.5b). The metal
10 20 30 40 50 60 700
20000
40000
60000
80000
Alumina
11Pt
2.1Pd
5.3Pt/1.8Pd co-SEA
5.3Pt/1.8Pd co-DI
Inte
nsity
2 Theta
10 20 30 40 50 60 700
50000
100000
150000
C
8.3Pt
2.7Pd
4Pt/1Pd co-SEA
4Pt/1Pd co-DI
Inte
nsity
2 Theta
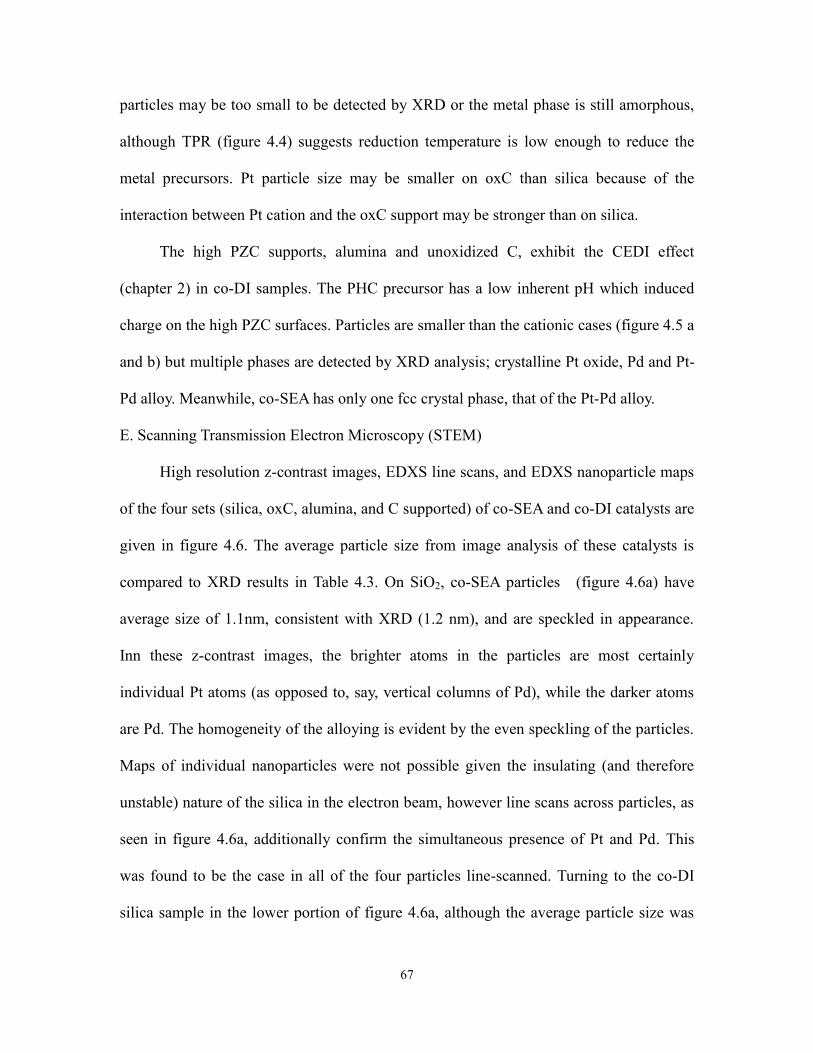
67
particles may be too small to be detected by XRD or the metal phase is still amorphous,
although TPR (figure 4.4) suggests reduction temperature is low enough to reduce the
metal precursors. Pt particle size may be smaller on oxC than silica because of the
interaction between Pt cation and the oxC support may be stronger than on silica.
The high PZC supports, alumina and unoxidized C, exhibit the CEDI effect
(chapter 2) in co-DI samples. The PHC precursor has a low inherent pH which induced
charge on the high PZC surfaces. Particles are smaller than the cationic cases (figure 4.5 a
and b) but multiple phases are detected by XRD analysis; crystalline Pt oxide, Pd and Pt-
Pd alloy. Meanwhile, co-SEA has only one fcc crystal phase, that of the Pt-Pd alloy.
E. Scanning Transmission Electron Microscopy (STEM)
High resolution z-contrast images, EDXS line scans, and EDXS nanoparticle maps
of the four sets (silica, oxC, alumina, and C supported) of co-SEA and co-DI catalysts are
given in figure 4.6. The average particle size from image analysis of these catalysts is
compared to XRD results in Table 4.3. On SiO2, co-SEA particles (figure 4.6a) have
average size of 1.1nm, consistent with XRD (1.2 nm), and are speckled in appearance.
Inn these z-contrast images, the brighter atoms in the particles are most certainly
individual Pt atoms (as opposed to, say, vertical columns of Pd), while the darker atoms
are Pd. The homogeneity of the alloying is evident by the even speckling of the particles.
Maps of individual nanoparticles were not possible given the insulating (and therefore
unstable) nature of the silica in the electron beam, however line scans across particles, as
seen in figure 4.6a, additionally confirm the simultaneous presence of Pt and Pd. This
was found to be the case in all of the four particles line-scanned. Turning to the co-DI
silica sample in the lower portion of figure 4.6a, although the average particle size was
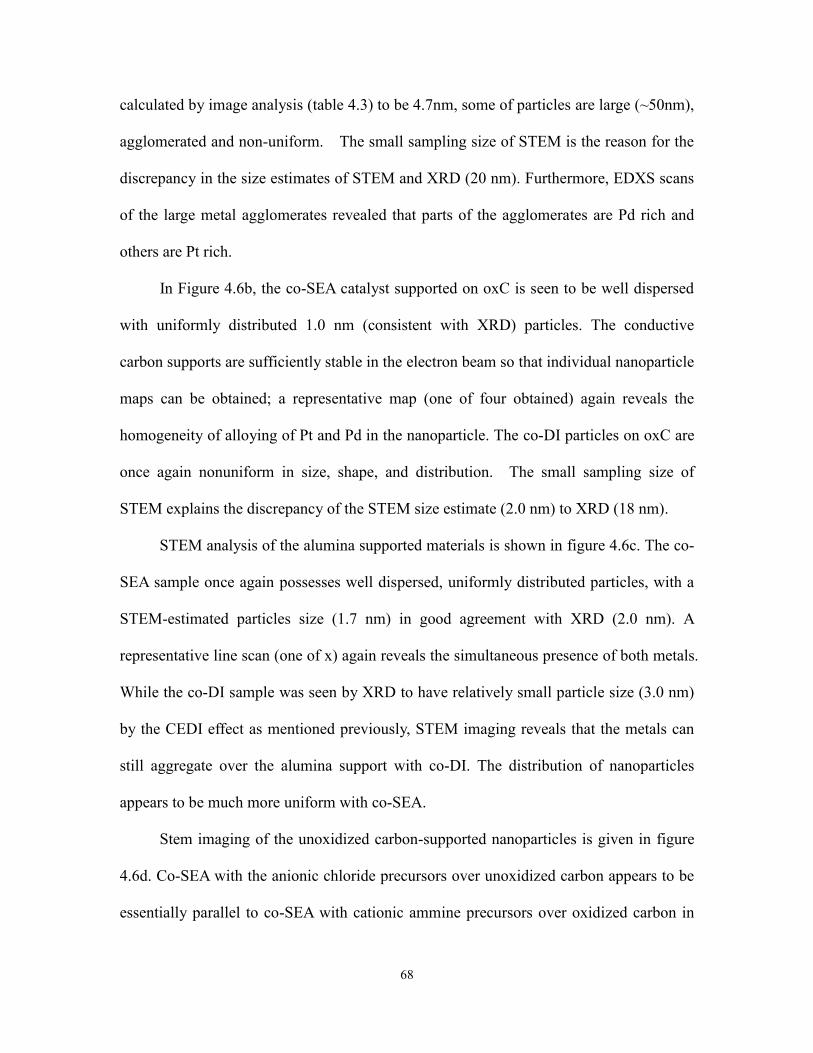
68
calculated by image analysis (table 4.3) to be 4.7nm, some of particles are large (~50nm),
agglomerated and non-uniform. The small sampling size of STEM is the reason for the
discrepancy in the size estimates of STEM and XRD (20 nm). Furthermore, EDXS scans
of the large metal agglomerates revealed that parts of the agglomerates are Pd rich and
others are Pt rich.
In Figure 4.6b, the co-SEA catalyst supported on oxC is seen to be well dispersed
with uniformly distributed 1.0 nm (consistent with XRD) particles. The conductive
carbon supports are sufficiently stable in the electron beam so that individual nanoparticle
maps can be obtained; a representative map (one of four obtained) again reveals the
homogeneity of alloying of Pt and Pd in the nanoparticle. The co-DI particles on oxC are
once again nonuniform in size, shape, and distribution. The small sampling size of
STEM explains the discrepancy of the STEM size estimate (2.0 nm) to XRD (18 nm).
STEM analysis of the alumina supported materials is shown in figure 4.6c. The co-
SEA sample once again possesses well dispersed, uniformly distributed particles, with a
STEM-estimated particles size (1.7 nm) in good agreement with XRD (2.0 nm). A
representative line scan (one of x) again reveals the simultaneous presence of both metals.
While the co-DI sample was seen by XRD to have relatively small particle size (3.0 nm)
by the CEDI effect as mentioned previously, STEM imaging reveals that the metals can
still aggregate over the alumina support with co-DI. The distribution of nanoparticles
appears to be much more uniform with co-SEA.
Stem imaging of the unoxidized carbon-supported nanoparticles is given in figure
4.6d. Co-SEA with the anionic chloride precursors over unoxidized carbon appears to be
essentially parallel to co-SEA with cationic ammine precursors over oxidized carbon in
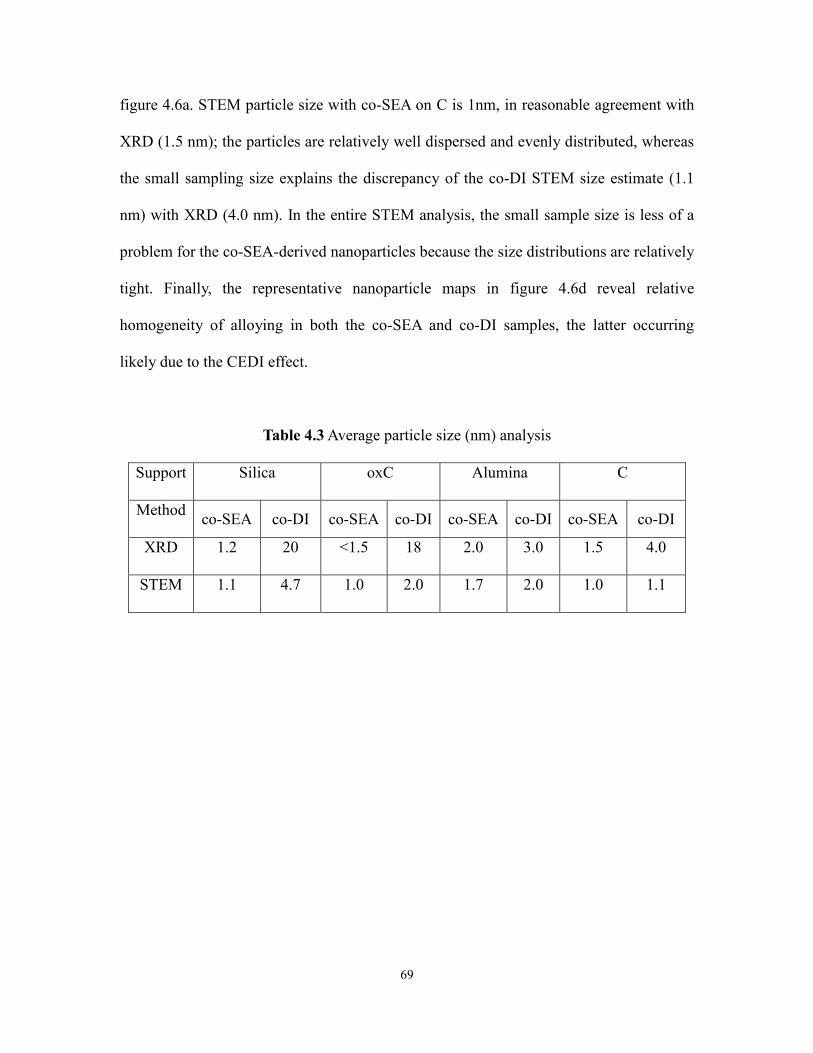
69
figure 4.6a. STEM particle size with co-SEA on C is 1nm, in reasonable agreement with
XRD (1.5 nm); the particles are relatively well dispersed and evenly distributed, whereas
the small sampling size explains the discrepancy of the co-DI STEM size estimate (1.1
nm) with XRD (4.0 nm). In the entire STEM analysis, the small sample size is less of a
problem for the co-SEA-derived nanoparticles because the size distributions are relatively
tight. Finally, the representative nanoparticle maps in figure 4.6d reveal relative
homogeneity of alloying in both the co-SEA and co-DI samples, the latter occurring
likely due to the CEDI effect.
Table 4.3 Average particle size (nm) analysis
Support Silica oxC Alumina C
Method co-SEA co-DI co-SEA co-DI co-SEA co-DI co-SEA co-DI
XRD 1.2 20 <1.5 18 2.0 3.0 1.5 4.0
STEM 1.1 4.7 1.0 2.0 1.7 2.0 1.0 1.1
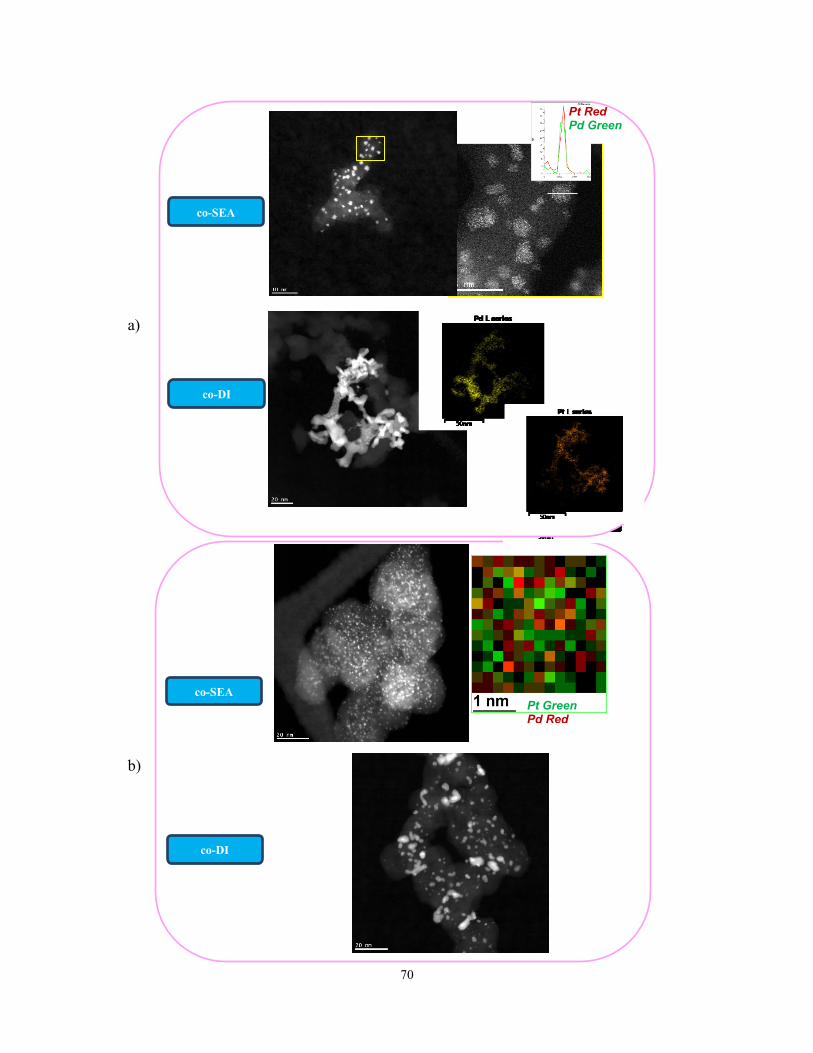
70
a)
b)
co-DI
co-SEA
co-DI
co-SEA Pt Green Pd Red
Pt Red Pd Green
co-DI
co-SEA
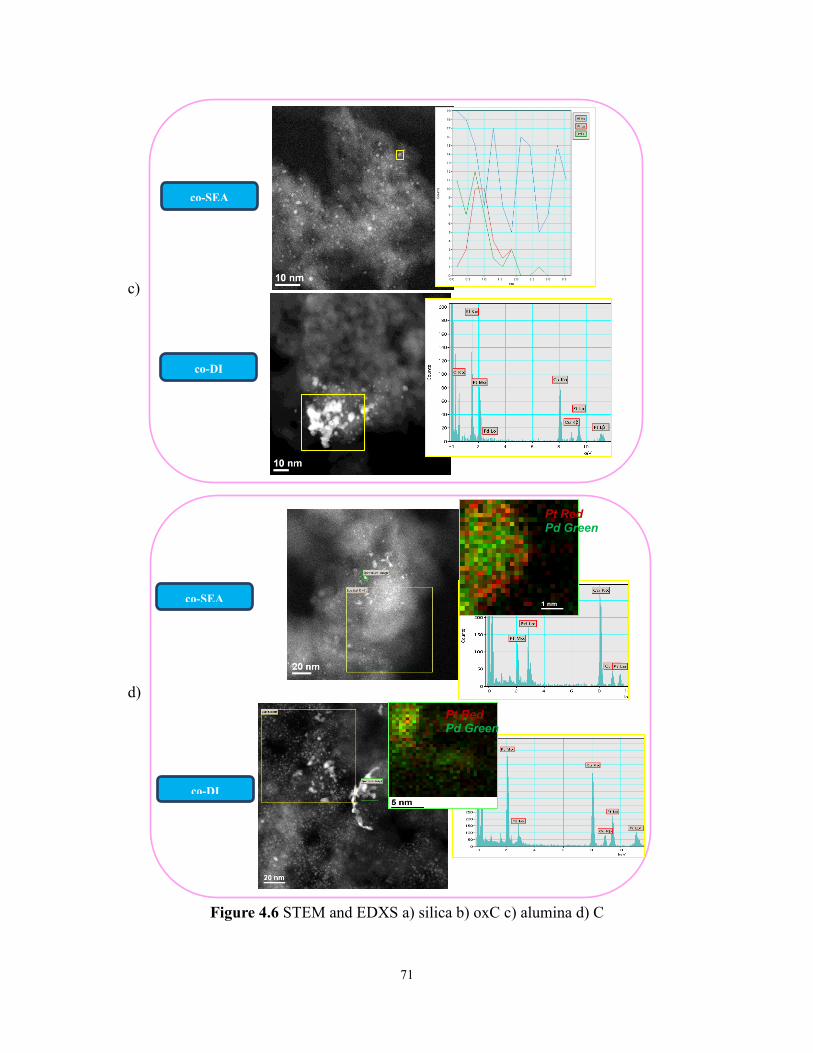
71
c)
d)
Figure 4.6 STEM and EDXS a) silica b) oxC c) alumina d) C
co-DI
co-SEA
co-DI
co-SEA
Pt Red Pd Green
Pt Red Pd Green
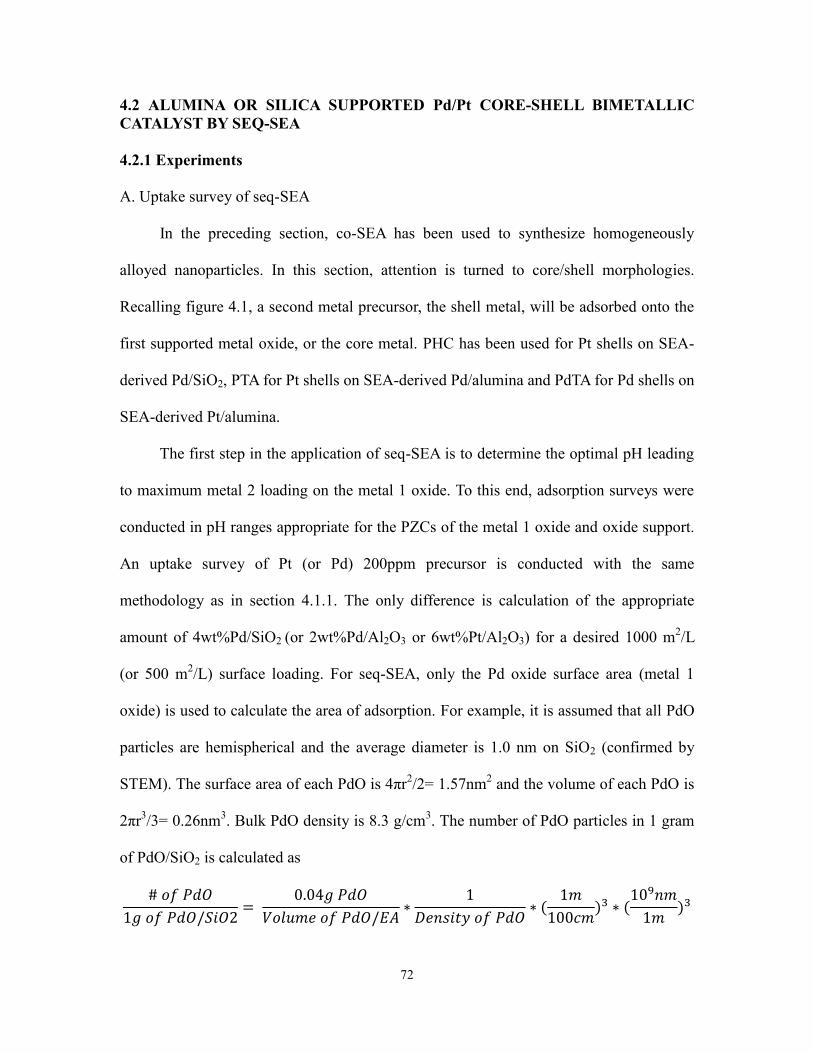
72
4.2 ALUMINA OR SILICA SUPPORTED Pd/Pt CORE-SHELL BIMETALLIC
CATALYST BY SEQ-SEA
4.2.1 Experiments
A. Uptake survey of seq-SEA
In the preceding section, co-SEA has been used to synthesize homogeneously
alloyed nanoparticles. In this section, attention is turned to core/shell morphologies.
Recalling figure 4.1, a second metal precursor, the shell metal, will be adsorbed onto the
first supported metal oxide, or the core metal. PHC has been used for Pt shells on SEA-
derived Pd/SiO2, PTA for Pt shells on SEA-derived Pd/alumina and PdTA for Pd shells on
SEA-derived Pt/alumina.
The first step in the application of seq-SEA is to determine the optimal pH leading
to maximum metal 2 loading on the metal 1 oxide. To this end, adsorption surveys were
conducted in pH ranges appropriate for the PZCs of the metal 1 oxide and oxide support.
An uptake survey of Pt (or Pd) 200ppm precursor is conducted with the same
methodology as in section 4.1.1. The only difference is calculation of the appropriate
amount of 4wt%Pd/SiO2 (or 2wt%Pd/Al2O3 or 6wt%Pt/Al2O3) for a desired 1000 m2/L
(or 500 m2/L) surface loading. For seq-SEA, only the Pd oxide surface area (metal 1
oxide) is used to calculate the area of adsorption. For example, it is assumed that all PdO
particles are hemispherical and the average diameter is 1.0 nm on SiO2 (confirmed by
STEM). The surface area of each PdO is 4πr2/2= 1.57nm
2 and the volume of each PdO is
2πr3/3= 0.26nm
3. Bulk PdO density is 8.3 g/cm
3. The number of PdO particles in 1 gram
of PdO/SiO2 is calculated as
# 𝑜𝑓 𝑃𝑑𝑂
1𝑔 𝑜𝑓 𝑃𝑑𝑂/𝑆𝑖𝑂2=
0.04𝑔 𝑃𝑑𝑂
𝑉𝑜𝑙𝑢𝑚𝑒 𝑜𝑓 𝑃𝑑𝑂/𝐸𝐴∗
1
𝐷𝑒𝑛𝑠𝑖𝑡𝑦 𝑜𝑓 𝑃𝑑𝑂∗ (
1𝑚
100𝑐𝑚)3 ∗ (
109𝑛𝑚
1𝑚)3
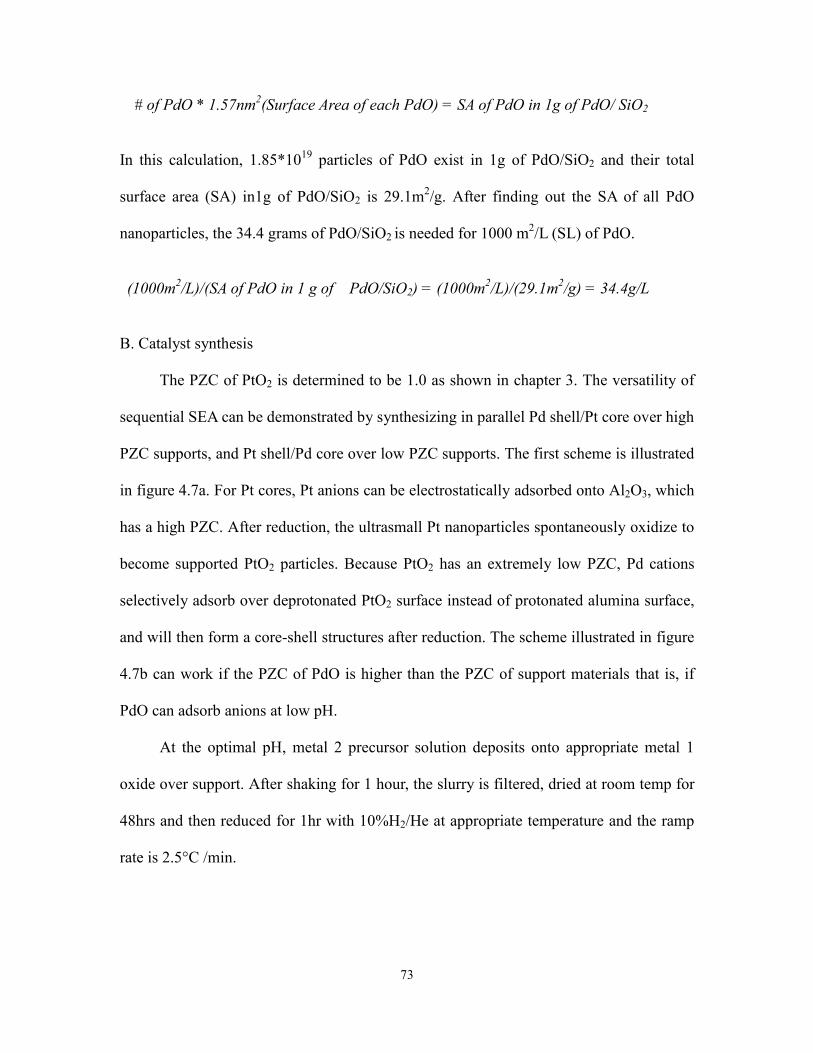
73
# of PdO * 1.57nm2(Surface Area of each PdO) = SA of PdO in 1g of PdO/ SiO2
In this calculation, 1.85*1019
particles of PdO exist in 1g of PdO/SiO2 and their total
surface area (SA) in1g of PdO/SiO2 is 29.1m2/g. After finding out the SA of all PdO
nanoparticles, the 34.4 grams of PdO/SiO2 is needed for 1000 m2/L (SL) of PdO.
(1000m2/L)/(SA of PdO in 1 g of PdO/SiO2) = (1000m
2/L)/(29.1m
2/g) = 34.4g/L
B. Catalyst synthesis
The PZC of PtO2 is determined to be 1.0 as shown in chapter 3. The versatility of
sequential SEA can be demonstrated by synthesizing in parallel Pd shell/Pt core over high
PZC supports, and Pt shell/Pd core over low PZC supports. The first scheme is illustrated
in figure 4.7a. For Pt cores, Pt anions can be electrostatically adsorbed onto Al2O3, which
has a high PZC. After reduction, the ultrasmall Pt nanoparticles spontaneously oxidize to
become supported PtO2 particles. Because PtO2 has an extremely low PZC, Pd cations
selectively adsorb over deprotonated PtO2 surface instead of protonated alumina surface,
and will then form a core-shell structures after reduction. The scheme illustrated in figure
4.7b can work if the PZC of PdO is higher than the PZC of support materials that is, if
PdO can adsorb anions at low pH.
At the optimal pH, metal 2 precursor solution deposits onto appropriate metal 1
oxide over support. After shaking for 1 hour, the slurry is filtered, dried at room temp for
48hrs and then reduced for 1hr with 10%H2/He at appropriate temperature and the ramp
rate is 2.5°C /min.
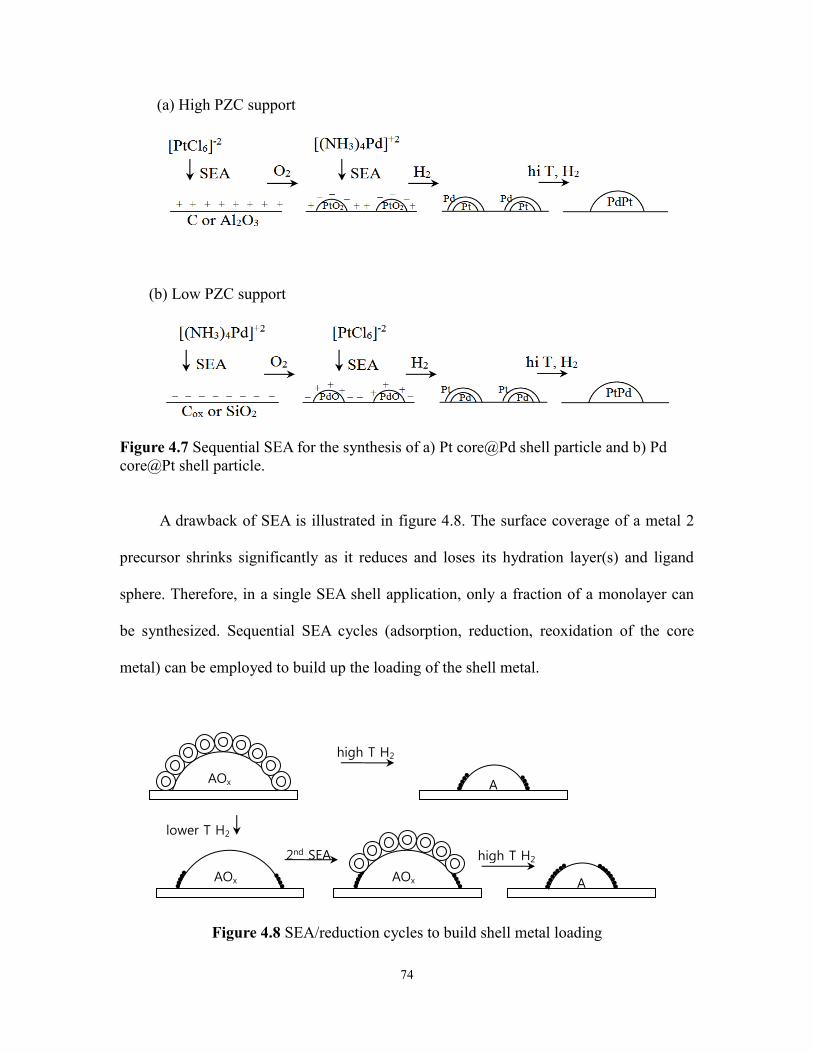
74
(a) High PZC support
(b) Low PZC support
Figure 4.7 Sequential SEA for the synthesis of a) Pt core@Pd shell particle and b) Pd
core@Pt shell particle.
A drawback of SEA is illustrated in figure 4.8. The surface coverage of a metal 2
precursor shrinks significantly as it reduces and loses its hydration layer(s) and ligand
sphere. Therefore, in a single SEA shell application, only a fraction of a monolayer can
be synthesized. Sequential SEA cycles (adsorption, reduction, reoxidation of the core
metal) can be employed to build up the loading of the shell metal.
Figure 4.8 SEA/reduction cycles to build shell metal loading
AOx
AOx
AOx A
A
lower T H2
high T H2
2nd SEA high T H2
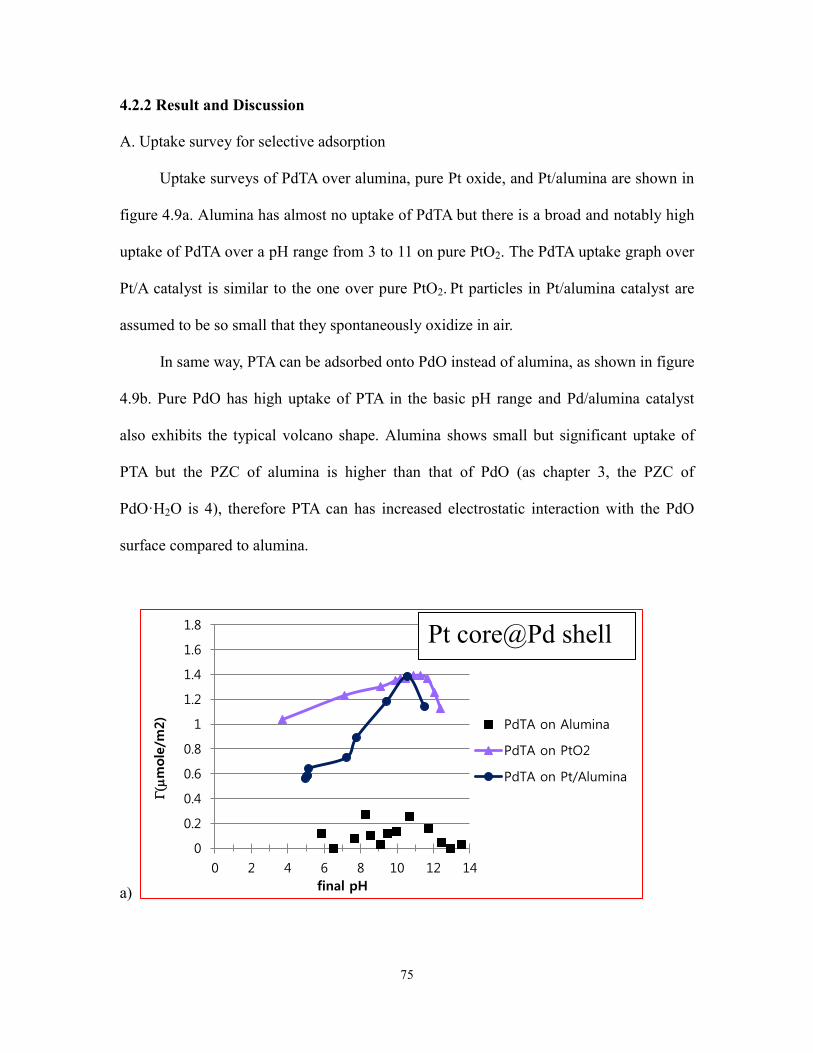
75
4.2.2 Result and Discussion
A. Uptake survey for selective adsorption
Uptake surveys of PdTA over alumina, pure Pt oxide, and Pt/alumina are shown in
figure 4.9a. Alumina has almost no uptake of PdTA but there is a broad and notably high
uptake of PdTA over a pH range from 3 to 11 on pure PtO2. The PdTA uptake graph over
Pt/A catalyst is similar to the one over pure PtO2. Pt particles in Pt/alumina catalyst are
assumed to be so small that they spontaneously oxidize in air.
In same way, PTA can be adsorbed onto PdO instead of alumina, as shown in figure
4.9b. Pure PdO has high uptake of PTA in the basic pH range and Pd/alumina catalyst
also exhibits the typical volcano shape. Alumina shows small but significant uptake of
PTA but the PZC of alumina is higher than that of PdO (as chapter 3, the PZC of
PdO·H2O is 4), therefore PTA can has increased electrostatic interaction with the PdO
surface compared to alumina.
a)
0
0.2
0.4
0.6
0.8
1
1.2
1.4
1.6
1.8
0 2 4 6 8 10 12 14
G(
mole
/m2)
final pH
PdTA on Alumina
PdTA on PtO2
PdTA on Pt/Alumina
Pt core@Pd shell
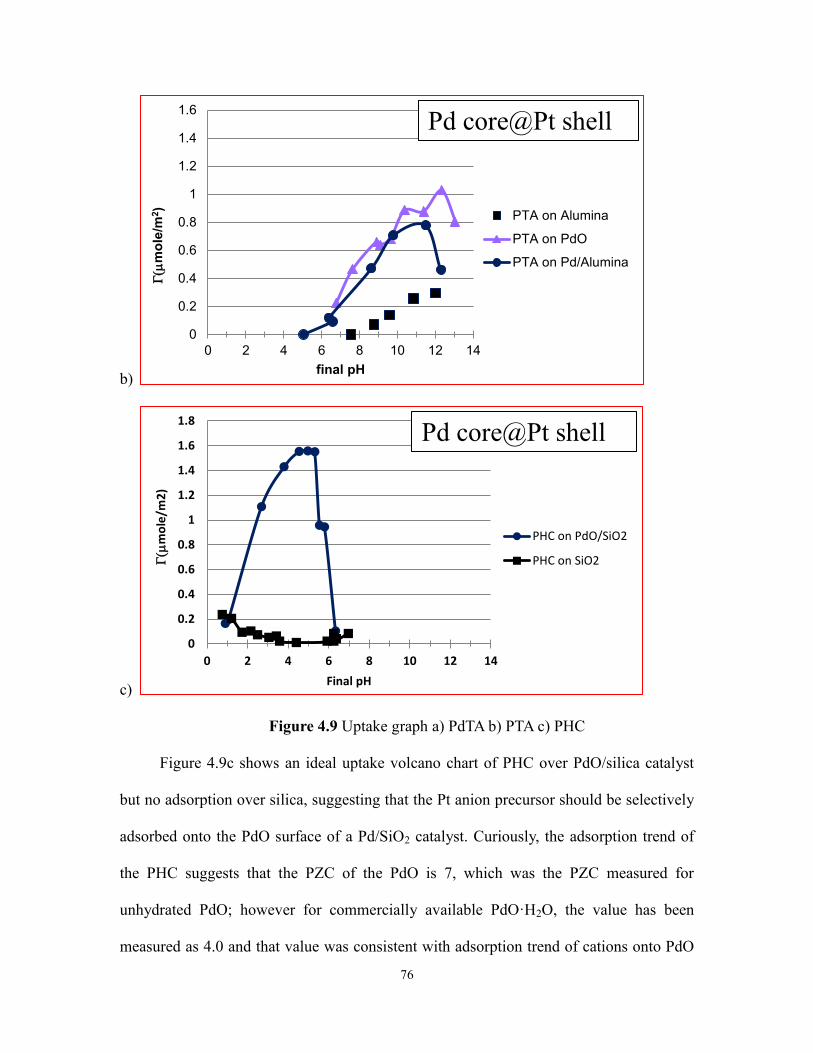
76
b)
c)
Figure 4.9 Uptake graph a) PdTA b) PTA c) PHC
Figure 4.9c shows an ideal uptake volcano chart of PHC over PdO/silica catalyst
but no adsorption over silica, suggesting that the Pt anion precursor should be selectively
adsorbed onto the PdO surface of a Pd/SiO2 catalyst. Curiously, the adsorption trend of
the PHC suggests that the PZC of the PdO is 7, which was the PZC measured for
unhydrated PdO; however for commercially available PdO·H2O, the value has been
measured as 4.0 and that value was consistent with adsorption trend of cations onto PdO
0
0.2
0.4
0.6
0.8
1
1.2
1.4
1.6
0 2 4 6 8 10 12 14
G(
mo
le/m
2)
final pH
PTA on Alumina
PTA on PdO
PTA on Pd/Alumina
0
0.2
0.4
0.6
0.8
1
1.2
1.4
1.6
1.8
0 2 4 6 8 10 12 14
G(
mo
le/m
2)
Final pH
PHC on PdO/SiO2
PHC on SiO2
Pd core@Pt shell
Pd core@Pt shell
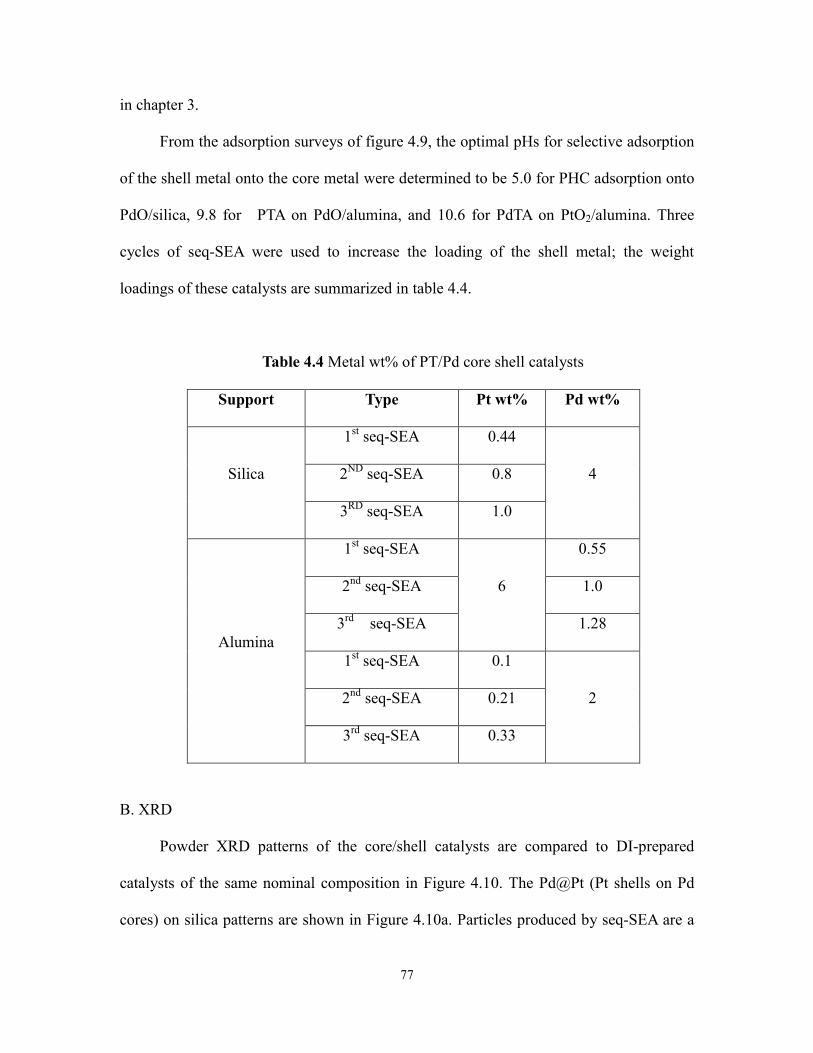
77
in chapter 3.
From the adsorption surveys of figure 4.9, the optimal pHs for selective adsorption
of the shell metal onto the core metal were determined to be 5.0 for PHC adsorption onto
PdO/silica, 9.8 for PTA on PdO/alumina, and 10.6 for PdTA on PtO2/alumina. Three
cycles of seq-SEA were used to increase the loading of the shell metal; the weight
loadings of these catalysts are summarized in table 4.4.
Table 4.4 Metal wt% of PT/Pd core shell catalysts
Support Type Pt wt% Pd wt%
Silica
1st seq-SEA 0.44
4 2ND
seq-SEA 0.8
3RD
seq-SEA 1.0
Alumina
1st seq-SEA
6
0.55
2nd
seq-SEA 1.0
3rd
seq-SEA 1.28
1st seq-SEA 0.1
2 2nd
seq-SEA 0.21
3rd
seq-SEA 0.33
B. XRD
Powder XRD patterns of the core/shell catalysts are compared to DI-prepared
catalysts of the same nominal composition in Figure 4.10. The Pd@Pt (Pt shells on Pd
cores) on silica patterns are shown in Figure 4.10a. Particles produced by seq-SEA are a
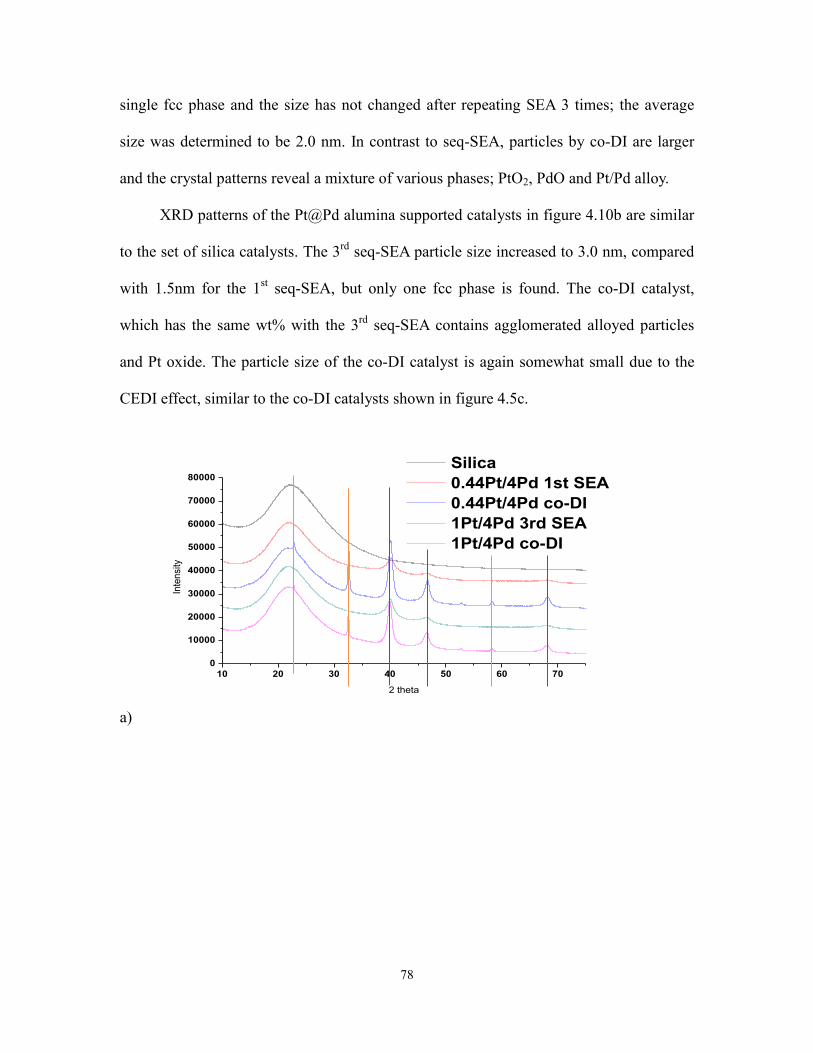
78
single fcc phase and the size has not changed after repeating SEA 3 times; the average
size was determined to be 2.0 nm. In contrast to seq-SEA, particles by co-DI are larger
and the crystal patterns reveal a mixture of various phases; PtO2, PdO and Pt/Pd alloy.
XRD patterns of the Pt@Pd alumina supported catalysts in figure 4.10b are similar
to the set of silica catalysts. The 3rd
seq-SEA particle size increased to 3.0 nm, compared
with 1.5nm for the 1st seq-SEA, but only one fcc phase is found. The co-DI catalyst,
which has the same wt% with the 3rd
seq-SEA contains agglomerated alloyed particles
and Pt oxide. The particle size of the co-DI catalyst is again somewhat small due to the
CEDI effect, similar to the co-DI catalysts shown in figure 4.5c.
a)
10 20 30 40 50 60 70
0
10000
20000
30000
40000
50000
60000
70000
80000
Silica
0.44Pt/4Pd 1st SEA
0.44Pt/4Pd co-DI
1Pt/4Pd 3rd SEA
1Pt/4Pd co-DI
Inte
nsi
ty
2 theta
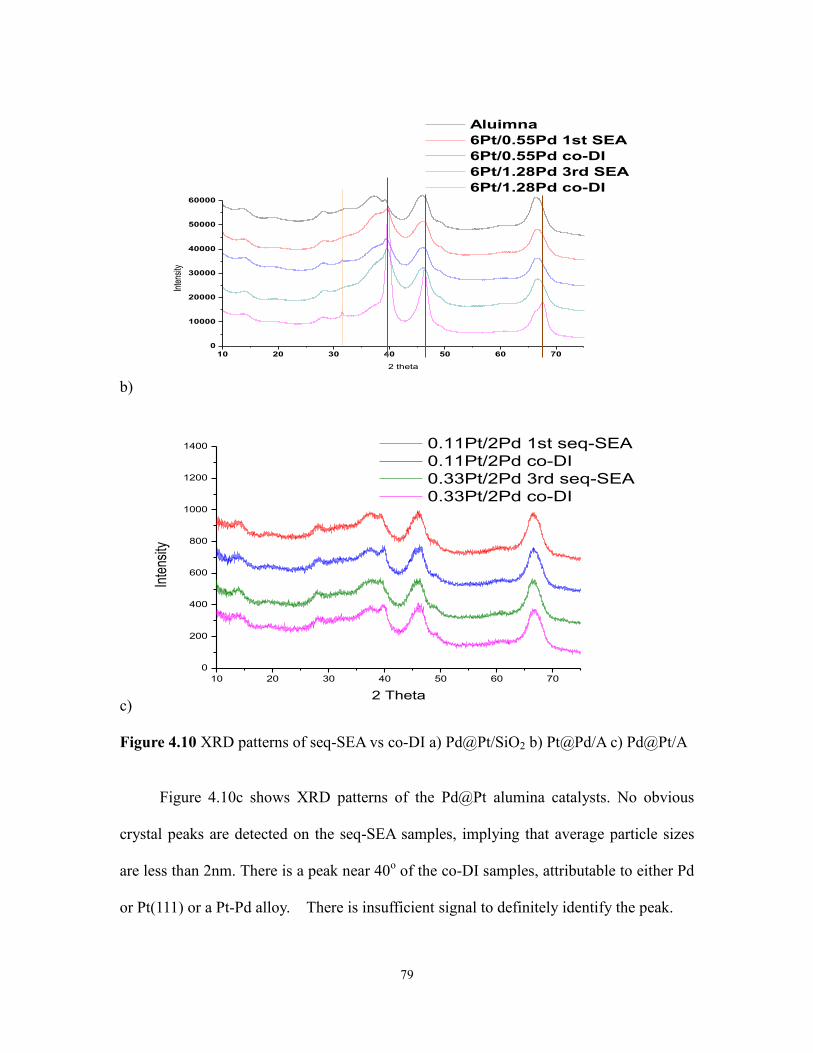
79
b)
c)
Figure 4.10 XRD patterns of seq-SEA vs co-DI a) Pd@Pt/SiO2 b) Pt@Pd/A c) Pd@Pt/A
Figure 4.10c shows XRD patterns of the Pd@Pt alumina catalysts. No obvious
crystal peaks are detected on the seq-SEA samples, implying that average particle sizes
are less than 2nm. There is a peak near 40o of the co-DI samples, attributable to either Pd
or Pt(111) or a Pt-Pd alloy. There is insufficient signal to definitely identify the peak.
10 20 30 40 50 60 70
0
200
400
600
800
1000
1200
1400 0.11Pt/2Pd 1st seq-SEA
0.11Pt/2Pd co-DI
0.33Pt/2Pd 3rd seq-SEA
0.33Pt/2Pd co-DI
Inte
nsity
2 Theta
10 20 30 40 50 60 70
0
10000
20000
30000
40000
50000
60000
Aluimna
6Pt/0.55Pd 1st SEA
6Pt/0.55Pd co-DI
6Pt/1.28Pd 3rd SEA
6Pt/1.28Pd co-DIIn
tens
ity
2 theta
80
C. STEM and EDXS
STEM and EDXS analysis of the core/shell catalysts and corresponding co-DI
catalysts of the same composition is given in figure 4.11. The Pd@Pt/silica samples are
shown in figure 4.11a. High resolution z-contrast images reveal an uneven, relatively
unstructured layer of Pt atoms (brighter spots) around structured Pd cores. EDXS maps
support a Pd core@Pt shell structure, as the Pt maps of individual particles are wider than
the corresponding Pd maps. The particles of 1Pt/4Pd/silica by co-DI in figure 4.11b are
large, agglomerated and some parts are Pd rich while others are Pt rich, consistent with
XRD showing a mixture of phases (figure 4.10a).
Images and maps of the 1.28Pd/6Pt/alumina catalyst synthesized by seq-SEA are
shown in figure 4.11c. EDXS maps appear to confirm the existence of partial Pd shells on
the Pt cores. The average particle size is near 3 nm, the same as XRD analysis (figure
4.10b). The 1.28Pd/6Pt/alumina by co-DI could not be analyzed by EDXS because high
numbers of Pt atoms are easily charged by x-ray beams and moved during analysis. The
Pt particles of seq-SEA catalyst are partially covered by Pd atoms and those particles may
be more stable under the beam. Average particle size of co-DI on alumina (figure 4.11d)
is small (less than 2nm) because most of the particles are very small, this may be
attributed to the CEDI effect, but agglomerated large particle still exist, creating to a
bimodal particle size distribution.
STEM analysis of the 0.33Pt/2Pd/alumina core/shell catalyst by seq-SEA (figure
4.11e) gave an average particle size of 2 nm, similar to co-DI (figure 4.11f). High
resolution z-contrast images reveal the presence of Pt atoms on the Pd surface, similar to
figure 4.11a. EDXS maps also suggest the decoration of Pd cores with Pt atoms. The
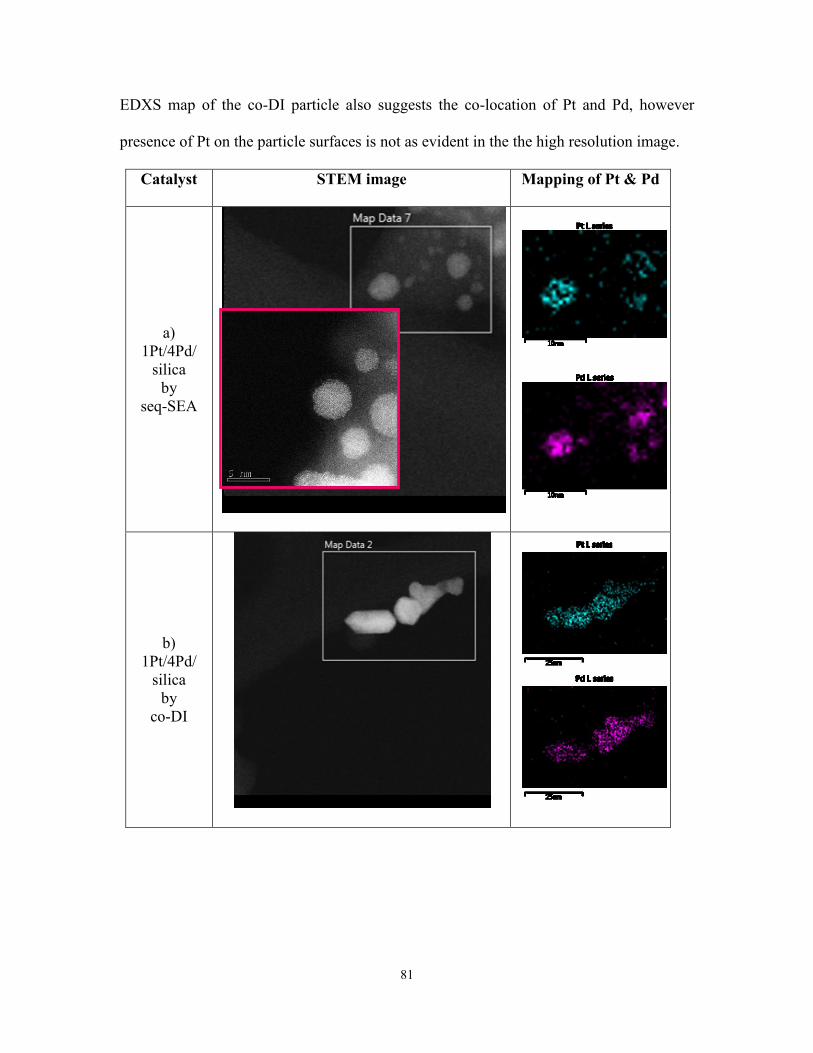
81
EDXS map of the co-DI particle also suggests the co-location of Pt and Pd, however
presence of Pt on the particle surfaces is not as evident in the the high resolution image.
Catalyst STEM image Mapping of Pt & Pd
a)
1Pt/4Pd/
silica
by
seq-SEA
b)
1Pt/4Pd/
silica
by
co-DI
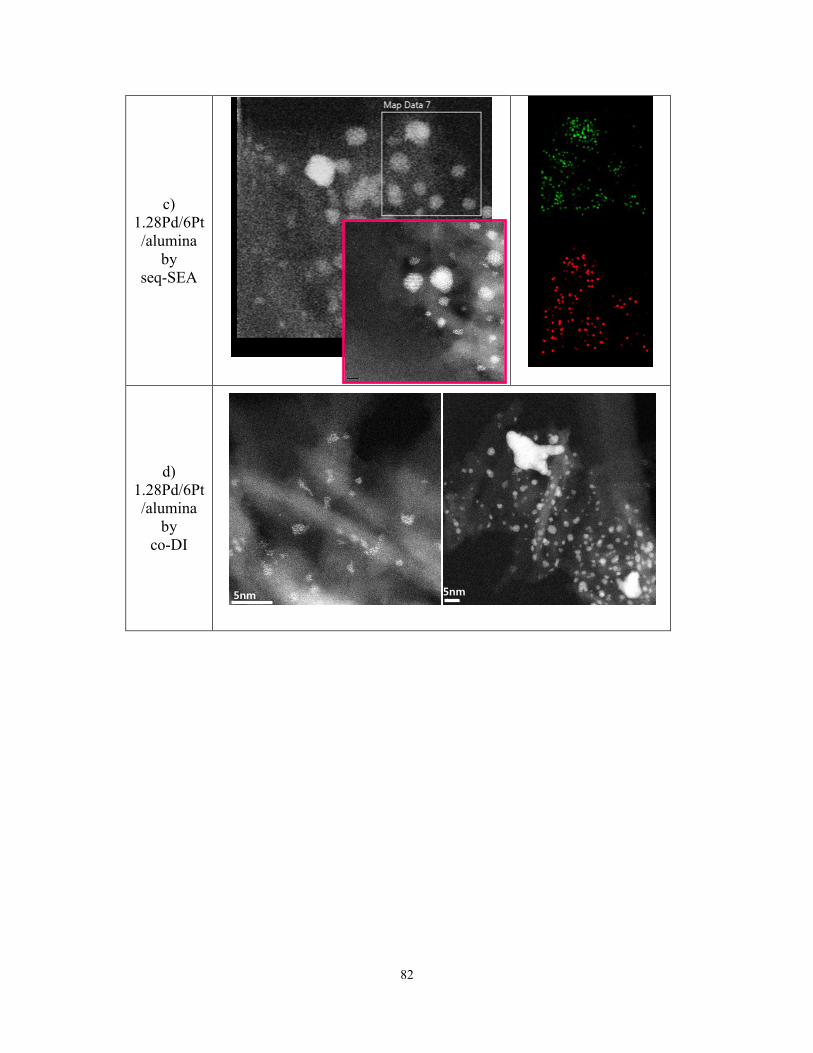
82
c)
1.28Pd/6Pt
/alumina
by
seq-SEA
d)
1.28Pd/6Pt
/alumina
by
co-DI
5nm 5nm
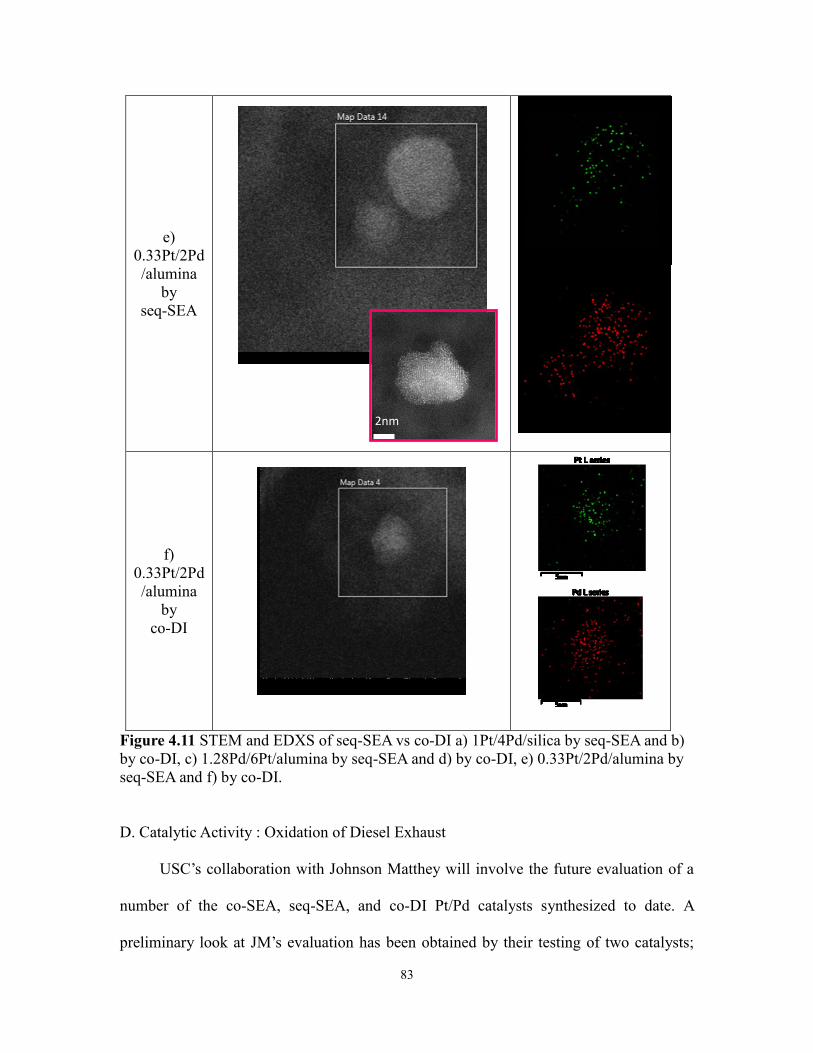
83
e)
0.33Pt/2Pd
/alumina
by
seq-SEA
f)
0.33Pt/2Pd
/alumina
by
co-DI
Figure 4.11 STEM and EDXS of seq-SEA vs co-DI a) 1Pt/4Pd/silica by seq-SEA and b)
by co-DI, c) 1.28Pd/6Pt/alumina by seq-SEA and d) by co-DI, e) 0.33Pt/2Pd/alumina by
seq-SEA and f) by co-DI.
D. Catalytic Activity : Oxidation of Diesel Exhaust
USC’s collaboration with Johnson Matthey will involve the future evaluation of a
number of the co-SEA, seq-SEA, and co-DI Pt/Pd catalysts synthesized to date. A
preliminary look at JM’s evaluation has been obtained by their testing of two catalysts;
2nm
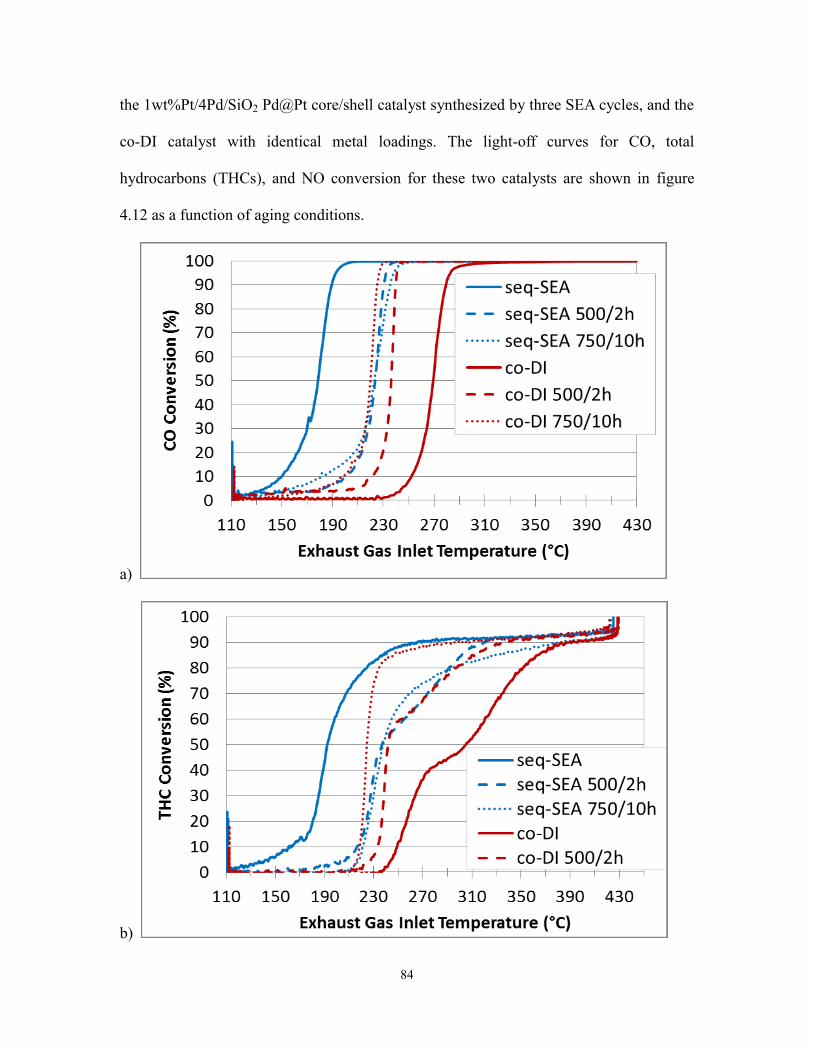
84
the 1wt%Pt/4Pd/SiO2 Pd@Pt core/shell catalyst synthesized by three SEA cycles, and the
co-DI catalyst with identical metal loadings. The light-off curves for CO, total
hydrocarbons (THCs), and NO conversion for these two catalysts are shown in figure
4.12 as a function of aging conditions.
a)
b)
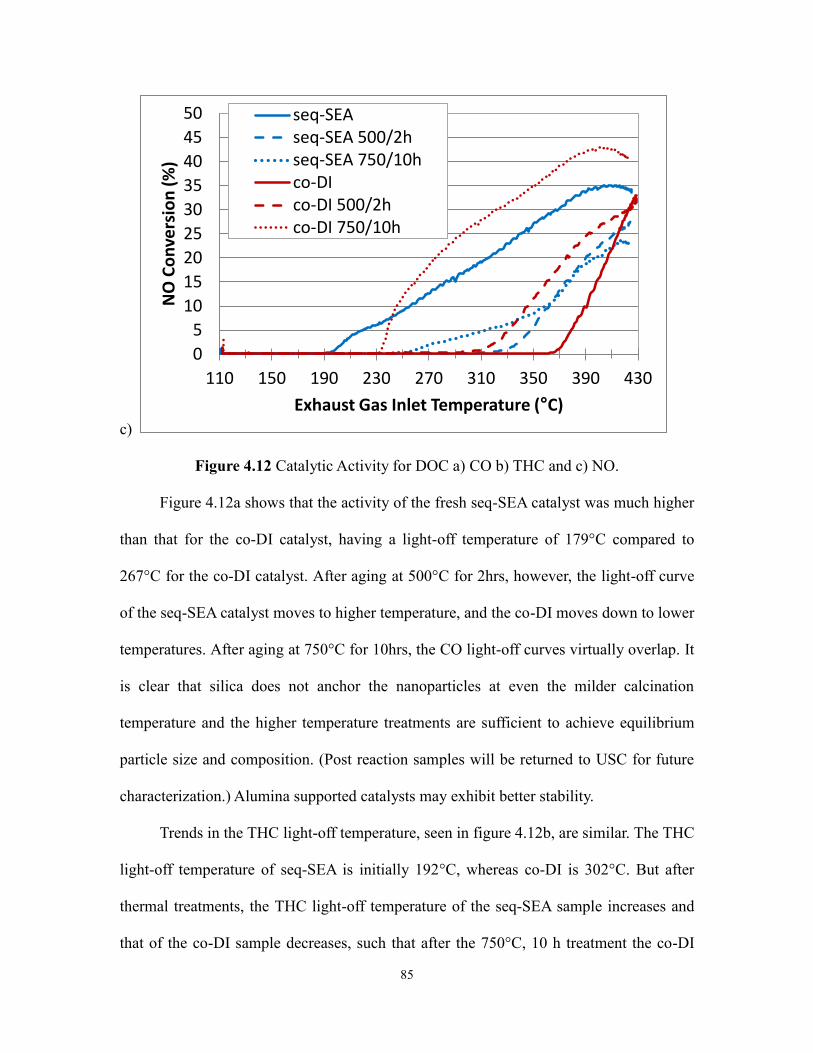
85
c)
Figure 4.12 Catalytic Activity for DOC a) CO b) THC and c) NO.
Figure 4.12a shows that the activity of the fresh seq-SEA catalyst was much higher
than that for the co-DI catalyst, having a light-off temperature of 179°C compared to
267°C for the co-DI catalyst. After aging at 500°C for 2hrs, however, the light-off curve
of the seq-SEA catalyst moves to higher temperature, and the co-DI moves down to lower
temperatures. After aging at 750°C for 10hrs, the CO light-off curves virtually overlap. It
is clear that silica does not anchor the nanoparticles at even the milder calcination
temperature and the higher temperature treatments are sufficient to achieve equilibrium
particle size and composition. (Post reaction samples will be returned to USC for future
characterization.) Alumina supported catalysts may exhibit better stability.
Trends in the THC light-off temperature, seen in figure 4.12b, are similar. The THC
light-off temperature of seq-SEA is initially 192°C, whereas co-DI is 302°C. But after
thermal treatments, the THC light-off temperature of the seq-SEA sample increases and
that of the co-DI sample decreases, such that after the 750°C, 10 h treatment the co-DI
0
5
10
15
20
25
30
35
40
45
50
110 150 190 230 270 310 350 390 430
NO
Co
nve
rsio
n (
%)
Exhaust Gas Inlet Temperature (°C)
seq-SEAseq-SEA 500/2hseq-SEA 750/10hco-DIco-DI 500/2hco-DI 750/10h
86
light-off temperature is actually lower than the seq-SEA sample. The same trends are also
seen in NO conversion, which is not expected to be high as the feed stream contains a
great excess of oxygen. The light-off curve for the co-DI, 500°C 2 h treatment appears to
be spurious.
It cannot presently be ascertained to what extent the large difference in initial
activity is due to metal dispersion on the one hand, or intimate Pt-Pd contact on the other.
A comparison of the seq-SEA sample with a control catalyst featuring a physical mixture
of two SEA-prepared, well dispersed single metal catalysts, with nearly identical overall
metal active area, will enable this effect to be isolated. The deactivation of the seq-SEA
catalyst may primarily be sintering, and the activation of the co-DI catalyst may be
wetting. Post-reaction characterization by XRD and STEM will help answer these
questions.
The entire set of catalysts synthesized for evaluation at JM is listed in table 4.5.
Samples number 5 and 6 were those already tested. Only oxide supports have been used
as carbon would be unstable in this reaction. Silica supported bimetallic catalysts have
been prepared with co-SEA for homogeneous alloys, and by seq-SEA with Pt shells on
Pd cores, with 1 and 3 SEA cycles of Pt shell application. As controls, co-DI samples at
the same nominal compositions have been prepared, and a physical mixture of SEA-
prepared single metals with high single metal dispersion will be used to eliminate the
difference in metal dispersion and isolate the effect of intimate Pd-Pt contact in the co-
SEA and seq-SEA samples. For alumina, the same variety of sample is prepared, with
either Pt shells and Pd cores, or Pd shells and Pt cores.
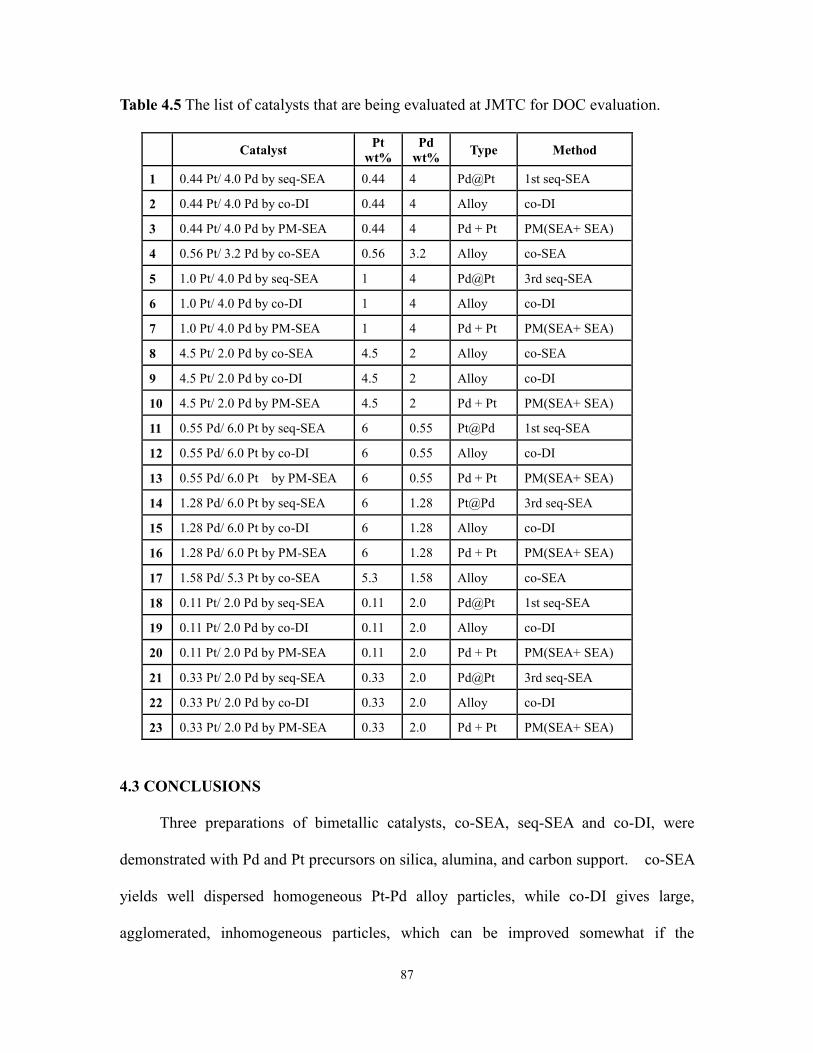
87
Table 4.5 The list of catalysts that are being evaluated at JMTC for DOC evaluation.
Catalyst Pt
wt%
Pd
wt% Type Method
1 0.44 Pt/ 4.0 Pd by seq-SEA 0.44 4 Pd@Pt 1st seq-SEA
2 0.44 Pt/ 4.0 Pd by co-DI 0.44 4 Alloy co-DI
3 0.44 Pt/ 4.0 Pd by PM-SEA 0.44 4 Pd + Pt PM(SEA+ SEA)
4 0.56 Pt/ 3.2 Pd by co-SEA 0.56 3.2 Alloy co-SEA
5 1.0 Pt/ 4.0 Pd by seq-SEA 1 4 Pd@Pt 3rd seq-SEA
6 1.0 Pt/ 4.0 Pd by co-DI 1 4 Alloy co-DI
7 1.0 Pt/ 4.0 Pd by PM-SEA 1 4 Pd + Pt PM(SEA+ SEA)
8 4.5 Pt/ 2.0 Pd by co-SEA 4.5 2 Alloy co-SEA
9 4.5 Pt/ 2.0 Pd by co-DI 4.5 2 Alloy co-DI
10 4.5 Pt/ 2.0 Pd by PM-SEA 4.5 2 Pd + Pt PM(SEA+ SEA)
11 0.55 Pd/ 6.0 Pt by seq-SEA 6 0.55 Pt@Pd 1st seq-SEA
12 0.55 Pd/ 6.0 Pt by co-DI 6 0.55 Alloy co-DI
13 0.55 Pd/ 6.0 Pt by PM-SEA 6 0.55 Pd + Pt PM(SEA+ SEA)
14 1.28 Pd/ 6.0 Pt by seq-SEA 6 1.28 Pt@Pd 3rd seq-SEA
15 1.28 Pd/ 6.0 Pt by co-DI 6 1.28 Alloy co-DI
16 1.28 Pd/ 6.0 Pt by PM-SEA 6 1.28 Pd + Pt PM(SEA+ SEA)
17 1.58 Pd/ 5.3 Pt by co-SEA 5.3 1.58 Alloy co-SEA
18 0.11 Pt/ 2.0 Pd by seq-SEA 0.11 2.0 Pd@Pt 1st seq-SEA
19 0.11 Pt/ 2.0 Pd by co-DI 0.11 2.0 Alloy co-DI
20 0.11 Pt/ 2.0 Pd by PM-SEA 0.11 2.0 Pd + Pt PM(SEA+ SEA)
21 0.33 Pt/ 2.0 Pd by seq-SEA 0.33 2.0 Pd@Pt 3rd seq-SEA
22 0.33 Pt/ 2.0 Pd by co-DI 0.33 2.0 Alloy co-DI
23 0.33 Pt/ 2.0 Pd by PM-SEA 0.33 2.0 Pd + Pt PM(SEA+ SEA)
4.3 CONCLUSIONS
Three preparations of bimetallic catalysts, co-SEA, seq-SEA and co-DI, were
demonstrated with Pd and Pt precursors on silica, alumina, and carbon support. co-SEA
yields well dispersed homogeneous Pt-Pd alloy particles, while co-DI gives large,
agglomerated, inhomogeneous particles, which can be improved somewhat if the
88
precursor solution is highly acidic or basic to produce the CEDI effect. With seq-SEA,
core@shell structures can be prepared by selectively adsorbing a second metal onto a first
metal oxide. Shell metal loading can be increased by additional cycles of SEA, which
gives some flexibility at catalyst composition in exchange for more synthesis steps.
An initial assessment of catalytic activity for diesel exhaust oxidation showed
much higher initial activity of seq-SEA catalysts than for co-DI catalysts, but the highly
dispersed SEA-derived materials appeared to sinter quickly on the silica support. Future
studies with other supports and other core/shell and homogeneously alloyed
morphologies will enable a better correlation of rational synthesis to structure and
function.
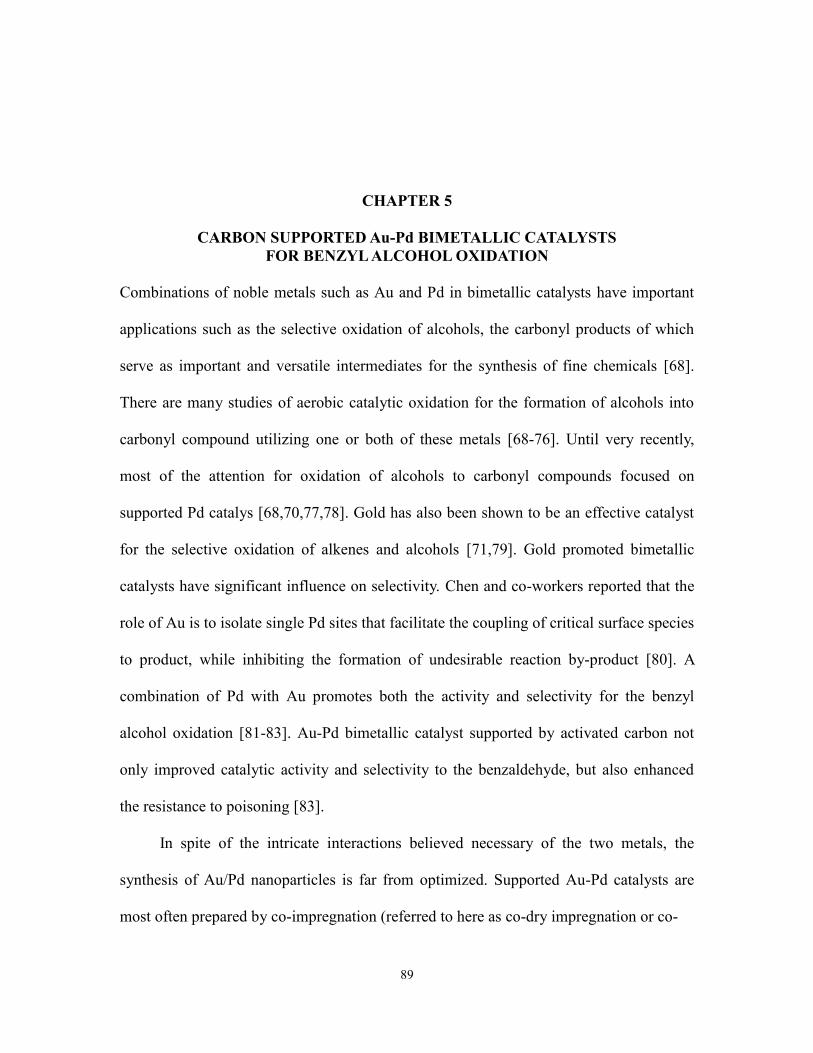
89
CHAPTER 5
CARBON SUPPORTED Au-Pd BIMETALLIC CATALYSTS
FOR BENZYL ALCOHOL OXIDATION
Combinations of noble metals such as Au and Pd in bimetallic catalysts have important
applications such as the selective oxidation of alcohols, the carbonyl products of which
serve as important and versatile intermediates for the synthesis of fine chemicals [68].
There are many studies of aerobic catalytic oxidation for the formation of alcohols into
carbonyl compound utilizing one or both of these metals [68-76]. Until very recently,
most of the attention for oxidation of alcohols to carbonyl compounds focused on
supported Pd catalys [68,70,77,78]. Gold has also been shown to be an effective catalyst
for the selective oxidation of alkenes and alcohols [71,79]. Gold promoted bimetallic
catalysts have significant influence on selectivity. Chen and co-workers reported that the
role of Au is to isolate single Pd sites that facilitate the coupling of critical surface species
to product, while inhibiting the formation of undesirable reaction by-product [80]. A
combination of Pd with Au promotes both the activity and selectivity for the benzyl
alcohol oxidation [81-83]. Au-Pd bimetallic catalyst supported by activated carbon not
only improved catalytic activity and selectivity to the benzaldehyde, but also enhanced
the resistance to poisoning [83].
In spite of the intricate interactions believed necessary of the two metals, the
synthesis of Au/Pd nanoparticles is far from optimized. Supported Au-Pd catalysts are
most often prepared by co-impregnation (referred to here as co-dry impregnation or co-
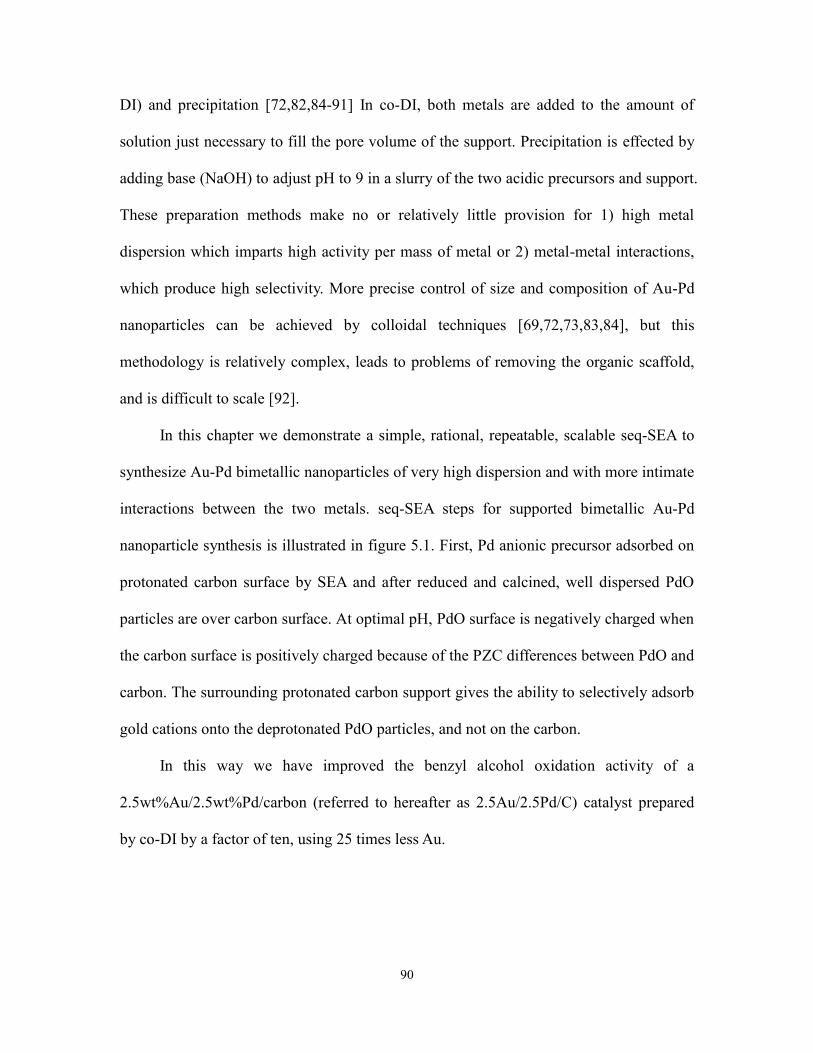
90
DI) and precipitation [72,82,84-91] In co-DI, both metals are added to the amount of
solution just necessary to fill the pore volume of the support. Precipitation is effected by
adding base (NaOH) to adjust pH to 9 in a slurry of the two acidic precursors and support.
These preparation methods make no or relatively little provision for 1) high metal
dispersion which imparts high activity per mass of metal or 2) metal-metal interactions,
which produce high selectivity. More precise control of size and composition of Au-Pd
nanoparticles can be achieved by colloidal techniques [69,72,73,83,84], but this
methodology is relatively complex, leads to problems of removing the organic scaffold,
and is difficult to scale [92].
In this chapter we demonstrate a simple, rational, repeatable, scalable seq-SEA to
synthesize Au-Pd bimetallic nanoparticles of very high dispersion and with more intimate
interactions between the two metals. seq-SEA steps for supported bimetallic Au-Pd
nanoparticle synthesis is illustrated in figure 5.1. First, Pd anionic precursor adsorbed on
protonated carbon surface by SEA and after reduced and calcined, well dispersed PdO
particles are over carbon surface. At optimal pH, PdO surface is negatively charged when
the carbon surface is positively charged because of the PZC differences between PdO and
carbon. The surrounding protonated carbon support gives the ability to selectively adsorb
gold cations onto the deprotonated PdO particles, and not on the carbon.
In this way we have improved the benzyl alcohol oxidation activity of a
2.5wt%Au/2.5wt%Pd/carbon (referred to hereafter as 2.5Au/2.5Pd/C) catalyst prepared
by co-DI by a factor of ten, using 25 times less Au.
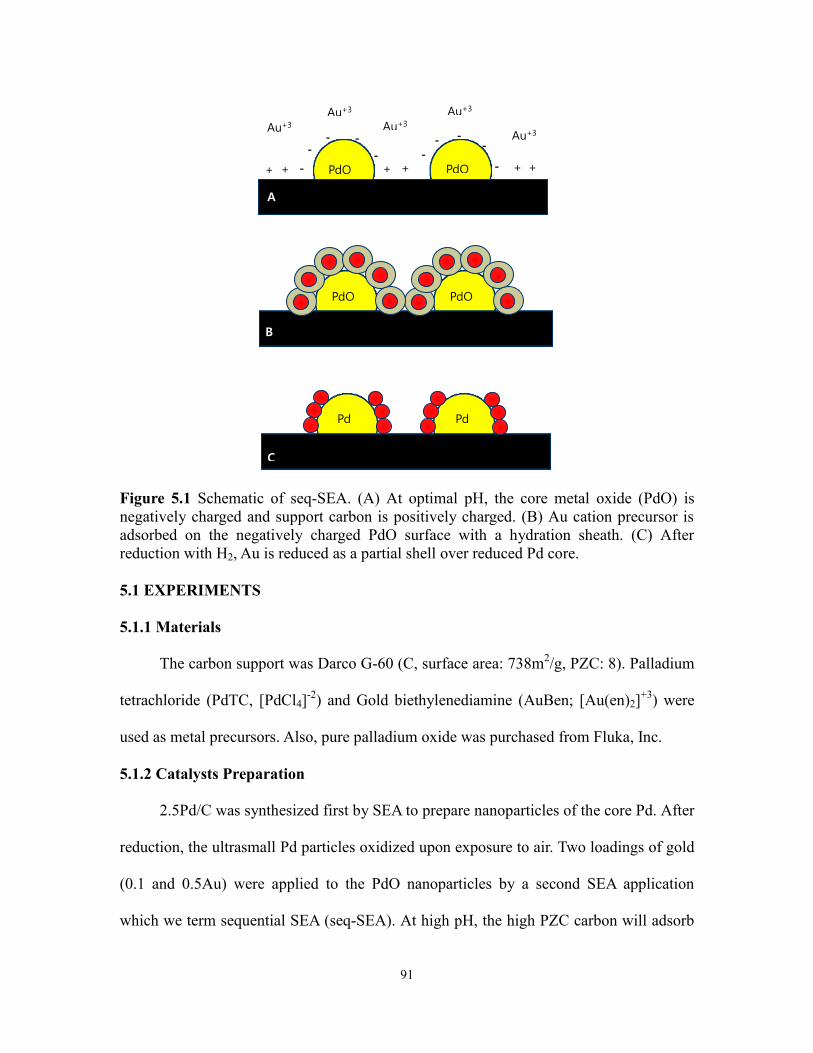
91
Figure 5.1 Schematic of seq-SEA. (A) At optimal pH, the core metal oxide (PdO) is
negatively charged and support carbon is positively charged. (B) Au cation precursor is
adsorbed on the negatively charged PdO surface with a hydration sheath. (C) After
reduction with H2, Au is reduced as a partial shell over reduced Pd core.
5.1 EXPERIMENTS
5.1.1 Materials
The carbon support was Darco G-60 (C, surface area: 738m2/g, PZC: 8). Palladium
tetrachloride (PdTC, [PdCl4]-2
) and Gold biethylenediamine (AuBen; [Au(en)2]+3
) were
used as metal precursors. Also, pure palladium oxide was purchased from Fluka, Inc.
5.1.2 Catalysts Preparation
2.5Pd/C was synthesized first by SEA to prepare nanoparticles of the core Pd. After
reduction, the ultrasmall Pd particles oxidized upon exposure to air. Two loadings of gold
(0.1 and 0.5Au) were applied to the PdO nanoparticles by a second SEA application
which we term sequential SEA (seq-SEA). At high pH, the high PZC carbon will adsorb
A
+
PdO PdO + + -
- - -
-
Au+3
+ + + + -
- - -
-
Au+3 Au+3
Au+3
Au+3
PdO PdO
B
Pd Pd
C
92
less cations than PdO which has the lower PZC as chapter 3, so that in principle, gold
cations of AuBen can be selectively adsorbed onto the PdO nanoparticles. Core-shell
Pd@Au morphologies will result after the Au precursors on the Pd oxide nanoparticles
are reduced. For comparison with past literature reports, another catalyst with the
commonly employed loadings of 2.5Au and 2.5Pd [85,86,88-91] was prepared by co-DI.
Others at 0.1 and 0.5Au were prepared by DI of the gold onto the well dispersed, SEA-
prepared 2.5Pd/C. All catalysts were reduced at 150 °C as determined by temperature
programmed reduction.
5.1.3 Catalysts Characterization
A. XRD
Powder XRD measurements were made using a Rigaku MiniFlexII bench-top
system. XRD patterns were compared to reference spectra using PDXL (Rigaku
Corporation) software. The radiation source was Cu Kα radiation (λ = 1.5406 Å) at
operating condition of 30kV and 15mA. All spectra were taken at a scan rate of 0.5o/min
and sampling width of 0.02 o.
B. CO chemisorptions
10% Carbon monoxide (balanced He) chemisorptions was used to determine the
accessible Pt surface (Micromeritics ASAP 2920) at 40°C. The samples were first dried at
150 °C in a He flow for 1 h and subsequently reduced in a H2 flow at 150 °C for 1 h
(ramp = 10°C/min).
C. STEM and EDXS
The microscope used in this study was a TITAN 80-300 with ChemiSTEM
Technology (FEI Company; Hillsboro, USA). It was equipped with a CEOS GmbH
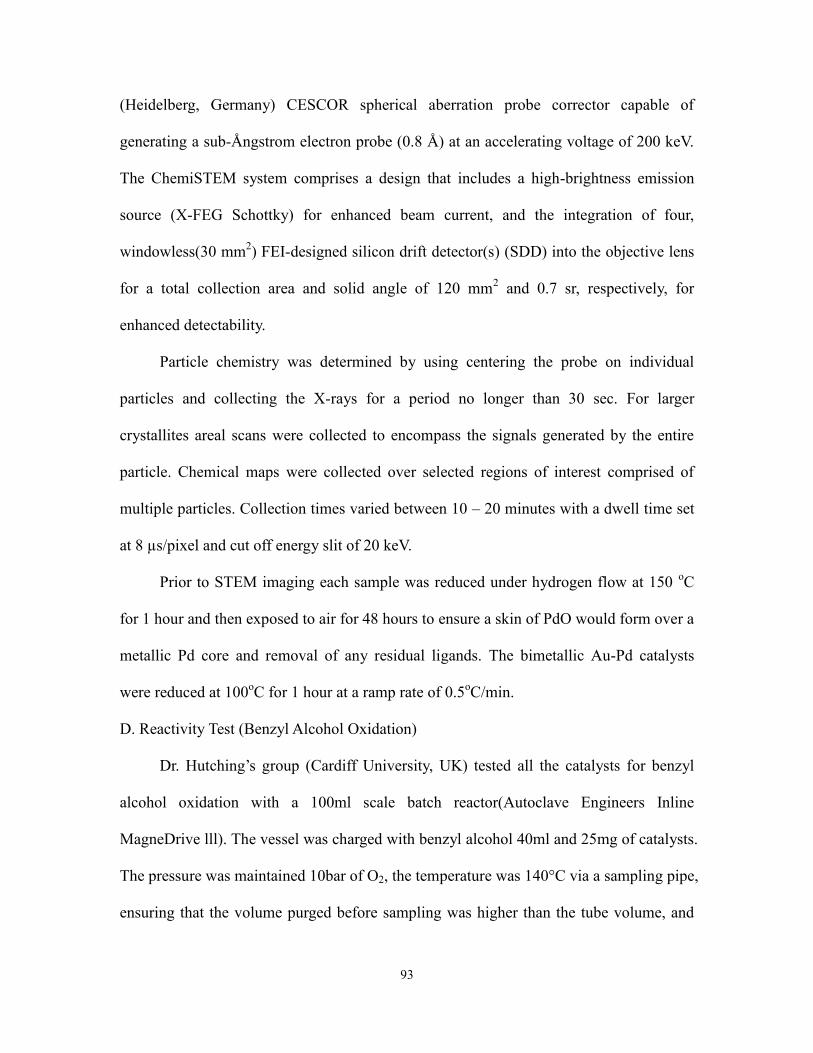
93
(Heidelberg, Germany) CESCOR spherical aberration probe corrector capable of
generating a sub-Ångstrom electron probe (0.8 Å) at an accelerating voltage of 200 keV.
The ChemiSTEM system comprises a design that includes a high-brightness emission
source (X-FEG Schottky) for enhanced beam current, and the integration of four,
windowless(30 mm2) FEI-designed silicon drift detector(s) (SDD) into the objective lens
for a total collection area and solid angle of 120 mm2 and 0.7 sr, respectively, for
enhanced detectability.
Particle chemistry was determined by using centering the probe on individual
particles and collecting the X-rays for a period no longer than 30 sec. For larger
crystallites areal scans were collected to encompass the signals generated by the entire
particle. Chemical maps were collected over selected regions of interest comprised of
multiple particles. Collection times varied between 10 – 20 minutes with a dwell time set
at 8 µs/pixel and cut off energy slit of 20 keV.
Prior to STEM imaging each sample was reduced under hydrogen flow at 150 oC
for 1 hour and then exposed to air for 48 hours to ensure a skin of PdO would form over a
metallic Pd core and removal of any residual ligands. The bimetallic Au-Pd catalysts
were reduced at 100oC for 1 hour at a ramp rate of 0.5
oC/min.
D. Reactivity Test (Benzyl Alcohol Oxidation)
Dr. Hutching’s group (Cardiff University, UK) tested all the catalysts for benzyl
alcohol oxidation with a 100ml scale batch reactor(Autoclave Engineers Inline
MagneDrive lll). The vessel was charged with benzyl alcohol 40ml and 25mg of catalysts.
The pressure was maintained 10bar of O2, the temperature was 140°C via a sampling pipe,
ensuring that the volume purged before sampling was higher than the tube volume, and
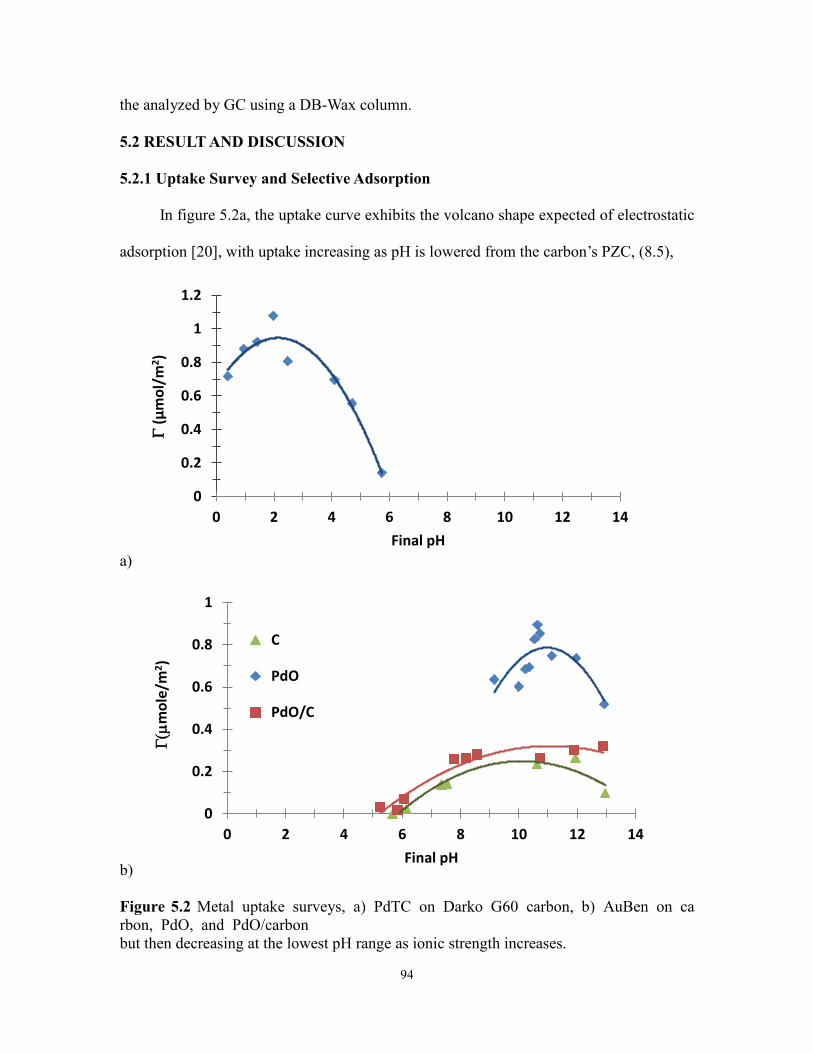
94
the analyzed by GC using a DB-Wax column.
5.2 RESULT AND DISCUSSION
5.2.1 Uptake Survey and Selective Adsorption
In figure 5.2a, the uptake curve exhibits the volcano shape expected of electrostatic
adsorption [20], with uptake increasing as pH is lowered from the carbon’s PZC, (8.5),
a)
b)
Figure 5.2 Metal uptake surveys, a) PdTC on Darko G60 carbon, b) AuBen on ca
rbon, PdO, and PdO/carbon
but then decreasing at the lowest pH range as ionic strength increases.
0
0.2
0.4
0.6
0.8
1
1.2
0 2 4 6 8 10 12 14
G (μ
mo
l/m
2)
Final pH
0
0.2
0.4
0.6
0.8
1
0 2 4 6 8 10 12 14
G(
mo
le/m
2)
Final pH
C
PdO
PdO/C
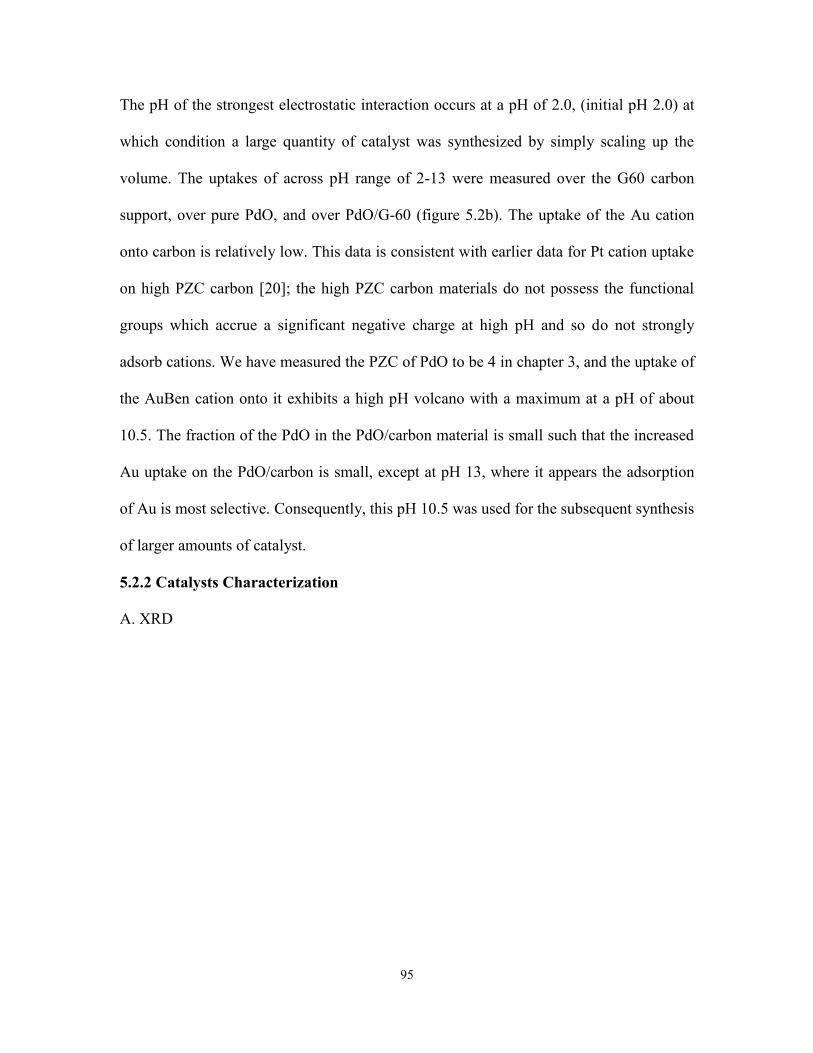
95
The pH of the strongest electrostatic interaction occurs at a pH of 2.0, (initial pH 2.0) at
which condition a large quantity of catalyst was synthesized by simply scaling up the
volume. The uptakes of across pH range of 2-13 were measured over the G60 carbon
support, over pure PdO, and over PdO/G-60 (figure 5.2b). The uptake of the Au cation
onto carbon is relatively low. This data is consistent with earlier data for Pt cation uptake
on high PZC carbon [20]; the high PZC carbon materials do not possess the functional
groups which accrue a significant negative charge at high pH and so do not strongly
adsorb cations. We have measured the PZC of PdO to be 4 in chapter 3, and the uptake of
the AuBen cation onto it exhibits a high pH volcano with a maximum at a pH of about
10.5. The fraction of the PdO in the PdO/carbon material is small such that the increased
Au uptake on the PdO/carbon is small, except at pH 13, where it appears the adsorption
of Au is most selective. Consequently, this pH 10.5 was used for the subsequent synthesis
of larger amounts of catalyst.
5.2.2 Catalysts Characterization
A. XRD
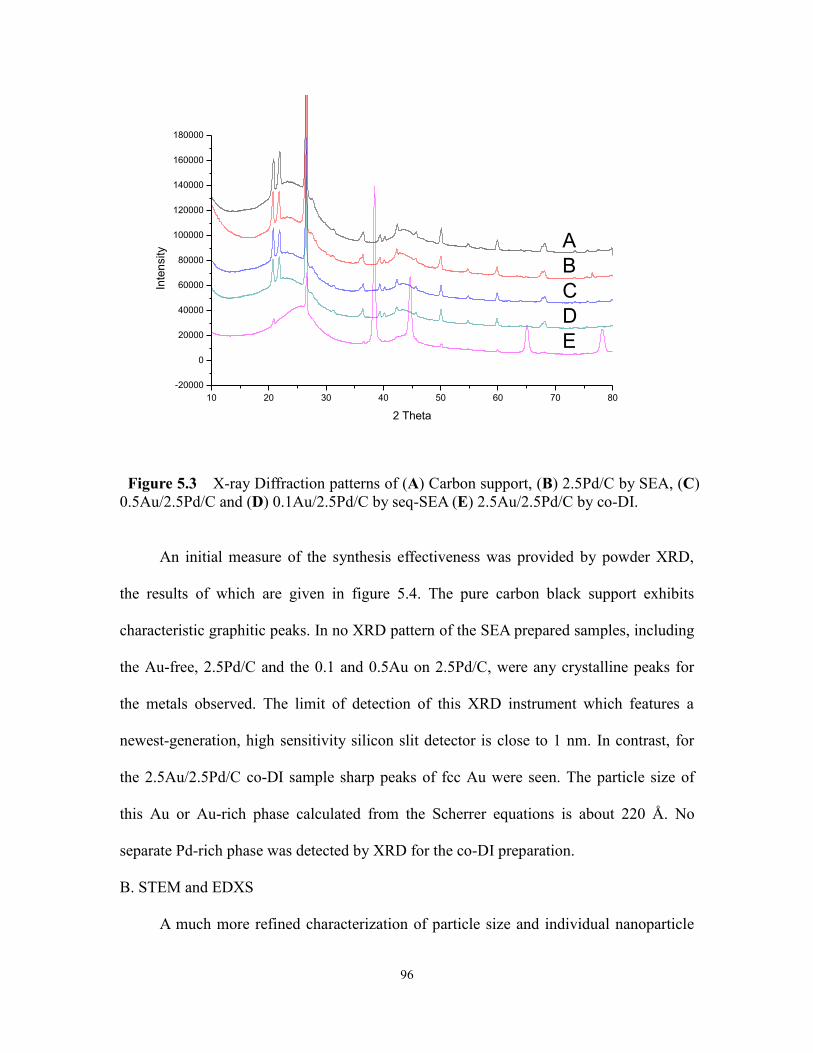
96
Figure 5.3 X-ray Diffraction patterns of (A) Carbon support, (B) 2.5Pd/C by SEA, (C)
0.5Au/2.5Pd/C and (D) 0.1Au/2.5Pd/C by seq-SEA (E) 2.5Au/2.5Pd/C by co-DI.
An initial measure of the synthesis effectiveness was provided by powder XRD,
the results of which are given in figure 5.4. The pure carbon black support exhibits
characteristic graphitic peaks. In no XRD pattern of the SEA prepared samples, including
the Au-free, 2.5Pd/C and the 0.1 and 0.5Au on 2.5Pd/C, were any crystalline peaks for
the metals observed. The limit of detection of this XRD instrument which features a
newest-generation, high sensitivity silicon slit detector is close to 1 nm. In contrast, for
the 2.5Au/2.5Pd/C co-DI sample sharp peaks of fcc Au were seen. The particle size of
this Au or Au-rich phase calculated from the Scherrer equations is about 220 Å. No
separate Pd-rich phase was detected by XRD for the co-DI preparation.
B. STEM and EDXS
A much more refined characterization of particle size and individual nanoparticle
10 20 30 40 50 60 70 80
-20000
0
20000
40000
60000
80000
100000
120000
140000
160000
180000
A
B
C
D
E
Inte
nsity
2 Theta
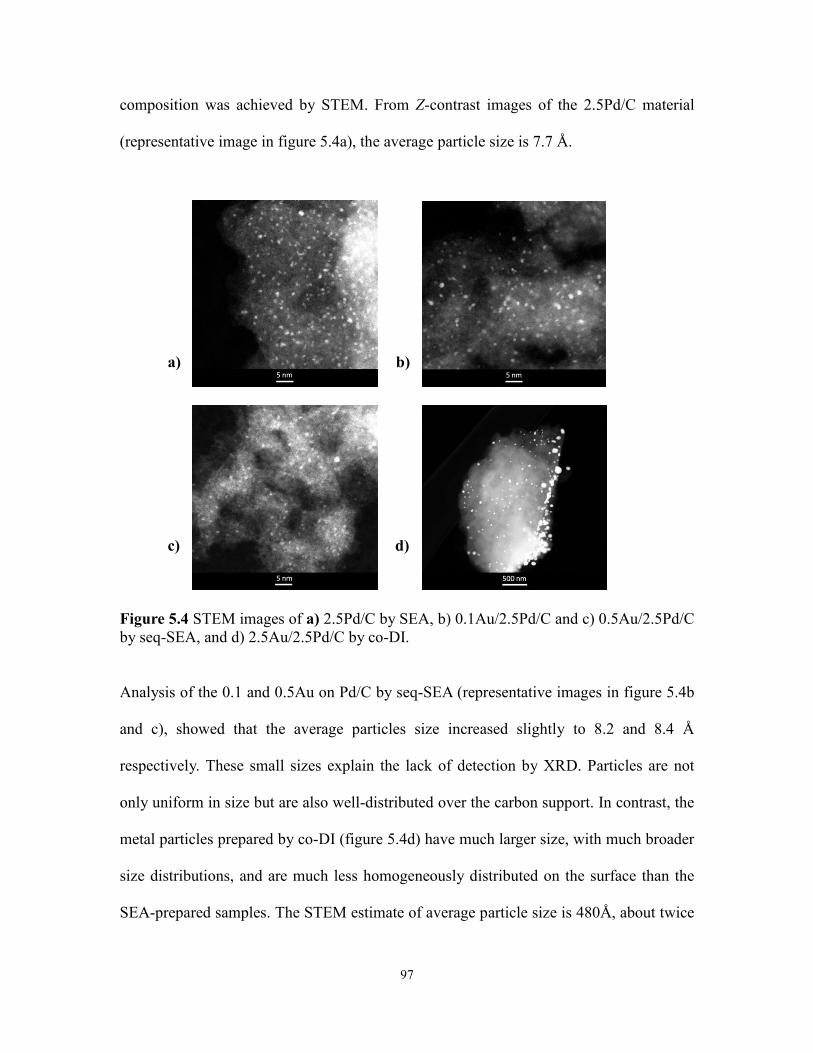
97
composition was achieved by STEM. From Z-contrast images of the 2.5Pd/C material
(representative image in figure 5.4a), the average particle size is 7.7 Å.
a) b)
c) d)
Figure 5.4 STEM images of a) 2.5Pd/C by SEA, b) 0.1Au/2.5Pd/C and c) 0.5Au/2.5Pd/C
by seq-SEA, and d) 2.5Au/2.5Pd/C by co-DI.
Analysis of the 0.1 and 0.5Au on Pd/C by seq-SEA (representative images in figure 5.4b
and c), showed that the average particles size increased slightly to 8.2 and 8.4 Å
respectively. These small sizes explain the lack of detection by XRD. Particles are not
only uniform in size but are also well-distributed over the carbon support. In contrast, the
metal particles prepared by co-DI (figure 5.4d) have much larger size, with much broader
size distributions, and are much less homogeneously distributed on the surface than the
SEA-prepared samples. The STEM estimate of average particle size is 480Å, about twice
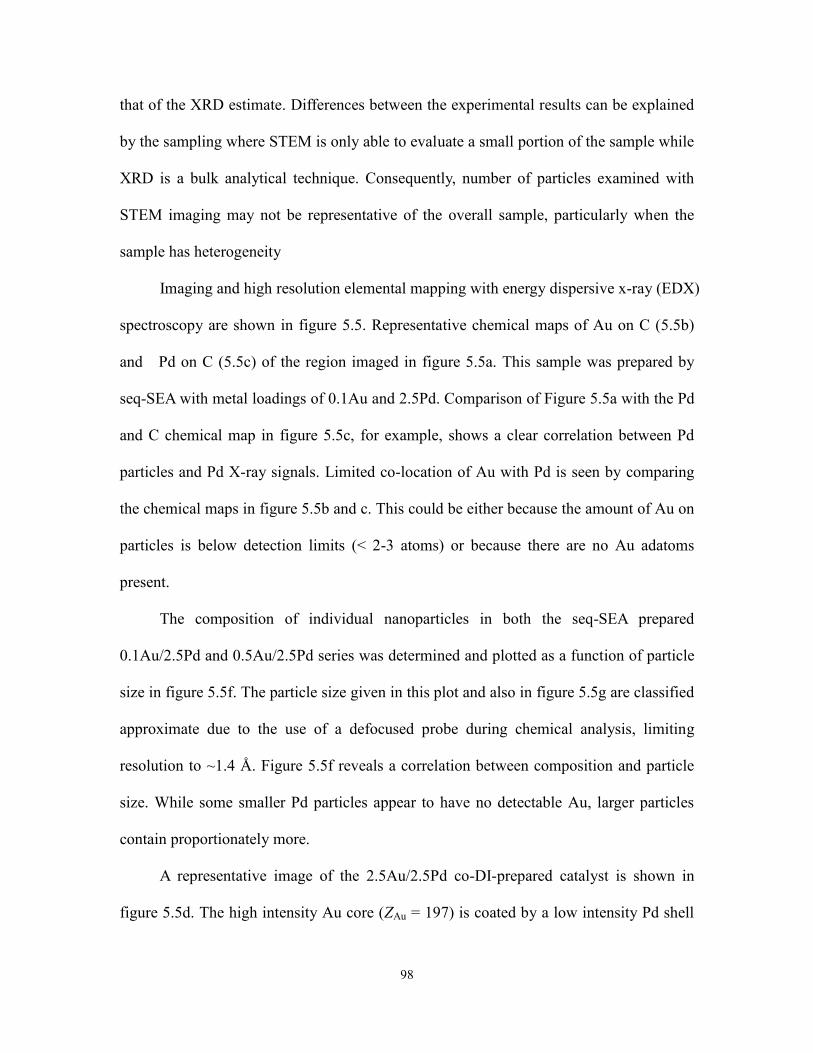
98
that of the XRD estimate. Differences between the experimental results can be explained
by the sampling where STEM is only able to evaluate a small portion of the sample while
XRD is a bulk analytical technique. Consequently, number of particles examined with
STEM imaging may not be representative of the overall sample, particularly when the
sample has heterogeneity
Imaging and high resolution elemental mapping with energy dispersive x-ray (EDX)
spectroscopy are shown in figure 5.5. Representative chemical maps of Au on C (5.5b)
and Pd on C (5.5c) of the region imaged in figure 5.5a. This sample was prepared by
seq-SEA with metal loadings of 0.1Au and 2.5Pd. Comparison of Figure 5.5a with the Pd
and C chemical map in figure 5.5c, for example, shows a clear correlation between Pd
particles and Pd X-ray signals. Limited co-location of Au with Pd is seen by comparing
the chemical maps in figure 5.5b and c. This could be either because the amount of Au on
particles is below detection limits (< 2-3 atoms) or because there are no Au adatoms
present.
The composition of individual nanoparticles in both the seq-SEA prepared
0.1Au/2.5Pd and 0.5Au/2.5Pd series was determined and plotted as a function of particle
size in figure 5.5f. The particle size given in this plot and also in figure 5.5g are classified
approximate due to the use of a defocused probe during chemical analysis, limiting
resolution to ~1.4 Å. Figure 5.5f reveals a correlation between composition and particle
size. While some smaller Pd particles appear to have no detectable Au, larger particles
contain proportionately more.
A representative image of the 2.5Au/2.5Pd co-DI-prepared catalyst is shown in
figure 5.5d. The high intensity Au core (ZAu = 197) is coated by a low intensity Pd shell
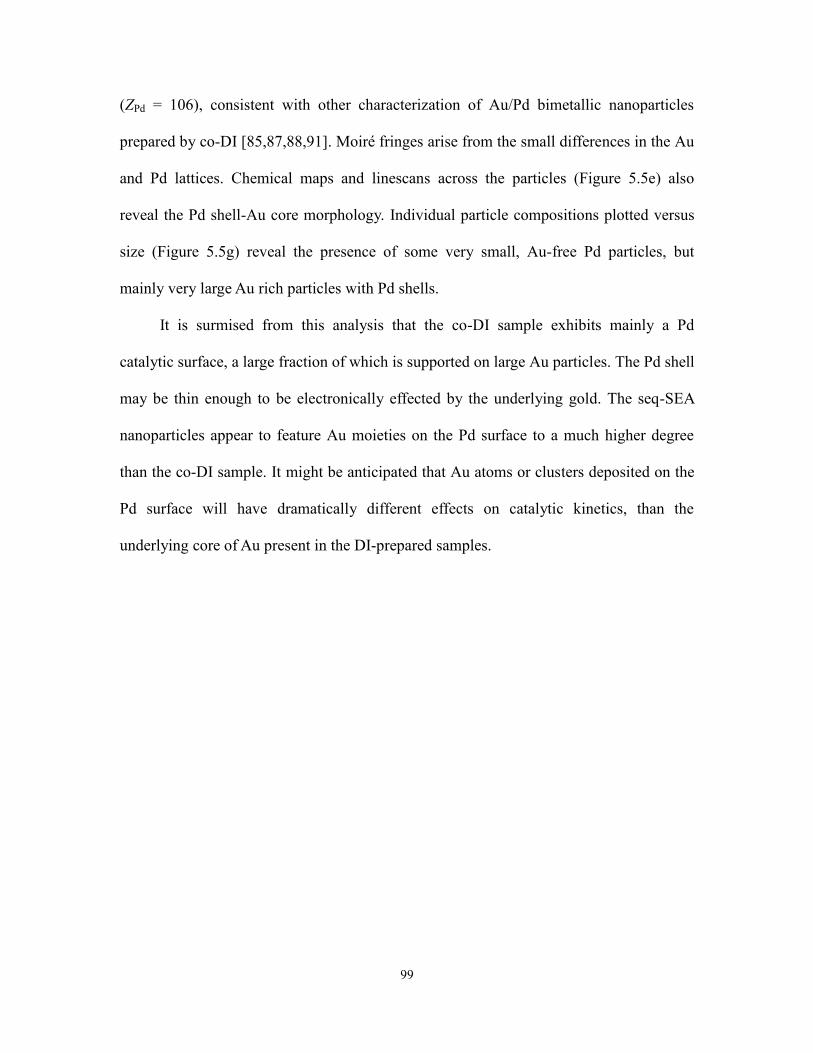
99
(ZPd = 106), consistent with other characterization of Au/Pd bimetallic nanoparticles
prepared by co-DI [85,87,88,91]. Moiré fringes arise from the small differences in the Au
and Pd lattices. Chemical maps and linescans across the particles (Figure 5.5e) also
reveal the Pd shell-Au core morphology. Individual particle compositions plotted versus
size (Figure 5.5g) reveal the presence of some very small, Au-free Pd particles, but
mainly very large Au rich particles with Pd shells.
It is surmised from this analysis that the co-DI sample exhibits mainly a Pd
catalytic surface, a large fraction of which is supported on large Au particles. The Pd shell
may be thin enough to be electronically effected by the underlying gold. The seq-SEA
nanoparticles appear to feature Au moieties on the Pd surface to a much higher degree
than the co-DI sample. It might be anticipated that Au atoms or clusters deposited on the
Pd surface will have dramatically different effects on catalytic kinetics, than the
underlying core of Au present in the DI-prepared samples.
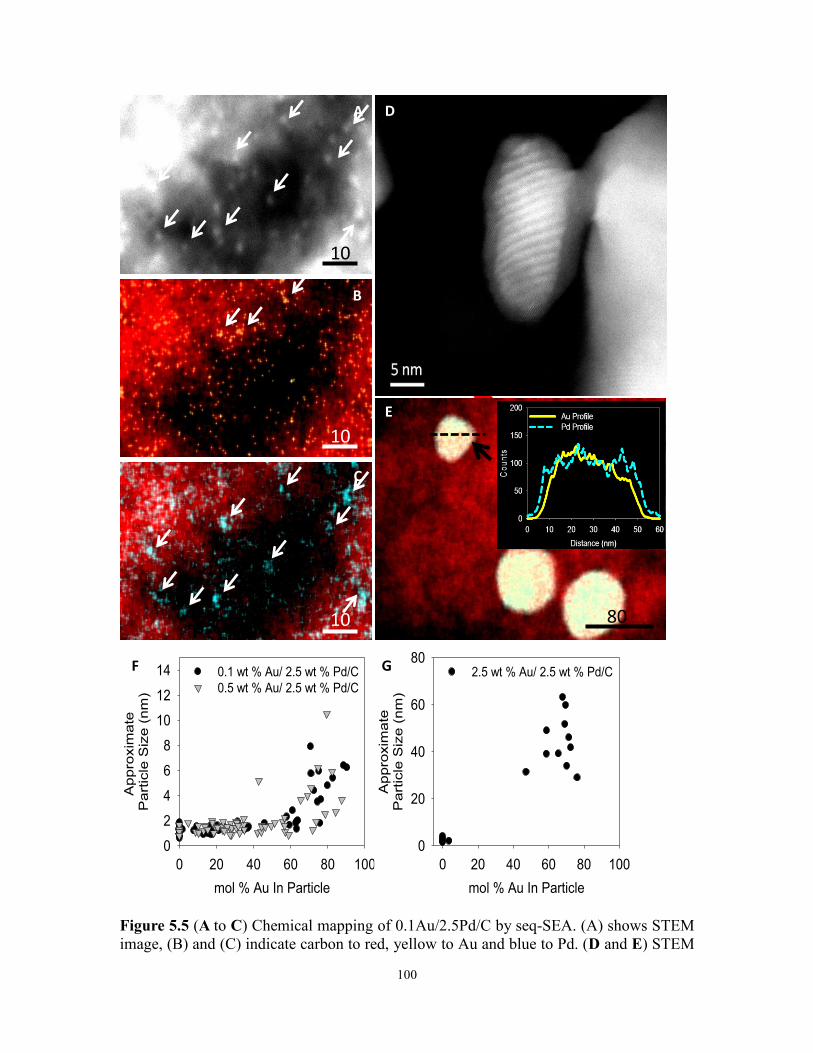
100
Figure 5.5 (A to C) Chemical mapping of 0.1Au/2.5Pd/C by seq-SEA. (A) shows STEM
image, (B) and (C) indicate carbon to red, yellow to Au and blue to Pd. (D and E) STEM
mol % Au In Particle
0 20 40 60 80 100
Ap
pro
xim
ate
P
art
icle
Siz
e (
nm
)
0
2
4
6
8
10
12
14 0.1 wt % Au/ 2.5 wt % Pd/C
0.5 wt % Au/ 2.5 wt % Pd/C
mol % Au In Particle
0 20 40 60 80 100
Ap
pro
xim
ate
Pa
rtic
le S
ize
(n
m)
0
20
40
60
802.5 wt % Au/ 2.5 wt % Pd/C
10 nm
10 nm
10 nm
A
B
C
E
80 nm
D
F G
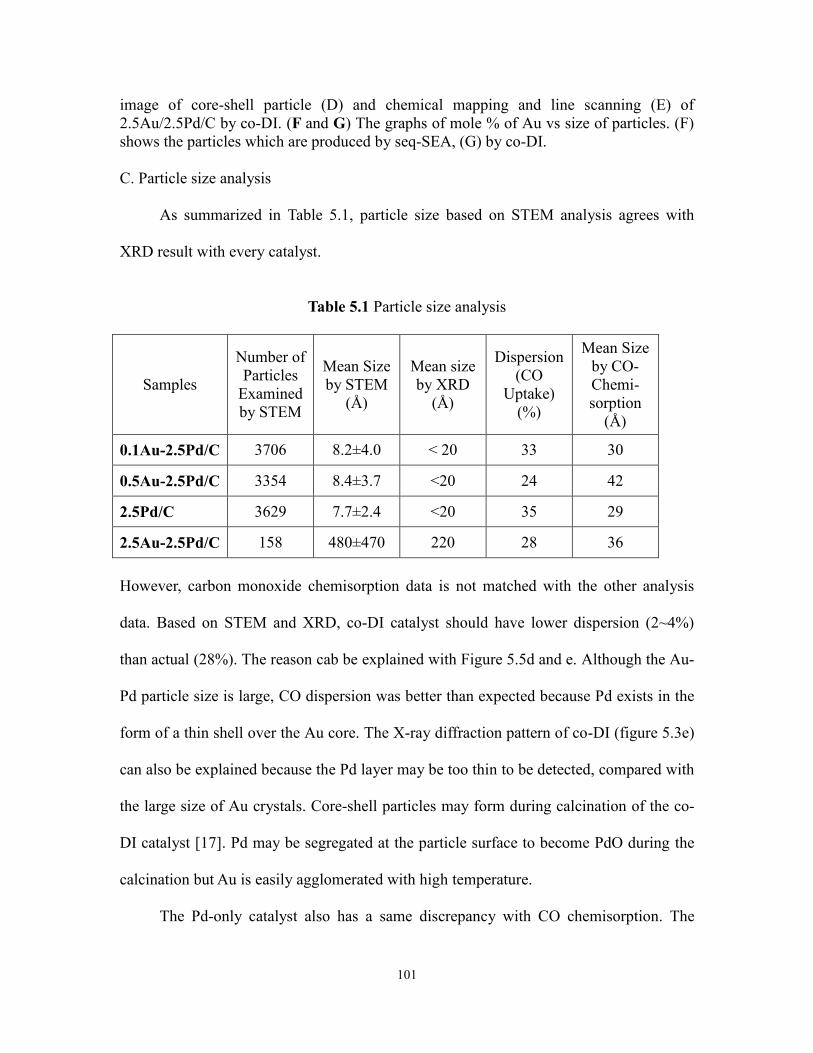
101
image of core-shell particle (D) and chemical mapping and line scanning (E) of
2.5Au/2.5Pd/C by co-DI. (F and G) The graphs of mole % of Au vs size of particles. (F)
shows the particles which are produced by seq-SEA, (G) by co-DI.
C. Particle size analysis
As summarized in Table 5.1, particle size based on STEM analysis agrees with
XRD result with every catalyst.
Table 5.1 Particle size analysis
Samples
Number of
Particles
Examined
by STEM
Mean Size
by STEM
(Å)
Mean size
by XRD
(Å)
Dispersion
(CO
Uptake)
(%)
Mean Size
by CO-
Chemi-
sorption
(Å)
0.1Au-2.5Pd/C 3706 8.2±4.0 < 20 33 30
0.5Au-2.5Pd/C 3354 8.4±3.7 <20 24 42
2.5Pd/C 3629 7.7±2.4 <20 35 29
2.5Au-2.5Pd/C 158 480±470 220 28 36
However, carbon monoxide chemisorption data is not matched with the other analysis
data. Based on STEM and XRD, co-DI catalyst should have lower dispersion (2~4%)
than actual (28%). The reason cab be explained with Figure 5.5d and e. Although the Au-
Pd particle size is large, CO dispersion was better than expected because Pd exists in the
form of a thin shell over the Au core. The X-ray diffraction pattern of co-DI (figure 5.3e)
can also be explained because the Pd layer may be too thin to be detected, compared with
the large size of Au crystals. Core-shell particles may form during calcination of the co-
DI catalyst [17]. Pd may be segregated at the particle surface to become PdO during the
calcination but Au is easily agglomerated with high temperature.
The Pd-only catalyst also has a same discrepancy with CO chemisorption. The
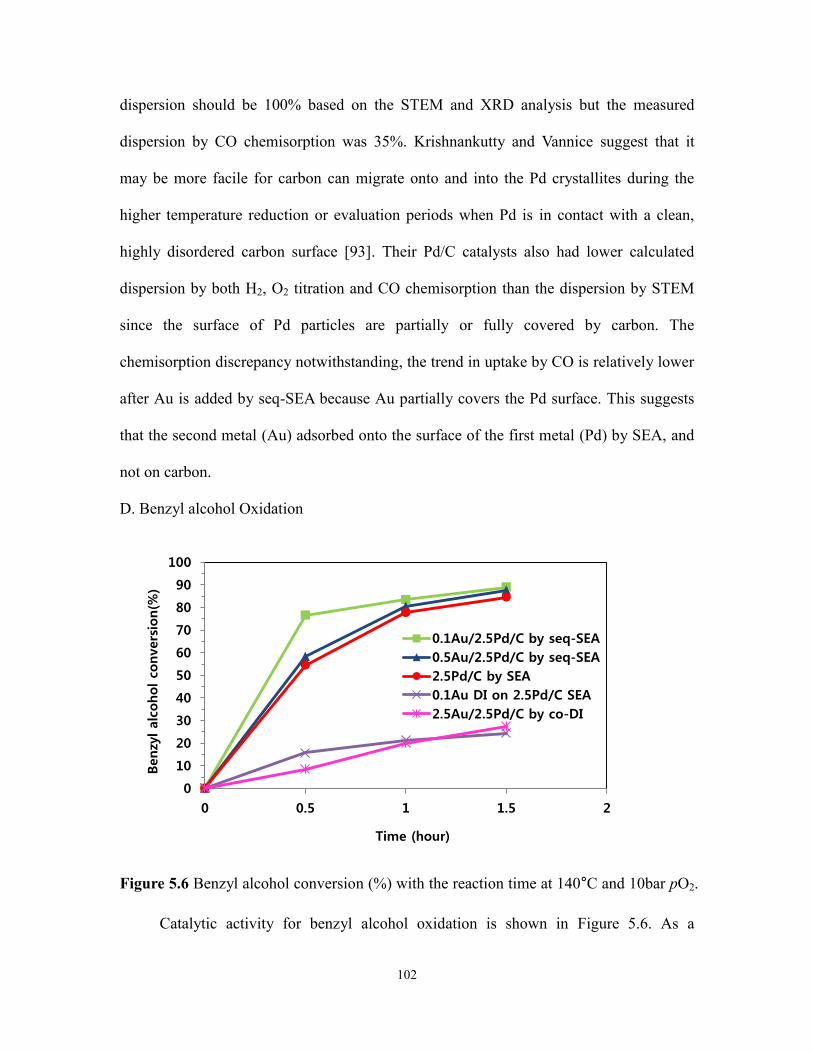
102
dispersion should be 100% based on the STEM and XRD analysis but the measured
dispersion by CO chemisorption was 35%. Krishnankutty and Vannice suggest that it
may be more facile for carbon can migrate onto and into the Pd crystallites during the
higher temperature reduction or evaluation periods when Pd is in contact with a clean,
highly disordered carbon surface [93]. Their Pd/C catalysts also had lower calculated
dispersion by both H2, O2 titration and CO chemisorption than the dispersion by STEM
since the surface of Pd particles are partially or fully covered by carbon. The
chemisorption discrepancy notwithstanding, the trend in uptake by CO is relatively lower
after Au is added by seq-SEA because Au partially covers the Pd surface. This suggests
that the second metal (Au) adsorbed onto the surface of the first metal (Pd) by SEA, and
not on carbon.
D. Benzyl alcohol Oxidation
Figure 5.6 Benzyl alcohol conversion (%) with the reaction time at 140°C and 10bar pO2.
Catalytic activity for benzyl alcohol oxidation is shown in Figure 5.6. As a
0
10
20
30
40
50
60
70
80
90
100
0 0.5 1 1.5 2
Benzy
l alc
ohol co
nvers
ion(%
)
Time (hour)
0.1Au/2.5Pd/C by seq-SEA
0.5Au/2.5Pd/C by seq-SEA
2.5Pd/C by SEA
0.1Au DI on 2.5Pd/C SEA
2.5Au/2.5Pd/C by co-DI
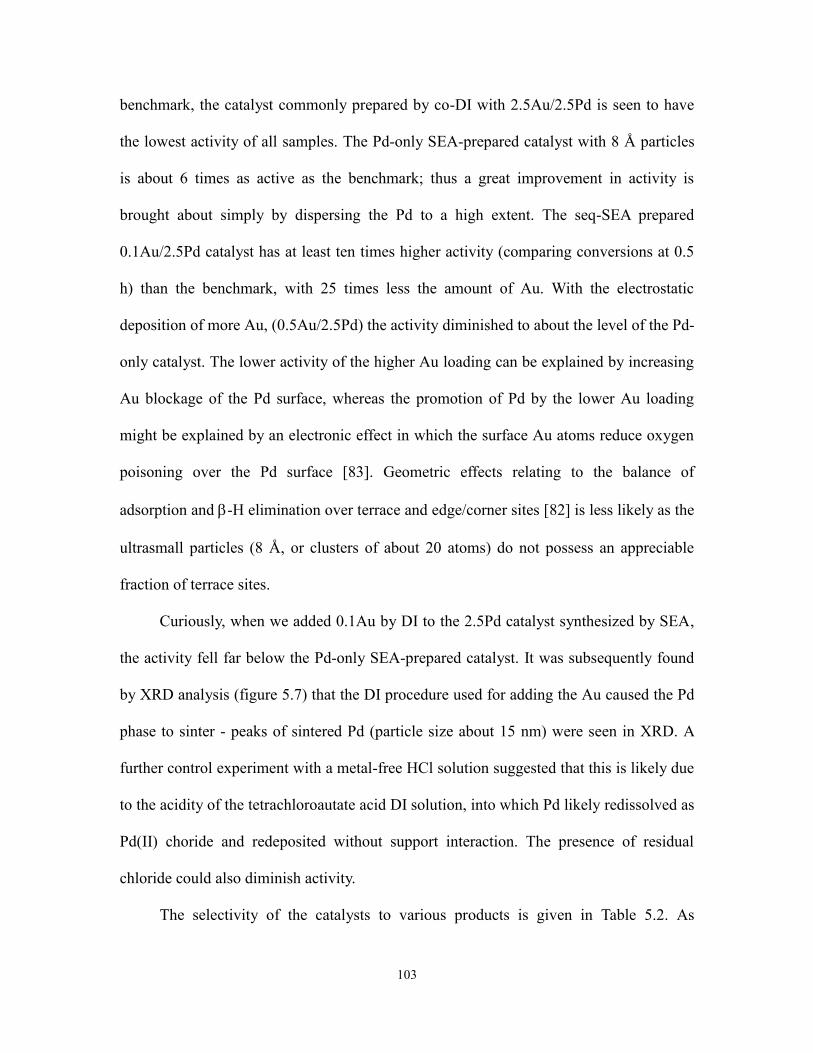
103
benchmark, the catalyst commonly prepared by co-DI with 2.5Au/2.5Pd is seen to have
the lowest activity of all samples. The Pd-only SEA-prepared catalyst with 8 Å particles
is about 6 times as active as the benchmark; thus a great improvement in activity is
brought about simply by dispersing the Pd to a high extent. The seq-SEA prepared
0.1Au/2.5Pd catalyst has at least ten times higher activity (comparing conversions at 0.5
h) than the benchmark, with 25 times less the amount of Au. With the electrostatic
deposition of more Au, (0.5Au/2.5Pd) the activity diminished to about the level of the Pd-
only catalyst. The lower activity of the higher Au loading can be explained by increasing
Au blockage of the Pd surface, whereas the promotion of Pd by the lower Au loading
might be explained by an electronic effect in which the surface Au atoms reduce oxygen
poisoning over the Pd surface [83]. Geometric effects relating to the balance of
adsorption and -H elimination over terrace and edge/corner sites [82] is less likely as the
ultrasmall particles (8 Å, or clusters of about 20 atoms) do not possess an appreciable
fraction of terrace sites.
Curiously, when we added 0.1Au by DI to the 2.5Pd catalyst synthesized by SEA,
the activity fell far below the Pd-only SEA-prepared catalyst. It was subsequently found
by XRD analysis (figure 5.7) that the DI procedure used for adding the Au caused the Pd
phase to sinter - peaks of sintered Pd (particle size about 15 nm) were seen in XRD. A
further control experiment with a metal-free HCl solution suggested that this is likely due
to the acidity of the tetrachloroautate acid DI solution, into which Pd likely redissolved as
Pd(II) choride and redeposited without support interaction. The presence of residual
chloride could also diminish activity.
The selectivity of the catalysts to various products is given in Table 5.2. As
104
expected the main product formed is the aldehyde as this is the primary product.
However as the reaction time increases for the SEA-prepared catalysts the selectivity to
benzoic acid, the sequential oxidation product, is enhanced. This is not observed for the
catalyst prepared by impregnation and shows the higher oxidation activity of the smaller
nanoparticles produced by this method. Toluene is formed by a transfer
10 20 30 40 50 60 70
0
50000
100000
150000
200000
250000 Carbon support
0.1Au DI on 2.5Pd/C
0.1Au DI on C
HCl on 2.5Pd/C
Inte
nsit
y
2 Theta
Figure 5.7. X-ray Diffraction patterns of 0.1wt% Au DI catalysts. Au and Pd (111) peaks
are indicated.
hydrogenation process and this is not particularly affected by the preparation method. The
catalysis results indicate the conversion activity enhancement is the main advantage of
the SEA method.
Au Pd rich phase
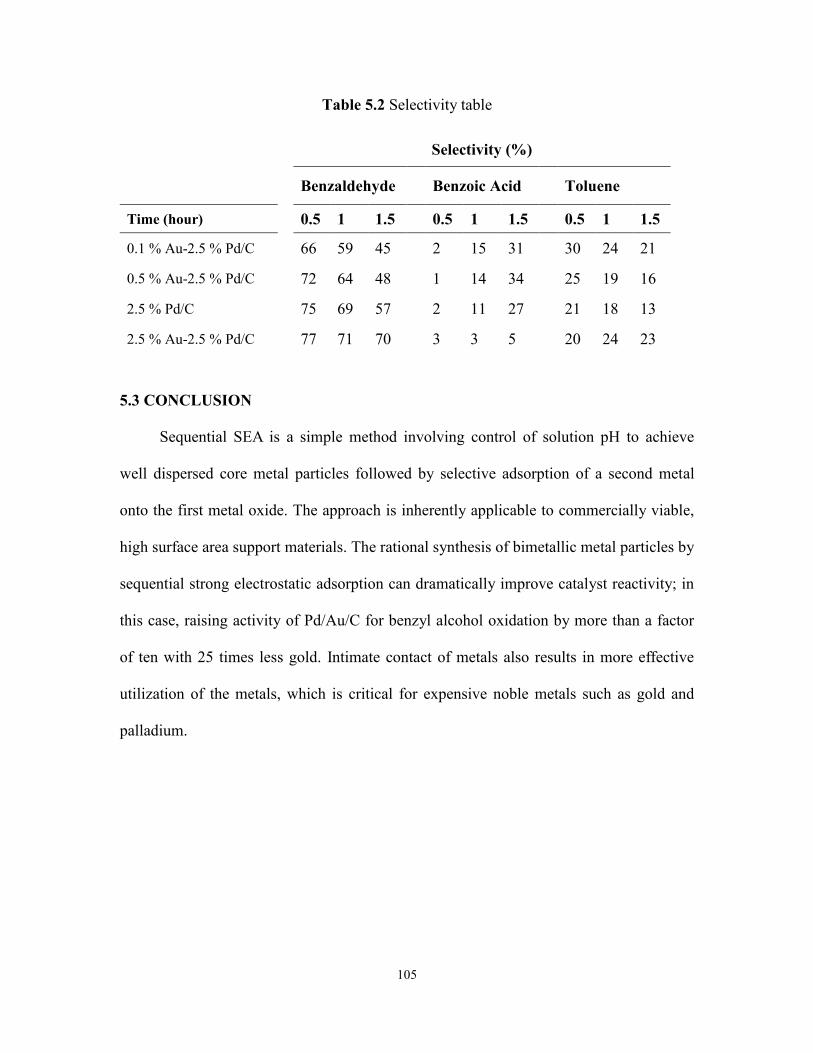
105
Table 5.2 Selectivity table
Selectivity (%)
Benzaldehyde
Benzoic Acid
Toluene
Time (hour) 0.5 1 1.5 0.5 1 1.5 0.5 1 1.5
0.1 % Au-2.5 % Pd/C 66 59 45 2 15 31 30 24 21
0.5 % Au-2.5 % Pd/C 72 64 48 1 14 34 25 19 16
2.5 % Pd/C 75 69 57 2 11 27 21 18 13
2.5 % Au-2.5 % Pd/C 77 71 70 3 3 5 20 24 23
5.3 CONCLUSION
Sequential SEA is a simple method involving control of solution pH to achieve
well dispersed core metal particles followed by selective adsorption of a second metal
onto the first metal oxide. The approach is inherently applicable to commercially viable,
high surface area support materials. The rational synthesis of bimetallic metal particles by
sequential strong electrostatic adsorption can dramatically improve catalyst reactivity; in
this case, raising activity of Pd/Au/C for benzyl alcohol oxidation by more than a factor
of ten with 25 times less gold. Intimate contact of metals also results in more effective
utilization of the metals, which is critical for expensive noble metals such as gold and
palladium.
106
REFERENCES
[1] Davis B.H., Ertl G., Knozinger H., Weitkamp J., Handbook of Heterogeneous
Catalysis, 1997
[2] Brunelle, J. P., Preparation of catalysts by metallic complex adsorption on mineral
oxides, Pure Appl. Chem. 50, 1978, 1211
[3] Heise, M.S., and Schwarz, J.A., Preparation of metal distributions within catalyst
supports 1. Effect of pH on catalytic metal profiles, J. Coll. Interf.Sci. 107, 1985, 51
[4] Heise, M.S., and Schwarz, J.A., Preparation of metal distributions within catalyst
supports 2. Effect of ionic strength on catalytic metal profiles, J. Coll. Interf.Sci. 113,
1986, 55
[5] Heise, M.S., and Schwarz, J.A., Preparation of metal distributions within catalyst
supports 3. Single component modeling of pH, ionic strength, and concentration
effects, J. Coll. Interf. Sci. 123, 1988, 237
[6] Schwarz, J.A., Heise, M.S.,Preparation of metal distributions within catalyst supports:
IV. Multicomponent effects, J. Colloid Interface Sci. 135, 1990, 461-467
[7] Park, J., Regalbuto, J.R., A simple, accurate determination of oxide PZC and strong
buffering effect of oxide sufaces at incipient wetness, J. Colloid Interface Sci. 175,
1995, 239-252
[8] Surface and Nanomolecular Catalysis, Chapter 6: A Scientific Method to Prepare
Supported Metal Catalysts, Richards, R. editor, Taylor and Francis/CRC Press, 2006
[9] Schreier, M., and Regalbuto, J.R., A Fundamental Study of Pt Ammine Impregnation
of Silica 1. The Electrostatic Nature of Pt Adsorption, J. Catal.225, 2004, 190
[10] Hao, X., and Regalbuto, J. R., A Further Simplification of the Revised Physical
Adsorption (RPA) Model, J. of Colloid Interface Sci. 267, 2003, 259
[11] Agashe, K.B. and J.R. Regalbuto,A Revised Physical Theory for Adsorption of Metal
Complexes at Oxide Surfaces, J. Colloid Interface Sci. 185, 1997, 174-189
[12] Silvana Braun, Lucia G. Appel, Vera L. Camorim, and Martin Schmal, Thermal
spreading of MoO3 onto Silica supports, J. Phys. Chem. B, 2000, 104, 6584-6590
107
[13] S. Noh, J. A. Schwarz, Estimation of the point of zero charge of simple oxides by
mass titration, J. Colloid Interface Sci.130, 1989, 157-164
[14] Malini Pasupong, Master thesis 2011, University of Illinois at Chicago
[15] Jiao, L., and Regalbuto, J.R., The Synthesis of Highly Dispersed Noble and Base
Metals on Silica via Strong Electrostatic Adsorption: I. Amorphous Silica, J.
Catalysis 260, 2008, 329
[16] Jiao, L., and Regalbuto, J.R., The Synthesis of Highly Dispersed Noble and Base
Metals on Silica via Strong Electrostatic Adsorption: II. Mesoporous Silica, J.
Catalysis 260, 2008, 342
[17] T. E Feltes, L. Espinosa-Alonso, E. de Smit, L. D'Souza, R. J. Meyer, B. M
Weckhuysen, J. R. Regalbuto , Selective Adsorption of Manganese onto Cobalt for
Optimized Mn/Co/TiO2 Fischer-Tropsch Catalysts, J. Catalysis 270, 2010, 95
[18] D’Souza, L., Regalbuto, J.R., Miller, J.T., and Kropf, A.J., Preparation of silica- and
carbon-supported cobalt by electrostatic adsorption of Co(III) hexaammines, J.
Catalysis, 248, 2007, 165
[19] D’Souza, L., Regalbuto, J.R., and Miller, J.T., Preparation of carbon supported
cobalt by electrostatic adsorption of [Co(NH3)6]Cl3, J. Catalysis 254, 2008, 157
[20] Catalyst Preparation: Science and Engineering, Chapter 13: Strong Electrostatic
Adsorption of Metals onto Catalyst Supports, Regalbuto, J.R., ed., Taylor and
Francis/CRC Press, 2007
[21] Schreier, M., Timmons, M., Feltes, T., and Regalbuto, J.R., The Determination of
Surface Charging Parameters for a Predictive Metal Adsorption Model, J. Colloid
Interface Sci. 348, 2010, 571
[22] Hao, X., and Regalbuto, J.R., Method for Preparing Highly Loaded, Highly
Dispersed Platinum Metal on a Carbon Substrate, U.S. Patent 7,312,174, filed Sept. 9,
2003, issued December 25, 2007
[23] Park, C., Fenter, P., Sturchio, N., and Regalbuto, J.R., Probing outer-sphere
adsorption of aqueous metal complexes at the oxide-water interface with resonant
anomalous x-ray reflectivity, Physics Review Letters 94, 2005, 076104/1
[24] J. S. Noh, J. A. Schwarz, Estimation of surface ionization constants for amphoteric
solids, J. Colloid Interface Sci. 1990, 139, 139-148
[25] S. Subramanian, J.S. Noh, J.A. Schwarz, Determination of the point of zero charge
of composite oxides, J. Catalysis 114, 1988, 433-439
108
[26] Job, N., Lambert, S., Preparation of highly loaded Pt/carbon xerogel catalysts for
Proton Exchange Membrane fuel cells by Strong Electrostatic Adsorption method,
Catalysis Today 150, 2010, 119-127
[27] Zhao, Y., Feltes, T. E., Regalbuto, J.R., R. J. Meyer, Klie, R., An analytical scanning
transmission electron microscopy study of the support effects on Mn-promoted Co
Fisher-Tropsch catalysts, Catalysis Science&Technology 1, 2011, 1483-1489
[28] Beard, K.D., Van Zee, J.W., and Monnier, J.R., Preparation of carbon-supported Pt-
Pd electrocatalysts with improved physical properties using electroless deposition
methods, Appl. Catal. B Env. 88, 2009, 185
[29] Alayoglu, S., Nilekar, A., Ru-Pt core-shell nanoparticles for preferential oxidation of
carbon monoxide in hydrogen, Nature Materials 7, 2008, 333-338
[30] Alayoglu, S., Eichhorn, B., Rh-Pt bimetallic catalysts: Synthesis, characterization,
and catalysis of core-shell, alloy, and monometallic nanoparticles, J. Am. Chem. Soc.
3, 2008, 810-815
[31] Smolentseva, S., Kusema, B., Selective oxidation of arabinose to arabinonic acid
over Pd-Au catalysts supported on alumina and ceria, Appl. Catal. A: Gen. 392, 2011,
69-79
[32] Hao, X., Quach, L., Korah, J.,andRegalbuto, J. R., The Engineering of Pt
Impregnation onto Oxides and Carbon, J. Molecular Catalysis 219, 2004, 97
[33] Castellazzi, P., Groppi, G., Forzatti, P., Effect of Pt-Pd ratio catalytic acitivity and
redox behavior of bimetallic Pt-Pd/Al2O3 catalysts for CH4 combustion, Appl.
Catal. B:Env. 95, 2010, 303-311\
[34] Nomura, K., Noro, K., Pd-Pt bimetallic catalyst supported on SAPO-5 for
catalytic combustion of diluted methane in the presence of water vapor, Catalysis
Letters 53, 1998, 167-169
[35] Persson, K., Ersson A., Cataltic combustion of methane over bimetallic Pd-Pt
catalysts: The influence of support materials, Appl. Catal. B:Env. 66, 2006, 175-
185
[36] Micheaud, C., Marecot, P., Preparation of alumina supported Pd-Pt catalysts by
surface redix reactions. Activity of complete hydrogen oxidation, Appl. Catal.
A:Gen. 171, 1998, 229-239
[37] Strobel, R., Grunwaldt, J.D., Flame-made alumina supported Pd-Pt
nanoparticles:structural properties and catalytic behavior in methane combustion,
Catalysis Letters 104, 2005, 9-15
[38] Lapisardi, G., Urfels, L., Superior catalytic be havior of Pt-doped Pd catalysts in the
complete oxidation of methane at low templerature, Catalysis Today 117, 2006, 564-
109
568
[39] Deganello, G., Duca, D., Pumice-supported Pd-Pt bimetallic catalysts:Synthesis,
structural characterization, and liquid-phase hydrogenation of 1,3-cyclooctadiene, J.
Catalysis 151, 1995, 125-134
[40] Castillo, N., Perez, R., Structural analysis of Pt-Pd nanoparticles dispersed on
titanium dioxide to evaluate cyclo-olefines reactivity, J. Alloys and Compounds 495,
2010, 453-457
[41] Guillon, E., Lynch, J., Charcterization of bimetallic Pt systems:application to the
reduction of aromatics in presence of sulfur, Catalysis Today 65, 2001, 201-208
[42] Fujikawa, T., Idei, K., Ohki, K., Mizuguchi, H., and Usui, K., Kinetic behavior of
hydrogenation of aromatics in diesel fuel over silica-alumina-supported bimetallic Pt-
Pd catalyst, Appl. Catal. A Gen. 205, 2001, 71
[43] Jan, C., Lin, T., Aromatics reduction over supported Pt catalysts. 3. Efeects of
catalysts precursors and pretreatment conditions on the performance of Pd-promoted
Pt catalysts, Ind. Eng. Chem. Res. 35, 1996, 3893-3898
[44] Lee., J., Rhee, H., Sulfur tolerance of zeolite beta-supported Pd-Pt catalysts for the
isomerization of n-Hexane, J. Catalysis 177, 1998, 208-216
[45] Blomsma, E., Martens, J.A., Isomerization and hydrocracking of heptane over
bimetallic bifunctional Pt/Pd H-beta and PtPd/USY zeolite catalysts, J. Catalysis 165,
1997, 241-248
[46] Loiha, S., Fottinger, K., Catalytic enhancement of Pt supported on zeolite beta for
toluene hydrogenation by addition of Pd, J. Industrial and Engineering Chem. 15,
2009, 819-823
[47] Jongpatiwut, S., Li, Z., Competitive hydrogenation of poly-aromatic hydrocarbons
on sulfur-resistance bimetallic Pt-Pd catalysts, Appl. Catal. A: Gen. 262, 2004, 241-
253
[48] Pawelec, B., Mariscal, R., Hydrogenation of aromatics over supported Pt-Pd
catalysts, Appl. Catal.A: Gen. 225, 2002, 223-237
[49] Navarro, R.M., Pawelec, B., Hydrogenation of aromatics on sulfur-resistance Pt-Pd
bimetallic catalysts, J. catalysis 189, 2000, 184-194
[50] Elangovan, S.P., Bischof, C., Isomerization and hydrocracking of n-decane over
bimetallic Pt-Pd clusters supported on mesoporous MCM-41 catalysts, Catalysis
Letters 80, 2002, 35-40
[51] Kim, H.S., Kim, T.W., Koh, H.L., Lee, S.H., and Min, B.R., Complete benzene
110
oxidation over Pt-Pd bimetal catalyst supported on γ-alumina: influence of Pt-Pd
ration on the catalytic activity, Appl. Catal. A Gen. 280, 2005, 125
[52] Yu, Z., Liao, S., Hydrogenation of nitroaromatics by polymer-anchored bimetallic
Pd-Ru and Pd-Pt catalysts under mild conditions, J. Molecular Catal. A: Chem. 120,
1997, 247-255
[53] Sharma, R., Zhou, B., Catalytic destruction of volatile organic compounds using
supported Pt and Pd hydrogphobic catalysts, Ind. Eng. Chem. Res. 34, 1995, 4310-
4317
[54] Papageorgopoulos, D.C., Keijzer, M., CO tolerance of Pd-rich Pt Pd carbon-
supported electrocatalysts, J. Electrochem. Soc. 149, 2022, A1400-1404
[55] Ji, X., Lee, K., Nanocrystalline intermetallics on mesoporous carbon for direct
formic acid fuel cell anodes, Nature Chemistry 2, 2010, 286-293
[56] Masato Ohashi, Kevin D. Beard, Shuguo Ma, Douglas A. Blom, Jean St-Pierre,
John W. Van Zee, John R. Monnier, Electrochemical and structural characterizationof
carbon-supported Pt–Pdbimetallic electrocatalysts prepared by electroless deposition,
ElectrochimicaActa 55, 2010, 7376–7384
[57] Liu, C., Shao, Z., Hydrodeoxygentaion of benzofuran over silica-alumina supported
Pt,Pd, and Pt-Pd catalysts, Energy Fuels 26, 2012, 4205-4211
[58] Roucoux, A., Schulz, J., and Patin, H., Reduced transition metal colloids: a family of
reusable catalysts?, Chem. Rev. 102, 2002, 3757
[59] Bonnemann, H., and Richards, R. M., Nanoscopic metal particles – synthetic
methods and potential applications, Eur. J. Inorg. Chem. 2001, 2455
[60] Scott, R. W. J., Wilson, O. M., and Crooks, R. M., Synthesis, characterization, and
applications of dendrimer-encapsulated nanoparticles, J. Phys. Chem. B 109, 2005,
692
[61] Peng, X., Pan, X., and Rempel, G.L., Bimetallic dendrimer-encapsulated
nanoparticles as catalysts: a review of the research advances, Chem. Soc. Rev., 37,
2008, 1619
[62] Liu, D.X., Lopez-de Jesus, Y.M., Monnier, J.R., and Williams, C.T., Preparation ,
characterization, and kinetic evaluation of dendrimer-derived bimetallicfPt-Ru/SiO2
catalysts, J. Catalysis 269, 2010, 376
[63] Kulp, C., Chen, X., Puschof, A., Schwamborn, S., Somsen, C., Schuhmann, W., and
Bron, M., Electrochemical synthesis of core-shell catalysts for electrocatalytic
applications, ChemPhysChem 11, 2010, 2854
111
[64] Rebelli, J., Detwiler, M., Ma, Synthesis and characterization of Au-Pd bimetallic
catalysts prepared by electroless deposition, J. Catalysis 270, 2010, 224
[65] Espinosa, G., Del Angel, G., Barbier, J., Bosch, P., lara, V., and Acosta, D., Catalytic
behavior and active sites structure of PtAu/Al2O3 bimetallic catalysts prepared by
surface redox reactions, J. Molc. Catal. A. Chem. 164, 2000, 253
[66] E. Kratzer. Thesis 2006. The Synthesis of Carbon Supported Palladium Catalysts by
Strong Electrostatic Adsorption. In Chemical Engineering.Univeristy of Illinois at
Chicago, Chicago
[67] Moralng, A., Neuhausen, U., Bimetallic Pt/Pd diesel oxidation catalysts structural
characterization and catalytic behavior, Appl. Catal. B: Env. 60, 2005, 191-199
[68] Mori, K., Hera, T., Hydroxyapatite-supported Pd nanocluster: a highly active
heterogeneous catalyst for selective oxidation of alcohols by use of molecular oxygen,
J. Am. Chem. Soc. 126, 2004, 10657-10666
[69] Meenakshisundaram, S., Nowicka, E., Oxidation of alcohols using supported Au and
Au-Pd nanoparticles, Faraday Discuss. 145, 2010, 341-356
[70] Schultz, M., Adler, R., Using mechanistic and computational studies to explain
ligand effects in the Pd-catalyzed aerobic oxidation of alcohols, J. Am. Chem. Soc.
127, 2205, 8499-8507
[71] Dimitratos, N., Lopez-Sanchez, J.A., Solvent free liquid phase oxidation of benzyl
alcohol using Au supported catalysts prepared using a sol immobilization technique,
Catalysis Today 122, 2007, 317-324
[72] Lopez-Sanchez, J.A., Dimitratos, N., Reactivity studies of Au-Pd supported
nanoparticles for catalytic applications, Appl. Catal. A:Gen., 391, 2011, 400-406
[73] Tiruvalam, R.C., Pritchard, J.C., Aberration corrected analytical electron microscopy
studies of sol-immobilized Au+Pd, Au{Pd} and Pd{Au} catalysts used for benzyl
alcohol oxidation and hydrogen peroxide production, Faraday Discussions 152, 2011,
63-86
[74] Sheldon, R.A., Arends, I.W.C.E., New developments in catalytic alcohols oxidations
for fine chemicals synthesis, Catalysis Today 57, 2000, 157-166
[75] Nishimura, T., Onoue, T., Pd(OAc)2-catalyzed oxidation of alcohols to aldehydes
and ketones by molecular oxygen, Tetrahedron Letters 39, 1998, 6011-6014
[76] Ferreira, Eric., Stoltz, B., The Pd-catalyzed oxidative kinetic resolution of secondary
alcohols with molecular oxygen, J. Am. Chem. Soc. 123, 2001, 7725-7726
[77] Wang, X., Wu, G., Supported Pd catalysts for solvent-free benzyl alcohols selective
112
oxidation: Effects of calcination pretreatments and reconstruction of Pd sites, Appl.
Catal. B:Env. 115-116, 2012, 7-15
[78] Conley, N., Labios, L., Aerobic alcohol oxidation with cationic Pd
complexes:Insights into catalyst design and decomposition, Organometallics 26, 2007,
23
[79] Hughes, m., Xu, Y., Tunable Au catalysts for selective hydrocarbon oxidation under
mild conditions, Nature 437, 2005, 1132-1135
[80] Chen, M., Kumar, D., The promotional effect of Au in catalysis by Pd-Au, Science
310, 2005, 291-293
[81] Echae, D., Edwards, J., Solvent-free oxidation of primary alcohols to aldehydes
using Au-Pd/TiO2 catalysts, Science 311, 2206, 362-365
[82] Chen, Y., Wang, H., Formation of monometallic Au and Pd and bi,etallic Au-Pd
nanoparticles confined in mesopores via Ar glow-discharge plasma reduction and
their catalytic applications in aerobic oxidation of benzyl alcohol, J. Catalysis 289,
2012, 105-117
[83] Dimitratos, N., Villa, A., Pd and Pt catalysts modified by alloying with Au in the
selective oxidation of alcohols, J. Catalysis 244, 2006, 113-121
[84] Miedziak, P., Sankar, M., Oxidation of benzyl alcohol using supported Au-Pd
nanoparticles, Catalysis Today 164, 2011, 315-319
[85] Edwards, J., Edwin Ntainjua N, Direct synthesis of H2O from H2 and O2 over
Au, Pd, and Au-Pd catalysts supported on acid-pretreated TiO2, Angew. Chem. Int.
Ed. 48, 2009, 8512-8515
[86] Pritchard, J., He, Q., The effect of catalyst preparation method on the
performance of supported Au-Pd catalysts for the direct synthesis of hydrogen
peroxide, Green Chemistry 12 , 2010, 915-921
[87] Edwards, J., Solsona, B., Switching off hydrogen peroxide hydrogenation in the
direct synthesis process, Science 323, 2009, 1037-1041
[88] Hutchings, Graham. J., Supported Au and Au-Pd catalysts for selective synthesis,
Catalysis Today 138, 2008, 9-14
[89] Edwin Ntainjua N, Piccinini, M., Efeect of halide and acid additives on the direct
synthesis of hydrogen peroxide using supported Au-Pd catalysts, ChemSusChem 2,
2009, 575-580
[90] Piccinini, M., Edwin Ntainjua N, Effect of reaction conditions on the performance of
Au-Pd/TiO2 catalyst for the direct synthesis of hydrogen peroxide, Phys. Chem.
113
Chem. Phys. 12, 2012, 2488-2492
[91] Edwards, J., Hutchings, G. J., Pd and Au-Pd catalysts for the direct synthesis of
hydrogen peroxide, Angew. Chem. Int. Ed. 47, 2008, 9192-9198
[92] Toshima, N., Harada, M., Catalytic activity and structural analysis of polymer-
protected Au-Pd bimetallic clusters prepared by the simultaneous reduction of
HAuCl4 and PdCl2, J. Phys. Chem 96, 1992, 9927-9933
[93] Krishnankutty, N., Vannice, A., The effect of pretreatment on Pd/C catalysts, J.
Catalysis 155, 1995, 312-326
[94] C. Hwang, C. Yeh, Platinum-oxide species formed by oxidation of platinum
crystallites supported on alumina, J. Molecular Catalysis A: Chem. 112, 1996,
295-302