The Rat Prefrontostriatal System Analyzed in 3D: Evidence for ...
10
Systems/Circuits The Rat Prefrontostriatal System Analyzed in 3D: Evidence for Multiple Interacting Functional Units Philippe Mailly, 1 Verena Aliane, 2 Henk J. Groenewegen, 3 Suzanne N. Haber, 4 and Jean-Michel Deniau 5 1 Institut National de la Sante ´ et de la Recherche Me ´dicale UMRs 952, Centre National de Recherche Scientifique UMR 7224, Universite ´ Pierre et Marie Curie, 75252 Paris Cedex 05, France, 2 Department of Experimental Neurophysiology, Medical Faculty, Ruhr-University of Bochum, D-44780 Bochum, Germany, 3 Department of Anatomy and Neurosciences, Neuroscience Campus Amsterdam, VU University Medical Center, 1007 MB Amsterdam, The Netherlands, 4 Department of Neurobiology and Anatomy, University of Rochester School of Medicine, Rochester, New York 14642, and 5 Institut National de la Sante ´ et de la Recherche Me ´dicale U. 667, Colle `ge de France, 75 231 Paris Cedex 05, France Previous studies in monkeys disclosed a specific arrangement of corticostriatal projections. Prefrontal and premotor areas form dense projection fields surrounded by diffuse terminal areas extending outside the densely innervated region and overlapping with projections from other areas. In this study, the mode of prefrontostriatal innervation was analyzed in rats using a 3D approach. Following injections of tracers in defined cortical areas, 3D maps from individual cases were elaborated and combined into a global 3D map allowing us to define putative overlaps between projection territories. In addition to providing a detailed 3D mapping of the topographic representation of prefrontal cortical areas in the rat striatum, the results stress important similarities between the rodent and primate prefrontostriatal projections. They share the dual pattern of focal and diffuse corticostriatal projections. Moreover, besides segregated projections con- sistent with parallel processing, the interweaving of projection territories establishes specific patterns of overlaps spatially organized along the dorsoventral, mediolateral, and anteroposterior striatal axis. In particular, the extensive striatal projection fields from the prelimbic and anterior cingulate areas, which partly overlap the terminal fields from medial, orbital, and lateral prefrontal cortical areas, provide putative domains of convergence for integration between reward, cognitive, and motor processes. Introduction The striatum is a main component of the basal ganglia involved in adaptive control of behavior and automation of action (Graybiel, 1998, 2005; Yin and Knowlton, 2006). Besides sensory-motor processes underlying motor habits, the striatum contributes to cognitive and motivational processes important for incentive- based learning. Receiving inputs from virtually the entire cerebral cortex and the limbic system (McGeorge and Faull, 1989; Parent, 1990; Groenewegen and Berendse, 1994), the striatum is pro- vided with a diversity of signals (sensory, motor, motivational, emotional) allowing the selection of adapted behavioral goals and elaboration of the corresponding sequence of actions to be en- gaged. In turn, via the substantia nigra and the pallidum, the striatum influences prefrontal cortical areas implicated in de- cision making and executive functions (Ilinsky et al., 1985; Groenewegen and Berendse, 1994; Joel and Weiner, 1994; Middleton and Strick, 1994; Deniau and Thierry, 1997; Haber and Calzavara, 2009). How the striatum integrates this diversity of information is not fully understood. Rather than an integrative system, most corticobasal ganglia models have emphasized parallel and segre- gated circuits (Alexander and Crutcher, 1990; Groenewegen and Berendse, 1994; Deniau and Thierry, 1997). However, corticos- triatal projections are also characterized by defined patterns of convergence organized both within and between different func- tional areas. (Yeterian and Van Hoesen, 1978; Alexander and Crutcher, 1990; Reep et al., 2003; Draganski et al., 2006; Haber, 2011). Moreover, in primates, there are two patterns of projec- tions from each cortical area: (1). the well described dense pro- jection fields and (2). diffuse and scattered terminal areas that extend widely outside the densely innervated region. Both these patterns of terminals overlap with those from other cortical re- gions. The areas of convergent terminals may be important for integration between different aspects of prefrontal functions (Reep et al., 2003; Haber et al., 2006; Calzavara et al., 2007). Determining the precise mode of convergence and segrega- tion of corticostriatal inputs in rodents is the first step to elucidate the role of striatum in learning behavioral rules in a rodent model. Moreover, comparing the organizational principles be- tween the rodent and primate corticostriatal circuits may con- tribute to establishing functional homologies across species. Here, using a 3D approach, we analyzed the organization of prefrontostriatal inputs in the rat brain to determine (1) whether, as in monkeys, the prefrontal cortical areas present focal and Received Nov. 12, 2012; revised Jan. 28, 2013; accepted Feb. 17, 2013. Author contributions: P.M. and J.-M.D. designed research; P.M., V.A., H.J.G., and J.-M.D. performed research; P.M. contributed unpublished reagents/analytic tools; P.M., V.A., H.J.G., S.N.H., and J.-M.D. analyzed data; P.M., H.J.G., S.N.H., and J.-M.D. wrote the paper. This work has been supported by grants from INSERM, Centre National de la Recherche Scientifique, Universite Pierre et Marie Curie, and Colle `ge de France. Part of this study was financed by a travel grant from Boehringer Ingelheim. We thank Anne-Marie Godeheu and Nicole Quenech’du for technical assistance. The authors declare no competing financial interests. Correspondence should be addressed to Philippe Mailly, Institut National de la Sante ´ et de la Recherche Me ´dicale UMRs 952, Centre National de Recherche Scientifique UMR 7224, Universite ´ Pierre et Marie Curie, 7-9 quai Saint Bernard, bat B 723, 75252 Paris Cedex 05, France. E-mail: [email protected]. DOI:10.1523/JNEUROSCI.5248-12.2013 Copyright © 2013 the authors 0270-6474/13/335718-10$15.00/0 5718 • The Journal of Neuroscience, March 27, 2013 • 33(13):5718 –5727
Transcript of The Rat Prefrontostriatal System Analyzed in 3D: Evidence for ...

Systems/Circuits
The Rat Prefrontostriatal System Analyzed in 3D: Evidencefor Multiple Interacting Functional Units
Philippe Mailly,1 Verena Aliane,2 Henk J. Groenewegen,3 Suzanne N. Haber,4 and Jean-Michel Deniau5
1Institut National de la Sante et de la Recherche Medicale UMRs 952, Centre National de Recherche Scientifique UMR 7224, Universite Pierre et MarieCurie, 75252 Paris Cedex 05, France, 2Department of Experimental Neurophysiology, Medical Faculty, Ruhr-University of Bochum, D-44780 Bochum,Germany, 3Department of Anatomy and Neurosciences, Neuroscience Campus Amsterdam, VU University Medical Center, 1007 MB Amsterdam, TheNetherlands, 4Department of Neurobiology and Anatomy, University of Rochester School of Medicine, Rochester, New York 14642, and 5Institut Nationalde la Sante et de la Recherche Medicale U. 667, College de France, 75 231 Paris Cedex 05, France
Previous studies in monkeys disclosed a specific arrangement of corticostriatal projections. Prefrontal and premotor areas form denseprojection fields surrounded by diffuse terminal areas extending outside the densely innervated region and overlapping with projectionsfrom other areas. In this study, the mode of prefrontostriatal innervation was analyzed in rats using a 3D approach. Following injectionsof tracers in defined cortical areas, 3D maps from individual cases were elaborated and combined into a global 3D map allowing us todefine putative overlaps between projection territories. In addition to providing a detailed 3D mapping of the topographic representationof prefrontal cortical areas in the rat striatum, the results stress important similarities between the rodent and primate prefrontostriatalprojections. They share the dual pattern of focal and diffuse corticostriatal projections. Moreover, besides segregated projections con-sistent with parallel processing, the interweaving of projection territories establishes specific patterns of overlaps spatially organizedalong the dorsoventral, mediolateral, and anteroposterior striatal axis. In particular, the extensive striatal projection fields from theprelimbic and anterior cingulate areas, which partly overlap the terminal fields from medial, orbital, and lateral prefrontal cortical areas,provide putative domains of convergence for integration between reward, cognitive, and motor processes.
IntroductionThe striatum is a main component of the basal ganglia involved inadaptive control of behavior and automation of action (Graybiel,1998, 2005; Yin and Knowlton, 2006). Besides sensory-motorprocesses underlying motor habits, the striatum contributes tocognitive and motivational processes important for incentive-based learning. Receiving inputs from virtually the entire cerebralcortex and the limbic system (McGeorge and Faull, 1989; Parent,1990; Groenewegen and Berendse, 1994), the striatum is pro-vided with a diversity of signals (sensory, motor, motivational,emotional) allowing the selection of adapted behavioral goals andelaboration of the corresponding sequence of actions to be en-gaged. In turn, via the substantia nigra and the pallidum, thestriatum influences prefrontal cortical areas implicated in de-cision making and executive functions (Ilinsky et al., 1985;Groenewegen and Berendse, 1994; Joel and Weiner, 1994;
Middleton and Strick, 1994; Deniau and Thierry, 1997; Haberand Calzavara, 2009).
How the striatum integrates this diversity of information isnot fully understood. Rather than an integrative system, mostcorticobasal ganglia models have emphasized parallel and segre-gated circuits (Alexander and Crutcher, 1990; Groenewegen andBerendse, 1994; Deniau and Thierry, 1997). However, corticos-triatal projections are also characterized by defined patterns ofconvergence organized both within and between different func-tional areas. (Yeterian and Van Hoesen, 1978; Alexander andCrutcher, 1990; Reep et al., 2003; Draganski et al., 2006; Haber,2011). Moreover, in primates, there are two patterns of projec-tions from each cortical area: (1). the well described dense pro-jection fields and (2). diffuse and scattered terminal areas thatextend widely outside the densely innervated region. Both thesepatterns of terminals overlap with those from other cortical re-gions. The areas of convergent terminals may be important forintegration between different aspects of prefrontal functions(Reep et al., 2003; Haber et al., 2006; Calzavara et al., 2007).
Determining the precise mode of convergence and segrega-tion of corticostriatal inputs in rodents is the first step to elucidatethe role of striatum in learning behavioral rules in a rodentmodel. Moreover, comparing the organizational principles be-tween the rodent and primate corticostriatal circuits may con-tribute to establishing functional homologies across species.
Here, using a 3D approach, we analyzed the organization ofprefrontostriatal inputs in the rat brain to determine (1) whether,as in monkeys, the prefrontal cortical areas present focal and
Received Nov. 12, 2012; revised Jan. 28, 2013; accepted Feb. 17, 2013.Author contributions: P.M. and J.-M.D. designed research; P.M., V.A., H.J.G., and J.-M.D. performed research;
P.M. contributed unpublished reagents/analytic tools; P.M., V.A., H.J.G., S.N.H., and J.-M.D. analyzed data; P.M.,H.J.G., S.N.H., and J.-M.D. wrote the paper.
This work has been supported by grants from INSERM, Centre National de la Recherche Scientifique, UniversitePierre et Marie Curie, and College de France. Part of this study was financed by a travel grant from BoehringerIngelheim. We thank Anne-Marie Godeheu and Nicole Quenech’du for technical assistance.
The authors declare no competing financial interests.Correspondence should be addressed to Philippe Mailly, Institut National de la Sante et de la Recherche Medicale
UMRs 952, Centre National de Recherche Scientifique UMR 7224, Universite Pierre et Marie Curie, 7-9 quai SaintBernard, bat B 723, 75252 Paris Cedex 05, France. E-mail: [email protected].
DOI:10.1523/JNEUROSCI.5248-12.2013Copyright © 2013 the authors 0270-6474/13/335718-10$15.00/0
5718 • The Journal of Neuroscience, March 27, 2013 • 33(13):5718 –5727
diffuse terminal fields within the striatum and (2) the degree ofoverlap between corticostriatal projection fields. The prefrontalcortex of the rat consists of several areas that have been definedbased on anatomical and behavioral criteria (Kolb, 1984;Heidbreder and Groenewegen, 2003; Uylings et al., 2003;Schilman et al., 2008; Van De Werd and Uylings, 2008). Injec-tions of tracers were placed in the main subdivisions of the ratprefrontal cortex, corticostriatal projections were charted, and3D reconstructions of the projection fields were elaborated. Fol-lowing a procedure previously applied to investigate the interre-lationships between corticostriatal projections fields in monkeys(Calzavara et al., 2007), the 3D maps from individual injectioncases were combined into a global 3D map (Mailly et al., 2010).
Materials and MethodsThe organization of prefrontal corticostriatal projections has been exam-ined in experimental cases in which the anterograde tracers Phaseolusvulgaris-leucoagglutinin (PHA-L) injected into areas of the anterome-dial, orbital, and rostrolateral cortex. For this study, we selected the casesin which injections were large enough to cover the cortical layers II–VI.Corticocortical and thalamocortical labeling was used to verify the spec-ificity of the injection sites. For each case, the dense (or focal) terminalfield was delineated and individual fibers outside the focal projectionfield (referred to as diffuse projections) were charted throughout thestriatum to create 3D maps of the fields. These were joined into one 3Dmap to determine the extent of possible interactions between differentprefrontal cortex regions. Reliability of 3D mapping was assessed bycomparing the maps of reconstructed projection fields from injections ofthe same prefrontal cortical area in different animals as well as examiningputative convergence between projections in individual cases that hadtwo tracer injections in different cortical regions.
Surgery and tissue preparation. Twenty adult male Sprague Dawley rats(weight 250 –350 g; Charles River) were used for the tracing studies (seeTable 1). Surgical procedures were applied in strict accordance with theEuropean Communities Council directive 86/609/EEC, 1986. Animalswere anesthetized by an injection of sodium pentobarbital (Nembutal, 40mg/kg, i.p.; Sanofi). Additional injections of ketamine (30 mg/kg, i.m.)were occasionally necessary to adjust the level of anesthesia. In addition,10% lidocaine was used as local anesthetic for the skin at the sites ofincision. Foot withdrawal reflex was checked to assess the depth of anes-thesia. The anesthetized animals were placed in a stereotaxic frame. Bodytemperature was maintained between 36 and 38°C by the use of a homeo-thermic mat. The brain was exposed through small burr holes in the
skull, and the anterograde tracer PHA-L (Vector Laboratories) was in-jected unilaterally in single areas of the prefrontal cortex. In three casesanimals received dual injections of PHA-L and Lucifer yellow (LY) (Vec-tor Laboratories) in two different cortical areas (Table 1). The coordi-nates were derived from the atlas of Paxinos and Watson (1986).
The tracer PHA-L dissolved at 2.5% in 0.1 M sodium phosphate buffer(PB), pH 7.4, delivered iontophoretically through glass micropipettes(CG 150; Clark) with an internal tip diameter of 20 –30 �m, by applyingpositive rectangular pulses (7 s on/7 s off, 5 �A for 10 –20 min per injec-tion site). LY was dissolved in 0.1 M PB, pH 7.4, to yield a 10% concen-tration and injected as described above for PHA-L.
After a 7 d postoperative survival period, the animals were deeplyre-anesthetized with sodium pentobarbital (Nembutal, 160 mg/kg, i.p.)and rapidly perfused transcardially with 0.9% saline followed by a fixa-tive containing 4% paraformaldehyde–0.05% glutaraldehyde in PB (0.1 M,pH 7.4). Following an overnight fixation period, the brains were sec-tioned coronally at 50 �m on a freezing microtome and the sections wereprocessed for PHA-L or LY histochemistry. A reliable plane of sectionwas obtained by cutting the brains dorsoventrally at the level of thecerebellum along a vertical plane tilted 18° toward the rostral part of thebrain and sections were cut parallel to this plane. The sections were rinsedwith PB followed by 0.05 M Tris/HCl (Merck) supplemented with 0.15 M
NaCl, pH 7.6 (Tris buffered saline; TBS-T), and 0.5% Triton X-100(TBS-Tx; Merck). They were subsequently incubated for 48 h at 4°C ingoat anti PHA-L (1:1000 dilution; Vector Laboratories) or goat anti-LY(1:3000 dilution; Invitrogen) in TBS-T. After rinsing (all intermediatesteps between different incubations include three rinses of the indicatedbuffer for 10 min each) with TBS-T, the sections were incubated for 18 hat room temperature in biotinylated rabbit anti-goat IgG followed byincubation in avidin-biotin-peroxidase complex (Vector Laboratories)in TBS-Tx for 1.5 h at room temperature. After rinsing with Tris/HCl,PHA-L was visualized by standard diaminobenzidine procedures. Stain-ing was intensified by incubating the tissue for 5–15 min in a solution of0.05% 3,3� diaminobenzidine tetra-hydrochloride, 0.025% cobalt chlo-ride, 0.02% nickel ammonium sulfate, and 0.01% H2O2 to yield a blacksection product. In cases in which two tracers was injected into a singleanimal (PHA-L and LY), adjacent sections were treated for each antibodyprotocol. Sections were mounted onto gel-coated slides, dehydrated, de-fatted in xylene, and coverslipped with Permount.
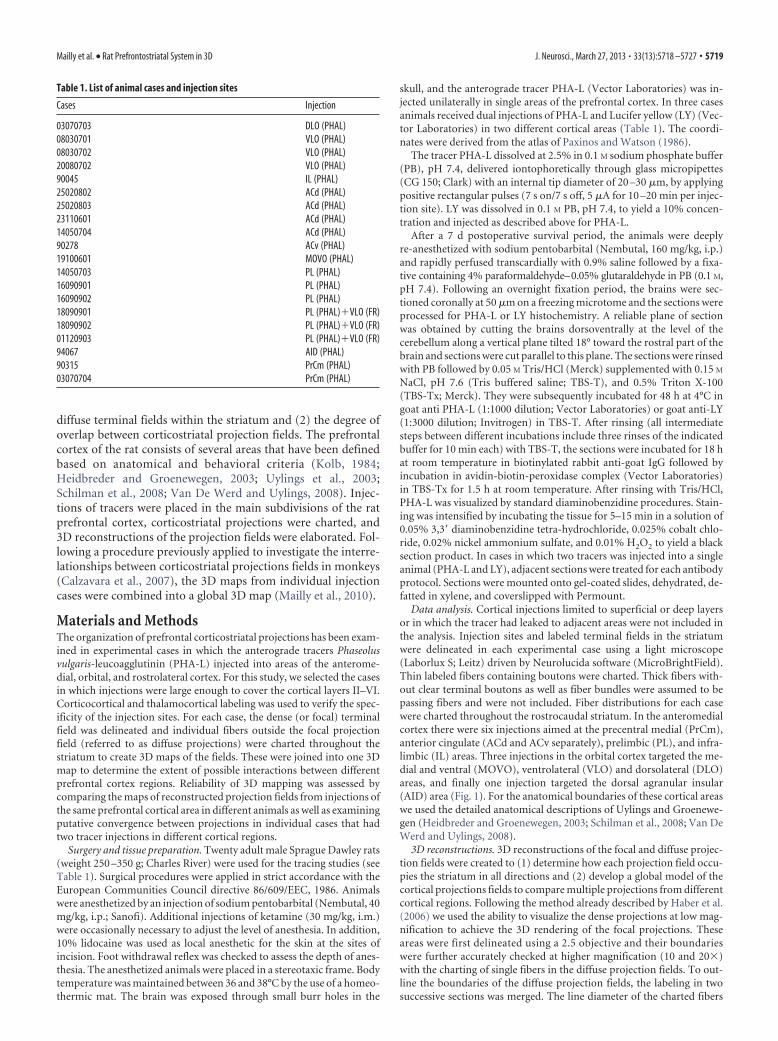
Data analysis. Cortical injections limited to superficial or deep layersor in which the tracer had leaked to adjacent areas were not included inthe analysis. Injection sites and labeled terminal fields in the striatumwere delineated in each experimental case using a light microscope(Laborlux S; Leitz) driven by Neurolucida software (MicroBrightField).Thin labeled fibers containing boutons were charted. Thick fibers with-out clear terminal boutons as well as fiber bundles were assumed to bepassing fibers and were not included. Fiber distributions for each casewere charted throughout the rostrocaudal striatum. In the anteromedialcortex there were six injections aimed at the precentral medial (PrCm),anterior cingulate (ACd and ACv separately), prelimbic (PL), and infra-limbic (IL) areas. Three injections in the orbital cortex targeted the me-dial and ventral (MOVO), ventrolateral (VLO) and dorsolateral (DLO)areas, and finally one injection targeted the dorsal agranular insular(AID) area (Fig. 1). For the anatomical boundaries of these cortical areaswe used the detailed anatomical descriptions of Uylings and Groenewe-gen (Heidbreder and Groenewegen, 2003; Schilman et al., 2008; Van DeWerd and Uylings, 2008).
3D reconstructions. 3D reconstructions of the focal and diffuse projec-tion fields were created to (1) determine how each projection field occu-pies the striatum in all directions and (2) develop a global model of thecortical projections fields to compare multiple projections from differentcortical regions. Following the method already described by Haber et al.(2006) we used the ability to visualize the dense projections at low mag-nification to achieve the 3D rendering of the focal projections. Theseareas were first delineated using a 2.5 objective and their boundarieswere further accurately checked at higher magnification (10 and 20�)with the charting of single fibers in the diffuse projection fields. To out-line the boundaries of the diffuse projection fields, the labeling in twosuccessive sections was merged. The line diameter of the charted fibers
Table 1. List of animal cases and injection sites
Cases Injection
03070703 DLO (PHAL)08030701 VLO (PHAL)08030702 VLO (PHAL)20080702 VLO (PHAL)90045 IL (PHAL)25020802 ACd (PHAL)25020803 ACd (PHAL)23110601 ACd (PHAL)14050704 ACd (PHAL)90278 ACv (PHAL)19100601 MOVO (PHAL)14050703 PL (PHAL)16090901 PL (PHAL)16090902 PL (PHAL)18090901 PL (PHAL)�VLO (FR)18090902 PL (PHAL)�VLO (FR)01120903 PL (PHAL)�VLO (FR)94067 AID (PHAL)90315 PrCm (PHAL)03070704 PrCm (PHAL)
Mailly et al. • Rat Prefrontostriatal System in 3D J. Neurosci., March 27, 2013 • 33(13):5718 –5727 • 5719
was increased and a minimal surface area was defined to threshold auto-matically the areas of significant density. The same parameters were ap-plied for all cases.
For each case, stained sections were digitized using a scanner (Epson V750 Pro; Seiko Epson) with a resolution of 3200 dpi (8 �m/pixel) in16-bit gray scale. A stack of 2D coronal sections was created using IMODsoftware (Boulder laboratory for 3D Electron Microscopy of Cells, Uni-versity of Colorado, Boulder, CO) (Kremer et al., 1996). As previouslydescribed by (Mailly et al., 2010) sections were aligned using manualrigid body transformations. The Neurolucida chartings were convertedinto the IMOD format using a specific program developed for this pur-pose. A 3D reconstruction that contained structures of interest (striatum,projections fields, cortex, injection sites, and structures of interest such ascorpus callosum and anterior commissure) was created for each caseseparately. Data from each case was then registered into a single referencemodel using landmarks of key internal structures (striatum and sur-rounding structures) (Mailly et al., 2010). The model could be sectionedthroughout its rostrocaudal extent to determine the patterns of segrega-tion and convergence between projection fields.
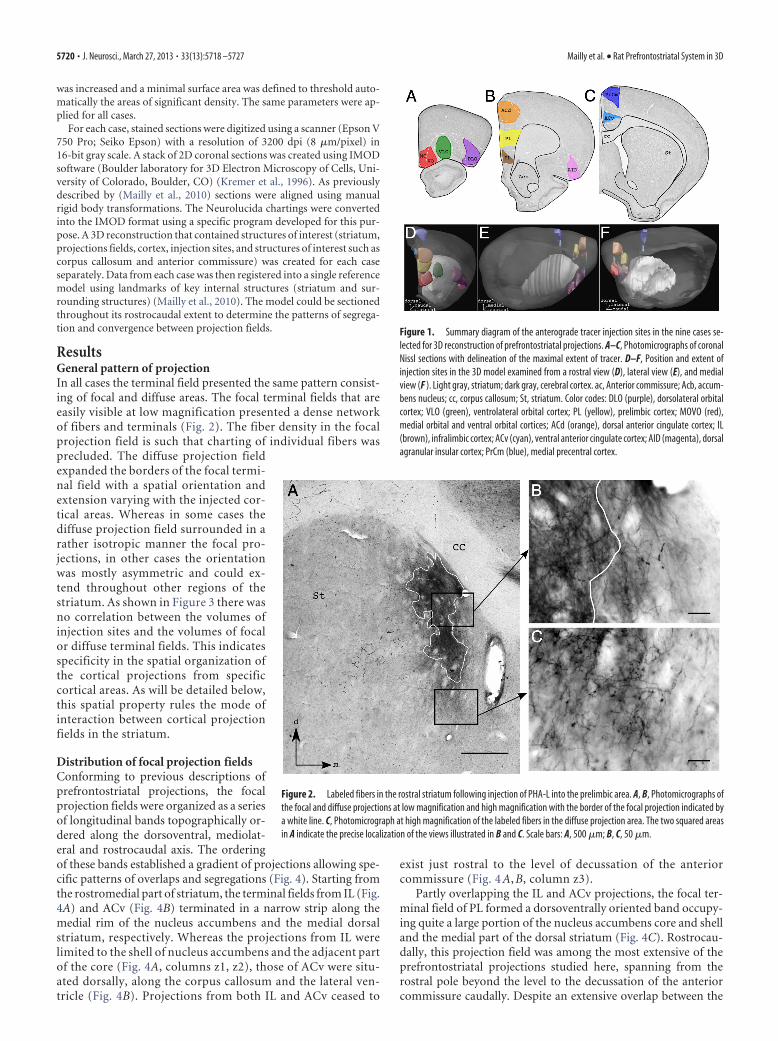
ResultsGeneral pattern of projectionIn all cases the terminal field presented the same pattern consist-ing of focal and diffuse areas. The focal terminal fields that areeasily visible at low magnification presented a dense networkof fibers and terminals (Fig. 2). The fiber density in the focalprojection field is such that charting of individual fibers wasprecluded. The diffuse projection fieldexpanded the borders of the focal termi-nal field with a spatial orientation andextension varying with the injected cor-tical areas. Whereas in some cases thediffuse projection field surrounded in arather isotropic manner the focal pro-jections, in other cases the orientationwas mostly asymmetric and could ex-tend throughout other regions of thestriatum. As shown in Figure 3 there wasno correlation between the volumes ofinjection sites and the volumes of focalor diffuse terminal fields. This indicatesspecificity in the spatial organization ofthe cortical projections from specificcortical areas. As will be detailed below,this spatial property rules the mode ofinteraction between cortical projectionfields in the striatum.
Distribution of focal projection fieldsConforming to previous descriptions ofprefrontostriatal projections, the focalprojection fields were organized as a seriesof longitudinal bands topographically or-dered along the dorsoventral, mediolat-eral and rostrocaudal axis. The orderingof these bands established a gradient of projections allowing spe-cific patterns of overlaps and segregations (Fig. 4). Starting fromthe rostromedial part of striatum, the terminal fields from IL (Fig.4A) and ACv (Fig. 4B) terminated in a narrow strip along themedial rim of the nucleus accumbens and the medial dorsalstriatum, respectively. Whereas the projections from IL werelimited to the shell of nucleus accumbens and the adjacent partof the core (Fig. 4A, columns z1, z2), those of ACv were situ-ated dorsally, along the corpus callosum and the lateral ven-tricle (Fig. 4B). Projections from both IL and ACv ceased to
exist just rostral to the level of decussation of the anteriorcommissure (Fig. 4 A, B, column z3).
Partly overlapping the IL and ACv projections, the focal ter-minal field of PL formed a dorsoventrally oriented band occupy-ing quite a large portion of the nucleus accumbens core and shelland the medial part of the dorsal striatum (Fig. 4C). Rostrocau-dally, this projection field was among the most extensive of theprefrontostriatal projections studied here, spanning from therostral pole beyond the level to the decussation of the anteriorcommissure caudally. Despite an extensive overlap between the
Figure 1. Summary diagram of the anterograde tracer injection sites in the nine cases se-lected for 3D reconstruction of prefrontostriatal projections. A–C, Photomicrographs of coronalNissl sections with delineation of the maximal extent of tracer. D–F, Position and extent ofinjection sites in the 3D model examined from a rostral view (D), lateral view (E), and medialview (F ). Light gray, striatum; dark gray, cerebral cortex. ac, Anterior commissure; Acb, accum-bens nucleus; cc, corpus callosum; St, striatum. Color codes: DLO (purple), dorsolateral orbitalcortex; VLO (green), ventrolateral orbital cortex; PL (yellow), prelimbic cortex; MOVO (red),medial orbital and ventral orbital cortices; ACd (orange), dorsal anterior cingulate cortex; IL(brown), infralimbic cortex; ACv (cyan), ventral anterior cingulate cortex; AID (magenta), dorsalagranular insular cortex; PrCm (blue), medial precentral cortex.
Figure 2. Labeled fibers in the rostral striatum following injection of PHA-L into the prelimbic area. A, B, Photomicrographs ofthe focal and diffuse projections at low magnification and high magnification with the border of the focal projection indicated bya white line. C, Photomicrograph at high magnification of the labeled fibers in the diffuse projection area. The two squared areasin A indicate the precise localization of the views illustrated in B and C. Scale bars: A, 500 �m; B, C, 50 �m.
5720 • J. Neurosci., March 27, 2013 • 33(13):5718 –5727 Mailly et al. • Rat Prefrontostriatal System in 3D
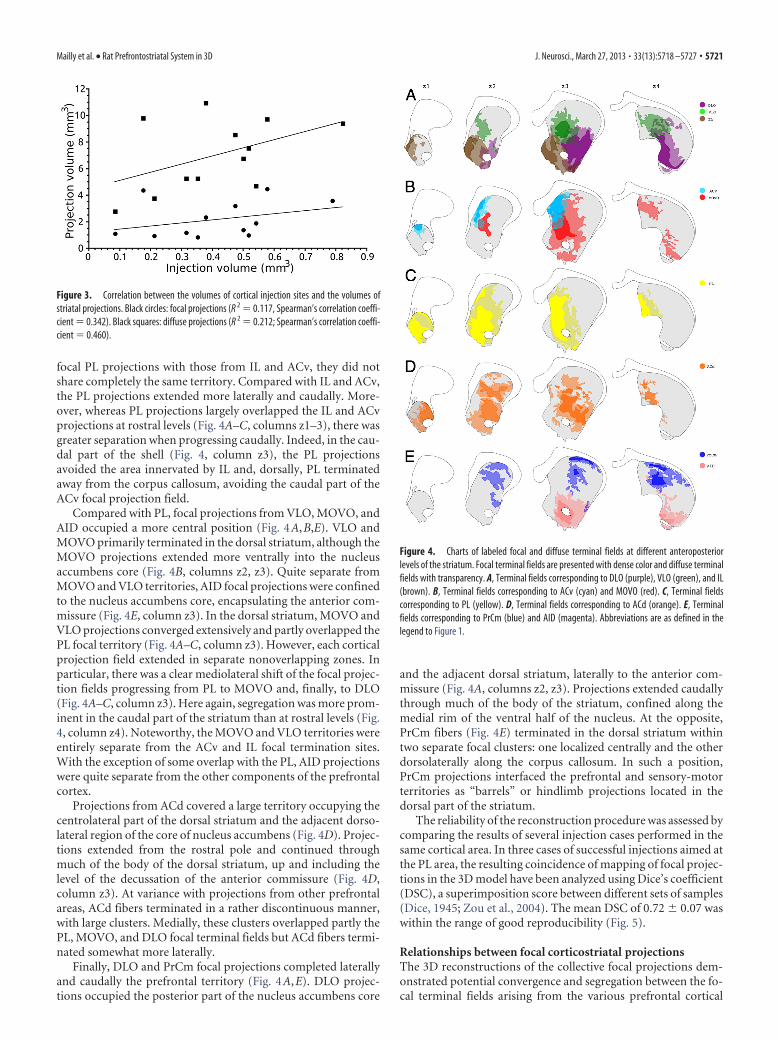
focal PL projections with those from IL and ACv, they did notshare completely the same territory. Compared with IL and ACv,the PL projections extended more laterally and caudally. More-over, whereas PL projections largely overlapped the IL and ACvprojections at rostral levels (Fig. 4A–C, columns z1–3), there wasgreater separation when progressing caudally. Indeed, in the cau-dal part of the shell (Fig. 4, column z3), the PL projectionsavoided the area innervated by IL and, dorsally, PL terminatedaway from the corpus callosum, avoiding the caudal part of theACv focal projection field.
Compared with PL, focal projections from VLO, MOVO, andAID occupied a more central position (Fig. 4A,B,E). VLO andMOVO primarily terminated in the dorsal striatum, although theMOVO projections extended more ventrally into the nucleusaccumbens core (Fig. 4B, columns z2, z3). Quite separate fromMOVO and VLO territories, AID focal projections were confinedto the nucleus accumbens core, encapsulating the anterior com-missure (Fig. 4E, column z3). In the dorsal striatum, MOVO andVLO projections converged extensively and partly overlapped thePL focal territory (Fig. 4A–C, column z3). However, each corticalprojection field extended in separate nonoverlapping zones. Inparticular, there was a clear mediolateral shift of the focal projec-tion fields progressing from PL to MOVO and, finally, to DLO(Fig. 4A–C, column z3). Here again, segregation was more prom-inent in the caudal part of the striatum than at rostral levels (Fig.4, column z4). Noteworthy, the MOVO and VLO territories wereentirely separate from the ACv and IL focal termination sites.With the exception of some overlap with the PL, AID projectionswere quite separate from the other components of the prefrontalcortex.
Projections from ACd covered a large territory occupying thecentrolateral part of the dorsal striatum and the adjacent dorso-lateral region of the core of nucleus accumbens (Fig. 4D). Projec-tions extended from the rostral pole and continued throughmuch of the body of the dorsal striatum, up and including thelevel of the decussation of the anterior commissure (Fig. 4D,column z3). At variance with projections from other prefrontalareas, ACd fibers terminated in a rather discontinuous manner,with large clusters. Medially, these clusters overlapped partly thePL, MOVO, and DLO focal terminal fields but ACd fibers termi-nated somewhat more laterally.
Finally, DLO and PrCm focal projections completed laterallyand caudally the prefrontal territory (Fig. 4A,E). DLO projec-tions occupied the posterior part of the nucleus accumbens core
and the adjacent dorsal striatum, laterally to the anterior com-missure (Fig. 4A, columns z2, z3). Projections extended caudallythrough much of the body of the striatum, confined along themedial rim of the ventral half of the nucleus. At the opposite,PrCm fibers (Fig. 4E) terminated in the dorsal striatum withintwo separate focal clusters: one localized centrally and the otherdorsolaterally along the corpus callosum. In such a position,PrCm projections interfaced the prefrontal and sensory-motorterritories as “barrels” or hindlimb projections located in thedorsal part of the striatum.
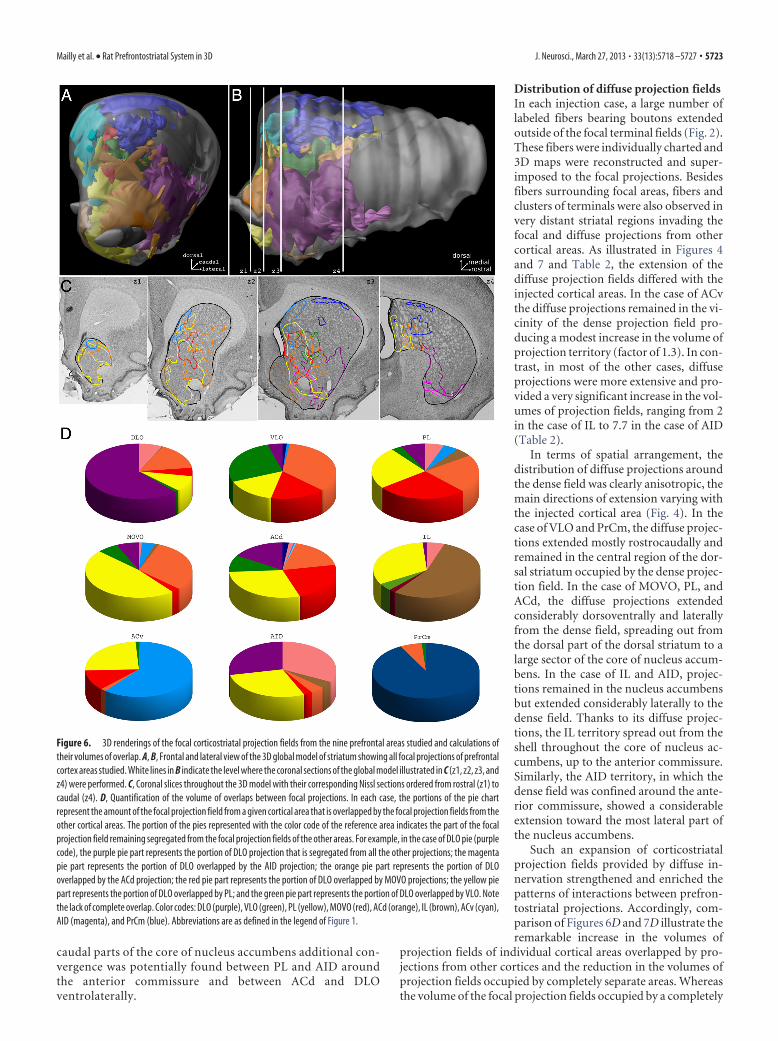
The reliability of the reconstruction procedure was assessed bycomparing the results of several injection cases performed in thesame cortical area. In three cases of successful injections aimed atthe PL area, the resulting coincidence of mapping of focal projec-tions in the 3D model have been analyzed using Dice’s coefficient(DSC), a superimposition score between different sets of samples(Dice, 1945; Zou et al., 2004). The mean DSC of 0.72 � 0.07 waswithin the range of good reproducibility (Fig. 5).
Relationships between focal corticostriatal projectionsThe 3D reconstructions of the collective focal projections dem-onstrated potential convergence and segregation between the fo-cal terminal fields arising from the various prefrontal cortical
Figure 3. Correlation between the volumes of cortical injection sites and the volumes ofstriatal projections. Black circles: focal projections (R 2 � 0.117, Spearman’s correlation coeffi-cient � 0.342). Black squares: diffuse projections (R 2 � 0.212; Spearman’s correlation coeffi-cient � 0.460).
Figure 4. Charts of labeled focal and diffuse terminal fields at different anteroposteriorlevels of the striatum. Focal terminal fields are presented with dense color and diffuse terminalfields with transparency. A, Terminal fields corresponding to DLO (purple), VLO (green), and IL(brown). B, Terminal fields corresponding to ACv (cyan) and MOVO (red). C, Terminal fieldscorresponding to PL (yellow). D, Terminal fields corresponding to ACd (orange). E, Terminalfields corresponding to PrCm (blue) and AID (magenta). Abbreviations are as defined in thelegend to Figure 1.
Mailly et al. • Rat Prefrontostriatal System in 3D J. Neurosci., March 27, 2013 • 33(13):5718 –5727 • 5721

areas. As illustrated in Figures 4 and 6,none of the focal projections from the var-ious prefrontal areas occupied a com-pletely separate territory. A significantvolume of each dense projection field(30 – 40% for DLO, IL, and ACv; 63–96%for VLO, PL, MOVO, ACd, and AID) wasoccupied by other cortical areas (Fig. 6D,Table 2). The main exception to this pat-tern of considerable overlap was formedby the PrCm, which displayed greatersegregation (only 5% overlap with otherterritories of focal projections). Thus,throughout its extension along the differ-ent axis of the striatum, the PL focal pro-jections overlapped with part of the denseprojection fields from almost all (exceptPrCm) other prefrontal areas. Among theterritories overlapped by PL, those ofMOVO, ACd, IL, ACv, and AID receivedthe most important proportion of focalPL projections (Fig. 6D). A rather similarsituation applied for the ACd and MOVOin the dorsal striatum. ACd projectionspartly overlapped DLO, VLO, PL, andMOVO focal projection fields whereasthe MOVO projection overlapped witha substantial part of VLO, PL, ACd, andACv projections. In the case of DLO, itsprojections also occupied part of differentprefrontal projections in the dorsal andventral striatum, the more significantoverlaps focused onto ACd and AID. Asfor IL, ACv, AID, and PrCm, their projec-tion fields occupied only very limited por-tions of other focal projection fields.
As a consequence of the topography ofcorticostriatal projections, interfaces be-tween specific cortical projections did notextend throughout the striatum but wererather confined to selective rostrocaudallevels. Moreover within each rostrocaudallevel, convergence between cortical pro-jections was located in restricted regions.
Dorsal striatumIn the rostral part of the dorsal striatum,PL and ACd focal projections occupiedquite a large portion of the nucleus, except for its dorsolateralquadrant (Figs. 4C,D, 6, columns z2, z3). PL and ACd terminalsconverged in a central region, dorsal to the anterior commissure.Compared with ACd, the PL focal area extended more mediallyand dorsomedially within the ACv territory. At this rostral levelof the dorsal striatum there was no focal projection from theorbital and AID areas. Slightly more caudally, the PL and ACdprojections showed a tendency to segregate mediolaterally. Atthis level, PL projections converged with ACv, MOVO, and VLOin a large centromedial region. Compared with PL, MOVO andVLO projections extended more laterally where they overlappedwith the ACd territory (Figs. 4, 6). Although VLO and MOVOshared partly the same territory, focal projections from VLO werelocated more laterally, allowing a specific territory of conver-gence with ACd projections. In the posterior part of the rostral
striatum, just rostral to level of the decussation of anterior com-missure, the projections of DLO appeared. They occupied a ven-trolateral quadrant mostly segregated from those of PL, MOVO,VLO, and ACv. In contrast, DLO projections converged withthose of ACd. At the level of the decussation of anterior commis-sure there were no more focal projections of ACd, ACv, andMOVO. There PL, VLO, and DLO occupied primarily separateregions. In contrast there was potential convergence betweenprojections of VLO and PrCm.
Nucleus accumbensIn the nucleus accumbens, the 3D reconstructions showed a ma-jor segregation between IL, ACd, MOVO, AID, and DLO (Figs. 4,6, column z1). In contrast major overlaps were potentially evi-dent between PL and IL medially and between PL and ACdcentrally and dorsally to the anterior commissure. In more
Figure 5. Validation of the method of model registration. In three experimental cases PHA-L injections were placed in the PLand the reconstructed focal terminal fields were reconstructed and joined (red, green, and blue) into a single 3D model. A, B,Photomicrographs of coronal Nissl sections with registered contours of the projection fields in coronal sections of the global modelcut at two different anteroposterior levels. C, 3D renderings of the combined striatal projection fields from the three PL injections.The 3D model of the right striatum is viewed from the medial part of the brain. White lines (zA and zB) indicate the level at whichthe sections of the global model shown in A and B were performed. Note the remarkable consistency in the position occupied by theprojection fields.
5722 • J. Neurosci., March 27, 2013 • 33(13):5718 –5727 Mailly et al. • Rat Prefrontostriatal System in 3D
caudal parts of the core of nucleus accumbens additional con-vergence was potentially found between PL and AID aroundthe anterior commissure and between ACd and DLOventrolaterally.
Distribution of diffuse projection fieldsIn each injection case, a large number oflabeled fibers bearing boutons extendedoutside of the focal terminal fields (Fig. 2).These fibers were individually charted and3D maps were reconstructed and super-imposed to the focal projections. Besidesfibers surrounding focal areas, fibers andclusters of terminals were also observed invery distant striatal regions invading thefocal and diffuse projections from othercortical areas. As illustrated in Figures 4and 7 and Table 2, the extension of thediffuse projection fields differed with theinjected cortical areas. In the case of ACvthe diffuse projections remained in the vi-cinity of the dense projection field pro-ducing a modest increase in the volume ofprojection territory (factor of 1.3). In con-trast, in most of the other cases, diffuseprojections were more extensive and pro-vided a very significant increase in the vol-umes of projection fields, ranging from 2in the case of IL to 7.7 in the case of AID(Table 2).
In terms of spatial arrangement, thedistribution of diffuse projections aroundthe dense field was clearly anisotropic, themain directions of extension varying withthe injected cortical area (Fig. 4). In thecase of VLO and PrCm, the diffuse projec-tions extended mostly rostrocaudally andremained in the central region of the dor-sal striatum occupied by the dense projec-tion field. In the case of MOVO, PL, andACd, the diffuse projections extendedconsiderably dorsoventrally and laterallyfrom the dense field, spreading out fromthe dorsal part of the dorsal striatum to alarge sector of the core of nucleus accum-bens. In the case of IL and AID, projec-tions remained in the nucleus accumbensbut extended considerably laterally to thedense field. Thanks to its diffuse projec-tions, the IL territory spread out from theshell throughout the core of nucleus ac-cumbens, up to the anterior commissure.Similarly, the AID territory, in which thedense field was confined around the ante-rior commissure, showed a considerableextension toward the most lateral part ofthe nucleus accumbens.
Such an expansion of corticostriatalprojection fields provided by diffuse in-nervation strengthened and enriched thepatterns of interactions between prefron-tostriatal projections. Accordingly, com-parison of Figures 6D and 7D illustrate theremarkable increase in the volumes of
projection fields of individual cortical areas overlapped by pro-jections from other cortices and the reduction in the volumes ofprojection fields occupied by completely separate areas. Whereasthe volume of the focal projection fields occupied by a completely
Figure 6. 3D renderings of the focal corticostriatal projection fields from the nine prefrontal areas studied and calculations oftheir volumes of overlap. A, B, Frontal and lateral view of the 3D global model of striatum showing all focal projections of prefrontalcortex areas studied. White lines in B indicate the level where the coronal sections of the global model illustrated in C (z1, z2, z3, andz4) were performed. C, Coronal slices throughout the 3D model with their corresponding Nissl sections ordered from rostral (z1) tocaudal (z4). D, Quantification of the volume of overlaps between focal projections. In each case, the portions of the pie chartrepresent the amount of the focal projection field from a given cortical area that is overlapped by the focal projection fields from theother cortical areas. The portion of the pies represented with the color code of the reference area indicates the part of the focalprojection field remaining segregated from the focal projection fields of the other areas. For example, in the case of DLO pie (purplecode), the purple pie part represents the portion of DLO projection that is segregated from all the other projections; the magentapie part represents the portion of DLO overlapped by the AID projection; the orange pie part represents the portion of DLOoverlapped by the ACd projection; the red pie part represents the portion of DLO overlapped by MOVO projections; the yellow piepart represents the portion of DLO overlapped by PL; and the green pie part represents the portion of DLO overlapped by VLO. Notethe lack of complete overlap. Color codes: DLO (purple), VLO (green), PL (yellow), MOVO (red), ACd (orange), IL (brown), ACv (cyan),AID (magenta), and PrCm (blue). Abbreviations are as defined in the legend of Figure 1.
Mailly et al. • Rat Prefrontostriatal System in 3D J. Neurosci., March 27, 2013 • 33(13):5718 –5727 • 5723
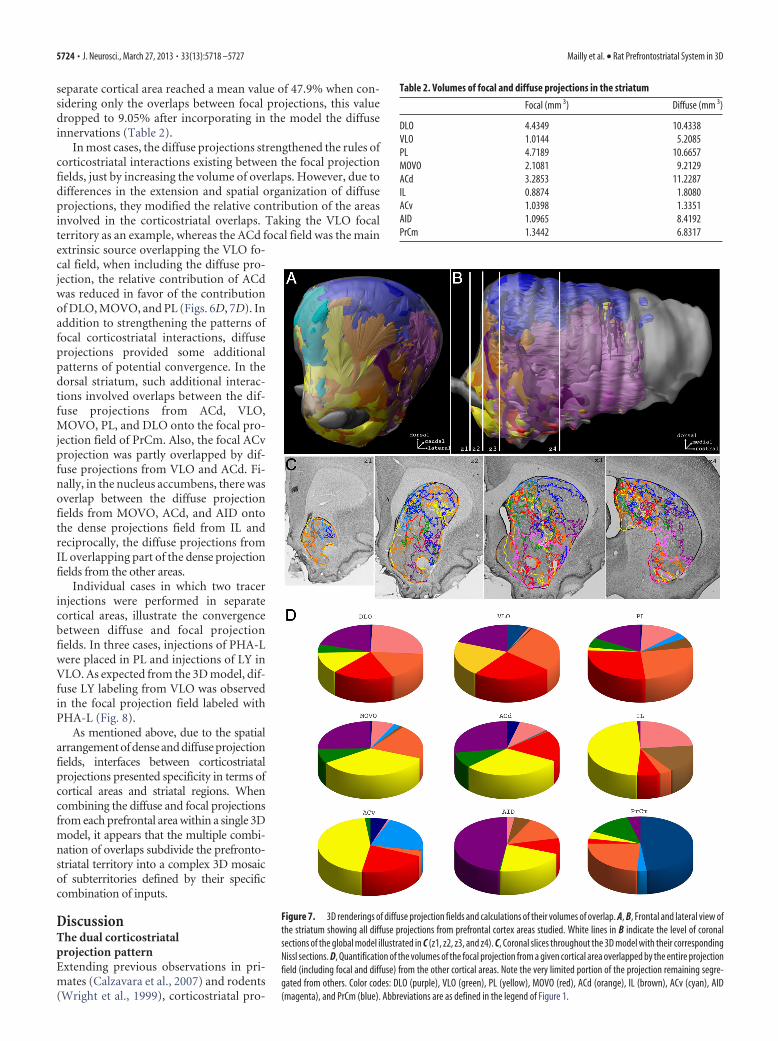
separate cortical area reached a mean value of 47.9% when con-sidering only the overlaps between focal projections, this valuedropped to 9.05% after incorporating in the model the diffuseinnervations (Table 2).
In most cases, the diffuse projections strengthened the rules ofcorticostriatal interactions existing between the focal projectionfields, just by increasing the volume of overlaps. However, due todifferences in the extension and spatial organization of diffuseprojections, they modified the relative contribution of the areasinvolved in the corticostriatal overlaps. Taking the VLO focalterritory as an example, whereas the ACd focal field was the mainextrinsic source overlapping the VLO fo-cal field, when including the diffuse pro-jection, the relative contribution of ACdwas reduced in favor of the contributionof DLO, MOVO, and PL (Figs. 6D, 7D). Inaddition to strengthening the patterns offocal corticostriatal interactions, diffuseprojections provided some additionalpatterns of potential convergence. In thedorsal striatum, such additional interac-tions involved overlaps between the dif-fuse projections from ACd, VLO,MOVO, PL, and DLO onto the focal pro-jection field of PrCm. Also, the focal ACvprojection was partly overlapped by dif-fuse projections from VLO and ACd. Fi-nally, in the nucleus accumbens, there wasoverlap between the diffuse projectionfields from MOVO, ACd, and AID ontothe dense projections field from IL andreciprocally, the diffuse projections fromIL overlapping part of the dense projectionfields from the other areas.
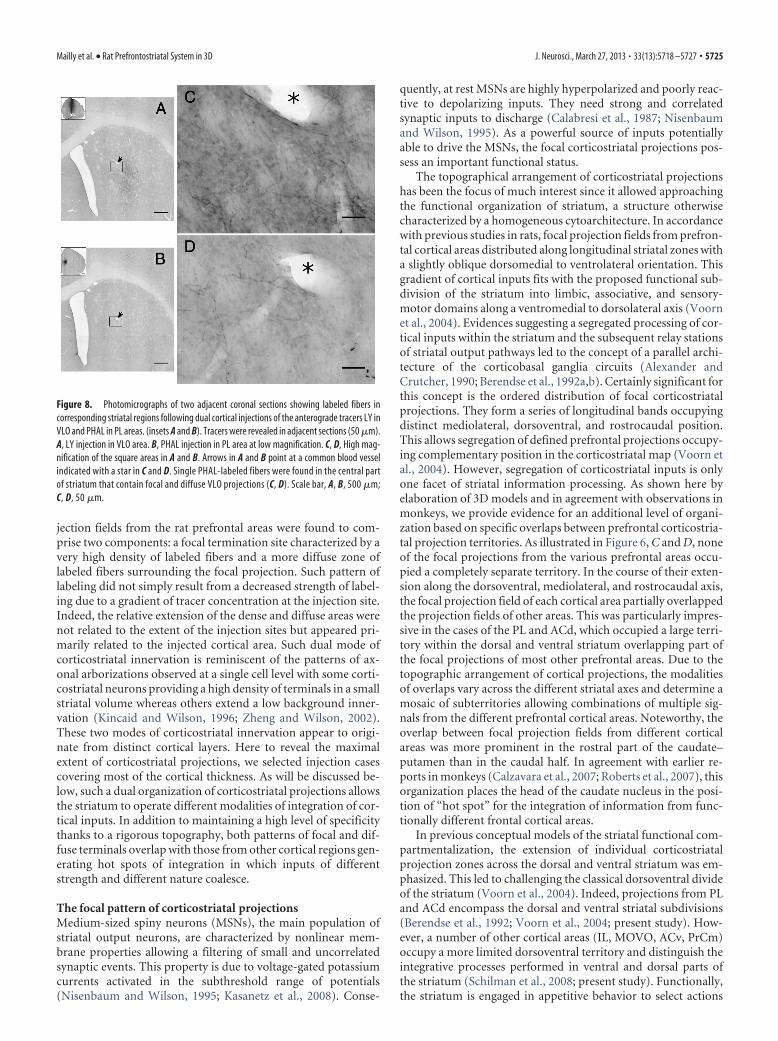
Individual cases in which two tracerinjections were performed in separatecortical areas, illustrate the convergencebetween diffuse and focal projectionfields. In three cases, injections of PHA-Lwere placed in PL and injections of LY inVLO. As expected from the 3D model, dif-fuse LY labeling from VLO was observedin the focal projection field labeled withPHA-L (Fig. 8).
As mentioned above, due to the spatialarrangement of dense and diffuse projectionfields, interfaces between corticostriatalprojections presented specificity in terms ofcortical areas and striatal regions. Whencombining the diffuse and focal projectionsfrom each prefrontal area within a single 3Dmodel, it appears that the multiple combi-nation of overlaps subdivide the prefronto-striatal territory into a complex 3D mosaicof subterritories defined by their specificcombination of inputs.
DiscussionThe dual corticostriatalprojection patternExtending previous observations in pri-mates (Calzavara et al., 2007) and rodents(Wright et al., 1999), corticostriatal pro-
Figure 7. 3D renderings of diffuse projection fields and calculations of their volumes of overlap. A, B, Frontal and lateral view ofthe striatum showing all diffuse projections from prefrontal cortex areas studied. White lines in B indicate the level of coronalsections of the global model illustrated in C (z1, z2, z3, and z4). C, Coronal slices throughout the 3D model with their correspondingNissl sections. D, Quantification of the volumes of the focal projection from a given cortical area overlapped by the entire projectionfield (including focal and diffuse) from the other cortical areas. Note the very limited portion of the projection remaining segre-gated from others. Color codes: DLO (purple), VLO (green), PL (yellow), MOVO (red), ACd (orange), IL (brown), ACv (cyan), AID(magenta), and PrCm (blue). Abbreviations are as defined in the legend of Figure 1.
Table 2. Volumes of focal and diffuse projections in the striatum
Focal (mm 3) Diffuse (mm 3)
DLO 4.4349 10.4338VLO 1.0144 5.2085PL 4.7189 10.6657MOVO 2.1081 9.2129ACd 3.2853 11.2287IL 0.8874 1.8080ACv 1.0398 1.3351AID 1.0965 8.4192PrCm 1.3442 6.8317
5724 • J. Neurosci., March 27, 2013 • 33(13):5718 –5727 Mailly et al. • Rat Prefrontostriatal System in 3D
jection fields from the rat prefrontal areas were found to com-prise two components: a focal termination site characterized by avery high density of labeled fibers and a more diffuse zone oflabeled fibers surrounding the focal projection. Such pattern oflabeling did not simply result from a decreased strength of label-ing due to a gradient of tracer concentration at the injection site.Indeed, the relative extension of the dense and diffuse areas werenot related to the extent of the injection sites but appeared pri-marily related to the injected cortical area. Such dual mode ofcorticostriatal innervation is reminiscent of the patterns of ax-onal arborizations observed at a single cell level with some corti-costriatal neurons providing a high density of terminals in a smallstriatal volume whereas others extend a low background inner-vation (Kincaid and Wilson, 1996; Zheng and Wilson, 2002).These two modes of corticostriatal innervation appear to origi-nate from distinct cortical layers. Here to reveal the maximalextent of corticostriatal projections, we selected injection casescovering most of the cortical thickness. As will be discussed be-low, such a dual organization of corticostriatal projections allowsthe striatum to operate different modalities of integration of cor-tical inputs. In addition to maintaining a high level of specificitythanks to a rigorous topography, both patterns of focal and dif-fuse terminals overlap with those from other cortical regions gen-erating hot spots of integration in which inputs of differentstrength and different nature coalesce.
The focal pattern of corticostriatal projectionsMedium-sized spiny neurons (MSNs), the main population ofstriatal output neurons, are characterized by nonlinear mem-brane properties allowing a filtering of small and uncorrelatedsynaptic events. This property is due to voltage-gated potassiumcurrents activated in the subthreshold range of potentials(Nisenbaum and Wilson, 1995; Kasanetz et al., 2008). Conse-
quently, at rest MSNs are highly hyperpolarized and poorly reac-tive to depolarizing inputs. They need strong and correlatedsynaptic inputs to discharge (Calabresi et al., 1987; Nisenbaumand Wilson, 1995). As a powerful source of inputs potentiallyable to drive the MSNs, the focal corticostriatal projections pos-sess an important functional status.
The topographical arrangement of corticostriatal projectionshas been the focus of much interest since it allowed approachingthe functional organization of striatum, a structure otherwisecharacterized by a homogeneous cytoarchitecture. In accordancewith previous studies in rats, focal projection fields from prefron-tal cortical areas distributed along longitudinal striatal zones witha slightly oblique dorsomedial to ventrolateral orientation. Thisgradient of cortical inputs fits with the proposed functional sub-division of the striatum into limbic, associative, and sensory-motor domains along a ventromedial to dorsolateral axis (Voornet al., 2004). Evidences suggesting a segregated processing of cor-tical inputs within the striatum and the subsequent relay stationsof striatal output pathways led to the concept of a parallel archi-tecture of the corticobasal ganglia circuits (Alexander andCrutcher, 1990; Berendse et al., 1992a,b). Certainly significant forthis concept is the ordered distribution of focal corticostriatalprojections. They form a series of longitudinal bands occupyingdistinct mediolateral, dorsoventral, and rostrocaudal position.This allows segregation of defined prefrontal projections occupy-ing complementary position in the corticostriatal map (Voorn etal., 2004). However, segregation of corticostriatal inputs is onlyone facet of striatal information processing. As shown here byelaboration of 3D models and in agreement with observations inmonkeys, we provide evidence for an additional level of organi-zation based on specific overlaps between prefrontal corticostria-tal projection territories. As illustrated in Figure 6, C and D, noneof the focal projections from the various prefrontal areas occu-pied a completely separate territory. In the course of their exten-sion along the dorsoventral, mediolateral, and rostrocaudal axis,the focal projection field of each cortical area partially overlappedthe projection fields of other areas. This was particularly impres-sive in the cases of the PL and ACd, which occupied a large terri-tory within the dorsal and ventral striatum overlapping part ofthe focal projections of most other prefrontal areas. Due to thetopographic arrangement of cortical projections, the modalitiesof overlaps vary across the different striatal axes and determine amosaic of subterritories allowing combinations of multiple sig-nals from the different prefrontal cortical areas. Noteworthy, theoverlap between focal projection fields from different corticalareas was more prominent in the rostral part of the caudate–putamen than in the caudal half. In agreement with earlier re-ports in monkeys (Calzavara et al., 2007; Roberts et al., 2007), thisorganization places the head of the caudate nucleus in the posi-tion of “hot spot” for the integration of information from func-tionally different frontal cortical areas.
In previous conceptual models of the striatal functional com-partmentalization, the extension of individual corticostriatalprojection zones across the dorsal and ventral striatum was em-phasized. This led to challenging the classical dorsoventral divideof the striatum (Voorn et al., 2004). Indeed, projections from PLand ACd encompass the dorsal and ventral striatal subdivisions(Berendse et al., 1992; Voorn et al., 2004; present study). How-ever, a number of other cortical areas (IL, MOVO, ACv, PrCm)occupy a more limited dorsoventral territory and distinguish theintegrative processes performed in ventral and dorsal parts ofthe striatum (Schilman et al., 2008; present study). Functionally,the striatum is engaged in appetitive behavior to select actions
Figure 8. Photomicrographs of two adjacent coronal sections showing labeled fibers incorresponding striatal regions following dual cortical injections of the anterograde tracers LY inVLO and PHAL in PL areas. (insets A and B). Tracers were revealed in adjacent sections (50 �m).A, LY injection in VLO area. B, PHAL injection in PL area at low magnification. C, D, High mag-nification of the square areas in A and B. Arrows in A and B point at a common blood vesselindicated with a star in C and D. Single PHAL-labeled fibers were found in the central partof striatum that contain focal and diffuse VLO projections (C, D). Scale bar, A, B, 500 �m;C, D, 50 �m.
Mailly et al. • Rat Prefrontostriatal System in 3D J. Neurosci., March 27, 2013 • 33(13):5718 –5727 • 5725

based on their predicted reward value. As documented by behav-ioral approach, whereas the ventral striatum, in particular thenucleus accumbens, is necessary for the acquisition of pavlovianappetitive responses and contribute to the motivational controlof instrumental performance, the dorsal striatum is critical forthe acquisition of goal-directed behaviors controlled by action-outcome contingencies and in the formation of stimulus re-sponse underlying the habits. Therefore, in addition to thespiraling mechanism established by the striato–nigral–striatalcircuit (Haber et al., 2000), the cortical areas such as PL and ACd,in which projections span the two striatal subdivisions, offer alink between the different learning processes during the acquisi-tion of a new task.
In a phylogenetic perspective, the mode of convergence be-tween prefrontostriatal projections documented here stress com-mon features between the organization of the rodent and primateprefrontostriatal system. First, the orbitofrontal areas, whichprovide an important source of reward signals to the striatum,occupy a large part of the medial and central region of the dorsalstriatum. Each of these areas encodes specific aspects of reward-related information such as magnitude and probability of reward.As in monkeys, focal projection fields from distinct orbitofrontalareas presented important areas of overlap indicating that in ratsas in primates, the dorsal striatum constitutes a major site for thecoordination of these processes. In monkeys, the reward-relatedpart of the striatum defined by the projection territory of theorbitofrontal cortex and ACd shares important convergent areaswith the projection field of the lateral prefrontal cortex. Rats haveno dorsolateral prefrontal cortex but the PL area, which is criticalfor attentional processes, behavioral flexibility, and the encodingof action outcome, shares some of the cognitive functions de-voted to the monkey dorsolateral prefrontal areas (Uylings et al.,2003). Interestingly, the PL projections occupied a large volumewithin the dorsal striatum and showed important zones of over-lap with the orbitofrontal and ACd projections. These observa-tions generalize to the rodent the concept viewing the dorsalstriatum as a major site for the integration of different aspects ofreward and cognition making it a central site for the developmentof incentive-based learning.
The diffuse patterns of corticostriatal projectionsIn each case, the dense projection fields were surrounded by dif-fuse projections, which expanded the influence of cortical areasonto the neighboring corticostriatal territories. Considering thenonlinear membrane properties of MSNs, which require a strongexcitatory input to be depolarized from a resting state (Calabresiet al., 1987; Nisenbaum and Wilson, 1995; Kasanetz et al., 2008),it is unlikely that the diffuse projections provide such efficientinput on their own. However, when discharged, MSNs becomeable to integrate small synaptic inputs. In this situation, signalsfrom the diffuse projection fields may contribute to the elabora-tion of the striatal output signal. Besides MSNs, the striatal net-work comprises several populations of interneurons that areactivated by corticostriatal afferents (Mallet et al., 2005; Fino etal., 2008, 2009). In particular, the population of fast-spikingGABAergic interneurons exerts a strong shunting effect on thesynaptic excitatory inputs of MSNs and contributes to contrasteffects between neighboring MSNs via a feedforward inhibitorymechanism (Koos and Tepper, 1999; Planert et al., 2010). Alto-gether, the organization of the corticostriatal projections and thephysiological properties of the neuronal elements suggest a dualfunctional mode of the diffuse projections. Depending on thedistribution of cortical activity in time and space, the combina-
tion of focal and diffuse projections may either contribute tofacilitate the activation of MSNs in some spots of convergenceand, conversely, inhibit MSNs in others, exerting contrast effects.Therefore, the combination of focal and diffuse corticostriatalprojections may provide a very dynamic network allowing us toprecisely select the striatal output neurons to be activated. Such adynamic network allows multiple and specific interactions be-tween corticostriatal inputs, which amplifies the combinatorialpower of the associations between them.
ReferencesAlexander GE, Crutcher MD (1990) Functional architecture of basal ganglia
circuits: neural substrates of parallel processing. Trends Neurosci 13:266 –271. CrossRef Medline
Berendse HW, Galis-de Graaf Y, Groenewegen HJ (1992a) Topographicalorganization and relationship with ventral striatal compartments of pre-frontal corticostriatal projections in the rat. J Comp Neurol 316:314 –347.CrossRef Medline
Berendse HW, Groenewegen HJ, Lohman AH (1992b) Compartmental dis-tribution of ventral striatal neurons projecting to the mesencephalon inthe rat. J Neurosci 12:2079 –2103. Medline
Calabresi P, Misgeld U, Dodt HU (1987) Intrinsic membrane properties ofneostriatal neurons can account for their low level of spontaneous activ-ity. Neuroscience 20:293–303. CrossRef Medline
Calzavara R, Mailly P, Haber SN (2007) Relationship between the corticos-triatal terminals from areas 9 and 46, and those from area 8A, dorsal androstral premotor cortex and area 24c: an anatomical substrate for cogni-tion to action. Eur J Neurosci 26:2005–2024. CrossRef Medline
Deniau JM, Thierry AM (1997) Anatomical segregation of information pro-cessing in the rat substantia nigra pars reticulata. Adv Neurol 74:83–96.Medline
Dice L (1945) Measures of the amount of ecologic association between spe-cies. Ecology 26:207–302. CrossRef
Draganski B, Gaser C, Kempermann G, Kuhn HG, Winkler J, Buchel C, MayA (2006) Temporal and spatial dynamics of brain structure changesduring extensive learning. J Neurosci 26:6314 – 6317. CrossRef Medline
Fino E, Deniau J-M, Venance L (2008) Cell-specific spike-timing-dependent plasticity in GABAergic and cholinergic interneurons in cor-ticostriatal rat brain slices. J Physiol 586:265–282. Medline
Fino E, Paille V, Deniau J-M, Venance L (2009) Asymmetric spike-timingdependent plasticity of striatal nitric oxide-synthase interneurons. Neu-roscience 160:744 –754. CrossRef Medline
Graybiel AM (1998) The basal ganglia and chunking of action repertoires.Neurobiol Learn Mem 70:119 –136. CrossRef Medline
Graybiel AM (2005) The basal ganglia: learning new tricks and loving it.Curr Opin Neurobiol 15:638 – 644. CrossRef Medline
Groenewegen HJ, Berendse HW (1994) The specificity of the “nonspecific”midline and intralaminar thalamic nuclei. Trends Neurosci 17:52–57.CrossRef Medline
Haber SN (2011) Neuroanatomy of reward: a view from the ventral stria-tum. In: Neurobiology of sensation and reward (Gottfried JA, ed), Chap11. Boca Raton, FL: CRC.
Haber SN, Calzavara R (2009) The cortico-basal ganglia integrative net-work: the role of the thalamus. Brain Res Bull 78:69 –74. CrossRefMedline
Haber SN, Fudge JL, McFarland NR (2000) Striatonigrostriatal pathways inprimates form an ascending spiral from the shell to the dorsolateral stria-tum. J Neurosci 20:2369 –2382. Medline
Haber SN, Kim K-S, Mailly P, Calzavara R (2006) Reward-related corticalinputs define a large striatal region in primates that interface with asso-ciative cortical connections, providing a substrate for incentive-basedlearning. J Neurosci 26:8368 – 8376. CrossRef Medline
Heidbreder CA, Groenewegen HJ (2003) The medial prefrontal cortex inthe rat: evidence for a dorso-ventral distinction based upon functionaland anatomical characteristics. Neurosci Biobehav Rev 27:555–579.CrossRef Medline
Ilinsky IA, Jouandet ML, Goldman-Rakic PS (1985) Organization of thenigrothalamocortical system in the rhesus monkey. J Comp Neurol 236:315–330. CrossRef Medline
Joel D, Weiner I (1994) The organization of the basal ganglia-
5726 • J. Neurosci., March 27, 2013 • 33(13):5718 –5727 Mailly et al. • Rat Prefrontostriatal System in 3D

thalamocortical circuits: open interconnected rather than closed segre-gated. Neuroscience 63:363–379. CrossRef Medline
Kasanetz F, Riquelme LA, Della-Maggiore V, O’Donnell P, Murer MG(2008) Functional integration across a gradient of corticostriatal chan-nels controls UP state transitions in the dorsal striatum. Proc Natl AcadSci U S A 105:8124 – 8129. CrossRef Medline
Kincaid AE, Wilson CJ (1996) Corticostriatal innervation of the patch andmatrix in the rat neostriatum. J Comp Neurol 374:578 –592. CrossRefMedline
Kolb B (1984) Functions of the frontal cortex of the rat: a comparative re-view. Brain Res 320:65–98. Medline
Koos T, Tepper JM (1999) Inhibitory control of neostriatal projection neu-rons by GABAergic interneurons. Nat Neurosci 2:467– 472. CrossRefMedline
Kremer JR, Mastronarde DN, McIntosh JR (1996) Computer visualizationof three-dimensional image data using IMOD. J Struct Biol 116:71–76.CrossRef Medline
Mailly P, Haber SN, Groenewegen HJ, Deniau J-M (2010) A 3D multi-modal and multi-dimensional digital brain model as a framework for datasharing. J Neurosci Methods 194:56 – 63. CrossRef Medline
Mallet N, Le Moine C, Charpier S, Gonon F (2005) Feedforward inhibitionof projection neurons by fast-spiking GABA interneurons in the rat stria-tum in vivo. J Neurosci 25:3857–3869. CrossRef Medline
McGeorge AJ, Faull RL (1989) The organization of the projection from thecerebral cortex to the striatum in the rat. Neuroscience 29:503–537.CrossRef Medline
Middleton FA, Strick PL (1994) Anatomical evidence for cerebellar andbasal ganglia involvement in higher cognitive function. Science 266:458 –461. CrossRef Medline
Nisenbaum ES, Wilson CJ (1995) Potassium currents responsible for in-ward and outward rectification in rat neostriatal spiny projection neu-rons. J Neurosci 15:4449 – 4463. Medline
Parent A (1990) Extrinsic connections of the basal ganglia. Trends Neurosci13:254 –258. CrossRef Medline
Paxinos G, Watson C (1986) The rat brain in stereotaxic coordinates. SanDiego, CA: Academic.
Planert H, Szydlowski SN, Hjorth JJ, Grillner S, Silberberg G (2010) Dy-
namics of synaptic transmission between fast-spiking interneurons andstriatal projection neurons of the direct and indirect pathways. J Neurosci30:3499 –3507. CrossRef Medline
Reep RL, Cheatwood JL, Corwin JV (2003) The associative striatum: orga-nization of cortical projections to the dorsocentral striatum in rats.J Comp Neurol 467:271–292. CrossRef Medline
Roberts AC, Tomic DL, Parkinson CH, Roeling TA, Cutter DJ, Robbins TW,Everitt BJ (2007) Forebrain connectivity of the prefrontal cortex in themarmoset monkey (Callithrix jacchus): an anterograde and retrogradetract-tracing study. J Comp Neurol 502:86 –112. CrossRef Medline
Schilman EA, Uylings HB, Galis-de Graaf Y, Joel D, Groenewegen HJ (2008)The orbital cortex in rats topographically projects to central parts of thecaudate–putamen complex. Neurosci Lett 432:40 – 45. CrossRef Medline
Uylings HB, Groenewegen HJ, Kolb B (2003) Do rats have a prefrontal cor-tex? Behav Brain Res 146:3–17. CrossRef Medline
Van De Werd HJ, Uylings HB (2008) The rat orbital and agranular insularprefrontal cortical areas: a cytoarchitectonic and chemoarchitectonicstudy. Brain Struct Funct 212:387– 401. CrossRef Medline
Voorn P, Vanderschuren LJ, Groenewegen HJ, Robbins TW, Pennartz CM(2004) Putting a spin on the dorsal-ventral divide of the striatum. TrendsNeurosci 27:468 – 474. CrossRef Medline
Wright AK, Norrie L, Ingham CA, Hutton EA, Arbuthnott GW (1999) Dou-ble anterograde tracing of outputs from adjacent “barrel columns” of ratsomatosensory cortex. Neostriatal projection patterns and terminal ultra-structure. Neuroscience 88:119 –133. CrossRef Medline
Yeterian EH, Van Hoesen GW (1978) Cortico-striate projections in the rhe-sus monkey: the organization of certain cortico-caudate connections.Brain Res 139:43– 63. CrossRef Medline
Yin HH, Knowlton BJ (2006) The role of the basal ganglia in habit forma-tion. Nat Rev Neurosci 7:464 – 476. CrossRef Medline
Zheng T, Wilson CJ (2002) Corticostriatal combinatorics: the implicationsof corticostriatal axonal arborizations. J Neurophysiol 87:1007–1017.Medline
Zou KH, Warfield SK, Bharatha A, Tempany CM, Kaus MR, Haker SJ, WellsWM 3rd, Jolesz FA, Kikinis R (2004) Statistical validation of image seg-mentation quality based on a spatial overlap index. Acad Radiol 11:178 –189. CrossRef Medline
Mailly et al. • Rat Prefrontostriatal System in 3D J. Neurosci., March 27, 2013 • 33(13):5718 –5727 • 5727