The Quantitative Imaging Network (QIN) 2 Nordstrom.pdfThe Quantitative Imaging Network (QIN): The...
48
The Quantitative Imaging Network (QIN): The Quest for Clinical Decision Tool Validation Robert J. Nordstrom, Ph.D. Director, the Quantitative Imaging Program Janet Eary, M.D. Deputy Associate Director, DCTD/CIP . July 11, 2018 CTAC
Transcript of The Quantitative Imaging Network (QIN) 2 Nordstrom.pdfThe Quantitative Imaging Network (QIN): The...

The Quantitative Imaging Network (QIN):The Quest for Clinical Decision Tool Validation
Robert J. Nordstrom, Ph.D.Director, the Quantitative Imaging Program
Janet Eary, M.D.Deputy Associate Director, DCTD/CIP
.July 11, 2018
CTAC

2
Imaging can offer useful information in clinical trials
Information can be gainedover many different domains:
Anatomic to molecularCan be combined with otherbiomarkersDisease location & stagingCan reduce (or eliminate) biopsies
Image from Hugo Aerts
3
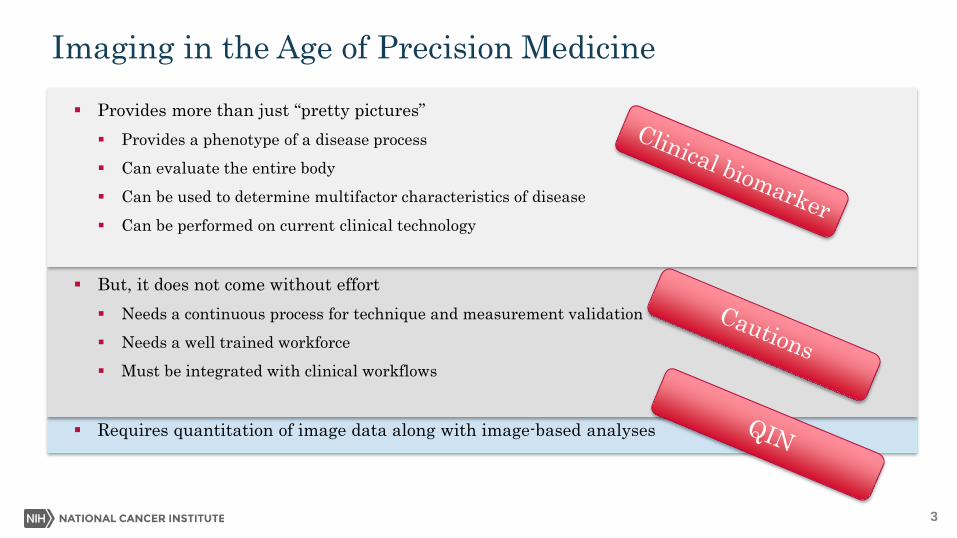
Imaging in the Age of Precision Medicine
Provides more than just “pretty pictures” Provides a phenotype of a disease process Can evaluate the entire body Can be used to determine multifactor characteristics of disease Can be performed on current clinical technology
But, it does not come without effort Needs a continuous process for technique and measurement validation Needs a well trained workforce Must be integrated with clinical workflows
Requires quantitation of image data along with image-based analyses

4
Hypothesis behind the program
Hypothesis: The evolution of targeted drugs and radiation therapies in clinical trials can benefit from the integration of quantitative imaging with the treatment protocols.
These quantitative imaging methods must be developed on commercial platforms in order to have value in multi-center, multi-platform clinical trials.
Goal: Create imaging tools and methods useful in clinical workflow that will measure response to cancer therapies or predict outcome.

5
Cancer Imaging Program Guidance
From the Cancer Imaging Program vision & goals: Create imaging methods to be validated as biomarkers
Implement an informatics infrastructures to optimize the value of cancer imaging data
Develop strategies of implementing science and methods to detect and treat cancers, and to monitor or predict response to therapy
Implement infrastructures based on standardized models for design and conduct of clinical trials using imaging or image-guided technologies.
CIP LeadershipPaula Jacobs PhD
Janet Eary, MD
6
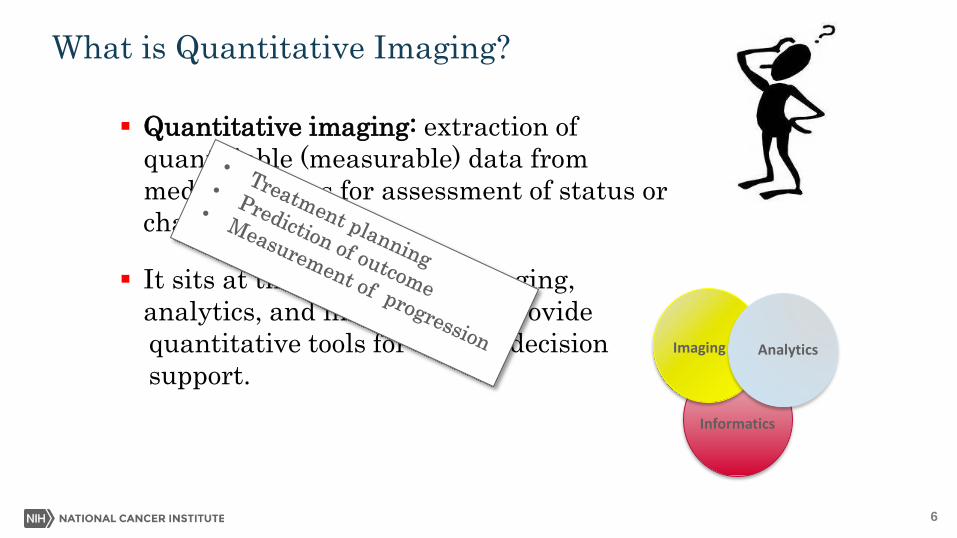
What is Quantitative Imaging?
Quantitative imaging: extraction of quantifiable (measurable) data from medical images for assessment of status or change in a disease.
It sits at the crossroads of imaging, analytics, and informatics to provide quantitative tools for clinical decisionsupport.
Imaging Analytics
Informatics

7
What is Quantitative Imaging?
7/5/2018
It seeks to reduce the noise and variabilityin clinical images to provide standardizedand robust results useful across sites and time.
It uses imaging protocol controls, informatics,and analytical methods to extract measurabledata from medical images during clinical trials.
It translates collected data into informationuseful for measuring response to therapy orpredicting therapy outcome.

8
What is Quantitative Imaging?
It is a part of translational research Concerned with: Standardization of methods Harmonization across different imaging platforms and vendors Reliable and repeatable results User convenience and easily interpreted information Seamless incorporation into clinical workflow

9
The step from the laboratory to patient’s bedside…is
extraordinarily arduous and fraught with danger
Dr. Paul Ehrlich
Nobel Prize in Medicine 1908
Translational research isnot new….
Development Clinic

10
It is the responsibility of those involved in today’s biomedical
research to translate the remarkable scientific innovations we are
witnessing into health gains for the nation.
Dr. Elias Zerhouni:
NEJM, 2005
ClinicDevelopment

11

12
The Quantitative Imaging Roadmap
1. Evaluation of imaging hardware performance2. Creation of harmonization methods (software and protocol) Reduce bias & variance during data collection
3. Creation of robust algorithms to extract quantitative information from images
4. Testing and validating performance of algorithms5. Introducing candidate algorithms into clinical workflow FDA and industrial interactions

13
Challenge: Not all teams start at the same time
…so they aren’t all at the same stage of development
14
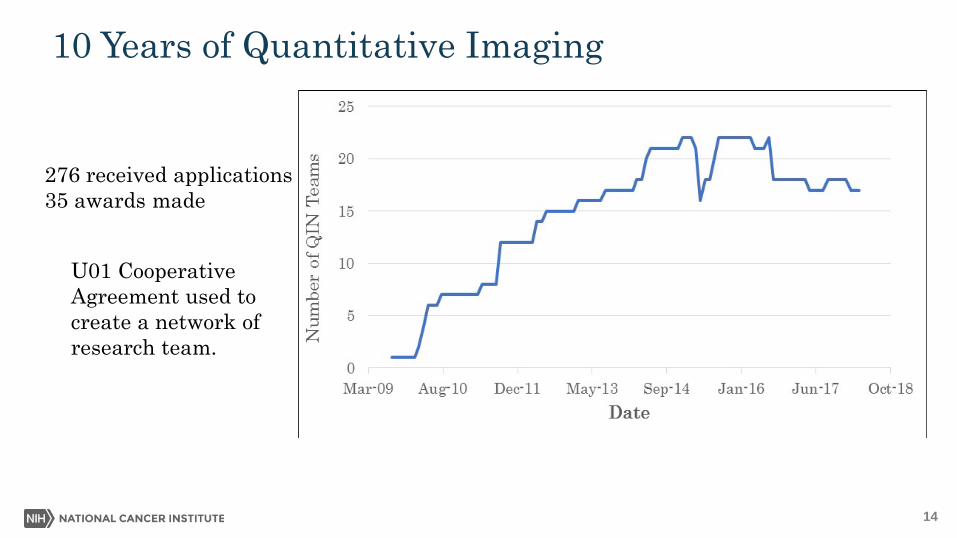
10 Years of Quantitative Imaging
0
5
10
15
20
25
30
35
40
45
2008 2009 2010 2011 2012 2013 2014 2015 2016 2017 2018
Awarded Received
276 received applications35 awards made
U01 CooperativeAgreement used tocreate a network ofresearch team.
15
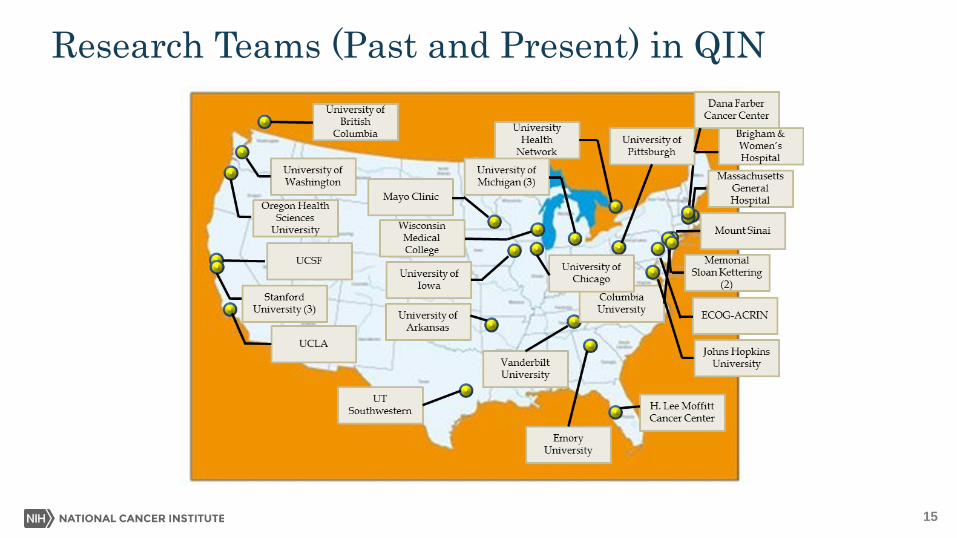
Research Teams (Past and Present) in QIN
16
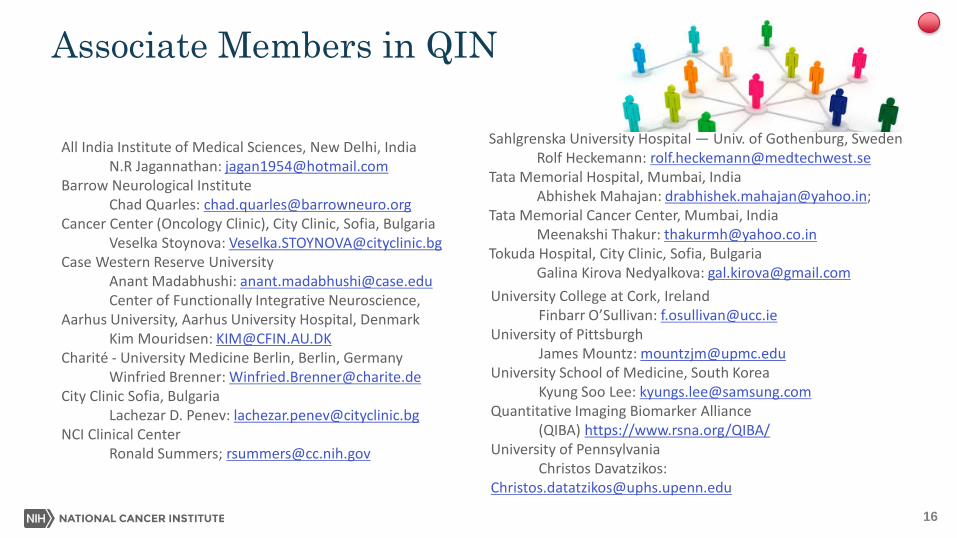
Associate Members in QIN
All India Institute of Medical Sciences, New Delhi, IndiaN.R Jagannathan: [email protected]
Barrow Neurological InstituteChad Quarles: [email protected]
Cancer Center (Oncology Clinic), City Clinic, Sofia, BulgariaVeselka Stoynova: [email protected]
Case Western Reserve UniversityAnant Madabhushi: [email protected] of Functionally Integrative Neuroscience,
Aarhus University, Aarhus University Hospital, DenmarkKim Mouridsen: [email protected]
Charité - University Medicine Berlin, Berlin, GermanyWinfried Brenner: [email protected]
City Clinic Sofia, BulgariaLachezar D. Penev: [email protected]
NCI Clinical CenterRonald Summers; [email protected]
University College at Cork, IrelandFinbarr O’Sullivan: [email protected]
University of PittsburghJames Mountz: [email protected]
University School of Medicine, South KoreaKyung Soo Lee: [email protected]
Quantitative Imaging Biomarker Alliance(QIBA) https://www.rsna.org/QIBA/
University of PennsylvaniaChristos Davatzikos:
Sahlgrenska University Hospital — Univ. of Gothenburg, SwedenRolf Heckemann: [email protected]
Tata Memorial Hospital, Mumbai, IndiaAbhishek Mahajan: [email protected];
Tata Memorial Cancer Center, Mumbai, IndiaMeenakshi Thakur: [email protected]
Tokuda Hospital, City Clinic, Sofia, BulgariaGalina Kirova Nedyalkova: [email protected]
17
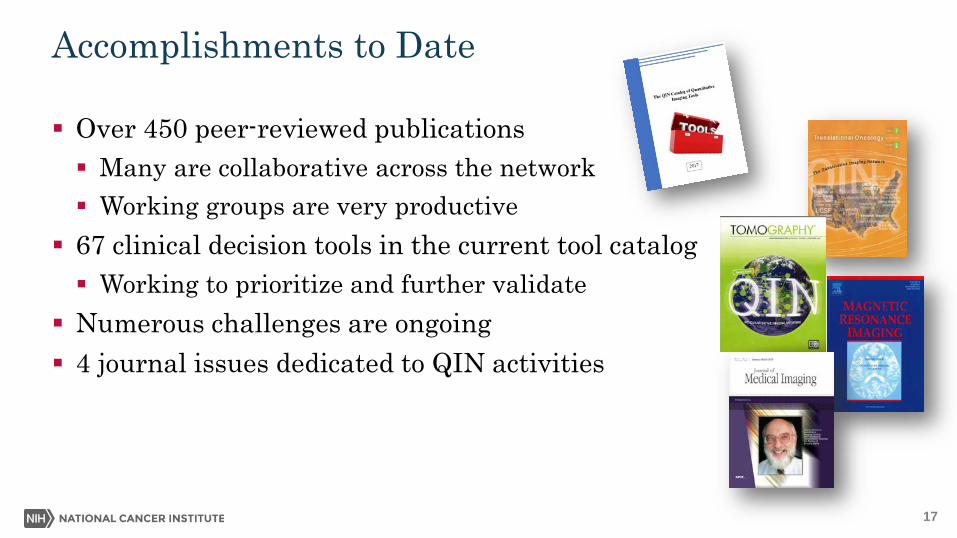
Accomplishments to Date
Over 450 peer-reviewed publications Many are collaborative across the network Working groups are very productive
67 clinical decision tools in the current tool catalog Working to prioritize and further validate
Numerous challenges are ongoing 4 journal issues dedicated to QIN activities

18
QIN network is efficiently organized
$0.00$2,000.00$4,000.00$6,000.00$8,000.00
$10,000.00$12,000.00$14,000.00
2008 2010 2012 2014 2016 2018 2020In
vest
men
t
Year
Annual Investment in QINAverage research teaminvestment: $570,500per year.
Same as a typical R01investigator-initiatedaward.
QIN support amounts to9% of the total Cancer ImagingProgram R01 support over the same timeframe, and only 6%of the total CIP extramuralsupport over that time.
19
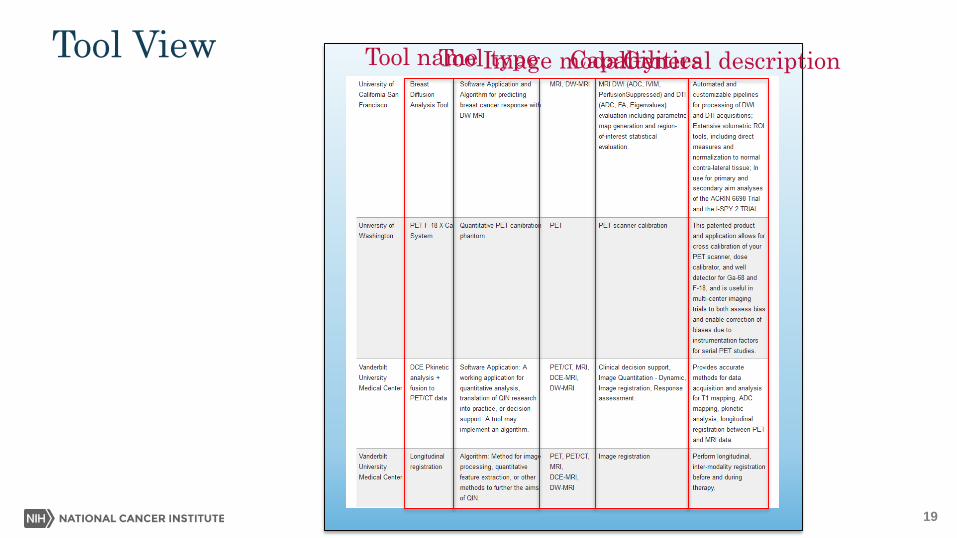
Tool View Tool typeTool name Image modalityGeneral descriptionCapabilities

20
The Tool Catalog

21
The Tool Catalog & Benchmarking
1. Pre-Benchmark
2. Basic Benchmark
3. Technical Test Benchmark
4. Clinical Trial Benchmark
5. Clinical Use Benchmark

Representative tools developed by QIN teams
Tool Modality PurposeLymph node segmentation MRI Lymph node segmentation
Xcal PET Multicenter PET SUV cross-calibration
AutoPERCIST PET PERCIST response analysis for FDG-PET
Lung Segmentation CT Volumetric lung nodule segmentation
Radiomics analysis CT Lung, head and neck radiomics analysis
Mass estimation CT Muscle mass of cancer patients
ePAD Image analysis Image annotation and quantitative analysis
Slicer Image analysis Image analysis and surgical planning
23
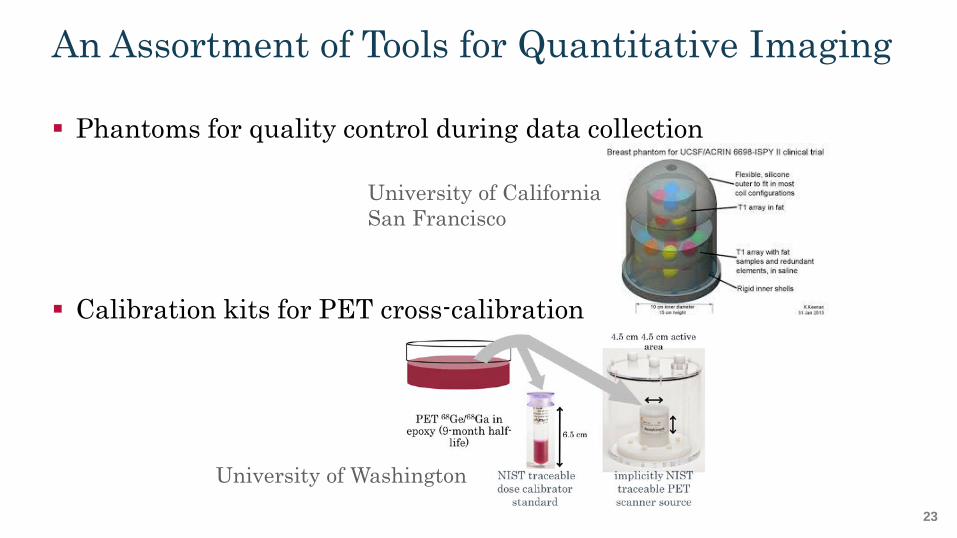
An Assortment of Tools for Quantitative Imaging
Phantoms for quality control during data collection
Calibration kits for PET cross-calibration
University of CaliforniaSan Francisco
University of Washington

24
Interactive Stations for Optimization & Training
Radiologist outline in pinkMachine outline in blue
University of Michigan

25
Enhancement of Infiltrating Tumors
Choline/NAA ratio in tumor delineates tumor and shows infiltration.
Tumor only weakly visible on T1 weighted image.
Photos from Emory University
NAACho
Cho
Cr
Normal
Tumor

26
PET Imaging Response CriteriaPERCISTComplete metabolic response:
Complete resolution of FDG uptake, with uptake less than themean SUL of the liver andindistinguishable from thesurrounding background.
Partial metabolic response:A decrease of greater than or equalto 30% and of at least 0.8 SULunits between the most intenseevaluable lesion at bae-line andthe most intense lesion at follow-up.
Stable metabolic disease:An increase or decrease of less than30% in a target lesion, nad no SULpeakof less than 30% is required.
Progressive disease:Greater than 30% and an increaseof at least 0.8 SUL units in a targetlesion.
Liver region forbackground reading.
Hottest lesion, baselineand follow-up.
Johns Hopkins Universityand Washington University

27
Informatics and Clinical Data Display
Tool pipelines
Image annotationsSemantic featuresSegmentationAnalysis
Stanford University

28
Pathway to FDA Clearance
A QIN team has completed thepath to FDA clearance onsoftware for clinical decision-making prior to beginningwork on the QIN project.This will streamline theprocess for clearance formany QIN teams.
University of Chicago

29
QIN embracing the use of Radiomics
Deep learningArtificial intelligence
30
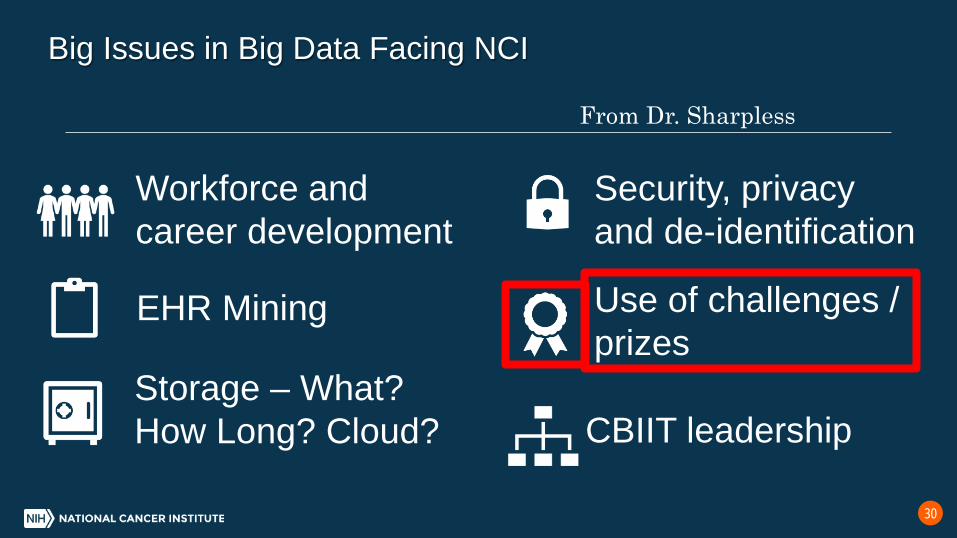
Big Issues in Big Data Facing NCI
Workforce and career development
EHR Mining
Storage – What? How Long? Cloud?
Security, privacy and de-identification
Use of challenges / prizes
CBIIT leadership
From Dr. Sharpless

31
Challenges help to qualify tool performance
Common data set with trainingand testing imaging dataoutcome data

32
Current list of QIN challenges
Title Challenge or Collaborative project1 PET Segmentation Challenge- PET-CT WG2 Dynamic PET/MISO Collaborative Project- PET-CT WG3 Interval Change using NLST Chest CT Scans Challenge- PET-CT WG4 CT Image Feature Collaborative Project- PET-CT WG5 Breast DCE-MRI Collaborative Project- MRI WG6 DCE-MRI Arterial Input Function Collaborative Project- MRI WG7 QIN ADC Collaborative Project- MRI WG8 DICOM Storage - Parameter Map Storage Collaborative Project- MRI WG9 DSC MRI Challenge- MRI WG
10 Validation of Gradient non_Linearity Bias Correction Collaborative Project -MRI WG11 Breast MRI Metrics of Response (BMMR) Challenge - MRI WG12 Cerebral Blood Volume DSC MRI Collaborative Project MRI WG13 Differentiation of high-grade prostate cancer with DWMRI Collaborative Project MRI WG14 PET Hypoxia Measurement Collaborative project PET-CT WG15 Informatics Pipeline Collaborative Project BIDS WG

33
Vision provided by Dr. Sharpless
Clearly there are three bins of activity Things we have to do Things we want to do Things we are already doing (but need ongoing attention)
For the QIN, the things we have to do are the things we want to do. So let’s look at the things we are doing vs. the things we still have
to do.
34
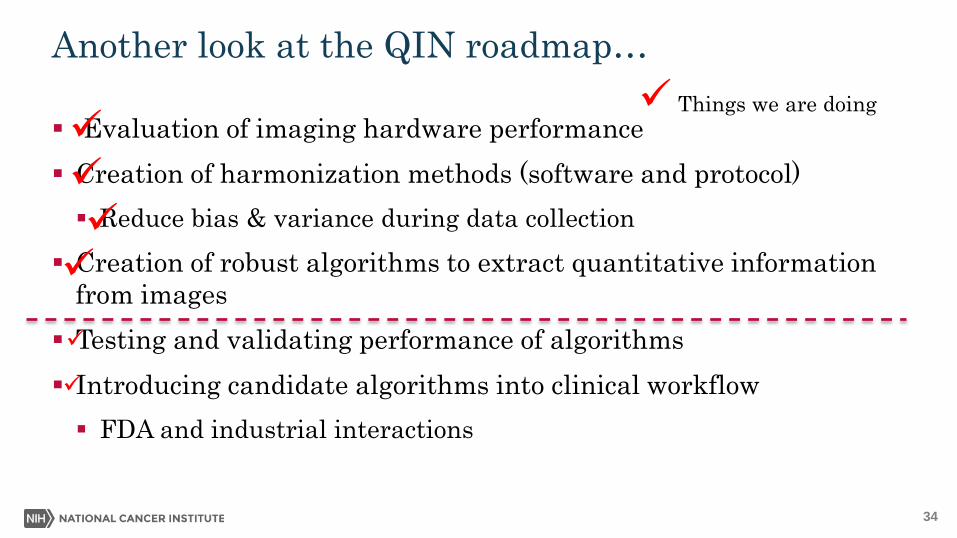
Another look at the QIN roadmap…
Evaluation of imaging hardware performance Creation of harmonization methods (software and protocol) Reduce bias & variance during data collection
Creation of robust algorithms to extract quantitative information from images
Testing and validating performance of algorithms Introducing candidate algorithms into clinical workflow FDA and industrial interactions
Things we are doing
35
To Participate in Precision Medicine
It is important to distinguish patient characteristics sufficiently well to be able to select patients who will benefit from an intervention, sparing the expense and side effects from those who will not. Quantitative Imaging can be a key player in this process. But, quantitative imaging can only have value in this area if it can
take a place as a reliable tool in clinical workflow.

The Great Divide
Imaging CommunityClinical CommunityIf we build it,
they will come We’re doingOK
Really?You’re both wrong.
NCI
J Eary 2018

37

38
Two Aspects to Clinical Utility
Does the tool offer results that are useful to the oncologist? It serves a clinical need It is reliable and repeatable
Does the tool fit into clinical workflow without disruption? The tool is easy to use The results are compatible with other clinical data

39
Bridging the Gap: Validating Tools
Engaging in challenges to compete tools against one another on fixed data sets to determine superior performing tools
Teams are using archived imaging data retrospectively to confirm tool performance characteristics
Inserting tools into single-site clinical trials to gain information on tools performance in a clinical environment
Teams are reluctant to crossfrom development to validation.
40
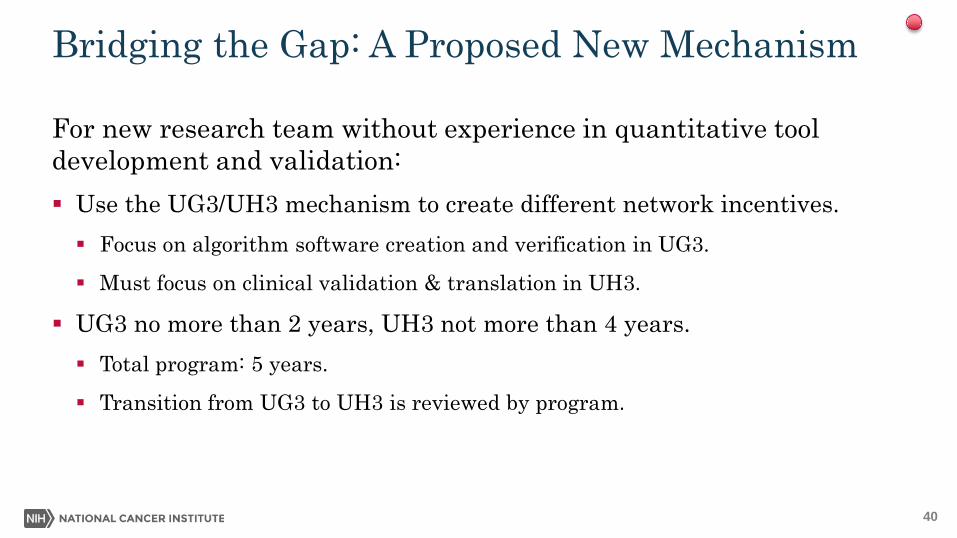
Bridging the Gap: A Proposed New Mechanism
For new research team without experience in quantitative tool development and validation: Use the UG3/UH3 mechanism to create different network incentives. Focus on algorithm software creation and verification in UG3.
Must focus on clinical validation & translation in UH3.
UG3 no more than 2 years, UH3 not more than 4 years. Total program: 5 years.
Transition from UG3 to UH3 is reviewed by program.

41
Bridging the Gap: A Proposed New Mechanism
For research teams experienced in quantitative tools development: Conversion of U01 cooperative agreement to R01 research grant Transfer control of the network to the research teams, not NCI
Investigator-initiated research in the standard RPG pool
Center for Scientific Review panel will include clinical emphasis
Transition teams into other grant possibilities such as Academic Industrial partnership (PAR-18-009), and parent grant opportunities Bring more industry perspective into the network
42
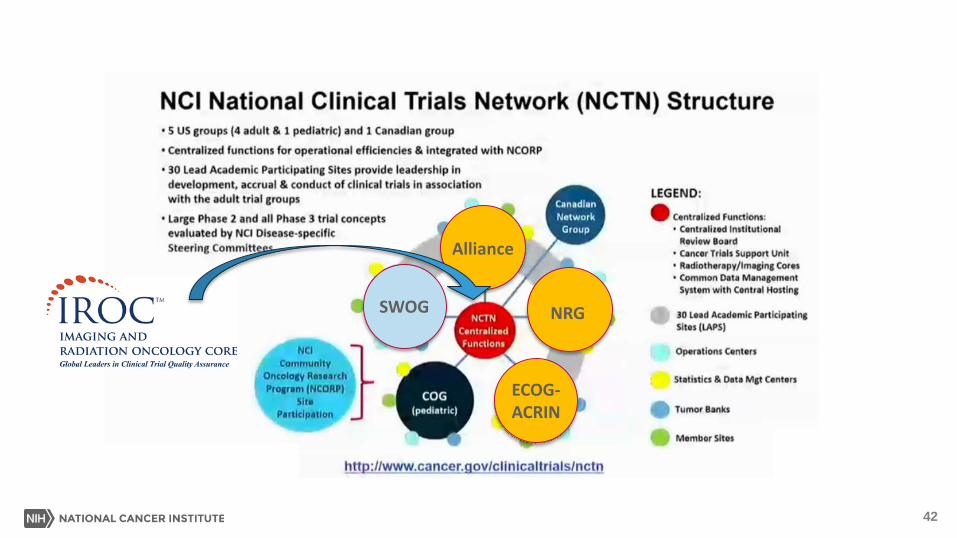
Alliance
ECOG-ACRIN
SWOG NRG

43
QIN “SWAT” team to carry message to cooperative groups
Robert Nordstrom, PhD: NCI
Janet Eary, MD: NCI
David Mankoff, MD: University of Pennsylvania and ECOG-ACRIN
Paul Kinahan, PhD: University of Washington and ECOG-ACRIN
Larry Schwartz, MD: Columbia University and Alliance
Michael Knopp, MD, PhD: The Ohio State University and IROC
Hui-Kuo Shu, MD, PhD: Emory University and NRG
John Buatti, MD University of Iowa and NRG
Maryellen Giger, PhD: University of Chicago

ECOG-ACRIN as a Member of QIN Aim 2: Develop the ECOG-ACRIN QIN Resource to support retrospective
testing for single- or multi-site QIN projects that seek to develop effective and efficient metrics and analysis methods for trials using advanced imaging. Use ECOG-ACRIN imaging and outcome data from completed ACRIN clinical trials as
testbeds for QIN tool validation.
Aim 3: Develop the ECOG-ACRIN resource to support prospective testing of novel imaging methods developed in the QIN. Coordinate access to ACRIN clinical trials where prospective studies of QIN tool
performance can be evaluated.

45
QIN tools are working in clinical trials
NCT02154490 Lung-MAP: Biomarker-Targeted Second-Line Therapy in Treating Patients With Recurrent Stage IV Squamous Cell Lung Cancer
Radiomics tools to assess response to therapy
A031704 PD-inhibitor (Nivolumab) and Ipilimumab followed by nivolumab vs. VEGF TKI cabozantinib with nivolumab in metastatic untreated REnal Cell CancEr [PDIGREE]
Volumetric / Necrosis / Radiomics tools to assess predictive and prognostic imaging biomarkers of response and progression
ALLIANCE A021602 - Randomized, Double Blinded Phase III Study of Cabozantinib versus Placebo in Patients with Advanced Neuroendocrine Tumors after Progression on Everolimus (CABINET)
Volumetric / Necrosis / Radiomics tools to assess predictive and prognostic imaging biomarkers of response and progression
A Randomized Phase 2 Study of Peptide Receptor Radio-Immune Therapy (PRRIT) in Gastro-Entero-Pancreatic Tumors, with Somatostatin Receptor Expression, and have progressed on Somatostatin Analog Therapy
Auto PERCIST tool

46
What more can QIN do to distribute tools?
We are publishing and promoting tools at all possible opportunities. We are motivating teams to move to validation as quickly as
possible. We are increasing industry and FDA participation in the network. We look to CTAC for additional ideas. Are there ways to reduce the hurdles into clinical trials? What would CTAC like us to do?
47

www.cancer.gov www.cancer.gov/espanol


![Quantitative Magnetic Particle Imaging Monitors the ...Magnetic particle imaging (MPI) [16–21], an imaging modality distinct from MRI, produces line-arly quantitative images of iron](https://static.fdocuments.in/doc/165x107/6124fca4732f0c68d25dc95d/quantitative-magnetic-particle-imaging-monitors-the-magnetic-particle-imaging.jpg)