The Quality Improvement of Primary Children Learning ...
47
1 The Quality Improvement of Primary Children Learning through a School-Based Programme in Indonesia Laurens Kaluge Setiasih Harjanto Tjahjono Universitas Surabaya East Java, Indonesia 2004 Research Paper
Transcript of The Quality Improvement of Primary Children Learning ...

1
The Quality Improvement of Primary Children Learning through a School-Based Programme in Indonesia
Laurens Kaluge Setiasih
Harjanto Tjahjono
Universitas Surabaya East Java, Indonesia
2004
Research Paper

2
Table of Contents
Table of Contents
Abstract
Acknowledgements
1. Background of the Quality Improvement Programme
2. The Sidoarjo School Improvement Programme
3. Methods of the Study
4. The Description of Data
5. Findings and Discussion
6. Conclusions and Recommendations
References
Appendices

3
Abstract
This paper reports the evaluation results of a school-based quality improvement programme
called SSIP in East Java, Indonesia. In terms of equity, the evaluation took into account
variables such as gender, age, and family social economic status referred to parental
education and occupation. The programme focused on Social Studies in Grade 3 and 4
primary schools. The main problem was: after controlling for the pupil, class, and school
factors did the programme improve the quality of schools? There were 19 experimental and
15 control schools identified on the basis of local clusters included in the study. Thus the
study followed used a quasi-experimental design and multilevel modelling techniques (using
pupil, classroom and school as the levels) were used to analyse the data. Even though not all
of the results were consistently evident across all analyses the following influences were
generally identified. Prior attainment (for Grade 3 and 4), ability, gender, father education,
parental occupation, self-concept, democratic attitudes, locus of control were significant
variables at pupil level. Classroom management was important at the class level.
Formalisation, teacher affiliation, and work pressure were important factors for the children’s
progress at the school level. The experimental schools achieved better than the control
schools. Before entering any factor, the variance explained at the class and school level
ranged between 16.3 and 29.4% for Grade 3 and 27.3 to 46.2% for Grade 4. After including
the significant factors in the analysis, the contribution of the final model ranged from 16.3 to
36.8 % for Grade 3 and 27.8 to 50.3% for Grade 4. The success of such an educational
improvement programme is optimistic sign for the future.

4
Acknowledgement
This is a report on the evaluation of a school-based programme in order to improve the
quality of children learning. Since the initiation of the programme until finishing this study
the researchers are grateful to many institutions taking part in different time, ways and places.
Firstly, The Universitas Surabaya and FINED as sponsors for the programme. Secondly, the
office of education such as District Kanwil and Local Kandep Diknas as superordinate of
schools which positively support to the activities of the programme. Thirdly, schools,
principals, teachers, and pupils as the main actors in the programme.

5
1. Background of the Quality Improvement Programme
1.1 Current problems of Education in Indonesia
The Republic of Indonesia has achieved general education for almost all children in
Indonesia. However there are several problems in education to be discussed for research and
improvement projects. The important problems are the effectiveness and efficiency of
education. With effectiveness is meant the effects of schools, teachers and education in
general on the student achievement. The effectiveness is reflected in the outcomes as
measured by standardised tests, number of students promoted to the next grade after taking
into account the background of students, their prior knowledge and the socio-economic status
(see Teddlie & Reynolds, 2000; Creemers, 1994a; Gray & Wilcox, 1995). In general the
output of education has been lower than expected, especially in more disadvantaged areas. In
this case, the great discrepancy between schools need to be considered. Some schools are
doing quite well but there are also schools that perform quite poorly.
The efficiency of education is negatively influenced by the amount of grade
repetition, dropouts and there are indications that schools cannot attain their objectives in a
given time-framework and that the cost of education increases with spending more time in
attaining the goals for specific children (Scheerens, 1992; Thomas, 1992; World Bank, 1998;
Unicef, 2000). The former projects such as Primary Education for Quality Improvement
Project (PEQIP), and the Basic Education Project (BEP) tried to increase the effectiveness
and the efficiency of education. As is known from other international and national project
studies, the effectiveness of education is especially related to the instructional processes at
classroom level and the organisation of the school. In this respect, the major problems of
Indonesian education become clear. The problems concern the instructional processes such as
objectives and content of instruction, the activities of students and the supportive conditions
at the school level. The ordinary classroom in Indonesia is characterised by a low degree of
activity of children. They are sitting in rows, not actively involved in the learning process.
One of the reasons might be that the instructional process is not attractive, not well structured
and doesn't contain the other characteristics which make instruction effective. In terms of
equity, it is also not related to the differences between children because the instruction treats
the classroom as a whole and is not adapted to the needs of specific children. In project for
Active Learning through Professional Support (ALPS) this issue was partly aimed at
increasing the involvement of children in learning activities (Tangyong, Wahyudi, Gardner,

6
& Hawes, 1989). Other characteristics, however, of effective instruction were somewhat
disregarded in this project.
One of the causes of poor learning achievement of students in Indonesia is the
centralized curriculum, which is ineffective. The central ruling about the curriculum cause
limited teacher creativity. A second problem is the inadequate assessment of student
achievement. So far, efforts to improve student achievement have focused almost exclusively
on inputs, such as teacher training, curriculum revision and provision of textbooks. But
students, teachers and principals do not work hard together with the intention to achieve the
objects of education. A third problem is the lack of teaching and learning materials. Several
studies pointed out that there is a bad distribution of the textbook and if the textbooks are
available, many times students and teachers don’t know the proper use of the books. Another
problem is the number and quality of the teachers. A number of studies indicate that teacher
competency in Indonesia is low. Consequently, many Indonesian teachers working in primary
schools have educational qualifications lower than formally required.
The quality of education is not only related to the curriculum delivery and
instructional technology but also the content of education and instruction itself. The
objectives and content of Indonesian education is academically focussed. The academic
subjects (mathematics, language and science) in the majority of schools are not related to
daily life experiences of children nor can what is learned be practiced in daily life again. In
the cognitive domain basic knowledge and skills are addressed, but there is not much
attention for higher order skills, like analysing, synthesising and the evaluation of knowledge.
Furthermore there is little attention for educational objectives in other domains (aesthetic,
social, affective and moral). In daily life however children deal with more than cognitive
knowledge and skills alone, they have to deal with social, cultural and moral situations as
well. It can be expected from education that education at least provides a cognitive basis to
deal with this kind of topics.
One of the causes of poor learning achievement of pupils in Indonesia is the
centralized curriculum, which is ineffective. The central ruling about the curriculum causes
limited teacher creativity. Another problem is the inadequate assessment of pupil
achievement. So far, efforts to improve pupil achievement have focused almost exclusively
on inputs, such as teacher training, curriculum revision and provision of textbooks. But
pupils, teachers and principals do not work hard together with the intention to achieve the
objects of education. A third problem is the lack of teaching and learning materials. Several

7
studies pointed out that there is a bad distribution of the textbook and if the textbooks are
available, many times pupils and teachers don’t know the proper use of the books. Another
problem is the number and quality of the teachers. A number of studies indicate that teacher
competency in Indonesia is low. Consequently, many Indonesian teachers working in primary
schools have educational qualifications lower than formally required (Thomas, 1992;
Supriyoko, 2002; Suparno, 2002).
Indicators of the inefficiency of education in Indonesia are the repetition rates, the
dropout rates and the non-completion rates. One of the causes of the inefficiency is the
economic crisis and dropout rates in earlier grades. Because of the crisis many parents have
low income and don’t have enough money for the education of their child. Dropout rates are
especially high in the higher grades (Unicef, 2000).
Students repeat because they cannot achieve the minimum standard of academic
achievement, but repeating is also closely related to the child’s readiness. The attendance at
pre-school or kindergarten has a positive impact on student’s performance. However, only a
small proportion of children attend kindergarten or pre-school programs. Internal inefficiency
also seems to be a problem (Unicef, 2000).
Surakhmad (1999) prescribes a practical-technical approach to solve current problems
in Indonesian education. For better education there should be a future oriented policy, a
democratic foundation of education, a predominantly pioneering approach and a
decentralized, community base management of education. The project of SSIP also uses other
approaches, which set priorities in improving the curriculum and improving teacher
competencies, in order to improve Indonesian primary education.
1.2 Former school improvement projects in Indonesia
Several school effectiveness projects (Kaluge, 1999; Ministry of Education, 1998) are
considered as the background for SSIP. A study by BP3K sponsored by the Indonesian
Ministry of Education and Culture (Setijadi, Moegiadi, Wiradinata & Elley, 1978) concluded
that the largest influence on student achievement were the indices of classroom climate.
Another important conclusion made was that the students in city schools achieved better than
the students of the rural schools. The results of this study were used as some starting
considerations for innovation in Indonesian primary education, known as CBSA (student
active learning), introduced by the ALPS project (Tangyong, Wahyudi, Gardner & Hawes,
1989).

8
Suryadi (1992) conducted another Indonesian study under the sponsorship of the
Indonesian Ministry of Education and Culture and USAID to improve primary schools. He
found that home and community variables affected variation more than the school quality
variables. The study was held in three provinces over 5790 random sampled students. Quality
and length of the instruction time were found out to be the most strongest policy manipulable
predictors of student achievement. Positive factors to higher student achievement were
reading books, peers discussion, teaching through reading, the use of teaching materials and
class discussions. Lecturing by the teacher was a negative factor to higher student
achievement. Some of these studies suffered from severe methodological problems, because
they failed to considered important baseline variables (Kaluge, 1999).
The Primary Education Quality Improvement Project (Ministry of Education, 1998)
focused on the training of tutors and subject matter specialist, who then in their turn had to
train teachers. Focus of the study was the professional development of teachers, the
educational management, books, learning materials and evaluation and monitoring. PEQIP
affected the quality of education in terms of student outcomes. However, differences between
PEQIP schools and non-PEQIP schools were small. The implementation time was too short.
The quality of instruction (the professional development of teachers) turned out to be the
most important factor to higher student achievement. The PEQIP-model was not effective
from an implementation point of view. Therefore, the authors made recommendations on
several levels. The focus of the principals is too much focused on administrative tasks and to
little on educative tasks. The training of teachers should focus on characteristics of effective
teaching. The involvement of community and parents deserves further attention. Good
textbooks that are actually available and used in classrooms, as well as teaching aids and
learning materials, are important vehicles for educational improvement.
The SSIP uses information of all these studies. The programme was meant for all
demographic types of schools and would be conducted on a small number of schools.
Teachers would be trained in order to make a better class climate and to improve the quality
of instruction. Principals would be involved in order to let them focus on educational tasks,
instead of administrative tasks. Group discussions would be held. Teaching materials would
be used. Intake variables would be taken care of.

9
2. The Sidoarjo School Improvement Programme
2.1 The Programme Objectives
The Sidoarjo School Improvement Programme (SSIP) used information of all those previous
studies. The programme was meant for all demographic types of schools and was conducted
on a small number of schools. Teachers were trained in order to make a better class climate
and to improve the quality of instruction. Principals were involved in order to let them focus
on educational tasks, instead of administrative tasks. Group discussions were held. Teaching
materials were used. Intake variables were taken into account.
Education in Indonesia is characterised by the fact that there are very strong central
guidelines with respect to the objectives and content of education. The room for
experimentation for individual schools is quite small. The only part that is more flexible and
more open is the local content part. Because this programme was only a pilot project, it was
decided to situate the project within this local content part in order to improve the quality of
education for that part of the curriculum. This programme was aimed at improving quality in
schools. There were four specified objectives:
• develop and implement objectives in cognitive, social and affective domains,
especially the synergy between the three domains
• develop up to date learning opportunities in the form of teaching-learning packages
and implement those packages in educational practice
• improve the quality of instruction within the programmes by improving the
methodology and the procedures of instruction, stressing more active involvement of
pupils, more adaptivity (related to specific needs of individual pupils) and improve
instructional methodology of the teacher.
• improve the conditions for classroom learning and teaching at the school level to
support improvement establish school – University partnership.
The knowledge basis for this programme is provided by research in different areas
and especially educational practice, which was evaluated. The specific characteristics of this
programme was that it was not restricted to one kind of knowledge basis or a certain topic
within the curriculum but it tried to combine different knowledge bases from different areas.
The main areas were (i) school improvement (ii) curriculum development and (iii) teaching
strategies.

10
2.2 School improvement.
Of course the improvement has to reach the children and that goes through the
classroom where teaching and learning take place. But in order to achieve classroom
effectiveness, conditions at school level have to be fulfilled, such as support at the school
through teaching materials and the supervision of teacher's teaching and the monitoring of
teachers' and pupils' progress. It also includes that the support given by the experts of the
teacher training institution and the universities. The support was provided in the school.
Teachers were not be taken out of their school and out of their classes. The supervision of
teachers and the guidance and monitoring was done through feedback on the actual classroom
behaviour. This can be done by the principal but also by external facilitators. Schools have to
develop an organisation within the school where innovation and improvement can take place
and is supported. There are different strategies for school improvement based on studies by
Stoll and Fink (1996), Hopkins (1990), Gray and Wilcox (1995), Gray, Reynolds, Fitz-
Gibbon and Jesson (1996). The main focus were the change of quality of teaching and
learning at classroom level by creating an organisation planning, implementing and
evaluating the process of teaching and learning in schools. Specific strategies which turned
out to be effective for teacher improvement was used, such classroom consultancy where
teachers immediately got feedback after the teaching about their teaching.
2.3 Curriculum development.
It is well-known that curriculum on paper doesn't work and that the final proof of the
curriculum is in the implementation of it. Curriculum Research resulted in some principles
can guide the development of materials. Materials should be well structured, clearly focused
and provide a lot of practical suggestions for activities, evaluation, feedback and adaptation
to individual needs. The curriculum was developed to be up to date and reflect the
environment where children live in. This was based on "old philosophies about education"
(Dewey) and new theories about the construction of knowledge by pupils themselves and
theories and experiences with real life mathematics and other real life educational
programmes (the constructivist approach).
2.4 Teaching strategies.
Educational research increased our knowledge about effective instruction, especially
on strategies which teachers could use to start, maintain and evaluate learning of pupils.

11
Characteristics of effective instruction can be found in the curriculum materials (learning
packages), the grouping of pupils in the classroom and - especially- the instructional activities
of teachers (Creemers 1994a, 1997). Although mastery learning was a very effective way of
grouping, in this programme we chose collaborative learning (Slavin, 1996) in order to
achieve certain goals. To increase teaching effectiveness the model of direct instruction
(Rosenshine, 1987) was applied with - if possible - some more constructivist approaches
(Creemers, 1994b; Creemers & Reezigt, 1996).
2.5 Activities.
The pilot project consisted of the following interrelate activities. Firstly, exchanging
information and finalising the project plan. The activity information was done by experts
from the IKIP/university (teacher training institution). The expert (supervisor) provided
further information about the different components comprised the project. This was discussed
because, finally, schools together with the experts had to agree on the project plan and the
activities. Secondly, the development of curriculum materials (the teaching-learning
packages). This was done by teams of teachers and principals within the gugus (school
cluster), depending on the number of gugus and schools which participate. Teams of teachers
and principals within the gugus (school cluster) had to develop about 6 packages, three for
each Grade 3 and 4. The development of the packages was supervised by the experts of the
universities. It was expected that different phases of construction were necessary: 1) draft, (2)
presentation and discussions to other participants who have to work with it as well, (3)
improvement based on critique, (4) pilot testing in different grade level and schools, (5) final
form, and (6) production of materials. Thirdly, training the teachers and principals. These
activity started immediately and continued throughout the whole project (in all stages).
Fourthly, the implementation of the curriculum. In this activity the teachers carried out the
package. This was supervised by the principal. In this way teachers got immediate feedback
from the experts. Gradually the principal took over this task from the experts. Fifthly,
evaluation. In the evaluation information was collected about the opinions of teachers,
principals and students concerning the packages in order to improve the curriculum and
finally the achievement of students in different areas. The information was analysed. Sixthly,
reporting. The development of materials (phase I), was reported separately from the
implementation of the materials in the second phase. The intention was also to publish a final
report which addresses also the question of school/educational improvement in this project. It

12
gave recommendations for future school improvement projects (based on the results of
students and teachers).

13
3. Methods of the Study
3.1 Objectives of the Study
The purpose of this study was providing information on to what extent school had been
improved by introducing the SSIP after taking into account the pupil, class, and school
factors. In more specific, the objectives of the study were attempting to answer the following
research questions:
1) what were the meaningful variables at pupil, class, and school levels that
differentiate the children progress in learning the social studies?
2) did the experimental schools (those that implement the programme) achieve success
and how big the variation accounted for the pupil and school or class levels?
3.2 Sample
This programme is located in the Sidoarjo-district, south of the city of Surabaya,
Indonesia. In this programme, it was chosen three sub-districts where in each has school
clusters named gugus. The participating subdistricts were Sidoarjo (urban characteristic),
Krian (sub-rural characteristic) and Krembung (rural characteristic). Each gugus was divided
into experiment schools and control schools. Table 3.1 shows the number of schools per
gugus. The number of control schools of Gugus Krian is low. Due to circumstances it was not
possible to arrange more control schools.
Table 3.1 Number of participating schools
Experiment Schools Control Schools Sidoarjo 7 5 Krian 6 3 Krembung 6 7 Total number of schools 19 15
The teachers in Grade 3 and 4 had an average age of 43 years. The teachers of
experiment schools were in average one year younger than the control teachers. 81% of the
teachers was female (88% at the experiment schools and 74% at the control schools). Both
experiment and control school teachers have an average experience in teaching of 13 years.
The average order of promotion rank between experiment and control schools was almost the

14
same. All differences between teachers of experiment and control schools were not
significant.
These 34 schools contained 1884 pupils in Grade 3 and 4. In this report a sample of
1547 pupils were used. During the testing some pupils were absent. Therefore in this section
only results of pupils who were present at all the tests (Intelligence Test, Content Related
Test in Cawu* 1 & 2, pupil background, Smiley Test) would be used. There was also an
outliers test conducted, as well as a distribution test. This way, the number of the pupils was
reduced to 1547. The number of these pupils per gugus per grade was shown in Table 3.2 and
were used in all results in this report.
Table 3.2 Number of participant pupils
Grade 3 Grade 4 Total Experiment
Schools Control Schools Experiment
Schools Control Schools
Sidoarjo 154 138 137 100 Krian 195 31 165 37 Krembung 94 169 114 213
Total number of pupil
443
338
416
350
1547
The average age of the pupils in Grade 3 was at time of measuring 7 years and 5
months. The average age of the pupils in Grade 4 at the same time was 8 years and 7 months.
There were more male than female pupils in the schools, except for the experiment schools of
Gugus Krembung. The experiment schools have 52% male pupils; the control schools have
53% male pupils. Gugus Krembung was showing the most equal distribution between male
and female pupils. Differences between experiment and control schools and between gugus
were not significant according to a Chi-square calculation.
The 34 schools were divided between 19 experiment and 15 control schools. Average
age of the teachers is 44 years old. In experiment schools 28% of the teachers was male, in
control schools this was 34%. The average order of promotion rank between experiment and
control schools is almost the same. The teachers in the experiment schools have overall less
experience in teaching than the teachers in the control schools (12.39 years vs. 12.77 years).
All differences in information about the teachers between experiment and control schools
were not significant.
* School term on the basis of four months.
15
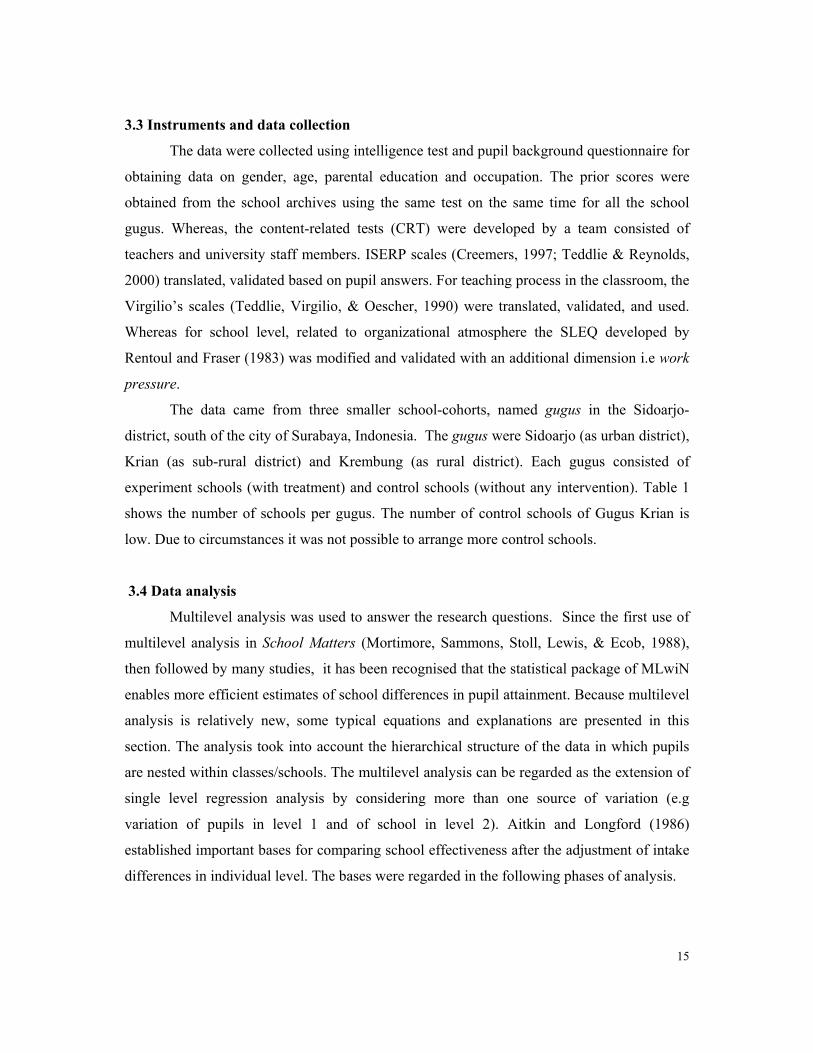
3.3 Instruments and data collection
The data were collected using intelligence test and pupil background questionnaire for
obtaining data on gender, age, parental education and occupation. The prior scores were
obtained from the school archives using the same test on the same time for all the school
gugus. Whereas, the content-related tests (CRT) were developed by a team consisted of
teachers and university staff members. ISERP scales (Creemers, 1997; Teddlie & Reynolds,
2000) translated, validated based on pupil answers. For teaching process in the classroom, the
Virgilio’s scales (Teddlie, Virgilio, & Oescher, 1990) were translated, validated, and used.
Whereas for school level, related to organizational atmosphere the SLEQ developed by
Rentoul and Fraser (1983) was modified and validated with an additional dimension i.e work
pressure.
The data came from three smaller school-cohorts, named gugus in the Sidoarjo-
district, south of the city of Surabaya, Indonesia. The gugus were Sidoarjo (as urban district),
Krian (as sub-rural district) and Krembung (as rural district). Each gugus consisted of
experiment schools (with treatment) and control schools (without any intervention). Table 1
shows the number of schools per gugus. The number of control schools of Gugus Krian is
low. Due to circumstances it was not possible to arrange more control schools.
3.4 Data analysis
Multilevel analysis was used to answer the research questions. Since the first use of
multilevel analysis in School Matters (Mortimore, Sammons, Stoll, Lewis, & Ecob, 1988),
then followed by many studies, it has been recognised that the statistical package of MLwiN
enables more efficient estimates of school differences in pupil attainment. Because multilevel
analysis is relatively new, some typical equations and explanations are presented in this
section. The analysis took into account the hierarchical structure of the data in which pupils
are nested within classes/schools. The multilevel analysis can be regarded as the extension of
single level regression analysis by considering more than one source of variation (e.g
variation of pupils in level 1 and of school in level 2). Aitkin and Longford (1986)
established important bases for comparing school effectiveness after the adjustment of intake
differences in individual level. The bases were regarded in the following phases of analysis.

16
3.4.1 Starting null model
The first simplest one was the null model which only estimated the total variance and
its components. In this model the scores were regressed on the constant term (coded 1 for
every pupil). In addition the constant term was set at random at both the pupil and school
levels. The aim of this analysis was to estimate the overall mean achievement at both intake
and at the end of school year and also to see whether there were any school differences in
mean achievement. The intra-school correlation (the proportion of the total variance which
was between schools) was also computed from the random estimates.
The model fitted was (based on Goldstein, 1995; Snijders & Bosker, 1999):
Yij = ojxo + eoijxo
with βoj = αoo + uoj (between school variation)
where
i = pupil j = school yij = pupil’s attainment xo = the intercept term (constant) with a value of 1 for every pupil αoo = overall mean attainment uoj = school level residual eoij = pupil level residual
Thus the model can be summarised as follows:
Yij = βo + (uoj + eoij) fixed random The following parameters were estimated by model 1:
βo = overall average attainment
σ2oe = pupil level variance i.e between pupils within schools variation σ2ou = between school variance The intra-school correlation was given by the formula:
ρ = σ2ou / ( σ2ou + σ2oe) This correlation measured the proportion of the total variation that was due to schools and
also the degree of similarity of the pupils within a school. The larger the value of ρ the
greater the clustering and the more important it was to use a fully efficient estimation
procedure (Goldstein, 1995 ).
17
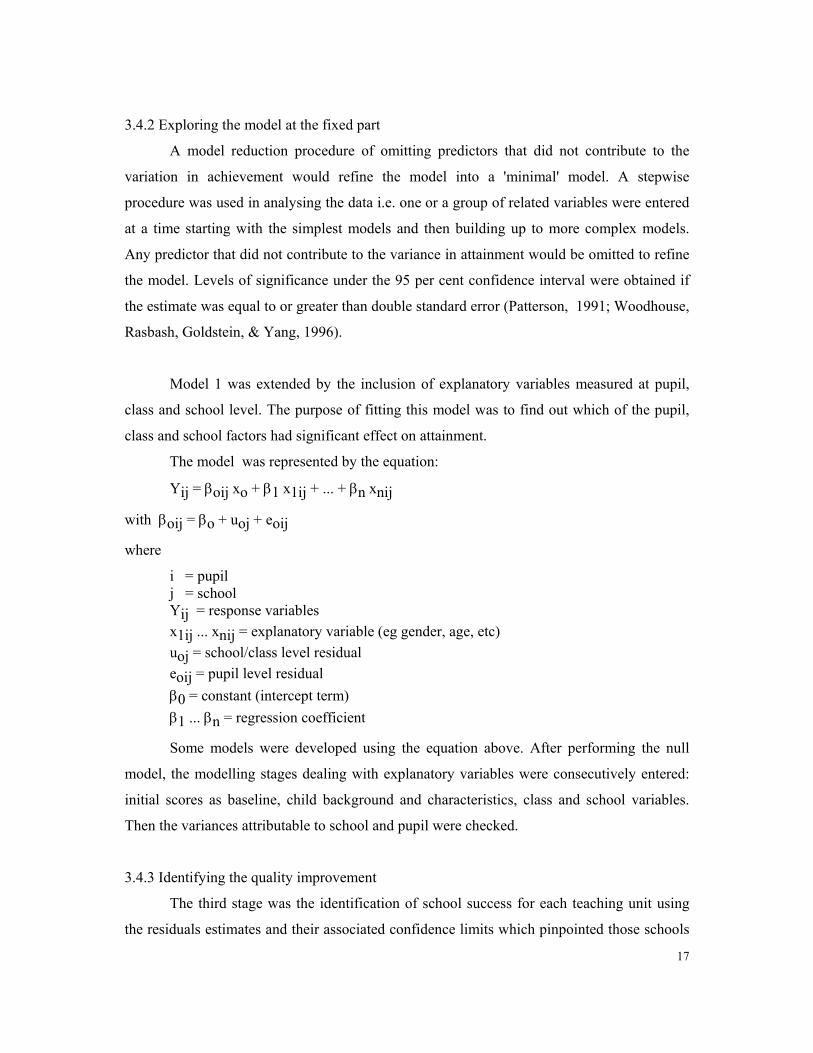
3.4.2 Exploring the model at the fixed part
A model reduction procedure of omitting predictors that did not contribute to the
variation in achievement would refine the model into a 'minimal' model. A stepwise
procedure was used in analysing the data i.e. one or a group of related variables were entered
at a time starting with the simplest models and then building up to more complex models.
Any predictor that did not contribute to the variance in attainment would be omitted to refine
the model. Levels of significance under the 95 per cent confidence interval were obtained if
the estimate was equal to or greater than double standard error (Patterson, 1991; Woodhouse,
Rasbash, Goldstein, & Yang, 1996).
Model 1 was extended by the inclusion of explanatory variables measured at pupil,
class and school level. The purpose of fitting this model was to find out which of the pupil,
class and school factors had significant effect on attainment.
The model was represented by the equation:
Yij = βoij xo + β1 x1ij + ... + βn xnij
with βoij = βo + uoj + eoij
where
i = pupil j = school Yij = response variables x1ij ... xnij = explanatory variable (eg gender, age, etc) uoj = school/class level residual eoij = pupil level residual β0 = constant (intercept term) β1 ... βn = regression coefficient
Some models were developed using the equation above. After performing the null
model, the modelling stages dealing with explanatory variables were consecutively entered:
initial scores as baseline, child background and characteristics, class and school variables.
Then the variances attributable to school and pupil were checked.
3.4.3 Identifying the quality improvement
The third stage was the identification of school success for each teaching unit using
the residuals estimates and their associated confidence limits which pinpointed those schools

18
performing better or worse than expected from their intake (p<0.05). Some explorations in
this phase were plotting the school’s mean raw score for the relevant outcome. In this case,
the distinction of the experiment and control schools (in dummy variable) was needed.

19
4. The Description of Data
4.1 Pupil age and gender
The average age of the children in Grade 3 was at time of measuring 7 years and 5
months old (SD = 18.78 months). The average age of the children in Grade 4 at the same time
was 8 years and 7 months old (SD = 17.17 months).
There were more male than female children in the schools (see Table A3.1.1), except
for the experiment schools of Gugus Krembung. The experiment schools had 52% male
pupils; the control schools had 53% male pupils. Gugus Krembung was showing the most
equal distribution between male and female pupils. Differences between experiment and
control schools and between gugus were not significant according to a Chi-square
calculation.
4.2 Parent’s education and occupation
The education and occupation of parents were shown in Figures 4.1 to 4.4. The level
of education of the father was higher than the level of education of the mother. Differences
between experiment and control schools were according to a Chi-square test only significant
for Grade 3, education and work of mothers (the Chi-square test on education of the mother
showed one cell (5.6 %) with an expected value lower than 5.
Concerning the education of the father, the graphs showed not much difference
between experiment and control schools, but different between the gugus. Gugus Krian
showed a higher percentage in primary finished, Gugus Krembung showed a higher
percentage in secondary finished and Gugus Sidoarjo showed a higher percentage in tertiary
finished. The same trend was shown with the education of the mother. There were not many
differences between experiment and control schools. Gugus Krian showed a higher
percentage in primary finished, Gugus Krembung showed a higher percentage in secondary
finished and Gugus Sidoarjo shows a higher percentage in secondary senior finished and
tertiary finished. Half of the mothers had only been into primary education or had no
education at all. In contrary, half of the fathers had been into (senior) secondary education.

20
tertiary finished
tertiary not finishe
senior secondary fin
senior secondary not
secondary finished secondary not finish
primary finished
primary not finished
no education
Figure 4.1: Education of fathers
clerical & professio
skilled manual
unskilled manual
Figure 4.3: Father occupation
teritiary finished
tertiary not finishe
senior secondary fin
senior secondary not
secondary finished
secondary not finish
primary finished
primary not finished
no education
Figure 4.2: Education of mothers
clerical & professio
skilled manual
unskilled manual
non-earning
Figure 4.4: Mother occupation

21
The categories for parent occupation showed the sector the parent works. This was a nominal
category. Nothing could be said about earning. For instance, if a person works as a farmer he
could work on the rice-field and earn not much or he could own the rice-field and earn much
more. This was also possible in the category of clerical/professional: it couldnot be clear if a
person worked as a secretary or was director of a company.
The work of the parents was shown in Figures 4.3 and 4.4. In the work of the father,
experiment schools scored higher in unskilled manual than the control schools. Gugus Krian
showed the highest percentage in unskilled manual. Gugus Krembung had the highest
percentage in skilled manual. Gugus Sidoarjo had the highest percentage in clerical and
professional. Mothers of the children in experiment schools were more non-earning than in
control schools, where more mothers work in the clerical/professional category. More than half
of the mothers of Gugus Sidoarjo were non-earning, in contrast with Gugus Krian, where more
mothers worked in the category of unskilled manual class. In Gugus Krembung and Gugus
Sidoarjo a larger part worked in the clerical/professional category than in Gugus Krian.
Differences between Grade 3 and 4 were only not significant for Reaction to a good
report. The importance of the mother in all three other categories (Homework control; Study
help and Schoolwork control) was bigger than the father. Especially in Study help brothers or
sisters were important. In Grade 3 the mothers of children in experiment schools were more
important with study help than those in the control schools. Brothers or sisters in the control
schools were much more important than in the experiment schools, concerning the study help.
More children of the experiment schools do without study help. Fewer children of experiment
schools in Grade 4 did without any control of their homework. Concerning the study help in
Grade 4 this was the other way around. The mothers of children in control schools were more
important for the control of the schoolwork than those in experiment schools. More children of
the experiment schools did without control of the schoolwork than in those control schools.
Children of the schools got praised a lot as a reaction to a good report, but even got more
praised, together with getting presents. Most of the parents did give one of these reactions.
4.3 Intelligence scores
The average scores on the intelligence tests in Grade 3 were almost the same, despite
the differences within the different gugus. Between the gugus differences were significant.

22
Gugus Sidoarjo scored the highest, after Gugus Krembung and Gugus Krian. In Grade 4 the
average scores on the intelligence test between experiment and control schools were significant
different: experiment schools score higher. The same trend as with Grade 3 was shown for
differences between the gugus. Differences between the gugus were significant. The
intelligence test was separated into an inclusion part and an exclusion part.
Figure 4.5: Average score on Intelligence Test, Grade 3
Figure 4.6: Average score on Intelligence Test, Grade 4
4.4 The learning achievement
The scores in the Cawu-tests were first rounded into whole numbers. After rounding, the
numbers were used for calculation. In the preceding year there were some results of Cawu 3.
Every time Cawu 3 was mentioned, it’s meant Cawu 3 of the preceding year. The scores on
Social Studies (IPS) in Cawu 1 and 2 are shown in Tables 4.3 and 4.4. For Grade 4 also the
scores on IPS in Cawu 3 were placed. These scores were not available for Grade 3, because the
subject IPS starts in Grade 3. The higher score on IPS (Cawu 2) by experiment schools was
significant. The same thing applied to the scores on Bahasa Indonesia, where in Cawu 3 control
schools score higher and in Cawu 1 experiment schools score higher. In Grade 4 differences in
scores on IPS (Cawu 1 and 2, experiment schools scored higher) were significant.

23
Table 4.1 Scores on IPS in Cawu 1 & 2, Grade 3
Cawu 1 Cawu 2* Experiment
Schools Control Schools
Experiment Schools
Controls Schools
Sidoarjo 6.76 6.61 6.60 6.41 Krian 6.69 7.26 6.50 6.23 Krembung 6.57 6.79 6.69 6.47
Average 6.69 6.76 6.58 6.42 * Differences between experiment and control schools are significant on a .05-level Table 4.2 Scores on IPS in Cawu 3, Cawu 1 & 2, Grade 4
Cawu 3 Cawu 1* Cawu 2* Experiment
Schools Control Schools
Experiment Schools
Control Schools
Experiment Schools
Control Schools
Sidoarjo 6.67 6.09 6.47 6.45 6.60 6.38 Krian 6.80 6.09 6.37 6.30 6.60 6.32 Krembung 6.91 7.13 6.83 6.32 6.89 6.49
Average 6.79 6.62 6.53 6.36 6.68 6.44 * Differences between experiment and control schools are significant on a .05-level
Content Related Test. The average scores on the Content Related Test (CRT) are
shown in Figures 4.7 and 4.8. From these figures, one can easily find out the experiment
schools score higher than the control schools, both on Grade 3 and Grade 4. The differences in
Grade 4 were higher than in Grade 3. These were scores on the three content related tests,
together with their standard deviations. The differences between the experiment and control
schools were significant, but the differences between the gugus were not significant.
* Differences between experiment and control schools are significant on a .05-level Figure 4.7: Content Related Test, Grade 3
* Differences between experiment and control schools are significant on a .05-level Figure 4.8: Content Related Test, Grade 4

24
4.5 The non-cognitive scores
For reading the data of the Smiley Test, it’s important to know this test scores minimum
at zero (0.00, this was shown by a negative “smiley”) and maximum at four (4.00, this was
shown by a positive “smiley”) for the subjects of pupil academic attitudes, self-concept & IPS
and democratic attitude. For the subject of locus of control this test scored minimum zero (0.00)
for external and maximum one (1.00) for internal. Differences between Grade 3 and 4 were not
significant for the subject of democratic attitude, the other subjects showed an increase from
Grade 3 to 4 in the average scores.
On locus of control, differences were not significant for Grade 3 and 4. On the other
subjects children of the experiment schools scored higher than the children on control schools.
These differences were all significant, except for Grade 4. Per subject, this meant that children of
the experiment schools had a more positive general attitude (grade 3), have a better impression
about themselves and IPS (Grade 3 & 4) and showed better democratic attitudes (Grade 3 & 4).
Differences between gugus were all significant. The children of Gugus Krembung scored
lowest on general attitude, on self-concept & IPS and on democratic attitude. Gugus Sidoarjo
scored highest on general attitude and on self-concept & IPS, but lowest on locus of control.
Gugus Krian scored highest on democratic attitude and on locus of control.
4.6 The children opinion on content and process
Answers on the opinion questionnaire for children were shown in percentages and
differences were shown between gugus. The topic preference of the children in Grade 3 went to
“Village map” (45%), but this topic was also the less preference (40%). The not very popular
seemed to be topic Home environment. School environment scored also quite good. In Grade 4
the most popular topic was Knowledge about the Indonesian map (50%). Provinces of Indonesia
scores 35% on preference. Children prefered the topic of Majapahit kingdom at least (67% on
least preference).
On the choices of activities, children in Grade 3 were given for homework preference, 48%
chose making a map of the house. Also some children enjoyed writing prose (25%). In Grade 4
children prefered making a scale sized map to writing prose.
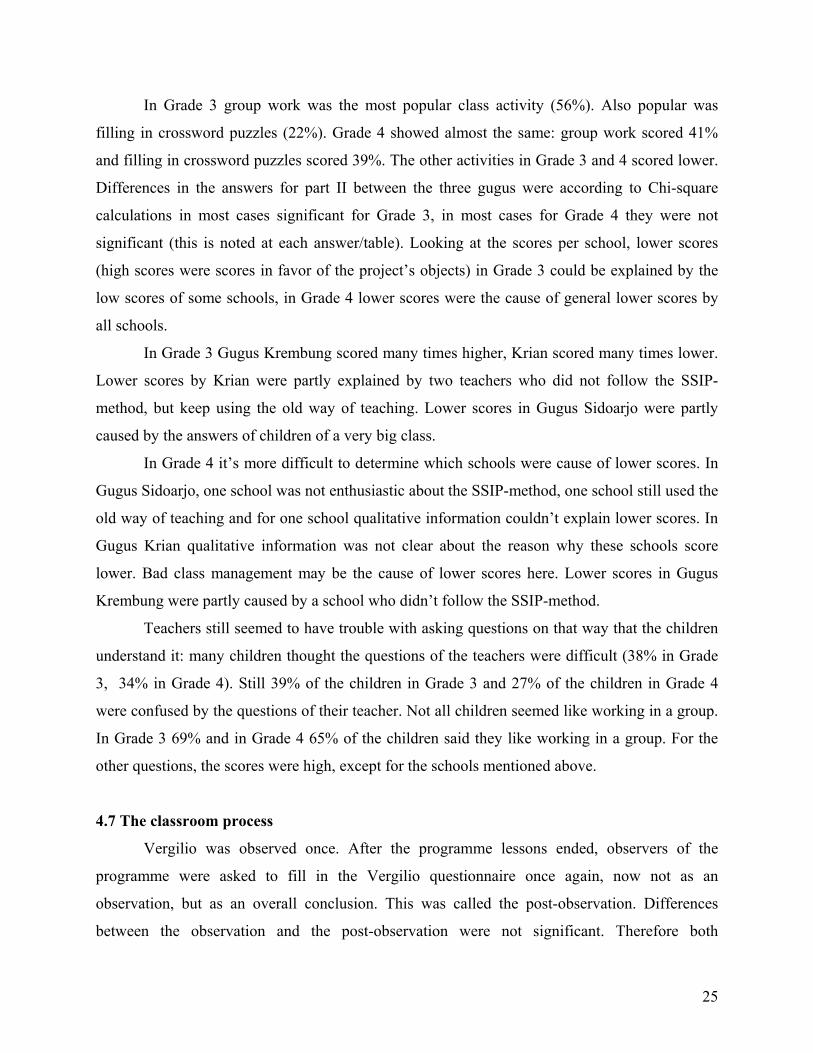
25
In Grade 3 group work was the most popular class activity (56%). Also popular was
filling in crossword puzzles (22%). Grade 4 showed almost the same: group work scored 41%
and filling in crossword puzzles scored 39%. The other activities in Grade 3 and 4 scored lower.
Differences in the answers for part II between the three gugus were according to Chi-square
calculations in most cases significant for Grade 3, in most cases for Grade 4 they were not
significant (this is noted at each answer/table). Looking at the scores per school, lower scores
(high scores were scores in favor of the project’s objects) in Grade 3 could be explained by the
low scores of some schools, in Grade 4 lower scores were the cause of general lower scores by
all schools.
In Grade 3 Gugus Krembung scored many times higher, Krian scored many times lower.
Lower scores by Krian were partly explained by two teachers who did not follow the SSIP-
method, but keep using the old way of teaching. Lower scores in Gugus Sidoarjo were partly
caused by the answers of children of a very big class.
In Grade 4 it’s more difficult to determine which schools were cause of lower scores. In
Gugus Sidoarjo, one school was not enthusiastic about the SSIP-method, one school still used the
old way of teaching and for one school qualitative information couldn’t explain lower scores. In
Gugus Krian qualitative information was not clear about the reason why these schools score
lower. Bad class management may be the cause of lower scores here. Lower scores in Gugus
Krembung were partly caused by a school who didn’t follow the SSIP-method.
Teachers still seemed to have trouble with asking questions on that way that the children
understand it: many children thought the questions of the teachers were difficult (38% in Grade
3, 34% in Grade 4). Still 39% of the children in Grade 3 and 27% of the children in Grade 4
were confused by the questions of their teacher. Not all children seemed like working in a group.
In Grade 3 69% and in Grade 4 65% of the children said they like working in a group. For the
other questions, the scores were high, except for the schools mentioned above.
4.7 The classroom process
Vergilio was observed once. After the programme lessons ended, observers of the
programme were asked to fill in the Vergilio questionnaire once again, now not as an
observation, but as an overall conclusion. This was called the post-observation. Differences
between the observation and the post-observation were not significant. Therefore both

26
questionnaires can be used for processing data. In total 82 observations were made in experiment
schools, 32 observations were made in control schools. There was no post-observation in the
control schools, because the student-assistants visited these schools only once, so one can’t speak
of an overall conclusion. Vergilio has three-points scale, scoring one (1.00) for never appeared,
two (2.00) for sometimes appeared and three (3.00) for many times appeared. Missing values
were replaced by the mean. Vergilio was parted into three factors: instruction, management, and
climate. Differences between experiment and control schools were not significant for instruction,
but were significant for management and climate. On management, experiment schools score on
average 2.26, control schools score on average 2.00. On climate, experiment schools scored on
average 2.39 and control schools scored on average 2.20.
Giving feedback seemed to be very useful for the teachers. If teachers did not show skills
the learning packages were implying (for instance: when a teacher was asking questions, but did
not do it on a personal but on a general way) feedback could be given to these teachers. This way
many teachers showed progress in their teaching capabilities. The qualitative report showed that
many teachers were able to make supportive materials by themselves and could bring more
variation in their way of teaching. Many problems showed up with asking questions to the
children. It was difficult for many teachers to ask questions not in general and it was even more
difficult to ask not only knowledge questions, but also open questions, which stimulate a higher
level of thinking. The quantitative report showed that almost all teachers of Gugus Krembung
showed improvement in the five project criteria. In Gugus Sidoarjo not as many teachers as
Gugus Krembung showed improvement. Gugus Krian had only a few teachers who showed
progress in their way of teaching, concerning the project criteria.
4.8 The Primary School Atmosphere (PSA)
Table 3.1 shows 34 schools, divided into 19 experiment and 15 control schools. PSA was
completed by 230 teachers: 124 of experiment schools, and 106 of control schools. Differences
on information of the teachers between experiment and control schools were not significant.
Average age of the teachers was 44 years old. In experiment schools 28% of the teachers was
male, in control schools this is 34%. The average order of promotion rank between experiment
and control schools was almost the same. The experiment school teachers had in average a little
bit less experience in teaching than those in the control schools (12.39 years vs. 12.77 years).

27
In PSA, missing values were replaced by the mean. The scale consists of six components:
formalization, social trust, innovativeness, achievement orientation, pupil supportiveness, and
work pressure. Formalization means if the teacher is working on a formal way, obeys the rules
and acts according to formalizations of government and school management. A high score means
the teacher acts in a formal way. A high score on Social Trust means a teacher trusts the people
in his work environment. Innovativeness tells if the teacher is allowed by his surroundings to be
innovative. A high score means the teacher is free to innovate. When a teacher is motivated and
tried to get the best out of his pupils, he would get a high score on Achievement Orientation.
When the children helped their teacher a lot, there would be a high score on Pupil
Supportiveness. A high score on Work Pressure showed that the teacher experiences the job as a
burden and feels stressful because of his job. Minimum score on all factors is one (1.00),
maximum score on all factors is four (4.00). All differences between experiment and control
schools on the six factors were significant, except for the factor Work Pressure.
Teachers of the experiment schools scored higher on Formalization, Social Trust,
Innovativeness and Pupil Supportiveness. These differences all were significant. Differences
between gugus on these factors also were significant. Gugus Krian scores highest on all these
factors, in the experiment schools Gugus Krembung scored on all these factors lowest, in the
control schools Gugus Sidoarjo always scores lowest. Teachers did not feel very stressful in their
job.
Table 4.3 Scores on PSA components Formalization Social
Trust Innovativeness Achievement
Orientation Pupil Supportiveness
Work Pressure
Experiment Schools
1.89 2.09 2.27 2.45 1.81 1.63
Control Schools
1.74 1.91 2.15 2.45 1.63 1.57
Total
1.82 * 2.01 * 2.21 * 2.45 * 1.73 * 1.60
* Differences between experiment and control schools are significant on a .05-level 4.9 The opinion of teachers and principals
The opinion questionnaire for teachers and principals contains three parts: closed
questions for the teachers and principals of experiment schools, closed questions for all teachers

28
and principals and open questions for all teachers. The first part was filled in by 54 teachers and
principals, the second part by 81. Most of the teachers also filled in the third part.
Teachers and principals were especially satisfied by the contents of the learning
packages. The packages were of good quality, they, but also the children enjoyed working with
the learning packages, they were motivated to work with the learning packages. Although the
positive reactions of the teachers and principals, 39 still said the children learned better in the old
way of teaching. Most of the teachers and principals would like to use the learning packages on
more subjects than only IPS. The teachers and principals were also enthusiastic about the
contacts they have with the SSIP-team: the training they received learned them how to work with
the learning packages, SSIP-team motivated most of the teachers, there was enough contact with
the SSIP-team, enough results were shown to the teachers and principals and these results were
understandable.
Most teachers and principals were eager to continue, if there would be a new project.
Three teachers or principals answer “Little not agree” if they would like to continue. These
teachers mentioned this to the SSIP-team and for a possible next project some would like
continue as control school. The control schools were very positive about the project: they would
like to join if the programme continuation still existed. All control schools received on their own
request the learning packages after the implementation phase of the project was finished.
The qualitative questions gave more insight into what the teachers and principals
knowledge on learning packages were obsolence. Many teachers noticed they did not have the
time for making audiovisual aids themselves. The audiovisual aids were not complete in order to
stimulate the creativity of the teachers. Mostly, the teachers themselves solved these problems.
Many teachers and principals like most the programme because it was a motivation for
the pupils and they would learn better by that. The systematic way of teaching was also popular.
Many teachers and principals thought the learning packages should be given in more subjects
and on more schools. Many teachers and principals were also looking for assistance, either in
making the audiovisual aids or in continue working with the learning packages even after the
programme finished.
On the final question if the schools would like to join a possible new further programme,
and especially why, most teachers and principals let know that they wanted to continue. The
main reasons were that the teachers felt being supported in their teaching. Working with the

29
learning packages enriched them and their pupil’s experience. Main reason for not joining in a
continuation was the time-consuming, which it took to heavy work with the learning packages.

30
5. Findings and Discussion 5.1 Findings
This study was carried out in order to explain whether after controlling for the pupil,
class, and school factors did the programme improve the quality of schools? In detail, the
answers to the following research questions would provide the explanation.
Research Question 1: what were the meaningful variables at pupil, class, and school levels that
differentiate the children progress in learning the social studies?
Table 5.1 Summary of Fixed Variables at Grade 3 and 4 Grade 3 Grade 4
Fixed Variables Module 1
Module 2
Module 3
Total Module 1
Module 2
Module 3
Total
Prior score Intelligence Gender Age Father education Mother education Foccupation1 Foccupation2 Moccupation1 Moccupation2 Moccupation3 Academic attitudes Self-concept Democratic attitudes Locus of control Class instruction Class management Class climate Formalisation Affiliation Innovation Achievement orientation Pupil support Work pressure Experiment
+ -
+
+ + -
+
+
+ -
+ -
+
+
+
+ -
+ - + +
+
+
+ -
+ - + +
+
+
+ +
+
+ - +
+ +
+ + - +
+ +
+
+
+ + - +
+ +
+ -
+
+ + - +
+ +
+
+ +
Note: All signs (+ or - direction) are significant with p<0.05. Dummy variables:
Gender (0=female pupil, 1=male pupil) Foccupation = Father occupation (0=clerical & professional, 1=unskilled manual, 2= skilled manual) Moccupation = Mother occupation (0=clerical & professional, 1=unskilled manual, 2= skilled manual, 3=non-earning) Experiment (0=control schools, 1=experimental schools) * Detail, see Appendices

31
In order to find factors affected the children learning improvement, Table 5.1 presents a
summary of the findings (detail, see Appendices) as follows:
• The ability (intelligence) of individual child was consistently appear to be a good
baseline for estimating the progress made by a child, class, and school.
• Some predictors at the pupil level were not consistently significant but gave the clues and
direction to be considered. They were pupil gender (better for girls), father occupation
(negative for manual works), mother occupation (positive for better jobs), father’s
education (positive), reward for better achievement (negative), attitude (positive), self-
concept (negative), democratic attitude (positive), locus of control (positive).
• Information about the classroom process from the teacher point of view was slight
different. Most of the teacher experienced lack of time, teaching aids and finance. But
they could solve the problems by sharing and discussion with their colleagues, principal,
or SSIP team. Some of them create their own teaching aids. Teachers like the programme
because could motivate the children to learn and easily to understand. As clearly stated in
their opinion that SSIP helped them to make teaching more systematic.
• For the process inside the classroom, based on the observation schedule, the instructional
activities tended to be perceived negatively, the managerial aspects could be positive and
negative as well, and the class climate was positive. It might be that the instructional
aspects covered by the Virgilio scales were not so well connected with what have been
implemented in educational practice. And also we were not able to establish consistent
behaviour through the implementation.
• It was implicitly expressed that the relationship between headteacher and the class-
teachers were good. But statement related to school process did not appear and looked no
contribution to the classroom improvement. The school process were explained in more
detailed related to the school atmosphere.
• In terms of the school atmosphere, none of the six developed dimensions showed
consistent results across the modules and grades. Although they were not significant but
at least the dimensions indicated certain direction in explaining the attainments as
response variables. The dimensions were formalisation (negative and positive), social
cohesiveness (positive), innovativeness (positive and negative), achievement orientation

32
(positive), pupil support (negative), work stress (positive and negative). These were not
easy to explain well except to be followed by separate study.
Research Question 2: Did the experimental schools (those that implement the programme)
achieve success and how big the variation accounted for the school or class?
Table 5.2 Raw effects on Social Studies Outcomes
Variance Component (%) Taught Unit Variance Pupil Class/School
N
Grade 3: Home environment School environment Village map
• Total Grade 4:
. Indonesian map
. Majapahit Kingdom
. Provinces in Indonesia • Total
6.746 6.976 77.26 130.9
9.981 6.397 90.29
189.34
76.5 83.7 70.6 72.9
60.1 72.7 53.8 56.9
23.5 16.3 29.4 27.1
39.9 27.3 46.2 43.1
781 781 781 781
766 766 766 766
* Detail, see Appendices
Table 5.3 Fractions of variance components explained by background and composition Variance Component (% for class/school) Taught Unit
Pupil Class School Contribution Grade 3:
1. Home environment 2. School environment 3. Village map • Total
17.7 14.4 26.2 23.0
15.9 13.6 21.2 19.7
14.9 13.3 19.8 17.7
25.9 21.1 36.8 16.3
Pupil Pupil& Prior score
Class School Contribution
Grade 4: 1. Indonesian map 2. Majapahit Kingdom 3. Provinces in Indonesia • Total
41.8 25.8 48.6 45.2
42.2 26.8 51.5 47.8
39.2 27.4 49.8 46.2
25.5 20.3 25.9 24.5
32.7 27.8 50.3 48.2
* Detail, see Appendices

33
• It was found, in Table 5.2, that the SSIP has made a difference comparing to the non-
participating schools. The most striking findings were that the attainments of children at
experimental schools were higher than those at the control schools.
• Relating to variances at the pupil level, before entering the explanatory variables,
illustrated in Table 5.3, the range between 70.6 % to 83.7% for Grade 3 and 53.8% to
72.7% for Grade 4 attainments. In other words it could be said that for class/school level
the variances ranged between 16.3 to 29.4 % for Grade 3 and 27.3 to 46.2% for Grade 4.
• Taught units in Grade 3, see Table 5.3, the variation at class level ranged between 13.6-
21.2% for Grade 3 and at the school level was between 13.3 to 19.8%. The overall
contribution of taught units were between 16.3 to 36.8%.
• Taught units in Grade 4, see Table 5.3, the variation at class level ranged between 27.4 to
49.8% and at the school level bet ween 20.3 to 25.9%. The prior knowledge could
explain between 26.8 to 51.5% whereas the contribution of taught components ranged
between 27.8 to 50.3%
5.2 Discussion
Results of the present study provides contribution to the dicussion about the equity of
children learning progress. Related to the attainment at the time, gender differences appeared
consistently across Grade 3 to be significant. The findings were in line with many studies in
primary level that girls performed better than boys. Parker (1997: 504) study on engendering
school children in Bali (another part of Indonesia) may illustrate the acceptable reason for the
findings. She explains that at school the typical behaviours are as follows: “… in classrooms,
girls are quiet and well-behaved at the front and boys are noisier and more active at the back …”
And the behaviours outside the schools:
… girls are always at home and boys are out ‘getting experience’, is not only in Bali but also in most part of Indonesia. School-age girls are nearly always at home in out-of-school time, it is expected that they will help with homework. However, boys roam the village, fishing, hunting, playing games, having adventures in all-boy bands (Parker, 1997: 509).
As a result of the habits, besides the teacher has a good impression about the girls that
may affect into good grades, girls have more time for studying at home than boys that influence
their cognitive achievement. Ardhana (1980) even ended up to the same conclusion with

34
different strategies. He found that although boys have higher scores than girls in formal thinking,
girls attained better due to their obedience, attitudes, honesty, and diligence in doing the school
works at home and school.
Culturally, Indonesian parents play important roles for their children educational
outcomes. Having high scores in academic achievement is an important business for most urban
parents and schools. Parents are struggling hard to raise the attainment level of the child by
hiring other people to teach child outside the school hours. School also were striving to raise the
pupil achievement in order to have better name and prestige that may affect enrolment of new
intake and school income in the subsequent years. Therefore children of better educational and
occupation parents outperformed those of other categories of parents.
Age does not appear to be problematic equity even many studies in the past found serious
problems Actually this Indonesin case is much related to the pupil promotion policies determined
by the government. The retention at primary schools does not make a child improve even worsen
the attainment and progress. For small children, retention could affect their attitudes, motivation,
increasing the boredom, and also be blamed by the family that could affect them to feel being
rejected.
Results of the Virgilio-instrument showed that teachers in experiment schools had a
better class management and a better class climate. There were no significant differences
between experiment and control schools concerning the Instruction by the teachers. This was
remarkable, because a better instruction by the teachers was a direct object of the SSIP.
Concerning the programme criteria the end situation was above average and the teachers of the
experiment schools had shown improvement. Experiment schools performed better than control
schools on factors at school level. Experiment schools also have a higher Formalization, Social
Trust, Innovativeness and Pupil Supportiveness. The analysis showed that the factors Social
Trust, Innovativeness and Achievement Orientation had positive influence on the results of the
pupils. The multilevel analysis showed that factors at class and school level had a small positive
influence on the results of the pupils.
Related to findings in class/school level, it would be of use to see the “public good test”
developed internationally for policy in education, based on work of Swanson and King (1997).
This test comprises six basic values viz. access, equity, choice, growth, efficiency, and harmony.
The access determines that the policy should ensure that all students have the opportunity to gain

35
an education that is world-class. The equity needs the policy should provide assurance that
students with similar needs will be treated in the same manner in the course of their education.
With choice, it means that policy should reflect the rights of parents and students to chools a
school that meets their needs and aspirations. For growth, the strategies should be in place to
ensure that resources are adequate to the task. Efficiency means that scarce resources should be
allocated wisely to optimize outcomes. For harmony, the policy should be developed to ensure
there is no fragmentation of commitment and effort in support of education.
All the six values could guarantee the classroom and school atmosphere as found in this study.
From empty model, the proportion of class/school variance was between 16.3 and 46.2%.
The findings are in line with those found of the effect size of the subject. For primary schools in
developed schools the total variances attributable to schools between 10.7 to 21.5 (Sammons,
Smess, Thomas, Robertson, McCall & Mortimore, 1997). Researchers using multilevel analysis
in developing countries have found that the school variances tend to be considerably higher
although many of the studies suffered from limitations in designing. For this Indonesian study
the remarkable variance results are likely to reflect conditions in developing countries.
After controlling for measures of the personal and family background of pupils and prior
attainment, the proportions attributed to school and class factors were between 16.3 to 50.3%.
Again the proportions appear to be different from those in developed countries i.e 12-18%
(Creemers, 1994b; Scheerens & Bosker, 1997). It should be noted in interpreting this study’s
findings that the percentages have a role in setting the boundaries for the potential impact of
factors in different levels only (Creemers & Reezigt, 1996). To discover more about the
explanatory factors in each level, further analyses are needed.
Gugus Krembung as a rural cluster appear to be the best in many figures. The children
come from lower socio-economic family with low parental education but could make a high
progress. This is the preeminence of the programme. The evidence proves that a thorough
developed school-based programme could make the rural schools better. Perhaps the statement
from Beeby (1979), Parker (1997), Surakhmad (1999) that heavy centralized education policies
could not guarantee a substantial quality improvement. The present study has already started
with a small scale programme. However, the study at least has successfully developed and then
tested by a set of performance indicators that would be useful to subsequent educational policy
and action development.

36
6. Conclusions and Recommendations
6.1 Conclusions
Summing up the findings, the drawn conclusions from the analyses as presented in the
previous pages, were:
• The SSIP has made a difference comparing to the non-project schools. The most striking
findings were that the attainments of children at experimental schools were higher than
those at the control schools. The same phenomena appeared also in the classroom and
school processes.
• The ability (intelligence) of individual child was consistently appear to be a good
baseline for estimating the progress made by a child, class, and school.
• Some predictors at the pupil level were not consistently significant but gave the clues and
direction to be considered. They were pupil gender (better for girls), father occupation
(negative for manual works), mother occupation (positive for better jobs), father’s
education (positive), reward for better achievement (negative), attitude (positive), self-
concept (negative), democratic attitude (positive), locus of control (positive).
• Information about the classroom process from the teacher point of view was slight
different. Most of the teacher experienced lack of time, teaching aids and finance. But
they could solve the problems by sharing and discussion with their colleagues, principal,
or SSIP team. Some of them create their own teaching aids. Teachers like the programme
because could motivate the children to learn and easily to understand. As clearly stated in
their opinion that SSIP helped them to make teaching more systematic.
• For the process inside the classroom, based on the observation schedule, the instructional
activities tended to be perceived negatively, the managerial aspects could be positive and
negative as well, and the class climate was positive. It might be that the instructional
aspects covered by the Virgilio scales were not so well connected with what have been
implemented in educational practice. And also we were not able to establish consistent
behaviour through the implementation.
• It was implicitly expressed that the the relatioship between headteacher and the class-
teachers were good. But statement related to school process did not appear and looked no

37
contribution to the classroom improvement. The school process were explained in more
detailed related to the school atmosphere.
• In terms of the school atmosphere, none of the six developed dimensions showed
consistent results across the modules and grades. Although they were not significant but
at least the dimensions indicated certain direction in explaining the attainments as
response variables. The dimensions were formalisation (negative and positive), social
cohesiveness (positive), innovativeness (positive and negative), achievement orientation
(positive), pupil support (negative), work stress (positive and negative). These were not
easy to explain well except to be followed by separate study.
• Relating to explained variances at the pupil level, the range of accounted variance
between 9.6 % to 29.7% for Grade 3 and 17.7% to 40.3% for Grade 4 attainments.
• For class level the estimation for contribution ranged between 5-7.2% for Grade 3 and 9.6
to 29.4% for Grade 4.
• On the other upper hierarchy, school level, 9.4 to 14.1% for Grade 3 and 14.3 to 34.2%
for Grade 4 were accounted for school level. The findings seemed to make sense even the
evidence from the class conditions were lower than pupil and school levels because of the
number of variables included in that level. Even though, this could not be guaranteed in a
simple way because of separating analysis among the levels without controlling each
other. This caveat may lead to other sophisticated analysis in the future. However, the
results had given some hints about the school improvement and the tendency to be
considered.
6.2 Recommendations
SSIP was a pilot programme that xperiences in the programme and the Evaluation result
lead to the prime recommendation for continuation and future research.
• There was implementation on only one subject, the social studies. On all other subjects
the experiment school teachers continued in using the “old way of teaching”. The pupils
continued in their “old habits”. A programme like the SSIP should implement on more
than one subject. Teachers would show better teaching strategies. There would be more
structure in the lessons of the teachers. Pupils would understand better and show better
results in their work.

38
• Teachers motivation and ability were varied. This made the process of developing the
learning package has to undergo some obstacles, such as lack of teachers’ creativity in
developing the module of the learning package. When making module, teachers only
reproduce from the example of the module given by SSIP team. Therefore the teaching
methods in the packages seemed similar. Enhancing teacher creativity is important for
such kind of programme.
• The intervention in this SSIP was manageable well and more fruitful in the subdistrict
like Krembung with rural and agricultural background. Schools there were hungry of
innovation and eager to participate. Whereas for the areas of urban, semi-urban and
industrial background some thorough considerations and carefully adjustment to their
conditions might make them more workable. All the three phases, especially
development and implementation were important to introduce, direct, and motivate all the
key actors in fulfilling the expected process of educational improvement.
• For schools, controlling for baseline effects was not common yet in some developing
countries (Riddell, 1997) including Indonesia. The prior ability and conditions were not
perceived appropriately. This happened locally during the process of the programme. The
tendency to compete at least among groups has led the schools to feeling rather inferior
especially in terms of socio-economic-status although it was not the point because such
conditions would be taken into account before making the further assessment. The next
consequence, of course, was the misinterpreted the results if not followed by some
additional explanation. This study demonstrated such kind of baseline to be of use for
future studies.

39
References Aitkin, M., & Longford, N. (1986). Statistical modelling issues in school effectiveness studies.
The journal of the royal statistical society series A (general), 149(Part 1), 1-43. Beeby, C.E., 1979; Assessment of Indonesian Education: A Guide in Planning. Wellington:
NZCER in association with Oxford University Press. Creemers, B.P.M. (1994a). The Effective Classroom. London: Cassell Creemers, B.P.M. (1994b). Effective instruction: an empirical basis for a theory of educational
effectiveness. In: Reynolds, D., B.P.M. Creemers, P.S. Nesselrodt, E.C. Shaffer, S. Stringfield & C. Teddlie (eds.); Advances in school effectiveness research and practice. Oxford: Pergamon.
Creemers, B.P.M. (1997). Effective Schools and Effective Teachers: An International Perspective. Coventry: Centre for Research in Elementary and Primary Education University of Warwick, UK.
Creemers, B.P.M. (2000). Report of a one-day discussion by Indonesian and Dutch experts: Basic Education in Indonesia. Reflexie, 3(2), 13-19.
Creemers, B.P.M. & Reezigt, G.J. (1996). School level conditions affecting the effectiveness of instruction. In: School Effectiveness and School Improvement, 7 (3), 197-228.
Goldstein, H. (1995). Multilevel statistical model. London: Edward Arnold. Gray, J., Reynolds, D., Fitz-Gibbon, C., & Jesson, D. (Eds.) (1996). Merging traditions: the
future of research on school effectiveness and school improvement. London: Cassell. Gray, J., & Wilcox, B. (1995). Good School, Bad School: evaluating performance and schools
encouraging improvement. Buckingham: Open University Press. Hopkins, D. (1990). The International School Improvement Project (ISIP) and effective
schooling: Towards a synthesis. School Organisation 8 (3), 129-94. Kaluge, L. (1999). Some Factors Related to Educational Attainment in Indonesian Primary
Schools. Unpublished Ph.D dissertation, Institute of Education, University of London. Ministry of Education and Culture (1998). Primary Education Quality Improvement Project
(PEQIP). Jakarta: Ministry of Education and Culture. Mortimore, P., Sammons, P., Stoll, L., Lewis, D., & Ecob, R. (1988) School matters: the junior
years. Wells: Open Books. Parker, L. (1997). Engendering school children in Bali. Journal of the Royal Anthropological
Institute, 3(3), 497-516. Paterson, L. (1991). An introduction to multilevel modelling. In Raudenbush, S.W. & Willms,
J.D. (Eds.) Schools, classrooms, and pupils: international studies of schooling from a multilevel perspective. London: Academic Press.
Rentoul, A.J. & Fraser, B.J. (1983). Development of a School-level Environment Questionnaire. The Journal of Educational Administration, XXI (1), 21-39.
Riddell, A.R. (1997). Assessing designs for school effectiveness research and school improvement in developing countries. Comparative education review, 41(2), 178-204.
Rosenshine, B. (1987). Direct Instruction. In: M.J. Dunkin (ed.), International Encyclopedia of Teaching and Teacher Education, pp. 143-149. Oxford: Pergamon Press.
Sammons, P., Smess, R., Thomas, S., Robertson, P., McCall, J., & Mortimore, P. (1997). The impact of background factors on pupil attainment, progress and attitudes in Scottish schools. Paper presented at the British Educational Research Association Annual Conference, University of York, 11-14 September.

40
Scheerens, J. (1992). Effective schooling; research, theory and practice. London: Cassell. Scheerens, J. & Bosker, R.J. (1997). The foundations of educational effectiveness. London:
Elsevier Science Ltd. Setijadi, Moegiadi, Wiradinata, R. & Elley, W.B. (1978). Grade VI survey of student
achievement. Jakarta: Badan Penelitian dan Pengembangan Pendidikan dan Kebudayaan, Departemen Pendidikan dan Kebudayaan.
Slavin, R.E. (1996). Education for All. Lisse: Swets and Zeitlinger. Snijders, T.A.B., & Bosker, R.J. (1999). Multilevel analysis: An introduction to basic and
advanced multilevel modeling. London: Sage. Stoll, L. & Fink, D. (1996). Changing our schools: linking school effectiveness and school
improvement. Buckingham: Open University Press. Supriyoko, K. (2002). Menyarjanakan Guru Sekolah Dasar (Mastering the primary school
teachers). Kompas, 10 Oktober 2002. Suparno, P. (2002). Guru dan Reformasi Pendidikan (Teachers and the educational reformation) ,
Kompas, 22 Agustus 2002. Surakhmad, W. (1999). Education in Indonesia: Will it Survive the Test. Paper for a one-day
discussion in Jakarta, 24 April Suryadi, A. (1993). Improving the Educational Quality of Primary Schools: Assessment of
School Quality and Students Achievement in Indonesian Primary Schools. Educational Resource Information Center (ERIC) ED 356545.
Teddlie, C., Virgilio, I., & Oescher, J. (1990). Development and validation of the Virgilio Teacher Behavior Instrument. Educational and Psychological Measurement, 50, 421-30.
Teddlie, C. & Reynolds, D. (2000). The International Handbook of School Effectiveness Research. London & New York: Falmer Press.
Thomas, R.M. (1992). Indonesia. In Thomas, R.M. (ed.); Education’s Role in National Development Plans: Ten Country Cases. New York: Praeger.
Tangyong, A.F., Wahyudi, Gardner, R. & Hawes, H. (1989). Quality through Support for Teachers: A Case Study from Indonesia. Jakarta: Published jointly by Office of Educational and Cultural Research and Development, Ministry of Education and Culture, Indonesia and Department of International and Comparative Education, University of London.
Unicef (2000). Challenges for a New Generation: The Situation of Children and Women in Indonesia. Government of Indonesia & Unicef.
World Bank (1998). Education in Indonesia: from crisis to recovery. Washington, D.C: Education Sector Unit, East Asia and Pacific Regional Office.
Woodhouse, G., Rasbash, J., Goldstein, H., & Yang, M. (1996). "Introduction to multilevel modelling." In Woodhouse, G. (Ed.) Multilevel modelling applications. London: Multilevel Models Project, Institute of Education, University of London.

41
APPENDICES

42
Grade 3: Model 0: the empty model, as a start without any explanatory variable Model 1: with pupil background variables only Model 2: with class variables Model 3: with school variables Table 1. Grade 3 Content-Related 1
Modelling Model 0 Model 1 Model 2 Model 3 Fixed part: Intercept Intelligence Gender Age Father education Mother education Foccupation1 Foccupation2 Moccupation1 Moccupation2 Moccupation3 Academic attitudes Self-concept Democratic attitudes Locus of control Class instruction Class management Class climate Formalisation Affiliation Innovation Achievement orientation Pupil support Work pressure Experiment
5.99 (0.23)
0.43 (1.16) 0.11 (0.012)* -0.39 (0.15)* 0.013 (0.009) 0.16 (0.05)* -0.086 (0.053) -0.038 (0.23) 0.09 (0.18) 0.4 (0.23) 0.79 (0.36)* 0.68 (0.21)* 0.13 (0.2) -0.83 (0.22)* 0.58 (0.3) 1.67 (0.45)*
2.6 (0.58) 0.11 (0.01)* -0.37 (0.15)* 0.1 (0.03)* 0.37 (0.23) 0.69 (0.34) 0.64 (0.21)* -0.64 (0.18)* 1.5 (0.44)* 0.32 (0.21) 0.15 (0.22) -0.26 (0.23)
2.1 (0.61) 0.11 (0.01)* -0.37 (0.15)* 0.11 (0.035)* 0.39 (0.23) 0.7 (0.34)* 0.63 (0.21)* -0.61 (0.18)* 1.46 (0.44)* 0.81 (0.63) -0.59 (0.43) -0.03 (0.49) 0.063 (0.35) -0.21 (0.53) -0.033 (0.4) 0.78 (0.38) *
Random part: School/Class σ2 Pupil σ2 Total σ2
1.588 (0.45) 5.158 (0.26) 6.746
0.9057 (0.27) 4.222 (0.21) 5.1277
0.8078 (0.25) 4.258 (0.21) 5.0658
0.7451 (0.23) 4.253 (0.21) 4.9981
% school σ2 % σ2 accounted for
23.5 -
17.7 24.0
15.9 24.9
14.9 25.9
-2(log-likehood) 3854.19 3589.26 3592.89 3589.8 Note: * p<0.05, standard error in brackets. Pupil gender (0=female pupil, 1=male pupil) Father occupation (0=clerical & professional, 1=unskilled manual, 2= skilled manual) Mother occupation (0=clerical & professional, 1=unskilled manual, 2= skilled manual, 3=non-earning) Experiment (0=control schools, 1=experimental schools)
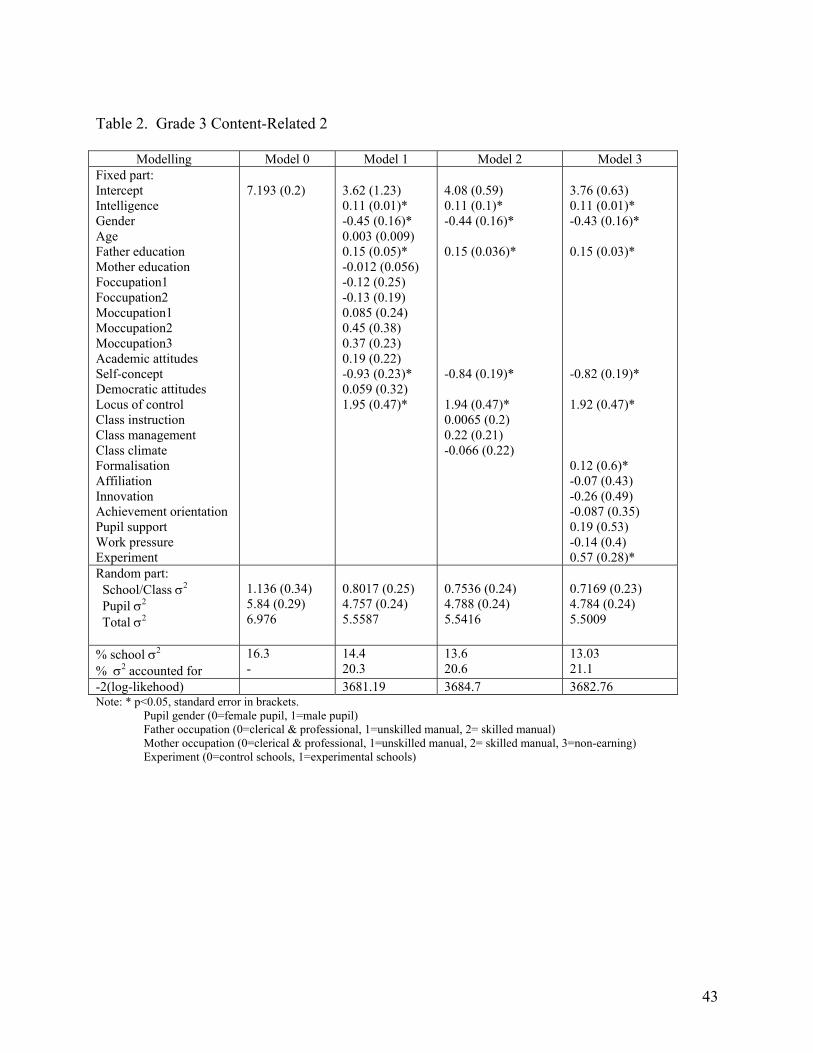
43
Table 2. Grade 3 Content-Related 2
Modelling Model 0 Model 1 Model 2 Model 3 Fixed part: Intercept Intelligence Gender Age Father education Mother education Foccupation1 Foccupation2 Moccupation1 Moccupation2 Moccupation3 Academic attitudes Self-concept Democratic attitudes Locus of control Class instruction Class management Class climate Formalisation Affiliation Innovation Achievement orientation Pupil support Work pressure Experiment
7.193 (0.2)
3.62 (1.23) 0.11 (0.01)* -0.45 (0.16)* 0.003 (0.009) 0.15 (0.05)* -0.012 (0.056) -0.12 (0.25) -0.13 (0.19) 0.085 (0.24) 0.45 (0.38) 0.37 (0.23) 0.19 (0.22) -0.93 (0.23)* 0.059 (0.32) 1.95 (0.47)*
4.08 (0.59) 0.11 (0.1)* -0.44 (0.16)* 0.15 (0.036)* -0.84 (0.19)* 1.94 (0.47)* 0.0065 (0.2) 0.22 (0.21) -0.066 (0.22)
3.76 (0.63) 0.11 (0.01)* -0.43 (0.16)* 0.15 (0.03)* -0.82 (0.19)* 1.92 (0.47)* 0.12 (0.6)* -0.07 (0.43) -0.26 (0.49) -0.087 (0.35) 0.19 (0.53) -0.14 (0.4) 0.57 (0.28)*
Random part: School/Class σ2 Pupil σ2 Total σ2
1.136 (0.34) 5.84 (0.29) 6.976
0.8017 (0.25) 4.757 (0.24) 5.5587
0.7536 (0.24) 4.788 (0.24) 5.5416
0.7169 (0.23) 4.784 (0.24) 5.5009
% school σ2 % σ2 accounted for
16.3 -
14.4 20.3
13.6 20.6
13.03 21.1
-2(log-likehood) 3681.19 3684.7 3682.76 Note: * p<0.05, standard error in brackets. Pupil gender (0=female pupil, 1=male pupil) Father occupation (0=clerical & professional, 1=unskilled manual, 2= skilled manual) Mother occupation (0=clerical & professional, 1=unskilled manual, 2= skilled manual, 3=non-earning) Experiment (0=control schools, 1=experimental schools)

44
Table 3. Grade 3 Content-Related 3
Modelling Model 0 Model 1 Model 2 Model 3 Fixed part: Intercept Intelligence Gender Age Father education Mother education Foccupation1 Foccupation2 Moccupation1 Moccupation2 Moccupation3 Academic attitudes Self-concept Democratic attitudes Locus of control Class instruction Class management Class climate Formalisation Affiliation Innovation Achievement orientation Pupil support Work pressure Experiment
22.29 (0.87)
3.81 (3.58) 0.43 (0.036)* -1.54 (0.45)* 0.0077 (0.029) 0.53 (0.15)* -0.046 (0.16) -0.33 (0.72) 0.24 (0.54) 0.26 (0.7) 1.37 (1.1) 0.68 (0.65) 0.79 (0.64) -3.49 (0.67)* 2.61 (0.92)* 7.83 (1.36)*
4.9 (2.1) 0.44 (0.035)* -1.55 (0.45)* 0.55 (0.1)* -3.11 (0.58)* 2.94 (0.91)* 7.72 (1.4)* -0.49 (0.72) 2.23 (0.76)* 0.13 (0.79)
3.85 (2.2) 0.44 (0.04)* -1.56 (0.45)* 0.55 (0.1)* -3.06 (0.58)* 2.98 (0.91)* 7.68 (1.36)* 2.13 (0.8)* 1.22 (2.3) -0.48 (1.5) 0.024 (1.74) -0.057 (1.2) -0.11 (1.93) -0.74 (1.43) 2.93 (1.36)*
Random part: School/Class σ2 Pupil σ2 Total σ2
22.7 (6.1) 54.56 (2.7) 77.26
13.83 (3.8) 38.97 (1.9) 52.8
10.52 (3.01) 39.2 (1.9) 49.72
9.691 (2.8) 39.17 (1.97) 48.861
% school σ2 % σ2 accounted for
29.4 -
26.2 31.7
21.2 35.6
19.8 36.8
-2(log-likehood) 5719.56 5437.23 5433.82 5431.03 Note: * p<0.05, standard error in brackets. Pupil gender (0=female pupil, 1=male pupil) Father occupation (0=clerical & professional, 1=unskilled manual, 2= skilled manual) Mother occupation (0=clerical & professional, 1=unskilled manual, 2= skilled manual, 3=non-earning) Experiment (0=control schools, 1=experimental schools)

45
Grade 4: Model 0: the empty model, as a start without any explanatory variable Model 1: with pupil background variables only Model 2; pupil background + prior attainment Model 3: with class variables Model 4: with school variables Table 4. Grade 4 Content-Related 1
Modelling Model 0 Model 1 Model 2 Model 3 Model 4 Fixed part: Intercept Prior score Intelligence Gender Age Father education Mother education Foccupation1 Foccupation2 Moccupation1 Moccupation2 Moccupation3 Academic attitudes Self-concept Democratic attitudes Locus of control Class instruction Class management Class climate Formalisation Affiliation Innovation Achievement orient. Pupil support Work pressure Experiment
4.26 (0.35)
-1.67 (1.53) 0.086 (0.013)* -0.18 (0.17) 0.01 (0.01) 0.12 (0.05)* 0.016 (0.06) -0.37 (0.28) 0.22 (0.21) -0.46 (0.25) -0.23 (0.41) -0.07 (0.23) 6.2 (0.23) 0.28 (0.25) 6.3 (0.36) 1.5 (0.58)*
-4.91 (1.58) 0.59 (0.09)* 0.06 (0.01)* 0.081 (0.17) 0.013 (0.01) 0.11 (0.052)* -0.012 (0.056) -0.39 (0.27) 0.13 (0.2) -0.48 (0.25) -0.35 (0.4) -0.18 (0.22) 0.052 (0.22) 0.35 (0.24) 0.24 (0.35) 1.32 (0.56)*
-2.52 (0.77) 0.6 (0.09)* 0.063 (0.01)* 0.09 (0.04)* 1.01 (0.55)* –0.34 (0.23) -0.17 (0.27) -0.22 (0.22)
-3.43 (0.76) 0.63 (0.09)* 0.06 (0.01)* 0.098(0.04)* 0.97 (0.54)* -1.59 (0.67)* 2.48 (0.47)* 0.73 (0.52) 0.006 (0.4) -0.16 (0.58) -1.5 (0.44)* 1.24 (0.51)*
Random part: School/Class σ2 Pupil σ2 Total σ2
3.984 (1.04) 5.997 (0.3) 9.981
3.887 (1.01) 5.411 (0.27) 9.298
3.757 (0.1) 5.156 (0.26) 8.913
3.366 (0.88) 5.219 (0.26) 8.585
1.713 (0.47) 5.007 (0.25) 6.72
% school σ2 % σ2 accounted for
39.9 -
41.8 6.8
42.2 10.7
39.2 14.0
25.5 32.7
-2(log-likehood) 60.074 3789.8 3750.85 3756.85 3703.48 Note: * p<0.05, standard error in brackets. Pupil gender (0=female pupil, 1=male pupil) Father occupation (0=clerical & professional, 1=unskilled manual, 2= skilled manual) Mother occupation (0=clerical & professional, 1=unskilled manual, 2= skilled manual, 3=non-earning) Experiment (0=control schools, 1=experimental schools)

46
Table 5. Grade 4 Content-Related 2
Modelling Model 0 Model 1 Model 2 Model 3 Model 4 Fixed part: Intercept Prior score Intelligence Gender Age Father education Mother education Foccupation1 Foccupation2 Moccupation1 Moccupation2 Moccupation3 Academic attitudes Self-concept Democratic attitudes Locus of control Class instruction Class management Class climate Formalisation Affiliation Innovation Achievement orient. Pupil support Work pressure Experiment
4.56 (0.24)
-0.45 (1.3) 0.076 (0.01)* -0.35 (0.18) -0.0002 (0.09) 0.017 (0.047) 0.094 (0.05) -0.44 (0.24) 0.27 (0.18) 0.045 (0.22) 0.76 (0.35)* 0.34 (0.2) -0.023 (0.2) -0.23 (0.21) 0.99 (0.3)* 1.58 (0.5)*
-4.39 (1.3) 0.71 (0.078)* 0.049 (0.01)* -0.23 (0.14) 0.004 (0.008) 0.002 (0.04) 0.06 (0.05) -0.47 (0.23)* 0.18 (0.17) 0.02 (0.21) 0.61 (0.33) 0.21 (0.19) -0.08 (0.19) -0.16 (0.2) 1.02 (0.29)* 1.43 (0.47)*
-4.55 (0.8) 0.77 (0.076)* 0.05 (0.01)* -0.45 (0.22)* 0.34 (0.16)* 0.98 (0.28)* 1.47 (0.46)* 0.061 (0.17) -0.02 (0.21) -0.19 (0.16)
-4.57 (0.79) 0.76 (0.076)* 0.05 (0.011)* -0.45 (0.22)* 0.34 (0.16)* 0.98 (0.28)* 1.5 (0.46)* 0.44 (0.6) 0.45 (0.4) 0.86 (0.42)* -0.14 (0.33) 0.06 (0.46) -0.58 (0.35) 1.05 (0.39)*
Random part: School/Class σ2 Pupil σ2 Total σ2
1.747 (0.48) 4.65 (0.23) 6.397
1.401 (0.39) 4.019 (0.2) 5.42
1.335 (0.37) 3.638 (0.18) 4.973
1.393 (0.38) 3.686 (0.19) 5.079
0.9403 (0.27) 3.681 (0.19) 4.6213
% school σ2 % σ2 accounted for
27.3 -
25.8 15.3
26.8 22.3
27.4 20.6
20.3 27.8
-2(log-likehood) 3645.91 3524.69 3445.01 3456.44 3443.97 Note: * p<0.05, standard error in brackets. Pupil gender (0=female pupil, 1=male pupil) Father occupation (0=clerical & professional, 1=unskilled manual, 2= skilled manual) Mother occupation (0=clerical & professional, 1=unskilled manual, 2= skilled manual, 3=non-earning) Experiment (0=control schools, 1=experimental schools)

47
Table 6. Grade 4 Content-Related 3
Modelling Model 0 Model 1 Model 2 Model 3 Model 4 Fixed part: Intercept Prior score Intelligence Gender Age Father education Mother education Foccupation1 Foccupation2 Moccupation1 Moccupation2 Moccupation3 Academic attitudes Self-concept Democratic attitudes Locus of control Class instruction Class management Class climate Formalisation Affiliation Innovation Achievement orient. Pupil support Work pressure Experiment
28.34 (1.6)
-0.38 (6.14) 0.48 (0.05)* -1.6 (0.67)* -0.016 (0.04) 0.36 (0.22) 0.31 (0.23) -1.98 (1.11) 1.87 (0.83)* -1.18 (1.01) 1.54 (1.63) 0.39 (0.91) 0.93 (0.92) -0.31 (0.98) 2.85 (1.4)* 11.46 (2.3)*
-21.9 (6.1) 3.9 (0.36)* 0.32 (0.05)* -0.95 (0.63) 0.003(0.037) 0.27 (0.2) 0.13 (0.21) -2.16 (1.04)* 1.6 (0.77)* -1.31 (0.94) 0.73 (1.5) -0.32 (0.85) 0.61 (0.86) 0.13 (0.92) 3.14 (1.32)* 10.49 (2.1)*
-22.34 (3.8) 4.22 (0.35)* 0.34 (0.05)* -2.12 (1.04)* 2.04 (0.73)* 3.6 (1.3)* 10.2 (2.12)* -0.4 (0.93) 0.35 (1.1) -1.64 (0.88)
-29.51 (3.7) 4.3 (0.34)* 0.34 (0.05)* -2.1 (1.02)* 2.09 (0.72)* 3.98 (1.3)* 9.98 (2.08)* -1.29 (2.55) 6.5 (1.8)* -2.43 (1.98) 2.48 (1.58) -1.7 (2.2) -3.15 (1.69)* 11.26 (1.93)*
Random part: School/Class σ2 Pupil σ2 Total σ2
81.64 (21.04) 107.7 (5.45) 189.34
70.89 (18.3) 85.92 (4.3) 156.81
68.28 (17.3) 74.46 (3.77) 142.74
64.77 (16.6) 75.36 (3.8) 140.13
24.01 (6.69) 74.15 (3.75) 98.16
% school σ2 % σ2 accounted for
43.1 -
45.2 17.2
47.8 24.6
46.2 26.0
24.5 48.2
-2(log-likehood) 6232.24 6050.34 5936.95 5944.66 5901.13 Note: * p<0.05, standard error in brackets. Pupil gender (0=female pupil, 1=male pupil) Father occupation (0=clerical & professional, 1=unskilled manual, 2= skilled manual) Mother occupation (0=clerical & professional, 1=unskilled manual, 2= skilled manual, 3=non-earning) Experiment (0=control schools, 1=experimental schools).