The Q Weak Experiment Event tracking, luminosity monitors, and backgrounds
19
The Q Weak Experiment Event tracking, luminosity monitors, and backgrounds John Leacock Virginia Tech on behalf of the Q Weak collaboration Hall C Users Meeting 23 January 2010
-
Upload
cruz-young -
Category
Documents
-
view
21 -
download
0
description
The Q Weak Experiment Event tracking, luminosity monitors, and backgrounds. John Leacock Virginia Tech on behalf of the Q Weak collaboration Hall C Users Meeting 23 January 2010. Q W eak Event Tracking. Why is event tracking needed?. Luminosity monitors. Measure moments of Q 2 - PowerPoint PPT Presentation
Transcript of The Q Weak Experiment Event tracking, luminosity monitors, and backgrounds

The QWeak Experiment Event tracking, luminosity monitors, and backgrounds
John LeacockVirginia Tech
on behalf of the QWeak collaboration
Hall C Users Meeting23 January 2010

QWeak Event Tracking
• Measure moments of Q2
• Determine main detector light response vs. angle and position• Sanity check on collimators and magnetic field• (Limited) Diagnostics on background origins• Radiative tail shape (benchmark simulation, E loss)
0.5% measurement of Q2
)],(][24
[ 242
QBQQQG
A pWeak
F
Why is event tracking needed?
35 cm Liquid Hydrogen Target
Polarized Electron Beam
Collimator With Eight Openings = 9 ± 2°
Toroidal Magnet
Eight Fused Silica (quartz)Cerenkov Detectors
5 inch PMT in Low GainIntegrating Mode on Each
End of Quartz Bar
Elastically Scattered Electrons
325 cm
580 cm
LuninosityMonitor
Region 3Drift Chambers
Region 2Drift Chambers
Region 1GEM Detectors
Luminosity monitors

Two opposing octants instrumented, rotator system for each region to cover all octants and to move to “parked” position for asymmetry measurement.Periodic tracking measurements at sub-nA beam current.
QWeak Event Tracking

2.5% shift in acceptance-averaged Q2
Detector Response vs. Position

Trigger Scintillators• Located just in front of the main detector• Must have a fast response• Veto neutrals and have enough resolution to identify multiparticle events
GWU

Region I GEMs
Gas electron multiplier• Registers spatial coordinates of event• 100 μm resolution• Radiation hard (near target)
Louisiana Tech

Region I GEMs

Region I GEM Rotator

Region II HDCs
Residuals from track reconstruction
Horizontal Drift Chambers• When combined with GEMs gives accurate scattering angle
Virginia Tech
Six layers:X,U,VX’,U’,V’ offset to resolve left right ambiguities

Region II HDCs

Region II HDC Rotator

Region III VDCs
Vertical Drift Chambers• Located after magnet• When combined with Region I+II and knowledge of magnetic field gives momentum of particle
William and Mary
σ =223μm

Region III VDC Rotator
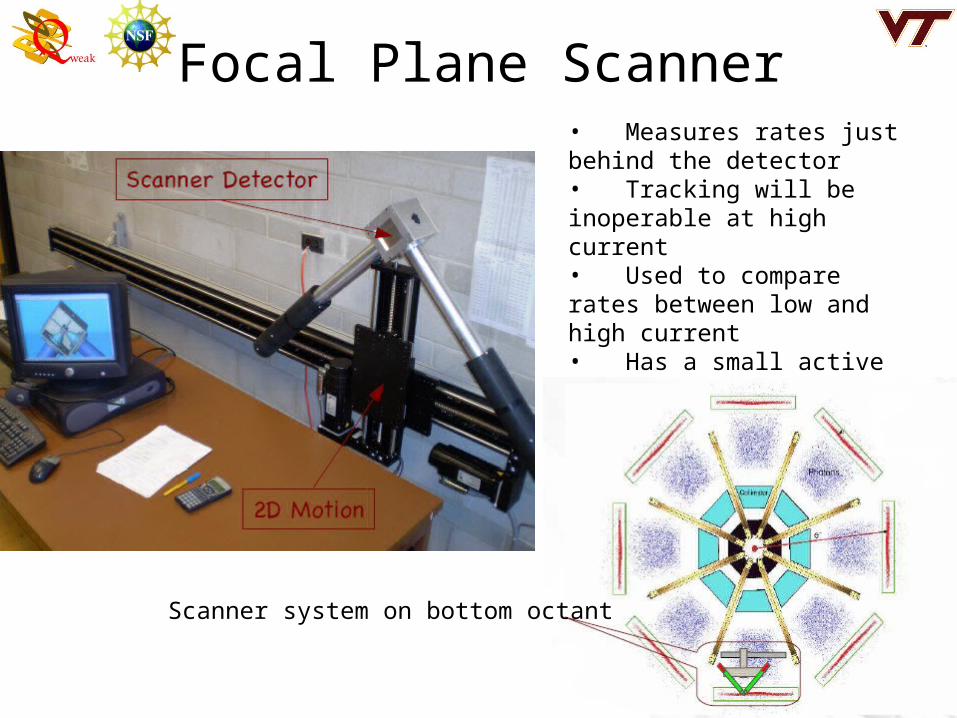
Focal Plane Scanner• Measures rates just behind the detector• Tracking will be inoperable at high current• Used to compare rates between low and high current• Has a small active area so it can be used in low and high current runs
Scanner system on bottom octant

Downstream:8 detectors@ ~ 0.55°• 100 GHz / det• null asymmetry monitor
Upstream: 4 detectors @ ~ 5°• 130 GHz / detector• mainly detects Moller e-• target density monitor• insensitive to beam angle, energy changes
Luminosity monitors: • current mode operation• higher rates than main detectors• quartz Cerenkov radiators• air light guides • PMTs in “unity gain” mode
Luminosity Monitors

Downstream Luminosity Monitors
22.1~70.1~1 2
2
pepe
Excess statistical broadening:
LUMI 1<pe> = 8.8σpe = 6.1
LUMI 2<pe> = 8.9σpe = 5.6
LUMI 3<pe> = 8.4σpe = 5.5
LUMI 4<pe> = 9.2σpe = 5.7
LUMI 5<pe> = 8.4σpe = 5.3
LUMI 6<pe> = 7.9σpe = 5
LUMI 7<pe> = 10.6σpe = 7.6
LUMI 8<pe> = 8σpe = 4.9

BackgroundsTwo background contributions considered here:
Inelastic electrons
Problem: 1% of asymmetry weighted signal is inelastic, 10 times the asymmetry of elastic events
Solution: Decrease magnetic field by 25% to focus inelastic peak on to the main detector.
30% of signal will be inelastic for a much quicker measurement
Electrons that scatter off the target windows
Problem: Aluminum windows have asymmetry weighted background contribution of 30% (cross section ~Z2 asymmetry ~8 times)
Solution: Use a thick aluminum dummy target at the upstream and downstream positions of the target windows to measure the asymmetry from the aluminum
Goal for the contribution of the background error to the final error on QpWeak is 0.5%

Extra Slides

GEM Hit GUI