THE Q-SORT METHOD: A R A C V O Q I A A P -T S - IE Store · emphasized that this procedure is more...
27
IE Working Paper DO8-103-I 15/02/2002 1 THE Q-SORT METHOD: ASSESSING RELIABILITY AND CONSTRUCT VALIDITY OF QUESTIONNAIRE ITEMS AT A PRE-TESTING STAGE Abraham Y. Nahm University of Wisconsin Dept. Information Systems & Operations Management Eau Claire – USA [email protected] Luis E. Solís-Galván Instituto de Empresa Dept. Operations & Technology Management C/ María de Molina, 12, 5º 28006, Madrid – Spain [email protected] S. Subba Rao University of Toledo Dept. Information Systems & Operations Management Toledo, Ohio – USA [email protected] T.S. Ragun-Nathan University of Toledo Dept. Information Systems & Operations Management Toledo, Ohio – USA [email protected] Abstract There is a growing interest in empirical research in operations management. The Q-sort method, which is a method of assessing reliability and construct validity of questionnaire items at a pre-testing stage, is described. The method is cost efficient and simple, yet provides ample insight into potential problem areas in the questionnaire items that are being tested. Two examples are provided on how the method was actually applied in large-scale survey research. Keywords Operations management research, Q-sort method in large-scale survey research
Transcript of THE Q-SORT METHOD: A R A C V O Q I A A P -T S - IE Store · emphasized that this procedure is more...

IE Working Paper DO8-103-I 15/02/2002
1
THE Q-SORT METHOD: ASSESSING RELIABILITY AND CONSTRUCT VALIDITY OF QUESTIONNAIRE
ITEMS AT A PRE-TESTING STAGE
Abraham Y. Nahm
University of Wisconsin Dept. Information Systems & Operations Management
Eau Claire – USA [email protected]
Luis E. Solís-Galván
Instituto de Empresa Dept. Operations
& Technology ManagementC/ María de Molina, 12, 5º
28006, Madrid – Spain [email protected]
S. Subba Rao
University of Toledo Dept. Information Systems & Operations Management Toledo, Ohio – USA [email protected]
T.S. Ragun-Nathan
University of Toledo Dept. Information Systems & Operations Management
Toledo, Ohio – USA [email protected]
Abstract There is a growing interest in empirical research in operations management. The Q-sort method, which is a method of assessing reliability and construct validity of questionnaire items at a pre-testing stage, is described. The method is cost efficient and simple, yet provides ample insight into potential problem areas in the questionnaire items that are being tested. Two examples are provided on how the method was actually applied in large-scale survey research. Keywords Operations management research, Q-sort method in large-scale survey research

IE Working Paper DO8-103-I 5/02/2002
2
Introduction
Recently, there has been a growing interest in empirical research in operations management (Melnyk and Handfield, 1998). For instance, Journal of Operations Management has recently dedicated one whole issue on empirical research (Volume 16, Issue 4, July 1998). Researchers are called to build operations management theory through survey research (Malhotra and Grover, 1998), case studies and field research (Meredith, 1998). Empirical assessment of construct validity (O'Leary-Kelly and Vokurka, 1998) and scale development techniques (Hensley, 1999) are also gaining interest. This paper describes the Q-sort method, which is a method of assessing reliability and construct validity of questionnaire items that are being prepared for survey research. The method is applied at the pre-test stage, which comes after the item generation through literature search and before the administering of questionnaire items as a survey. The method is cost efficient and simple, yet provides ample insight into potential problem areas in the questionnaire items that are being tested. In the following section, we describe the theoretical basis for the method, including the formulas for calculating evaluation indices Cohen’s Kappa and the Hit Ratio. In section three, we provide two examples of how the method was used in actual research. We conclude with a short discussion on the implication for research.
2. Theoretical Basis
The Q-sort method is an iterative process in which the degree of agreement between judges forms the basis of assessing construct validity and improving the reliability of the constructs. The method consists of two stages. In the first stage, two judges are requested to sort the questionnaire items according to different constructs, based on which the inter-judge agreement is measured. In the second stage, questionnaire items that were identified as being too ambiguous, as a result of the first stage, are reworded or deleted, in an effort to improve the agreement between the judges. The process is carried out repeatedly until a satisfactory level of agreement is reached. The following example describes the theoretical basis for the Q-sort method and the two evaluation indices to measure inter-judge agreement level; Cohen’s Kappa (Cohen, 1960) and Moore and Benbasat’s “Hit Ratio” (Moore and Benbasat, 1991). Let us assume that two judges independently classified a set of N components as either acceptable or rejectable. After the work was finished the following table was constructed:
Judge 1 Acceptable Rejectable Totals Acceptable X11 X12 X 1+ Rejectable X21 X22 X 2+
Judge 2
Totals X+1 X+2 N Xij = the number of components in the ith row and jth column, for i,j = 1,2.

IE Working Paper DO8-103-I 5/02/2002
3
The above table can also be constructed using percentages by dividing each numerical entry by N. For the population of components, the table will look like:
Judge 1 Acceptable Rejectable Totals Acceptable P11 P12 P 1+ Rejectable P21 P22 P 2+
Judge 2
Totals P+1 P+2 100 Pij = the percentage of components in the ith row and jth column. We will use this table of percentages to describe the Cohen’s Kappa coefficient of agreement. The simplest measure of agreement is the proportion of components that were classified the same by both judges, i.e., Σi Pii = P11 + P22. However, Cohen suggested comparing the actual agreement, Σi Pii , with the chance of agreement that would occur if the row and columns are independent, i.e., Σi Pi+P+i. The difference between the actual and chance agreements, Σi Pii - Σi Pi+P+i, is the percent agreement above which is due to chance. This difference can be standardized by dividing it by its maximum possible value, i.e., 100% - Σi Pi+P+i. The ratio of these is denoted by the Greek letter Kappa and is referred to as Cohen’s Kappa. Thus, Cohen’s Kappa as a measure of agreement can be interpreted as the proportion of joint judgement in which there is agreement after chance agreement is excluded. The three basic assumptions for this agreement coefficient are: 1) the units are independent, 2) the categories of the nominal scale are independent and mutually exclusive, and 3) the judges operate independently. For Kappa, no general agreement exists with respect to required scores. However, several studies have considered scores greater than 0.65 to be acceptable (e.g. Vessey, 1984; Jarvenpaa 1989). Landis and Koch (1977) have provided a more detailed guideline to interpret Kappa by associating different values of this index to the degree of agreement beyond chance. The following guideline is suggested by them:
Value of Kappa Degree of Agreement Beyond Chance
.76 - 1.00 Excellent
.40 - .75 Fair to Good (Moderate)
.39 or less Poor A second overall measure of both the reliability of the classification scheme and the validity of the items was developed by Moore and Benbasat (1991). The method required analysis of how many items were placed by the panel of judges for each round within the target construct. In other words, because each item was included in the pool explicitly to measure a particular underlying construct, a measurement was taken of the overall frequency with which the judges placed items within the intended theoretical construct. The higher the percentage of items placed in the target construct, the higher the degree of inter-judge agreement across the panel which must have occurred. Scales based on categories which have a high degree of correct placement of items within them can be considered to have a high degree of construct validity, with a high potential for good reliability scores. It must be emphasized that this procedure is more a qualitative analysis than a rigorous quantitative procedure. There are no

IE Working Paper DO8-103-I 15/02/2002
4
established guidelines for determining good levels of placement, but the matrix can be used to highlight any potential problem areas. The following exemplifies how this measure works. Consider the simple case of four theoretical constructs with ten items developed for each construct. With a panel of three judges, a theoretical total of 30 placements could be made within each construct. Thereby, a theoretical versus actual matrix of item placements could be created as shown in the table below (including an ACTUAL “N/A: Not Applicable” column where judges could place items which they felt fit none of the categories).
ACTUAL A B C D N/A Total % Hits
A 26 2 1 0 1 30 87 B 8 18 4 0 0 30 60 C 0 0 30 0 0 30 100 THEORETICAL
D 0 1 0 28 1 30 93 Item Placements: 120 Hits: 102 Overall “Hit Ratio”: 85% The item placement ratio (the “Hit Ratio”) is an indicator of how many items were placed in the intended, or target, category by the judges. Examination of the diagonal of the matrix shows that with a theoretical maximum of 120 target placements (four constructs at 30 placements per construct), a total of 102 “hits” were achieved, for an overall “hit ratio” of 85%. More important, an examination of each row shows how the items created to tap the particular constructs are actually being classified. For example, row C shows that all 30-item placements were within the target construct, but that in row B, only 60% (18/30) were within the target. In the latter case, 8 of the placements were made in construct A, which might indicate the items underlying these placements are not differentiated enough from the items created for construct A. This finding would lead one to have confidence in a scale based on row C, but be hesitant about accepting any scale based on row B. An examination of off-diagonal entries indicates how complex any construct might be. Actual constructs based on columns with a high number of entries in the off-diagonal might be considered too ambiguous, so any consistent pattern of item misclassification should be examined. Examples Research on Post-industrial Manufacturing Nahm (2000) studied the relationship between external environment, internal environment (“managerial beliefs and attitudes” and “organizational structure”), and manufacturing practices through a large-scale survey. As part of this research, questionnaire items were developed to measure the constructs “external environment,” “managerial beliefs and attitudes,” and “organizational structure” (items for “manufacturing practices” were adopted from Koufteros, 1995). The development of the instrument was carried out in two steps. The first step was item generation. The purpose of this step was to create pools of items for each of the constructs that fit the construct definitions. Once the item pools were created, items for the various constructs were re-evaluated to eliminate redundant or ambiguous items. This was done through structured interviews with practitioners from five different manufacturing firms. The focus was to check the relevance of each construct's definitions and clarity of wordings of sample questionnaire items. The result was the following number of items in each pool:

IE Working Paper DO8-103-I 15/02/2002
5
External Environment Level of Market Heterogeneity 10 Degree of Market Segmentation 8 Length of Product Life Cycle 10 Driving Force for Manufacturing Technology 10 Number of Customer Requirements 10 Sub-Total 48 Managerial Beliefs and Attitudes Goals for Investing in Facilities and Equipment 10 Organization of Work 10 Scope in Decision Making 11 Management Mechanism 10 Focus of Managerial Tasks 10 Focus of Supplier Relationships Management 10 Sub-Total 61 Organizational Structure Locus of Decision Making 12 Nature of Formalization 10 Number of Layers in Hierarchy 8 Level of Horizontal Integration 12 Level of Communication 12 Sub-Total 54 Total 163 Items placed in a common pool were subjected to two sorting rounds by two independent judges per round. The basic procedure was to have practitioners from the industry act as judges and sort the items from the first stage into separate constructs, based on similarities and differences among items. Based on the placements made by the judges the items could then be examined and inappropriately worded or ambiguous item could be eliminated or reworded. Two goals for this stage were: to attempt to identify any ambiguous items, and to pre-assess the construct validity of the various scales being developed. First, judges sorted the questionnaire items into construct categories. Each item was printed on a 3 x 5 -inch index card. The cards were shuffled into random order for presentation to the judges. Each judge sorted the cards into categories. A “not available” category definition was included to ensure that the judges did not force any item into a particular category. During the two sorting rounds, two different pairs of judges were utilized. Each set of judges included a manufacturing engineer/manager or a top management executive to ensure that the perceptions of the target population would be included in the analysis. Prior to sorting the cards, the judges were briefed with a standard set of instructions that were previously tested with a separate judge to ensure comprehensiveness and comprehensibility. Judges were allowed to ask as many questions as necessary to ensure they understood the procedure. To assess the reliability of the sorting conducted by the judges, two different measures were made. First, for each pair of judges in each sorting step, their level of agreement in categorizing items was measured using Cohen’s Kappa.

IE Working Paper DO8-103-I 15/02/2002
6
Table 1. Inter-Judge Raw Agreement Scores: First Sorting Round
Judge 1 1 2 3 4 5 6 7 8 9 10 11 12 13 14 15 16 NA1 6 2 1 2 6 1 3 8 1 4 11 5 2 1 9 6 6 7 1 5 3 1 1 8 4 6 3 1 9 1 7 10 1 8 1 11 1 9 12 8 2 13 2 9 2 14 8 15 1 1 10 16 3 2 5 1
J u d g e 2
NA 1 1
Total Items Placement: 163 Number of Agreements:121 Agreement Ratio: 0.74
1. Market heterogeneity 2. Degree of market segmentation 3. Length of product life cycle 4. Driving force for manufacturing technology 5. Number of customer requirements 6. Goals for investing in facilities and equipment 7. Organization of work 8. Scope in decision making 9. Management mechanism 10. Focus of managerial tasks 11. Focus of supplier relationships management 12. Locus of decision making 13. Nature of formalization 14. Number of layers in hierarchy 15. Level of horizontal integration 16. Level of communication

IE Working Paper DO8-103-I 15/02/2002
7
Table 2. Items Placement Ratios: First Sorting Round
Actual Categories 1 2 3 4 5 6 7 8 9 10 11 12 13 14 15 16 NA T % 1 16 1 3 20 80% 2 1 14 1 16 88% 3 17 3 20 85% 4 20 20 100% 5 1 19 20 95% 6 14 2 2 2 20 70% 7 15 3 2 20 75% 8 5 16 1 22 73% 9 3 16 1 20 80% 10 2 1 17 20 85% 11 1 1 18 20 90% 12 19 3 2 24 79% 13 1 18 1 20 90% 14 16 16 100% 15 1 1 22 24 92%
T h e o r e t i c a l
16 1 3 3 16 1 24 67% Total Items Placement: 326 Number of Hits: 273 Overall Hit Ratio: 84%
1. Market heterogeneity 12. Locus of decision making 2. Degree of market segmentation 13. Nature of formalization 3. Length of product life cycle 14. Number of layers in hierarchy 4. Driving force for manufacturing technology 15. Level of horizontal integration 5. Number of customer requirements 16. Level of communication 6. Goals for investing in facilities and equipment 7. Organization of work 8. Scope in decision making 9. Management mechanism 10. Focus of managerial tasks 11. Focus of supplier relationships management

IE Working Paper DO8-103-I 15/02/2002
8
First Sorting Round
In the first round, the inter-judge raw agreement scores averaged 0.74 (Table 1), the initial overall placement ratio of items within the target constructs was 84 % (Table 2), and the Kappa scores averaged 0.73. A summary of the first round inter-judge agreement indices is shown in Table 3. Following the guidelines of Landis and Koch (1977) for interpreting the Kappa coefficient, the value of 0.73 indicates a moderate, but almost excellent level of agreement beyond chance for the judges in the first round. This value is slightly lower than the value for raw agreement, which is 0.74 (Table 1). The level of item placement ratios averaged 84%. For instance, the lowest item placement ratio value was 67% for the “level of communication” construct, indicating a low degree of construct validity. On the other hand, several constructs ("driving force for manufacturing technology" and "number of layers in hierarchy") obtained a 100% item placement ratio, indicating a high degree of construct validity. In order to improve the Cohen’s Kappa measure of agreement, an examination of the off-diagonal entries in the placement matrix (Table 2) was conducted. Any ambiguous items (fitting in more than one category) or too indeterminate items (fitting in no category) were either deleted or reworded. Overall, 29 items were deleted, and 25 items were reworded. The remaining number of items for each construct after the first round of Q-sort was as follows: External Environment Level of Market Heterogeneity 7 Degree of Market Segmentation 7 Length of Product Life Cycle 8 Driving Force for Manufacturing Technology 10 Number of Customer Requirements 10 Sub-Total 42 Managerial Beliefs and Attitudes Goals for Investing in Facilities and Equipment 7 Organization of Work 7 Scope in Decision Making 8

IE Working Paper DO8-103-I 5/02/2002
9
Table 3. Inter-Judge Agreements
Agreement Measure Round 1 Round 2 Raw Agreement 0.74 0.80 Cohen's Kappa 0.73 0.78 Placement Ratio Summary External environment 80% 86% Degree of market segmentation 88% 93% Length of product life cycle 85% 81% Driving force for manufacturing technology 100% 95% Number of customer requirements 95% 85% Goals for investing in facilities and equipment 70% 100% Organization of work 75% 93% Scope in decision making 73% 69% Management mechanism 80% 86% Focus of managerial tasks 85% 94% Focus of supplier relationships management 90% 100% Locus of decision making 79% 83% Nature of formalization 90% 100% Number of layers in hierarchy 100% 81% Level of horizontal integration 92% 91% Level of communication 67% 75% Average 84% 88%
Management Mechanism 7 Focus of Managerial Tasks 8 Focus of Supplier Relationships Management 10 Sub-Total 47 Organizational Structure Locus of Decision Making 9 Nature of Formalization 9 Number of Layers in Hierarchy 8 Level of Horizontal Integration 11 Level of Communication 8 Sub-Total 45 Total 134

IE Working Paper DO8-103-I 5/02/2002
10
Second Sorting Round Again, two judges were involved in the second sorting round, which included the reworded items developed after the first sorting round. In the second round the inter-judge raw agreement scores averaged 0.80 (Table 4), the initial overall placement ratio of items within the targets constructs was 88 % (Table 5), and the Kappa scores averaged 0.78. A summary of the second round inter-judge agreement indices is shown in the second column of Table 3. The value for Kappa coefficient of 0.78 is higher than the value obtained in the first round, and indicates an excellent fit, based on the guidelines of Landis and Koch (1977) for interpreting the Kappa coefficient. The level of item placement ratios averaged 88%. The lowest item placement ratio value was that of 69% for the “scope in decision making” construct, indicating a low degree of construct validity. Again several constructs ("goals for investing in facilities and equipment," "focus of supplier relationships management," and "nature of formalization") obtained a 100% item placement ratio, indicating a high degree of construct validity.

IE Working Paper DO8-103-I 15/02/2002
11
Table 4. Inter-Judge Raw Agreement Scores: Second Sorting Round
Judge 3 1 2 3 4 5 6 7 8 9 10 11 12 13 14 15 16 NA1 5 1 1 2 1 6 3 1 6 1 4 10 5 1 7 2 6 7 1 7 6 3 1 8 3 1 1 9 2 5 10 7 11 10 12 7 1 13 2 9 1 14 1 5 15 1 9 16 1 1 5
J u d g e 4
NA 2
Total Items Placement: 134 Number of Agreements:107 Agreement Ratio: 0.80
1. Market heterogeneity 2. Degree of market segmentation 3. Length of product life cycle 4. Driving force for manufacturing technology 5. Number of customer requirements 6. Goals for investing in facilities and equipment 7. Organization of work 8. Scope in decision making 9. Management mechanism 10. Focus of managerial tasks 11. Focus of supplier relationships management 12. Locus of decision making 13. Nature of formalization 14. Number of layers in hierarchy 15. Level of horizontal integration 16. Level of communication

IE Working Paper DO8-103-I 15/02/2002
12
Table 5. Items Placement Ratios: Second Sorting Round Actual Categories
1 2 3 4 5 6 7 8 9 10 11 12 13 14 15 16 NA T % 1 12 1 1 14 86% 2 1 13 14 93% 3 1 13 2 16 81% 4 1 19 20 95% 5 1 17 2 20 85% 6 14 14 100% 7 13 1 14 93% 8 3 11 1 1 16 69% 9 2 12 14 86% 10 1 15 16 94% 11 20 20 100% 12 15 2 1 18 83% 13 18 18 100% 14 1 13 2 16 81% 15 2 20 22 91%
T h e o r e t i c a l
16 2 1 1 12 16 75% Total Items Placement: 268 Number of Hits: 237 Overall Hit Ratio: 88%
1. Market heterogeneity 12. Locus of decision making 2. Degree of market segmentation 13. Nature of formalization 3. Length of product life cycle 14. Number of layers in hierarchy 4. Driving force for manufacturing technology 15. Level of horizontal integration 5. Number of customer requirements 16. Level of communication 6. Goals for investing in facilities and equipment 7. Organization of work 8. Scope in decision making 9. Management mechanism 10. Focus of managerial tasks 11. Focus of supplier relationships management
In order to further improve potential reliability and construct validity, an examination of the off-diagonal entries in the placement matrix (Table 5) was conducted. Again, any ambiguous items (fitting in more than one category) or too indeterminate items (fitting in no category) were either deleted or reworded. Overall, 29 items were further deleted, and 15 items were reworded. The remaining number of items for each construct after the second round of Q-sort was as follows:

IE Working Paper DO8-103-I 5/02/2002
13
External Environment Level of Market Heterogeneity 5 Degree of Market Segmentation 6 Length of Product Life Cycle 7 Driving Force for Manufacturing Technology 7 Number of Customer Requirements 7 Sub-Total 32 Managerial Beliefs and Attitudes Goals for Investing in Facilities and Equipment 7 Organization of Work 7 Scope in Decision Making 5 Management Mechanism 7 Focus of Managerial Tasks 7 Focus of Supplier Relationships Management 7 Sub-Total 40 Organizational Structure Locus of Decision Making 6 Nature of Formalization 7 Number of Layers in Hierarchy 6 Level of Horizontal Integration 8 Level of Communication 6 Sub-Total 33 Total 105 At this point, we stopped the Q-sort method at round two, for the raw agreement score of 0.80, Cohen’s Kappa of 0.78, and the average placement ratio of 88% were considered as an excellent level of inter-judge agreement, indicating high level of reliability and construct validity. Research on Quality Management The second example is from Solís-Galván (1998) who studied the relationship between quality management and manufacturing competitive capabilities. The basic steps for the instrument development were the same as with Nahm (2000). The first step was item generation. Then the initial pool of items was distributed to a random sample of 12 respondents from the industry for comments. The respondents were asked to provide feedback about the clarity of the questions, instructions, the length of the questionnaire, and provide relevant comments meant to improve the questionnaire. Based on the feedback, items were modified or discarded to strengthen the construct and content validity. As a result, the following number of items remained in each pool:

IE Working Paper DO8-103-I 5/02/2002
14
Management Based Quality Practices Top Management Support 11 Strategic Quality Planning 5 Sub-Total 16 Employee Based Quality Practices Employee Training 5 Employee Involvement 5 Employee Empowerment 5 Employee Recognition 4 Sub-Total 19 Information Based Quality Practices Quality Information Availability 5 Quality Information Usage 4 Benchmarking 4 Sub-Total 13 Customer Based Quality Practices Customer Orientation 9 Customer Closeness 6 Sub-Total 15 Product/Process Based Quality Practices Product Design 8 SPC Usage 3 Process Design 3 Sub-Total 14 Supplier Based Quality Practices Supplier Quality 7 Total 84 The second step was item testing. The basic procedure was to have quality managers, plant managers, and top management executives judge and sort the items from the first stage into separate quality management categories, based on similarities and differences among items. A group of potential judges were identified from the local Chapter of the American Society for Quality. All of the potential participants were representatives of the population targeted for this study, and considered as knowledgeable in the quality field, and with the required experience and position to assess the impact of TQM practices in their organization. From this group, a random sample of six judges was selected to participate during this stage.
IE Working Paper DO8-103-I 5/02/2002
15
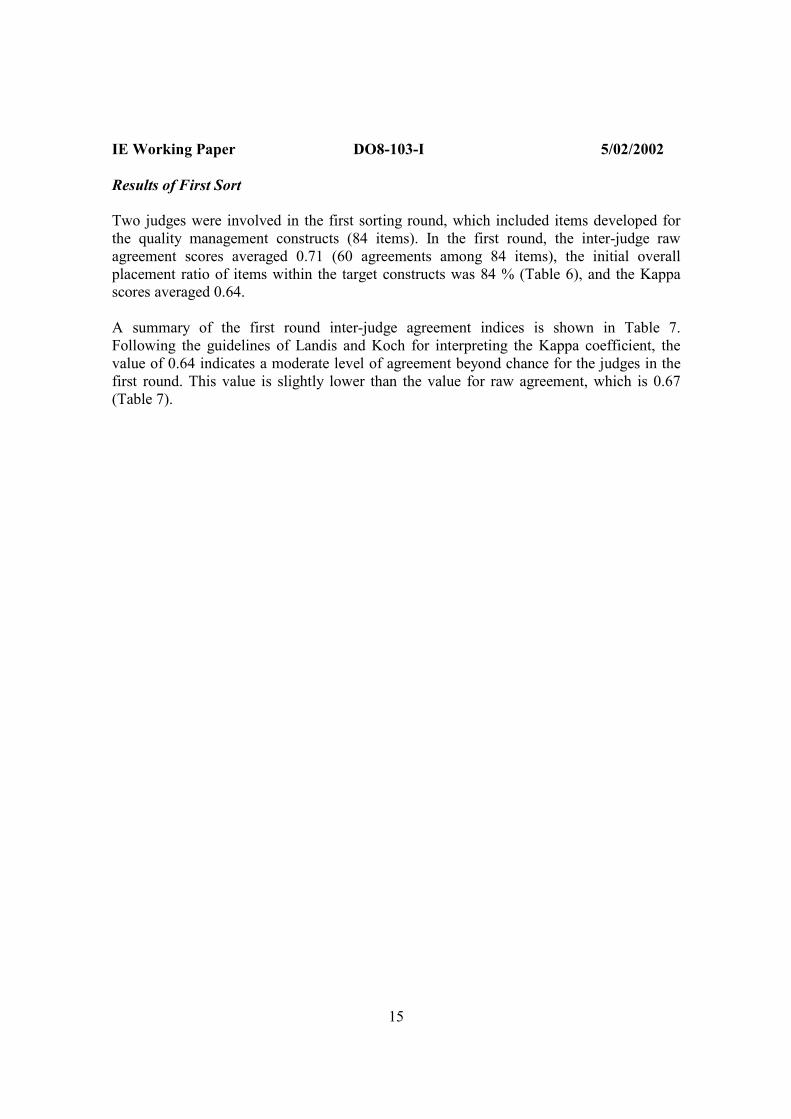
Results of First Sort Two judges were involved in the first sorting round, which included items developed for the quality management constructs (84 items). In the first round, the inter-judge raw agreement scores averaged 0.71 (60 agreements among 84 items), the initial overall placement ratio of items within the target constructs was 84 % (Table 6), and the Kappa scores averaged 0.64. A summary of the first round inter-judge agreement indices is shown in Table 7. Following the guidelines of Landis and Koch for interpreting the Kappa coefficient, the value of 0.64 indicates a moderate level of agreement beyond chance for the judges in the first round. This value is slightly lower than the value for raw agreement, which is 0.67 (Table 7).

IE W
orki
ng P
aper
W
P 8
/ 02
15/0
2/20
02
16
Tabl
e 6.
Item
s Pla
cem
ent R
atio
s: F
irst
Sor
ting
Rou
nd
AC
TUA
L C
ATE
GO
RIE
S
1 2
3 4
5 6
7 8
9 1 0
1 1
1 2
1 3
1 4
1 5
N
A
T T G
%
1
1 9
3
2 2
86
2 2
8
1 0
80
3 1
1 8
1 0
80
4
8 1
1 1 0
80
5
2 8
1 0
80
6
8
8
10 0 7
1 0
1 0
10 0
T H
E O
R
E T I C
A
L
8
8
8
10 0

IE W
orki
ng P
aper
W
P 8
/ 02
15/0
2/20
02
17
9 2
1
1
1 0
3 1
1 8
56
1 0
1
1 1
1 2
92
1 1
1
2
1 2
1
1 6
75
1 2
6
6 10 0
1 3
2
4
6 66
1 4
1 1 3
1 4
93
1 5
8
8 10 0
Tota
l Ite
ms P
lace
men
t: 16
8 H
its: 1
41
Ove
rall
Hit
Rat
io: 8
4%
1.
Top
man
agem
ent s
uppo
rt 6.
Em
ploy
ee re
cogn
ition
11.
Prod
uct d
esig
n 2.
St
rate
gic
qual
ity p
lann
ing
7.
Qua
lity
info
rmat
ion
avai
labi
lity
12
. SP
C u
sage
3.
Empl
oyee
trai
ning
8.
Qua
lity
info
rmat
ion
usag
e
13.
Proc
ess d
esig
n 4.
Em
ploy
ee in
volv
emen
t 9.
C
usto
mer
orie
ntat
ion
14.
Supp
lier q
ualit
y 5.
Em
ploy
ee e
mpo
wer
men
t 10
. C
usto
mer
clo
sene
ss
15.
Ben
chm
arki
ng

IE Working Paper DO8-103-I 15/02/2002
18
Table 7. Inter-Judge Agreements Agreement Measure
Round 1
Round 2
Round 3
Raw Agreement
0.71
0.70
0.81
Cohen’s Kappa
0.64
0.68
0.81
Placement Ratio Summary
Top Management Involvement
86%
91%
91%
Strategic Quality Planning
80%
80%
90%
Employee Training
80%
100%
100%
Employee Involvement
80%
50%
80%
Employee Empowerment
80%
70%
80%
Employee Recognition
100%
80%
88%
Availability of Quality Information
100%
100%
100%
Usage of Quality Information
100%
100%
75%
Customer Orientation
55%
67%
83%
Closeness to Customers
91%
63%
75%
Product Design
75%
78%
83%
Statistical Process Control Usage
100%
100%
100%
Process Management
66%
100%
100%
Supplier Relationships
93%
88%
100%
Benchmarking
100%
88%
100%
Average
84%
82%
89%

IE Working Paper DO8-103-I 5/02/2002
19
The level of item placement ratios averaged 84%. For instance, the lowest item placement ratio value was 56% for the “customer orientation” construct, indicating a low degree of construct validity. On the other hand, several constructs (“employee recognition,” “quality information availability,” “quality information usage,” “usage of statistical quality control,” and “benchmarking”) obtained a 100% item placement ratio, indicating a high degree of construct validity. In order to improve the Cohen’s Kappa measure of agreement, an examination of the off-diagonal entries in the placement matrix (Table 6) was conducted. The first part of the analysis revealed two significant clusters. The first one involved the constructs “top management support,” “strategic quality planning,” and “employee training.” The second cluster involved the constructs “employee involvement” and “employee empowerment.” These clusters showed potential internal consistency, because the off-diagonals showed clustering, rather than scattering, of items. An analysis of the two clusters was conducted to identify ambiguous items or too indeterminate items, which resulted in rewording of the appropriate items. Further, the “customer orientation” and “product design” constructs revealed a light scattering of items, raising concern for the level of its internal consistency. In this case, items classified in a construct different from what they were intended to be were identified and reworded. One additional item was included in the “product design” construct after reviewing its definition. Feedback obtained from both judges lead to the creation of two additional items for the “customer closeness” construct and one additional item for the “supplier quality” construct. Results of Second Sort Two judges were involved in the second sorting round, which included the reworded and new items developed after the first sort round. In the second round the inter-judge raw agreement scores averaged 0.70 (62 agreements among 88 items). A summary of the second round inter-judge agreements indices is shown in the second column of Table 7. The value for Kappa coefficient of 0.68 was higher than the value obtained in the first round, but still indicated a moderate level of agreement beyond chance for the judges in the second round. The level of item placement ratios averaged 82% (Table 8). The lowest item placement ratio was 50% for the “employee involvement” construct, indicating a low degree of construct validity. Several constructs (“employee recognition,” “quality information availability,” “quality information usage,” “usage of statistical quality control,” and “process design”) obtained a 100% item placement ratio, indicating a high degree of construct validity. In order to further improve the Cohen’s Kappa, an examination of the off-diagonal entries in the placement matrix (Table 8) was conducted. The analysis revealed two significant clusters. The first involved the constructs “employee involvement” and “employee

IE Working Paper DO8-103-I 5/02/2002
20
empowerment,” while the second involved the constructs “customer orientation” and “customer closeness.” The results of the second round show an improvement over the type of problems found in the first round since no scattering patterns were identified. The second round results argue well for potential internal consistency, because the off-diagonals showed clustering, rather than a scattering of items. Further, analysis of the two clusters resulted in rewording four items belonging to the constructs “customer orientation,” “product design,” and “supplier quality.” One additional question suggested by two judges was added to the “SPC usage” construct.

IE W
orki
ng P
aper
W
P 8
/ 02
15/0
2/20
02
21
Tabl
e 8.
Item
s Pla
cem
ent R
atio
s: S
econ
d S
ortin
g R
ound
A
CTU
AL
CA
TEG
OR
IES
1
2 3
4 5
6 7
8 9
1 0
1 1
1 2
1 3
1 4
1 5
N
A
T TG
%
1
2 0
1
1
2 2
91
2 2
8
1 0
80
3
1 0
1 0
10 0 4
4
5
1
1 0
50
5
3 7
1 0
70
6
8
8
10 0 7
1 0
1 0
10 0
T H
E O
R
E T I C
A
L
8
8
8
10 0

IE W
orki
ng P
aper
W
P 8
/ 02
15/0
2/20
02
22
9
1
1 2
3
2 1 8
67
1 0
5 1 0
1
1 6
63
1 1
1 4
3
1 1 8
78
1 2
6
6 10 0
1 3
6
6 10 0
1 4
1
1 4
1
1 6
88
1 5
1
7
8 88
Tota
l Ite
ms P
lace
men
t: 17
6 H
its: 1
45
Ove
rall
Hit
Rat
io: 8
2%
1.
Top
man
agem
ent s
uppo
rt 6.
Em
ploy
ee re
cogn
ition
11.
Prod
uct d
esig
n 2.
St
rate
gic
qual
ity p
lann
ing
7.
Qua
lity
info
rmat
ion
avai
labi
lity
12
. SP
C u
sage
3.
Empl
oyee
trai
ning
8.
Qua
lity
info
rmat
ion
usag
e
13.
Proc
ess d
esig
n 4.
Em
ploy
ee in
volv
emen
t 9.
C
usto
mer
orie
ntat
ion
14.
Supp
lier q
ualit
y 5.
Em
ploy
ee e
mpo
wer
men
t 10
. C
usto
mer
clo
sene
ss
15.
Ben
chm
arki
ng

IE Working Paper DO8-103-I 5/02/2002
23
Results of Third Sort Two judges participated in the third sorting round, which included the reworded items and the new item added to the “SPC usage” construct. In the third round the inter-judge raw agreement scores averaged 0.81 (72 agreements among 89 items), the initial overall placement ratio of items within the targets constructs was 89 % (Table 9), and the Kappa scores averaged 0.81. A summary of the third round inter-judge agreements indices is shown in the third column of Table 7. The value for Kappa coefficient of 0.80 is significantly higher than the value obtained in the second round, and indicates an excellent level of agreement beyond chance. The level of item placement ratios averaged 89%. The lowest item placement ratio value was that of 75% for the “quality information usage” construct, indicating a moderate to good degree of construct validity. The constructs “employee training,” “quality information availability,” “usage of statistical quality control,” “process design,” “supplier quality,” and “benchmarking” obtained a 100% item placement ratio. This placement of items within the target construct shows that a high degree of construct validity and potential reliability were achieved.

IE W
orki
ng P
aper
W
P 8
/ 02
15/0
2/20
02
24
Tabl
e 9.
Item
s Pla
cem
ent R
atio
s: T
hird
Sor
ting
Rou
nd
AC
TUA
L C
ATE
GO
RIE
S
1 2
3 4
5 6
7 8
9 1 0
1 1
1 2
1 3
1 4
1 5
N
A
T T G
%
1
2 0
2
2 2
91
2 1
9
1 0
80
3
1 0
1 0
10 0 4
8
1 1
1 0
50
5 1
1 8
1 0
70
6
1
7
8
10 0 7
1 0
1 0
10 0
T H
E O
R
E T I C
A
L
8
1
1
6
8
10 0

IE W
orki
ng P
aper
W
P 8
/ 02
15/0
2/20
02
25
9
1
1 5
2
1 8
67
1 0
1
3 1 2
1 6
63
1 1
1
1 5
2
1 8
78
1 2
8
8 10 0
1 3
6
6 10 0
1 4
1 6
1 6
88
1 5
8
8 88
Tota
l Ite
ms P
lace
men
t: 17
8 H
its: 1
58
Ove
rall
Hit
Rat
io: 8
9%
1.
Top
man
agem
ent s
uppo
rt 6.
Em
ploy
ee re
cogn
ition
11
. Pr
oduc
t des
ign
2.
Stra
tegi
c qu
ality
pla
nnin
g 7.
Q
ualit
y in
form
atio
n av
aila
bilit
y 12
. SP
C u
sage
3.
Empl
oyee
trai
ning
8.
Qua
lity
info
rmat
ion
usag
e
13.
Proc
ess d
esig
n 4.
Em
ploy
ee in
volv
emen
t 9.
C
usto
mer
orie
ntat
ion
14
. Su
pplie
r qua
lity
5.
Empl
oyee
em
pow
erm
ent
10.
Cus
tom
er c
lose
ness
15
. B
ench
mar
king

IE Working Paper DO8-103-I 15/02/2002
26
Conclusion Until now, researchers engaged in survey research had no simple way of assessing the reliability and construct validity of their questionnaire items before large scale survey except for conducting pilot survey on a reduced scale. By applying the Q-sort method, one can now assess them in a timely and cost-efficient manner. The method is a qualitative rather than a quantitative method, and thus may not be compared to the usefulness and the statistical power of a pilot survey. Nevertheless, in light of growing interest in empirical research in operations management, a method like the one described here, which is a cost-efficient and simple yet insightful method of assessing reliability and construct validity of measurement items, should be of great help to researchers.

IE Working Paper DO8-103-I 15/02/2002
27
References Cohen, J. 1960. A Coefficient of Agreement for Nominal Scales, Educational and Psychological Measurement, Spring, 37-46. Hensley, R. L. 1999. A Review of Operations Management Studies Using Scale Development Techniques, Journal of Operations Management, 17(3), 343-358. Jarvenpaa, S. 1989. The Effect of Task Demands and Graphical Format on Information Processing Strategies, Management Science, March, 35(3), 285-303. Koufteros, X. A. 1995. Time-Based Competition: Developing a Nomological Network of Constructs and Instrument Development. Unpublished Ph.D. Dissertation, College of Business Administration, The University of Toledo, Toledo, OH. Landis, J. R. and C. G. Koch. 1977. The Measurement of Observer Agreement for Categorical Data, Biometrics, 33. Malhotra, M. K. and V. Grover. 1998. An Assessment of Survey Research in POM: From Constructs to Theory, Journal of Operations Management, 16(4), 407-425. Melnyk, S. A. and R. Handfield. 1998. May You Live in Interesting Times: The Emergence of Theory-Driven Empirical Research, Journal of Operations Management, 16(4), 311-319. Meredith, J. 1998. Building Operations Management Theory through Case and Field Research, Journal of Operations Management, 16(4), 441-454. Moore, G. C. and I. Benbasat. 1991. Development of an Instrument to Measure the Perceptions of Adopting an Information Technology Innovation, Information Systems Research, 2(3), 192-222. Nahm, A. Y. 2000. Exploring the Relationship Between External Environment, Internal Environment, and Manufacturing Practices: An Industrial/Post-industrial Perspective. Working Paper, College of Business Administration, The University of Toledo, Toledo, OH. O'Leary-Kelly, S. W. and R. J. Vokurka. 1998. The Empirical Assessment of Construct Validity, Journal of Operations Management, 16(4), 387-405. Solís-Galván, L. E. 1998. An Exploratory Study of the Relationship Between Quality Management and Manufacturing Competitive Capabilities. Unpublished Ph.D. Dissertation, College of Business Administration, The University of Toledo, Toledo, OH. Vessey, I. 1984. An Investigation of the Psychological Processes Underlying the Debugging of Computer Programs. Unpublished Ph.D. Dissertation, Department of Commerce, The University of Queensland, Queensland, Australia.