
The Provincial Business Environment Scorecard in … · The Provincial Business Environment...
69
The Provincial Business Environment Scorecard in Cambodia A Measure of Economic Governance and Regulatory Policy Technical Report March, 2007 A partnership between the International Finance Corporation’s Mekong Private Sector Development Facility (IFC-MPDF) and The Asia Foundation with funding support from the Australian Agency for International Development (AusAID)
Transcript of The Provincial Business Environment Scorecard in … · The Provincial Business Environment...

The Provincial Business Environment Scorecard in CambodiaA Measure of Economic Governance and Regulatory Policy
Technical Report
March, 2007
A partnership between the International Finance Corporation’s Mekong Private SectorDevelopment Facility (IFC-MPDF)
andThe Asia Foundation with funding support from the Australian Agency for International
Development (AusAID)

Common Abbreviations ........................................................................................................................................ i
Acknowledgements .............................................................................................................................................. ii
1. Executive Summary ......................................................................................................................................... 31.1. The Sub-Indices ........................................................................................................................................ 31.2. Methodological Innovation ........................................................................................................................ 41.3. The Provincial Business Environment Scorecard ................................................................................... 51.4. The Impact of Provincial Business Environments ................................................................................... 81.5. Conclusions ............................................................................................................................................. 10
2. Sub-Indices of the PBES ............................................................................................................................... 132.1. Entry Costs ............................................................................................................................................... 132.2. Property Rights ........................................................................................................................................ 172.3. Transparency .......................................................................................................................................... 212.4. Time Costs of Regulatory Compliance .................................................................................................. 262.5. Informal Charges ..................................................................................................................................... 282.6. Participation ............................................................................................................................................ 332.7. Crime Prevention ..................................................................................................................................... 342.8. Tax Administration and Burden ............................................................................................................... 352.9. Proactivity of Provincial Authorities .......................................................................................................... 382.10.Dispute Resolution .................................................................................................................................. 402.11.Composition of the Final PBES Index .................................................................................................... 41
3. Methodology ................................................................................................................................................... 453.1. Phase 1: Census of Private Firms in 10 Provinces ................................................................................ 453.2. Phase 2: Data Collection and Field Testing ........................................................................................... 453.3. Phase 3: Survey ....................................................................................................................................... 463.4. Phase 4: Index Creation .......................................................................................................................... 47
4. Next Steps ........................................................................................................................................................ 53
Contents
Appendices
Appendix 1: Detailed Descriptions of Sub-Indices and Component Indicators .......................................... 57Appendix 2A: Determinants of Firm Expansion .............................................................................................. 58Appendix 2B: Determinants of Labor Growth .................................................................................................. 59Appendix 3: Determinants of Labor Growth (Sub-Indices) ........................................................................... 60Appendix 4: Construction of Structural Conditions ....................................................................................... 61

Figure 1: The Provincial Business Environment Scorecard (PBES) ............................................................... 6
Figure 2: Total Investment Environment ............................................................................................................ 7
Figure 3: Star Chart of Provincial Scores on Each Sub-Index .......................................................................... 8
Figure 4: PBES and Literacy Rates on Firm Labor Growth .............................................................................. 9
Figure 5: Entry Costs Sub-Index ...................................................................................................................... 13
Figure 6: Property Rights Sub-Index ................................................................................................................ 17
Figure 7: Transparency Sub-Index .................................................................................................................. 22
Figure 8: Time Costs of Regulatory Compliance Sub-Index ......................................................................... 27
Figure 9: Informal Charges Sub-Index ............................................................................................................ 29
Figure 10: Relationship between Micro-Corruption and Predictability ............................................................ 32
Figure 11: Participation Sub-Index .................................................................................................................... 33
Figure 12: Crime Prevention Sub-Index ............................................................................................................ 34
Figure 13: Tax Administration and Burden Sub-Index ...................................................................................... 37
Figure 14: Proactivity of Provincial Authorities Sub-Index ................................................................................. 38
Figure 15: Dispute Resolution Sub-Index ......................................................................................................... 40
Figure 16: External Validity- Firms Evaluations of Road Quality vs. Actual Coverage ...................................... 48
Figure 17: Internal Validity- Firms Evaluations of Electricity vs. Number of Outrages Experienced ............... 48
Figure 18: Confidence Intervals around the Mean Waiting Period for Patent Tax Registration ..................... 49
List of Figures

Table 1: Final Provincial Business Environment Scorecard ............................................................................. 6
Table 2: Predicted Probability of Expansion in Next Two Years ........................................................................ 9
Table 3: Predicted Impact of Sub-Indices on Labor Growth 2005-2006 ........................................................ 10
Table 4: Levels of Cambodian Business Formalization .................................................................................. 14
Table 5: Indicators Comprising Entry Costs (Dimension 1) Waiting Periods/Procedures .............................. 16
Table 6: Indicators Comprising Entry Costs (Dimension 2) Official Fees ...................................................... 16
Table 7: Levels of Cambodian Land Titling ..................................................................................................... 18
Table 8: Indicators Comprising Property Rights (Dimension 1) Perceptions .................................................. 19
Table 9: Regression Determination of Effective Land Price ............................................................................ 20
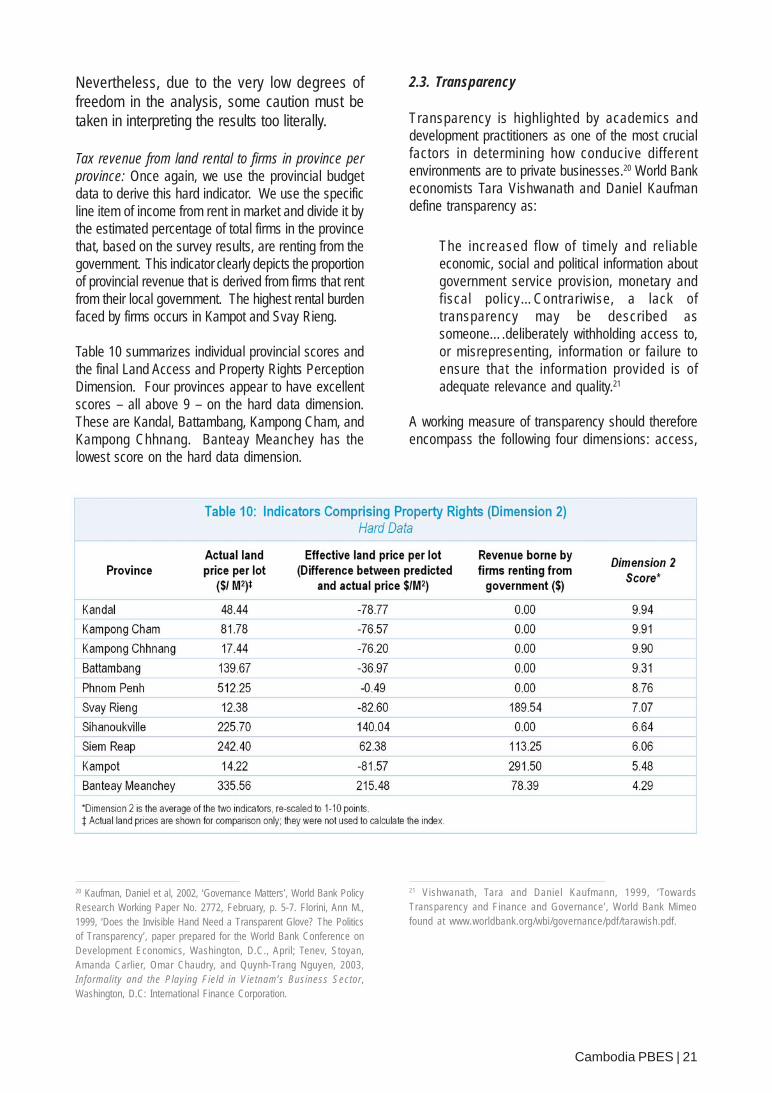
Table 10: Indicators Comprising Property Rights (Dimension 2) Hard Data .................................................... 21
Table 11: Important Provincial Documents and Firms’ Knowledge of their Existence .................................... 23
Tbale 12: Indicators Comprising Transparency (Dimension 1) Access to Regulatory Information. ................ 23
Table 13: Indicators Comprising Transparency (Dimension 2) Consistency of Application ............................ 24
Table 14: Indicators Comprising Transparency (Dimension 3) Predictability of Laws and Policies ............... 25
Table 15: Indicators Comprising Transparency (Dimension 4) Hard Data Information Request. ................... 26
Table 16: Indicators Comprising Time Costs of Regulatory Compliance ........................................................ 28
Table 17: Indicators Comprising Informal Charges (Dimension 1) Micro-Corruption ...................................... 30
Table 18: Indicators Comprising Informal Charges (Dimension 2) Macro-corruption ..................................... 31
Table 19: Indicators Comprising Informal Charges (Dimension 3) Predictability of Corruption ...................... 32
Table 20: Indicators Comprising Participation Sub-Index ................................................................................. 34
Table 21: Indicators Comprising Crime Prevention Sub-Index ......................................................................... 35
Table 22: Profit Tax Categories for Private Firms .............................................................................................. 36
Table 23: Indicators Comprising Tax Administration and Burden Sub-Index ................................................... 37
Table 24: Indicators Comprising Proactivity of Provincial Authorities Sub-Index .............................................. 39
Table 25: Indicators Comprising Dispute Resolution Sub-Index ...................................................................... 41
Table 26: Final Provincial Business Environment Scorecard ........................................................................... 42
Table 27: Predicted Impact of Sub-Indices on Labor Growth 2005-2006 ........................................................ 42
Table 28: Population and Sample Distribution of Firms of Phnom Penh ......................................................... 46
Table 29: Correlation of Scores with Response Rate ........................................................................................ 47
List of Tables

Asian Development Bank (ADB)Australian Agency for International Development (AusAID)Department of Industry, Mines, and Energy (DIME)Department of Commerce (DOC)Department of Tourism (DOT)World Bank’s Investment Climate Analysis (ICA)Cambodian Riel (KR)Ministry of Industry, Mines and Energy (MIME)The International Finance Corporation’s Mekong Private Sector Development Facility (IFC-MPDF)Ministry of Commerce (MOC)Ministry of Tourism (MOT)Provincial Business Environment Scorecard (PBES)Value Added Tax (VAT)World Bank (WB)
Common Abbreviations
i
ii
The Provincial Business Environment Scorecard (PBES) project is a collaborative effort between the InternationalFinance Corporation’s Mekong Private Sector Development Facility (IFC-MPDF) and The Asia Foundation (withfunding support from the Australian Agency for International Development - AusAID).
The study would not have been possible without the strong support of H.E. Suy Sem, Minister of Industry, Mines andEnergy; H.E. Cham Prasidh, Senior Minister and Minister of Commerce, and H.E. Sun Chanthol, Minister of PublicWorks and Transport. The Senior Minister and Ministers issued separate letters of endorsement for the project andwere pivotal in ensuring effective coordination of officials in their respective ministry. We are very grateful for theirgracious support.
Like any other research endeavor, PBES was the result of the collaborative efforts of many individuals. The project’stechnical advisor and author was Dr. Edmund Malesky, who was supported by a field research team from IndochinaResearch Limited (IRL) in Cambodia. Stefano Magistretti managed field research and was assisted by Kim Huortand Kuon Chantha. Chum Chanreasey, Chin Vuthy, and Va Wisal provided indispensable assistance with data entryand coding. John McGinley was instrumental in providing hard data on province specific macroeconomic conditionsand endowments. Dr. Malesky also received valuable assistance in data analysis from Brandon Hickie of ExportAccess. Throughout the implementation period, the project received guidance from Hor Soneath and Quynh TrangPhuong Nguyen of IFC-MPDF and Véronique Salze-Lozac’h of The Asia Foundation.
Our colleagues at IFC-MPDF and The Asia Foundation worked tirelessly at every aspect of the project and throughoutthe implementation period to ensure its success. Touk Khy of IFC-MPDF provided comments and inputs throughoutthe study. Rashmi K. Pendse and Charles Schneider provided editorial assistance to make the report more accessibleto the public at large, as well as valuable comments throughout the study. Jennifer Bartlett and Khut Inserey of TheAsia Foundation helped to coordinate various aspects of the project’s implementation, including the importantphase of translation. Nancy Kelly provided comments and edited the report.
Our special thanks go to Kea Kunthea for making great efforts to create the layout and graphics to illustrate the PBESresults and Tonie Tan for her administrative support.
The International Finance Corporation’s The Asia FoundationMekong Private Sector Development Facility
Acknowledgements


Executive Summary


The Provincial Business Environment Scorecard (PBES) in CambodiaA Measure of Economic Governance and Regulatory Policy
Cambodia PBES | 3
1. Executive Summary
Recent research on the development of theCambodian private sector has highlighted fourimportant and interconnected findings.1
1) The private sector is the major source ofemployment in the economy (accounting for 92%of total jobs) and will continue to be the dominantsource of job creation and poverty reduction forthe foreseeable future.
2) Nevertheless, relative to its peers in otherSoutheast Asian economies, the Cambodianprivate sector has been inhibited in its ability togrow and create jobs because of a wide spectrumof institutional barriers and constraints to itsdevelopment.
3) As a result of these institutional barriers, thevast majority of private enterprises have avoidedthe full formalization of their activities (asmeasured by whether an enterprise has registeredwith the Ministry of Commerce).
4) For all unregistered enterprises and most ofthe registered enterprises as well, the immediateinterface with governing institutions is at the local(specifically the provincial/municipal) level.
And yet researchers and those in the donor communityunderstand very little about these interactions, how theyaffect private sector performance and the choice toformalize, and finally how provincial governance differsacross Cambodia. The missing key to ourunderstanding of how to promote the growth anddynamism of the private sector in Cambodia andthereby assist job creation and poverty alleviation liesin a thorough understanding of the impact of localinstitutions on private sector performance. TheProvincial Business Environment Scorecard (PBES)represents the first attempt to understand this inCambodia.
1 Development Consulting International, 2003. “Private SectorAssessment for the Kingdom of Cambodia,” TA Report forthe Asian Development Bank and Ministry of Industry, Minesand Energy. Asian Development Bank: Phnom Penh,December; World Bank Group, 2004a. “Cambodia: EconomyProfile,” Doing Business in 2005: Removing Obstacles toGrowth. World Bank: Washington, D.C.; World Bank Group,2004b. Cambodia Seizing the Global Opportunity:Investment Climate Assessment and Reform Strategy forCambodia. World Bank: Phnom Penh; Dapice, David. 2005.“Reducing Poverty by Creating a Normal Country,”Memorandum to Government of Cambodia; Chandarrot, Kang,2006. The Enabling Environment for Micro, Small, andMedium Enterprises in Cambodia. Phnom Penh: The AsiaFoundation and Cambodian Development Resource Institute.Chandarrot, Kang, Salze-Lozac’h, Véronique, and Liv Dannet,2006. Streamlining Local Licensing Procedures inCambodia. Phnom Penh: The Asia Foundation and CambodianInstitute of Development Study.
The PBES is a thorough diagnosis of the comparativeeconomic governance of 10 provinces according to10 basic criteria (sub-indices). The ultimate goal ofthe project is to identify the provinces that have excelledat various aspects of provincial governance andcommunicate these successful governance practicesto other provinces.
1.1. The Sub-Indices
More detail about how these sub-indices weremeasured is provided in Section 2 below, but brieflythe sub-indices include:
1. Entry Costs: A measure of the time it takesfirms to register and receive all the necessarylicenses to start business, the number oflicenses required, and the official costs ofobtaining all licenses/permits.
2. Property Rights: A measure of the formalrights to business premises and the securityof tenure once land is properly acquired andtitled.
3. Transparency: A measure of whether firmshave access to the proper planning and legal
documents necessary to run their business,whether those documents are equitablyavailable, and whether new policies and lawsare communicated to firms and predictablyimplemented.
4. Time Costs of Regulatory Compliance: Ameasure of how much time firms spend onbureaucratic compliance and waitingperiods, as well as how often firms mustundergo inspections by local regulatoryagencies.
5. Informal Charges: A measure of how oftenfirms pay both micro-informal charges suchas bribes and macro-informal charges suchas kickbacks on public procurement, howmuch of an obstacle those extra fees posefor their business operations, and whetherpayments of those extra fees are predictableand result in the expected results or “services.”
6. Participation: Measuring whether firms areconsulted in the creation of provincial policyand whether their interests are representedin policy discussions by businessassociations or other interest groups.
7. Crime Prevention: A measure of how muchfirms pay in explicit costs as a result of crimedue to property that is lost or stolen, as well asthe implicit costs of preventing crime bypaying security and protection money.
8. Tax: A gauge of both the administrative andfiscal burden imposed by tax regulation inthe province.
9. Proactivity of Provincial Leadership: Ameasure of the creativity and willingness ofprovincial authorities to assist and interpretin favor of local private firms – given an oftenunclear national regulatory framework – inimplementing central policy and designingtheir own initiatives for private sectordevelopment.
10. Dispute Resolution: A measure of thesatisfaction firms have in the outcomes offormal and informal modes of disputeresolution in the province.
1.2. Methodological Innovation
Two general types of data were used to construct thesub-indices. The first is perceptions data, drawn froma face-to-face survey of 500 private firms in 10provinces. This perceptions (or “soft”) data wascombined with objective (or “hard”) data gathered frompublished sources, such as statistical yearbooks, theannual provincial budget, first-person collection andinterviews with third-parties like state-owned banks andreal estate firms.2
It is important to highlight that while the PBES analysisstudies similar issues as previous assessments of theprivate sector in Cambodia, its methodology differs intwo critical ways. First, the PBES research team didnot limit its analysis to the formal sector; the explicitgoal of the research was to assess the private sectorgenerally and this meant focusing on economicgovernance toward unregistered firms as well. 58 %of the firms in our sample are neither registered withthe Ministry of Commerce nor even possess the lessformal distinction of one-year registration throughMunicipal/Provincial Department of Commerce.Nevertheless, calling them informal is a misnomer, as73% have documented their business activities bypaying a one-year Patent Tax with the local tax authority.Local officials are aware of their business activitiesand benefit from them.
The decision to sample from the entire population ofenterprises arose from two problems faced in the earlystages of the research – one methodological and onetheoretical. First, in terms of methodology, we found itimpossible to obtain similar lists of registeredenterprises (or enterprises with one-year operatinglicenses) between the different provinces; data qualityand coverage differed dramatically (if lists existed atall), raising severe concerns about selection bias inthe comparison of provincial environments. We thusfelt it was necessary to have a well-documented censusof all enterprises in the research area from which wecould draw a random sample. Second, theoretically,the ultimate goal of the research was to understandthe environment for private sector activity at theprovincial level – this simply could not be done if 75%of the active private sector was omitted because it wasconsidered informal by government standards, as2 See Appendix 1 for a list of the full set of indicators.
Cambodia PBES | 4
would have been the case in Banteay Meancheay.Furthermore, as important as it is to understand theconstraints faced by the registered sector, it is equallyimportant to understand why such a large portion ofprivate firms (accounting for 80% of Gross DomesticProduct (GDP) and 95% of employment)3 choose notto take the next steps in the formalization of theiractivities. Certainly, this will be best done in a panelsetting with yearly surveys of the same enterprises, butit cannot be done at all if they are eliminated from thestudy at the outset.
The second major difference between the PBES andearlier work on private sector activity in Cambodia isthat rather than extrapolating a few provincial-levelresults from a national-level sample, the research teamdrew 10 different provincial-level samples, so that ithad as accurate a picture as possible of the privatesector. To do this, the team performed a detailedcensus of private sector operation in the capital andthe three other major population centers of all theprovinces and municipalities. First, the 10 mosteconomically important provinces were selected,including, arguably, all of Cambodia’s main economiccenters. Collectively, these provinces represent 75%of GDP and 64% of the Cambodian population.4 Whilethe goal is to eventually extend the PBES analysis toall provinces; in this inaugural year, the decision wasmade to concentrate on provinces with relatively robusteconomies. Next, researchers traveled to each of the10 provinces to undertake a complete census ofbusiness activity. Every business operation in a fixedlocation was considered an active enterprise for ouranalysis. In total, 41,775 business operations wereidentified. After excluding all enterprises with less thanone employee other than the owner, a stratified randomsample was drawn from the lists generated by thecensus. Strata were defined by the number ofemployees (five different categories) and the sector inwhich the firms operate (services, manufacturing andconstruction, and commerce) for a total of 15 differentstrata. Random selection within these strata ensuredthat the sample would be reliable representation ofthe provincial populations. The result of thesemethodological choices is a far more accuraterepresentation of provincial-level business activity thanhas been put together thus far in Cambodia.
1.3. The Provincial Business Environment Scorecard
The final results of the PBES can be seen in Figure 1below. The Eastern border provinces of KampongCham and Svay Rieng top the list, followed by KampongChhnang and Kampot. Kandal, a province encirclingthe capital city of Phnom Penh, along with BanteayMeanchey and Battambang in the Northwest alongthe Thai border, rank sixth and seventh respectively.The PBES found that governance is weakest in PhnomPenh, Siem Reap, and Sihanoukville. Individual scorescan also be seen in Table 1.
Siem Reap’s placement near the bottom of the listmay come as a surprise to anyone familiar with thelarge investment and growth in the hotel and touristindustry in the province. Those who have worked there,however, may be less surprised by Siem Reap’sespecially low scores on Entry Costs, Transparency,Crime Prevention, Proactivity, and Taxes. Like naturalresource rich economies who suffer from the well-known “resource curse,” where heavy rent-seeking foraccess to oil, lumber, and minerals leads to corruptionand officials who have a little incentive to improvegovernance,5 Siem Reap may suffer from ananalogous issue related to its tourist potential. SiemReap’s government officials do not have to try as hardas their peers from other provinces to improve theeconomic situation. Because the Angkor templecomplex is located within their borders, they are virtuallyguaranteed a greater flow of tourist dollars and serviceactivity than their neighbors. Indeed, Siem Reap hasthe highest GDP per capita outside of Phnom Penhand the PBES survey revealed that its firms enjoyedthe highest growth in labor and investment over thepast year, while ranking second only to Kampong Chamin willingness of entrepreneurs to expand theirbusiness. Nevertheless, it is interesting to note thatwith just small efforts to improve its governance, SiemReap could grow even faster.
3 Development Consulting International, 2003, p. 10.
4 Author’s own calculation based on Cambodian StatisticalYearbook 2004.
5 Ross, Michael, 2001a. Timber Booms and InstitutionalBreakdown in Southeast Asia. New York; CambridgeUniversity Press. Ross, Michael, 2001b. “Does oil hinderdemocracy?” World Politics 53: 325-361. Sachs, Jeffreyand Andrew Warner, 1995. “Natural resource abundanceand economic growth.” National Bureau of EconomicResearch Working Paper No. 5398.
Cambodia PBES | 5
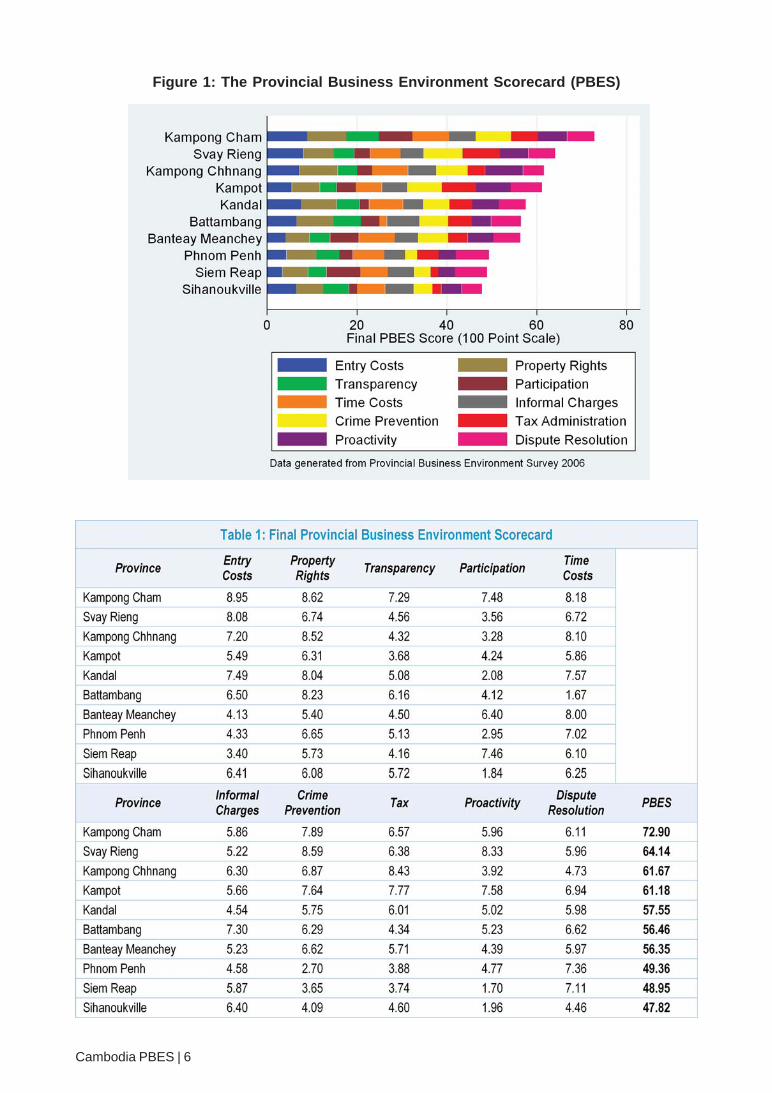
Figure 1: The Provincial Business Environment Scorecard (PBES)
Cambodia PBES | 6
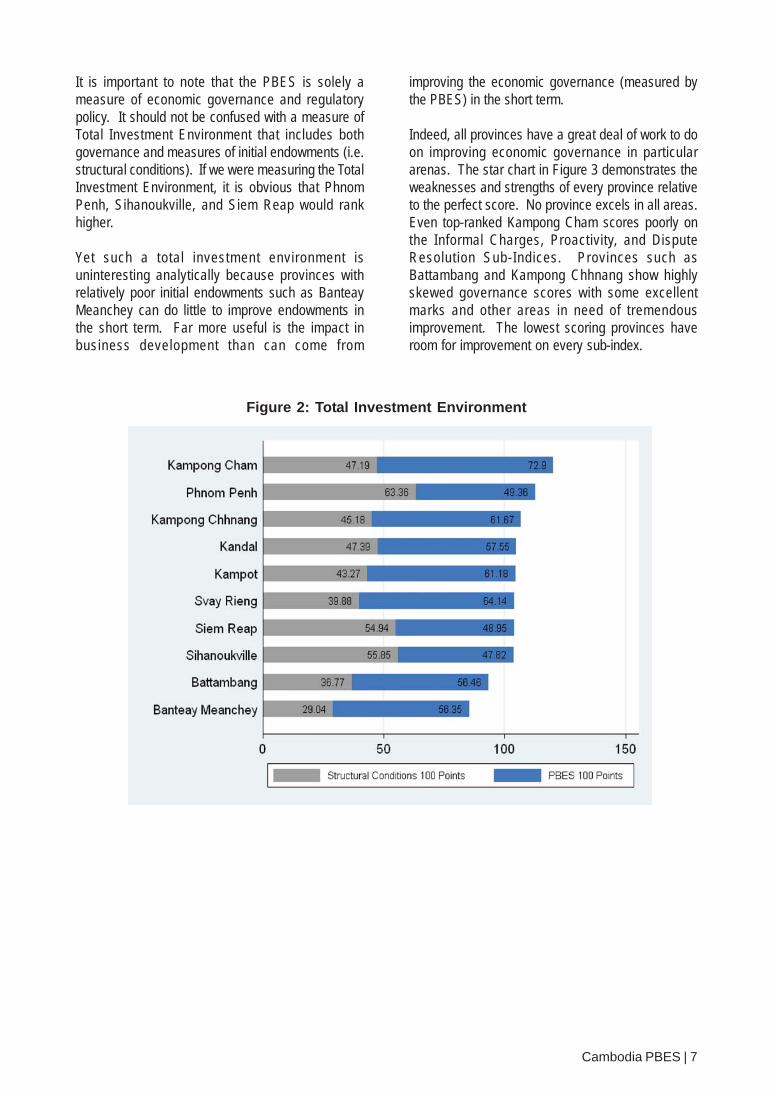
It is important to note that the PBES is solely ameasure of economic governance and regulatorypolicy. It should not be confused with a measure ofTotal Investment Environment that includes bothgovernance and measures of initial endowments (i.e.structural conditions). If we were measuring the TotalInvestment Environment, it is obvious that PhnomPenh, Sihanoukville, and Siem Reap would rankhigher.
Yet such a total investment environment isuninteresting analytically because provinces withrelatively poor initial endowments such as BanteayMeanchey can do little to improve endowments inthe short term. Far more useful is the impact inbusiness development than can come from
Figure 2: Total Investment Environment
improving the economic governance (measured bythe PBES) in the short term.
Indeed, all provinces have a great deal of work to doon improving economic governance in particulararenas. The star chart in Figure 3 demonstrates theweaknesses and strengths of every province relativeto the perfect score. No province excels in all areas.Even top-ranked Kampong Cham scores poorly onthe Informal Charges, Proactivity, and DisputeResolution Sub-Indices. Provinces such asBattambang and Kampong Chhnang show highlyskewed governance scores with some excellentmarks and other areas in need of tremendousimprovement. The lowest scoring provinces haveroom for improvement on every sub-index.
Cambodia PBES | 7

Figure 3: Star Chart of Provincial Scores on Each Sub-Index
1.4. The Impact of Provincial Business Environments
While some of these changes may be time consumingand perhaps politically difficult to accomplish,improved governance will almost certainly have animmediate effect on the business development in theregion. Statistical analysis of the PBES indicatorsbears this out. Controlling for firm-level variables suchas age, sector, size, and costs, and the provincial-levelfactors of infrastructure and tourist attraction potential,it can be shown that a one-point improvement on thePBES index from the mean score of 56.30 would leadto a 1.20% increase in the probability of firm expansion.Thus, a one standard deviation improvement (7.27points) from the mean would generate a predicted8.20% increase in the probability that existing firmswill expand their businesses over the next two years.6
To make this more tangible, if Battambang (given itsexisting infrastructure, tourist potential, and humancapital) were to improve from its present PBES score(56.46 ) to the level of Kampong Cham (72.90), it couldexpect nearly a 17% improvement in the willingnessof existing firms to expand their businesses in the future.
Table 2 takes this one step further by looking at therelationship between governance and willingness toexpand in the manufacturing sector – thought to be afuture source of growth in Cambodia due to its laborcost advantages.7 On average, there is statistically nodifference between the willingness of firms engagedin manufacturing and construction (63.60%) to expandtheir business than firms in other industries (62.50%).This relationship changes drastically, however, if welook at the options for manufacturing firms in well-governed provinces (defined as provinces with a totalPBES score of 59 points or above). Here, we find thatin provinces with low PBES scores, manufacturingfirms are more reluctant to expand their businessesthan firms in other industries (53% to 58%). In provinceswith high PBES scores, however, both types of firmsenvision significant expansion over the next two yearswith manufacturing far more likely than their peers incommerce or services (73% to 67%). The results arequite striking: the predicted impact of manufacturingexpansion will be most pronounced in well-governedregions.
6 Derived from a firm-level regression with standard errors clustered atthe provincial level using Survey Question B_8, “Which statementbest characterizes your firm’s investment plans over the next twoyears?” Please see Appendix 2A for more details on regression androbustness analysis.
7 World Bank 2004b; Mohan, T. 2005. “SMEs can be the Drivers ofCompetitiveness in Cambodia.” Cambodian Review, August, p. 10.
Cambodia PBES | 8

Of course, a simple willingness to expand can bemisleading due to the sometimes irrational optimismof many entrepreneurs. A more realistic measure ofthe impact of governance on firm expansion is theactual percentage of employees each firm has addedto the labor force over the past year. Once again, wefind that governance is quite influential. A one-pointincrease in PBES from the mean score would likelyyield a 2.39% increase in average firm employment.8
Thus, if Banteay Meanchey were to improve its existingPBES score of 56.35 to the level of Kampong Chhnang(61.67) without changing its infrastructure or humancapital, it could expect firms within its border to increasetheir employment by 12.70% on average. Indeed, suchan improvement would be a much easier short-termgoal to accomplish than Banteay Meanchey raising,for example, its provincial literacy rate from 62% to theKampong Chhnang level of 88%, which would yield apredicted 9.36% increase in labor growth per firm.
8 Derived from a firm-level regression with standard errors clustered atthe provincial level using three survey questions: [Q7_7a (Number ofPermanent Employees Hired 2006) – Q7_7b (Number of PermanentEmployees Fired 2006)]/ Q6a_b (Number of Permanent Employees in2005)]. Please see Appendix 2B for more details on regression androbustness analysis.
Figure 4 demonstrates the results of the interactionbetween governance and literacy on net firm hires,controlling for other firm and provincial-level factors.Additional hiring in firms is strongly related toimprovements in literacy in both high and low scoringprovinces. Indeed, the slopes of the two lines areroughly the same indicating that a 10-pointimprovement in literacy would have about the same5% increase in labor growth in both types of provinces.But if we take literacy as given, we can see that at eachliteracy level, firms in well-governed provinces hiredmore workers on average than those in lowerperforming regions, controlling for other factors. At the60% literacy rate, for example, a province with a lowPBES score would have experienced a 50% increasein employment on average, whereas a well-governedprovince would have experienced a 62% increase inemployment.
Figure 4: PBES and Literacy Rates on Firm Labor Growth
Cambodia PBES | 9

Cambodia PBES | 10
For provincial officials wishing to prioritize their reforminterventions, Table 3 demonstrates that improvementsin Entry Costs, Property Rights, Transparency(specifically access to regulatory information),Participation, Informal Charges, and Crime Preventionplay the largest role in explaining labor growth.Provincial officials are advised to concentrate onpolicies that will improve these indicators first beforeconcentrating on the others. Increasing performanceon informal charges alone will yield a potential 21%increase in firm labor for every one-point improvement.Simply improving the availability of information onregistration and licensing would generate a potential8% average growth in firm level employment.
1.5. Conclusions
This summary has tried to demonstrate three criticalpoints:
1. Provincial governance, as measured by thePBES, differs drastically across thedifferent regions of Cambodia;
2. All provinces, no matter how high theirscores, have room for improvement; and
3. Any governance improvements couldgenerate a large impact on provincialbusiness expansion and employment, buta few key areas will yield enormous returns.
Section 2 documents how each of the PBES sub-indices was created and how the final scores wereassembled into the PBES. Provincial leaders will bebest served by paying careful attention to the indicatorsthat comprise each index, as they offer the most vividportrayal of where they can target their policy initiativesfor improvement. The section concludes with ananalysis of the impact of individual sub-indices on laborgrowth.
Section 3 provides a detailed methodologicaldiscussion of the various phases of the PBES researchprogram.
Section 4 discusses potential areas for additionalresearch and technical assistance projects.
9 Appendix 3 shows the full regressions that generated these results.
Sub-Indices of the PBES


2. Sub-Indices of the PBES
2.1. Entry Costs
The Entry Costs Sub-Index draws upon widespreadand extensive research which indicates that starting abusiness anywhere in Cambodia can be difficult,expensive and time consuming.10 Because businessentry is so complicated, we divided this sub-index intotwo dimensions, capturing: 1) the length of waitingperiods and the number of required documents andprocedures involved with starting a business; and 2)the official expense of acquiring each requireddocument. The final results from this sub-index areshown in Figure 5 below. Answers were re-scaled, sothat the shortest wait and lowest expense paymentswere re-coded as 10, while the most cumbersomeand expensive environments received a 1. In otherwords, the best-performing provinces get the highestscores. Using our approach, Kampong Cham has thelowest entry costs, while Siem Reap has the mostburdensome procedures and costs.
Developing a simple gauge of Entry Costs in theCambodian context was difficult for two main reasons.
First, depending on their level of formalization, differentfirms confront varying start-up procedures. Using itsspecific methodology for limited liability companies inthe national capital, the World Bank documented atleast 10 separate steps that an entrepreneur mustcomplete to turn a business idea into a legal enterprise.Moreover, the official fees required to start a businesswere calculated to be 236% of per capita income,which is 17 times more expensive than in neighboringVietnam and places Cambodia’s business entry costsamong the highest in the world.11 However, most firmsin Cambodia do not meet the rigid criteria used in theWorld Bank’s Doing Business report. Indeed, only 15of the 500 firms in our sample had a registrationcertificate from the Ministry of Commerce, and almost300 (or 59%) lacked the common one-year provincialcertificate that is often issued in lieu of full registrationbut that does not establish clear legal authority.12 Whenasked both in focus groups and the survey why theyhave not registered, most firms cited their small sizeand unnecessary registration costs, which more oftenthan not also invite unwanted attention from the taxauthorities.
The Asian Development Bank (2003) and Chandararot,Salze-Lozac’h, and Dannet (2006) recognize that the
vast majority of Cambodian firms do not meet the DoingBusiness criteria and analyze in detail other activitiesthat firms must undertake. Table 4 summarizes thefive levels of formalization identifiable in the Cambodianbusiness context: 1) Fully Formal – National Level; 2)Fully Formal – Provincial Level; 3) Unregistered with
10 Development Consulting International, 2003, p. 55-64; World Bank,2004a, p. 12-14; World Bank, 2004b, p. 17; Chandarrot and Dannet,2006.
11 World Bank, 2007a, p. 102.
12 Development Consulting International, 2003, p. 55.
Figure 5: Entry Costs Sub-Index
Cambodia PBES | 13

an Operating License; 4) Possession of Patent Tax;and 5) Fully Informal. Because each of the five levelsinvolves different interactions with provincialauthorities and varying waiting periods, it wasimportant that the Entry Costs Sub-Index incorporatethese nuances by considering the opportunity costsof detailed procedures on businesses while notpenalizing provinces for implementing national lawsthat require documentation.
A second obstacle to proper measurement of EntryCosts is that many firms do not actually experience
these bureaucratic waiting periods directly. In the PBESsample, 32% of the firms hired facilitators to handlebusiness registration activities on their behalf. In themajority of cases, the facilitator was an employee of alocal government agency; other firms hired familymembers or individuals who did not work for thegovernment. Because facilitators took care of allpaperwork, these enterprises could not always answerdetailed questions about the waiting periods or aboutthe official costs of obtaining documents.Consequently, firms that used facilitators were askedonly whether they possessed specific documentation.
Cambodia PBES | 14

They were not invited to answer detailed questionsabout the cost of business registration activities.
2.1.1. Waiting Periods and Procedures
The Waiting Periods Dimension consists of fivedifferent measures, each one re-scaled to 10 points.13
It is a composite measure of the time burden involvedfor a firm to become a legal enterprise.
• The percentage of fully formal enterprises(national or provincial) is the first measure ofprocedural costs. The key assumption of thisindicator is that if more firms have taken allnecessary steps to become fully legal, then theprovincial administration can be consideredmore encouraging toward formalization andensuring the ease of procedures. Before usingthis indicator, diagnostic checks by the researchteam confirmed that variation in registration wasnot determined by differences in the average sizeof businesses or manufacturing firms at theprovincial level – rather, the measure is primarilyan indicator of bureaucratic procedures.14
• The percentage of firms in the province requiringless than five formal documents (including allregistrations, licenses, and permits) to start theirbusiness. This measure captures the numberof bureaucratic steps that are required for a firmto be fully legal in each province. Most firms inthe PBES survey actually needed to completeonly a few steps. Though fully formal enterprisesrequired slightly more documentation, the burdenimposed by the number of procedures theyneeded to complete was still not that large. 10%of fully formal enterprises needed more than fivedocuments, as opposed to only 1% of those atlower levels of formalization.
The next three indicators measure the median waitingperiod required to obtain the three most common typesof firm documentation. Only firms that had completedthe necessary procedures themselves and possessedthe actual document were eligible to answer thequestions. These three indicators are:
• Median waiting period for Registration Certificatefrom the Provincial/Municipal Department ofCommerce.
• Median waiting period for a One-Year OperatingLicense from the relevant provincial departmentfor a firm’s products or services.
• Median waiting period for Patent Tax registrationfrom Local (Provincial/Municipal) Tax Authority.
Table 5 summarizes individual provincial scores andthe final Entry Costs’ Waiting Periods/ProceduresDimension. As can be seen, Kampong Cham and SvayRieng perform the best for these indicators, while SiemReap and Banteay Meanchey, which require the mostcumbersome entry procedures, rank at the bottom.
2.1.2. Monetary Costs of Business Entry
This is a composite measure of the official costsrequired for a firm to become a fully legal enterprise.The Money Dimension consists of five differentmeasures, each one re-scaled to 10 points.
The first three indicators measured the median costscharged to firms for obtaining the three most commontypes of firm documentation. As mentioned above, onlyfirms that had completed the procedures themselvesand possessed the actual document were eligible toanswer the questions. Though the research teamlabeled these indicators as “official” costs, this is aeuphemism. Although the registration fees are set bynational law that does not allow for provincial variation,in reality the variation is quite high. While the officialfee for a provincial registration certificate should be$10, the median fees charged to firms varied from $2.25in Kampong Cham to $35 in Phnom Penh.15 Thus,“official” fees almost certainly include additionalinformal charges levied by provincial officials, whomight be taking advantage of the ignorance of theirclients. When the PBES research team askedprovincial officials for verification of the official feescited by firms, the appropriate departments in eachprovince and municipality claimed they did not havethe necessary information.
13 Re-scaling uses the following formula, in which Province1 is the individual
provincial value, minimum is the smallest provincial value in the sample,and maximum is the largest provincial value in the sample.
Pr9* 1iovince Minimum
Maximum Minimum
−⎡ ⎤ +⎢ ⎥−⎣ ⎦For some calculations, a large number has a negative interpretation.In these cases, we reverse the index by subtracting the entire quantityfrom 11.
Pr11 9* 1iovince Minimum
Maximum Minimum
⎡ ⎤−⎡ ⎤− +⎢ ⎥⎢ ⎥−⎣ ⎦⎣ ⎦
14 Bivariate Correlations with the percentage of fully formal firms are:0.21 with the provincial average of total assets; 0.25 with employmentsize, and 0.35 with the percentage of manufacturing firms. None aresignificant at the 10% level.15 World Bank, 200a, p. 12.
Cambodia PBES | 15

• Official fee for Registration Certificate from theProvincial/Municipal Department of Commerce.
• Official fee for One-Year Operating License forfirm products or services from relevant provincialdepartments.
• Official fee for Patent Tax registration from Local(Provincial/Municipal) Tax Authority.
Official fees for firms’ legal documents were nevermeant to be a primary source of revenue for provincialadministrations. Instead, they are intended to reflectthe labor and material costs of processing suchdocumentation. Nevertheless, according to provincialbudget information, these fees comprise a healthy
portion of revenue in some provinces – ranging from atotal of 1.7% in Kampong Chhnang to 45% in SiemReap. The heavy reliance of provincial administrationson processing fees for revenue is a clear indication thatfirms are over-paying to formalize and subsidizing asignificant portion of provincial services. Consequently,two measures derived from provincial budgets offer auseful complement to official fees in the MoneyDimension of the Entry Costs Sub-Index. These are:
• Percentage of provincial revenue derived fromprocessing Patent Tax registration.
• Percentage of provincial revenue derived fromenterprise registration and stamps processing.16
16 Ministry of Economy and Finance, 2006.
Cambodia PBES | 16

17 De Soto, Hernando. 2000. The Mystery of Capital. New York: BasicBooks.
18 Chan, Sophal and Sarthi Acharya, 2002. “Facing the Challenge ofRural Livelihoods: A Perspective from Nine Villages in Cambodia.Cambodian Development Research Institute Working Paper 25, PhnomPenh, Cambodia.
19 Development Consulting International, 2003, p. 64-65.
Figure 6: Property Rights Sub-Index
Table 6 summarizes individual provincial scores andthe final Entry Costs’ Official Fees Dimension.Kampong Cham (9.40) and Kampong Chhnang (8.76)offer the lowest cost environments, while start-upprocedures prove most costly in Phnom Penh (2.85)and Siem Reap (3.96).
2.2. Property Rights
Hernando de Soto, a Peruvian economist,demonstrated the importance of land titles ineconomic development by pointing out that legalproperty rights encourage investment in fixedassets and that, by allowing the use of title land ascollateral, access to capital markets is enhanced.17
Recent research on Cambodia has demonstratedthat formal property rights still remain relativelyweak due to limited land ownership and titling. TheLand Law of 2001 developed a legal regime forproperty rights and laid forth a plan for systematic
land registration, which our data indicates hadprogressed admirably – 49% of the firms in oursamples possess full titles. Nevertheless, in manyprovinces implementation of these procedures hasbarely commenced, and in those where it has, itvaries greatly. Sophal and Acharya (2002) foundthat 20% of all rural households lacked any land atall, 25% owned less than ½ hectare, and 20%possessed between 1.2 and 1 hectare.18 An evensmaller percentage of land that is owned is officiallytitled. The Asian Development Bank (ADB)reported that as of April 2003, only 80,000certificates from a total target of 1 million had beenissued by provincial and/or municipal Departmentsof Land Management, Urban Planning, andConstruction.19 Figure 6 demonstrates thatKampong Cham is the leading province in termsof safeguarding general property rights, whilePhnom Penh and Siem Reap lag furthest behind.
Cambodia PBES | 17

2.2.1. Soft (Perceptions) Data
Five indicators are used to generate the survey-basedDimension 1:
• Percentage of provincial firms with anydocumentation regarding the ownership ofpurchased or household land. As with formalbusiness registration, the definition of land titlesis quite complicated; it involves four differentlevels of formality that are roughly equal to thesecurity of property rights offered by proper landtitles. These are summarized in Table 7 below.For the first indicator, we take the percentage offirms in each province that have any type ofdocumentation related to their land. In the PBESsample, 87% of firms operating on purchased orhousehold land have some documentation, butthis figure varies regionally, from 70% inSihanoukville to 96% in Battambang.
• Percentage of firms with Solid Titles to purchasedor household land. As Table 7 makes clear, onlySolid Titles offer the full range of property rightsthat DeSoto considers important for encourag-ing firms to invest and expand their business.For that reason, we also calculate the percent-
age of firms in each province that have the high-est level of security. Note that to prevent confu-sion over which type of title they possessed, firmswere shown photocopies of each of the relevantdocuments. Given recent literature on the pro-cess and the purported inefficiency of land ad-ministration offices, the number of firms gener-ated from our sample with Solid Titles turnedout to be a surprisingly high 49%. Clearly, thesystematic land registration put forth in the 2001Land Law is having some effect. The highestpossession of Solid Titles was found in Kampotand Kampong Cham.
• Percentage of firms that consider expropriationby provincial officials to be a frequent or constantrisk. Simple possession of a title is not enough ifthe government can still seize land that it deemsis necessary for local development projects orfor officials’ personal use. In the past, such
seizures have occurred regularly, with little or poorcompensation offered to local entrepreneurs.Focus group participants in Siem Reap andBattambang mentioned press coverage of suchactivities. The PBES survey, however, revealedvery little perception of expropriation risk. In most
Cambodia PBES | 18
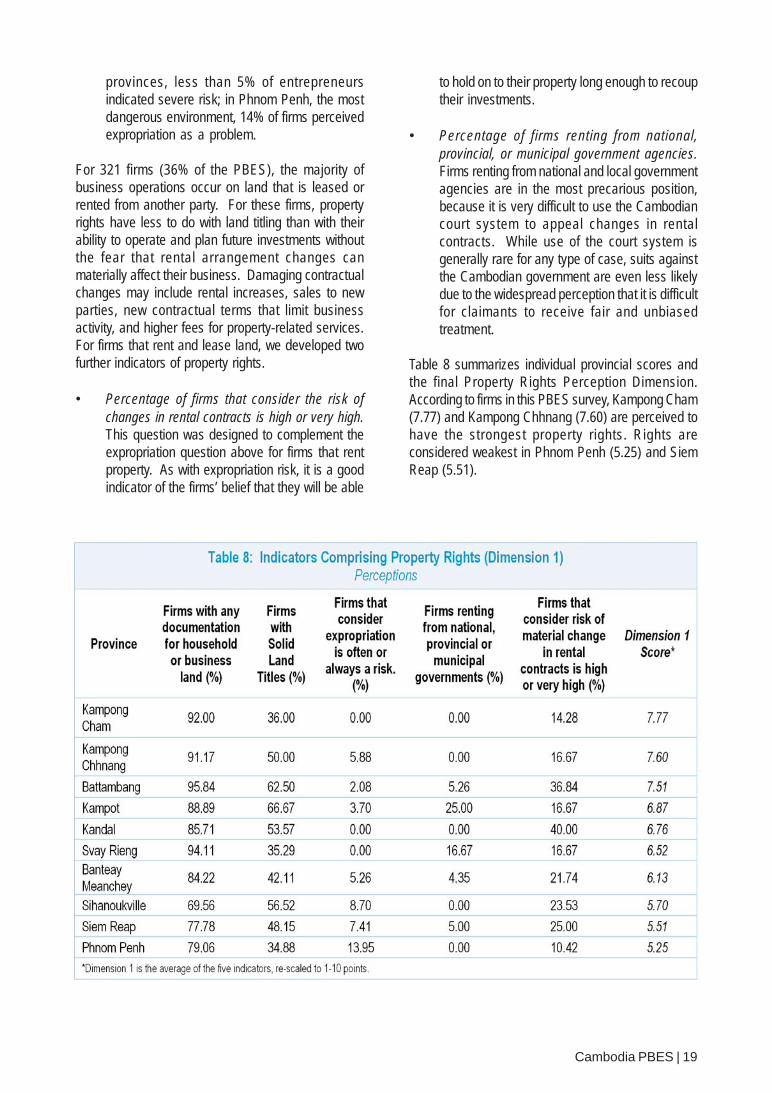
provinces, less than 5% of entrepreneursindicated severe risk; in Phnom Penh, the mostdangerous environment, 14% of firms perceivedexpropriation as a problem.
For 321 firms (36% of the PBES), the majority ofbusiness operations occur on land that is leased orrented from another party. For these firms, propertyrights have less to do with land titling than with theirability to operate and plan future investments withoutthe fear that rental arrangement changes canmaterially affect their business. Damaging contractualchanges may include rental increases, sales to newparties, new contractual terms that limit businessactivity, and higher fees for property-related services.For firms that rent and lease land, we developed twofurther indicators of property rights.
• Percentage of firms that consider the risk ofchanges in rental contracts is high or very high.This question was designed to complement theexpropriation question above for firms that rentproperty. As with expropriation risk, it is a goodindicator of the firms’ belief that they will be able
to hold on to their property long enough to recouptheir investments.
• Percentage of firms renting from national,provincial, or municipal government agencies.Firms renting from national and local governmentagencies are in the most precarious position,because it is very difficult to use the Cambodiancourt system to appeal changes in rentalcontracts. While use of the court system isgenerally rare for any type of case, suits againstthe Cambodian government are even less likelydue to the widespread perception that it is difficultfor claimants to receive fair and unbiasedtreatment.
Table 8 summarizes individual provincial scores andthe final Property Rights Perception Dimension.According to firms in this PBES survey, Kampong Cham(7.77) and Kampong Chhnang (7.60) are perceived tohave the strongest property rights. Rights areconsidered weakest in Phnom Penh (5.25) and SiemReap (5.51).
Cambodia PBES | 19

2.2.2. Hard Data
Two indicators are used to generate the data-basedDimension 2. These indicators were selected asproxies for the perception-based data on propertyrights.
Effective price of land in the province: High landprices, which are predominantly determined bythe demand for and supply of available land in aparticular area, limit the ability of entrepreneurs topurchase enough property to meet their expansionplans. A strong demand for business premisescan also drive property values up further, particularlywhen useful land is scarce. A regression modelthat controls for supply and demand can provideus with a residual that is the effective price of land.More specifically, the residual is the differencebetween the predicted price of land (from structuralconditions) and its actual price. Firms with negativeresiduals have under-priced land, while firms withpositive residuals have land that is more expensivethan what structural determinants would predict.What is left is the part of the land price that isaffected by government policy, especially by extracosts related to obtaining titles, the transparencyof land registries, and information regarding zoningpolicies. As one Phnom Penh firm commented,“If a title is urgently needed, a firm has to providemoney to government staff to get the title on time.”Some focus groups participants estimated thatthese extra costs can be as high as $1,000.
Table 9 presents the results from this regression,in which the team controlled for the number of firmscompeting for scarce land, the size of the province,and the proportion of manufacturing firms, who oftenneed larger spaces. Although in theory morecontrols could have been added, limited degreesof freedom prevented their use in this analysis.Already seven degrees of freedom and only 10observations require that we treat the pointestimates with caution and instead rely on the rank-ordering of the residual land costs of provinces.In short, Table 9 shows that land price is significantlyrelated to the number of firms in the province, thepercentage of firms in manufacturing, and theprovince’s surface area. As this is an ordinaryleast squares (OLS) analysis, coefficients can beread directly from the table. For instance, every100 firms in the province collectively add about$1.80 to the predicted price of land. All told, thethree variables explain about 73% of variance inthe price of land. The unexplained 27% of thevariance is caused by other factors which wecapture in the residual land price.
These residuals are shown in column 3 of Table10. Provinces with negative scores haveundervalued land because of demand conditions,while provinces with positive scores tend to haveprices that are higher than what would bepredicted, due to demand and supply conditions.Land appears to be most egregiously overvaluedin Sihanoukville and Banteay Meanchey.
Cambodia PBES | 20
Nevertheless, due to the very low degrees offreedom in the analysis, some caution must betaken in interpreting the results too literally.
Tax revenue from land rental to firms in province perprovince: Once again, we use the provincial budgetdata to derive this hard indicator. We use the specificline item of income from rent in market and divide it bythe estimated percentage of total firms in the provincethat, based on the survey results, are renting from thegovernment. This indicator clearly depicts the proportionof provincial revenue that is derived from firms that rentfrom their local government. The highest rental burdenfaced by firms occurs in Kampot and Svay Rieng.
Table 10 summarizes individual provincial scores andthe final Land Access and Property Rights PerceptionDimension. Four provinces appear to have excellentscores – all above 9 – on the hard data dimension.These are Kandal, Battambang, Kampong Cham, andKampong Chhnang. Banteay Meanchey has thelowest score on the hard data dimension.
2.3. Transparency
Transparency is highlighted by academics anddevelopment practitioners as one of the most crucialfactors in determining how conducive differentenvironments are to private businesses.20 World Bankeconomists Tara Vishwanath and Daniel Kaufmandefine transparency as:
The increased flow of timely and reliableeconomic, social and political information aboutgovernment service provision, monetary andfiscal policy…Contrariwise, a lack oftransparency may be described assomeone….deliberately withholding access to,or misrepresenting, information or failure toensure that the information provided is ofadequate relevance and quality.21
A working measure of transparency should thereforeencompass the following four dimensions: access,
20 Kaufman, Daniel et al, 2002, ‘Governance Matters’, World Bank PolicyResearch Working Paper No. 2772, February, p. 5-7. Florini, Ann M.,1999, ‘Does the Invisible Hand Need a Transparent Glove? The Politicsof Transparency’, paper prepared for the World Bank Conference onDevelopment Economics, Washington, D.C., April; Tenev, Stoyan,Amanda Carlier, Omar Chaudry, and Quynh-Trang Nguyen, 2003,Informality and the Playing Field in Vietnam’s Business Sector,Washington, D.C: International Finance Corporation.
Cambodia PBES | 21
21 Vishwanath, Tara and Daniel Kaufmann, 1999, ‘TowardsTransparency and Finance and Governance’, World Bank Mimeofound at www.worldbank.org/wbi/governance/pdf/tarawish.pdf.
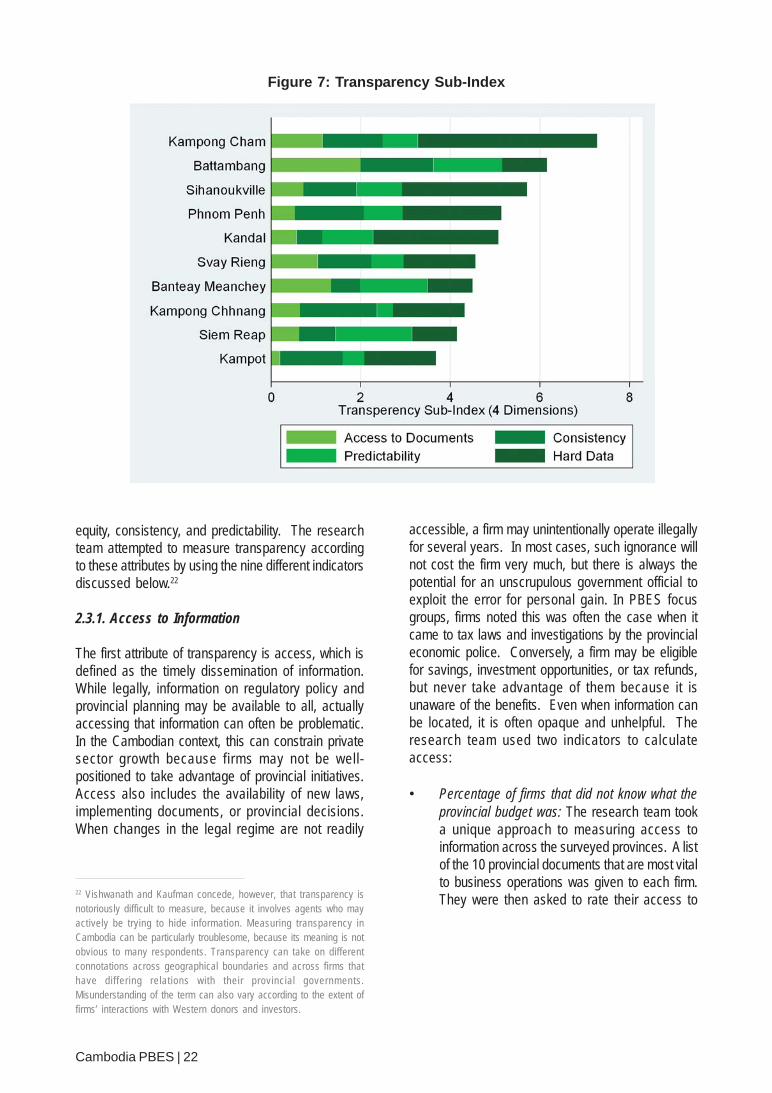
Figure 7: Transparency Sub-Index
equity, consistency, and predictability. The researchteam attempted to measure transparency accordingto these attributes by using the nine different indicatorsdiscussed below.22
2.3.1. Access to Information
The first attribute of transparency is access, which isdefined as the timely dissemination of information.While legally, information on regulatory policy andprovincial planning may be available to all, actuallyaccessing that information can often be problematic.In the Cambodian context, this can constrain privatesector growth because firms may not be well-positioned to take advantage of provincial initiatives.Access also includes the availability of new laws,implementing documents, or provincial decisions.When changes in the legal regime are not readily
accessible, a firm may unintentionally operate illegallyfor several years. In most cases, such ignorance willnot cost the firm very much, but there is always thepotential for an unscrupulous government official toexploit the error for personal gain. In PBES focusgroups, firms noted this was often the case when itcame to tax laws and investigations by the provincialeconomic police. Conversely, a firm may be eligiblefor savings, investment opportunities, or tax refunds,but never take advantage of them because it isunaware of the benefits. Even when information canbe located, it is often opaque and unhelpful. Theresearch team used two indicators to calculateaccess:
• Percentage of firms that did not know what theprovincial budget was: The research team tooka unique approach to measuring access toinformation across the surveyed provinces. A listof the 10 provincial documents that are most vitalto business operations was given to each firm.They were then asked to rate their access to
Cambodia PBES | 22
22 Vishwanath and Kaufman concede, however, that transparency isnotoriously difficult to measure, because it involves agents who mayactively be trying to hide information. Measuring transparency inCambodia can be particularly troublesome, because its meaning is notobvious to many respondents. Transparency can take on differentconnotations across geographical boundaries and across firms thathave differing relations with their provincial governments.Misunderstanding of the term can also vary according to the extent offirms’ interactions with Western donors and investors.
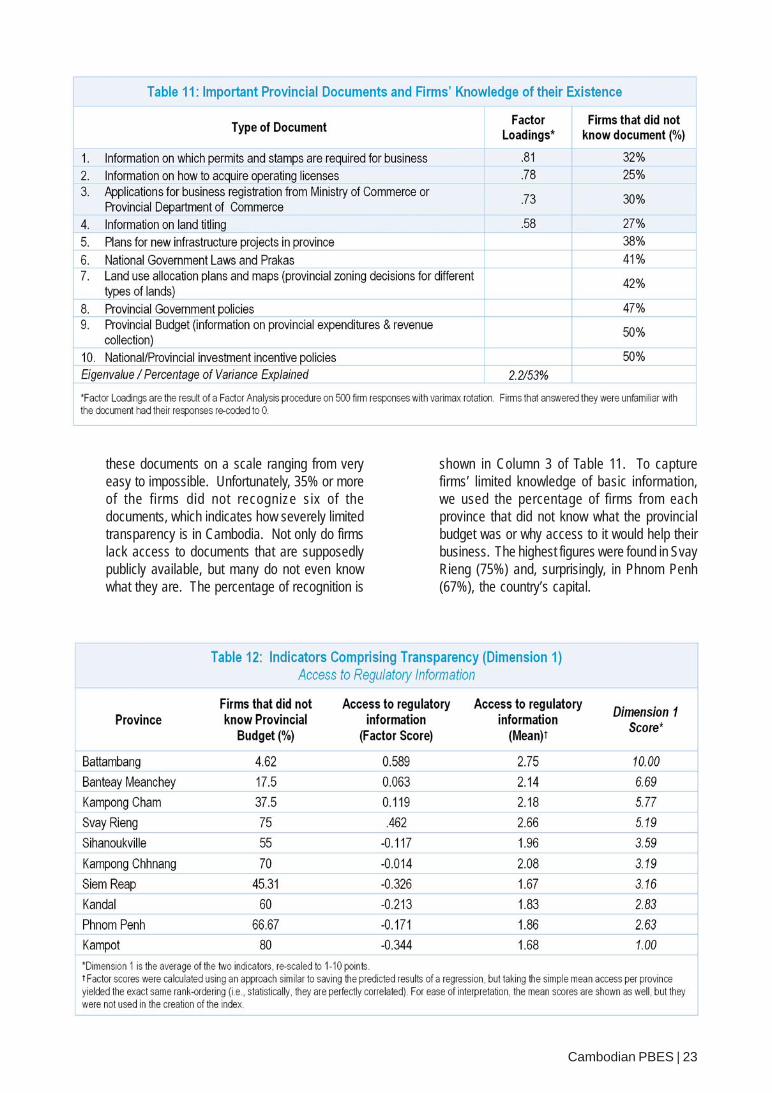
these documents on a scale ranging from veryeasy to impossible. Unfortunately, 35% or moreof the firms did not recognize six of thedocuments, which indicates how severely limitedtransparency is in Cambodia. Not only do firmslack access to documents that are supposedlypublicly available, but many do not even knowwhat they are. The percentage of recognition is
shown in Column 3 of Table 11. To capturefirms’ limited knowledge of basic information,we used the percentage of firms from eachprovince that did not know what the provincialbudget was or why access to it would help theirbusiness. The highest figures were found in SvayRieng (75%) and, surprisingly, in Phnom Penh(67%), the country’s capital.
Cambodian PBES | 23

• Access to regulatory information: All fourdocuments that were recognizable to the sampleof firms were related to the provision of regulatoryinformation. The research team then performeda factor analysis on these documents to see howclosely they are related. Factor analysis is aprocedure for reducing several highly correlatedvariables to a single variable. The loadings arethe bivariate correlation between each of thedifferent documents and the unobserved latentvariable, which can be thought of as a generalmeasure of access to all regulatory information.The loadings are all quite high, which indicatesthat the provinces that do a good job of providingone of these documents also do a good job ofproviding the others. This simple fact allows usto calculate factor scores for each province,which represent overall access to regulatorydocuments. The result of the analysis was onefactor (or basket) of documents that had verystrong correlations with each other (shown bythe Shaded Factor Loadings in Column 1 ofTable 11).
Table 12 summarizes the results on the first dimension.According to firms, Battambang has the highest accessto documentation with a perfect score of 10. Whilethis means that Battambang performs the best in thesample, it does not, however, mean that Battambanghas achieved perfect access – there is still room forimprovement. Kampot, in which nearly 80% of firmsdid not recognize what the provincial budget was,
received a score of 1, indicating an urgent need forimprovement.
2.3.2. Equity and Consistency of Application
While the two indicators above capture access to thedocuments, they do not necessarily represent equitableaccess, the lack of which can result in the inefficientuse of provincial resources. Such inefficiencies canconstitute more than a simple transfer of resourcesfrom one party to another. Take, for instance, theexample of provincial planning. The beneficial impactof infrastructure and land conversion plans on theoverall province is limited if their details are availableto only a select few insiders. The firms that can accessprovincial documents may only be able to do so byexploiting favored connections to provincialgovernment officials. A follow-up question thereforesought to measure different aspects of equitableaccess in the transparency sub-index. Two variablesused to capture equitable access were:
• Access dependent on a relationship withprovincial government measured the percentageof firms that considered a connection withsomeone in the provincial government to beimportant or very important in facilitating accessto the above documents.
• The percentage of firms that agreed or stronglyagreed that favoritism toward firms with politicalconnections is an obstacle to their business.
Cambodia PBES | 24

2.3.3. Predictability of Laws and Policies
The third dimension of transparency is predictability,or the notion that national laws and regulations areimplemented in a consistent and foreseeable manneracross the provinces. One important role of provincialgovernment officials is to adequately inform firms aboutchanges in central laws or in the implementation ofthose laws. Three indicators were used to capturewhether firms understand how provincial decisions aremade and how they will be implemented, so that theycan gauge the direction of long-term strategies and findit easier to make informed investment decisions. Table14 demonstrates that most firms in Cambodia arepoorly informed about national laws. KampongChhnang, Kampot, and Svay Rieng rank lowest in thesample when it comes to information provision, but nosingle province excels in this dimension. Table 14summarizes the score for these indicators, which areas follows:
• How often do representatives from the provincialgovernor’s office or province meet with you andother private domestic businesses to discusschanges in laws or polices? (% Seldom or Never)
• How informed are you about new rules, laws, andregulations that are related to economics andfinance and/or that materially affect yourbusiness? (% Not at all or Poorly)
• How often do you receive advance notice aboutchanges in central government laws? (% Seldomand Never)
2.3.4. Hard Data
The final dimension of transparency is derived fromour own test for provincial information provision. Ratherthan relying solely on the perceptions of individual firms,the PBES research team traveled to all 10 of the sampleprovinces and, posing as private entrepreneurs,attempted to access applications for and informationabout registration (from the Provincial Department ofCommerce) and operating licenses (from theProvincial Department of Industry, Mines, & Energy).We recorded the transparency of information from thedepartments on the following four-point scale (from 4being good to 1 being bad):
4. Information is posted and applications arereadily available without having to contact anofficial.
3. Information is clearly posted, but applicationsmust be requested from an official.
2. Both information and application requirerequests to an official.
1. Requests that were made did not yieldinformation or applications.
Cambodia PBES | 25
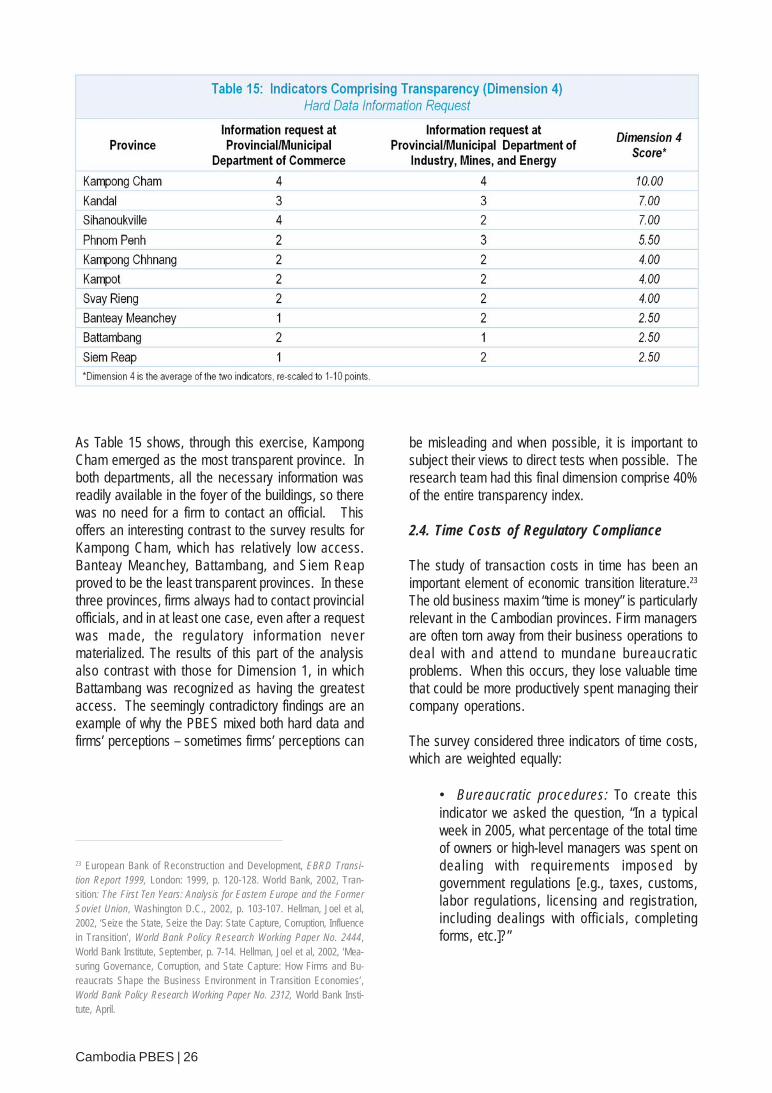
As Table 15 shows, through this exercise, KampongCham emerged as the most transparent province. Inboth departments, all the necessary information wasreadily available in the foyer of the buildings, so therewas no need for a firm to contact an official. Thisoffers an interesting contrast to the survey results forKampong Cham, which has relatively low access.Banteay Meanchey, Battambang, and Siem Reapproved to be the least transparent provinces. In thesethree provinces, firms always had to contact provincialofficials, and in at least one case, even after a requestwas made, the regulatory information nevermaterialized. The results of this part of the analysisalso contrast with those for Dimension 1, in whichBattambang was recognized as having the greatestaccess. The seemingly contradictory findings are anexample of why the PBES mixed both hard data andfirms’ perceptions – sometimes firms’ perceptions can
be misleading and when possible, it is important tosubject their views to direct tests when possible. Theresearch team had this final dimension comprise 40%of the entire transparency index.
2.4. Time Costs of Regulatory Compliance
The study of transaction costs in time has been animportant element of economic transition literature.23
The old business maxim “time is money” is particularlyrelevant in the Cambodian provinces. Firm managersare often torn away from their business operations todeal with and attend to mundane bureaucraticproblems. When this occurs, they lose valuable timethat could be more productively spent managing theircompany operations.
The survey considered three indicators of time costs,which are weighted equally:
• Bureaucratic procedures: To create thisindicator we asked the question, “In a typicalweek in 2005, what percentage of the total timeof owners or high-level managers was spent ondealing with requirements imposed bygovernment regulations [e.g., taxes, customs,labor regulations, licensing and registration,including dealings with officials, completingforms, etc.]?”
23 European Bank of Reconstruction and Development, EBRD Transi-tion Report 1999, London: 1999, p. 120-128. World Bank, 2002, Tran-sition: The First Ten Years: Analysis for Eastern Europe and the FormerSoviet Union, Washington D.C., 2002, p. 103-107. Hellman, Joel et al,2002, ‘Seize the State, Seize the Day: State Capture, Corruption, Influencein Transition’, World Bank Policy Research Working Paper No. 2444,World Bank Institute, September, p. 7-14. Hellman, Joel et al, 2002, ‘Mea-suring Governance, Corruption, and State Capture: How Firms and Bu-reaucrats Shape the Business Environment in Transition Economies’,World Bank Policy Research Working Paper No. 2312, World Bank Insti-tute, April.
Cambodia PBES | 26
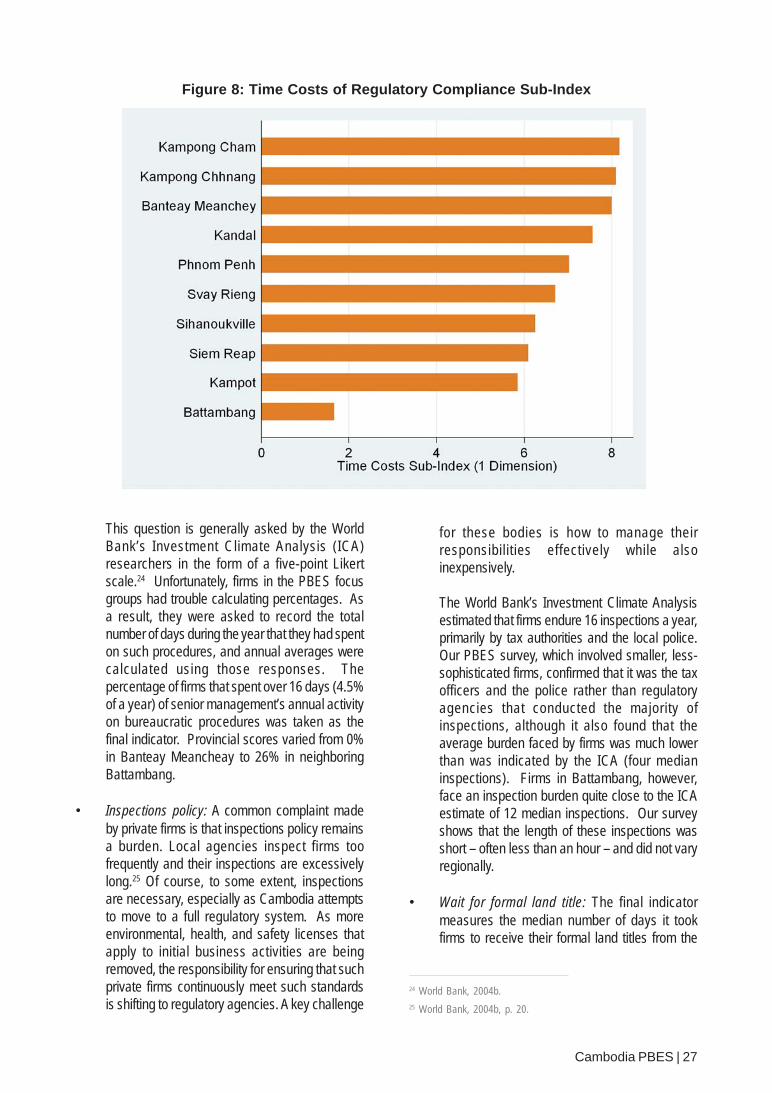
Figure 8: Time Costs of Regulatory Compliance Sub-Index
This question is generally asked by the WorldBank’s Investment Climate Analysis (ICA)researchers in the form of a five-point Likertscale.24 Unfortunately, firms in the PBES focusgroups had trouble calculating percentages. Asa result, they were asked to record the totalnumber of days during the year that they had spenton such procedures, and annual averages werecalculated using those responses. Thepercentage of firms that spent over 16 days (4.5%of a year) of senior management’s annual activityon bureaucratic procedures was taken as thefinal indicator. Provincial scores varied from 0%in Banteay Meancheay to 26% in neighboringBattambang.
• Inspections policy: A common complaint madeby private firms is that inspections policy remainsa burden. Local agencies inspect firms toofrequently and their inspections are excessivelylong.25 Of course, to some extent, inspectionsare necessary, especially as Cambodia attemptsto move to a full regulatory system. As moreenvironmental, health, and safety licenses thatapply to initial business activities are beingremoved, the responsibility for ensuring that suchprivate firms continuously meet such standardsis shifting to regulatory agencies. A key challenge
for these bodies is how to manage theirresponsibilities effectively while alsoinexpensively.
The World Bank’s Investment Climate Analysisestimated that firms endure 16 inspections a year,primarily by tax authorities and the local police.Our PBES survey, which involved smaller, less-sophisticated firms, confirmed that it was the taxofficers and the police rather than regulatoryagencies that conducted the majority ofinspections, although it also found that theaverage burden faced by firms was much lowerthan was indicated by the ICA (four medianinspections). Firms in Battambang, however,face an inspection burden quite close to the ICAestimate of 12 median inspections. Our surveyshows that the length of these inspections wasshort – often less than an hour – and did not varyregionally.
• Wait for formal land title: The final indicatormeasures the median number of days it tookfirms to receive their formal land titles from the
24 World Bank, 2004b.25 World Bank, 2004b, p. 20.
Cambodia PBES | 27
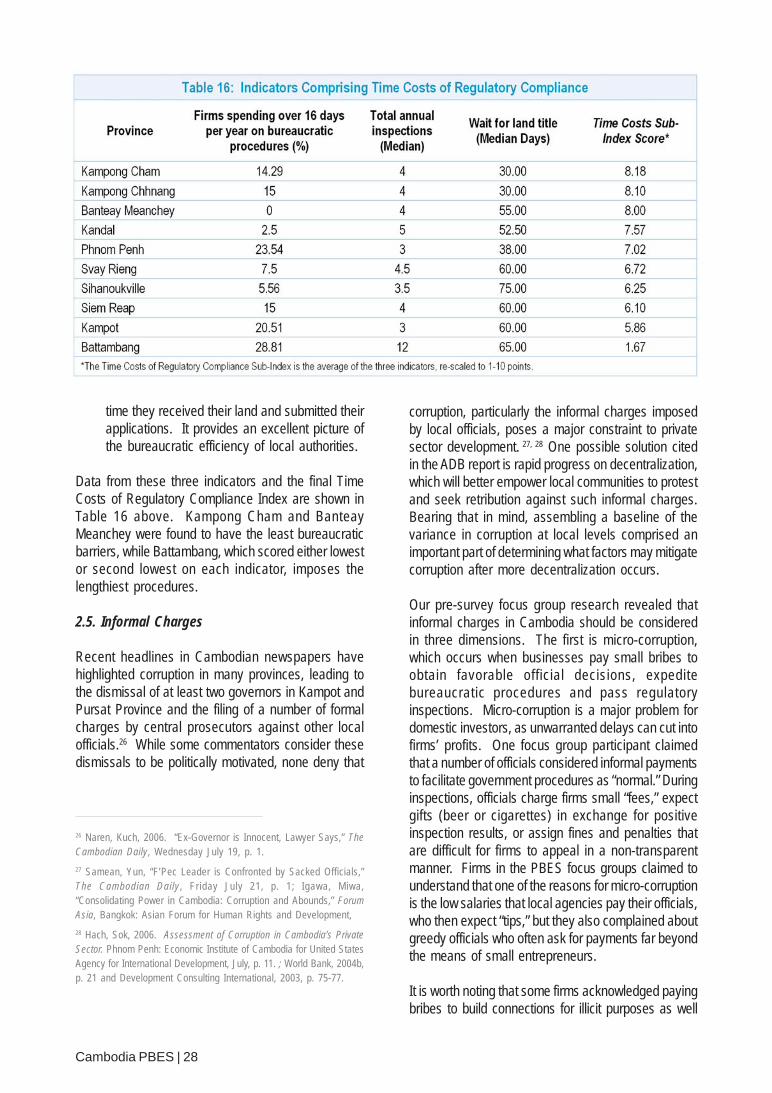
time they received their land and submitted theirapplications. It provides an excellent picture ofthe bureaucratic efficiency of local authorities.
Data from these three indicators and the final TimeCosts of Regulatory Compliance Index are shown inTable 16 above. Kampong Cham and BanteayMeanchey were found to have the least bureaucraticbarriers, while Battambang, which scored either lowestor second lowest on each indicator, imposes thelengthiest procedures.
2.5. Informal Charges
Recent headlines in Cambodian newspapers havehighlighted corruption in many provinces, leading tothe dismissal of at least two governors in Kampot andPursat Province and the filing of a number of formalcharges by central prosecutors against other localofficials.26 While some commentators consider thesedismissals to be politically motivated, none deny that
corruption, particularly the informal charges imposedby local officials, poses a major constraint to privatesector development. 27, 28 One possible solution citedin the ADB report is rapid progress on decentralization,which will better empower local communities to protestand seek retribution against such informal charges.Bearing that in mind, assembling a baseline of thevariance in corruption at local levels comprised animportant part of determining what factors may mitigatecorruption after more decentralization occurs.
Our pre-survey focus group research revealed thatinformal charges in Cambodia should be consideredin three dimensions. The first is micro-corruption,which occurs when businesses pay small bribes toobtain favorable official decisions, expeditebureaucratic procedures and pass regulatoryinspections. Micro-corruption is a major problem fordomestic investors, as unwarranted delays can cut intofirms’ profits. One focus group participant claimedthat a number of officials considered informal paymentsto facilitate government procedures as “normal.” Duringinspections, officials charge firms small “fees,” expectgifts (beer or cigarettes) in exchange for positiveinspection results, or assign fines and penalties thatare difficult for firms to appeal in a non-transparentmanner. Firms in the PBES focus groups claimed tounderstand that one of the reasons for micro-corruptionis the low salaries that local agencies pay their officials,who then expect “tips,” but they also complained aboutgreedy officials who often ask for payments far beyondthe means of small entrepreneurs.
It is worth noting that some firms acknowledged payingbribes to build connections for illicit purposes as well
26 Naren, Kuch, 2006. “Ex-Governor is Innocent, Lawyer Says,” TheCambodian Daily, Wednesday July 19, p. 1.
27 Samean, Yun, “F’Pec Leader is Confronted by Sacked Officials,”The Cambodian Daily , Friday July 21, p. 1; Igawa, Miwa,“Consolidating Power in Cambodia: Corruption and Abounds,” ForumAsia, Bangkok: Asian Forum for Human Rights and Development,
28 Hach, Sok, 2006. Assessment of Corruption in Cambodia’s PrivateSector. Phnom Penh: Economic Institute of Cambodia for United StatesAgency for International Development, July, p. 11. ; World Bank, 2004b,p. 21 and Development Consulting International, 2003, p. 75-77.
Cambodia PBES | 28

for as normal business activities. Such payments oftenenable businesses to receive advance warnings ofimpending police raids, engage in il legal orunauthorized behavior, and avoid paying higher taxes.
Macro-corruption, the second dimension, relates to briberequests made by higher ranking officials who areinvolved in the bidding for public procurement contracts.Such bribes are often assessed as a percentage of thecontract or quota amounts, and can reach a sum ofhundreds of thousands of dollars. Moreover, the biddingprocess tends to be unfair and stacked against firmsthat lack connections. A recent dispute between theWorld Bank and the Cambodian Government revolvedaround accusations of macro-corruption in someWorld Bank-funded infrastructure projects.29
A third dimension of informal charges measures thepredictability of corrupt actions. A wide range of literatureon corruption indicates that firms may consider informalcharges beneficial if these expedite bureaucraticprocedures and are predictable (i.e., enable firms tofactor bribe costs into their business plans and deliverthe expected results).30 While most firms in our focusgroups claimed that they could not predict extrapayments exactly, there was some consensus thatthreshold prices exist for most types of assistance fromprovincial officials. Any payment less than $5 for asmall firm or $20 for a larger firm would be too low to
29 British Broadcasting Corporation. 2006. “Corruption Curbs CambodianCash.” May 29, on-line edition.
30 World Bank, World Development Report 1997, Washington, D.C., p.172; Edgardo J. Campos, Donald Lien, and Sanjay Pradhan, “TheImpact of Corruption on Investment: Predictability Matters,” ElsevierWorld Development XXVII, vol. 27, issue 6, 1999, pp. 1059-1067;Johann Graf Lambsdorff, Johan Graf, 2002. “How Confidence FacilitatesIllegal Transactions: An Empirical Approach” The American Journal ofEconomics and Sociology, October. Lambsdorff’s questions were takenfrom a World Bank/University of Basel survey. Our questions arederivatives of these, which have been made more suitable to theCambodian context.
31 World Bank, 2004b, 15.
yield the desired outcome. Such charges are basedon the notion that firms network and, over time, learnfrom both their own and their peers’ experiences aboutwhat they are paying for, how much it should cost, and(most importantly) whether they will eventually receivethe service that they need. The World Bank’s ICA isskeptical of this view, demonstrating that servicedelivery did not improve for firms that paid extra fees.31
Our focus groups confirmed this finding, as firmscomplained that although they often paid bribes,officials did not try to solve their problems.
Figure 9: Informal Charges Sub-Index
Cambodia PBES | 29
2.5.1. Micro-Corruption
Three indicators measure the extent of the problemby gauging the frequency, type, and amount of extrapayments:
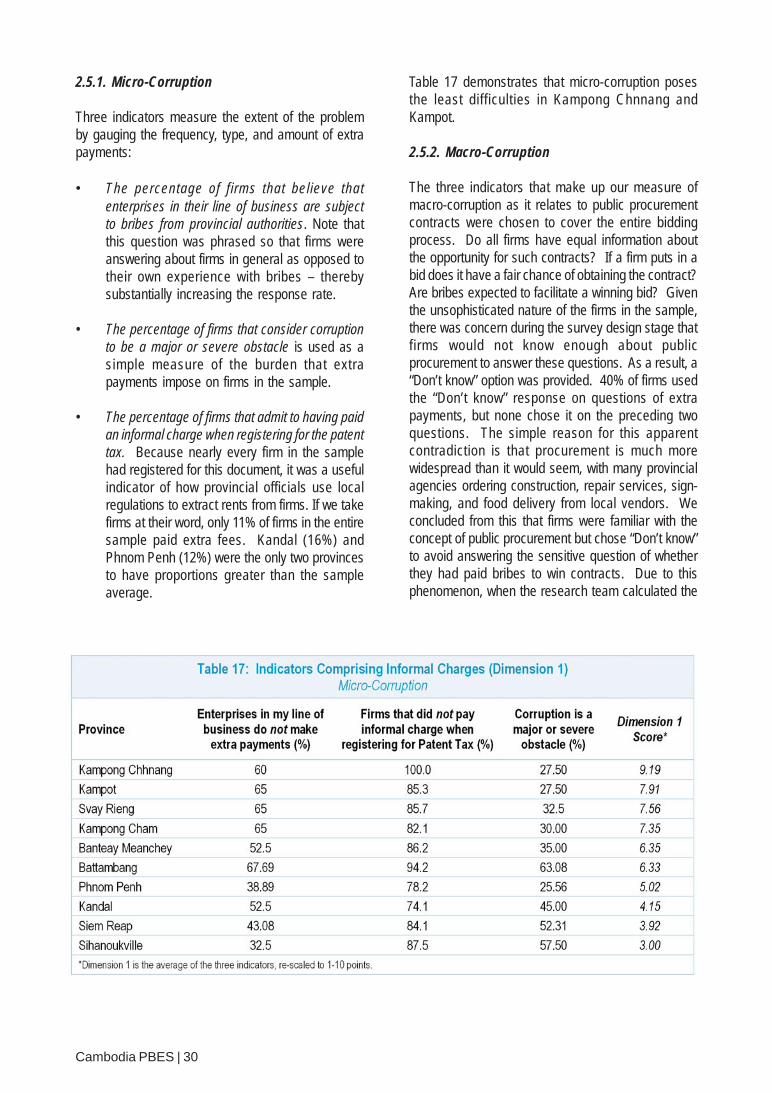
• The percentage of firms that believe thatenterprises in their line of business are subjectto bribes from provincial authorities. Note thatthis question was phrased so that firms wereanswering about firms in general as opposed totheir own experience with bribes – therebysubstantially increasing the response rate.
• The percentage of firms that consider corruptionto be a major or severe obstacle is used as asimple measure of the burden that extrapayments impose on firms in the sample.
• The percentage of firms that admit to having paidan informal charge when registering for the patenttax. Because nearly every firm in the samplehad registered for this document, it was a usefulindicator of how provincial officials use localregulations to extract rents from firms. If we takefirms at their word, only 11% of firms in the entiresample paid extra fees. Kandal (16%) andPhnom Penh (12%) were the only two provincesto have proportions greater than the sampleaverage.
Table 17 demonstrates that micro-corruption posesthe least difficulties in Kampong Chnnang andKampot.
2.5.2. Macro-Corruption
The three indicators that make up our measure ofmacro-corruption as it relates to public procurementcontracts were chosen to cover the entire biddingprocess. Do all firms have equal information aboutthe opportunity for such contracts? If a firm puts in abid does it have a fair chance of obtaining the contract?Are bribes expected to facilitate a winning bid? Giventhe unsophisticated nature of the firms in the sample,there was concern during the survey design stage thatfirms would not know enough about publicprocurement to answer these questions. As a result, a“Don’t know” option was provided. 40% of firms usedthe “Don’t know” response on questions of extrapayments, but none chose it on the preceding twoquestions. The simple reason for this apparentcontradiction is that procurement is much morewidespread than it would seem, with many provincialagencies ordering construction, repair services, sign-making, and food delivery from local vendors. Weconcluded from this that firms were familiar with theconcept of public procurement but chose “Don’t know”to avoid answering the sensitive question of whetherthey had paid bribes to win contracts. Due to thisphenomenon, when the research team calculated the
Cambodia PBES | 30
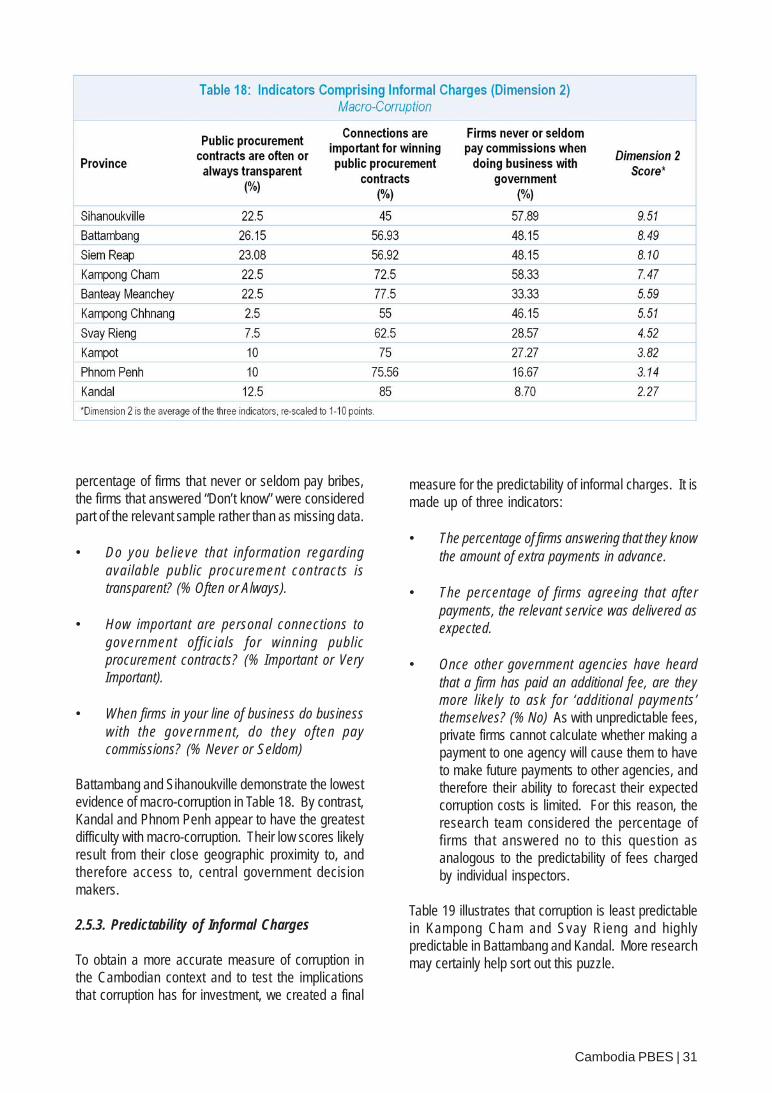
percentage of firms that never or seldom pay bribes,the firms that answered “Don’t know” were consideredpart of the relevant sample rather than as missing data.
• Do you believe that information regardingavailable public procurement contracts istransparent? (% Often or Always).
• How important are personal connections togovernment officials for winning publicprocurement contracts? (% Important or VeryImportant).
• When firms in your line of business do businesswith the government, do they often paycommissions? (% Never or Seldom)
Battambang and Sihanoukville demonstrate the lowestevidence of macro-corruption in Table 18. By contrast,Kandal and Phnom Penh appear to have the greatestdifficulty with macro-corruption. Their low scores likelyresult from their close geographic proximity to, andtherefore access to, central government decisionmakers.
2.5.3. Predictability of Informal Charges
To obtain a more accurate measure of corruption inthe Cambodian context and to test the implicationsthat corruption has for investment, we created a final
measure for the predictability of informal charges. It ismade up of three indicators:
• The percentage of firms answering that they knowthe amount of extra payments in advance.
• The percentage of firms agreeing that afterpayments, the relevant service was delivered asexpected.
• Once other government agencies have heardthat a firm has paid an additional fee, are theymore likely to ask for ‘additional payments’themselves? (% No) As with unpredictable fees,private firms cannot calculate whether making apayment to one agency will cause them to haveto make future payments to other agencies, andtherefore their ability to forecast their expectedcorruption costs is limited. For this reason, theresearch team considered the percentage offirms that answered no to this question asanalogous to the predictability of fees chargedby individual inspectors.
Table 19 illustrates that corruption is least predictablein Kampong Cham and Svay Rieng and highlypredictable in Battambang and Kandal. More researchmay certainly help sort out this puzzle.
Cambodia PBES | 31

An interesting issue in the Informal Charges Sub-Indexis that Micro-Corruption and Predictability arenegatively and significantly correlated, as shown inFigure 10. This seems to indicate a trade-off.Provinces such as Kampong Cham tend to not burdentheir firms with informal charges, but whenever theydo charge them, these events are highly unpredictable
for local firms. By contrast, while informal charges inBattambang, Kandal, and Sihanoukville are muchmore common, they are also for that very reason morepredictable. Neither of these conditions is ideal forprivate firms; charges should be low and predictable.But the question of which condition is better for privatesector development is a topic for future research.
Figure 10: Relationship between Micro-Corruption and Predictability
Cambodia PBES | 32

2.6. Participation
Participation represents the flip-side of Transparency.While Transparency indicates how much informationprovinces voluntarily supply to entrepreneurs,Participation studies provincial officials’ receptivenessto the information provided by firms about changes inlocal policies and initiatives. The Sub-Index measuresif firms are consulted during the creation of provincialpolicies, either through individual discussions withgovernment officials, forums between the governmentand enterprises, and/or through advocacy on the partof business associations. Because a great deal ofeffort has recently been made toward empoweringassociations to advocate on behalf of the private sector,we have focused specifically on this element ofgovernance.
Four indicators comprise the Participation Sub-Index :
• When a new law, rule, regulation or decree thatcould have a substantial impact on your businessis being discussed, does the provincialgovernment solicit advice from firms like yoursregarding the legal document’s content orimplementation? (% Always or Regularly). Theanswer to this question directly indicates firms’evaluations of their roles in local decisionmaking. Compared to levels of participation inneighboring Vietnam, scores in each Cambodian
province were low. The highest value, in BanteayMeanchey, was only 7.5%.
The next three indicators capture the role of businessassociations in provincial activities. Although businessassociations fulfill a variety of roles, one of their primarypurposes is to advocate on behalf of the private sector.
• Percentage of firms that could identify activebusiness associations in their province, whetheror not they belonged to any. This indicator is ameasure of business associations’ visibility.
• Percentage of firms from the PBES sample whoare members of business associations. Thisstatistic measures the organizations’inclusiveness.
• Business associations for every 1,000 firms. Thishard data measure of associations’ outreachcaptures the number of business associationsregistered with the DOC and DIME in everyprovince. It accounts for 40% of the total indexscore.
Table 20 displays relatively high firm participationscores for Siem Reap and Kampong Cham. By con-trast, the urban centers of Sihanoukville, Kandal, andPhnom Penh had very low scores.
Figure 11: Participation Sub-Index
Cambodia PBES | 33

2.7. Crime Prevention
Any quick glance at a Cambodian daily newspaperwill reveal that crime (often violent) is a common oc-currence. The constant threat of crime also affectsthe decisions of entrepreneurs. Indeed, our focusgroup demonstrated that crime was an issue in al-most all provinces, though its relative importance var-ied. While firms in Kampot, Battambang, and KampongCham said they were satisfied with the level of protec-
tion that local governments offered, firms in PhnomPenh were much more anxious about the increasingnumbers of violent crime and robbery. In Siem Reapand Sihanoukville, entrepreneurs worried less aboutrobberies than about the growing criminal drug tradeand its potentially negative impact on tourism.
Crime is expensive for firms, even if they never actuallyexperience a robbery. Many firms pay individuals toact as security guards on their premises, while others
Figure 12: Crime Prevention Sub-Index
Cambodia PBES | 34
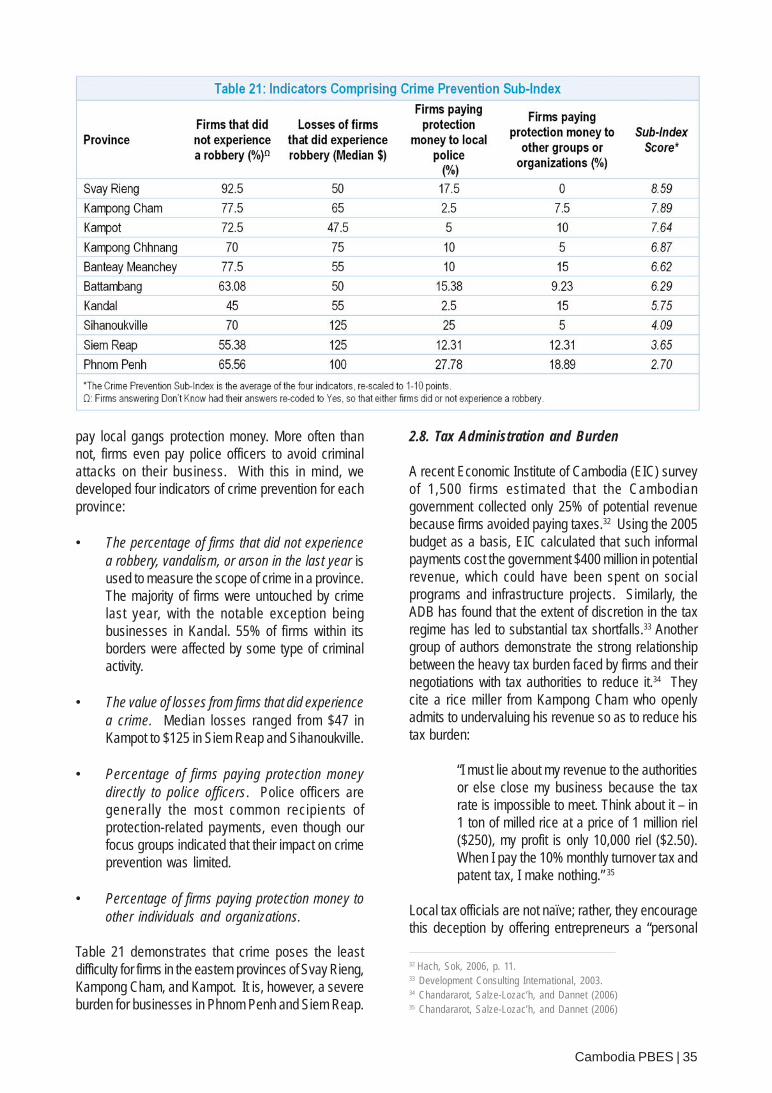
pay local gangs protection money. More often thannot, firms even pay police officers to avoid criminalattacks on their business. With this in mind, wedeveloped four indicators of crime prevention for eachprovince:
• The percentage of firms that did not experiencea robbery, vandalism, or arson in the last year isused to measure the scope of crime in a province.The majority of firms were untouched by crimelast year, with the notable exception beingbusinesses in Kandal. 55% of firms within itsborders were affected by some type of criminalactivity.
• The value of losses from firms that did experiencea crime. Median losses ranged from $47 inKampot to $125 in Siem Reap and Sihanoukville.
• Percentage of firms paying protection moneydirectly to police officers. Police officers aregenerally the most common recipients ofprotection-related payments, even though ourfocus groups indicated that their impact on crimeprevention was limited.
• Percentage of firms paying protection money toother individuals and organizations.
Table 21 demonstrates that crime poses the leastdifficulty for firms in the eastern provinces of Svay Rieng,Kampong Cham, and Kampot. It is, however, a severeburden for businesses in Phnom Penh and Siem Reap.
2.8. Tax Administration and Burden
A recent Economic Institute of Cambodia (EIC) surveyof 1,500 firms estimated that the Cambodiangovernment collected only 25% of potential revenuebecause firms avoided paying taxes.32 Using the 2005budget as a basis, EIC calculated that such informalpayments cost the government $400 million in potentialrevenue, which could have been spent on socialprograms and infrastructure projects. Similarly, theADB has found that the extent of discretion in the taxregime has led to substantial tax shortfalls.33 Anothergroup of authors demonstrate the strong relationshipbetween the heavy tax burden faced by firms and theirnegotiations with tax authorities to reduce it.34 Theycite a rice miller from Kampong Cham who openlyadmits to undervaluing his revenue so as to reduce histax burden:
“I must lie about my revenue to the authoritiesor else close my business because the taxrate is impossible to meet. Think about it – in1 ton of milled rice at a price of 1 million riel($250), my profit is only 10,000 riel ($2.50).When I pay the 10% monthly turnover tax andpatent tax, I make nothing.” 35
Local tax officials are not naïve; rather, they encouragethis deception by offering entrepreneurs a “personal
32 Hach, Sok, 2006, p. 11.33 Development Consulting International, 2003.34 Chandararot, Salze-Lozac’h, and Dannet (2006)35 Chandararot, Salze-Lozac’h, and Dannet (2006)
Cambodia PBES | 35

or sentimental discount” in exchange for free samplesor service fees.36 The result is a complex web ofinformal activity that benefits only individual taxinspectors. It deprives provincial governments ofrevenue, makes firms dependent on local authorities(because the firms’ growth corresponds with aproportionate increase in payments), and deniesindividual citizens public services that could beprovided through a larger tax base.
To capture these taxation issues at the provincial level,the PBES research team developed a Sub-Indexentitled Tax Administration and Burden that includessix indicators:
• The percentage of firms in each province that donot pay any taxes. While Cambodian firms arelegally subject to a number of different taxes,including VAT, salary taxes, and excise taxes, itis profit (turnover) taxes that vary most at theprovincial level. All three legal categories of profittax rates (described in Table 22) are representedin our sample. While there are only 11% of “realregime” (see Table 22 below for a definition)members in the entire sample, 40% of those inKampong Cham sample fit in this category. InKampot province, 38% of firms pay the estimatedtax, a figure that is two standard deviations greaterthan the entire sample mean. Other provinceshave been less diligent about registering theirfirms for profit taxes. 48% of firms in Phnom
36 Chandararot 2006.
Penh and 40% of firms Siem Reap do not payany taxes; together, businesses in these twoprovinces account for over half the non-payingfirms in the entire sample. As a result, thepercentage of firms that do not pay any taxesserves as a useful indicator of the capacity oflocal tax authorities.
The next three indicators capture the arbitrary natureof tax collection at the provincial level for all types oftaxes, including profit taxes, VAT and the tax burdennegotiations that firms must have with tax authorities:
• The percentage of firms that view bribes paid topublic officials for avoiding taxes as an obstacleto their business.
• The percentage of firms that pay bribes to localtax authorities to expedite the tax collectionprocess. In some provinces, firms may faceadditional fines for not paying taxes on time eventhough the timing of tax collection rests with taxofficials. Such businesses have taken it uponthemselves to accelerate the collection processwith extra payments.
·• The percentage of firms that agree or stronglyagree that negotiations with the tax authority arean essential part of doing business. While the“estimated regime” (see Table 22 above for adefinition) legally requires an estimated sales
Cambodia PBES | 36

value, negotiations can yield a lower tax burdenin exchange for informal payments.
The final two indicators were taken directly from theWorld Bank’s Investment Climate Analysis (ICA)questions on obstacles to business performance.These questions are posed on a 5-point scale, with 5representing a severe obstacle and 1 representing aminimal obstacle. The two indicators are:
• The mean obstacle imposed by TaxAdministration.
• The mean obstacle posed by the Tax Burden(which is interpreted as the amount paid).
While these figures generated statistically significantdifferences, it is interesting to note that no provinceshave a mean score greater than 3, which is defined asa moderate obstacle.
Cambodia PBES | 37
Figure 13: Tax Administration and Burden Sub-Index
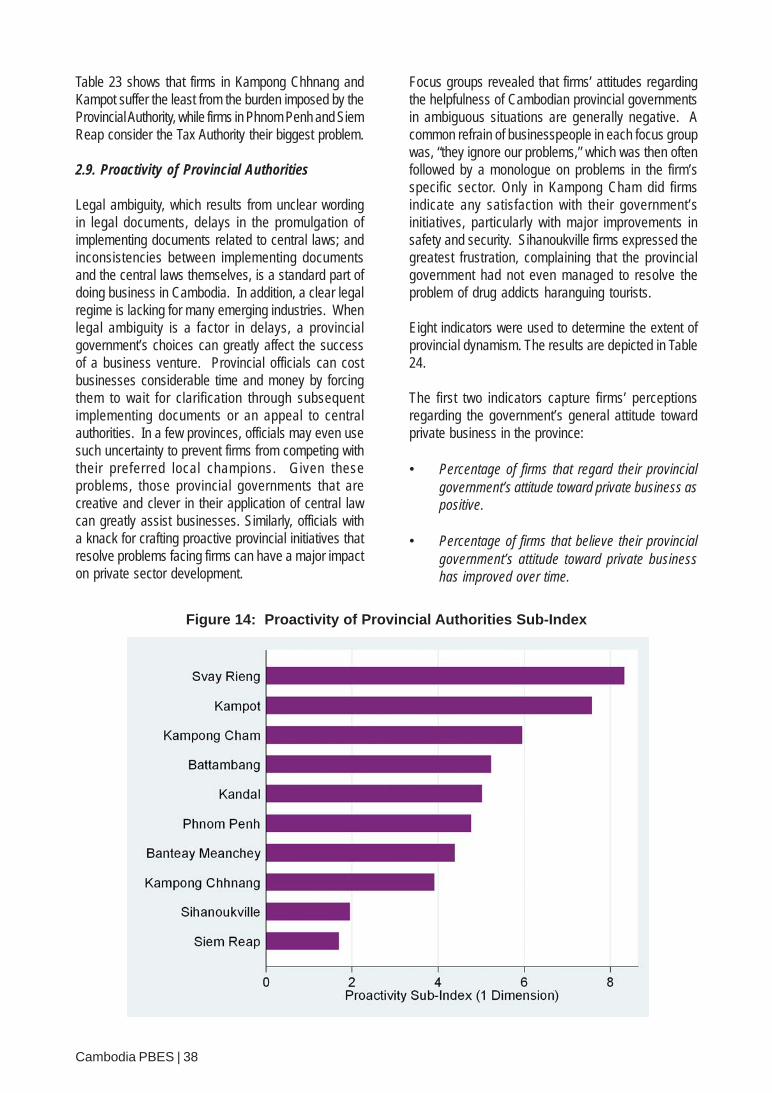
Table 23 shows that firms in Kampong Chhnang andKampot suffer the least from the burden imposed by theProvincial Authority, while firms in Phnom Penh and SiemReap consider the Tax Authority their biggest problem.
2.9. Proactivity of Provincial Authorities
Legal ambiguity, which results from unclear wordingin legal documents, delays in the promulgation ofimplementing documents related to central laws; andinconsistencies between implementing documentsand the central laws themselves, is a standard part ofdoing business in Cambodia. In addition, a clear legalregime is lacking for many emerging industries. Whenlegal ambiguity is a factor in delays, a provincialgovernment’s choices can greatly affect the successof a business venture. Provincial officials can costbusinesses considerable time and money by forcingthem to wait for clarification through subsequentimplementing documents or an appeal to centralauthorities. In a few provinces, officials may even usesuch uncertainty to prevent firms from competing withtheir preferred local champions. Given theseproblems, those provincial governments that arecreative and clever in their application of central lawcan greatly assist businesses. Similarly, officials witha knack for crafting proactive provincial initiatives thatresolve problems facing firms can have a major impacton private sector development.
Figure 14: Proactivity of Provincial Authorities Sub-Index
Focus groups revealed that firms’ attitudes regardingthe helpfulness of Cambodian provincial governmentsin ambiguous situations are generally negative. Acommon refrain of businesspeople in each focus groupwas, “they ignore our problems,” which was then oftenfollowed by a monologue on problems in the firm’sspecific sector. Only in Kampong Cham did firmsindicate any satisfaction with their government’sinitiatives, particularly with major improvements insafety and security. Sihanoukville firms expressed thegreatest frustration, complaining that the provincialgovernment had not even managed to resolve theproblem of drug addicts haranguing tourists.
Eight indicators were used to determine the extent ofprovincial dynamism. The results are depicted in Table24.
The first two indicators capture firms’ perceptionsregarding the government’s general attitude towardprivate business in the province:
• Percentage of firms that regard their provincialgovernment’s attitude toward private business aspositive.
• Percentage of firms that believe their provincialgovernment’s attitude toward private businesshas improved over time.
Cambodia PBES | 38
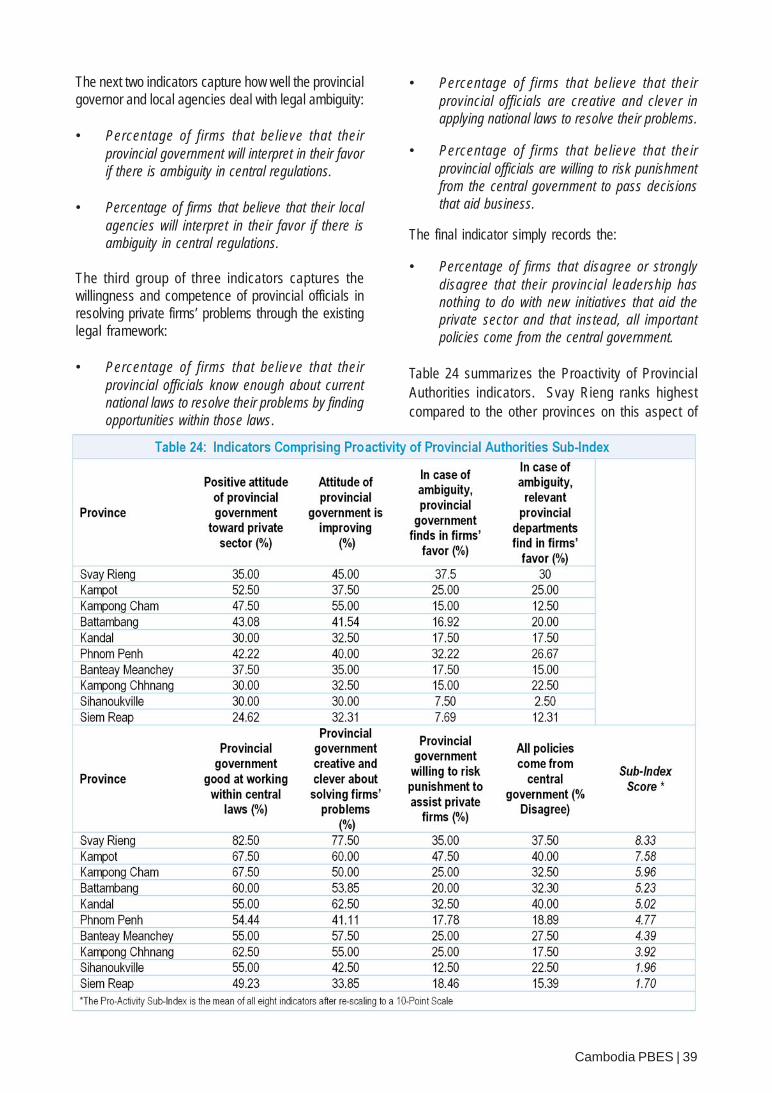
The next two indicators capture how well the provincialgovernor and local agencies deal with legal ambiguity:
• Percentage of firms that believe that theirprovincial government will interpret in their favorif there is ambiguity in central regulations.
• Percentage of firms that believe that their localagencies will interpret in their favor if there isambiguity in central regulations.
The third group of three indicators captures thewillingness and competence of provincial officials inresolving private firms’ problems through the existinglegal framework:
• Percentage of firms that believe that theirprovincial officials know enough about currentnational laws to resolve their problems by findingopportunities within those laws.
• Percentage of firms that believe that theirprovincial officials are creative and clever inapplying national laws to resolve their problems.
• Percentage of firms that believe that theirprovincial officials are willing to risk punishmentfrom the central government to pass decisionsthat aid business.
The final indicator simply records the:
• Percentage of firms that disagree or stronglydisagree that their provincial leadership hasnothing to do with new initiatives that aid theprivate sector and that instead, all importantpolicies come from the central government.
Table 24 summarizes the Proactivity of ProvincialAuthorities indicators. Svay Rieng ranks highestcompared to the other provinces on this aspect of
Cambodia PBES | 39
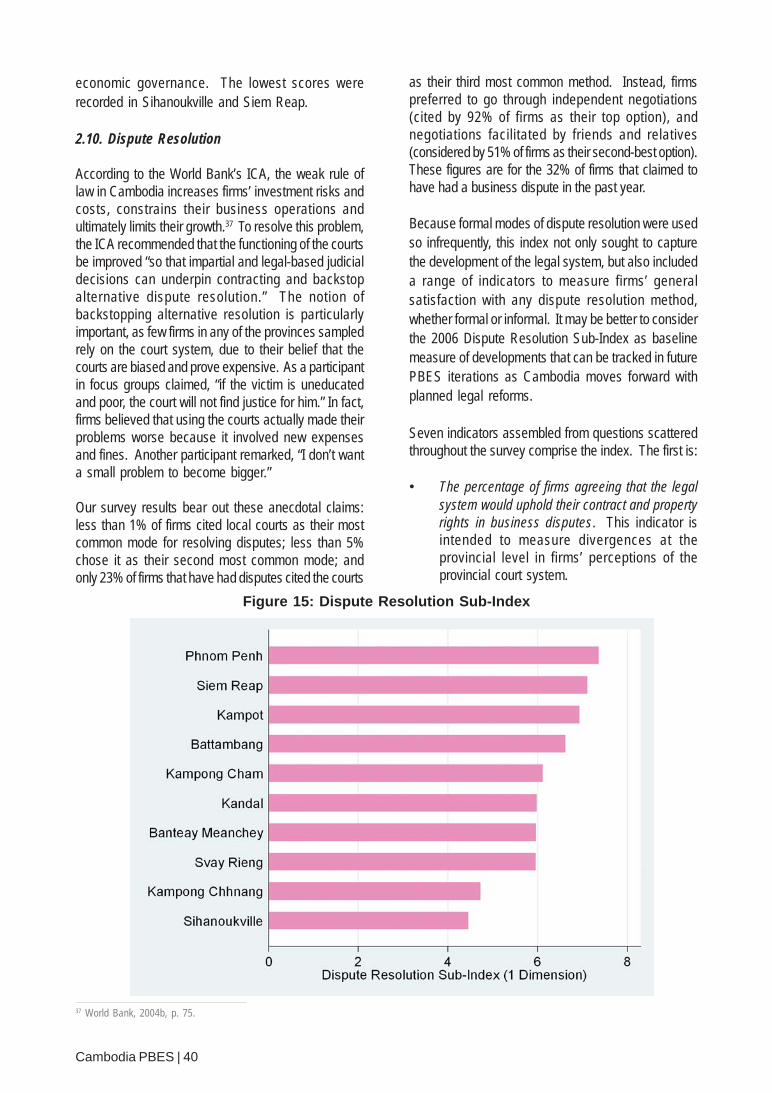
economic governance. The lowest scores wererecorded in Sihanoukville and Siem Reap.
2.10. Dispute Resolution
According to the World Bank’s ICA, the weak rule oflaw in Cambodia increases firms’ investment risks andcosts, constrains their business operations andultimately limits their growth.37 To resolve this problem,the ICA recommended that the functioning of the courtsbe improved “so that impartial and legal-based judicialdecisions can underpin contracting and backstopalternative dispute resolution.” The notion ofbackstopping alternative resolution is particularlyimportant, as few firms in any of the provinces sampledrely on the court system, due to their belief that thecourts are biased and prove expensive. As a participantin focus groups claimed, “if the victim is uneducatedand poor, the court will not find justice for him.” In fact,firms believed that using the courts actually made theirproblems worse because it involved new expensesand fines. Another participant remarked, “I don’t wanta small problem to become bigger.”
Our survey results bear out these anecdotal claims:less than 1% of firms cited local courts as their mostcommon mode for resolving disputes; less than 5%chose it as their second most common mode; andonly 23% of firms that have had disputes cited the courts
as their third most common method. Instead, firmspreferred to go through independent negotiations(cited by 92% of firms as their top option), andnegotiations facilitated by friends and relatives(considered by 51% of firms as their second-best option).These figures are for the 32% of firms that claimed tohave had a business dispute in the past year.
Because formal modes of dispute resolution were usedso infrequently, this index not only sought to capturethe development of the legal system, but also includeda range of indicators to measure firms’ generalsatisfaction with any dispute resolution method,whether formal or informal. It may be better to considerthe 2006 Dispute Resolution Sub-Index as baselinemeasure of developments that can be tracked in futurePBES iterations as Cambodia moves forward withplanned legal reforms.
Seven indicators assembled from questions scatteredthroughout the survey comprise the index. The first is:
• The percentage of firms agreeing that the legalsystem would uphold their contract and propertyrights in business disputes. This indicator isintended to measure divergences at theprovincial level in firms’ perceptions of theprovincial court system.
Cambodia PBES | 40
37 World Bank, 2004b, p. 75.
Figure 15: Dispute Resolution Sub-Index
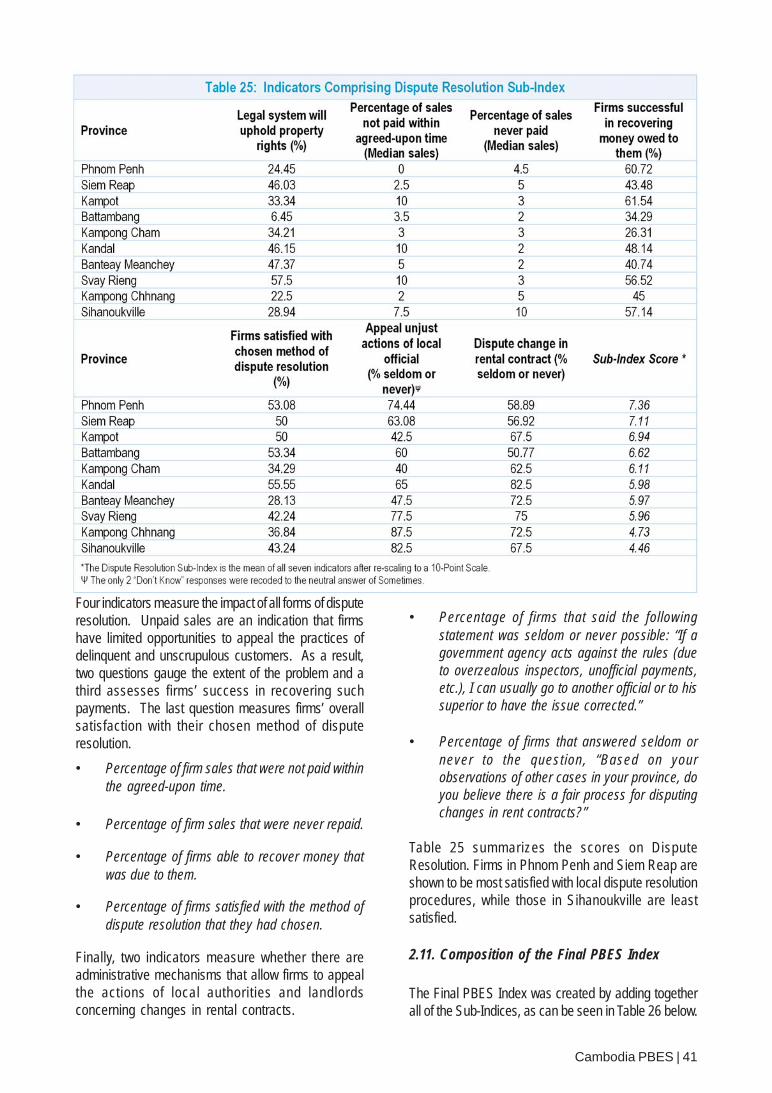
Four indicators measure the impact of all forms of disputeresolution. Unpaid sales are an indication that firmshave limited opportunities to appeal the practices ofdelinquent and unscrupulous customers. As a result,two questions gauge the extent of the problem and athird assesses firms’ success in recovering suchpayments. The last question measures firms’ overallsatisfaction with their chosen method of disputeresolution.
• Percentage of firm sales that were not paid withinthe agreed-upon time.
• Percentage of firm sales that were never repaid.
• Percentage of firms able to recover money thatwas due to them.
• Percentage of firms satisfied with the method ofdispute resolution that they had chosen.
Finally, two indicators measure whether there areadministrative mechanisms that allow firms to appealthe actions of local authorities and landlordsconcerning changes in rental contracts.
• Percentage of firms that said the followingstatement was seldom or never possible: “If agovernment agency acts against the rules (dueto overzealous inspectors, unofficial payments,etc.), I can usually go to another official or to hissuperior to have the issue corrected.”
• Percentage of firms that answered seldom ornever to the question, “Based on yourobservations of other cases in your province, doyou believe there is a fair process for disputingchanges in rent contracts?”
Table 25 summarizes the scores on DisputeResolution. Firms in Phnom Penh and Siem Reap areshown to be most satisfied with local dispute resolutionprocedures, while those in Sihanoukville are leastsatisfied.
2.11. Composition of the Final PBES Index
The Final PBES Index was created by adding togetherall of the Sub-Indices, as can be seen in Table 26 below.
Cambodia PBES | 41

Although a weighting system based on each sub-index’s probable contribution to firm expansion andjob growth was considered, this idea was eventuallydismissed because the small number of provinces inthe sample limited the available degrees of freedomthat would be used in such a test.
Preliminary analysis did indicate, however, that somesub-indices were more influential than others. EntryCosts, Property Rights, Transparency, Participation,Informal Charges, and Crime Prevention appear to playthe largest role in improving firm level labor growth.Provincial officials are advised to concentrate first onpolicies that will improve these indicators beforefocusing on the others.
Table 27 shows the predicted impact of improvements(from the regressions in Appendix 3) on these variables
from a multivariate regression in which structuralconditions were held constant. Stars indicate theconfidence level at which the coefficient is statisticallysignificant. Most interestingly, while controlling forother determinants, a one-point improvement forInformal Charges in the mean score would yield apotential 21% average annual increase in firm levellabor growth. Also, the full Transparency Sub-Index isinsignificant at the 10% level, which indicates that it isstatistically distinguishable from 0 and that anotherrandom selection of firms may have even yielded anegative result. However, when we parse Transparencyby its various dimensions, we find that Access toDocuments is statistically significant. A one-pointimprovement on the Access to Documents dimensionwould yield a 9% increase in predicted firm level laborgrowth. The other Transparency dimensions arestatistically insignificant.
Cambodia PBES | 42
38 Appendix 3 shows the full regressions that generated these results.

Methodology


3. Methodology
The PBES research program was initiated inNovember 2005 by IFC-MPDF and The AsiaFoundation (with support from AusAID). It involved fourphases of research.
3.1. Phase 1: Census of Private Firms in 10Provinces
Because equally reliable lists of private firms did notexist for all 10 of the economically most importantprovinces in Cambodia, it was necessary to undertakea census that recorded all readily identified firms.PBES researchers traveled to each of the ten provincesto conduct a complete accounting of business activity.All firms within the provincial capital and the three nextmost populous areas were covered. The teamconsidered every business operation that was in a fixedlocation as an active enterprise. In total, 41,775business operations were identified. 70% of thebusinesses were either in Phnom Penh or in theprovince of Kandal – a belt surrounding the capital.57% of the businesses were new, having beenestablished since 2000. And all were very small; only2% had more than 10 employees.
The census also revealed other interesting findings.Two-thirds of the population is involved in small retail/food outlets, while the 11 % accounted for the next largestsector – repair and maintenance. Despite non-foodmanufacturing firms’ importance in job creation (theyaccount for 23.8% of the workforce), they representedonly 4% of establishments covered by the census.
Women accounted for 55.3% of all private firm owners.This fits with the Cambodian tradition of womenholding property titles, even if they do not necessarilycontrol related transactions.39 The lowest level offemale ownership was found in the traditionally malesectors of maintenance (17%) and non-foodmanufacturing (21%). Women also accounted for 56%of the private sector labor force.
Firms tended to serve local markets. 95% of the firmsoperated primarily within their provincial borders andcatered to consumers in their provinces. The onenotable exception was in Siem Reap, where 29% ofsales were to foreign tourists.
3.2. Phase 2: Data Collection and Field Testing
After completing the census, the research teamfocused on two tasks. First, we collected the harddata used in the index and as controls for structuralconditions from published sources and third parties.The most important data was derived from provincialbudgets and from the Provincial Department ofCommerce and Department of Industry, Mines andEnergy. Some hard data, such as the availability ofinformation, was constructed from the team’sobservations during direct visits to the province (SeeSection 2.3.4).
A 16-page survey was developed which covered 12major topic areas and generated 391 variables. Thesurvey built upon the World Bank’s Mini-InvestmentClimate Analysis Survey Instrument, which wasdeveloped to allow for follow-up on the Bank’s 2003research.40 The survey was designed in English,translated into Khmer, and the meaning of eachquestion was double-checked by a fluent Englishspeaker who had no involvement with the originalsurvey design.
After the survey’s initial design in May/June 2006, sixPBES focus groups, each made up of eight people,were conducted to test survey questions and gatherfurther information on aspects of provincial economicgovernance in the following different populations:
• One-person female-owned businesses inPhnom Penh
• One-person male-owned businesses inKampong Cham
• Multi-person female-owned businesses in SiemReap
• Multi-person female-owned businesses inKampot
• Multi-person male-owned businesses inBattambang
• Multi-person male-owned businesses inSihanoukville
The average size of the multi-person businesses was6.3 employees and the average age of the owner about34 years.
39 A Fair Share for Women: UNIFEM, World Bank, ADB, UNDP andDFID/UK. 2004. Cambodia Gender Assessment. Phnom Penh:UNIFEM, WB, ADB, UNDP and DFID/UK.40 World Bank, 2004b.
Cambodia PBES | 45
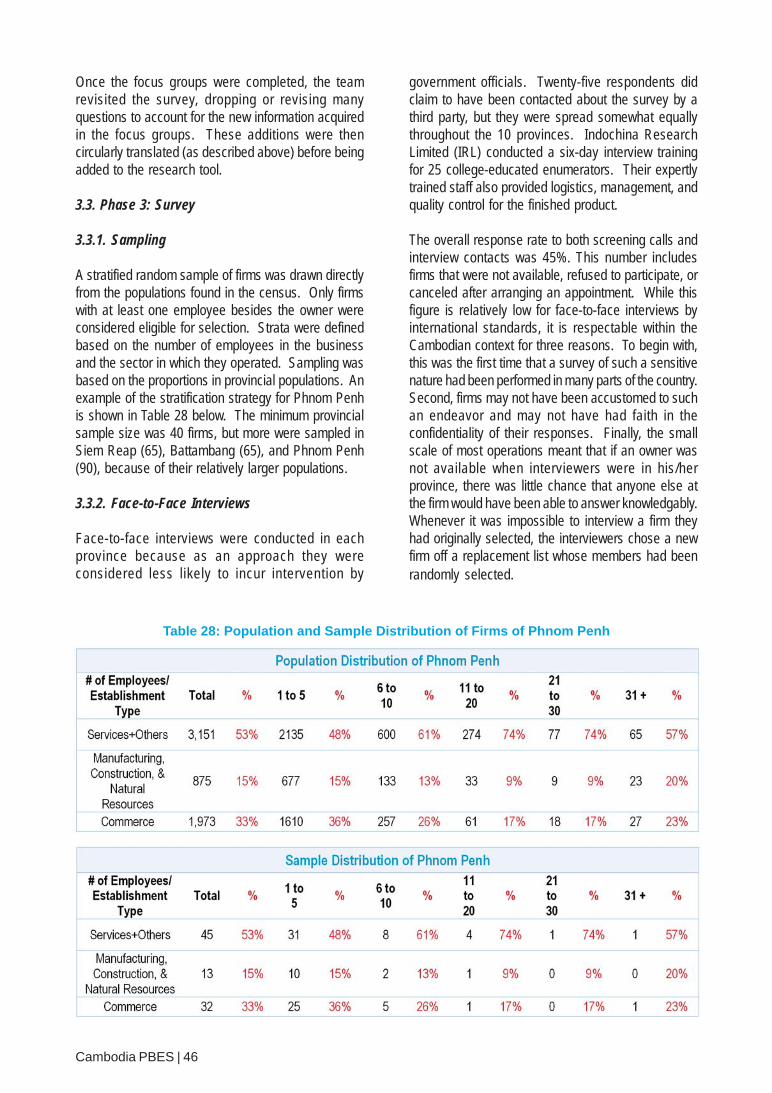
Once the focus groups were completed, the teamrevisited the survey, dropping or revising manyquestions to account for the new information acquiredin the focus groups. These additions were thencircularly translated (as described above) before beingadded to the research tool.
3.3. Phase 3: Survey
3.3.1. Sampling
A stratified random sample of firms was drawn directlyfrom the populations found in the census. Only firmswith at least one employee besides the owner wereconsidered eligible for selection. Strata were definedbased on the number of employees in the businessand the sector in which they operated. Sampling wasbased on the proportions in provincial populations. Anexample of the stratification strategy for Phnom Penhis shown in Table 28 below. The minimum provincialsample size was 40 firms, but more were sampled inSiem Reap (65), Battambang (65), and Phnom Penh(90), because of their relatively larger populations.
3.3.2. Face-to-Face Interviews
Face-to-face interviews were conducted in eachprovince because as an approach they wereconsidered less likely to incur intervention by
Table 28: Population and Sample Distribution of Firms of Phnom Penh
government officials. Twenty-five respondents didclaim to have been contacted about the survey by athird party, but they were spread somewhat equallythroughout the 10 provinces. Indochina ResearchLimited (IRL) conducted a six-day interview trainingfor 25 college-educated enumerators. Their expertlytrained staff also provided logistics, management, andquality control for the finished product.
The overall response rate to both screening calls andinterview contacts was 45%. This number includesfirms that were not available, refused to participate, orcanceled after arranging an appointment. While thisfigure is relatively low for face-to-face interviews byinternational standards, it is respectable within theCambodian context for three reasons. To begin with,this was the first time that a survey of such a sensitivenature had been performed in many parts of the country.Second, firms may not have been accustomed to suchan endeavor and may not have had faith in theconfidentiality of their responses. Finally, the smallscale of most operations meant that if an owner wasnot available when interviewers were in his/herprovince, there was little chance that anyone else atthe firm would have been able to answer knowledgably.Whenever it was impossible to interview a firm theyhad originally selected, the interviewers chose a newfirm off a replacement list whose members had beenrandomly selected.
Cambodia PBES | 46
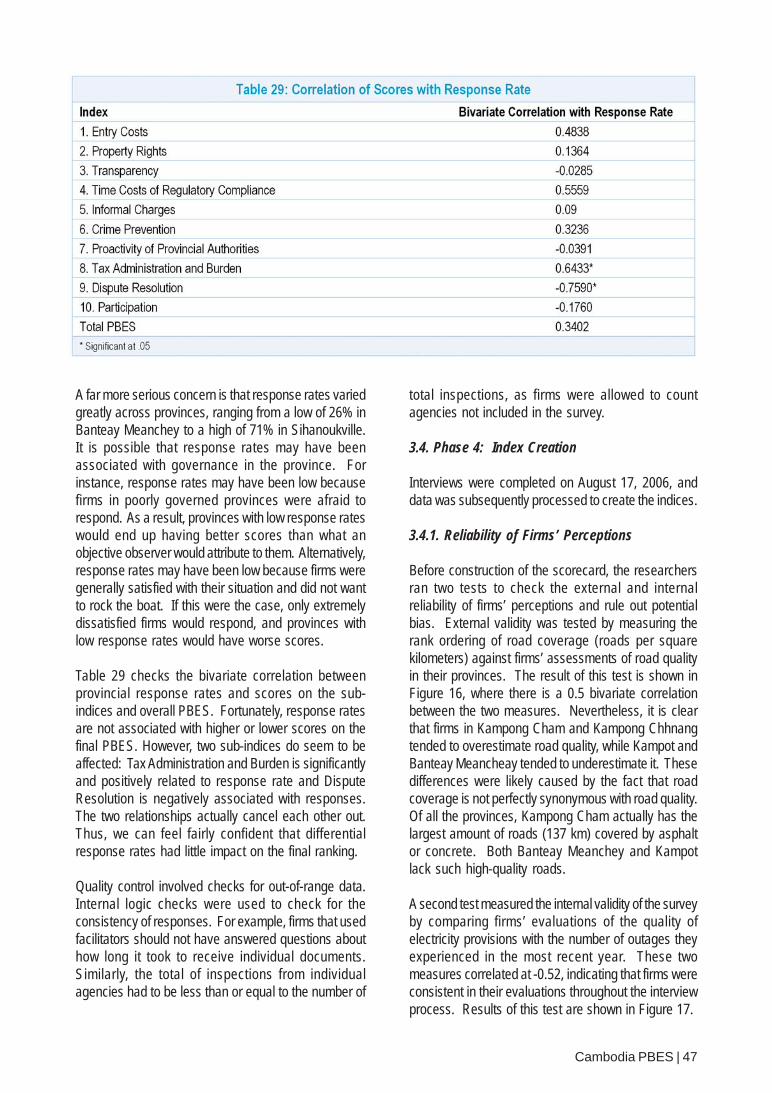
A far more serious concern is that response rates variedgreatly across provinces, ranging from a low of 26% inBanteay Meanchey to a high of 71% in Sihanoukville.It is possible that response rates may have beenassociated with governance in the province. Forinstance, response rates may have been low becausefirms in poorly governed provinces were afraid torespond. As a result, provinces with low response rateswould end up having better scores than what anobjective observer would attribute to them. Alternatively,response rates may have been low because firms weregenerally satisfied with their situation and did not wantto rock the boat. If this were the case, only extremelydissatisfied firms would respond, and provinces withlow response rates would have worse scores.
Table 29 checks the bivariate correlation betweenprovincial response rates and scores on the sub-indices and overall PBES. Fortunately, response ratesare not associated with higher or lower scores on thefinal PBES. However, two sub-indices do seem to beaffected: Tax Administration and Burden is significantlyand positively related to response rate and DisputeResolution is negatively associated with responses.The two relationships actually cancel each other out.Thus, we can feel fairly confident that differentialresponse rates had little impact on the final ranking.
Quality control involved checks for out-of-range data.Internal logic checks were used to check for theconsistency of responses. For example, firms that usedfacilitators should not have answered questions abouthow long it took to receive individual documents.Similarly, the total of inspections from individualagencies had to be less than or equal to the number of
total inspections, as firms were allowed to countagencies not included in the survey.
3.4. Phase 4: Index Creation
Interviews were completed on August 17, 2006, anddata was subsequently processed to create the indices.
3.4.1. Reliability of Firms’ Perceptions
Before construction of the scorecard, the researchersran two tests to check the external and internalreliability of firms’ perceptions and rule out potentialbias. External validity was tested by measuring therank ordering of road coverage (roads per squarekilometers) against firms’ assessments of road qualityin their provinces. The result of this test is shown inFigure 16, where there is a 0.5 bivariate correlationbetween the two measures. Nevertheless, it is clearthat firms in Kampong Cham and Kampong Chhnangtended to overestimate road quality, while Kampot andBanteay Meancheay tended to underestimate it. Thesedifferences were likely caused by the fact that roadcoverage is not perfectly synonymous with road quality.Of all the provinces, Kampong Cham actually has thelargest amount of roads (137 km) covered by asphaltor concrete. Both Banteay Meanchey and Kampotlack such high-quality roads.
A second test measured the internal validity of the surveyby comparing firms’ evaluations of the quality ofelectricity provisions with the number of outages theyexperienced in the most recent year. These twomeasures correlated at -0.52, indicating that firms wereconsistent in their evaluations throughout the interviewprocess. Results of this test are shown in Figure 17.
Cambodia PBES | 47

Figure 16: External Validity – Firms Evaluations of Road Quality vs. Actual Coverage
Figure 17: Internal Validity – Firms Evaluations of Electricity vs. Number ofOutages Experienced
Cambodia PBES | 48

3.4.2. Verification of Indicators
Before indicators could be used in the creation of theindex, they had to pass three tests.
• Scaled data had to pass a Chi Square testindicating there were statistically significantdifferences across provinces as to thepercentage of firms that checked particularvalues on Likert scales. For instance, is the 40%of firms that answered strongly agree or agree inKampong Cham statistically distinct from the35% in Battambang? Testing statisticalsignificance incorporates the number ofrespondents along with the variance withinprovinces.
• Confidence intervals around mean scores hadto demonstrate limited overlap, so that the teamcould determine that another random samplewould not yield a different ordering. Figure 18gives an example of this exercise with respect tothe mean waiting period for Patent Taxregistration. There was some overlap, but for themost part, intervals around sample means were
tight. We are fairly certain that the rank orderingwould be maintained with another randomsample. The major exception is Battambangprovince, which had extremely large confidenceintervals due to a wide variation in provincialscores. With another sample, Battambang’sscore could potentially be the highest or lowestscore in the sample. In cases like this, it wasnecessary to take median scores to avoiddistortions caused by outliers.
• Differences in responses among provinces couldnot be caused by variation in the type, legalstatus, or size of firms concentrated in particularprovinces. Section 2.1.1 on the percentage offully formal firms describes a test of this analysis.
3.4.3. Re-scaling of answers
All indicators were re-scaled to a 10-point scale usingthe formula
Pr9* 1iovince Minimum
Maximum Minimum
−⎡ ⎤ +⎢ ⎥−⎣ ⎦
Cambodia PBES | 49
Figure 18: Confidence Intervals around the Mean Waiting Period for Patent TaxRegistration
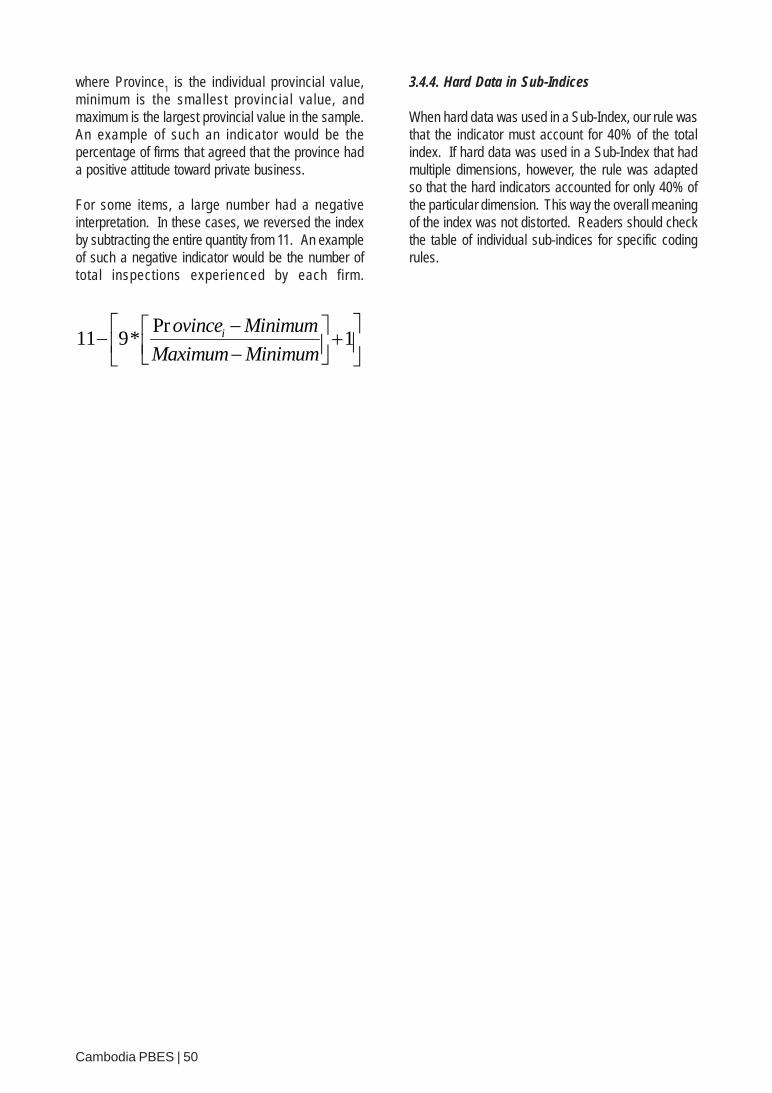
where Province1 is the individual provincial value,minimum is the smallest provincial value, andmaximum is the largest provincial value in the sample.An example of such an indicator would be thepercentage of firms that agreed that the province hada positive attitude toward private business.
For some items, a large number had a negativeinterpretation. In these cases, we reversed the indexby subtracting the entire quantity from 11. An exampleof such a negative indicator would be the number oftotal inspections experienced by each firm.
Pr11 9* 1iovince Minimum
Maximum Minimum
⎡ ⎤−⎡ ⎤− +⎢ ⎥⎢ ⎥−⎣ ⎦⎣ ⎦
Cambodia PBES | 50
3.4.4. Hard Data in Sub-Indices
When hard data was used in a Sub-Index, our rule wasthat the indicator must account for 40% of the totalindex. If hard data was used in a Sub-Index that hadmultiple dimensions, however, the rule was adaptedso that the hard indicators accounted for only 40% ofthe particular dimension. This way the overall meaningof the index was not distorted. Readers should checkthe table of individual sub-indices for specific codingrules.

Next Steps

4. Next Steps
The rigor and care involved in the design of this indexshould ensure confidence that the rankings aregenerally correct. As a result, the PBES should prove auseful tool for provincial officials who wish to improvetheir policies. For any specific aspect of economicgovernance and regulation, it serves as a resource ofhelpful best practices. Firms wishing to expand orrelocate their business to new areas would also bewell served by the rankings. Finally, donors looking toevaluate the impact of their technical assistanceprojects can use this year’s PBES and future iterationsas benchmarks.
Government officials, private entrepreneurs,researchers, and members of the donor community,however, would be best served by thinking of the PBESas an initial attempt to rank provinces on economicgovernance. Despite its usefulness, the PBES actuallyraises more questions than its answers. For instance,we do not know why firms in Kampong Cham, SvayRieng, and Kampong Chhnang are more satisfied withlocal governance than their peers. We know very littleabout the actual policies in these provinces and haveeven less information about from where officials in thehigh-performing provinces are drawing their policyinitiatives. Cultural, historical, political, and evengeographical factors may be at work. More researchis certainly needed to answer these underlyingquestions. Ultimately, future studies should endeavorto identify successful economic governance initiativesthat can be easily communicated and disseminatedto leaders in poorer performing provinces. Of course,in such cases, it will be important to ascertain thatpolicy innovations are appropriate to the specificprovincial context(s). Further research should initiallyfocus on those policy areas that have the largest impacton firm growth, such as lowering entry costs, improving
property rights, increasing access to regulatoryinformation, reducing informal charges and crime, andenhancing firms’ participation in local decision makingprocesses.
Towards this end, The Asia Foundation has initiatedprograms that aim to create a better enablingenvironment for private sector development at theprovincial level. The Foundation’s economic reformprogram in Cambodia focuses on the process ofpolicymaking and reform, the empowerment of theprivate sector, particularly provincial micro, small andmedium enterprises (MSMEs), and the developmentof a more business-friendly environment. TheFoundation will use the PBES results to designactivities that foster regulatory reforms by enhancingthe local entrepreneurs’ advocacy potential andincreasing interaction between business owners andgovernment officials through public-private dialogues.By designing programs that are based on the demandand perspectives of local entrepreneurs (drawn fromtheir answers in PBES Focus Groups and to thesurvey), the Foundation expects to provide the businesscommunity with greater access to provincial decisionmaking and to contribute to greater economic growththroughout Cambodia.
The International Finance Corporation’s MekongPrivate Sector Development Facility (IFC-MPDF)focuses its technical assistance on simplifyingadministrative procedures for businesses. Using thePBES as the basis for discussions, IFC-MPDF will workwith provincial authorities and the private sector toidentify how to reduce specific time costs and excessbureaucratic requirements, especially in areas relatedto business registration, permits, and inspections. TheFacility will also bring good practices from theprovinces to the attention of national authorities to helpimprove central level regulations.
Cambodia PBES | 53


Appendices


1 Entry Costs• % of firms registered with the Ministry of Commerce or Municipal
Department of Commerce• Total number of registrations, licenses and permits firms need to
operate• Official fee for One-Year Operating License (median $)• Waiting period for Registration Certificate from Municipal Department
of Commerce (median days)• Official fee for Registration Certificate from Provincial/Municipal
Department of Commerce (median $)• Waiting period for One-Year Operating License (median days)• Official fee for One-Year Operating License (median $)• Waiting period for Patent Tax registration from Local Tax Authority
(median days)**• Official Patent Tax Fee from Local Tax Authority (median $)**
2 Property Rights• % of firms with land documentation• % of firms with Solid Title to land• % of firms that feel expropriation is a risk• % of firms renting land from government• % of firms that deem changes in rental contracts a risk• Effective land prices (adjusted for differences in supply and demand)
(mean $)**• Rental revenue per firm (mean $)*
3 Transparency• Transparency of - and access to - local planning and decrees/
decisions (10 documents/5-point scale)• Firm’s knowledge of provincial budget (% not familiar)• % of times that a relationship with a provincial official is necessary
to obtain access to land or property documents• % of firms agreeing favoritism towards firms with political connec-
tions is an obstacle to business• Regularity that representatives from the provincial governor’s office
meet with firms to discuss changes in laws or polices (% regularlyor always)
• Firms are informed about new economic and finance regulations thataffect their business (% not or poorly informed)
• Regularity that a firm receives advance notice about new orchanging central government laws (% regularly or always)
• Request to Provincial/Municipal Department of Commerce** (4-pointscale)
• Request to Departments of Industry Mine, and Energy** (4-pointscale)
4 Time Costs of Regulatory Compliance• % of management time spent dealing with requirements imposed by
government regulations• Total number of inspections per year (median)• Time it took a firm to receive its land title (median days)
5 Informal Charges• Giving gifts to public officials is sometimes required to pass
customs, obtain licenses, receive public services, or meet taxrequirements (% agree)
• % of firms that paid informal charges in application for Patent Tax• Firm's assessment of corruption in province (5-point scale)• Information regarding available public procurement contracts is
transparent (% agree)• Importance of government connections for winning public procure-
ment contracts (% important)• % of firms that believe firms in their industry often pay commissions
when doing business with government• % of firms that believe government agencies assess additional fees
based on what there counterparts are able to acquire• Firms usually know how much additional payment is required in
their industry (% agree)• Regularity that services are delivered as expected when a firm
pays the required additional payment (% regularly or always)
6 Participation
• % of firms agreeing provincial government solicits advice fromaffected firms on new laws, rules, regulations or decrees
• There are business associations or clubs in the province (% Yes)
• % of firms in sample that are members of associations or clubs in theprovince
• Number of business associations per 10,000 firms in province**
7 Crime Prevention• % of firms that experienced losses due to theft, robbery, vandalism,
or arson in last year• Monetary value of firm's losses caused by crime (median $)• % of firms that believe firms in their sector make protection payments
to the police• % of firms that know firms that have made protection payments in
the past
8 Tax Administration and Burden
• % of firms that believe bribes to public officials to avoid taxes andregulations are a significant business obstacle
• % of firms that pay taxes
• Regularity of extra payments to expedite tax process (% regularly oralways)
• % of firms that believe negotiating with tax authority is part ofbusiness
• Tax rates as obstacle (5-point scale)
9 Proactivity of Provincial Authorities
• Provincial government officials' attitude toward private business (%positive)
• Attitude of the provincial government toward private business isimproving (% agree)
• Provincial government interprets law in favor of local firm if certaingovernment regulations are unclear (% agree)
• Provincial departments of line ministries tend to interpret in firms’favor when central regulation lacks clarity (% agree)
• Provincial government is good at working within central laws tocreate a profitable business environment (% agree)
• Provincial government is creative and clever about solving newbusiness problems (% agree)
• Provincial government willingly risks punishment from the centralgovernment to pass decisions to aid local businesses (% agree)
• There are no initiatives at the provincial level (% disagree)
10 Dispute Resolution
• % of firms that are confident that the legal system will upholdcontracts and property rights in disputes
• Possibility of going to another official to dispute unjust (% seldom ornever)
• % of monthly total sales in 2005 for which firm did not receivepayment in the agreed time
• % of monthly sales for which firm never paid by customers in 2005
• Satisfaction with government dispute resolution (% satisfied)
• Success at recovering money owed to it (% successful)
• % of firms in province that believe there is a fair process to disputechanges in rent contracts
Appendix 1: Detailed Descriptions of Sub-Indices and Components Indicators
Notes: *Denotes component uses both hard and soft data; **Denotes component uses only hard data; all other indicators are derived from perceptions data; = Derivedfrom factor analysis; in all sub-indices each primary component is given equal weight (i.e., Entry Costs has four primary components, each worth 25%)
Cambodia PBES | 57

This regression shows four ordinal probit models: abaseline model on only firm characteristics; a sec-ond model adding initial structural conditions; a thirdmodel adding the total PBES; and the final interactionthat was described in the introductory section of thereport. Because this is a probabilistic model, coeffi-cients cannot be interpreted directly off the table andmarginal effects must be calculated. Column threeis the most important column to look at, as it demon-strates that four factors have significant impacts on
firm expansion: the original size of the firm; the impor-tance of tourism in the economy; the quality of infra-structure (as measured by road coverage); and thePBES score. The large size of the tourism and roadcoefficients indicates that structural conditions con-tinue to play a determinant role in firms’ willingness toexpand. Nevertheless, given these dominant initialconditions, the PBES score proves to be highly sig-nificant and exerts a strong independent impact onfirms’ expansion plans.
Cambodia PBES | 58

Cambodia PBES | 59
This regression shows three models: a baseline modelon only firm characteristics; a second model addinginitial conditions; and a third model adding the totalPBES. Because this regression uses ordinary leastsquares (OLS) rather than probit, coefficients can beread right off the table. Once again, column three isthe most important column, demonstrating that fourfactors have significant impacts on firm expansion:the cost of labor in the province; the size of a firm’scapital stock; the number of vocational schools; andthe PBES score. A $100 increase in the cost of labor isassociated with a 6.4% increase in labor employed.
This counter-intuitive result seems to indicate that firmsare more interested in employing higher-cost skilledlabor. A 1% increase in the capital assets of the firmleads to a 13% decrease in labor growth, which con-firms that capital intensive operations are less likely toexpand labor. Each vocational school in the provinceadds about 9.4% increase in labor growth, which onceagain demonstrates the important demand for skilledlabor. Finally, given the other control variables, a one-point improvement in the PBES score would yield a2.5% increase in labor growth.

Cambodia PBES | 60

Appendix 3 extends the analysis of Appendix 2B byreplacing the total PBES score with each individualindicator but not altering the control variables. Eightof the sub-indices are significantly different from 0.Their marginal impacts are explored in more detailin Table 25 above. It is important to note thatTransparency is not wholly significant. Only the
Access to Documents dimension has anindependent impact on f irm labor growth.Interestingly, Time Costs of Regulatory Complianceactually has a significant and negative impact onfirms’ labor expansion. Future research shouldinvestigate the reason for this unexpectedrelationship.
Cambodia PBES | 61

IFC-MPDF is a multi-donor funded initiative set up bythe International Finance Corporation in 1997 inCambodia, Vietnam and Lao PDR to reduce povertythrough sustainable private sector development. TheFacility works through six interrelated programs that seekto improve the business environment, develop thefinancial sector, improve managerial capacity, andincrease sustainable business practices in three sectorsthat are central to economic growth and poverty reduction– tourism, agribusiness, and garments. IFC-MPDF’sdonors are the Asian Development Bank, Australia,Canada, Finland, IFC, Ireland, Japan, New Zealand,the Netherlands, Norway, Sweden, Switzerland andthe United Kingdom.
The Asia Foundation (www.asiafoundation.org) is anon-profit, non-governmental organization committedto the development of a peaceful, prosperous, just,and open Asia-Pacific region. The Foundationsupports programs in Asia that help improvegovernance, law, and civil society; women’sempowerment; economic reform and development;and international relations. Drawing on more than 50years of experience in Asia, the Foundationcollaborates with private and public partners tosupport leadership and institutional development,exchanges, and policy research.
With a network of 17 offices throughout Asia, an officein Washington, D.C., and its headquarters in SanFrancisco, the Foundation addresses these issueson both a country and regional level. In 2006, theFoundation provided more than $53 million in programsupport and distributed 920,000 books andeducational materials valued at $30 million throughoutAsia.
AusAID is the Australian Government agencyresponsible for managing Australia’s overseas aidprogram. The objective of the aid program is to assistdeveloping countries to reduce poverty and achievesustainable development in line with Australia’snational interest.
AusAID provides advice and support to the Ministerand Parliamentary Secretary on development policy,and plans and coordinates poverty reduction activitiesin partnership with developing countries.
AusAID’s head office is in Canberra. AusAID alsohas representatives in 25 Australian diplomaticmissions overseas.