The Proposed Minimum Wage Law for Los Angeles
99
POLICY BRIEF March 2015 CWED The Proposed Minimum Wage Law for Los Angeles: Economic Impacts and Policy Options by Michael Reich, Ken Jacobs, Annette Bernhardt and Ian Perry With the assistance of Miranda Dietz and Laurel Lucia A Report to the Los Angeles City Council Michael Reich is a Professor at UC Berkeley and Director of the UC Berkeley Institute for Research on Labor and Employment; Ken Jacobs is the Chair of the UC Berkeley Center for Labor Research and Education; Annette Bernhardt is a visiting professor of sociology and senior researcher, Institute for Research on Labor and Employment; Ian Perry is a researcher at the UC Berkeley Center for Labor Research and Education. Acknowledgments: We thank Lindsay Cattell, William Lester and Jenifer MacGillvary for their valuable assistance, as well as staff of the California Employment Development Department. Center on Wage and Employment Dynamics Institute for Research on Labor and Employment University of California, Berkeley
Transcript of The Proposed Minimum Wage Law for Los Angeles
POLICY BRIEFMarch 2015
CWED
The Proposed Minimum Wage Law for Los Angeles: Economic Impacts and Policy Options
by Michael Reich, Ken Jacobs, Annette Bernhardt and Ian PerryWith the assistance of Miranda Dietz and Laurel Lucia
A Report to the Los Angeles City Council
Michael Reich is a Professor at UC Berkeley and Director of the UC Berkeley Institute for Research on Labor and Employment; Ken Jacobs is the Chair of the UC Berkeley Center for Labor Research and Education; Annette Bernhardt is a visiting professor of sociology and senior researcher, Institute for Research on Labor and Employment; Ian Perry is a researcher at the UC Berkeley Center for Labor Research and Education.
Acknowledgments: We thank Lindsay Cattell, William Lester and Jenifer MacGillvary for their valuable assistance, as well as staff of the California Employment Development Department.
Center on Wage and Employment DynamicsInstitute for Research on Labor and Employment
University of California, Berkeley
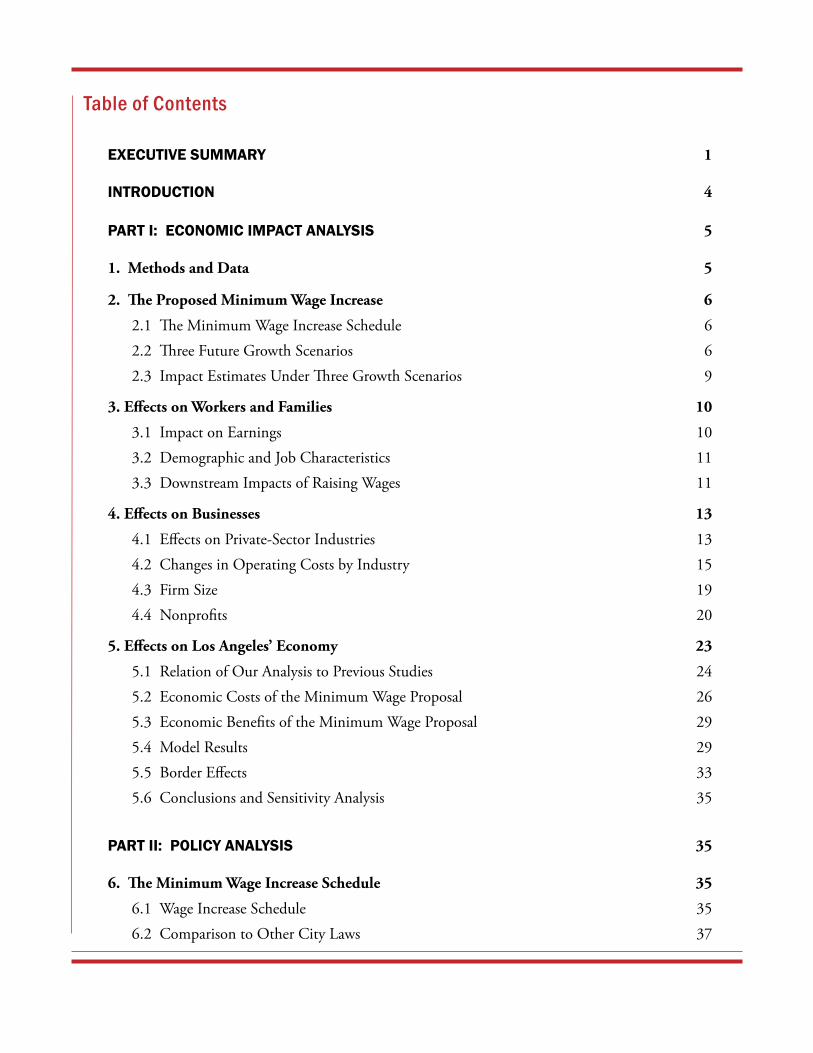
Table of Contents
EXECUTIVE SUMMARY 1
INTRODUCTION 4
PART I: ECONOMIC IMPACT ANALYSIS 5
1. Methods and Data 5
2. The Proposed Minimum Wage Increase 6
2.1 The Minimum Wage Increase Schedule 62.2 Three Future Growth Scenarios 62.3 Impact Estimates Under Three Growth Scenarios 9
3. Effects on Workers and Families 10
3.1 Impact on Earnings 103.2 Demographic and Job Characteristics 113.3 Downstream Impacts of Raising Wages 11
4. Effects on Businesses 13
4.1 Effects on Private-Sector Industries 134.2 Changes in Operating Costs by Industry 154.3 Firm Size 194.4 Nonprofits 20
5. Effects on Los Angeles’ Economy 23
5.1 Relation of Our Analysis to Previous Studies 245.2 Economic Costs of the Minimum Wage Proposal 265.3 Economic Benefits of the Minimum Wage Proposal 295.4 Model Results 295.5 Border Effects 335.6 Conclusions and Sensitivity Analysis 35
PART II: POLICY ANALYSIS 35
6. The Minimum Wage Increase Schedule 35
6.1 Wage Increase Schedule 356.2 Comparison to Other City Laws 37
7. Indexing 40
7.1 Floors and Ceilings 417.2 Mechanisms to Slow or Halt Scheduled Increases 42
8. Enforcement 42
8.1 Enforcement-Related Provisions in the Law Itself 438.2 The Creation of an Enforcement Agency 448.3 Best Enforcement Practices 458.4 The Role of Community Partnerships 45
9. Nonprofits and Small Businesses 46
9.1 Nonprofit Organizations 469.2 Small Businesses 48
10. Total Compensation 49
11. Other Issues 50
11.1 Teens 5011.2 The Hotel Minimum Wage Law 51
CONCLUSIONS 51
REFERENCES 53
ENDNOTES 64
APPENDIX A: Data and Methods 68
APPENDIX B: The Research Literature on Minimum Wage Effects 81
APPENDIX C: Los Angeles Neighborhood Impact Maps 93
1 Proposed Minimum Wage Law for Los Angeles
Executive Summary
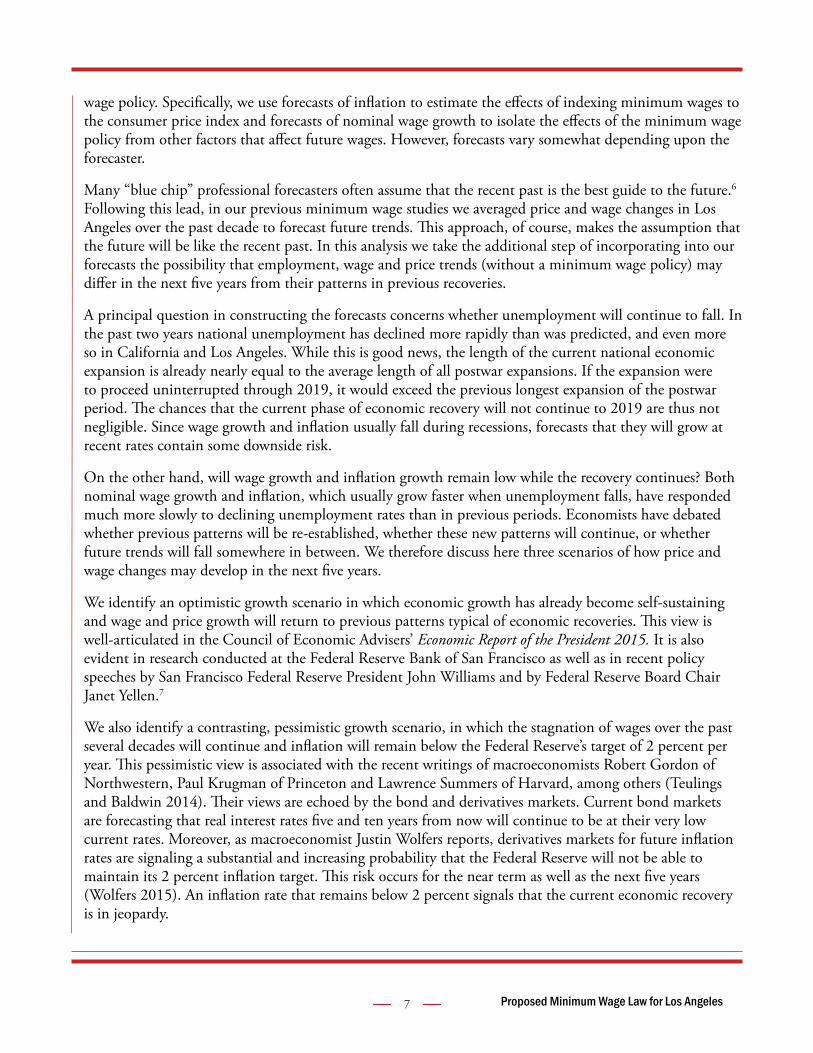
The Los Angeles City Council is considering a citywide minimum wage increase to $13.25 by 2017 and $15.25 by 2019, followed by annual increases indexed to inflation. In this prospective study, we assess the economic impact of the proposal on workers, businesses and the city’s economy, and analyze a range of policy design options. Our below findings are based on a mid-range scenario for future wage and inflation growth in Los Angeles. If actual economic growth turns out to be stronger or weaker than in this scenario, our assessment would change accordingly.
Effects on Workers
• The proposed policy would result in significant benefits to workers and their families. By 2017, we estimate that 542,000 workers in Los Angeles, or 37.8 percent of the covered workforce, will receive a wage increase from the proposed law. These estimates include a ripple effect in which some workers who earn above the new minimum wage also receive an increase. Average annual earnings will increase by 20.4 percent, or $3,200 (in 2014 dollars).
• By 2019, we estimate that 609,000, or 41.3 percent of the covered workforce, will receive a wage increase from the proposed law. Average annual earnings will increase by 30.2 percent, or $4,800 (in 2014 dollars).
• The large majority of affected workers will be adults with a median age of 33 (only 3 percent are teens).
• The proposed minimum wage increase will disproportionately benefit workers of color, who represent over 80 percent of affected workers. In particular, we estimate that more than half of Latino/a workers in Los Angeles will receive a pay increase.
• The median annual earnings of affected workers ($16,600 in 2014 dollars) is about half of the median income for all workers in Los Angeles. Affected workers are disproportionately employed in part-time and part-year jobs, and are also less likely to have health insurance through their employer.
• Affected workers disproportionately live in low-income families; on average, affected workers bring home more than half of their family’s income.
• Affected workers live disproportionately in the lower-income areas of the city. These areas will experience much greater earnings gains than the city as a whole.
• The research literature suggests that there may be downstream benefits from the proposed wage increase, such as improved health outcomes for both workers and their children, and increases in children’s school achievement and cognitive and behavioral outcomes.
Effects on Businesses
• We estimate that the majority of workers getting a raise from the proposed law are employed in the private, for-profit sector. Four industries alone account for half of the affected workforce by 2019: food services, which is largely restaurants (17.3 percent), health care and social assistance (12.9

2 Proposed Minimum Wage Law for Los Angeles
percent), retail trade (14.0 percent), and administrative and waste management services, such as temp agencies and janitorial and security contractors (9.4 percent).
• We estimate that about 40 percent of affected workers are employed at firms with fewer than 50 employees. At the other end of the size range, close to 40 percent of affected workers are employed at firms with 500 employees or more.
• Minimum wage increases do not affect all industries equally. For example, we estimate that 79.7 percent of workers in the restaurant industry will receive a wage increase by 2019; that figure is only 19.1 percent in Professional and Scientific Services industries.
• Overall, we estimate that firms’ operating costs will increase by 0.5 percent by 2017 and 0.9 percent by 2019 as a result of the proposed law; these are cumulative estimates and will be spread over several years. The largest increases will occur in food services, administrative and waste management services, and apparel manufacturing.
• We estimate that 6 percent of the workers projected to receive increases are employed in one of Los Angeles’ 2,500 nonprofit organizations. The impact of the proposed law varies considerably across the nonprofit sector, with the largest effects in residential care and early care and education.
Costs and Benefits for Los Angeles’ Economy
• On the cost side, we find that employers will pass on their increased operating costs to consumers via prices, after accounting for savings from reduced employee turnover. As a result of these price increases, consumer demand in Los Angeles will decrease by $592 million by 2017 and $1.128 billion by 2019 (nominal dollars).
• While price increases reduce consumer demand, increases in low-wage workers’ wages will have the opposite effect. On the benefits side, we estimate that the total wage increase from the proposed law (net of reductions in public assistance and lost worker income due to reductions in consumer demand) will be $1.361 billion by 2017 and $2.381 billion by 2019 (nominal dollars). These increased incomes generate further spending benefits through multiplier effects.
• The costs of the proposed minimum wage law will be concentrated in Los Angeles City, but the full benefits will be realized throughout Los Angeles County, because more than half of the affected workers live, and therefore spend most of their increased earnings, outside the city.1. Los Angeles City: Combining costs and benefits and taking into account multiplier effects,
we estimate a cumulative net reduction in GDP of $135 million by 2017 and $315 million by 2019, or 0.1 percent compared to a scenario with no city minimum wage increase. These effects on the level of economic activity correspond to a cumulative net reduction in employment in Los Angeles City of 1,552 jobs by 2017 and 3,472 jobs by 2019, or 0.1 and 0.2 percent of all employment, respectively. These employment changes are quite small when compared to projected job growth of 2.5 percent a year in the city.
2. Los Angeles County: Combining costs and benefits and taking into account multiplier effects, we estimate a cumulative net increase in employment of 3,666 jobs by 2017 and 5,262 jobs by 2019 at the county level.
• These are cumulative estimates, which will be spread over a number of years; 2017 estimates will be spread over 2015-2017, and 2019 estimates will be spread over 2015-2019.

3 Proposed Minimum Wage Law for Los Angeles
• We project a nominal increase in sales and business tax receipts for the City of $2.6 million in 2017 and $4.7 million in 2019. We were not able to project increases in costs to the City budget.
• Previous research suggests that business relocations in the Los Angeles area are more determined by real estate prices and access to consumer markets than by differences in labor costs. Wages are likely to rise just outside of Los Angeles City as businesses there will want to hold on to their workforce. The low levels of retail vacancy rates inside and near Los Angeles City will also mitigate any net business exodus.
• Recent research also suggests that any business closures stimulated by minimum wage increases tend to be offset by additional new businesses.
Policy Assessment
• We find that the benefits of the proposed minimum wage law will largely outweigh the costs in Los Angeles City, and when the larger region is considered, the net impact of the law will be positive.
• The high density of low-wage jobs in Los Angeles means that the benefits of raising the minimum wage will be considerable; it also means that the risks of unintended effects are greater, especially at higher wage levels.
• In implementing a local minimum wage ordinance of the proposed magnitude, it will be essential to monitor the program as it develops. Support will be needed for small businesses and nonprofit agencies to make the transition toward higher wages, and to secure increases in reimbursement rates for nonprofits funded through government subsidies.
• Finally, given the high rates of workplace violations in Los Angeles, the goals of the minimum wage proposal will be realized only by including robust enforcement language in the law, creating a city enforcement agency, and implementing good enforcement practices and policies.
Our goal in this report has been to provide the Los Angeles City Council the best information available as it weighs these competing factors in designing the best policy for the city’s workers, businesses and residents.

4 Proposed Minimum Wage Law for Los Angeles
Introduction
The Los Angeles City Council is considering a citywide minimum wage increase to $13.25 by 2017 and $15.25 by 2019, followed by annual increases based on the Consumer Price Index for Urban Wage Earners and Clerical Workers for the Los Angeles metropolitan area. In this prospective study, we first analyze the economic impact of the proposal on workers, businesses and the city’s economy. We then assess a range of policy design options, including a review of best practices for enforcing the proposed law.
The economic context for this study is a city that by employment-based measures is well on its way to recovering from the Great Recession. Although Los Angeles experienced steeper unemployment increases and job losses during the recession compared to the U.S. overall, it has regained much of the lost ground in the recovery that began in 2010. In its recent economic forecast report, the Los Angeles County Economic Development Corporation (2015) estimates that county employment in 2015 will surpass the pre-recession peak in 2007.
The return to growth is especially apparent in the past two years. For example, from December 2013 to December 2014 the city’s employment grew by 3.3 percent, outpacing California’s rate of 2.6 percent and the U.S. rate of 2.3 percent.1 And while the city’s unemployment rate of 8.3 percent (in December 2014) is still higher than either the state or the national average, Figure 1 shows that it has been dropping at rates that are similar to those of California and the U.S. as a whole.2
0.0
2.0
4.0
6.0
8.0
10.0
12.0
14.0
16.0
18.0
Dec
-07
Jan-
09
Jan-
10
Jan-
11
Jan-
12
Jan-
13
Jan-
14
Dec
-14
Unem
ploy
men
t ra
te (p
erce
nt)
Fig 1. Monthly Unemployment Rate, Dec 2007 - Dec 2014(seasonally adjusted)
US
California
Los AngelesCity

5 Proposed Minimum Wage Law for Los Angeles
At the same time, workers’ wages have not recovered. Between 2007 and 2013, median annual earnings (adjusted for inflation) fell by 9.9 percent for those who work in the city of Los Angeles.3 And according to a recent Brookings Institution report, household income inequality4 in Los Angeles ranks ninth among U.S. cities and has increased since the start of the recession (Berube 2014). Los Angeles also ranks highest in California in child poverty rates. In short, although the city is experiencing strong economic growth, which has spurred employment, poverty and inequality remain high and wages continue to stagnate. The policy question at hand is whether the proposed city minimum wage law will provide meaningful income increases to low-wage workers and their families, and whether it can do so without imposing unintended harm on the intended beneficiaries and the city as a whole.
Part I: Economic Impact Analysis
1. Methods and Data
A prospective assessment of the impact of a proposed law inherently involves uncertainty about future economic trends and about the final provisions of the law itself. This uncertainty is especially true of the new wave of city minimum wage laws, which are adopting higher wage standards than have historically been implemented (and therefore studied) in the U.S.. Compounding the challenge, there is no simple existing economic model consistent with the empirical minimum wage research literature that can be used to estimate the impact of a minimum wage law, taking into account all the direct and indirect effects as they course through a regional economy (we elaborate on this point later in the report).
This report builds upon a research design developed by the UC Berkeley Center on Wage and Employment Dynamics over the past year in several previous studies of proposed city minimum wage laws.5 It goes well beyond the research and substantive scope of those studies, especially in our discussions of detailed industries, our use of and modifications to existing regional economic models, and our discussion of effects at the city’s borders. Appendix A gives a detailed discussion of both the methods and datasets used; here we provide a brief summary.
The logic of our research design is to first estimate the number of workers that will receive a wage increase under the proposed law, as well as the size of those wage increases.
Our model simulates Los Angeles’ wage distribution into the future, under two scenarios. In the first scenario, the proposed minimum wage law is adopted; in the second scenario, the proposed law is not adopted. We then compare the two scenarios and estimate, for each yearly phase-in step, the number of workers that would be affected by the city law and the additional wages they would receive as a result (above and beyond state minimum wage increases). In constructing these estimates, our simulation models adjust for expected growth in employment, wages and inflation over time. Our estimates also take into account what is often referred to as a “ripple” or “compression” effect: workers who make slightly more than the new proposed minimum wage level are also likely to receive wage increases.
With these baseline estimates in hand, we then turn to a detailed analysis of the policy’s effects on workers, businesses and the economy. In these analyses, we draw on a range of government data sources, the large

6 Proposed Minimum Wage Law for Los Angeles
body of economic research on the minimum wage, and regional economic models. These data sources and models are fully documented in the text and accompanying endnotes.
Finally, throughout the report we draw on the invaluable information and input gained in meetings with the full range of stakeholders (from the business, nonprofit and labor communities) as well as members of the Los Angeles City Council and public comments filed before the issuance of the Request for Proposals.
2. The Proposed Minimum Wage Increase
2.1 The Minimum Wage Increase Schedule
The Los Angeles City Council asked us to evaluate a city minimum wage proposal that would be phased in over five years, reaching $13.25 by 2017 and $15.25 by 2019. In order to conduct an empirical impact analysis, it is necessary to set wage levels for the intervening years, shown in Table 1. (In practice, changing the exact values of these intervening wage levels does not significantly affect our impact estimates).
Table 1 shows that the yearly percentage increases in nominal dollars become smaller during the five steps of the phase-in schedule, with the biggest increase occurring from 2015 to 2016 (14.6 percent) and the smallest in the last year from 2018 to 2019 (7.0 percent). The table also shows the proposed wage increase schedule after adjusting for inflation, in constant 2014 dollars. From the standpoint of workers and employers, this version of the wage increase schedule is more relevant, reflecting the actual value of the minimum wage in the context of a given year’s prices. For example, a nominal 2019 wage of $15.25 will actually be worth $13.66 in terms of today’s buying power. For employers, the yearly increases in real labor costs are also lower, ranging from a high of 12.1 percent to 4.5 percent.
2.2 Three Future Growth Scenarios
To analyze the effects of the proposed minimum wage increases through 2019, we incorporate forecasts of the future trajectories of the price and wage changes that would occur in the absence of the minimum
Table 1. Wage Schedule for the Proposed Minimum Wage Policy
Year Nominal Dollars Percentage Increase from Previous Year Constant 2014 Dollars Percentage Increase
from Previous Year
2014 (actual) $9.00 $ 9.00
2015 $10.25 13.9 $10.09 12.1
2016 $11.75 14.6 $11.30 12.1
2017 $13.25 12.8 $12.45 10.1
2018 $14.25 7.5 $13.08 5.0
2019 $15.25 7.0 $13.66 4.5
Note: Constant dollar values are calculated using the mid-
7 Proposed Minimum Wage Law for Los Angeles
wage policy. Specifically, we use forecasts of inflation to estimate the effects of indexing minimum wages to the consumer price index and forecasts of nominal wage growth to isolate the effects of the minimum wage policy from other factors that affect future wages. However, forecasts vary somewhat depending upon the forecaster.
Many “blue chip” professional forecasters often assume that the recent past is the best guide to the future.6 Following this lead, in our previous minimum wage studies we averaged price and wage changes in Los Angeles over the past decade to forecast future trends. This approach, of course, makes the assumption that the future will be like the recent past. In this analysis we take the additional step of incorporating into our forecasts the possibility that employment, wage and price trends (without a minimum wage policy) may differ in the next five years from their patterns in previous recoveries.
A principal question in constructing the forecasts concerns whether unemployment will continue to fall. In the past two years national unemployment has declined more rapidly than was predicted, and even more so in California and Los Angeles. While this is good news, the length of the current national economic expansion is already nearly equal to the average length of all postwar expansions. If the expansion were to proceed uninterrupted through 2019, it would exceed the previous longest expansion of the postwar period. The chances that the current phase of economic recovery will not continue to 2019 are thus not negligible. Since wage growth and inflation usually fall during recessions, forecasts that they will grow at recent rates contain some downside risk.
On the other hand, will wage growth and inflation growth remain low while the recovery continues? Both nominal wage growth and inflation, which usually grow faster when unemployment falls, have responded much more slowly to declining unemployment rates than in previous periods. Economists have debated whether previous patterns will be re-established, whether these new patterns will continue, or whether future trends will fall somewhere in between. We therefore discuss here three scenarios of how price and wage changes may develop in the next five years.
We identify an optimistic growth scenario in which economic growth has already become self-sustaining and wage and price growth will return to previous patterns typical of economic recoveries. This view is well-articulated in the Council of Economic Advisers’ Economic Report of the President 2015. It is also evident in research conducted at the Federal Reserve Bank of San Francisco as well as in recent policy speeches by San Francisco Federal Reserve President John Williams and by Federal Reserve Board Chair Janet Yellen.7
We also identify a contrasting, pessimistic growth scenario, in which the stagnation of wages over the past several decades will continue and inflation will remain below the Federal Reserve’s target of 2 percent per year. This pessimistic view is associated with the recent writings of macroeconomists Robert Gordon of Northwestern, Paul Krugman of Princeton and Lawrence Summers of Harvard, among others (Teulings and Baldwin 2014). Their views are echoed by the bond and derivatives markets. Current bond markets are forecasting that real interest rates five and ten years from now will continue to be at their very low current rates. Moreover, as macroeconomist Justin Wolfers reports, derivatives markets for future inflation rates are signaling a substantial and increasing probability that the Federal Reserve will not be able to maintain its 2 percent inflation target. This risk occurs for the near term as well as the next five years (Wolfers 2015). An inflation rate that remains below 2 percent signals that the current economic recovery is in jeopardy.
8 Proposed Minimum Wage Law for Los Angeles
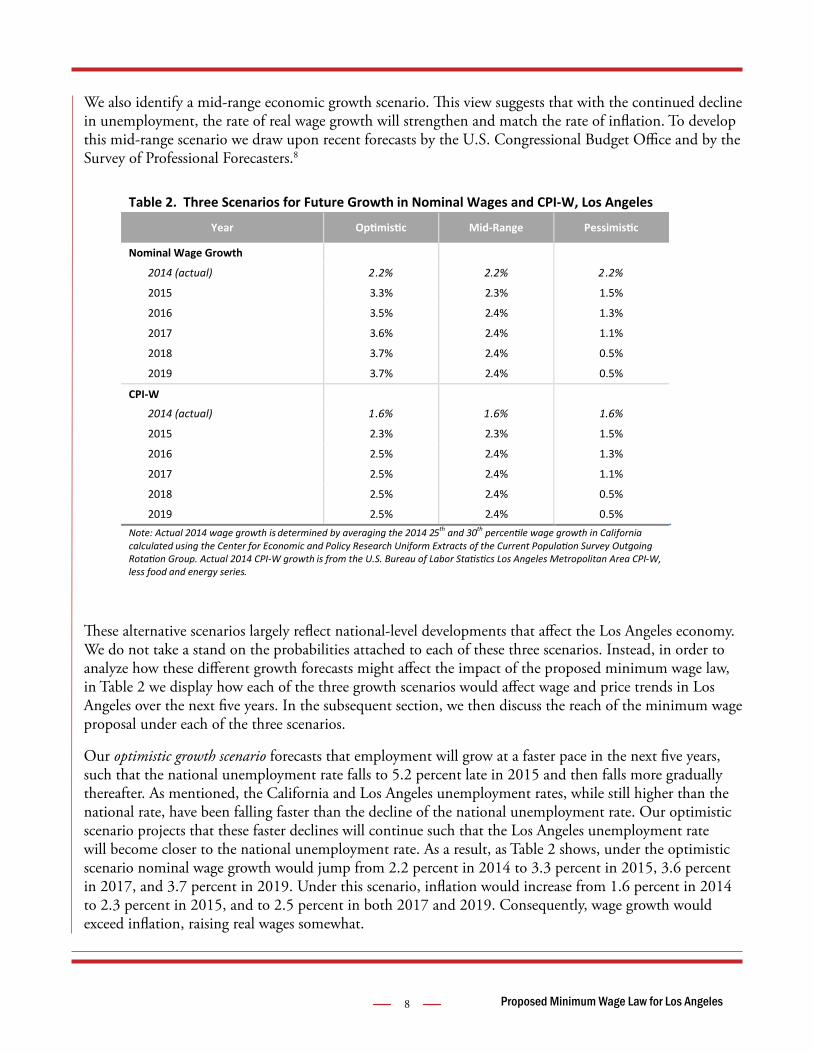
We also identify a mid-range economic growth scenario. This view suggests that with the continued decline in unemployment, the rate of real wage growth will strengthen and match the rate of inflation. To develop this mid-range scenario we draw upon recent forecasts by the U.S. Congressional Budget Office and by the Survey of Professional Forecasters.8
These alternative scenarios largely reflect national-level developments that affect the Los Angeles economy. We do not take a stand on the probabilities attached to each of these three scenarios. Instead, in order to analyze how these different growth forecasts might affect the impact of the proposed minimum wage law, in Table 2 we display how each of the three growth scenarios would affect wage and price trends in Los Angeles over the next five years. In the subsequent section, we then discuss the reach of the minimum wage proposal under each of the three scenarios.
Our optimistic growth scenario forecasts that employment will grow at a faster pace in the next five years, such that the national unemployment rate falls to 5.2 percent late in 2015 and then falls more gradually thereafter. As mentioned, the California and Los Angeles unemployment rates, while still higher than the national rate, have been falling faster than the decline of the national unemployment rate. Our optimistic scenario projects that these faster declines will continue such that the Los Angeles unemployment rate will become closer to the national unemployment rate. As a result, as Table 2 shows, under the optimistic scenario nominal wage growth would jump from 2.2 percent in 2014 to 3.3 percent in 2015, 3.6 percent in 2017, and 3.7 percent in 2019. Under this scenario, inflation would increase from 1.6 percent in 2014 to 2.3 percent in 2015, and to 2.5 percent in both 2017 and 2019. Consequently, wage growth would exceed inflation, raising real wages somewhat.
Table 2. Three Scenarios for Future Growth in Nominal Wages and CPI-W, Los Angeles
Year Mid-Range
Nominal Wage Growth
2014 (actual) 2.2% 2.2% 2.2%
2015 3.3% 2.3% 1.5%
2016 3.5% 2.4% 1.3%
2017 3.6% 2.4% 1.1%
2018 3.7% 2.4% 0.5%
2019 3.7% 2.4% 0.5%
CPI-W
2014 (actual) 1.6% 1.6% 1.6%
2015 2.3% 2.3% 1.5%
2016 2.5% 2.4% 1.3%
2017 2.5% 2.4% 1.1%
2018 2.5% 2.4% 0.5%
2019 2.5% 2.4% 0.5% Note: Actual 2014 wage growth is determined by averaging the 2014 25th and 30th calculated using the Center for Economic and
Actual 2014 CPI-W growth -W, less food and energy series.

9 Proposed Minimum Wage Law for Los Angeles
Our mid-range growth scenario forecasts that wage growth will increase from 2.2 percent in 2014 to 2.3 percent in 2015, 2.4 percent in 2017, and 2.4 percent in 2019. In the same scenario, prices would increase 2.3 percent in 2015, 2.4 percent in 2017, and 2.4 percent in 2019. As a result, nominal wage growth would match inflation, leaving real wages unchanged.
Finally, our pessimistic growth scenario forecasts that wage growth will decelerate, but that wages will continue to increase, in part because even in recessions nominal wage reductions are not the norm. We forecast that both wages and prices would increase only 1.5 percent in 2015, 1.1 percent in 2017, and 0.5 percent in 2019. Thus, the pessimistic growth scenario outlined in Table 2 shows an expected decline in both inflation and nominal wage growth.
2.3 Impact Estimates Under Three Growth Scenarios
Table 3 estimates the number of workers in Los Angeles that will receive a wage increase from the proposed minimum wage law, under the three different growth scenarios.
Table 3. Cumulative Number of Workers Affected by Proposed Minimum Wage Law Under Three Growth Scenarios
Year Number of Affected Workers
(cumulative)
Number of Directly Affected Workers
(cumulative)
Number of Indirectly Affected Workers
(cumulative)
Percent of Covered
Workforce (cumulative)
Percent of Covered
Workforce Directly Affected
(cumulative)
Percent of Covered
Workforce Indirectly Affected
(cumulative) Mid-Range Scenario
2015 388,000 310,000 78,000 27.9 22.3 5.6
2016 477,000 384,000 93,000 33.8 27.2 6.6
2017 542,000 446,000 96,000 37.8 31.1 6.7
2018 567,000 479,000 88,000 39.0 32.9 6.1
2019 609,000 511,000 98,000 41.3 34.6 6.7
Optimistic Scenario
2015 386,000 305,000 81,000 27.7 21.9 5.8
2016 465,000 375,000 90,000 32.9 26.5 6.4
2017 525,000 423,000 102,000 36.6 29.5 7.1
2018 544,000 436,000 108,000 37.4 30.0 7.4
2019 570,000 457,000 113,000 38.6 31.0 7.6
Pessimistic Scenario
2015 390,000 314,000 76,000 28.0 22.5 5.5
2016 487,000 392,000 95,000 34.4 27.7 6.7
2017 556,000 472,000 84,000 38.8 32.9 5.9
2018 600,000 515,000 84,000 41.2 35.4 5.8
2019 653,000 562,000 91,000 44.3 38.1 6.1
Source: Authors’ analysis of ACS and QCEW data. See appendix for details. Note: The proposed minimum wage proposal will not cover self-employed workers, state and federal workers, or workers employed by the Los Angeles Unified School District. Directly affected workers are those with wages below the proposed new minimum wage level in each year. Indirectly affected workers are those with wages slightly above the proposed new minimum wage, who will receive an increase via the ripple effect.

10 Proposed Minimum Wage Law for Los Angeles
In the mid-range scenario, we estimate that 388,000 workers will receive a wage increase in the first year of implementation. Of these, 310,000 are directly affected (they earn less than the new minimum wage) and 78,000 are indirectly affected (they earn slightly more than the new minimum wage but will receive an increase via the ripple increase).9 By 2019, we estimate that 609,000 workers (or 41.3 percent of the covered workforce) will be affected by the law in this scenario. Using the covered workforce (rather than the entire workforce) as the denominator is important, because the proposed minimum wage policy will not cover self-employed workers, state and federal workers, or workers employed by the Los Angeles Unified School District.
Our estimates of numbers of workers affected are lower in the optimistic scenario, which forecasts strong wage growth (faster than the rate of inflation) during the implementation period, meaning that there will be fewer low-wage workers covered by the proposed law. On the flip side, our estimates are higher in the pessimistic scenario, which forecasts weak wage growth during the implementation period, meaning that there will be more low-wage workers covered by the proposed law.
We have provided impact estimates under these three different growth forecasts in order to highlight how the effect of the proposed minimum wage law would differ depending on the city’s economic growth trajectory in the next five years (we return to this point in Section 6.1). However, as Table 3 shows, our forecasts differ only modestly across the three growth scenarios. For this reason, and to simplify our analysis, we will draw only upon the mid-range scenario estimates in the following sections of our report.
3. Effects on Workers and Families
3.1 Impact on Earnings
We next estimate the size of the earnings increase (compared to projected earnings under the state minimum wage law) that affected workers would receive as a result of the proposed city law. Table 4 shows the estimated cumulative increase in affected workers’ hourly wages, annual earnings and percentage change in annual earnings, as well as the total earnings increase for all affected workers.
We estimate that affected workers will on average receive an hourly wage increase of $1.82 by 2017 and $2.73 by 2019. On an annual basis, this amounts to an estimated additional $3,200 per year by 2017 and
Table 4. Cumulative Pay Increases for Workers Affected by the Proposed Minimum Wage Policy (in 2014 dollars)
2015 2016 2017 2018 2019
Average Cumulative Hourly Wage Increase $0.72 $1.05 $1.82 $2.33 $2.73
Average Cumulative Annual Earnings Increase $800 $1,800 $3,200 $4,000 $4,800
Average Cumulative Percent Annual Earnings Increase 5.6 11.9 20.4 25.9 30.2
Total Cumulative Increase In Earnings (millions) $310 $861 $1,708 $2,289 $2,895
Source: Authors’ analysis of ACS and QCEW data. Notes: Estimates were calculated using the mid-range wage growth and inflation scenario and include both directly and indirectly affected workers. Results are cumulative across the phase-in years.

11 Proposed Minimum Wage Law for Los Angeles
$4,800 by 2019—or a 20.4 and 30.2 percent increase in earnings, respectively. As a whole, we estimate that affected workers in Los Angeles will earn an additional $1.7 billion in earnings by 2017 and $2.9 billion by 2019. All estimates are listed in 2014 dollars.
Appendix C provides maps of the geographic distribution among Los Angeles’ Community Planning Areas of several minimum wage policy impact measures by 2019. Of the affected workers who reside in the city, most live in neighborhoods with low median incomes, meaning the aggregate wage increase will have the largest impact in these poorer areas. This conclusion holds both when looking at the percentage of workers within a Community Planning Area that will be affected (Figure C1) and when considering the distribution of additional incomes across the city (Figure C2). In other neighborhoods with higher median incomes, fewer resident workers will be affected by the proposed law. The concentration of wage increases in poorer neighborhoods suggests that the policy may support existing businesses and stimulate further economic development in those areas.
3.2 Demographic and Job Characteristics
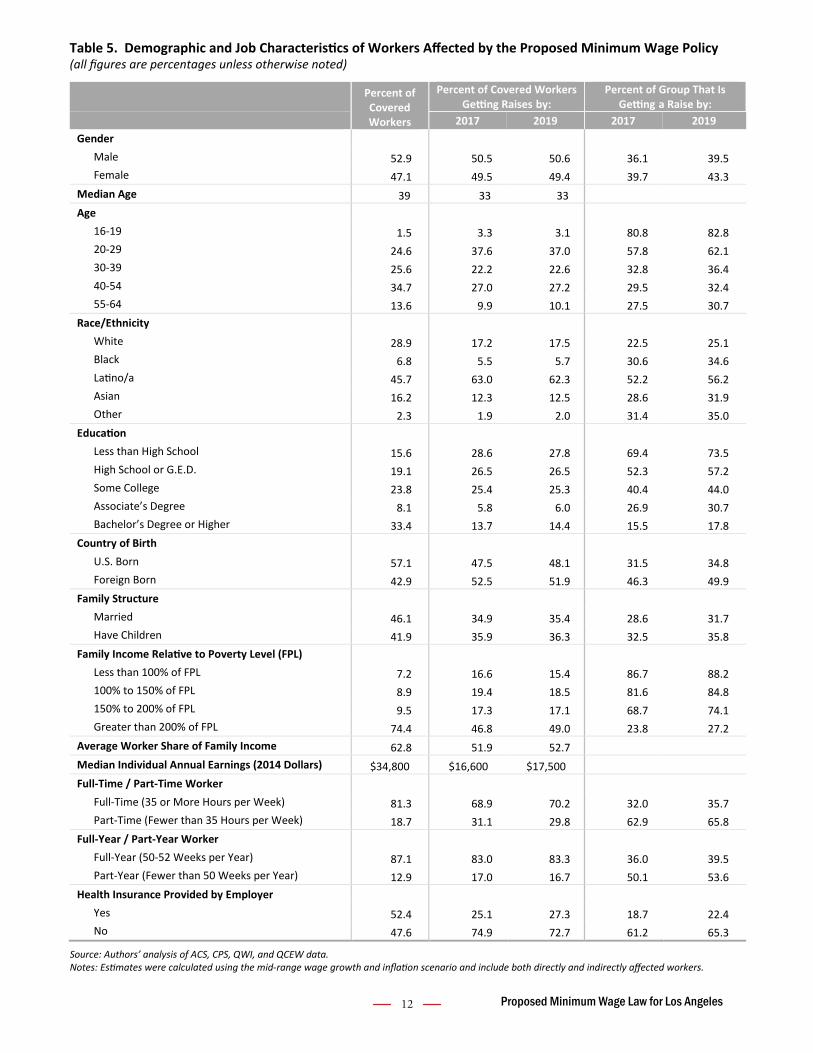
In Table 5, we show the demographic and job characteristics of the affected workers. In the first column, we display the characteristics of all covered workers in Los Angeles. For example, 52.9 percent of all covered Los Angeles workers are men and 47.1 percent are women. In the next two columns we show the distribution of affected workers by 2017 and 2019. For example, we estimate that 50.5 percent of affected workers by 2017 are men and 49.5 percent are women. The final two columns show the share of each demographic group that will receive a wage increase under the proposal in 2017 and 2019. For example, by 2017, 36.1 percent of male workers will be affected by the proposed increase compared to 39.7 percent of female workers. Again, these estimates include both directly and indirectly affected workers (i.e., those receiving a wage increase via the “ripple effect”).
Contrary to popular perception, the large majority of affected workers are adults, with a median age of 33 (only 3 percent are teens). The proposed minimum wage increase will greatly benefit workers of color, who represent over 80 percent of affected workers. In particular, we estimate that more than half of Latino/a workers in Los Angeles will receive a pay increase (52.2 percent in 2017; 56.2 percent in 2019). Workers of all education levels will benefit from the proposed law, with less educated workers benefitting the most.
More than a third of affected workers are parents. Affected workers live disproportionately in low-income families, with more than 50 percent at or below 200 percent of the federal poverty level. It is important to note that on average affected workers bring home more than half of their family’s income.
We estimate that the median annual earnings of affected workers ($16,600 in 2014 dollars) is about half of the median income for all workers in Los Angeles. Affected workers are disproportionately employed in part-time and part-year jobs. They are also less likely to have health insurance through their employer.
3.3 Downstream Impacts of Raising Wages
The increases in earnings shown in Table 4 are significant and stand to have an immediate impact on the lives of Los Angeles’ low-wage workers and their families. But it is important to recognize that there are longer-term benefits as well.
12 Proposed Minimum Wage Law for Los Angeles
Table 5. Demographic and Job Characteristics of Workers Affected by the Proposed Minimum Wage Policy(all figures are percentages unless otherwise noted)
Percent of Covered Workers
Percent of Covered Workers Getting Raises by:
Percent of Group That Is Getting a Raise by:
2017 2019 2017 2019 Gender
Male 52.9 50.5 50.6 36.1 39.5 Female 47.1 49.5 49.4 39.7 43.3
Median Age 39 33 33 Age
16-19 1.5 3.3 3.1 80.8 82.8 20-29 24.6 37.6 37.0 57.8 62.1 30-39 25.6 22.2 22.6 32.8 36.4 40-54 34.7 27.0 27.2 29.5 32.4 55-64 13.6 9.9 10.1 27.5 30.7
Race/Ethnicity White 28.9 17.2 17.5 22.5 25.1 Black 6.8 5.5 5.7 30.6 34.6 Latino/a 45.7 63.0 62.3 52.2 56.2 Asian 16.2 12.3 12.5 28.6 31.9 Other 2.3 1.9 2.0 31.4 35.0
Education Less than High School 15.6 28.6 27.8 69.4 73.5 High School or G.E.D. 19.1 26.5 26.5 52.3 57.2 Some College 23.8 25.4 25.3 40.4 44.0 Associate’s Degree 8.1 5.8 6.0 26.9 30.7 Bachelor’s Degree or Higher 33.4 13.7 14.4 15.5 17.8
Country of Birth U.S. Born 57.1 47.5 48.1 31.5 34.8 Foreign Born 42.9 52.5 51.9 46.3 49.9
Family Structure Married 46.1 34.9 35.4 28.6 31.7 Have Children 41.9 35.9 36.3 32.5 35.8
Family Income Relative to Poverty Level (FPL) Less than 100% of FPL 7.2 16.6 15.4 86.7 88.2 100% to 150% of FPL 8.9 19.4 18.5 81.6 84.8 150% to 200% of FPL 9.5 17.3 17.1 68.7 74.1 Greater than 200% of FPL 74.4 46.8 49.0 23.8 27.2
Average Worker Share of Family Income 62.8 51.9 52.7 Median Individual Annual Earnings (2014 Dollars) $34,800 $16,600 $17,500 Full-Time / Part-Time Worker
Full-Time (35 or More Hours per Week) 81.3 68.9 70.2 32.0 35.7 Part-Time (Fewer than 35 Hours per Week) 18.7 31.1 29.8 62.9 65.8
Full-Year / Part-Year Worker Full-Year (50-52 Weeks per Year) 87.1 83.0 83.3 36.0 39.5 Part-Year (Fewer than 50 Weeks per Year) 12.9 17.0 16.7 50.1 53.6
Health Insurance Provided by Employer Yes 52.4 25.1 27.3 18.7 22.4 No 47.6 74.9 72.7 61.2 65.3
Source: Authors’ analysis of ACS, CPS, QWI, and QCEW data. Notes: Estimates were calculated using the mid-range wage growth and inflation scenario and include both directly and indirectly affected workers.
13 Proposed Minimum Wage Law for Los Angeles
Low wages have been shown to affect workers negatively in a variety of ways, but the health impacts are most pronounced. All else equal, low wages (and in turn poverty) result in increased rates of high blood pressure and high levels of stress, as well as shorter life expectancy (Leigh and Du 2012). In a quasi-natural experiment, additional income led to fewer arrests for parents and increases in parental supervision of their children (Akee et al. 2010). Similarly, increases in Earned Income Tax Credit (EITC) program payments led to improvements in the mental health of mothers (Evans and Garthwaite 2010).
Multiple rigorous studies also establish a causal negative effect of low incomes on outcomes for children. A recent review of peer-reviewed articles found that 29 of 34 studies established a negative effect of poverty on the children’s outcomes (Cooper and Stewart 2013). Using data from a randomized control trial of the Minnesota Family Investment Program, researchers found positive, significant effects on children’s social behavior and school engagement due to increases in income (Morris and Gennetian 2003). Other researchers used data from ten such studies and found significant effects of increased income on school achievement (Duncan et al. 2011).
Generally these studies show that additional income has a positive effect on the outcomes of children in households of all income levels. However, multiple studies also suggest that additional income has a larger effect for very-low-income households compared to middle-income households (Dahl and Lochner 2012; Akee et al. 2010; Costello et al. 2003). Some evidence indicates that additional income early in life is important to cognitive outcomes, whereas additional income in later childhood may be more important in terms of behavioral outcomes (Cooper and Stewart 2013).
4. Effects on Businesses
How a higher minimum wage affects a firm depends on three major factors: the change in the firm’s operating costs, how the firm responds to these increased costs (such as by reducing employment or passing on the cost of the increase to consumers, which in turn depends on the price elasticity of demand for the firm’s product), and how increased consumer buying power as a result of the minimum wage increase affects sales of the firm’s products. In this section we first analyze the impact on operating costs in select industries. We then turn to the variety of ways the increases may be absorbed.
4.1 Effects on Private-Sector Industries
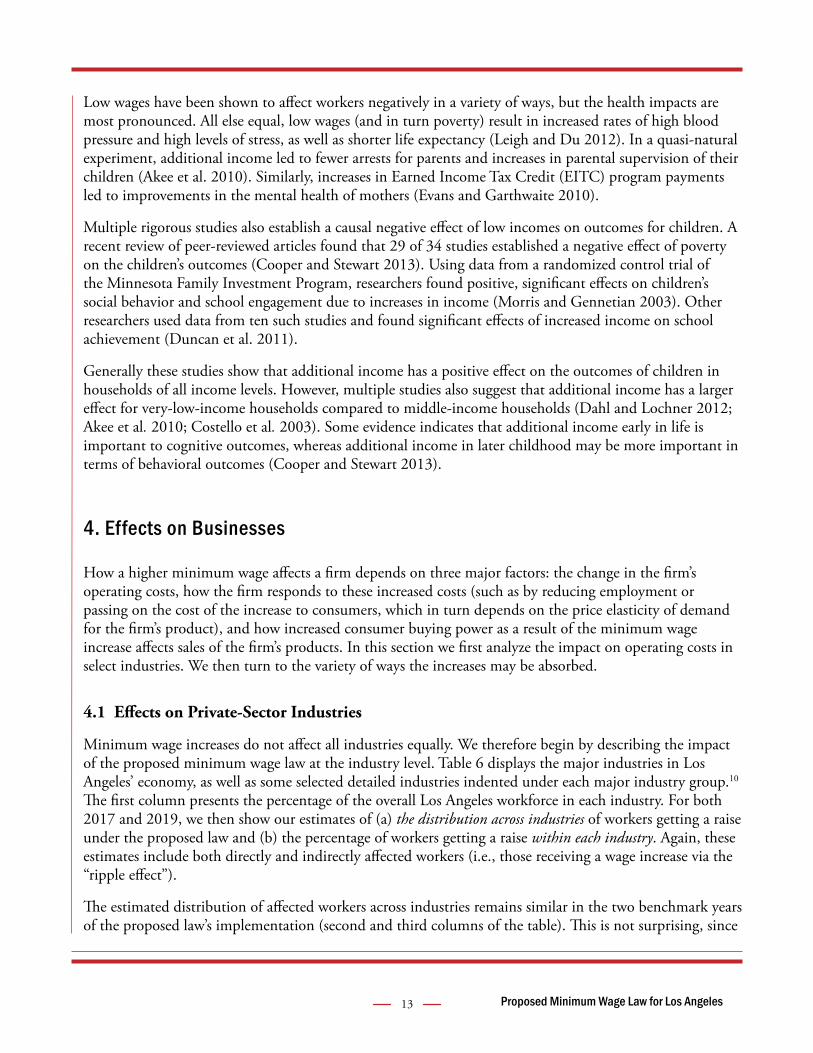
Minimum wage increases do not affect all industries equally. We therefore begin by describing the impact of the proposed minimum wage law at the industry level. Table 6 displays the major industries in Los Angeles’ economy, as well as some selected detailed industries indented under each major industry group.10 The first column presents the percentage of the overall Los Angeles workforce in each industry. For both 2017 and 2019, we then show our estimates of (a) the distribution across industries of workers getting a raise under the proposed law and (b) the percentage of workers getting a raise within each industry. Again, these estimates include both directly and indirectly affected workers (i.e., those receiving a wage increase via the “ripple effect”).
The estimated distribution of affected workers across industries remains similar in the two benchmark years of the proposed law’s implementation (second and third columns of the table). This is not surprising, since
14 Proposed Minimum Wage Law for Los Angeles
Percent of Covered Workers
Percent of Covered Workers Getting a Raise by:
Percent of Industry That Is Getting a Raise by:
2017 2019 2017 2019
Private, For-Profit Sector 84.3 92.6 92.3 41.5 45.2
Agriculture, Forestry, Fishing, Hunting, and Mining 0.2 0.2 0.2 44.8 48.6 Construction 2.5 2.6 2.6 38.1 42.3 Non-Durable Manufacturing 3.0 4.3 4.2 53.8 57.1
Food Manufacturing 0.8 1.2 1.2 58.1 61.0 Apparel Manufacturing 0.9 1.7 1.7 72.1 74.9
Durable Manufacturing 3.9 3.2 3.2 30.6 33.7 Wholesale Trade 4.8 4.7 4.8 37.1 41.7 Retail Trade 9.9 14.2 14.0 54.4 58.5
Grocery Stores 1.9 2.9 2.8 58.0 62.3 Transportation, Warehousing, and Utilities 4.6 3.6 3.7 29.1 33.4
Truck Transportation 0.9 0.9 0.9 38.0 43.6 Information 3.8 1.7 1.9 17.2 20.0 Finance, Insurance, Real Estate, and Rental and Leasing 6.3 3.9 4.1 23.2 26.8 Professional, Scientific, and Management Services 9.5 4.1 4.4 16.5 19.1 Administrative and Waste Management Services 6.4 9.5 9.4 56.0 60.4
Employment Services (e.g., temp agencies) 0.8 1.0 1.0 45.8 50.1 Building Services (e.g., janitorial and security) 2.8 4.8 4.7 65.7 70.3
Educational Services 1.5 1.4 1.4 34.6 38.6 Health Care and Social Assistance 12.9 12.6 12.9 37.0 41.2
Ambulatory Care 5.7 5.4 5.5 35.7 40.4 Hospitals 4.2 2.6 2.7 23.4 26.7 Residential Care Facilities (e.g., nursing homes) 1.5 2.0 2.0 52.2 57.6 Social Assistance 0.9 1.5 1.5 62.9 66.4 Child Day Care Services 0.7 1.2 1.1 64.1 68.1
Arts, Entertainment, Recreation 1.8 1.9 1.9 39.7 43.8 Accommodation* 1.3 1.5 1.6 45.7 51.4 Food Services (largely restaurants) 8.9 18.2 17.3 76.9 79.7 Other Services 2.9 5.0 4.8 65.1 68.7
Personal Services 2.1 3.7 3.6 64.8 68.7 Private, Nonprofit Sector 8.5 6.1 6.3 27.2 30.4 City Government 7.2 1.3 1.4 6.7 8.1 Total: 100.0 100.0 100.0
Table 6. Impact Estimates by Major Industries and Select Detailed Industries
Source: Authors’ analysis of ACS and QCEW data. Note: Estimates were calculated using the mid-range wage growth and inflation scenario and include both directly and indirectly affected workers. * Accommodation estimates do not include the effect of Los Angele’s hotel worker minimum wage law.

15 Proposed Minimum Wage Law for Los Angeles
a local economy’s industry mix does not change significantly over the course of a few years.
The large majority of affected workers are employed in the private, for-profit sector (we analyze the nonprofit sector separately). While affected workers are employed in a broad range of industries, they are concentrated in just a few. Four industries alone account for half (53.5 percent) of the affected workforce by 2019: food services, which is largely restaurants (17.3 percent), health care and social assistance (12.9 percent), retail trade (14.0 percent), and administrative and waste management services, such as temp agencies and janitorial contractors (9.4 percent).
This picture changes when we examine the percentage of each industry’s workforce that will be affected by the proposed law (shown in the third and fourth columns of Table 6). The restaurant industry will experience the largest impact. We estimate that 76.9 percent of its workers will receive a wage increase by 2017, rising to 79.7 percent by 2019. Apparel manufacturing will also experience a large impact, although this industry makes up only 1.7 percent of affected workers overall. Other high-impact industries include building services, food manufacturing, grocery stores, social assistance and child care, residential care facilities, and personal services.
Table 6 also makes clear that a variety of industries will see modest impacts from the proposed law. Not surprisingly, these are typically higher-wage industries, such as finance, insurance and real estate; information; professional and scientific services; transportation, warehousing and utilities; durable manufacturing; and City government employees.
4.2 Changes in Operating Costs by Industry
Given the high shares of workers affected in a number of the industries in Table 6, we next analyze the impact of the proposed minimum wage on firms’ payroll costs and operating costs. In order to do so, however, it is necessary to first understand the relationship between wages and worker turnover.
Impact of Higher Wages on Turnover and Worker Performance
The correlation between low wages and high employee turnover is well known (Cotton and Tuttle 1986).11 Over the last decade, annual employee turnover in accommodation and food service workers averaged 70 percent a year, compared to 41.4 percent in other services, 30.5 percent in health care and social assistance, and 32 percent in non-durable manufacturing (U.S. Bureau of Labor Statistics, 2014).12 Quits are higher in low-wage occupations because workers leave to find higher-wage jobs or because they are unable to stay in their jobs due to poverty-related problems such as difficulties with transportation, child care or health. At the same time wages can be lower in high-turnover industries because employers experience higher turnover costs.
Recent labor market research has gone beyond establishing a correlation between pay and turnover. We now know minimum wage increases have well-identified causal impacts that reduce worker turnover. Dube, Naidu and Reich (2007) found that worker tenure increased substantially in San Francisco restaurants after the 2003 minimum wage law, especially in limited service restaurants. Dube, Lester and Reich (forthcoming) found that a 10 percent increase in the minimum wage results in a 2.1 percent reduction in turnover for restaurant workers and for teens. Jacobs and Graham-Squire (2010) reviewed studies of the impact of living wage laws on employment separations and found that a 1 percent increase in
16 Proposed Minimum Wage Law for Los Angeles
wages is associated with a decline in separations of 1.45 percent.
Turnover creates financial costs for employers (Dube, Freeman and Reich 2010; Hinkin and Tracey 2000; Blake 2000). These costs includes both direct costs for administrative activities associated with departure, recruitment, selection, orientation and training of workers, and the indirect costs associated with lost sales and lower productivity as new workers learn on the job. Hinkin and Tracey (2010) estimate the average turnover cost for hotel front desk employees at $5,864. A study of the cost of supermarket turnover by the Coca Cola Research Council estimated the replacement cost for an $8 an hour non-union worker at $4,199 (Blake 2000). Boushey and Glynn (2012) estimate that the median replacement cost for jobs paying $30,000 or less equals 16 percent of an employee’s annual salary.
Pollin and Wicks-Lim (2015) estimate that 20 percent of the increased costs from a minimum wage increase are offset by reductions in turnover. Similar estimates can be found in Fairris (2005) and Jacobs and Graham-Squire (2010). In a small case study of quick service restaurants in Georgia and Alabama (Hirsch, Kaufman and Zelenska 2011), managers reported they offset 23 percent of the labor cost increases through operational efficiencies.
For our calculations below, we assume that 17.5 percent of the increase in payroll costs is absorbed through lower turnover in the early years of the proposed minimum wage increase.13 However, these turnover savings do not continue to grow at higher wage levels. Dube, Lester and Reich (forthcoming) find that most of the reduction in turnover occurs among workers with less than three months of job tenure. This result suggests that the effect of higher wages on reducing tenure dissipates as wage levels increase. We therefore assume that by 2019, the marginal increase in wages relative to 2017 no longer results in turnover reductions, yielding an overall lower rate of savings from turnover of 11.7 percent in 2019.
Paying workers more can also affect worker performance, morale, absenteeism, the number of grievances, customer service and work effort, among other metrics (Reich, Jacobs and Dietz 2014; Hirsch, Kaufman and Zelenska 2011). We do not estimate cost savings from these effects.
Changes in Operating Costs
Changes in a firm’s operating costs due to a minimum wage increase are determined by the following factors: the share of workers receiving wage increases, the average size of the wage increases, and the labor share of operating costs within the firm. As we saw in Table 6, in most industries only a minority of workers in Los Angeles will receive a wage increase from the proposed law. And among those that do receive an increase, not everyone will receive the full increase (because many of the workers who will see a wage increase already earn more than the current minimum).
Table 7 shows our calculations of changes in payroll costs and operating costs stemming from the proposed minimum wage law for select industries—a combination of the largest industries and industries with the greatest share of workers receiving increases under the law. (Note that this table combines for-profit, nonprofit and public sectors.)
For all industries combined, we find that the proposed minimum wage would increase payroll costs in Los Angeles by 2.1 percent by 2017 and 3.8 percent by 2019, after accounting for the savings from reduced turnover described above (for cost estimates that do not include savings from reduced turnover, see

17 Proposed Minimum Wage Law for Los Angeles
Table 7. Cumulative Change in Operating Costs in High-Impact Industries
2017 2019
All Industries
% Change in Payroll Costs* 2.1 3.8 Labor Costs as % of Operating Costs 22.4 23.2 % Change in Operating Costs 0.5 0.9
Food Services
% Change in Payroll Costs* 12.1 20.2 Labor Costs as % of Operating Costs 32.6 38.6 % Change in Operating Costs 3.9 7.8
Administrative Services and Waste Management
% Change in Payroll Costs* 5.0 8.8 Labor Costs as % of Operating Costs 61.9 64.6 % Change in Operating Costs 3.1 5.7
Other Services
% Change in Payroll Costs* 5.6 9.8 Labor Costs as % of Operating Costs 34.7 37.6 % Change in Operating Costs 1.9 3.7
Health Care and Social Assistance
% Change in Payroll Costs* 1.8 3.2 Labor Costs as % of Operating Costs 48.7 49.8 % Change in Operating Costs 0.9 1.6
Residential Care
% Change in Payroll Costs* 4.8 8.4 Labor Costs as % of Operating Costs 53.0 55.7 % Change in Operating Costs 2.5 4.7
Ambulatory Care
% Change in Payroll Costs* 1.8 3.3 Labor Costs as % of Operating Costs 53.2 54.3 % Change in Operating Costs 1.0 1.8
Hospitals
% Change in Payroll Costs* 0.8 1.5 Labor Costs as % of Operating Costs 44.2 44.7 % Change in Operating Costs 0.3 0.7
Retail Trade
% Change in Payroll Costs* 4.7 8.1 Labor Costs as % of Operating Costs 11.1 12.2 % Change in Operating Costs 0.5 1.0
18 Proposed Minimum Wage Law for Los Angeles
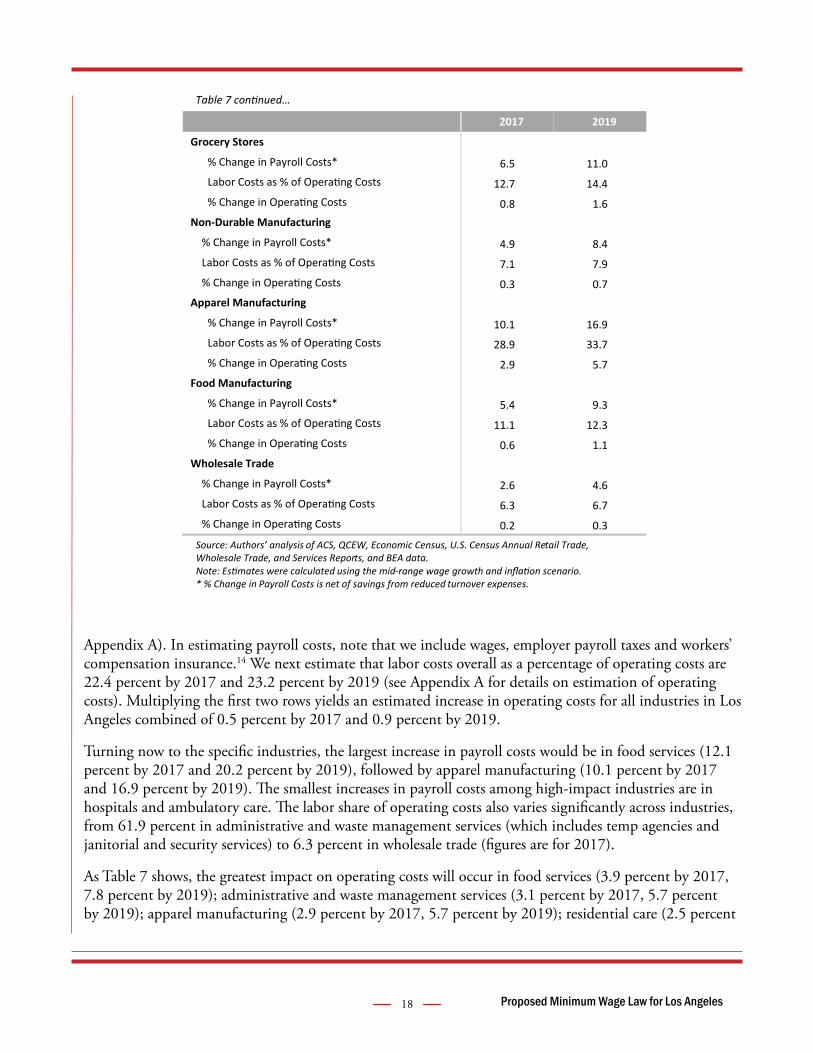
Appendix A). In estimating payroll costs, note that we include wages, employer payroll taxes and workers’ compensation insurance.14 We next estimate that labor costs overall as a percentage of operating costs are 22.4 percent by 2017 and 23.2 percent by 2019 (see Appendix A for details on estimation of operating costs). Multiplying the first two rows yields an estimated increase in operating costs for all industries in Los Angeles combined of 0.5 percent by 2017 and 0.9 percent by 2019.
Turning now to the specific industries, the largest increase in payroll costs would be in food services (12.1 percent by 2017 and 20.2 percent by 2019), followed by apparel manufacturing (10.1 percent by 2017 and 16.9 percent by 2019). The smallest increases in payroll costs among high-impact industries are in hospitals and ambulatory care. The labor share of operating costs also varies significantly across industries, from 61.9 percent in administrative and waste management services (which includes temp agencies and janitorial and security services) to 6.3 percent in wholesale trade (figures are for 2017).
As Table 7 shows, the greatest impact on operating costs will occur in food services (3.9 percent by 2017, 7.8 percent by 2019); administrative and waste management services (3.1 percent by 2017, 5.7 percent by 2019); apparel manufacturing (2.9 percent by 2017, 5.7 percent by 2019); residential care (2.5 percent
…
2017 2019
Grocery Stores
% Change in Payroll Costs* 6.5 11.0 12.7 14.4
0.8 1.6 Non-Durable Manufacturing
% Change in Payroll Costs* 4.9 8.4 Labor Costs as % o 7.1 7.9
0.3 0.7 Apparel Manufacturing
% Change in Payroll Costs* 10.1 16.9 28.9 33.7
2.9 5.7 Food Manufacturing
% Change in Payroll Costs* 5.4 9.3 11.1 12.3
0.6 1.1 Wholesale Trade
% Change in Payroll Costs* 2.6 4.6 6.3 6.7
0.2 0.3
Source: Authors’ analysis of ACS, QCEW, Economic Census, U.S. Census Annual Retail Trade, Wholesale Trade, and Services Reports, and BEA data. Note: were calculated using the mid- * % Change in Payroll Costs is net of savings from reduced turnover expenses.
19 Proposed Minimum Wage Law for Los Angeles
by 2017, 4.7 percent by 2019); and other services (1.9 percent by 2017, 3.7 percent by 2019). For the other industries, the increases in operating costs would be below 2 percent. For example, operating costs for health care and social assistance would increase by 0.9 percent by 2017 and 1.6 percent by 2019, retail trade by 0.5 percent by 2017 and 1.0 percent by 2019, and non-durable manufacturing as a whole by 0.3 percent by 2017 and 0.7 percent by 2019.15
4.3 Firm Size
The lack of robust data on firm size by metropolitan area and industry limits our ability to analyze the impact of the proposed minimum wage law on small firms. The main dataset that we use in our wage simulation model (the American Community Survey) does not have information on the size of workers’ employers. We therefore use the March Supplement of the Current Population Survey, which does include a question on firm size. We note, however, that this variable contains significant measurement error and that our sample size is smaller than ideal. (See Appendix A for more details.)
Two points are important for our analysis. The first concerns the distinction between firms and establishments. Some firms operate many establishments at which they make products or provide services (e.g., multinational clothing retailers with local stores). Those establishments may be small, but the firm itself may be large and—relevant for our purposes—have sufficient economies of scale and market leverage to absorb a minimum wage increase. Second, the distribution of firms across size categories will be different from the distribution of workers across firm size categories. Although there are more small firms than large firms in the economy, the large firms employ many more workers per firm than do the small ones.
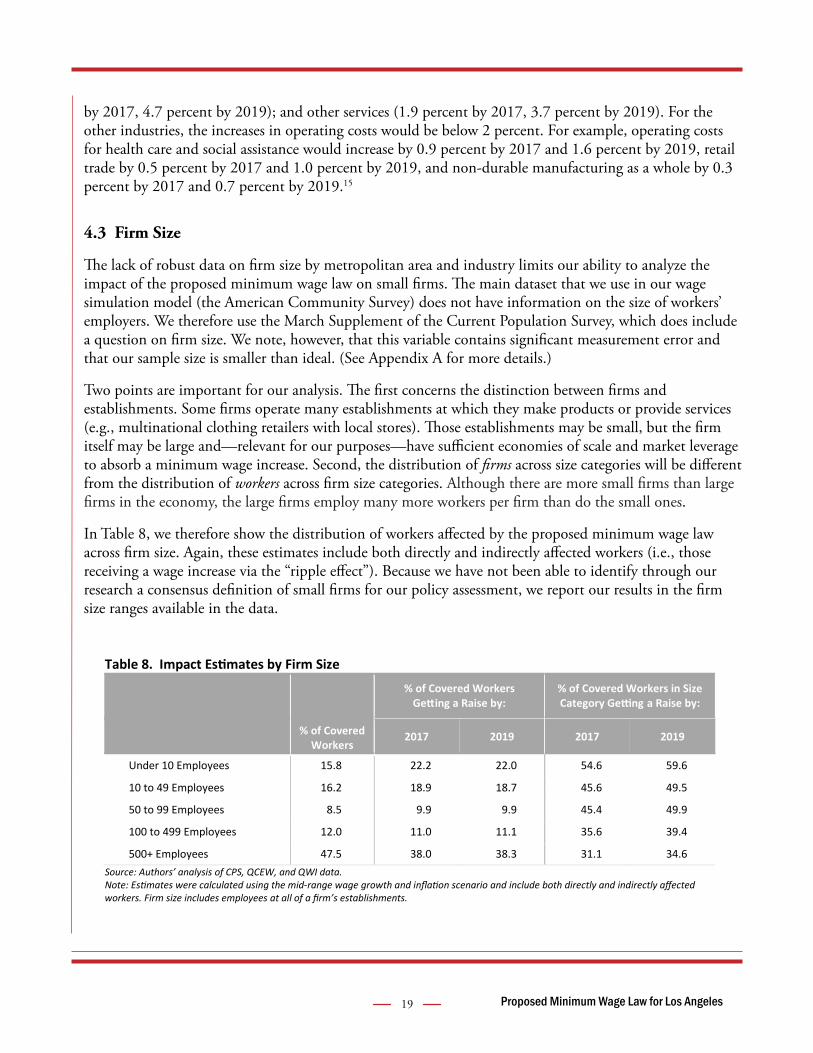
In Table 8, we therefore show the distribution of workers affected by the proposed minimum wage law across firm size. Again, these estimates include both directly and indirectly affected workers (i.e., those receiving a wage increase via the “ripple effect”). Because we have not been able to identify through our research a consensus definition of small firms for our policy assessment, we report our results in the firm size ranges available in the data.
Table 8. Impact Estimates by Firm Size
% of Covered Workers
% of Covered Workers Getting a Raise by:
% of Covered Workers in Size Category Getting a Raise by:
2017 2019 2017 2019
Under 10 Employees 15.8 22.2 22.0 54.6 59.6
10 to 49 Employees 16.2 18.9 18.7 45.6 49.5
50 to 99 Employees 8.5 9.9 9.9 45.4 49.9
100 to 499 Employees 12.0 11.0 11.1 35.6 39.4
500+ Employees 47.5 38.0 38.3 31.1 34.6 Source: Authors’ analysis of CPS, QCEW, and QWI data. Note: Estimates were calculated using the mid-range wage growth and inflation scenario and include both directly and indirectly affected workers. Firm size includes employees at all of a firm’s establishments.

20 Proposed Minimum Wage Law for Los Angeles
The distribution of workers getting a raise across firm size does not differ much between 2017 and 2019, which is not surprising given the short time range. We estimate that about 40 percent of affected workers are employed at firms with fewer than 50 employees. At the other end of the size range, close to 40 percent of affected workers are employed at firms with 500 employees or more.
In short, the impact of the minimum wage increase will span the full range of firm sizes. But as shown in the last two columns of the table, the magnitude of the impact varies by firm size. The percentage of workers receiving a wage increase declines with firm size, and that decline is steady—there are no obvious firm size break-points where the impact of the minimum wage changes sharply.
4.4 Nonprofits
Very little research has been done on the impact of minimum wage increases on the nonprofit sector. The share of nonprofit workers affected by minimum wage increases is much lower than in low-wage industries like food service or retail. The nonprofit sector is also very diverse, encompassing large hospitals and universities along with human service agencies, child care, nursing homes, arts institutions, and religious and civic organizations. To assess the impact of the minimum wage proposal on the nonprofit sector, we combined data analysis with findings from interviews with a diverse group of nonprofit agencies and sector leaders.16
In this section we present our findings on the overall impacts on selected nonprofit industries; discuss specific challenges for nonprofit organizations that primarily rely on government funding sources; and review the research on higher wages and service quality.
There were 2,531 nonprofit organizations in Los Angeles in 2012, the year for which there is the most recent data.17 These organizations employed 115,000 people with total annual revenues of more than $13 billion and $20 billion in net assets (Table 9). Education and health care nonprofits account for 70
Table 9. Nonprofit Organizations in the City of Los Angeles
Industry Category Count % of Total
Total Revenue (millions)
% of Total
Total Net Assets
(millions)
% of Total
Average Net Assets
(in ‘000s)
Average Revenue (in ‘000s)
Arts, Culture, and Humanities 360 14.2 $767 5.9 $2,102 10.4 $5,840 $2,130
Education, Higher 26 1.0 $4,415 33.8 $7,184 35.7 $276,320 $169,820 Education, Other 371 14.7 $1,288 9.9 $2,702 13.4 $7,280 $3,470 Environment 66 2.6 $56 0.4 $64 0.3 $970 $850 Hospitals 9 0.4 $1,903 14.6 $2,397 11.9 $266,380 $211,460 Health, Other 307 12.1 $1,500 11.5 $1,336 6.6 $4,350 $4,890 Human Services 736 29.1 $2,109 15.4 $1,260 6.3 $1,710 $2,740 International 69 2.7 $117 0.9 $107 0.5 $1,550 $1,700 Mutual, Public and Societal Benefit 323 12.8 $941 7.2 $3,232 16.1 $10,010 $2,910
Religion 260 10.3 $114 0.9 $155 0.8 $590 $440
Total 2,531 100.0 $13,079 100.0 $20,134 100.0 $7,950 $5,170 Source: Urban Institute, National Center for Charitable Statistics. 2012. NCCS Enhanced Extract of IRS Financial Data. Data is from IRS 990 and 990-EZ forms. Four nonprofits are included in the total but not in the industry breakout because their industry is unknown.
21 Proposed Minimum Wage Law for Los Angeles
percent of the sector’s revenue and 68 percent of its net assets. Many of these nonprofits are small—average nonprofit revenue, excluding nonprofits in health and education, was $2.3 million a year.
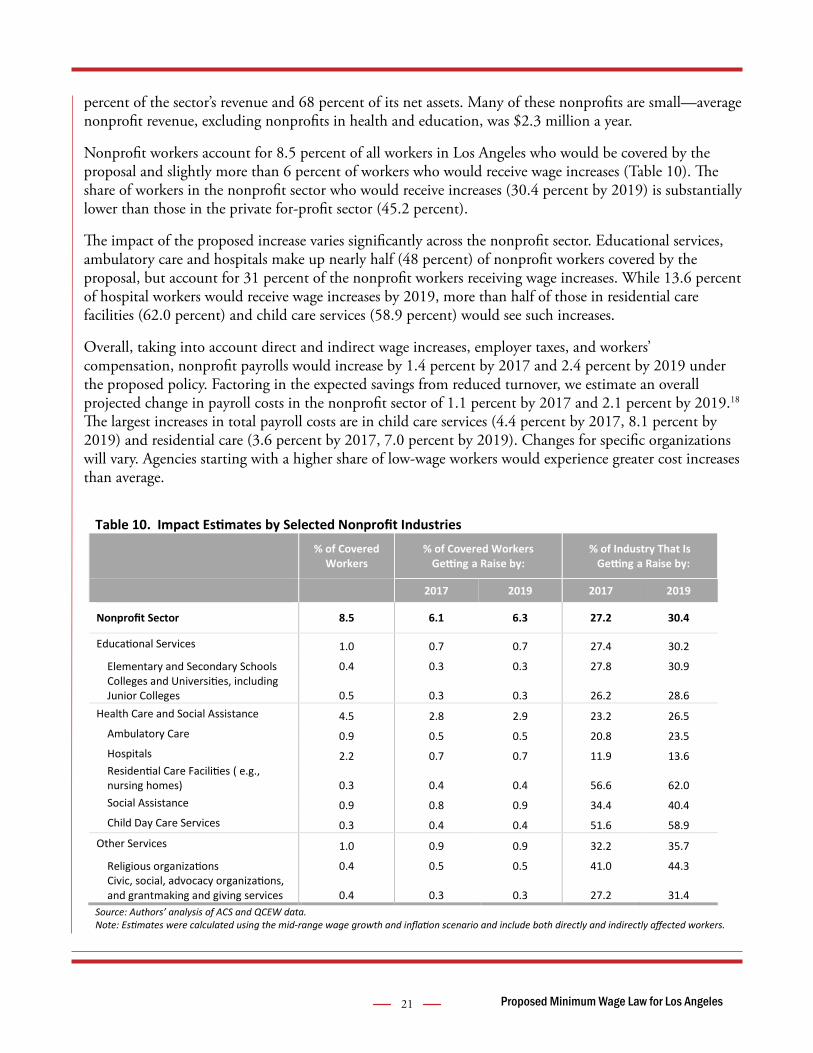
Nonprofit workers account for 8.5 percent of all workers in Los Angeles who would be covered by the proposal and slightly more than 6 percent of workers who would receive wage increases (Table 10). The share of workers in the nonprofit sector who would receive increases (30.4 percent by 2019) is substantially lower than those in the private for-profit sector (45.2 percent).
The impact of the proposed increase varies significantly across the nonprofit sector. Educational services, ambulatory care and hospitals make up nearly half (48 percent) of nonprofit workers covered by the proposal, but account for 31 percent of the nonprofit workers receiving wage increases. While 13.6 percent of hospital workers would receive wage increases by 2019, more than half of those in residential care facilities (62.0 percent) and child care services (58.9 percent) would see such increases.
Overall, taking into account direct and indirect wage increases, employer taxes, and workers’ compensation, nonprofit payrolls would increase by 1.4 percent by 2017 and 2.4 percent by 2019 under the proposed policy. Factoring in the expected savings from reduced turnover, we estimate an overall projected change in payroll costs in the nonprofit sector of 1.1 percent by 2017 and 2.1 percent by 2019.18 The largest increases in total payroll costs are in child care services (4.4 percent by 2017, 8.1 percent by 2019) and residential care (3.6 percent by 2017, 7.0 percent by 2019). Changes for specific organizations will vary. Agencies starting with a higher share of low-wage workers would experience greater cost increases than average.
Table 10. Impact Estimates by Selected Nonprofit Industries
% of Covered Workers
% of Covered Workers Getting a Raise by:
% of Industry That Is Getting a Raise by:
2017 2019 2017 2019
Nonprofit Sector 8.5 6.1 6.3 27.2 30.4
Educational Services 1.0 0.7 0.7 27.4 30.2
Elementary and Secondary Schools 0.4 0.3 0.3 27.8 30.9 Colleges and Universities, including Junior Colleges 0.5 0.3 0.3 26.2 28.6
Health Care and Social Assistance 4.5 2.8 2.9 23.2 26.5 Ambulatory Care 0.9 0.5 0.5 20.8 23.5 Hospitals 2.2 0.7 0.7 11.9 13.6 Residential Care Facilities ( e.g., nursing homes) 0.3 0.4 0.4 56.6 62.0 Social Assistance 0.9 0.8 0.9 34.4 40.4 Child Day Care Services 0.3 0.4 0.4 51.6 58.9
Other Services 1.0 0.9 0.9 32.2 35.7
Religious organizations 0.4 0.5 0.5 41.0 44.3 Civic, social, advocacy organizations, and grantmaking and giving services 0.4 0.3 0.3 27.2 31.4
Source: Authors’ analysis of ACS and QCEW data. Note: Estimates were calculated using the mid-range wage growth and inflation scenario and include both directly and indirectly affected workers.

22 Proposed Minimum Wage Law for Los Angeles
While the projected increase in payroll costs in the nonprofit sector is lower than that found for Los Angeles employers as a whole, labor costs as a share of operating costs are generally higher in the nonprofit sector (38 percent) than in the private sector (22 percent).19 As a result, the total operating costs for nonprofits is expected to rise by 0.4 percent by 2017 and 0.8 by 2019, slightly less than the figures reported for all industries in Table 6 above. As noted above, changes for specific industries and organizations will vary significantly. In the for-profit sector, as we have discussed, price increases are one of the main avenues for absorbing higher operating costs resulting from an increase in the minimum wage. Nonprofit organizations receive funding from a variety of sources, including program revenues, contributions and government contracts, which will affect their ability to absorb the increases in cost without cuts to services.
Government Contracts
Nonprofit agencies that rely on federal, state or county funding tied to established reimbursement rates face unique challenges in absorbing higher operating costs in the absence of concomitant changes in reimbursement policy. This is especially an issue for organizations that provide services to people with developmental disabilities and to those in early care and education.
Under California law, individuals with developmental disabilities have the right to receive a system of comprehensive support services. These services are largely provided by independent community-based agencies. Reimbursement to vendors is based on per capita rates for each unit of service provided by the agency. Depending on the service provided, rates are either statutorily set by the State Department of Developmental Services, or negotiated between the provider and the local regional center charged with coordinating services. These rates have been largely frozen since 2003-2004, with some adjustments for increases in the state minimum wage. Service providers are required to accept state reimbursements as payments in full, and cannot charge clients above the reimbursement rate. While nonprofit service providers supplement state revenue with fundraising for contributions and grants, fundraising capacity varies across providers.
Child care subsidy rates are set by the state, and low-income consumers have limited ability to pay higher costs. State funding for child care was cut back during the Great Recession and remains $1.1 billion below pre-recession levels in inflation-adjusted dollars.20 Similarly, After School Education and Safety Programs (ASES) operate on a combination of client fees and state subsidies provided on a set per-pupil rate.
While reimbursement rates for community health clinics are also set by the state, wages tend to be higher than in human service agencies. Though payroll costs may not change significantly at many of the Federally Qualified Health Centers, some of the smaller clinics may see more pressure on their budgets. Cash flow has been a problem for some Los Angeles clinics due to delays in reimbursements for services from the County.
If reimbursement rates are not increased, or a source of revenue cannot be identified, some publicly-funded nonprofits are likely to respond to higher operating costs by reducing services.
Quality Jobs and Quality Care
23 Proposed Minimum Wage Law for Los Angeles
Raising wages in human services and early care and education has benefits for clients as well as workers. There is a well-documented link between quality jobs and quality care in human services and early care and education.
Larson et al. (2004) found that, in the field of developmental disability services, high vacancies are associated with lower consumer and family satisfaction. Furthermore, families reported increased stress, greater financial challenges, and more job losses due to reduction in services that were at least in part connected to high turnover and vacancies. Wage increases have been shown to reduce turnover and vacancies. For example, after Wyoming legislation increased wages for developmental disability industry workers, turnover rates fell from 52 percent to 32 percent in just two years (Harmuth and Dyson 2005). Similarly, turnover decreased 17 percent among home care workers in San Francisco after an increase in wages (Howes 2002).
Other studies have directly linked wages and quality care. The National Childcare Staffing Study (Whitebook, Howes and Phillips 1989) found that staff wages provided the strongest predictor of child care quality. Observations in child care centers in Wisconsin revealed an increase in the quality of care after a wage increase (Center on Wisconsin Strategy 2002). Child care quality in turn has long-term impacts on children’s learning, health and development (Whitebook, Howes and Phillips 2014). Larson et al.’s 2004 study similarly found a link between lower wages in developmental disabilities services and lower quality of life assessments for consumers (Larson et al. 2004).
A higher minimum wage would help to reduce turnover in lower paid occupations within the nonprofit sector and improve quality outcomes for consumers. Realizing these gains, however, will require providing a sufficient phase-in time for highly-impacted nonprofit industry sectors and addressing the issue of funding for nonprofit organizations with fixed reimbursement rates. These issues are discussed further in Section 9.1, below.
5. Effects on Los Angeles’ Economy
A principal and stated goal of the proposed minimum wage policy for Los Angeles is to raise the earnings of low-wage workers in the city, while minimizing the tradeoffs in economic costs to the city. In previous chapters, we have assessed the benefits to low-wage workers and their families, as well as the impact on businesses’ operating costs in particular industries. In this section we consider whether the proposed policy would generate net gains or losses to the city’s economy.
We are not the first to conduct an analysis of minimum wage effects on an entire regional economy. In Section 5.1, we discuss these previous studies. A key issue concerns how much of their cost increases employers will pass on in the form of higher prices. The range in previous studies ranges from zero to 100 percent.
In Section 5.2, we discuss who might pay the costs of the higher minimum wage. Higher prices reduce consumption demand, which translates into reductions in employment and economic activity.
Section 5.3 examines benefits to the city’s economy. These economic benefits consist primarily of the
24 Proposed Minimum Wage Law for Los Angeles
increased spending that derives from the higher income of low-wage workers, especially those who live in the city (there may also be a small increase in spending by in-commuters and visitors to the city). We take into account the effects of taxes and reduction in public benefits on the affected workers’ take-home pay, the rate at which their households spend income compared to others, and spending leakage outside of the city economy. Greater spending from consumers increases economic demand, which translates into increases in employment and economic activity.
The net effects on the city’s economy will then depend upon whether the costs are greater or less than the benefits; Section 5.4 estimates these net impacts on economic activity, employment and taxes. Here we also take into account that the communities that surround Los Angeles will also experience benefits and costs. More than half of the workers affected by the minimum wage increase live outside the city; the multipliers on their increased household spending will be felt largely in other parts of the county. In order to fully capture the benefits of the proposed law, we display our estimated total employment effects for the county as a whole.
We turn to spatial mobility issues in Section 5.5. The key issues here are (a) the extent to which firms currently located in Los Angeles might relocate to nearby areas in response to the minimum wage proposal, and (b) the extent to which residents who currently commute to low-paying jobs located outside the city might switch to higher-paying jobs located inside the city.
Section 5.6 concludes and considers some of the limitations of our analysis.
5.1 Relation of Our Analysis to Previous Studies
Economists have conducted numerous econometric studies of the effects of minimum wages on earnings and employment. This econometric approach does not tell us whether employment effects are the result of mechanization, or price increases, or other possible mechanisms. Instead, it effectively incorporates the results of all these mechanisms without identifying which are at work.
This research does not detect a significant effect on workers age 20 and over. Some observers attribute the lack of visible effects to the relatively small proportion of adults who were affected by past minimum wage increases in the U.S. These observers argue that negative effects could better be discerned by examining groups that are more affected, such as teens and restaurant workers (Brown 1999).21
Economists have therefore focused on these two groups for whom minimum wage effects should be detectible. This research has produced some areas of agreement. After two decades of methodological controversy, recent studies of the effects on restaurant workers by researchers from opposing teams have arrived at a consensus: the employment effects are either extremely small or non-existent.22
Controversy does continue concerning the effects of minimum wages on teen workers, with one camp finding significant negative effects and the other finding effects that are much smaller, or even positive. But while teens once represented one-fourth of all workers affected by minimum wages nationwide, their importance has fallen to less than half that level today. More important, in our tabulations in Chapter 2, we find that teens represent only 3 percent of the workers who would be affected by the Los Angeles proposed policy. Results that are specific to teens, who are more likely to work part-time while still in school, will therefore not be informative for the effects for the workforce as a whole.
25 Proposed Minimum Wage Law for Los Angeles
At the same time, the proportion of all adult workers that would be affected by the Los Angeles minimum wage law approximates 35 to 40 percent, far higher than is the case in the minimum wage research literature to date. As a result, previous research is only suggestive as to the effects of the proposal we consider here. Consequently, we turn in this chapter to modeling how the minimum wage policy effects work their way through the Los Angeles area economy.
The approach we use follows a similar logic of previous studies, such as those that use REMI, the Regional Economic Model, Inc. (e.g., Chow 2014), the EPI model from the Economic Policy Institute (Hall and Cooper 2013), and the Beacon Economics model, which uses the IMPLAN regional simulator (Beacon 2012).23 Each of these studies examines the costs of a minimum wage to employers and how they are shifted to employees, owners and consumers. Each also compares these costs to the direct and indirect effects of the increased spending by workers who receive a wage increase, taking into account taxes, reduced public benefits, reduced spending by disemployed workers and lower profits received by owners. In the REMI model, rising labor costs increase prices, which then work themselves through the economy. However, REMI assumes a production relationship in which small increases in labor costs imply relatively large amounts of substitution of capital for labor. Yet this relationship is not found in studies of minimum wage effects in restaurants or other industries. The REMI model also assumes that even very small price increases by geographic area have very high effects on the local market share of produced goods and services. That is, it does not incorporate spatial frictions, such as travel costs, into its model. As a result, the REMI model is hard-wired to overstate the costs of minimum wage increases and understate their benefits. (For a full discussion, see Reich, Jacobs, Bernhardt and Perry 2014c).
The EPI model (Hall and Cooper 2013) assumes that 20 to 50 percent of cost increases from minimum wage increases are passed through in higher prices, with the remaining amount absorbed by reduced profits. Net spending increases because lower-wage workers spend higher proportions of their income, generating a greater multiplier than for households who would absorb the higher prices, and the businesses and shareholders who EPI assumes would have lower profits.
Beacon Economics (2012) draws upon a standard regional planning model provided by IMPLAN, Inc. IMPLAN takes into account commuting patterns in the local region, changes in demand in response to specified levels of higher prices, and the effects of increased consumer spending. Drawing upon Aronson (2001), Beacon specifies that cost increases are fully passed on in prices. However, Beacon’s use of the model greatly overestimated the price increases resulting from the proposed minimum wage, overstating minimum wage price response estimates from Aaronson (2001) by a factor of ten, and assumed that a similarly exaggerated increase in restaurant prices would occur in the rest of the economy.24 The results greatly overstated the effect of the policy on reducing consumer demand.25
In our study, we make use of the IMPLAN model as well. We also supplement it with estimated economic relationships that draw upon the best available objective research. In what follows, we lay out the logic of our regional economic model in Sections 5.2 (costs) and 5.3 (benefits). In Section 5.4, we then present the results of our model.

26 Proposed Minimum Wage Law for Los Angeles
5.2 Economic Costs of the Minimum Wage Proposal
Automation and substitution away from unskilled labor
It is often argued that a higher minimum wage will lead firms to reduce their use of workers. This reduction in labor demand can occur through two different channels: one involves substituting capital for labor, i.e., automation of jobs while keeping sales at the same level; the other involves needing fewer workers when sales fall as prices increase. We discuss here the automation channel and consider the effect on sales later in this section.
Mechanization does not necessarily lead to a net loss of jobs. As David Autor (2014a-b) points out, machines (including smart robots) do not just substitute for labor; they are also complements to existing jobs or lead to the creation of new jobs and industries. Indeed, previous rounds of automation and computerization have created more jobs than they destroyed. Moreover, automation does not involve only the replacement of labor by machines. It also involves the replacement of old machines (think manual cash registers) with newer ones (think electronic cash registers and now iPads).
Aaronson and Phelan (2014) recently studied the short-run impact of minimum wages on the automation of different kinds of jobs in the restaurant industry. Their study is the first to examine Autor’s job mechanization hypothesis within a low-wage industry. Just as Autor predicts, Aaronson and Phelan find that minimum wage increases do reduce routinized jobs (such as cashiers) and increase the number of less-routinized jobs (such as food preparation). As it turns out, the changes offset each other almost equally, resulting in no net change in employment. We therefore conclude that the short-run effects of automation are not a concern for our study.26
Reductions in paid hours relative to working hours
Some commentators assert that a higher minimum wage will lead employers to cheat them of a portion of their wages. It is important to recognize that such practices already exist; the question at hand is how much the minimum wage increase will increase their intensity and prevalence. Although it is difficult to measure changes in wage theft, we know that employee-reported increases in pay (to a census surveyor) after a minimum wage increase match up well to employer-reported increases in pay on administrative reports that determine payroll taxes (Dube, Lester and Reich 2010). These results suggest that most employers comply about as much after the increase as before.
Effects on employee turnover and productivity
On the cost side, we estimate that about 17.5 percent (in 2017) of wage cost increases are offset by turnover cost savings. As discussed in our literature review, a number of careful studies have found that minimum wage increases do reduce employee turnover. Dube, Lester and Reich (forthcoming) further find that reductions in employee turnover, while significant, are concentrated among new employees—those with less than three months on the job. This pattern suggests that further reductions in employee turnover may be much smaller at higher minimum wage levels. On the other hand, employee quit rates increase during periods of economic growth. We model both of these effects in our calculations.
Reduced employee turnover means that workers will have more tenure with the same employer, which creates incentives for both employers and workers to increase training and therefore worker productivity. A

27 Proposed Minimum Wage Law for Los Angeles
large scholarly literature makes this point, and it has been emphasized recently by firms such as Walmart, TJ Maxx and Gap as principal reasons underlying their announced policies to increase their minimum wages nationally to $10.00. However, because of the lack of data on individual productivity, the literature does not provide a quantitative assessment of the importance of the effect on productivity. We therefore do not include it in our calculations. Consequently, we are very likely overstating the costs of the minimum wage on the economy.
Effects on prices, profits and rents
As we have seen, previous prospective studies have made different assumptions on how much costs will affect prices—and therefore also profits. Card and Krueger (1995, ch. 10) provide an extensive discussion of this issue. As they point out, from the point of view of an individual employer in a perfectly competitive industry, profits would be unaffected only in the extreme case in which firms can costlessly replace low-wage labor with high-skill labor and/or capital, and without cutting output. Since such substitutions are costly, from this perspective a minimum wage increase would have to reduce profits. Firms do not envision a price increase as a solution, as it fears losing sales to its competitors.
A different result emerges when Card and Krueger consider the point of view of an industry as a whole. This perspective is necessary since the minimum wage increase applies to all the firms in an industry. Now, when individual firms respond to the prospect of reduced profits by raising their prices, they find that other firms are doing the same. Some of the price increases will stick and the industry will recapture some of the reduced profits. However, since demand for the industry’s product is not fixed, this increase in price entails some reduction in product demand, implying that industry output (and therefore employment) will fall. In other words, the price increase will permit employers to recover only a portion of their reduced profits.
The above reasoning contains a key assumption: that firms’ labor costs consist only of the wages they pay. As Card and Krueger and many other economists (such as Manning 2003, and Ashenfelter, Farber and Ransom 2010) emphasized, the presence of nonwage labor costs—such as the cost of replacing workers who leave—leads to different conclusions. In particular, minimum wage increases may reduce employee turnover costs. As a result, employment declines, price increases and profit declines will all be moderated. Considerable evidence, moreover, suggests that turnover costs are an important feature of low-wage labor markets.
Economic theory thus does not itself tell us conclusively how minimum wage costs are borne.
The evidence on whether profits do fall is extremely scant. The most important study remains the one in Card and Krueger (1995). These authors obtained mixed results when examining the effects of minimum wage changes on shareholder returns for fast-food restaurant chains. Using British data, Draca et al. (2011) find a small negative effect on profits. However, one segment of this study uses data for firms in the British residential care industry. Firms in this industry were not permitted to increase prices, making the results not very useful for other sectors. Harasztosi and Lindner (2015) examine a large (60 percent) and persistent increase in the Hungarian minimum wage, much of which was felt in manufacturing. These authors find that cost increases were entirely passed through, but employment did not change and profits did not fall. However, the relevance of the British and Hungarian studies for the U.S. is highly uncertain.
28 Proposed Minimum Wage Law for Los Angeles
In our model, we assume that employers pass all of the increase in operating costs stemming from a minimum wage increase onto prices, after accounting for the above-mentioned turnover savings. Our assumption that cost increases net of turnover savings are passed on entirely in higher prices is consistent with the few empirical studies of price effects. These studies generally examine data on restaurants. Aaronson (2001) and Aaronson, French and MacDonald (2008) both find complete pass through of costs. However, their data come from a period of much higher inflation, are based on a handful of observations per metro area, and they do not correct their standard errors for clustering. In contrast, Allegretto and Reich (2014) collected a large sample of restaurant price data in and near San Jose, before and after a 25 percent minimum wage increase in 2013 (from $8.00 to $10.00). Their preliminary results indicate that most, but not all, of the costs are passed through to consumers in higher prices. Note that since sales fall, it is possible that profits will fall as well.
Effects of increased prices on reduced sales of consumer goods
Economists use the term price elasticity of consumer demand to refer to the estimated effect of an increase in prices on reducing consumer demand. Taylor and Houthakker (2010) report price elasticities for six categories of goods and services that together cover all of consumption. We adjust their health care elasticity to -0.2, to take into account changes in the structure of health care provision since the 1990s, and then compute a weighted average elasticity across the six categories using personal consumption expenditure shares from the U.S. Consumer Expenditure Survey (McCully 2011). The result is a price elasticity of consumer demand of -0.72.27
This estimate is compatible with, but somewhat larger than, price elasticities estimated from aggregate panel data. Hall (2009), for example, obtains a price elasticity of -0.5. On the other hand, our estimate is very close to that of Blundell et al. (1993), as used in Beacon (2012).
How well does our consumption elasticity of -0.72 apply to an open regional economy such as Los Angeles? A primary concern arises with visitor services, which by definition are sold not to local residents but to visitors to Los Angeles, whether from elsewhere in the U.S. or abroad. Visitor services—which largely overlaps with tourism—is not broken out separately in Table 7, as the industry data reported by government censuses and surveys make it difficult to do so. Nonetheless, Los Angeles is a major tourist mecca. Yet a report by Micronomics estimates that tourism accounts for approximately a tenth of the city’s economy (Weinstein and Stanford 2013). Tourism, moreover, has grown more rapidly than the economy as a whole, increasing to record levels.28
The importance of tourism thus introduces some uncertainty into our calculations. Consider restaurants, one of the tourist sector’s major components.29 The tourist segment of the industry is arguably less price elastic than the local segment. But the price elasticities of demand for restaurant meals that make up a part of the Taylor-Houthakker overall consumption elasticity estimates draw from national data sets. We cannot estimate how much error this contributes, especially as existing price elasticities of demand for tourism are very imprecisely estimated. Since we cannot make such an adjustment, we may overestimate how much an increase in the minimum wage reduces restaurant sales in a tourist destination such as Los Angeles.
Effects of reduced consumption on economic activity and jobs
We use the IMPLAN model to estimate the direct and indirect effects of the reduction in consumer spending on economic activity and employment in Los Angeles. The IMPLAN model allows us to estimate

29 Proposed Minimum Wage Law for Los Angeles
leakage from household spending in Los Angeles. We use zip codes to model IMPLAN for the City of Los Angeles. We assume that any reductions in consumer spending will be born within the city. As noted above, this may be an overstatement of the impact on spending if tourism is less price elastic.30
5.3 Economic Benefits of the Minimum Wage Proposal
The benefits side requires fewer additional assumptions. We use IMPLAN to estimate the multiplier effects of increased household spending as a result of the minimum wage increase, taking into account taxes and declines in income from reduced eligibility for public benefits programs and ACA subsidies. We also take into account spending leakages from the city to the surrounding economy, which as we will see is an important dynamic in assessing where the multiplier effects of the proposed minimum wage increase will be felt.
5.4 Models
In Table 11, we display the results of the above model for 2017 and 2019. An important point is that the estimates in these two years are cumulative—they are estimated relative to the state’s minimum wage in each year, and therefore capture the full effect of increases in the proposed city minimum wage in previous years.
Panel A: Costs
Panel A in Table 11 estimates reductions in consumer spending from the higher payroll costs that are generated by the proposed minimum wage law in 2017 and 2019 in Los Angeles City. We begin by restating in Row 1 the total net percentage increase in payroll costs from the proposed law, accounting for savings from reduced turnover costs. This is simply the top line from Table 7, using the same assumption that expected savings from reduced turnover will be 17.5 percent in 2017 and 11.7 percent in 2019. Similarly, in Row 2 we restate the percentage change in prices from Table 7, which is equal to the percentage change in operating costs (after accounting for savings from turnover).
In Row 3, we estimated the reduction in consumer spending in Los Angeles City from the price increase. As previously discussed, our best estimate is that each 1 percent increase in prices results in a -.72 percent decline in spending. We thus apply this price elasticity of demand of -0.72 to the percentage increase in prices and then multiply by annual consumer spending in Los Angeles.31 (Recall that we calculated this price elasticity of demand drawing from results in Taylor and Houthakker 2010).
The result is an estimate of a $592 million cumulative reduction in consumer spending by 2017 and a $1.128 billion cumulative reduction in consumer spending by 2019. In percentage terms, these figures represent 0.3 and 0.6 percent, respectively, of annual consumer spending. As an input into the calculations in Panel C, we use IMPLAN to estimate the total reduction in GDP and employment from the reduction in consumer spending, including multiplier effects.32
Panel B: Spending Increases due to the Proposed Minimum Wage Increases
Panel B of Table 11 estimates increases in income from the proposed minimum wage increase. Here, we include estimates for both Los Angeles City and Los Angeles County. While the costs of the proposed law occur in the city, the benefits will accrue in both the city and the rest of the county. We estimate that about

30 Proposed Minimum Wage Law for Los Angeles
59 percent of affected workers live outside the city; IMPLAN refers to the resultant spending outside the city’s boundaries as spending leakage.
Row 4 shows the total wage increase from the proposed law for all affected workers, both residents and commuters, in Los Angeles City businesses. These estimates are taken from Table 4, converted to nominal dollars in 2017 and 2019. Row 5 adjusts the total wage increase for an estimated loss of 9.3 percent due to reduced eligibility for public assistance programs, as well as lost worker income due to reductions in consumer spending from Panel A.33 The result is an estimated net income increase for both residents and commuters of $1.361 billion by 2017 and $2.381 billion by 2019. As an input into the calculations in Panel C, we use IMPLAN to estimate the increase in employment for Los Angeles County resulting from the increased household spending triggered by the income increase, accounting for multiplier effects and spending leakage outside the county.34
In Row 6, we estimate the net increase in income only for workers who reside in the city, adding a small amount of commuter wages that are likely spent in the city (e.g., on restaurants and entertainment).35 The result is an estimated net income increase for city residents of $680 million by 2017 and $1.190 billion by 2019 (plus a small amount for in-commuter spending). As an input into the calculations in Panel C, we use IMPLAN to estimate the increase in employment for Los Angeles City resulting from the increased household spending triggered by the resident income increase, accounting for multiplier effects and spending leakage outside of the city.36
Panel C: Net Impact
In Panel C of Table 11, we estimate the net changes in GDP and employment from Los Angeles’ proposed city minimum wage law, taking into account costs and benefits as well as regional multiplier effects, via the IMPLAN models described above. For Los Angeles City, we estimate a cumulative net reduction in GDP of $135 million in 2017 and $315 million in 2019 (-0.1 percent) over the no-minimum-wage-increase scenario. To put this estimate in context, projected growth for California GDP is 4.3 percent a year.37 Regarding employment, we estimate a cumulative net reduction in employment, due to the policy, of 1,552 jobs by 2017 and 3,472 jobs by 2019, or - 0.1 and -0.2 percent, respectively. To put this estimate in context, Beacon Economics (2014) estimates that employment in the city will grow by 2.5 percent per year over 2015-2019; 0.1 percent is equal to two and a half weeks of growth.
Again, the full benefits of the proposed city minimum wage law will be realized at the county level, since more than half of the affected workers live (and therefore spend their increased earnings) outside the city. Recall also that the costs of the proposal occur only within the city. As a result, in Panel C we estimate a cumulative net increase in employment of 3,666 jobs by 2017 and 5,262 jobs by 2019 at the county level, or 0.1 percent. To put this estimate in context, the California Employment Development Department projects that annual employment growth for Los Angeles County will be 1.21 percent per year from 2012-2022.38
We emphasize again that these cumulative estimates will be spread over the preceding years of the city minimum wage increase—the 2017 estimate includes effects in 2015 and 2016, and the 2019 estimate includes effects from 2015 to 2018.

31 Proposed Minimum Wage Law for Los Angeles
Finally, it is important to reiterate that these estimates are subject to multiple caveats. First, in our impact model we are using the mid-range growth scenario described in Section 2.2; the results would be different in the case of stronger or weaker economic growth. Second, we are drawing on multiple parameters in our impact model, each of which is subject to error. We conducted a series of sensitivity tests that vary the following parameters: the percentage savings due to reduction in turnover, the price elasticity of demand, and the percentage of increased income that in-commuters are likely to spend in Los Angeles City. The results of the sensitivity tests suggest that the scale of the net estimates in Panel C do not substantively change (see Section 5.6 for details on the sensitivity analysis).
Impact on City Tax Revenue
If firms sell fewer goods and services when prices rise, and the increase in prices is greater than the
Table 11. Estimated Cumulative Net Changes in GDP and Employment in Los Angeles from Proposed Minimum Wage Law, 2017 and 2019
Cumulative by 2017
Cumulative by 2019
A. Cumulative reductions in consumer spending from proposed minimum wage increase in Los Angeles City
1. Net percentage increase in payroll costs from proposed minimum wage law, accounting for savings from reduced turnover costs 2.1 3.8
2. Percentage increase in prices resulting from net percentage increase in operating costs (labor costs are only a portion of a firm’s operating costs) 0.5 0.9
3. Reduction in consumer spending in Los Angeles City from price increase (millions) -$592 -$1,128
B. Cumulative increases in wages from proposed minimum wage increase in Los Angeles City and County
4. Total wage increase from proposed minimum wage law for all workers (both residents and commuters) at Los Angeles City businesses (millions) $1,832 $3,256
5. Net income increase from proposed minimum wage law for all workers (both residents and commuters) at Los Angeles City businesses, accounting for loss in public assistance and lost worker income due to reductions in consumer spending (millions)
$1,361 $2,381
6. Net income increase from proposed minimum wage law for workers residing in Los Angeles City, including increased in-commuter income likely spent in the city (in millions)
$680 $1,190
C. Cumulative net change in GDP and employment from proposed minimum wage increase Los Angeles City and County
Los Angeles City:
Net change in GDP (in millions) -$135 -$315
Net change, as a percent of GDP -0.1 -0.1
Net change in employment -1,552 -3,472
Net change, as a percent of total employment -0.1 -0.2
Los Angeles County:
Net change in employment 3,666 5,262
Net change, as a percent of total employment 0.1 0.1
All dollar values are nominal. Estimates are relative to state minimum wage within given year.

32 Proposed Minimum Wage Law for Los Angeles
decrease in sales, then gross sales and business revenue will be greater in nominal terms. (This condition is met when the price elasticity of consumer demand is less than -1; our estimated elasticity is -0.72.) An increase in nominal sales then implies that a higher minimum wage will increase tax revenue, even as the purchasing power of that revenue is reduced in the local economy.
To estimate the change in tax revenue, we assume that gross receipts and sales taxes increase proportionally to the increase in total consumer spending in the local economy, while non-gross receipts business taxes, made up largely of flat rate fees, change with the level of production of goods and services. In 2014, $401 million, accounting for 94 percent of business tax revenue in Los Angeles, was generated by gross receipts taxes.
We also take into account the upcoming reduction in the gross receipts tax rate for professions and occupations, which will be phased in during our time period. These revenues account for 59 percent of the gross receipts taxes collected in 2014. To get the change in tax revenue, we multiply our estimated change in sales for 2017 and 2019 by estimated gross receipts taxes for the two years without a minimum wage policy (see Appendix A for details).
As Table 12 shows, we project a nominal increase in gross receipts taxes of $800,000 in 2017, rising to $1.4 million in 2019, and an increase in sales taxes of $1.9 million in 2017 and $3.4 million in 2019. The total projected increase in nominal tax receipts is $2.6 million in 2017 and $4.7 million in 2019.
Over the long run there may be an additional negative effect on commercial property taxes. If commercial rents decline in response to the higher minimum wage, then corresponding property taxes may decline by a small amount. Any effect on personal property taxes is likely to be minimal.
We are not able to calculate the impact on City costs. Potential City costs would include:
• Payroll costs associated with any City workers earning under the proposed minimum wage.• Increased costs for City service contracts and other locally purchased goods and services. The
current minimum rate for workers on Los Angeles City Contracts is $11.03 per hour plus $1.25 per hour in health benefits; full cash wage of $12.28.
• Costs associated with enforcement.
Table 12. Cumulative Change in City Tax Revenue in Los Angeles from Proposed Minimum Wage Law, 2017 and 2019
2017 2019
Gross Receipts Tax $800,000 $1,410,000
Non-Gross Receipts Business Taxes -$20,000 -$40,000
Sales Tax $1,860,000 $3,370,000
Total $2,640,000 $4,740,000 Source: Authors’ analysis of City of Los Angeles, Business Tax Accounts and Actual Total Measures, 2009-2014.
33 Proposed Minimum Wage Law for Los Angeles
5.5 Border Effects
Will a $3.25 or $5.25 minimum wage discontinuity at the border of Los Angeles City generate price differentials that would lead businesses just inside the border to lose sales to businesses just outside the border? Would such firms then move across the border? We begin by discussing the theoretical considerations that enter into firms’ and workers’ location decisions. We then consider how these considerations apply for Los Angeles.39
Most economic activity in the U.S. is concentrated in urban areas, where wages are higher. Despite higher wages—and much higher real estate prices—firms want to locate in cities. They seek the advantages of being near other firms in their industry, the market for their products, and sources of raw materials, trans-shipment points, and labor. The firms that located in urban areas thus already are paying a premium. Of course, at the periphery of urban areas, real estate prices are lower, creating an advantage that gets balanced against the benefits of being closer to customers and to other firms.
Some industries are more footloose than others. Footloose industries generally produce standardized commodities and are very labor-intensive; a large segment of apparel manufacturing fits this description. We take up the apparel manufacturing case separately below.
In the present context, although higher wage costs inside the city border might lead some firms to relocate outside, the minimum wage policy could also lead prosperous firms that would reap the benefit of higher productivity to move inside the border. Firms just outside the border may also find that their workers will find it more attractive to switch to firms inside the border that offer a higher wage. For this reason, we can expect wages to rise just outside the border, reducing the sharp policy discontinuity. Finally, higher wages might lead some Los Angeles residents to move to other areas that have lower housing costs, but it could also lead to some suburban residents to move inside the city to be closer to higher paying jobs. Gross outflows of capital and labor need to be compared with gross inflows to obtain a net flow amount. Economic theory does not by itself predict that the minimum wage policy will on net lead economic activity to relocate outside the city.
What does the empirical research say? In their exhaustive analysis of firm location dynamics in California from 1992 to 2004, researchers Jed Kolko and David Neumark (2007) found that a miniscule proportion of all firms relocated at all. Those that did were much more likely to move to a nearby area than to a location farther away. Kolko and Neumark conclude from this pattern that wage differentials play a very minor role in motivating these moves.
How do these considerations apply specifically to low-wage firms in Los Angeles that are located just inside the city border? Los Angeles has a relatively decentralized pattern of economic activity within its borders. It also has very irregular borders and it is surrounded by a substantial number of densely settled cities.40 In principle, this economic geography could mean that many businesses in the city are located just inside the city’s border and that they compete directly with businesses just outside the city’s border. At our request, Professor William Lester of the University of North Carolina has computed, using 2011 city block census data, how many low-wage jobs in Los Angeles are located just inside its borders. Drawing on his calculations, we estimate that only 6.4 percent of Los Angeles jobs that pay below $13.25 per hour are located within one-quarter of a mile of its border.41
Still, could price differences affect shoppers’ decisions on where to shop? Jekanowski et al. (2001) find that

34 Proposed Minimum Wage Law for Los Angeles
convenience and accessibility are the prime determinants of fast-food restaurant location decisions. The best recent evidence comes from Colbion et al. (2015), who examined sales and price data for 31 identical products from hundreds of retail stores in 50 metro areas. These authors document substantial store-based differences in prices for the same exact product, even within the same metro area. The persistence in price differences, even among nearby stores, indicates the presence of geographic frictions in consumer markets. In other words, small price differences did not lead consumers to switch to lower-price stores.
On the other hand, the same study also found that consumers switched to low-price outlets when local unemployment rates increased, in part because the cost of time for unemployed shoppers is much lower than for shoppers as a whole. This evidence thus also indicates that spatial price differences, although not decisive for shoppers, are not completely irrelevant either.
Not surprisingly, much depends on the size of the price differences. A number of studies have focused on the implied travel costs for consumers in deciding where to shop. Gopinath et al. (2011) estimated that such costs might be about $1.70 per mile (round-trip) for retail.42 Thomadsen (2005) collected data on prices, locations and attributes of every Burger King and McDonald’s outlet in Santa Clara County and estimated a travel cost of $3 per (round-trip) mile. Implied travel costs of this magnitude make it unlikely that fast-food restaurants would want to move away from their own customer base.
Finally, firms that want to relocate may also not easily find locations that meet their needs. Retail vacancy rates in Los Angeles, which have been trending downward during the economic recovery, were below 6 percent in the third quarter of 2013 (Dunn 2014). Moreover, vacancy rates were somewhat lower in real estate markets near but not inside the city: 5.7 percent in West Los Angeles, 4.7 percent in the San Fernando Valley market, and 4.7 percent in the San Gabriel Valley market. These low vacancy rates thus reinforce our conclusion that firms are less likely to move in the short run.
Impact on the Location of Apparel Manufacturing
Wages in the Los Angeles manufacturing sector are relatively low in apparel manufacturing and much higher in aerospace and biotech manufacturing. As shown in Table 7, the impact on operating costs for the city’s manufacturing sector as a whole is relatively small. But the effect on operating costs varies across very different industries. In particular, for apparel manufacturing, the impact of the proposed minimum wage law on operating costs is larger, at 2.9 percent by 2017 and 5.7 percent by 2019.
The existing research literature does not provide guidance on how apparel firms are likely to adjust to minimum wage increases. We know that employment in the Los Angeles apparel industry has declined over the long term, with much of the industry relocating offshore.
Two scenarios are possible for the firms that remain. On the one hand, the apparel manufacturers that still operate in Los Angeles are located there because of specific location advantages, such as serving just-in-time markets or specializing in higher-end segments of the industry. Those advantages might outweigh the impact of a minimum wage increase. If all apparel manufacturers in the city fit this description, apparel employment would not decline because of the proposed law, but apparel prices might increase by as much as 5.7 percent. On the other hand, smaller garment contractors in particular are quite mobile and therefore might move from the city of Los Angeles to other locations within the county, where the minimum wage would remain lower. The actual effect is likely to be somewhere between these two scenarios.
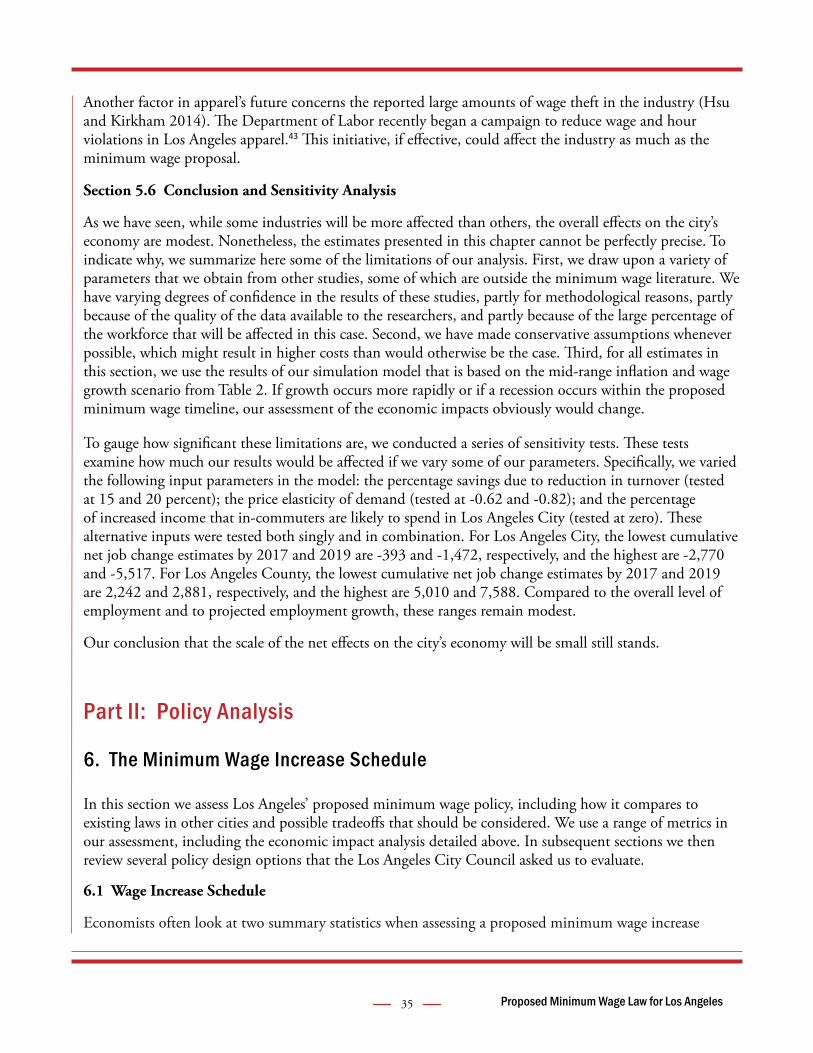
35 Proposed Minimum Wage Law for Los Angeles
Another factor in apparel’s future concerns the reported large amounts of wage theft in the industry (Hsu and Kirkham 2014). The Department of Labor recently began a campaign to reduce wage and hour violations in Los Angeles apparel.43 This initiative, if effective, could affect the industry as much as the minimum wage proposal.
Section 5.6 Conclusion and Sensitivity Analysis
As we have seen, while some industries will be more affected than others, the overall effects on the city’s economy are modest. Nonetheless, the estimates presented in this chapter cannot be perfectly precise. To indicate why, we summarize here some of the limitations of our analysis. First, we draw upon a variety of parameters that we obtain from other studies, some of which are outside the minimum wage literature. We have varying degrees of confidence in the results of these studies, partly for methodological reasons, partly because of the quality of the data available to the researchers, and partly because of the large percentage of the workforce that will be affected in this case. Second, we have made conservative assumptions whenever possible, which might result in higher costs than would otherwise be the case. Third, for all estimates in this section, we use the results of our simulation model that is based on the mid-range inflation and wage growth scenario from Table 2. If growth occurs more rapidly or if a recession occurs within the proposed minimum wage timeline, our assessment of the economic impacts obviously would change.
To gauge how significant these limitations are, we conducted a series of sensitivity tests. These tests examine how much our results would be affected if we vary some of our parameters. Specifically, we varied the following input parameters in the model: the percentage savings due to reduction in turnover (tested at 15 and 20 percent); the price elasticity of demand (tested at -0.62 and -0.82); and the percentage of increased income that in-commuters are likely to spend in Los Angeles City (tested at zero). These alternative inputs were tested both singly and in combination. For Los Angeles City, the lowest cumulative net job change estimates by 2017 and 2019 are -393 and -1,472, respectively, and the highest are -2,770 and -5,517. For Los Angeles County, the lowest cumulative net job change estimates by 2017 and 2019 are 2,242 and 2,881, respectively, and the highest are 5,010 and 7,588. Compared to the overall level of employment and to projected employment growth, these ranges remain modest.
Our conclusion that the scale of the net effects on the city’s economy will be small still stands.
Part II: Policy Analysis
6. The Minimum Wage Increase Schedule
In this section we assess Los Angeles’ proposed minimum wage policy, including how it compares to existing laws in other cities and possible tradeoffs that should be considered. We use a range of metrics in our assessment, including the economic impact analysis detailed above. In subsequent sections we then review several policy design options that the Los Angeles City Council asked us to evaluate.
6.1 Wage Increase Schedule
Economists often look at two summary statistics when assessing a proposed minimum wage increase

36 Proposed Minimum Wage Law for Los Angeles
schedule. The first measures the ratio of the minimum wage to the median full-time wage, a common metric used both in the U.S. and in other countries (Organization for Economic Co-operation and Development [OECD] 2013). The second estimates the percentage of the workforce directly or indirectly affected by the minimum wage increase. Both metrics provide a measure of scale of impact and therefore give us insight into the ability of an economy to absorb higher minimum wage levels (the two metrics are related but do not necessarily move in strict tandem). Table 13 shows our estimates of these metrics for the proposed Los Angeles city minimum wage law, under the three future growth scenarios introduced above in Section 2.2.
We begin with the ratio of the minimum wage to the median full-time wage (minimum-to-median ratio for short). Historically, this ratio reached a high of 55 percent in 1968 at the federal level (Dube 2014). The average for OECD countries is 49 percent; five, including France and New Zealand, have minimum-to-median ratios of 60 percent or more (OECD 2013). In the U.S. we have scant evidence on the effects of minimum wages at ratio levels this high. Zipperer (2014) finds greater disemployment effects at higher minimum-to-median ratios in the United States, though none of the effects are statistically significant and the highest ratios in his sample are below 60 percent.
Table 13 shows that Los Angeles’ proposed law results in ratios at or beyond 60 percent by 2017 and 2019. For comparison, we estimate that the ratio of the state minimum wage of $9.00 an hour to Los Angeles’ median full-time wage was 44.1 percent in 2014. California’s ratio will increase to just below 50 percent when the state minimum wage increases to $10 on January 1, 2016 (Allegretto, Reich and West 2014). At the time of full implementation of its 2014 law, San Francisco’s minimum wage will be 44.7 percent of its median full-time wage. Seattle’s ratio will be 53.3 percent at the time of full implementation.
Our second metric shows that that the percentage of workers directly and indirectly affected is sizable under the proposed law, ranging from 38.6 to 44.3 percent by 2019. This compares to an estimated 31 percent of the Chicago workforce receiving wage increases from a $13 minimum wage in 2019;44 23 percent of workers in San Francisco receiving wage increases at a $15 minimum in 2018 (Reich, Jacobs, Bernhardt and Perry 2014c); and 25 percent receiving increases in Oakland at a $12.25 minimum in 2015 (Reich, Jacobs, Bernhardt and Perry 2014a).
The key lesson is that the $13 and $15 minimum wage levels that are becoming common benchmarks will not have the same impact in every city. Los Angeles has a higher density of low-wage jobs and lower median earnings compared to other cities (we elaborate on this point below). As a result, the proposed minimum wage increase schedule reaches higher up into the city’s wage distribution than has been attempted to date in the U.S.; therefore, we cannot rule out larger effects than would be predicted based on previous research, especially by 2019. Should the Los Angeles City Council decide to consider a longer implementation timeline to reduce uncertainty and risk, one useful metric would project the 2017 minimum wage of $13.25 forward with inflation and identify the year in which it would reach $15.00. By our calculations, using our mid-range growth scenario, $15.25 would be reached in 2023.
We recommend that the City Council commission impact studies as the minimum wage increases go into effect. The higher the minimum wage and the longer the timeline, the more important it will be to monitor developments along the way. Any evaluation should be done against a carefully constructed control group and take into account trends prior to the policy change, as well as concurrent changes in the economic and policy context not affected by the minimum wage law. Examples of short-term metrics for
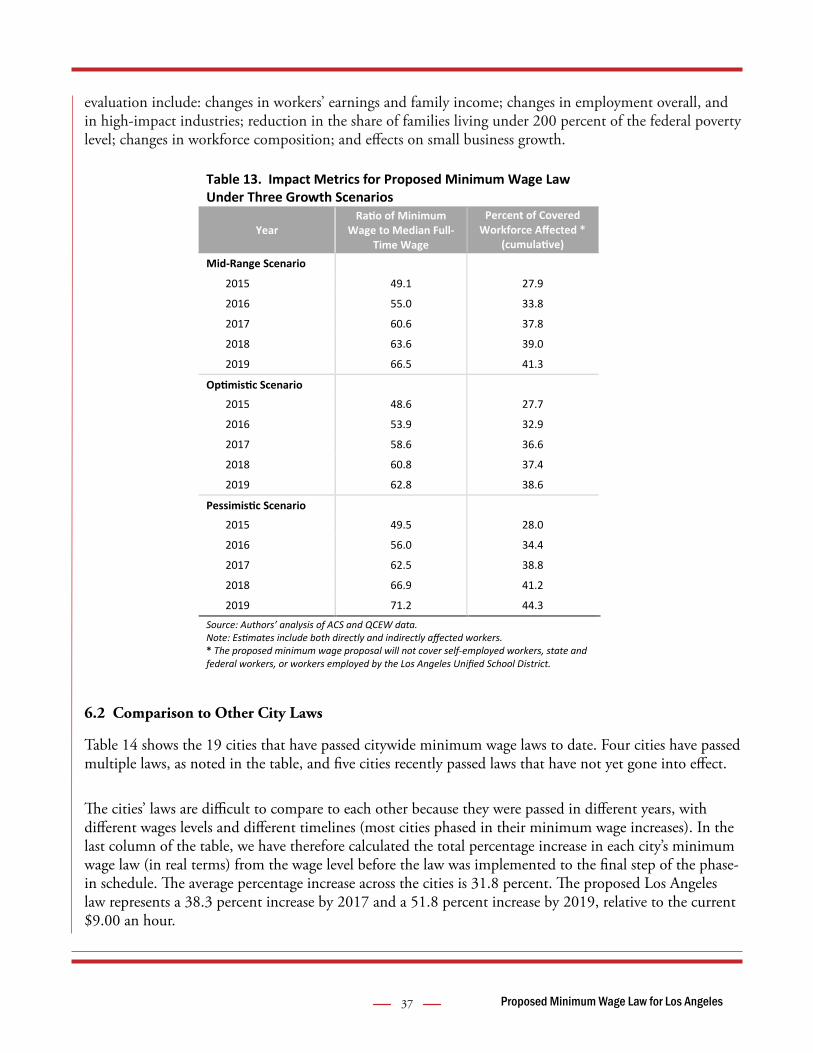
37 Proposed Minimum Wage Law for Los Angeles
evaluation include: changes in workers’ earnings and family income; changes in employment overall, and in high-impact industries; reduction in the share of families living under 200 percent of the federal poverty level; changes in workforce composition; and effects on small business growth.
6.2 Comparison to Other City Laws
Table 14 shows the 19 cities that have passed citywide minimum wage laws to date. Four cities have passed multiple laws, as noted in the table, and five cities recently passed laws that have not yet gone into effect.
The cities’ laws are difficult to compare to each other because they were passed in different years, with different wages levels and different timelines (most cities phased in their minimum wage increases). In the last column of the table, we have therefore calculated the total percentage increase in each city’s minimum wage law (in real terms) from the wage level before the law was implemented to the final step of the phase-in schedule. The average percentage increase across the cities is 31.8 percent. The proposed Los Angeles law represents a 38.3 percent increase by 2017 and a 51.8 percent increase by 2019, relative to the current $9.00 an hour.
Table 13. Impact Metrics for Proposed Minimum Wage Law Under Three Growth Scenarios
Year Ratio of Minimum
Wage to Median Full-Time Wage
Percent of Covered Workforce Affected *
(cumulative)
Mid-Range Scenario
2015 49.1 27.9
2016 55.0 33.8
2017 60.6 37.8
2018 63.6 39.0
2019 66.5 41.3
Optimistic Scenario
2015 48.6 27.7
2016 53.9 32.9
2017 58.6 36.6
2018 60.8 37.4
2019 62.8 38.6
Pessimistic Scenario
2015 49.5 28.0
2016 56.0 34.4
2017 62.5 38.8
2018 66.9 41.2
2019 71.2 44.3
Source: Authors’ analysis of ACS and QCEW data. Note: Estimates include both directly and indirectly affected workers. * The proposed minimum wage proposal will not cover self-employed workers, state and federal workers, or workers employed by the Los Angeles Unified School District.

38 Proposed Minimum Wage Law for Los Angeles
These cities vary significantly in their median wages, demographics, cost of living, poverty rates, and economic measures such as the unemployment rate and pace of job growth. In Table 15, we compare such measures across a range of cities in the U.S. (not all of which have adopted minimum wage laws). Los Angeles is at the low end in its median annual earnings and at the high end in its poverty and unemployment rates. Its cost of living is close to that of the high-wage cities of the San Francisco Bay Area and well above other major cities, such as Seattle and Chicago.45 These differences are particularly stark when comparing Los Angeles to San Francisco and Seattle, whose recently passed laws have become a reference point for policy makers.
Table 14. U.S. Cities and Counties with Local Minimum Wage Laws
City Year Passed Current Minimum Wage (as of March 2015)
Final Wage Step Before Indexing
(nominal)
Total Schedule Percentage Wage
Increase (real)
Albuquerque, NM 2006, 2012 $8.75 41.5, 13.3
Berkeley, CA 2014 $10.00 $12.53 (2016) 32.9
Bernalillo County, NM 2006, 2013 $8.50 41.5, 12.4
Chicago, IL 2014 $10.00 (on July 1) $13.00 (2019) 43.4
Las Cruces, NM 2014 $8.40 $10.00 (2019) 12.0
Louisville, KY 2014 $7.75 (on July 1) $9.00 (2017) 17.1
Montgomery County, MD 2013 $8.40 $11.50 (2017) 48.1
Mountain View, CA 2014 $10.30 (on July 1) 14.4
Oakland, CA 2014 $12.25 36.1
Prince George's County, MD County
2013 $8.40 $11.50 (2017) 48.1
Richmond, CA 2014 $9.60 $13.00 (2018) 34.7
San Diego, CA* 2014 $9.75 $11.50 (2017) 22.0
San Francisco, CA 2003, 2014 $11.05 ($12.25 on May 1)
$15.00 (2018) 25.9, 27.1
San Jose, CA 2012 $10.30 25.0 Santa Fe, NM 2003 $10.84 76.2
Santa Fe County, NM 2014 $10.84 42.1
Seattle, WA 2014 $10-$11 depending on employer size (on April 1)
$15.00 (2017-21) 48.2
Sunnyvale, CA 2014 $10.30 14.4
Washington D.C. 2004, 2014 $9.50 $11.50 (2016) 20.6, 33.7
Average 31.8
Los Angeles $9.00 $15.25 (2019) 51.8 Source: Authors’ analysis of city minimum wage law statutes. Note: Total Schedule Percentage Wage Increase is calculated by deflating the final wage level to the time of the initial increase and then calculating the percentage increase over the existing minimum wage before the law was implemented. Inflation for future years is assumed to follow the mid-range scenario. Past year inflation is obtained from the appropriate regional CPI-W series. *On ballot referendum in 2016.

39 Proposed Minimum Wage Law for Los Angeles
Tabl
e 15
. W
orke
r Dem
ogra
phic
s and
Eco
nom
ic C
onditio
ns in
Los
Ang
eles
and
Oth
er M
ajor
Citi
es
(all fig
ures
are
per
cent
ages
and
are
by
city
unl
ess o
ther
wise
not
ed)
Los
Ange
les
Oak
land
Sa
n Di
ego
San
Fran
cisc
o Sa
n Jo
se
Chic
ago
Dalla
s N
ew Y
ork
City
Ph
ilade
lphi
a Ph
oeni
x Se
attle
Tota
l Em
ploy
men
t- M
SA (2
013)
5,
514,
372
2,08
7,73
0 1,
304,
320
2,08
7,73
0 95
3,25
3 4,
238,
649
3,05
8,41
4 8,
570,
830
2,60
8,89
2 1,
770,
841
1,73
2,24
3 M
edia
n An
nual
Ear
ning
s- b
y pl
ace
of w
ork
(201
3)
$31,
531
$42,
016
$39,
722
$51,
600
$44,
803
$40,
742
$37,
273
$42,
278
$38,
847
$34,
956
$47,
471
Plac
e of
Wor
k Da
ta (2
012-
2013
)
Mal
e 52
.0
53.7
53
.0
53.6
57
.2
52.4
55
.3
52.5
48
.9
53.2
55
.5
Fem
ale
48.0
46
.3
47.0
46
.4
42.8
47
.6
44.7
47
.5
51.1
46
.8
44.5
18-2
9 26
.0
21.6
27
.3
22.7
21
.4
23.8
23
.7
23.3
25
.5
26.0
23
.4
30-5
4 60
.0
61.5
58
.3
62.1
64
.6
60.3
62
.0
61.7
57
.9
59.5
60
.6
55 a
nd O
lder
14
.0
16.9
14
.4
15.1
14
.0
15.9
14
.4
15.0
16
.7
14.5
16
.0
Whi
te
28.7
39
.0
47.7
44
.6
37.2
52
.6
44.8
40
.6
52.4
61
.1
67.2
Blac
k 7.
1 9.
0 4.
5 5.
5 2.
7 16
.9
17.8
19
.1
30.3
5.
1 5.
3
Latin
o 45
.7
22.7
31
.5
16.7
24
.5
22.0
29
.4
24.3
9.
0 26
.6
8.6
Asia
n 16
.2
25.4
13
.2
29.3
33
.0
7.1
6.4
13.6
6.
7 4.
2 14
.5
Oth
er
2.4
3.9
3.1
3.9
2.6
1.4
1.6
2.4
1.6
3.1
4.4
Less
than
Hig
h Sc
hool
15
.6
9.3
10.6
7.
4 9.
1 8.
8 13
.7
10.5
6.
3 9.
9 5.
6
High
Sch
ool o
r G.E
.D.
19.4
17
.4
19.1
12
.2
13.4
19
.6
20.4
19
.3
26.5
21
.7
16.6
Som
e Co
llege
/Ass
ocia
te’s
Deg
ree
31.2
30
.7
33.9
22
.8
25.3
28
.9
30.1
23
.3
27.2
36
.7
30.2
Bach
elor
’s D
egre
e or
Hig
her
33.8
42
.6
36.4
57
.6
52.2
42
.7
35.8
46
.9
39.9
31
.7
47.6
Plac
e of
Res
iden
ce D
ata
Pove
rty
Rate
(201
3)
23.0
19
.5
15.8
13
.8
12.8
23
.0
24.4
20
.9
26.3
23
.6
14.2
Pe
rcen
t of M
edia
n In
com
e N
eede
d fo
r Tr
ansp
ortatio
n an
d Ho
usin
g Co
sts (
2006
-201
0)
48.7
42
.4
48.5
43
.5
43.9
45
.7
45.8
46
.6
55.9
49
.3
45.1
Regi
onal
Pric
e Pa
rities
-MSA
(201
2)
118.
2 12
1.3
119.
0 12
1.3
122.
0 10
6.6
101.
0 12
2.2
109.
0 99
.7
107.
0
Une
mpl
oym
ent R
ate
(Dec
embe
r 201
4)
8.3
7.8
5.2
3.8
5.0
6.2
4.4
6.4
6.2
5.8
3.9
Empl
oym
ent G
row
th (2
004-
2013
)
Perc
ent C
hang
e- 1
0 ye
ars
0.4
3.5
4.0
16.1
11
.5
-5.6
-3
.5
6.7
3.1
-2.3
12
.7
Perc
ent C
hang
e- 4
yea
rs
4.0
7.2
4.9
10.3
9.
9 2.
4 5.
6 3.
4 2.
8 2.
4 7.
1
Sour
ce: T
otal
Em
ploy
men
t: Q
CEW
, 201
3. M
edia
n An
nual
Ear
ning
s: 1
-yea
r ACS
dat
a, P
lace
of W
ork
Annu
al M
edia
n Ea
rnin
gs. P
lace
of W
ork
Data
: Aut
hors
’ ana
lysis
of 2
012
and
2013
, 1-y
ear A
CS d
ata.
Pl
ace
of R
esid
ence
Dat
a: P
over
ty ra
te fr
om 2
013,
1-y
ear A
CS; T
rans
port
ation
and
Hou
sing
Cost
s fro
m H
UD
Locatio
n Aff
orda
bilit
y In
dex
(four
-per
son
hous
ehol
d w
ith tw
o co
mm
uter
s), 2
006-
2010
; Reg
iona
l Pric
e
Pariti
es fr
om U
.S. D
epar
tmen
t of C
omm
erce
, Bur
eau
of E
cono
mic
Ana
lysis
, 201
2; U
nem
ploy
men
t rat
e fr
om L
ocal
Are
a U
nem
ploy
men
t Statistic
s for
Dec
embe
r 201
4. E
mpl
oym
ent G
row
th: L
ocal
Are
a U
nem
ploy
men
t Statistic
s, 2
004-
2013
.
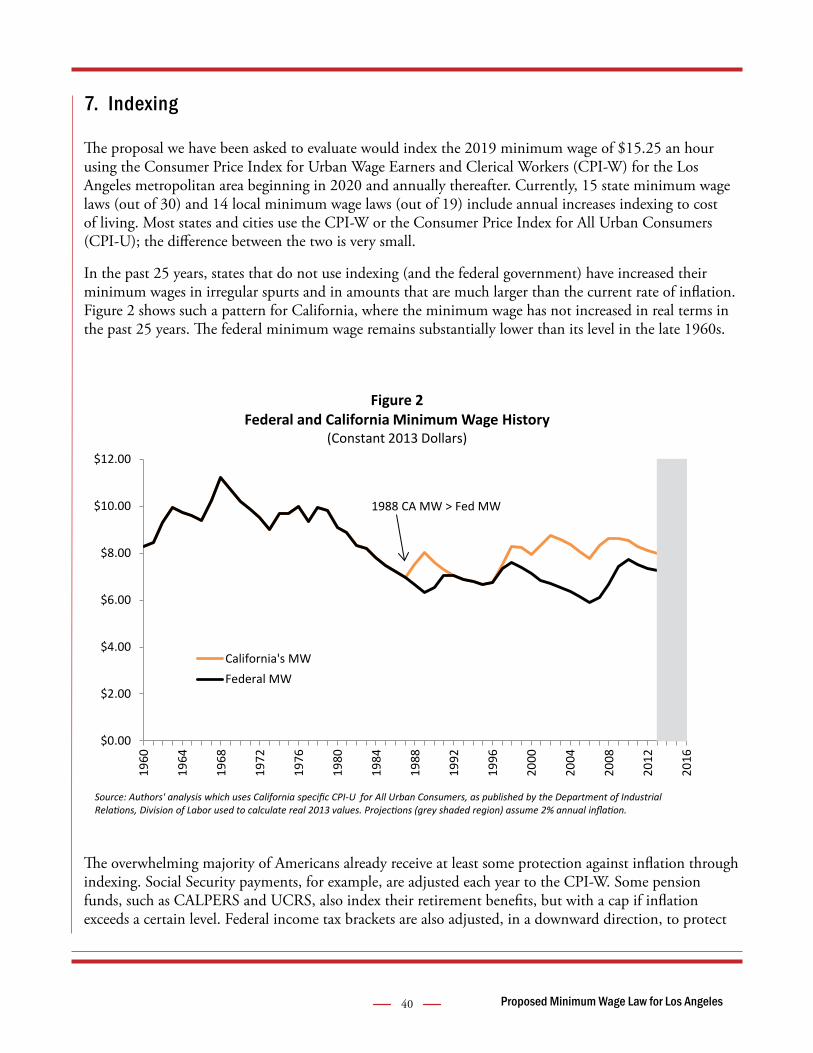
40 Proposed Minimum Wage Law for Los Angeles
7. Indexing
The proposal we have been asked to evaluate would index the 2019 minimum wage of $15.25 an hour using the Consumer Price Index for Urban Wage Earners and Clerical Workers (CPI-W) for the Los Angeles metropolitan area beginning in 2020 and annually thereafter. Currently, 15 state minimum wage laws (out of 30) and 14 local minimum wage laws (out of 19) include annual increases indexing to cost of living. Most states and cities use the CPI-W or the Consumer Price Index for All Urban Consumers (CPI-U); the difference between the two is very small.
In the past 25 years, states that do not use indexing (and the federal government) have increased their minimum wages in irregular spurts and in amounts that are much larger than the current rate of inflation. Figure 2 shows such a pattern for California, where the minimum wage has not increased in real terms in the past 25 years. The federal minimum wage remains substantially lower than its level in the late 1960s.
The overwhelming majority of Americans already receive at least some protection against inflation through indexing. Social Security payments, for example, are adjusted each year to the CPI-W. Some pension funds, such as CALPERS and UCRS, also index their retirement benefits, but with a cap if inflation exceeds a certain level. Federal income tax brackets are also adjusted, in a downward direction, to protect
$0.00
$2.00
$4.00
$6.00
$8.00
$10.00
$12.00
1960
1964
1968
1972
1976
1980
1984
1988
1992
1996
2000
2004
2008
2012
2016
Figure 2 Federal and California Minimum Wage History
(Constant 2013 Dollars)
California's MWFederal MW
1988 CA MW > Fed MW
Source: Authors' analysis which uses California specific CPI-U for All Urban Consumers, as published by the Department of Industrial Relations, Division of Labor used to calculate real 2013 values. Projections (grey shaded region) assume 2% annual inflation.

41 Proposed Minimum Wage Law for Los Angeles
taxpayers from “bracket creep” that would send them into higher tax rates. Eligibility levels for food stamps, Medi-Cal and other programs are adjusted each year for changes in the cost of living. Federal housing subsidies for low-income renters and landlords are adjusted for changes in apartment rents.
The primary argument for minimum wage indexing focuses on the goal of maintaining the purchasing power of the minimum wage for those it is intended to benefit. The underlying assumption here is that prices continue to rise, albeit at different rates over time (more in boom times than during busts). A secondary argument notes that regular, small annual minimum wage increases provide valuable predictability for businesses, in contrast to the pattern of irregular increases of unknown timing and amounts.
The primary argument against indexing focuses on the constraints indexing places on firms during bad times, when they are already forced to lay off workers. However, macroeconomists have consistently found that nominal wage rates are surprisingly rigid during downturns, including for workers who are not at minimum wage levels and who are not protected by indexation. Moreover, prices continue to increase in downturns even in industries that are most affected by the downturn.
A secondary argument against indexing focuses on the disruptions that might be caused to businesses by high inflation rates, such as occurred during the 1970s in the U.S. Since inflation has averaged 2.4 percent over the past ten years, and has been lower in the past five, any return of 1970s-levels of inflation is not on the current horizon. Indeed, since the 1970s the Federal Reserve has been quick to reduce inflation over its target levels by increasing interest rates.
While the theoretical advantages of indexation might seem to outweigh the theoretical disadvantages, in our view the argument is best settled by the evidence on whether indexation affects economic outcomes. We know of only one study that addresses this question (Allegretto, Dube and Reich 2011). Using a variety of statistical techniques, the authors were unable to detect employment effects from minimum wage laws that were different in the states that indexed compared to the states that did not.
7.1 Floors and Ceilings
Only three state laws and one city law include maximum caps on annual increases in their minimum wages. Michigan caps the increase at 3.5 percent a year, Nevada at 3.0 percent, Vermont at 5.0 percent, and Chicago at 2.5 percent. All states but Colorado and Missouri have a floor for annual adjustments at zero.
According to the California Department of Industrial Relations, the average annual increase in the CPI-W for Los Angeles from 1994 to 2013 was 2.4 percent.46 Growth in the CPI-W exceeded 4.0 percent only in two years (2005 and 2006), and was negative in one year (2009, at the height of the Great Recession).
The control of prices is a central preoccupation and goal of our central banking authority, the U.S. Federal Reserve Board. The Federal Reserve’s concern about deflation has changed over time. Price levels did fall in the 1930s during the Great Depression. While economic historians’ opinions differ as to the exact mechanism that generated price declines in that period, they generally agree that the Federal Reserve did not act then to restore price levels. The views of recent and current Chairs of the Federal Reserve and their policies emphasize that price declines should be avoided by the monetary authority.
42 Proposed Minimum Wage Law for Los Angeles
The Federal Reserve has demonstrated a strong and ongoing commitment to maintaining low inflation rates. Given this, the high rates of inflation that would raise the volatility concerns behind the rationale for floors and ceilings are unlikely to occur. If the Los Angeles City Council elects to include a cap, it could preserve the purchasing value of the minimum wage by banking any increase above the cap, or any decrease below the floor of 0, to be adjusted into subsequent years.
In sum, we find no compelling evidence that indexation would generate tradeoffs between economic benefits for minimum wage workers and economic activity.
7.2 Mechanisms to Slow or Halt Scheduled Increases
We have found only two examples of legislated provisions to slow or halt scheduled minimum wage increases (for example, in response to economic downturns or empirical evidence of negative economic impacts caused by the minimum wage increase). Chicago’s recently passed (2014) minimum wage law includes a provision that suspends the scheduled minimum wage increase in any year when the unemployment rate in the city for the preceding year was equal to or greater than 8.5 percent. The Bernalillo County, New Mexico, minimum wage law specifies that the Board of County Commissioners will review the minimum wage ordinance every five years to assess its continuing adequacy.
If the Los Angeles City Council decides to consider a mechanism to slow or halt scheduled minimum wage increases, different policy design options could be considered. For example, rather than pursuing a blanket change in minimum wage policy in response to a given trigger, an alternative strategy might be to empirically identify which industries or employers are struggling and provide for a temporary waiver process, while allowing the planned minimum wage increases to go forward for the majority of employers. Providing another design example, after passage of its minimum wage law in 2014 the Seattle City Council passed a resolution requesting that the City establish a five-year Minimum Wage Commission to review the law’s impact. The resolution also requested that impact studies be conducted two and four years after implementation of the law.
As mentioned above, the importance of predictability for businesses would need to be considered when weighing a policy mechanism that could result in abrupt changes to planned minimum wage increases.
8. Enforcement
An essential element of any local minimum wage law is the legal framework for enforcement. This includes both the enforcement provisions in the law itself and the direction of city resources towards enforcement.
Significant and extensive minimum wage violations have been documented in cities around the country, including Los Angeles. In a large representative survey of low-wage workers in Los Angeles in 2008, 30 percent were found to have been paid below the minimum wage during the previous week, and 88 percent had at least one pay-related violation in the previous week. The amount of underpayment due to minimum wage violations assuming a full-year work schedule averaged $1,135 a year, or 6.9 percent of earnings. Counting all pay-based violations, such as unpaid overtime and off-the-clock work, the yearly loss was $2,070, or 12.5 percent of earnings. Violations were found across industries and occupations, with above-average rates of minimum wage violations in garment manufacturing, domestic service, building services, and department stores (Milkman, Gonzalez and Narro 2010).
43 Proposed Minimum Wage Law for Los Angeles
Given the high prevalence of workplace violations in Los Angeles, effectively raising the minimum wage will require robust enforcement language in the law, creating a city enforcement agency, and implementing good enforcement practices and policies (see Yoon and Gebreselassie [2015] for a more in-depth treatment).
8.1 Enforcement-Related Provisions in the Law Itself
A standard set of enforcement provisions has emerged for California local minimum wage laws. This core legal framework commonly includes a private right of action, damages and other penalties, retaliation protections, notice posting and record keeping provisions, and business license revocation. Wage liens are another effective provision used in some jurisdictions to help with collections.
Private right of action: This provision allows victims of wage theft to privately pursue their own court cases against employers, supplementing public enforcement resources. The federal Fair Labor Standards Act, most states (Meyer and Greenleaf 2011), and all the existing California local minimum wage laws include a private right of action. In addition, local ordinances include provisions awarding reasonable attorneys’ fees and costs to employees whose rights have been violated, a necessary provision to encourage attorneys to take cases.
Damages and penalties: There is little incentive to comply with minimum wage laws if the only consequence of violation is payment of wages due (Meyer and Greenleaf 2011). To increase the incentive to comply, employees may be awarded not simply the wages they are owed but rather three times the wages they are owed, also known as “treble damages.” Five states and San Diego’s proposed minimum wage law specify that treble damages can be awarded for minimum wage violations (National Employment Law Project [NELP] 2011). Most of the other California local minimum wage laws include penalties payable to the worker of $50 per worker per day, from the first day the unpaid wages were due to the day on which they were paid back in full. Penalties that accrue in this way also provide an incentive for speedier repayment.
Retaliation protection: Fear of employer retaliation is a significant reason that violations go unreported (Bernhardt et al. 2009). Strong anti-retaliation protections in the law can help. Most California local minimum wage ordinances include a rebuttable presumption of retaliation if an employer takes broadly defined “adverse action” against an employee who has recently asserted his or her rights (NELP 2011).
Notice posting and record keeping: California local minimum wage laws also recognize the importance of informing employers and employees of the minimum wage. The city must publish the updated minimum wage rates, and employers must post the minimum wage in relevant languages for workers to see. Employers are also required to keep payroll records and provide access to investigators as needed. In the absence of payroll records, an employee’s report of wages and hours is presumed to be correct.47
Business license revocation: One strategy to increase compliance and prompt repayment included in most California local minimum wage ordinances is to involve other city departments or agencies in revoking or suspending business licenses and permits until any wage violation is remedied (NELP 2011; Gleeson, Taube and Noss 2014). San Francisco’s Office of Labor Standards Enforcement (OLSE) has had success working with the health department to consider outstanding wage claims before granting health permits to restaurants (Dietz, Levitt and Love 2014). New Jersey, Utah, Massachusetts, and Connecticut can suspend liquor licenses for violations of various laws. Houston, Chicago, and Seattle are also able to suspend or

44 Proposed Minimum Wage Law for Los Angeles
revoke business licenses or permits for businesses found to owe money to their workers. Consequences for employers convicted of wage theft or with unpaid wage claims can include being barred from winning city contracts, renting city-owned space, or receiving city business permits (Gleeson, Taube and Noss 2014).
Wage liens: Even when a violation has been found and employers are ordered to provide back pay to workers, actual payment of wages is not guaranteed, and indeed in California only a fraction of wages found due are ever paid (Cho, Koonse and Mischel 2014). A wage lien—a claim on property owned by the employer so that it cannot be sold without payment going to the worker—is one tool used to secure payment from recalcitrant employers found to owe back wages. A number of states, including Alaska, Texas, and Wisconsin, have legislation enabling workers to impose wage liens (NELP 2011). Evidence from Wisconsin indicates that this process results in increased collections of wages due. Wisconsin’s wage lien statute allows liens to be filed at the beginning of the claims process rather than only after a judgment has been issued, by which time the employer may have abandoned, transferred, or sold the business (Cho, Koonse and Mischel 2014).48
8.2 The Creation of an Enforcement Agency
Creating, funding, and staffing a local government office dedicated to enforcement is vital for implementing an effective law. Even with the right of private action and awarding of attorneys’ fees and costs, the private bar is not enough to protect the rights of low-wage workers. For a city to realize the economic benefits of increased spending brought about by higher minimum wages, it must enforce workers’ right to a minimum wage. A dedicated city office serves as a centralized place to educate workers and employers, receive complaints, investigate compliance, and collect wages due. State and federal enforcement offices are already understaffed and struggle to provide robust investigations and timely collections (Government Accountability Office 2009; Su 2013; Bobo 2009), let alone deter wage theft with proactive enforcement and a credible expectation of a compliance check (Fine and Gordon 2010; Ichikawa and Smith 2014). State enforcement offices are limited not only in their resources but also in their ability to collect wages associated with local minimum wage laws, though legislation introduced at the state-level, AB-970, would amend the labor code to allow for enforcement up to the local minimum.49 Nevertheless, coordination between local and state or federal enforcement agencies makes sense, as in San Francisco where local and state offices refer cases to one another (Dietz, Levitt and Love 2014).
Local employment conditions are important when determining the appropriate staffing level of an enforcement agency. Other jurisdictions can provide a baseline, but the particulars of economy and geography matter. More resources may be appropriate for areas with higher concentrations of low-wage jobs, industries with poor track records of compliance, immigrant workers, and complex workplace relationships (such as use of temp agencies or independent contractors). More small employers and larger geographic coverage also require more resources for the same level of enforcement.
San Francisco, the city with the most robust enforcement regime, currently has only 5.5 minimum wage investigators for a labor force of approximately 600,000, or about 110,000 workers per investigator. San Francisco, however, has a lower concentration of low-wage workers than Los Angeles (and we suspect also lower rates of violations). Looking at the low-wage workforce projected to directly benefit from an increase in minimum wage, San Francisco has approximately 20,000 minimum wage workers per investigator (unpublished data from Reich, Jacobs, Bernhardt and Perry 2014c). Using this metric translates into 25 investigators to cover the low-wage workers estimated to directly benefit from the minimum wage increase

45 Proposed Minimum Wage Law for Los Angeles
in Los Angeles by 2019, underscoring that enforcement staffing needs to be calibrated to the specific needs of each locality.
8.3 Best Enforcement Practices
As cities and states experiment with increases in minimum wage, enforcement strategies are evolving to meet the challenges of 21st century workplaces given constrained funding. Strategies to consider at the local level are summarized below.
Company-wide investigations: When responding to a worker complaint, the San Francisco OLSE investigates the entire workplace on behalf of all workers. This allows the worker who came forward to remain anonymous for longer, which may provide some protection from retaliation. Because violations are rarely concentrated on a single employee, this approach allows investigators to recover back wages for more employees. The goal is also to correct business practices for all employees going forward (Dietz, Levitt and Love 2014).
Proactive investigations: Enforcement of wage and hour laws in many jurisdictions is solely complaint-driven, even though the most vulnerable and exploited workers are among the least likely to complain (Weil and Pyles 2005). Complaint-driven enforcement is also less effective at deterrence than targeted investigations (Ichikawa and Smith 2014). In response, federal, state, and city enforcement offices are increasingly moving beyond a complaint-driven approach and engaging in targeted, proactive investigations of industries and employers. As part of a proactive strategy, random payroll audits in a given industry or region can help generate data on the scale of violations and where to focus investigations, as well as create a mechanism to assess effectiveness of enforcement strategies over time (NELP 2011).
Proactive investigations are already taking place at labor enforcement agencies across the country. The Wage and Hour Division of the Department of Labor increased its targeted investigations from 27 percent of investigations in 2009 to 44 percent in 2013, and focuses those investigations on priority industries (Weil 2014). In California, the Janitorial Enforcement Team works alongside the Maintenance Corporation Trust Fund to police workplace conditions in the janitorial industry, which is full of complex subcontracting relationships (Fine and Gordon 2010). In New York the state Department of Labor uncovered $6.6 million in unpaid wages through a proactive investigation of the car wash industry (New York State Department of Labor 2008).
8.4 The Role of Community Partnerships
Building trust with workers is fundamental to successful enforcement of labor laws. Mistrust of government institutions can mean that workers do not come forward with complaints, or are reticent to cooperate once an investigation starts (Dietz, Levitt and Love 2014). Many of the most vulnerable workers—low-wage workers from immigrant communities and communities of color—are wary of government institutions but do trust organizations within their community (Gleeson 2009). Enforcement agencies can leverage the complementary strengths of community-based organizations (CBOs) in order to increase effectiveness and reach. The linguistic, cultural, and industry knowledge within CBOs make them valuable partners in educating workers about their rights, building trust between workers and investigators, and providing knowledge of the particular industry dynamics at play (Fine and Gordon 2010, Fine 2014).
46 Proposed Minimum Wage Law for Los Angeles
In Los Angeles, the Board of Public Works and the Unified School District have successfully partnered with building trades unions to train volunteers to help enforce prevailing wage laws. The city inspectors determine violations and assess penalties, but cases are brought to their attention or made stronger through the partnership. These volunteers gather information that city inspectors use to put together cases. In addition to expanding the capacity of the city to enforce prevailing wage, essentially acting as the “directed enforcement team,” these volunteers also provide deep industry knowledge and expanded language capabilities (Fine and Gordon 2010).
San Francisco funds contracts for immigrant and low-income community organizations to conduct worker outreach and education and to help develop cases. One of the most significant cases in the city, a $4 million settlement with dim sum restaurant Yank Sing, was brought about through intense work by the Chinese Progressive Association. The organization was able to build on its existing relationship with workers, many of whom were monolingual Chinese speakers, so that workers felt safe coming forward and pressing their case. While OLSE staffers themselves have a broad range of language abilities and experience in various industries, they still see CBOs as important and complementary partners (Dietz, Levitt and Love 2014). In fiscal year 2013 –14 the office collected more in back wages and interest from cases filed with the help of CBOs than from those generated by worker complaints alone (Love 2015). Because of the success in San Francisco, Seattle and San Diego are also considering the appropriate funding levels for community groups to do minimum wage-related worker outreach and education (Beekman 2014; Office of the Independent Budget Analyst 2014).
9. Nonprofits and Small Businesses
9.1 Nonprofit Organizations
As discussed above, nonprofits comprise a wide range of organizations. Some are large institutions (universities, hospitals, large services providers) that have sizeable annual budgets with varied funding streams and that are therefore able to absorb minimum wage increases. Such institutions account for a significant portion of the nonprofit sector, as previously noted. At the same time, other nonprofits may face real constraints on their ability to adjust to minimum wage increases (see Section 4.4 above). These are typically smaller nonprofits dependent on a few public funding streams that are fixed over the short or even medium term, and over which they have little leverage.
Our analysis in Section 4.4 suggests that a local minimum wage policy offers an opportunity to address the problem of low-wage work in certain nonprofit service-providing sectors—a problem that impacts the well-being of both workers and program clients through the quality of care provided. Exempting groups of nonprofit organizations from a minimum wage increase, conversely, could have negative effects on the quality of care by increasing employee turnover. If certain nonprofits pay lower wages than the rest of the market, it will make it harder for them to attract and retain workers. But requiring higher wages without addressing the need to increase funding streams, or without providing sufficient phase-in time, is likely to result in cuts to services.
Ultimately, the solution is to increase public funding for the services provided by these nonprofits. The City of Los Angeles has already begun to raise this issue with the State as it relates to services for people

47 Proposed Minimum Wage Law for Los Angeles
with developmental disabilities. We recognize that this is a difficult policy challenge, given the complex matrix of local, state, and federal funding streams for social services combined with budgetary constraints and the inevitable time lags involved in moving approval through the governmental process.
Los Angeles could join with other cities that are setting local minimum wage rates to obtain state and federal funding to help pay for the cost of increased wages in publicly-funded services. In seeking higher reimbursement rates, cities could point to the savings that the minimum wage increases will immediately generate for the state budget in reduced public assistance costs (Allegretto, Reich and West 2014). These savings will primarily come from Medi-Cal, as some individuals who qualified under the 50 percent federal matching rate will now be at a slightly higher income level for which the state receives a full federal match under the Affordable Care Act expansion. Others will go from Medi-Cal coverage into Covered CA where the subsidies are federally funded. In addition, the state will have a small amount of savings from individuals receiving cash assistance through CalWORKS, as the amount of the assistance will decrease as wages increase.
The City could also choose to fund the higher wages in certain sectors. San Francisco’s C-Wages program, for example, provides County wage subsidies to child care centers and family child care providers that meet certain quality measures and enroll at least 25 percent of their children from low-income families. Funding for this program was increased to assist providers in meeting the higher minimum wage in 2015. The City could also engage with private philanthropy to help support nonprofit agencies through the transition. This should include both financial aid and technical assistance and management support in adjusting to the higher wage rate.
In the short term, it is likely some nonprofits will need a longer time period to adjust to the proposed minimum wage increase. A number of city minimum wage laws have provided for slower phase-ins for nonprofit organizations. In San Francisco’s 2003 law, implementation was delayed by one year for nonprofits; however, its recent 2014 law had no such phase-in. Berkeley’s 2014 law exempts nonprofits for one year, at which point they are required to pay the same minimum wage as for-profit firms. Santa Fe initially exempted nonprofits in its 2003 law, but revoked that exemption in its 2007 ordinance (though it continues to exempt nonprofits whose primary source of funding is from Medicaid waivers).
If the Los Angeles City Council decides to consider a longer phase-in schedule for some nonprofits, a key policy design question will be which nonprofits would qualify for the slower phase-in. In our policy scan, we have not identified a robust test that differentiates nonprofit institutions with sufficient margins and diversified funding streams from nonprofits that will struggle to comply on the proposed timeline. Therefore, we are not able to recommend a specific qualification test to the City Council. Los Angeles’ living wage law attempts such a test by allowing applications for waivers for nonprofits whose CEO earns less than eight times the hourly wage rate of the lowest paid worker (this exemption does not apply to child care workers); the waiver lasts the length of the contract. Without empirical evidence, it is difficult to assess whether this test adequately differentiates between nonprofits that can absorb the proposed minimum wage increase from those that will need more time. One downside of this approach is that it potentially creates an incentive to contract out lower-wage work. This could be avoided by factoring in wages of sub-contracted services or using a ratio of CEO pay to the new minimum wage.
Transitional Jobs Programs
We have been asked to identify provisions in existing city minimum wage laws that specifically identify one
48 Proposed Minimum Wage Law for Los Angeles
particular type of nonprofit—transitional jobs programs—for differential treatment. One challenge here is that it is not clear what qualifies as a transitional jobs program in existing laws. Las Cruces’ (2014) law exempts from coverage “individuals being served for purposes of rehabilitation by a charitable or nonprofit organization, notwithstanding the payment to the individual of a stipend based upon the value of the work performed by the individual.” Some cities reference sections of their state laws that provide lower wage rates for (or exclude from coverage altogether) certain categories of workers: for example, participants in publicly-subsidized youth job training programs, workers with certain disabilities, client workers in rehabilitation facilities, or learners/apprentices.50 Typically, nonprofits are required to apply for a license to pay such workers a wage below the statutory minimum rate.
If the Los Angeles City Council decides to consider differential treatment of transitional jobs programs, several policy design questions should be considered. At issue is that transitional jobs programs provide services to their client employees (education and training, legal services, counseling, etc.) that incur added costs on top of the wages paid. The question is how these services are funded. If they are funded via public funding streams and foundation grants, then in some sense transitional jobs programs are in the same position as the other nonprofits discussed above, and should be grouped with them. In other words, we do not have enough information to assess whether the economics of transitional jobs programs are substantively different from the economics of other nonprofit social service providers dependent on public funding streams.
9.2 Small Businesses
Several city minimum wage laws have provided slower phase-ins for small businesses. San Francisco’s 2003 law delayed implementation by one year for businesses with fewer than 10 employees. Santa Fe initially exempted small businesses (fewer than 25 employees) from its 2003 law, but in 2007 amended the law to cover all establishments regardless of size. Seattle’s 2014 law establishes slower phase-ins for small businesses (defined as 500 or fewer employees); the phase-in schedule varies depending on total compensation.51 Two local laws exempt some small businesses altogether: Montgomery County’s 2013 law exempts businesses that employ fewer than two employees, and Richmond’s 2014 law exempts employers who pay for less than 800 hours of employee labor during a given two-week period.
If the Los Angeles City Council decides to consider a slower phase-in for small businesses, several policy design questions should be considered. First, there is a lack of consistent definitions of “small businesses” in public policy, as evidenced in the above examples from other cities. In Los Angeles, the City’s Small, Local Business Program requires that applicants are not dominant in their field and are owned and operated in Los Angeles; administrators are to consider whether the business’s receipts are less than $3 million when approving the request. By contrast, the City’s Economic and Workforce Development Department’s Small Business Loan Program requires recipients to operate in Los Angeles and to have less than $10 million in annual revenue.52 While these city programs do not include requirements on the number of employees, other local and state programs have employee-based thresholds that range from 7 employees to 100 employees.53 We are not able to recommend a specific definition of “small business” because of the lack of consensus and consistency in definitions currently being used, and because our data analysis in Section 4.3 did not reveal any obvious impact discontinuities by firms size that might suggest a natural threshold.
A second consideration is whether to define businesses as firms or establishments. Large firms often operate via multiple small establishments (i.e., retail clothing stores or bank branches); therefore, a small business
49 Proposed Minimum Wage Law for Los Angeles
definition based on establishment size will erroneously include large national or multinational firms. We would therefore recommend a definition based on firm size. The same principle holds in the case of franchises—i.e., all franchises or other businesses owned by a given owner or group of owners should be counted toward firm size.
Finally, economic theory suggests that wholesale exemptions based on firm size will result in perverse incentives, and so we generally do not recommend them.
Whether or not the City institutes a longer phase-in period for certain small businesses, the City should seek ways to assist small businesses through the transition, including assisting access to small business loans and technical assistance and training.
10. Total Compensation
Four localities allow employers to include some or all of their payment of health benefits and child care benefits in the calculation of wages paid. Albuquerque’s and Bernalillo County’s minimum wage laws allow a health care or child care credit of $1.00 per hour, and Richmond allows a health care credit of up to $1.50 per hour. Santa Fe’s (2003) law states that the value of health and child care benefits are considered part of wages. Seattle allows certain forms of compensation to be counted during a phase-in period. Four cities (San Francisco, San Jose, Seattle and Sunnyvale) allow commissions and/or non-discretionary bonuses to be counted as compensation. (Current California state law pre-empts localities from instituting a tip credit or excluding tipped workers, so we do not address tips here).
One rationale for including all or some of the costs of certain benefits in the wage calculation is to avoid creating an incentive for employers to cut benefits in order to meet the higher wage threshold. Studies of past minimum wage increases have not found associated reductions in fringe benefits (Schmitt 2013), though it is difficult to predict with certainty whether this would change as a greater share of the workforce is affected by the policy. We estimate that just over a quarter (25.1 percent by 2017, 27.3 percent by 2019) of the workers who would receive wage increases under the proposed minimum wage law have health insurance through their own employer (see Table 5). Of those, 25 percent work in firms with less than 50 employees and 7 percent work under 30 hours a week, and so would not be covered under the employer responsibility provisions of the Affordable Care Act. Employers of workers covered under the ACA employer provisions would be unlikely to eliminate health benefits, but might reduce the employer share of premium or move to lower-cost plans.
The provision of benefits varies significantly from one industry to another, and, within industries, from one employer to another. Counting total compensation would therefore result in very different minimum wage levels. Since the value of many benefits does not appear on worker’s paychecks, this would create substantial challenges for enforcement. We also know that large firms are more likely to provide benefits than small firms; counting total compensation would therefore result in a disadvantage to small business.
Crediting health benefits towards a minimum wage creates additional challenges for policy design. The Los Angeles Living Wage policy allows employers to only count money actually spent for health care on each specific individual towards meeting the requirement; if an employer offers insurance but the employee

50 Proposed Minimum Wage Law for Los Angeles
turns down the coverage, the employer must pay the higher wages unless the policy is offered at no cost to the employee. This is designed to avoid situations where employers offer health care with a high share of premium cost to the employees with the expectation that many part-time and lower-wage workers will choose to forgo coverage. By offering employees a choice between health insurance and higher pay, however, there is added risk that healthier employees may turn down coverage in order to obtain higher wages, leading to adverse selection into the health plan.54 Either way, such a policy would entail significant enforcement challenges.
11. Other Issues
11.1 Teens
Local minimum wage laws typically incorporate state definitions of which employees are covered by state labor law. Four of the California cities with local minimum wage laws exempt subsidized summer or short-term youth employment programs. Two local ordinances, Montgomery and Prince George’s Counties, go beyond state law and exclude employees under the age of 19 who work no more than 20 hours per week; Bernalillo County exempts employees under age 16. California regulation allows for youth “learner” employees to be paid 85 percent of the minimum wage during their first 160 hours of employment in occupations in which the employee has no previous similar or related experience (California Department of Industrial Relations 2013). When state or federal law has included a subminimum wage for teens, very few employers made use of it (Card and Krueger 1995).55
The goal behind exempting young workers from minimum wage requirements is to avoid creating disincentives for hiring such workers. In theory, higher minimum wages could reduce the incentive for employers to hire less skilled workers, thus disadvantaging teens. On the other hand, higher minimum wages might draw more teen workers into the labor market, leading to an increase in teen employment.
A large body of research suggests that the effect of minimum wage laws on teen employment, reviewed in Appendix B, is either negligible or very small. Moreover, we estimate that teens will constitute only 3 percent of workers affected by Los Angeles’ proposed law (see Table 5).
Giuliano (2013) finds a small increase in relative employment of teens after a minimum wage increase using personnel data from a large U.S. retail firm. Neumark and Wascher (1992) find a modest negative impact on teen employment through cross-state comparisons. Allegretto, Dube and Reich (2011) follow Neumark and Wascher’s methods, but control for regional differences and find no measurable impact on teen employment.56
On the downside, subminimum or training wages for teens may create an incentive to hire middle-class teenagers over low-wage adult workers in high-turnover industries such as food-fast restaurants.
To summarize, it appears that differential treatment for teens beyond what is already permissible in California law is not necessary.
51 Proposed Minimum Wage Law for Los Angeles
11.2 The Hotel Minimum Wage Law
Under current law, hotels in Los Angeles with more than 300 rooms will be required to pay $15.37 an hour starting in July, 2015, and those with 150 or more rooms in July 2016. We were asked to assess the implications of the proposed citywide minimum wage law for the existing hotel minimum wage law. The new minimum wage policy does not change the policy considerations behind the City’s rationale for setting higher wage requirements for the hotel industry, in the same way that a more comprehensive set of policies covers standards at the Los Angeles International Airport. By setting a higher minimum wage for all workers in the city, the proposed policy would lessen any competitive disadvantage created by the hotel minimum wage law. If a new agency is created to enforce the proposed citywide minimum wage law, it could incorporate enforcement of the hotel policy at a lower marginal cost than creating an agency to enforce the current hotel policy only.
Conclusions
In this report, we find that the proposal to increase the minimum wage to $13.25 by 2017 and $15.25 by 2019 would generate a series of benefits and costs for workers, residents and businesses in Los Angeles City and in the remainder of the County.
The proposed policy would result in substantial benefits to low-wage workers and their families. We estimate that it would raise wages for 542,000 workers by 2017 and 609,000 workers by 2019. On average, the annual earnings of affected workers would increase $3,200 by 2017 and $4,800 by 2019.
More than 80 percent of Los Angeles workers in poor or near-poor families would receive wage increases under the proposal. The large majority (97 percent) of those receiving wage increases would be adults and 83 percent would be people of color. While increases would go disproportionately to those with lower levels of educational attainment, nearly half (45 percent) would go to workers with at least some college education.
In our model, the additional payroll costs to businesses would be partly offset by savings on turnover costs; the remainder would be passed on to consumers via prices in the short run and partly absorbed through lower profits or commercial rents in the long run. We estimate that the proposed minimum wage increases would result in a 0.5 percent increase in consumer prices by 2017 and a 0.9 percent increase by 2019. Higher prices would in turn reduce consumer sales in the city.
Taking multiplier effects into account, we find that this reduction in consumer demand would be largely, but not entirely, offset within the city of Los Angeles by increased consumer spending by workers receiving wage increases. Moreover, increased spending by affected workers who live outside the city would result in a net increase in employment in the region. Specifically, we estimate that the proposed minimum wage increase would reduce employment by 0.1 percent in the city by 2017 and by 0.2 percent by 2019, but would increase employment overall by 0.1 percent in Los Angeles County. These estimates are cumulative (and so will be spread over several years) and should be understood in the context of projected annual employment growth in the city of 2.5 percent from 2015 to 2019 (Beacon Economics 2014). These net changes in employment can take the form of job losses, reduced hours worked, or most likely, a combination of both. In Los Angeles City, if all of the reduction in employment were to take the form of lost jobs, the cumulative number of workers benefitting from the proposed minimum wage law would

52 Proposed Minimum Wage Law for Los Angeles
change from 542,000 to 540,00 in 2017, and from 609,000 to 606,000 in 2019.
In other words, the costs of the proposed law would be concentrated in the city, but the benefits would be spread throughout the county (because more than half of the affected workers live outside the city).
Previous research suggests that business relocations in the Los Angeles area are more determined by real estate prices and access to consumer markets than by differences in labor costs. Wages are likely to rise just outside of Los Angeles City as businesses there will want to hold on to their workforce. The low levels of retail vacancy rates inside and near Los Angeles City will also mitigate any net business exodus. Recent research also suggests that any business closures stimulated by minimum wage increases tend to be offset by additional new businesses.
An ongoing, sustained high minimum wage differential between Los Angeles and surrounding areas could affect the location decisions of firms producing tradable goods and services. This risk would be lessened if a minimum wage policy in Los Angeles encourages other jurisdictions in the county to take similar action. Just as minimum wage increases in Los Angeles will benefit surrounding areas, higher minimum wage levels in those areas would also boost economic activity within the city, allowing Los Angeles to realize its full share of the benefits of a minimum wage increase.
Any prospective impact study comes with an inherent level of uncertainty. That uncertainty is greater the farther into the future that we predict. For example, while most analysts project continued steady economic growth, there is a risk that wage growth could slow between now and 2019, which would increase the costs to firms of meeting the higher minimum wage rate.
Uncertainty also increases when assessing policies that go beyond the range of previous experience. The economic relationships in our impact model between wages and prices, border effects, and turnover are based in part on research on minimum wage increases that were smaller than those currently being contemplated by the City of Los Angeles by 2019. We have tried to mitigate this uncertainty by drawing on research outside of the minimum wage literature and by varying the parameters in our model to test how they affect the overall results. Nonetheless, we cannot rule out larger than expected effects at higher wage levels.
In implementing a local minimum wage ordinance of the proposed magnitude, therefore, it will be important to monitor the program as it develops. Special assistance and support will be needed for small businesses and nonprofit agencies to make the transition towards higher wages. Los Angeles should join with other cities to seek increased reimbursement rates for child care subsidies and human service programs to enable them to meet the higher wage levels without reductions in service.
Finally, we underscore that the intended benefits of the proposed minimum wage law will not be realized without robust enforcement language in the law and sustained ongoing enforcement after passage.
To conclude, we find that the benefits of the proposed minimum wage law will largely outweigh the costs in Los Angeles City, and when the larger region is considered, the net impact of the law will be positive. The high density of low-wage jobs in Los Angeles means that the benefits of raising the minimum wage will be considerable; it also means that the risks of unintended effects are greater at higher wage levels. Our goal in this report has been to provide the Los Angeles City Council the best information available as it weighs these competing factors in designing the best policy for the city’s workers, businesses and residents.
53 Proposed Minimum Wage Law for Los Angeles
References
Aaronson, Daniel. 2001. “Price Pass-Through and the Minimum Wage.” Review of Economics and Statistics 83(1): 158-169.
Aaronson, Daniel, Sumit Agarwal and Eric French. 2012. “The Spending and Debt Responses to a Minimum Wage Hike.” American Economic Review 102(7): 3111-39.
Aaronson, Daniel and Eric French. 2013. “How Does a Minimum Wage Hike Affect Aggregate Household Spending?” Federal Reserve Bank of Chicago, Chicago Fed Letter No. 313. http://www.chicagofed.org/digital_assets/publications/chicago_fed_letter/2013/cflaugust2013_313.pdf
Aaronson, Daniel, Eric French and James MacDonald. 2008. “The Minimum Wage, Restaurant Prices, and Labor Market Structure.” Journal of Human Resources 43(3): 688-720.
Aaronson, Daniel, Eric French and Isaac Sorkin. 2013. “Firm Dynamics and the Minimum Wage: A Putty-Clay Approach.” Research Department, Federal Reserve Board of Chicago, Working Paper 2013-26. https://www.chicagofed.org/digital_assets/publications/working_papers/2013/wp2013_26.pdf
Aaronson, Daniel and Brian Phelan. 2014. “Wage Shocks and Technological Substitution.” Preliminary draft, Federal Reserve Bank of Chicago.
Aguiar, Mark and Erik Hurst. 2005. “Consumption versus Expenditure.” Journal of Political Economy 113(5): 919-948.
Akee, Randall, William Copeland, Gordon Keeler, Adrian Angold and E. Jane Costello. 2010. “Parents’ Incomes and Children’s Outcomes: A Quasi-experiment Using Transfer Payments from Casino Profits.” American Economic Journal: Applied Economics 2(1):86–115.
Allegretto, Sylvia, Arindrajit Dube and Michael Reich. 2011. “Do Minimum Wages Really Reduce Teen Employment? Accounting for Heterogeneity and Selectivity in State Panel Data.” Industrial Relations 50(2): 205-40.
Allegretto, Sylvia, Arindrajit Dube, Michael Reich and Ben Zipperer. (2013). “Credible Research Designs for Minimum Wage Studies.” IRLE Working Paper No. 148-13. http://irle.berkeley.edu/workingpapers/148-13.pdf
Allegretto, Sylvia, Arindrajit Dube, Michael Reich and Ben Zipperer. Forthcoming. “Response to Neumark, Salas and Wascher.” Manuscript.
Allegretto, Sylvia and Michael Reich. 2014. “Minimum Wage Effects on Prices: Preliminary Results.” Paper presented at the Portland Meetings of the Labor and Employment Research Association.
Allegretto, Sylvia, Michael Reich and Rachel West. 2014. “Ten Dollars or Thirteen Dollars? Comparing the Effects of State Minimum Wage Increases in California.” Center on Wage and Employment Dynamics Policy Brief. http://www.irle.berkeley.edu/cwed/briefs/2014-02.pdf

54 Proposed Minimum Wage Law for Los Angeles
Ashenfelter, Orley, Henry Farber and Michael Ransom. 2010. “Modern Models of Monopsony in Labor Markets: A Brief Survey.” Journal of Labor Economics. Available at: http://ftp.iza.org/dp4915.pdf
Autor, David. 2014a. “Skills, Education and the Rise of Earnings Inequality Among the ‘Other 99 Percent.’” Science 344(6186): 843-851. http://www.sciencemag.org/content/344/6186/843.full
Autor, David. 2014b. “Polanyi’s Paradox and the Shape of Employment Growth.” NBER Working Paper 20485. http://www.nber.org/papers/w20485.pdf
Beacon Economics. 2012. “An Economic Analysis of Measure D: The San Jose Minimum Wage.” http://www.sjchamber.com/pdf/12_BeaconEconomicsMeasureDStudy_10.pdf
Beacon Economics. 2014. “City of Los Angeles: A Comparative Analysis and Forecast.” http://cao.lacity.org/debt/2014.05.27_Los_Angeles_Bond_Study_2014.pdf
Beekman, Daniel. 2014. “Seattle City Council may add minimum-wage investigators, funding to mayor’s budget.” The Seattle Times, November 4, 2014. http://blogs.seattletimes.com/today/2014/11/seattle-city-council-may-add-minimum-wage-investigators-funding-to-mayors-budget/
Belman, Dale and Paul J. Wolfson. 2014. What Does the Minimum Wage Do? Kalamazoo, MI: W.E. Upjohn Institute for Employment Research.
Benner, Chris and Saru Jayaraman. 2012. “A Dime a Day: The Impact of the Miller/Harkin Minimum Wage Proposal on the Price of Food.” University of California Berkeley Food Labor Research Center, Food Chain Workers Alliance and Restaurant Opportunities Center. http://laborcenter.berkeley.edu/foodlabor/price_food12.pdf
Bernhardt, Annette, Ruth Milkman, Nik Theodore, Douglas Heckathorn, Mirabai Auer, James DeFilippis, Ana Luz Gonzalez, Victor Narro, Jason Perelshteyn, Diana Polson and Michael Spiller. 2009. “Broken Laws, Unprotected Workers: Violations of Employment and Labor Laws in America’s Cities.” Center for Urban Economic Development; National Employment Law Project; UCLA Institute for Research on Labor and Employment. http://www.nelp.org/page/-/brokenlaws/BrokenLawsReport2009.pdf?nocdn=1
Berube, Alan. 2014. “All Cities Are Not Created Equal.” Brookings Institution, Appendix. http://www.brookings.edu/~/media/research/files/papers/2014/02/city%20inequality/appendix.pdf.
Blake, Frank. 2000. “New Ideas for Retaining Store-Level Employees.” Coca-Cola Research Council. Atlanta, GA. http://ccrrc.org/wp-content/uploads/sites/24/2014/02/New_Ideas_for_Retaining_Store-Level_Employees_2000.pdf
Blundell, Richard, Panos Pashardes and Guglielmo Weber. 1993. “What Do We Learn About Consumer Demand Patterns from Micro Data?” American Economic Review 83(3): 570-597.
Bobo, Kim. 2009. Wage Theft in America: Why Millions of Working Americans are Not Getting Paid, and What We Can Do About It. New York: W. W. Norton.

55 Proposed Minimum Wage Law for Los Angeles
Boushey, Heather and Sarah Glynn. 2012. “There are Significant Business Costs to Replacement Employees.” Center for American Progress. https://cdn.americanprogress.org/wp-content/uploads/2012/11/CostofTurnover.pdf
Brochu, Pierre, and David Green. 2011. “The Impact of Minimum Wages on Quit, Layoff and Hiring Rates.” IFS Working Paper 06/11. London: Institute for Fiscal Studies. http://www.ifs.org.uk/wps/wp1106.pdf
Brown, Charles. 1999. “Minimum Wages, Employment, and the Distribution of Family Income.” In Orley Ashenfelter and David Card (eds.) Handbook of Labor Economics, Volume 3. Elsevier Science B.V.
California Department of Industrial Relations, Division of Labor Standards Enforcement. 2013. “Child Labor Laws.” http://www.dir.ca.gov/DLSE/ChildLaborLawPamphlet.pdf
Card, David and Alan B. Krueger 1994. “Minimum Wage and Employment: A Case Study of the Fast-Food Industry in New Jersey and Pennsylvania.” American Economic Review 84(4): 772-93.
Card, David and Alan Kruger. 1995. Myth and Measurement: The New Economics of the Minimum Wage. Princeton: Princeton University Press.
Center on Wisconsin Strategy (COWS). 2002. “A Public Investment in Quality Care for Kids: An Evaluation of the Local Child Care Wage Initiative.” University of Wisconsin-Madison. http://www.cows.org/_data/documents/1018.pdf
Cho, Eunice Hyunhue, Tia Koonse and Anthony Mischel. 2014. “Hollow Victories: A Crisis in Collecting Unpaid Wages for California’s Workers.” National Employment Law Project; UCLA Labor Center. http://nelp.3cdn.net/f6fc363a30266f0cd3_pzm6id1xa.pdf
Chodorow-Reich, Gabriel and Loukas Karabarbounis. 2014. “The Cyclicality of the Opportunity Cost of Employment.” NBER Working Paper 19678. http://scholar.harvard.edu/files/chodorow-reich/files/opportunity_cost_employment.pdf
Chow, Michael. 2014. “Economic Impact Analysis of California Senate Bill No. 395.” National Federation of Independent Business Research Foundation. https://s3.amazonaws.com/NFIB/AMS%20Content/Attachments/1/1-65864-BSIM_SB935_ANALYSIS%20%28Min%20Wage%29.pdf
Coibion, Olivier, Yuri Gorodnichenko and Gee Hong. 2015. “The Cyclicality of Sales, Regular and Effective Prices.” American Economic Review 105(3): 993-1029.
Congressional Budget Office. 2012. “Effective Marginal Tax Rates for Low- and Moderate-Income Workers.” U.S. Congress. https://www.cbo.gov/sites/default/files/11-15-2012-MarginalTaxRates.pdf
Cooper, David. 2013. “Raising the Federal Minimum Wage to $10.10 Would Lift Wages for Millions and Provide a Modest Economic Boost.” Economic Policy Institute. http://www.epi.org/publication/raising-federal-minimum-wage-to-1010/.
Cooper, Kerris and Kitty Stewart. 2013. “Does Money Affect Children’s Outcomes? A Systematic Review.” Joseph Rowntree Foundation. http://www.jrf.org.uk/sites/files/jrf/money-children-outcomes-full.pdf

56 Proposed Minimum Wage Law for Los Angeles
Costello, E. Jane, Scott Compton, Gordon Keeler and Adrian Angold. 2003. “Relationships between Poverty and Psychopathology: A Natural Experiment.” Journal of the American Medical Association 290(15): 2023–29.
Cotton, John L. and Jeffrey M. Tuttle. 1986.”Employee Turnover: A Meta-Analysis and Review with Implications for Future Research.” The Academy of Management Review 11(1): 55-70.
Dahl, Gordon and Lance Lochner. 2012. “The Impact of Family Income on Child Achievement: Evidence from the Earned Income Tax Credit.” American Economic Review 102(5): 1927–56.
Daly, Mary C. and Bart Hobijn. 2015. “Why Is Wage Growth So Slow?” FRBSF Economic Letter. Federal Reserve Bank of San Francisco, January 5, 2015. http://www.frbsf.org/economic-research/publications/economic-letter/2015/january/unemployment-wages-labor-market-recession/
Dietz, Miranda, Donna Levitt and Ellen Love. 2014. “Enforcement of Labor Standards.” In Michael Reich, Ken Jacobs and Miranda Dietz (eds.) When Mandates Work: Raising Labor Standards at the Local Level, by Michael Reich, Ken Jacobs and Miranda Dietz. Berkeley: University of California Press.
Draca, Mirko, Stephen Machin and John Van Reenen. 2011. “Minimum Wages and Firm Profitability.” American Economic Journal: Applied Economics, 3(1): 129-51.
Dube, Arindrajit. 2013. “Minimum Wages and the Distribution of Family Incomes.” Unpublished paper. https://dl.dropboxusercontent.com/u/15038936/Dube_MinimumWagesFamilyIncomes.pdf
Dube, Arindrajit. 2014. “Designing Thoughtful Minimum Wage Policies at the Local and State Levels” in Kearney, Melissa S. and Benjamin H. Harris. Policies to Address Poverty in America. The Hamilton Project, 2014.
Dube, Arindrajit, Eric Freeman and Michael Reich. 2010. “Employee Replacement Costs.” IRLE Working Paper 201-10, UC Berkeley. http://www.irle.berkeley.edu/workingpapers/201-10.pdf
Dube, Arindrajit, T. William Lester and Michael Reich. 2010. “Minimum Wage Effects Across State Borders: Estimates Using Contiguous Counties.” Review of Economics and Statistics, 92(4): 945-964.
Dube, Arindrajit, T. William Lester and Michael Reich. Forthcoming. “Minimum Wage Shocks, Employment Flows and Labor Market Frictions.” Journal of Labor Economics. Working Paper, Institute for Research on Labor and Employment, University of California Berkeley. http://escholarship.org/uc/item/76p927ks
Dube, Arindrajit, Suresh Naidu and Michael Reich. 2007. The Economic Effects of a Citywide Minimum Wage.” Industrial and Labor Relations Review, 60(4): 522-543.
Duncan, Greg, Pamela Morris and Chris Rodrigues. 2011. “Does money really matter? Estimating impacts of family income on young children’s achievement with data from random-assignment experiments.” Developmental Psychology, 47(5): 1263–79.
57 Proposed Minimum Wage Law for Los Angeles
Dunn, Charles. 2014. Retail Market Report, First Quarter 2013, Los Angeles. http://www.charlesdunn.com/wp-content/uploads/Retail-Quarterly-Market-Report-1Q-2013.pdf
Evans, William and Craig Garthwaite. 2010. “Giving Mom a Break: The Impact of Higher EITC Payments on Maternal Health.” NBER Working Paper 16296. http://www.nber.org/papers/w16296.pdf
Fairris, David. 2005. “The Impact of Living Wages on Employers: A Control Group Analysis of the Los Angeles Ordinance.” Industrial Relations, 44(1): 84-105.
Fine, Janice. 2014. “Co-Producing Labor Standards Enforcement.” Presentation to the LIFT convening, September 11, 2014.
Fine, Janice, and Jennifer Gordon. 2010. “Strengthening Labor Standards Enforcement through Partnerships with Workers’ Organizations.” Politics & Society, 38(4):552-585. http://www.law.yale.edu/documents/pdf/Clinics/ITC_FineGordon_PoliticsandSociety.pdf
Flaming, Daniel and Patrick Burns. 2013. “Effects of a Fifteen Dollar an Hour Minimum Wage in the City of Los Angeles” Los Angeles Economic Roundtable. http://economicrt.org/wp-content/uploads/2013/11/Effects_15Dollar_Minimum_Wage_2013.pdf
Giuliano, Laura. 2013. “Minimum Wage Effects on Employment, Substitution, and the Teenage Labor Supply: Evidence from Personnel Data.” Journal of Labor Economics, 31(1): 155-194.
Gleeson, Shannon. 2009. “From Rights to Claims: The Role of Civil Society in Making Rights Real for Vulnerable Workers.” Law & Society Review, 43(3): 669-700.
Gleeson, Shannon, Ruth Silver Taube and Charlotte Noss. 2014. “Santa Clara County Wage Theft Report.” Santa Clara County Wage Theft Coalition. http://www.sccgov.org/sites/owp/Documents/pub/WageTheftReportFinal-2014.pdf
Gopinath, Gita, Pierre-Olivier Gourinchas, Chang-Tai Hsieh and Nicholas Li. 2011. “International Prices, Costs, and Markup Differences.” American Economic Review, 101(5): 2450-2486.
Government Accountability Office. 2009. “Department of Labor: Wage and Hour Division’s Complaint Intake and Investigative Processes Leave Low Wage Workers Vulnerable to Wage Theft.” Testimony Before the Committee on Education and Labor, House of Representatives. U.S. Government Accountability Office, March 25, 2009. http://www.gao.gov/assets/130/122107.pdf
Hall, Doug and David Cooper. 2013. “How Raising the Federal Minimum Wage Would Help Working Families and Give the Economy a Boost.” Economic Policy Institute, Issue Brief 341. http://www.epi.org/publication/ib341-raising-federal-minimum-wage/
Hall, Robert. 2009. “By How Much Does GDP Rise if the Government Buys More Output?” Brookings Panel on Economic Activity, 2: 183-231.
Harasztosi, Peter and Attila Lindner. 2015. “Who Pays for the Minimum Wage?” https://www.dropbox.com/s/4wdvae5oo68v8mo/HungaryMW_wpFinal.pdf?dl=0
58 Proposed Minimum Wage Law for Los Angeles
Harmuth, Susan and Susan Dyson. 2005. “Results of the 2005 National Survey of State Initiatives on the Long-term Care Direct-Care Workforce.” The National Clearinghouse on the Direct Care Workforce; The Direct Care Workers Association of North Carolina. http://www.phinational.org/sites/phinational.org/files/clearinghouse/RESULTS%20OF%20THE%202005%20NATIONAL%20SURVEY%20FINAL%2092205.pdf
Hinkin, Timothy and J. Bruce Tracey. 2000. “The Cost of Turnover: Putting a Price on the Learning Curve.” Cornell Hotel and Restaurant Administration Quarterly, 41(4): 14-21.
Hirsch, Barry T., Bruce Kaufman and Tetyana Zelenska. 2011. “Minimum Wage Channels of Adjustment.” IZA Discussion Paper No. 6132. Institute for the Study of Labor. http://www2.gsu.edu/~ecobth/IZA_HKZ_MinWageCoA_dp6132.pdf
Howes, Candace. 2002. “The Impact of a Large Wage Increase on the Workforce Stability of IHSS Home Care Workers in San Francisco County.” University of California Institute for Labor and the Economy; Center for Labor Education and Research, UC Berkeley. http://laborcenter.berkeley.edu/pdf/2002/Howes.pdf
Howes, Candace. 2005. “Living Wages and Retention of Homecare Workers in San Francisco.” Industrial Relations 44(1): 139-163.
Hsu, Tiffany and Chris Kirkham 2014. “Southern California is Hotbed for Wage Theft in Garment Industry.” Los Angeles Times, November 15.
Ichikawa, Diego Rondon and Rebecca Smith. 2014. “Delivering $15: Community-Centered Wage and Hour Enforcement in Seattle.” National Employment Law Project. http://www.nelp.org/page/-/Justice/Delivering-15-Community-Centered-Wage-and-Hour-Enforcement-Seattle.pdf?nocdn=1
Jacobs, Ken and Dave Graham-Squire. 2010. “Labor Standards for School Cafeteria Workers, Turnover and Public Program Utilization.” Berkeley Journal of Employment and Labor Law, 31(2): 447-459. http://scholarship.law.berkeley.edu/cgi/viewcontent.cgi?article=1428&context=bjell
Jacobs, Ken and Michael Reich. 2014. “When do Mandates Work?” In Michael Reich, Ken Jacobs and Miranda Diets (eds.) When Mandates Work: Raising Labor Standards at the Local Level, pp. 1-43. Berkeley CA: University of California Press.
Jekanowski, Mark, James Binkley and James Eales. 2001. “Convenience, Accessibility, and the Demand for Fast Food.” Journal of Agricultural and Resource Economics, 26(1):58-74. http://ageconsearch.umn.edu/bitstream/31162/1/26010058.pdf
JPMorgan Chase & Co. 2014. “Regional Perspectives: California Economic Outlook.” June 2, 2014. https://www.chase.com/content/dam/chasecom/en/commercial-bank/documents/california-economy.pdf
Kolko, Jed and David Neumark. 2007. “Business Location Decisions and Employment Dynamics in California.” Public Policy Institute of California. http://www.ppic.org/content/pubs/report/R_1107JKR.pdf
59 Proposed Minimum Wage Law for Los Angeles
Koonse, Tia, interview by Miranda Dietz. 2015. Legal and Policy Research Manager, UCLA Labor Center, February 24, 2015.
Larson, Sheryl, Amy Hewitt, Charlie Lakin and David Felce. 2004. “Multi-perspective Analysis of Workforce Challenges and Their Effects on Consumer and Family Quality of Life.” American Journal of Mental Retardation, 109(6): 481-500.
Lee, Chinkook, Gerald Schluter and Brian O’Roark. 2000. “Minimum Wage and Food Prices: An Analysis of Price Pass-Through Effects.” International Food and Agribusiness Management Review, 3: 111–128.
Leigh J. Paul and Juan Du. 2012. “Are Low Wages Risk Factors for Hypertension?” European Journal of Public Health, 22(6): 854-859.
Liu, Su and Deborah Chollet. 2006. “Price and Income Elasticity of the Demand for Health Insurance and Health Care Services: A Critical Review of the Literature.” Mathematica Policy Research, Inc. http://www.mathematica-mpr.com/~/media/publications/PDFs/priceincome.pdf
Los Angeles County Economic Development Corporation (LAEDC). 2015. “Economic Forecast and Industry Outlook.” The Kyser Center for Economic Research, LAEDC. http://laedc.org/wp-content/uploads/2015/02/LAEDC-February-2015-Forecast-Report.pdf
Love, Ellen, interview by Miranda Dietz. 2015. Senior Administrative Analyst, San Francisco Office of Labor Standards Enforcement, March 9, 2015.
Manning, Alan 2003. Monopsony in Motion. Princeton: Princeton University Press.
Manning, Alan. 2011. “Imperfect Competition in the Labor Market.” In O. Ashenfelter & D. Card (eds.), Handbook of Labor Economics. vol. 4, no. 5. Elsevier,
McCully, Clinton. 2011. “Trends in consumer spending and personal saving, 1959–2009.” Survey of Current Business, 91(6):14-23. http://www.bea.gov/scb/pdf/2011/06%20June/0611_pce.pdf
Meyer, Jacob and Robert Greenleaf. 2011. “Enforcement of State Wage and Hour Laws: A Survey of State Regulators.” Columbia Law School, National State Attorneys General Program. http://web.law.columbia.edu/sites/default/files/microsites/attorneys-general/files/Wage%20and%20Hour%20Report%20FINAL_0.pdf
Milkman, Ruth, Ana Luz Gonzalez and Victor Narro. 2010. “Wage Theft and Workplace Violations in Los Angeles: The Failure of Employment and Labor Law for Low-Wage Workers.” UCLA Institute for Research on Labor and Employment. http://www.irle.ucla.edu/publications/documents/LAwagetheft-Milkman-Narro-110.pdf
Morris, Pamela and Lisa Gennetian. 2003. “Identifying the Effects of Income on Children’s Development Using Experimental Data.” Journal of Marriage & Family, 65(3):716–29.
National Employment Law Project. 2011. “Winning Wage Justice: An Advocates’ Guide to State and City Policies to Fight Wage Theft.” National Employment Law Project. http://www.nelp.org/page/-/Justice/2011/WinningWageJustice2011.pdf?nocdn=1

60 Proposed Minimum Wage Law for Los Angeles
National Employment Law Project. 2012. Reviewing the Research on Citywide Minimum Wage Increases. Research Analysis.
National Employment Law Project. 2014. “City Minimum Wage Laws: Recent Trends and Economic Evidence on Local Minimum Wages.” http://www.nelp.org/page/-/rtmw/City-Minimum-Wage-Laws-Recent-Trends-Economic-Evidence.pdf?nocdn=1
Neumark, David, Ian Salas and William Wascher 2014a. “Revisiting the Minimum Wage-Employment Debate: Throwing out the Baby with the Bathwater.” Industrial and Labor Relations Review, ILR Review, Cornell University, ILR School, vol. 67(2.5), pages 608-64.
Neumark, David, J. M. Ian Salas and William Wascher. 2014b. “More on Recent Evidence on the Effects of Minimum Wages in the United States.” NBER Working Paper Series 20619. http://www.nber.org/papers/w20619.pdf
Neumark, David and William Wascher. 1992. ‘‘Employment Effects of Minimum and Subminimum Wages: Panel Data on State Minimum Wage Laws,’’ Industrial and Labor Relations Review, 46(1):55–81.
Neumark, David and William Wascher. 2006. “Minimum Wages and Employment: A Review of Evidence from the New Minimum Wage Research.” National Bureau of Economic Research Working Paper 12663. Cambridge, MA: National Bureau of Economic Research. http://www.nber.org/papers/w12663
New York State Department of Labor. 2008. “Labor Department Investigation of New York’s Car Wash Industry.” August 15, 2008. https://www.labor.state.ny.us/pressreleases/2008/August15_2008.htm
Office of the Independent Budget Analyst. 2014. “Estimated Cost of Enforcing Proposed New Minimum Wage and Earned Sick Leave Laws.” The City of San Diego, IBA Report 14-26. http://www.sandiego.gov/iba/pdf/reports/2014/14_26_140710.pdf
Organization for Economic Co-operation and Development. 2013. “Minimum Wage Relative to Average Wages of Full-Time Workers.” OECD StatExtracts. Data extracted at: http://stats.oecd.org/viewhtml.aspx?datasetcode=MIN2AVE&lang=en
Pollin, Robert. 2004. Expert Report submitted in New Mexicans for Free Enterprise v. City of Santa Fe, No. D-0101-CV-2003-468 (N.M. 1st Jud. Dist Ct., Mar. 9, 2004).
Pollin, Robert and Jeannette Wicks-Lim. 2005. “Comments on Aaron Yelowitz, ‘Santa Fe’s Living Wage Ordinance and the Labor Market’.” Political Economy Research Institute, Working Paper. http://scholarworks.umass.edu/cgi/viewcontent.cgi?article=1085&context=peri_workingpapers
Pollin, Robert and Jeannette Wicks-Lim. 2015. “A $15 U.S. Minimum Wage: How the Fast-Food Industry Could Adjust Without Shedding Jobs.” Political Economy Research Institute, University of Massachusetts Amherst, Working Paper 373. http://www.peri.umass.edu/fileadmin/pdf/working_papers/working_papers_351-400/WP373.pdf

61 Proposed Minimum Wage Law for Los Angeles
Potter, Nicholas. 2006. “Measuring the Employment Impacts of the Living Wage Ordinance Santa Fe, New Mexico.” University of New Mexico, Bureau of Business and Economic Research. Available at: https://bber.unm.edu/pubs/EmploymentLivingWageAnalysis.pdf
Reich, Michael. 2012. “Increasing the Minimum Wage in San Jose: Benefits and Costs. IRLE CWED Policy Brief. http://www.irle.berkeley.edu/cwed/briefs/2012-01.pdf
Reich, Michael, Peter Hall and Ken Jacobs. 2005. “Living wage Policies at the San Francisco Airport: Impacts on Workers and Businesses.” Industrial Relations 44(1): 106-138.
Reich, Michael, Ken Jacobs, Annette Bernhardt and Ian Perry. 2014a. “The Impact of Oakland’s Proposed City Minimum Wage Law: A Prospective Study.” Center on Wage and Employment Dynamics, Institute for Research on Labor and Employment, UC Berkeley, Berkeley, CA. http://irle.berkeley.edu/cwed/briefs/2014-01.pdf
Reich, Michael, Ken Jacobs, Annette Bernhardt and Ian Perry. 2014b. “Fact Sheet: Estimated Impact of San Diego’s Proposed Minimum Wage Law.” Center on Wage and Employment Dynamics, Institute for Research on Labor and Employment, UC Berkeley, Berkeley, CA. http://irle.berkeley.edu/cwed/briefs/2014-03.pdf
Reich, Michael, Ken Jacobs, Annette Bernhardt and Ian Perry. 2014c. “San Francisco’s Proposed City Minimum Wage Law: A Prospective Impact Study.” Center on Wage and Employment Dynamics, Institute for Research on Labor and Employment, UC Berkeley, Berkeley, CA. http://irle.berkeley.edu/cwed/briefs/2014-04.pdf
Reich, Michael, Ken Jacobs, Annette Bernhardt and Ian Perry. 2014d. “The Mayor of Los Angeles’ Proposed City Minimum Wage Policy: A Prospective Impact Study.” Center on Wage and Employment Dynamics, Institute for Research on Labor and Employment, UC Berkeley, Berkeley, CA. http://irle.berkeley.edu/cwed/briefs/2014-05.pdf
Reich, Michael, Ken Jacobs and Miranda Dietz (eds.). 2014. When Mandates Work: Raising Labor Standards at the Local Level. Berkeley, CA: University of California Press.
Reich, Michael and Amy Laitinen. 2003. “Raising Low Pay in a High Income Economy: The Economics of a San Francisco Minimum Wage.” University of California, Berkeley, Institute for Research on Labor and Employment, Report for the San Francisco Board of Supervisors. Available at: http://irle.berkeley.edu/research/minimumwage/minwage_may03.pdf
Reynis, Lee, Myra Segal and Molly Bleeker. 2005. “Preliminary Analysis of the Impacts of the $8.50 Minimum Wage on Santa Fe Businesses, Workers and the Santa Fe Economy.” University of New Mexico, Bureau of Business and Economic Research. Revised December 27, 2005.
Schmitt, John. 2013. “Why Does the Minimum Wage Have No Discernible Effect on Employment?” Washington, DC: Center for Economic and Policy Research. http://www.cepr.net/documents/publications/min-wage-2013-02.pdf

62 Proposed Minimum Wage Law for Los Angeles
Schmitt, John and David Rosnick. 2011. “The Wage and Employment Impact of Minimum-Wage Laws in Three Cities.” Center for Economic and Policy Research. Available at: http://www.cepr.net/documents/publications/min-wage-2011-03.pdf
Su, Julie. 2013. “2012-2013 Fiscal Year Report on the Effectiveness of the Bureau of Field Enforcement.” State of California, California Department of Industrial Relations. https://www.dir.ca.gov/dlse/BOFE_LegReport2013.pdf
Taylor, Lester and Hendrik Houthakker. 2010. Consumer Demand in the United States: Prices, Income and Consumption Behavior. New York: Springer.
Teulings, Cohen and Richard Baldwin ( eds.). 2014. Secular Stagnation: Facts, Causes and Cures. Vox-EU. http://www.voxeu.org/content/secular-stagnation-facts-causes-and-cures
Thomadsen, Raphael. 2005. “The Effect of Ownership Structure on Prices in Geographically Differentiated Industries.” RAND Journal of Economics, 36(4): 908-929. http://www.jstor.org/stable/4135263
Totty, Evan 2014. “The Employment Effects of the Minimum Wage: A Factor Analytic Approach.” Krannert School of Management, Working Paper No. 1278. http://www.krannert.purdue.edu/programs/phd/working-papers-series/2014/1278.pdf
Urban Institute National Center for Charitable Statistics. 2012. NCCS Enhanced Extract of IRS Financial Data.
U.S. Bureau of Labor Statistics. 2014. Job Openings and Labor Turnover Survey. http://www.bls.gov/jlt/data.htm.
U.S. Department of Labor. 2014. “Workers face millions in unpaid wages in Southern California garment industry.” News Release, November 6, 2014. http://www.dol.gov/opa/media/press/whd/WHD20142047.htm
Weil, David. 2014. “Strategic Enforcement 2.0.” U.S. Department of Labor, video. https://www.youtube.com/watch?v=XP8SUD7yodU
Weil, David and Amanda Pyles. 2005. “Why Complain? Complaints, Compliance, and the Problem of Enforcement in the U.S. Workplace.” Comparative Labor Law & Policy Journal, 27(1): 59-92.
Weinstein, Roy and Kristina Stanford. 2013. “2012 Economic Impact of Los Angeles County Visitor Spending.” Micronomics. http://www.micronomics.com/articles/Visitors_Economic_Impact_Study.pdf
West, Rachel and Michael Reich. 2014. “The Effects of Minimum Wages on SNAP Enrollments and Expenditures.” Center for American Progress. Available at: http://www.americanprogress.org/issues/economy/report/2014/03/05/85158/the-effects-of-minimum-wages-on-snap-enrollments-and-expenditures/
Whitebook, Marcy, Carollee Howes and Deborah Phillips.1989. “Who cares? Child care teachers and the quality of care in America. Final report, National Child Care Staffing Study.” Child Care Employee Project. http://www.irle.berkeley.edu/cscce/wp-content/uploads/2010/07/Who-Cares-full-report.pdf

63 Proposed Minimum Wage Law for Los Angeles
Whitebook, Marcy, Carollee Howes and Deborah Phillips. 2014. “Worthy work, STILL Unlivable Wages: The Early Childhood Workforce 25 years after the National Child Care Staffing Study.” Center for the Study of Child Care Employment, Institute for Research on Labor and Employment, UC Berkeley. http://www.irle.berkeley.edu/cscce/wp-content/uploads/2014/11/ReportFINAL.pdf
Wicks-Lim, Jeannette. 2006. “Mandated Wage Floors and the Wage Structure: New Estimates of the Ripple Effects of Minimum Wage Laws.” Working Paper Number 116, Political Economy Research Institute. Available at: http://scholarworks.umass.edu/cgi/viewcontent.cgi?article=1092&context=peri_workingpapers.
Williams, John. 2015. “The View from Here: The Economic Outlook and the Implications for Monetary Policy.” Presentation to the CFA Society Hawaii Annual Economic Forecast Dinner, March 5, 2015. http://www.frbsf.org/our-district/press/presidents-speeches/williams-speeches/2015/march/monetary-policy-federal-funds-rate-normalization/
Wilson, Daniel J. 2012. “Fiscal Spending Jobs Multipliers: Evidence from the 2009 American Recovery and Reinvestment Act.” American Economic Journal: Economic Policy 2012, 4(3): 251–282. http://www.frbsf.org/economic-research/papers/2010/wp10-17bk.pdf
Wolfers, Justin. 2015. “Concerns about Deflation Shows up in an Obscure Derivatives Market.” New York Times, March 7, 2015. http://www.nytimes.com/2015/03/08/upshot/derivatives-market-shows-a-rising-fear-of-deflation.html?partner=rss&emc=rss&abt=0002&abg=0
Workers’ Compensation Insurance Rating Bureau of California. 2014. “WCIRB Report on the State of the California Workers’ Compensation Insurance System.” http://www.wcirb.com/sites/default/files/documents/state_of_the_wc_system_report_140815.pdf
Yelowitz, Aaron. 2005a. “Santa Fe’s Living Wage Ordinance and the Labor Market.” Employment Policies Institute. Available at: https://www.epionline.org/wp-content/studies/yelowitz_09-2005.pdf
Yelowitz, Aaron. 2005b. “How Did the $8.50 Citywide Minimum Wage Affect the Santa Fe Labor Market?” Employment Policies Institute. Available at: https://www.epionline.org/wp-content/studies/yelowitz_12-2005.pdf
Yelowitz, Aaron. 2012. “The Labor Market Effects of Citywide Compensation Floors.” Employment Policies Institute. Available at: https://www.epionline.org/wp-content/uploads/2014/07/EPI_SanFrancisco_Studyv4.pdf
Yoon, Haeyoung and Tsedeye Gebreselassie. 2015. “Building Robust Labor Standards Enforcement
Regimes in Our Cities and Counties.” National Employment Law Project.
Zipperer, Ben. 2014. “Essays on the Minimum Wage.” Unpublished Ph.D. dissertation. Department of Economics, University of Massachusetts-Amherst.
64 Proposed Minimum Wage Law for Los Angeles
Endnotes1 Bureau of Labor Statistics, Current Employment Statistics, State and Metro Area Employment, Hours and Earnings, available at http://www.bls.gov/sae/. 2 Bureau of Labor Statistics, Local Area Unemployment Statistics, available at http://www.bls.gov/lau/.3 U.S. Census Bureau, American Community Survey, 2007 and 2013, 1-Year Estimates, Table B08521. For 2007, earnings were adjusted to 2013 dollars using the Los Angeles-Anaheim-Riverside Consumer Price Index for Urban Wage Earners and Clerical Workers (CPI-W).
4 Measured by the income level of the 95th percentile (income at which households earn more than 95 percent of all other households) divided by the 20th percentile.
5 The studies were done for Oakland, San Francisco, San Diego, and Mayor Garcetti’s August 2014 proposal for Los Angeles; see Reich, Jacobs, Bernhardt and Perry (2014a-d).
6 See the Survey of Professional Forecasters: http://www.philadelphiafed.org/research-and-data/real-time-center/survey-of-professional-forecasters.7 Mary Daly and Bart Hobijn, “Why is Wage Growth so Slow?” FRBSF Economic Letter, January 5, 2015. http://www.frbsf.org/economic-research/publications/economic-letter/2015/january/unemployment-wages-labor-market-recession; Williams (2015). 8 Congressional Budget Office. 2015. Budget Data and Projections. https://www.cbo.gov/publication/45069
9 By 2017, the upper bound of the ripple effect will be $14.99, and by 2019 it will be $16.89, in nominal dollars.
10 Detailed industries were selected on the basis of sufficient sample size, as well as sizeable percentage of workers affected by the proposed minimum wage increase.
11 Since workers often increase their wages by moving from one employer to another, we cannot assume that the correlation between wages and turnover indicates that low wages are causing higher turnover. As we discuss below, however, policy experiments with living wages and minimum wages have provided the evidence needed to determine that wages do, in fact, affect turnover.
12 These averages include the low-turnover period of the Great Recession, and can be expected to increase towards higher pre-recession levels as the labor market tightens.
13 The estimate of 17.5 percent represents the midpoint between the 20 percent estimate of Pollin and Wicks-Lim (2015) and a 15 percent (unpublished) estimate that draws upon Dube, Freeman and Reich (2010) and Dube, Lester and Reich (forthcoming).
14 We use a payroll tax rate of 7.65 percent (6.2 percent for Social Security and 1.45 percent for Medicare). Workers’ compensation insurance rates vary by industry (see Table 6: http://www.wcirb.com/sites/default/files/documents/state_of_the_wc_system_report_140815.pdf ).15 Since the vast majority of restaurant inputs come from outside of Los Angeles, any additional impact would be small. Several studies have analyzed the impact of minimum wage in all domestic industries. Lee et al. (2000) estimate that restaurant operating costs increase by 1 percent for each 10 percent increase in the minimum wage.
16 We contracted with Ong & Associates for the nonprofit interviews.
17 This includes nonprofit organizations with more than $50,000 in gross receipts that filed a 990 tax form in 2012, the most recent year with complete data available; most private foundations are excluded.
http://www.philadelphiafed.org/research-and-data/real-time-center/survey-of-professional-forecasters

65 Proposed Minimum Wage Law for Los Angeles
18 Research on the low-wage nonprofit human services sector finds a similar relationship to wages and turnover as found for for-profit organizations; see for example, Larson et al. (2004) and Howes (2002).
19 The nonprofit share of operating costs is calculated using data from Urban Institute National Center for Charitable Statistics (2012).
20 See http://calbudgetcenter.org/resources/support-for-child-care-and-preschool-is-1-1-billion-below-2007-08-even-with-the-recent-funding-increase/. 21 However, Aaronson, Agarwal and French (2012), Table A-3, report a positive earnings effect for adults and nonetheless find no detectable effect on employment.
22 Neumark, Salas and Wascher (2014a), the best-known researchers who find negative effects, report a minimum wage employment elasticity for restaurants of 0.06, very close to the findings in Allegretto et al. (2013). For details, see the literature review in Appendix B.
23 A different approach to estimating spending effects is taken by Aaronson and French (2013), who in turn rely on Aaronson, Agarwal and French (2012).
24 Beacon’s method also appears to double-count disemployment effects. That is, Beacon drew upon negative employment effects in the literature, not recognizing that they already incorporate effects on reduced sales, and then they added the effects of reduced sales again using the IMPLAN model.
25 The Los Angeles Economic Roundtable (Flaming and Burns 2013) also uses IMPLAN to model the direct and indirect effects of increasing wage income on the level of economic activity in Los Angeles. Unlike Beacon, Flaming and Burns do not expect that price increases will offset spending. 26 Long-run effects might be different. However, Dube, Lester and Reich (2010) do not detect any negative employments effects as long as four years after a minimum wage is implemented.
27 Taylor and Houthakker’s individual elasticities are based on regressions of U.S. panel data across over 300 cities and pooled over 1996-99. As we discuss below in Section 5.5, we do not expect that a substantial component of consumer sales will move outside the city’s borders. Liu and Chollet (2006)’s review essay suggests that the price elasticity of demand for out-of-pocket individual healthcare expenses is -0.2. Our health care elasticity recognizes that employers shift their cost of health care on to employees and that for those with subsidized coverage through Covered CA, increases in premium costs are borne by the federal government for lower-income families who are more price-sensitive.
28 See http://www.dailynews.com/business/20140506/los-angeles-tourists-on-record-spending-binge-in-2013.29 A $15.37 minimum wage has already been enacted for a major segment of the Los Angeles hotel industry; it therefore lies outside the purview of our study.
30 An alternative approach estimates the total reduction in economic activity from reduced consumer spending, and then uses multipliers from the new economics research on the employment effects of the 2009 American Recovery and Reinvestment Act (ARRA) to estimate reductions in employment. This literature uses exogenous variation in ARRA programs across states or counties to identify a causal effect of a given stimulus on employment (Wilson 2012). However, these methods have produced a wide range of estimates, rendering this literature not helpful for our purposes here.31 Annual consumer spending for Los Angeles is estimated at 70 percent of IMPLAN’s estimated GDP for Los Angeles in 2017 and 2019. This is the Bureau of Economic Analysis’s estimate for California. Specifically, CA Personal Consumer Expenditures were $1,412,648,000,000 in 2012 (http://www.bea.gov/regional/ZIP/PCEbyState.zip) and CA GDP was $2,009,936,000,000 in 2012 (http://www.bea.gov/newsreleases/regional/gdp_state/2014/xls/gsp0614.xls).32 IMPLAN household spending model (proportional to city consumer spending patterns by household income

66 Proposed Minimum Wage Law for Los Angeles
level), using reduced consumer spending in Row 3 and forcing IMPLAN to apply 100 percent of the reduction in the city of Los Angeles; see Appendix A for details on IMPLAN modeling.
33 This includes an offset of 7 percent for reduction in SNAP (Allegretto, Reich and West 2014), and 2.3 percent in lower premium tax credits and cost sharing subsidies under the ACA (Congressional Budget Office 2012). We also reduce the aggregate increase in wages by lost earnings due to estimated job loss in Panel A. This offset may be too high. According to a new paper by Chodorow-Reich and Karabarbounis (2014), the consumption expenditures of the unemployed equal 75 percent of the consumption expenditures of the employed, even after taking into account the limited duration of unemployment insurance benefits. Their result echoes a similar result by Aguiar and Hurst (2005) for food expenditures only.
34 IMPLAN household income model for Los Angeles County, using net wage increase from Row 5 and subtracting net wage increase going to affected workers who live outside Los Angeles County; see Appendix A for details on IMPLAN modeling. Net wage increase is distributed across household income categories by distribution of increased wages from the minimum wage increase. Our wage simulation model estimates that 5.5 percent (2017) and 5.7 percent (2019) of increased wages will go to workers living outside the County.
35 Using PUMA place of residence for impacted workers, we estimate from our data that 43.1 percent (by 2017) and 42.9 percent (by 2019) of the increased wages will go to resident workers’ households. In addition, we expect that commuters will spend some percentage of their increased wages in the city (e.g., for lunch and entertainment); however, we have not been able to find an estimate of this percentage in the research literature. We therefore assume that 50 percent of the overall net increase in wages will potentially be spent in the city (before IMPLAN applies leakage from household spending).
36 IMPLAN household income model for Los Angeles City, using net wage increase from Row 6; see Appendix A for details on IMPLAN modeling. Net wage increase is distributed across household income categories by distribution of increased wages from minimum wage increase.
37 See JPMorgan Chase & Co. (2014).
38 See http://www.labormarketinfo.edd.ca.gov/data/employment-projections.html.39 A caveat: our discussion refers to a relatively short time horizon when the policies are being implemented.
40 In these respects, Los Angeles is similar to San Jose.
41 This calculation omits affluent enclaves, such as Beverly Hills, Marina del Rey, Santa Monica, the UCLA campus and the border with the Pacific Ocean. Computed from the U.S. Bureau of the Census, LODES data, Version 7.0, block group data.
42 Gopinath et al. (2011) find a 24 percent discontinuity in grocery prices at the U.S.-Canadian border—for identical goods on both sides of the border at stores owned by the same retailer—but 0 percent at state borders. See http://socrates.berkeley.edu/~pog/academic/gghl_aer.pdf
43 See U.S. Department of Labor (2014). 44 See: http://www.cityofchicago.org/city/en/depts/mayor/press_room/press_releases/2014/sep/mayor-emanuel-signs-executive-order-requiring-city-contractors-t.html.45 Cost of living is based on regional price parity (RPP)—that is, what a dollar would buy in goods and services in any given region as compared to the national average for Metropolitan Statistical Areas.
46 See http://www.dir.ca.gov/OPRL/CPI/EntireCCPI.PDF 47 This provision is included in the San Diego, San Jose, Richmond, and Berkeley minimum wage ordinances. The provision is worded slightly differently in San Francisco’s ordinance, and absent in Oakland’s ordinance.
67 Proposed Minimum Wage Law for Los Angeles
48 Wage liens are also being pursued through state-level legislation, AB-2416 the California Wage Theft Recovery Act. For more on wage liens, see Cho, Koonse and Mischel (2014), and National Employment Law Project (2011).
49 Currently, the state Bureau of Field Enforcement can issue citations but only for payment up to the state minimum wage; the Department of Labor Standards Enforcement Wage Claim Adjudication unit can adjudicate higher minimum wages, but it is up to the worker to collect on the judgment (Koonse 2015).50 For excerpts of similar provisions in California’s labor code, see http://www.dir.ca.gov/iwc/EXCERPTS.htm. 51 See http://murray.seattle.gov/minimumwage/#sthash.cYmSPbdt.dpbs for the full implementation schedule.52 “Small, Local Business Program.” City of Los Angeles Charter. Chapter 1, Section 10, Article 4. http://www.amlegal.com/nxt/gateway.dll/California/laac/administrativecode/division10contracts/chapter1contractsgeneral?f=templates$fn=default.htm$3.0$vid=amlegal:losangeles_ca_mc$anc=JD_D10C1A4. See also: “Financing Opportunities.” Economic and Workforce Development Department Website. City of Los Angeles. http://wiblacity.org/ewddLacity/index.php/local-business/business-financing53 Examples of 25-employee thresholds: City Administrative Code, Los Angeles School Board. Requires a member to be a small business owner, which is defined as having less than 25 employees. Also the Port of Los Angeles, Small Business Enterprise Program. Defines very small manufacturing businesses as employing 25 or fewer employees. Examples of 100-employee thresholds: Los Angeles County Office of Small Business, Procurement Technical Assistance Center. Local Small Business Enterprise and Community Enterprise Programs. Also State of California, Office of Small Business and Disabled Veteran Business Enterprises Services. Small Business Certification Eligibility Requirements. Finally, the Los Angeles living wage law provides special consideration for small businesses with less than 7 employees—or if more than 7, the workforce can have no more than 1,214 hours per month for at least three-fourths of the calendar year, and an annual gross revenue of less than $486,601.
54 This risk may be somewhat lessened by the individual mandate in the Affordable Care Act.
55 Federal law permits a 90-day subminimum wage for workers under the age of 20.
56 Neumark, Salas and Wascher (2014) have criticized these findings. A response paper (Allegretto, Dube, Reich and Zipperer, forthcoming) refutes the criticisms.

68 Proposed Minimum Wage Law for Los Angeles
Appendix A: Data and Methods
In this appendix, we document a wage simulation method developed by the UC Berkeley Center on Wage and Employment Dynamics to estimate the number of workers impacted by proposed local minimum wage laws, as well as the expected increase in wages (Section A1). We also describe our method for estimating median full-time wages (Section A2), the labor share of operating costs in various industries and the overall economy (Section A3), the IMPLAN models used in the report (Section A4), and the estimation of effects on taxes (Section A5)
Table of Contents:
A1: Estimating the Number of Affected Workers and the Size of Wage Increases 69A2: Estimating the Minimum Wage to Median Full-Time Wage Ratio 74A3: Estimating the Labor Share of Operating Costs 74A4: IMPLAN Models 77A5: Tax Estimation 78Endnotes 79
69 Proposed Minimum Wage Law for Los Angeles
A1: Estimating the Number of Affected Workers and the Size of Wage IncreasesOur wage simulation model is similar to that used by researchers to generate prospective impact estimates for national and state minimum wage proposals, but differs in several respects because of significant data limitations for city-based analyses.
In Section A, we describe the data source, sample definition, and wage variable creation and cleaning for our analysis of the American Community Survey, which makes up the bulk of the data shown in the report. In Section B, we then describe the process for estimating the number of workers affected and the expected increase in wages. In Section C, we describe the process for obtaining estimates by firm size categories using the Current Population Survey.
A. Data and Wage Variable Creation
i. Data source
We use the 2012 and 2013 IPUMS American Community Survey (ACS) (https://usa.ipums.org/usa/). We use the ACS rather than the Current Population Survey (CPS) because the ACS (a) has much larger sample sizes, which is critical for local analyses; (b) is representative at the city and county level, which the CPS is not; and (c) allows us to construct a sample based on place of work, which the CPS does not. That said, the ACS does not have a respondent-reported measure of hourly wages; we address this issue below.
ii. Sample definition
The sample consists of U.S. civilians aged 16 to 64, who had positive wage and salary income in the previous 12 months, who worked last week, and who were not self-employed, unpaid family workers, or federal or state government employees (these groups of workers will not be covered by the proposed city minimum wage law). We also exclude local public workers not employed by city government, as they would not be covered by the proposed law (largely employees of the Los Angeles Unified School District). In addition, we select only respondents who worked more than 13 weeks last year and who usually worked more than 3 hours per week; the goal with this selection was to identify workers actively connected to the labor market.
iii. Geography
We identify workers based on place of work, not place of residence, an important distinction given that low-wage workers are increasingly not able to afford to live in the cities where they work. The ACS reports place of work at the county level, so we use data for L.A. County (see section B.iv for a further detail on our use of county-level data).
iv. The hourly wage variable
Following standard practice with the ACS, our hourly wage variable is a computed variable, based on the worker’s annual earnings, reported number of weeks worked last year, and usual hours worked per week.1 The ‘weeks worked last year’ variable is a categorical variable of intervals of weeks worked (such as 14-26 weeks or 50-52 weeks). We converted this variable to a continuous variable by setting the number of weeks worked to the midpoint of each interval.2 The annual earnings measure includes wages, salaries, commissions, cash bonuses, or tips from all jobs,3 before deductions for taxes.

70 Proposed Minimum Wage Law for Los Angeles
The ACS hourly wage variable is computed as annual earnings divided by the product of weeks worked last year and usual hours worked per week. We smooth the calculated wage variable by adding or subtracting a random amount ranging from -$0.25 to $0.25. We then trimmed outliers by dropping wages less than $0.50 or greater than $100 in 1989 dollars.4
v. Checks on the computed hourly wage variable
Researchers have long recognized that there is measurement error in the ACS computed hourly wage variable. For example, for Los Angeles county, the ACS variable yields a higher percentage of workers with hourly wages below the statutory minimum wage compared to the CPS. Note that this is an imperfect comparison, because the ACS estimate is based on place of work, while the CPS estimate is based on place of residence (one might expect that the latter would omit low-wage commuters in the case of high cost-of-living cities, for example). Additionally, these differences shrink substantially after we adjust the data for the July 2014 state minimum wage increase (see below).
We more closely examined the distribution of the ACS computed hourly wage variable for those who work in California, and found that most of the observations below the state minimum wage in 2012 and 2013 ($8.00) were clustered within a few dollars of the minimum. For these respondents, we also tested for any patterns in the components that were used to calculate the hourly wage variable (weeks worked, hours per week, or yearly earnings) that might indicate incorrect reporting of one or more of the components; however, no patterns emerged. The large majority of these respondents had very low annual earnings. These are clearly low-wage workers; the measurement error appears to stem mainly from reporting of weeks and hours worked.
B. Simulating the Impact of Proposed Local Minimum Wage Increases
In this section, we outline a simulation model for estimating the number of workers that would be affected by the proposed minimum wage increase, using the dataset and wage variable described in Section A. For ease of exposition, we refer to ‘the city’ below; however, we have had to use Los Angeles county data for the bulk of the estimation (see section B.4 below).
The logic of our method is to simulate the city’s wage distribution right before the proposed minimum wage law would go into effect, and then estimate the number of workers affected by the increase and the additional wages earned as a result.
In simulating this future wage distribution just prior to the minimum wage increase, we:
1. adjust for projected wage growth; 2. adjust for any interim increases in the state minimum wage; and3. adjust for projected employment growth.
We then estimate (a) the number of workers impacted by the proposed minimum wage increase, both directly and indirectly, and (b) the additional wages earned as a result of the increase. As we describe below, we generate “high” and “low” estimates, and in the main report we show an average of these estimates.
We repeat the above simulation for each successive phase-in step between 2015 and 2019, cumulating the number of workers affected and the increase in wages over those steps.

71 Proposed Minimum Wage Law for Los Angeles
i. Method to estimate wage growth
Because we have combined the 2012 and 2013 ACS files, we first need to inflate the 2012 data to be on equal footing with the 2013 data. To do this, we use the average of the 2013 wage growth rate in California at the 25th and 30th percentiles (1.9%), calculated from the 2012 and 2013 CPS Outgoing Rotation Group (ORG) files.
To inflate the wages to 2014 dollars, we first calculate the 2014 wage growth rate (2.2%) with the 2013 and 2014 CPS ORG files using the same procedure as above. We then account for the California state minimum wage increase from $8 to $9 in July 2014, by inflating the 2013 wages to July 2014 dollars using half of the 2014 wage growth rate, then “applying” the state increase using the method in B.ii below, and finally applying the remaining half of the 2014 wage growth rate. We then inflate 2014 wages to the year and month that the proposed minimum wage law would go into effect using the wage growth forecasts described in Section 2 of the main report.
In order to compare the effect of the proposed minimum wage increase relative to scheduled state minimum wage policy, we also simulate the January 2016 California minimum wage. This allows us to measure the number of workers affected and the size of the earnings increase from the proposed minimum wage increase above and beyond future state increases.
ii. Method to adjust wages based on changes to the statutory minimum wage
We next simulate the impact of the proposed minimum wage law, yielding a “high” and “low” estimate. Both estimates identify workers affected directly and indirectly (via spill-over effects) by the minimum wage increase. The spill-over effect means that workers who make slightly more than the new proposed minimum wage level are also likely to receive wage increases.
The two estimates differ in (1) how they treat respondents with wages below 90% of the old minimum wage (“subminimum wage workers”) and (2) how they define the spill-over effect. Table 1 details these differences:
• The main group of impacted workers – minimum wage workers – consists of those who earn between the old minimum wage and the new minimum wage. Given measurement error, we include in this group workers who earn somewhat below the old minimum wage (down to 90% of the old minimum wage).
• For subminimum wage workers, Scenario 1 includes those earning between 50% to just under 90% of the old minimum wage; Scenario 2 includes everyone earning less than 90% of the old minimum wage.
• For indirectly affected workers, Scenario 1 defines the spill-over band as reaching from the new minimum wage up to 115% of the new minimum wage. Scenario 2 defines the spill-over band as reaching from the new minimum wage up to the sum of the new minimum wage plus the absolute value of the minimum wage increase.5
We build a “low” and “high” estimate of impacted workers from these components (different combinations yield the upper and lower bound depending on the details of the proposed minimum wage increase). In the report, we show an average of these estimates.

72 Proposed Minimum Wage Law for Los Angeles
We then estimate the additional wages earned by affected workers as a result of the proposed minimum wage law, as summarized in Table A1. Minimum wage workers simply receive the new minimum wage. Subminimum wage workers receive a percentage wage increase of the same size as the percentage change in the statutory minimum wage. Indirectly affected workers receive a quarter of the difference between their current wage and the upper bound of the spill-over band.
iii. Method to adjust for employment growth
Our estimate of employment in the city comes from data supplied by the California Employment Development Department (EDD). The EDD data give us total employment in the city in the third quarter of 2013. To adjust this total for future years, we use the EDD forecast of employment growth in L.A. County from 2010 to 2020.
iv. Method to generate city estimates with county data
The smallest geographic unit for the ACS place-of-work variable is the county. For some cities, the county is the same geographic unit as the city. But for many cities including Los Angeles, the county is larger than the city contemplating the minimum wage increase. In these cases, we perform steps i-iii above on county-level data, and calculate the estimated number of affected workers by applying the percentage of affected workers to the employment estimate from step iii. This step introduces additional assumptions; namely, that the wage distribution of those who work in the city (not all of whom live in the city) is the same as the wage distribution of those who work in the county, and that wage and employment growth trends in the city mirror those at the county level.
To help mitigate some of these concerns, we use data from EDD to adjust the industry and sector distribution of the county ACS data to match the city’s distribution. The EDD data allow us to shift the
Table A1. Summary of method to identify workers that will be impacted by a proposed minimum wage increase
Definition of which workers are estimated to receive an increase
Estimate of new wage after the increase
Minimum wage workers Wage = 90% of OMW to NMW NMW Subminimum wage workers
Scenario 1 Wage = 50-89% of OMW OW + OW * ( (NWM-OMW)/OMW) Scenario 2 Wage = 0-89% of OMW OW + OW * ( (NWM-OMW)/OMW)
Indirectly affected workers Scenario 1 Wage = NMW to 115% of NMW OW + 0.25 * (1.15*NMW - OW) Scenario 2 Wage = NMW to ( (NMW-OMW) +
NMW) OW + 0.25 * ( ( (NMW-OMW) + NMW) - OW)
Note: OMW = Old Minimum Wage, NMW = New Minimum Wage, OW = Old Wage, NW= New Wage
73 Proposed Minimum Wage Law for Los Angeles
industry distribution of private sector workers in the county to match the city, and also allows us to match the city’s overall distribution of private and public sector workers.
C. Estimating the Impact by Firm Size
i. Data Source, Sample Definition, Geography, and Wage Variable
The ACS does not contain information on the firm size of a worker’s employer, so to obtain impact estimates by firm size we must turn to the CPS March supplement, which does have a firm size variable. As mentioned above, the sample size for the CPS is much smaller than the ACS, which limits its usefulness for the detailed analyses in most of the report. However by pooling together the 2012-2014 March CPS files, we gain enough observations in L.A. County to produce estimates of the share of workers affected by firm size.
We use the same sample criteria as in the ACS analysis.
The geography of the CPS is based on place of residence, not place of work as with the ACS. This forces us to make the assumption that the characteristics of the residents of Los Angeles match those of its workers. In section ii below, we describe some of the techniques we use to mitigate the effects of this assumption.
Like the ACS, the March CPS does not directly collect an hourly wage variable. We use the same method as in the ACS to compute an hourly wage variable,6 and follow the same method to inflate the wage variable for future years.
ii. Simulating the Proposed Local Minimum Wage Increases and Estimate the Impact by Firm Size
We use the same method as with the ACS to estimate wage growth, simulate the proposed minimum wage increase, and estimate employment growth.
Even though the CPS asks respondents to report the number of employees at “all locations where [their] employer operates,” comparison of the resulting CPS firm size distribution to employer-based data shows suggests that some respondents reported the number of workers at their particular job site, rather than the total number of workers in the firm. Our firm size distribution adjustment partially corrects for this response error.7 As we mentioned above, the CPS data are based on place of residence not place of work, so we also want to adjust the data so that they more closely reflect the firm size distribution in Los Angeles.
To make this adjustment, we use data from the 2011-2013 U.S. Census Bureau Quarterly Workforce Indicators (QWI) for L.A. County. The QWI data are based on administrative data from employers’ unemployment insurance records, and the firm size variable is calculated based on the total number of workers across all of a firm’s locations. Using the QWI data, we calculate the distribution of workers in several broad industry categories across three firm size categories (under 50 employees, 50-499 employees, and 500+ employees),8 and then reweight the CPS data so that the distribution of workers in those industry categories matches the QWI data.
After making the firm size distribution adjustment at the County level, we then make the same adjustments to the city’s industry distribution as with the ACS data.

74 Proposed Minimum Wage Law for Los Angeles
A2: Estimating the Minimum Wage to Median Full-Time Wage RatioOne of the metrics we use to assess the proposed minimum wage increase is the ratio of the proposed minimum wage to the median full-time wage. This section describes our method for estimating the median full-time wage in Los Angeles.
i. Data Source, Sample Definition, and Geography
We again use the 2012-2013 ACS to estimate the median full-time wage. Because the minimum wage to median full-time wage ratio is used to assess the level of the proposed minimum wage in relation to Los Angeles’ economy as a whole, we do not exclude federal and state government employees, nor local government employees not covered by the proposed law. Otherwise, our sample criteria are the same as used in the simulation of the minimum wage increase (see section 1.A.ii for further detail). We make the same adjustments to the industry distribution as in the simulation of the minimum wage increase (see section 1.B.iv for further detail).
ii. Wage Variable and Ratio Calculation
We construct the wage variable in the same manner as with the simulation of the minimum wage increase, except that we do not smooth the wage variable for this calculation (see section 1.A.iv for further detail). To inflate the wage variable from 2012 to 2014 we use core inflation for the Los Angeles metropolitan area (CPI-W less food and energy). We inflate the 2012 portion of the data to 2013 dollars using the actual core inflation in 2013, and then calculate the median wage for full-time workers (those working 35 or more hours per week). We then inflate the median full-time wage to 2014 dollars using the actual core inflation in 2014. For future years we inflate the median full-time wage using the wage growth assumptions described in Section 2 of the main report. To calculate the ratio we divide the proposed new minimum wage in a given year by the median full-time wage inflated to that year’s dollars.
A3: Estimating the Labor Share of Operating CostsTo calculate the change in operating costs for businesses as a result of the proposed minimum wage increase, it is necessary to first determine the share of operating expenses accounted for by labor costs. This section describes our methods for calculating the labor share of operating costs in several industries and the overall economy.
A. Retail Trade (including Grocery Stores)
To determine the labor share of operating costs in retail trade and grocery stores, we use the U.S. Census Annual Retail Trade Reports, which provide data on retail sales, payroll costs, merchandise purchased for resale, and detailed operating expenses. We add operating expenses and purchases together to determine total operating costs. We add the costs of payroll taxes, employer paid insurance premiums, and employer benefits (excluding health insurance and retirement benefits) to annual payroll to estimate total labor costs. Health and retirement benefits are excluded since, unlike payroll taxes and workers’ compensation insurance, the costs of the benefits will not change if wages are increased. Dividing labor costs by operating costs gives us the labor share in retail trade.
75 Proposed Minimum Wage Law for Los Angeles
B. Food Services
For the food services industry, we use industry data on gross operating surplus available from the Bureau of Economic Analysis Input-Output Account Data (Use Table, 2012, Before Redefinitions, Producer Value). We subtract gross operating surplus from sales to get total restaurant operating costs, and then proceed as was done for retail using the Annual Retail Trade Report to obtain labor cost data.
C. Wholesale Trade
For the wholesale trade industry we use data from the U.S. Census Annual Wholesale Trade Report, and follow the same methodology as with retail trade.
D. Manufacturing
For manufacturing industries we use data from the 2012 Economic Census (Table EC1231I1). To determine operating expenses we add together payroll costs and fringe benefits, total cost of materials, total capital expenditures, depreciation, rental or lease payments, and all other operating expenses. To determine labor costs we add together payroll costs and payroll taxes, employer paid insurance premiums, and employer benefits (excluding health insurance and retirement benefits).
E. Administrative and Waste Management Services, Health Care and Social Assistance (including ambulatory care, hospitals, and long-term care), and Other Services
For these industries, we use data from the U.S. Census Annual Services Report, which provides data on payroll and operating expenses. Total operating expenses are reported directly in the data. To determine labor costs we add together payroll costs and payroll taxes, employer paid insurance premiums, and employer benefits (excluding health insurance and retirement benefits).
F. Overall Economy
To calculate the labor share of operating costs in the overall economy, we sum the total labor and operating costs across all industries with available data, and then divide the aggregate labor costs by the aggregate operating costs. In addition to the industries listed above, we are able to use the Annual Services Report to gather data on the following industries (costs for these additional industries are calculated as in section E above): utilities; transportation and warehousing; information; finance and insurance; real estate and rental and leasing; professional, scientific, and technical services; educational services; and arts, entertainment, and recreation. We are missing data for the following industries, and as a result they are not included in our calculation: agriculture, forestry, fishing, and hunting; mining, quarrying, and oil and gas extraction; construction; accommodation; and public administration.
***
Finally, in Table A2, we show an alternative version of Table 7 in the main report: the cumulative change in operating costs in high-impact industries, but without savings from reduced turnover.
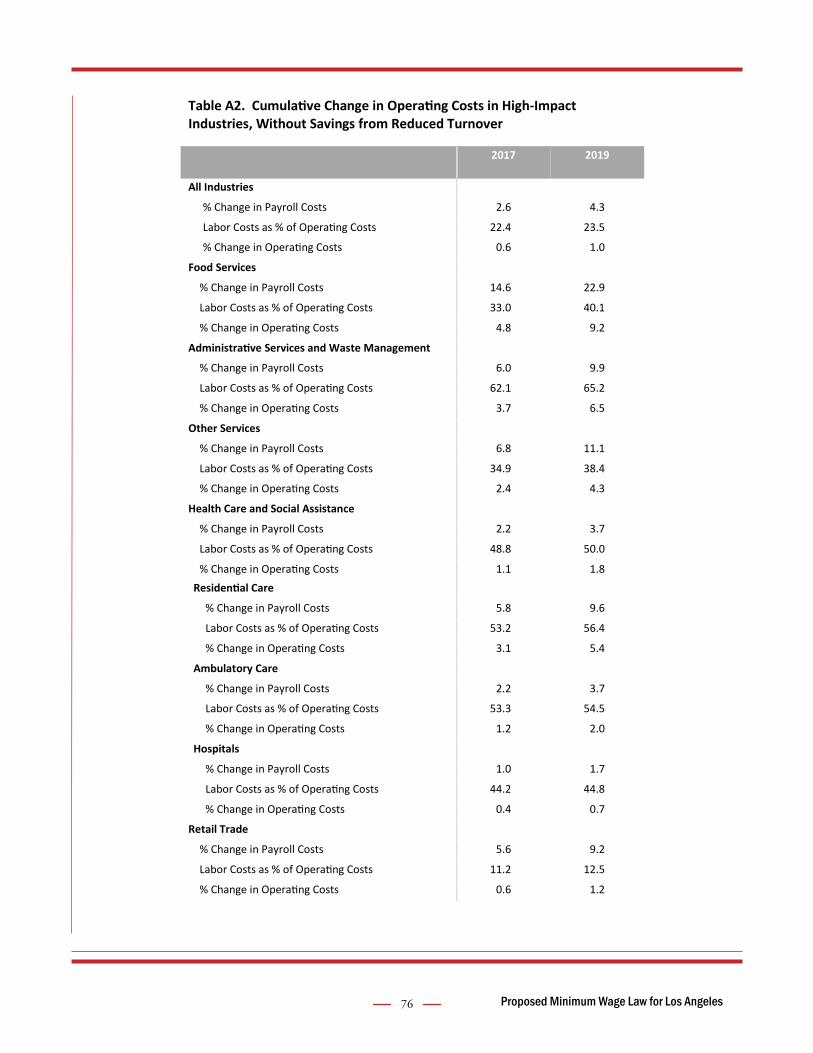
76 Proposed Minimum Wage Law for Los Angeles
Table A2. Cumulative Change in Operating Costs in High-Impact Industries, Without Savings from Reduced Turnover
2017 2019
All Industries
% Change in Payroll Costs 2.6 4.3
Labor Costs as % of Operating Costs 22.4 23.5
% Change in Operating Costs 0.6 1.0
Food Services
% Change in Payroll Costs 14.6 22.9
Labor Costs as % of Operating Costs 33.0 40.1
% Change in Operating Costs 4.8 9.2
Administrative Services and Waste Management
% Change in Payroll Costs 6.0 9.9
Labor Costs as % of Operating Costs 62.1 65.2
% Change in Operating Costs 3.7 6.5
Other Services
% Change in Payroll Costs 6.8 11.1
Labor Costs as % of Operating Costs 34.9 38.4
% Change in Operating Costs 2.4 4.3
Health Care and Social Assistance
% Change in Payroll Costs 2.2 3.7
Labor Costs as % of Operating Costs 48.8 50.0
% Change in Operating Costs 1.1 1.8 Residential Care
% Change in Payroll Costs 5.8 9.6
Labor Costs as % of Operating Costs 53.2 56.4
% Change in Operating Costs 3.1 5.4
Ambulatory Care
% Change in Payroll Costs 2.2 3.7
Labor Costs as % of Operating Costs 53.3 54.5
% Change in Operating Costs 1.2 2.0
Hospitals
% Change in Payroll Costs 1.0 1.7
Labor Costs as % of Operating Costs 44.2 44.8
% Change in Operating Costs 0.4 0.7
Retail Trade
% Change in Payroll Costs 5.6 9.2
Labor Costs as % of Operating Costs 11.2 12.5
% Change in Operating Costs 0.6 1.2

77 Proposed Minimum Wage Law for Los Angeles
A4: IMPLAN ModelsIMPLAN analyses were conducted using zip-code level data from IMPLAN version 3.1 2013 for Los Angeles County. The policy changes were run for the relevant event years (2017 or 2019) with all results in nominal 2017 or 2019 dollars.
Isolating Effect on Los Angeles City using IMPLAN
The city of Los Angeles was isolated based on the 105 zip codes in which 50% of the zip code lives within the city of Los Angeles, according to Census data.1 The zip codes included are as follows:
Grocery Stores
% Change in Payroll Costs 7.8 12.4
Labor Costs as % of Operating Costs 12.8 14.8
% Change in Operating Costs 1.0 1.8
Non-Durable Manufacturing
% Change in Payroll Costs 5.9 9.5
Labor Costs as % of Operating Costs 7.2 8.1
% Change in Operating Costs 0.4 0.8
Apparel Manufacturing
% Change in Payroll Costs 12.3 19.2
Labor Costs as % of Operating Costs 29.2 35.0
% Change in Operating Costs 3.6 6.7
Food Manufacturing
% Change in Payroll Costs 6.5 10.5
Labor Costs as % of Operating Costs 11.1 12.6
% Change in Operating Costs 0.7 1.3
Wholesale Trade
% Change in Payroll Costs 3.1 5.2
Labor Costs as % of Operating Costs 6.3 6.8
% Change in Operating Costs 0.2 0.3
Source: Authors’ analysis of ACS, QCEW, Economic Census, U.S. Census Annual Retail Trade, Wholesale Trade, and Services Reports, and BEA data.
Note: Estimates were calculated using the mid-range wage growth and inflation scenario.
Continued…. 2017 2019

78 Proposed Minimum Wage Law for Los Angeles
Modeling Household Spending and Household Income Changes
To model the reduction in household spending from price increases in Panel A of Table 11, we used IMPLAN’s pre-created Institutional Spending Pattern for households. We applied the household spending changes proportional to spending patterns across household income levels within the study area. IMPLAN assumes that some portion of a household spending change occurs outside the study area, also known as leakage. In order to capture the full effect of increased prices and therefore reduced consumer spending within the study area, we manually increased the household spending change amount fed into IMPLAN so that the decrease in direct output within the study area was equal to the spending decrease predicted to occur within city limits.
To model household income changes in Panel B of Table 11, we used IMPLAN’s household income activity, which removes taxes and savings from income before modeling the effects of increased spending. We applied the household income changes proportional to the estimated distribution of the minimum wage increase across household income levels from our simulation model.
A5: Tax EstimationImpact on City Tax Revenue
We estimate that the real production of goods and services in Los Angeles will decline by -0.06% in 2017 and -0.12% in 2019 over the baseline in those years without a city minimum wage increase, and that prices will increase by 0.48% and 0.88% for the two years. Since consumption makes up 70 percent of GDP, prices will increase by 0.34% as a share of GDP in 2017 and 0.62% in 2019. Subtracting the reduction in production of goods and services gives us a change in nominal GDP of 0.28% in 2017 and 0.49% in 2019. If consumption makes up 70 percent of GDP, this gives us a change in business revenue of 0.2% in 2017 and 0.3% in 2019.
Increase in Prices as a Share of GDP — Decline in Production of Goods and Services =Change in Nominal GDP
Change in Nominal GDP X Consumption as a Share of GDP = Change in Sales
2017: (0.34%-0.06%) * 0.7 = 0.2%2019: (0.62%-0.12%) * 0.7 = 0.34%
90002, 90003, 90004, 90005, 90006, 90007, 90008, 90010, 90011, 90012, 90013, 90014, 90015, 90016, 90017, 90018, 90019, 90020, 90021, 90023, 90024, 90025, 90026, 90027, 90028, 90029, 90031, 90032, 90033, 90034, 90035, 90036, 90037, 90038, 90039, 90041, 90042, 90043, 90044, 90045, 90046, 90047, 90048, 90049, 90057, 90058, 90059, 90061, 90062, 90064, 90065, 90066, 90067, 90068, 90071, 90077, 90089, 90094, 90095, 90248, 90272, 90291, 90292, 90293, 90710, 90731, 90732, 90744, 91040, 91042, 91303, 91304, 91306, 91307, 91311, 91316, 91324, 91325, 91326, 91330, 91331, 91335, 91342, 91343, 91344, 91345, 91352, 91356, 91364, 91367, 91371, 91401, 91402, 91403, 91405, 91406, 91411, 91423, 91436, 91601, 91602, 91604, 91605, 91606, 91607

79 Proposed Minimum Wage Law for Los Angeles
Gross Receipts
In 2014, the City of Los Angeles received $427 million in business taxes, $402 million from gross receipts and $25 million from non-gross receipts taxes. The top tax rate under the gross receipts tax is set to decline from $5.07 in 2014 to $4.50 in 2017 and $4.25 in 2019. This top rate accounted for 59 percent of the gross receipts taxes collected in 2014. Factoring in the rate reduction and projected inflation, we estimate that absent a city minimum wage policy, $402 million would be collected in 2017 and $408 million in 2019.
Factoring in the projected increase in sales we obtain an increases in tax receipts of $800,000 ($402 million x 0.2%) in 2017 and 1.4 million ($409 million x 0.34%) in 2019.
Non Gross Receipts Business Taxes (NRGT)
Without a city minimum wage policy, NGRT would be $27 million in 2017 and $29 million in 2019. To estimate the change due to policy, we subtract the projected reduction in production of goods and services due to the city minimum wage policy, which gives us a reduction of $15,000 in 2017 and $35,000 in 2019.
Sales Tax
IMPLAN estimates that sales taxes in Los Angeles increase by 2.4% of an output. To determine the change in sales tax revenue for the city of Los Angeles we calculate the overall change in sales tax as a result of the projected increase in total sales, and proportion the 1/9 of the increase that Los Angeles receives as a share of sales tax collected in the City.
Endnotes1 Since the ACS surveys respondents over the course of the year and asks about earnings in the previous 12 months, we apply the ACS-provided adjust variable to convert reported earnings to constant dollars within the survey year.
2 We tested the validity of the interval mid-point using the continuous version of weeks worked last year in the Current Population Survey (March supplement). For low-income workers in California, average weeks worked in each of the intervals was not substantially different from the interval midpoint (except for the first interval, which is dropped in our sample).
3 For the purposes of the simulation, our wage measure is intended to only reflect wages paid directly by the employer. To remove tips, we reduced wages for restaurant wait staff to the state minimum wage.
4 This step follows the methodology of The State of Working America, Economic Policy Institute.
5 There is no single consensus estimate of the size of the ripple-effect from minimum wage increases. For our lower bound, we draw on Wicks-Lim (2006), who finds a modal ripple effect of 115 percent across state and federal minimum wage increases from 1983-2002. For our upper bound, we draw on Cooper (2013), who uses a common convention of defining the ripple-effect band as equal to the new minimum wage plus the absolute value of the minimum wage increase being studied.
6 The weeks worked variable in the CPS is continuous, so we can use it directly to compute the hourly wage variable.
80 Proposed Minimum Wage Law for Los Angeles
7 We can adjust the CPS firm size distribution for this response error by reweighting the data, but we are not able to move observations to their correct firm size category. To the extent that wages vary by firm size, our adjustment does not correct the wage distribution by firm size.
8 Both QWI and CPS have more finely-grained firm size categories, but these are the only common categories between the two sources. After the adjustment, we use the more detailed CPS categories for the analysis.
9 U.S. Census, 2010 ZCTA to Place Relationship File, https://www.census.gov/geo/maps-data/data/zcta_rel_download.html.

81 Proposed Minimum Wage Law for Los Angeles
Appendix B: The Research Literature on Minimum Wage Effects
We review here the empirical evidence on the effects of minimum wage laws on workers, families, and businesses. Where possible, we highlight research on local minimum wage laws. We also draw upon the much larger body of research on the impacts of state and federal minimum wage increases. Recent studies that compare adjacent counties from different states with different minimum wages are especially relevant. The findings from these studies speak directly to policy makers’ concerns that businesses might relocate employment outside their city’s borders in response to a local minimum wage law.
1. Impact on low-wage workers’ earnings
The primary goal of raising the minimum wage is, of course, to raise the pay of low-wage workers. A broad consensus in the economic research literature agrees that minimum wage laws raise pay for workers on the bottom rungs of the labor market (for an extensive review, see Belman and Wolfson 2014). Researchers also consistently find that the affected workers are largely adults and disproportionately women and people of color. Finally, we review what is known about reliance on public assistance programs by low-wage workers and their families. San Francisco’s minimum wage, implemented in early 2004, established a minimum standard of $8.50, 28 percent above the state minimum wage of $6.75, To assess this policy, Dube, Naidu and Reich (2007) used a before-and-after survey of restaurant employers in San Francisco and in nearby parts of neighboring Alameda County. They found that the average wage of workers at surveyed restaurants rose from $10.22 before the increase to $11.01 afterward, with pay rising twice as much among fast-food restaurants compared to table-service restaurants. They also found evidence that the increase compressed the wage distribution among restaurant workers by raising the bottom of the distribution (not by hurting pay for higher-wage workers). Before the policy, 49.7 percent of restaurant workers earned less than $8.50; afterward, only 5 percent did. The authors also tested whether compliance with minimum wage laws decreased after the law passed. They found no evidence of decreased compliance.
Jacobs and Reich (2014) recently conducted a longer-term assessment of San Francisco’s minimum wage law. They estimate that 55,000 workers in the city receive higher pay because of the ordinance, amounting to a cumulative increase of $1.2 billion in wages in the ten years since the law’s inception. They also found additional evidence that the law had a significant impact on workers’ earnings over time. The wages of San Francisco workers earning at the bottom of the distribution (the 10th percentile) jumped in 2004, when the law was implemented. This wage, when measured to take account of inflation, did not change even during the recession that began in December 2007, precisely because the city’s minimum wage standard is indexed to inflation. By contrast, in the surrounding counties, without an indexed minimum wage, the 10th percentile wage declined over that same time period.
Additional lessons can be gleaned from Santa Fe, the other city whose minimum wage law has been extensively studied. Pollin’s (2004) detailed prospective study of the city’s 2004 law estimated that 17,000 workers would be directly or indirectly affected and that the directly affected workers would see an average increase of $2,647 in annual earnings. In a more recent prospective study, Reich (2012) estimated that San Jose’s minimum wage increase from $8.00 to $10.00 would lead to higher pay for about 69,000 of the city’s 388,000-person workforce (18.9 percent).

82 Proposed Minimum Wage Law for Los Angeles
Schmitt and Rosnick (2011) studied the wage impacts of both the San Francisco and Santa Fe laws. These authors found that wages increased in a range of low-wage industries in both cities. In San Francisco, for example, the average wage of fast-food workers increased 9 to 11 percent by the third year of the ordinance, and as much as 12 percent in low-wage industries overall. Pay for fast-food workers in Santa Fe increased by similar amounts, together with wage increases of 2 to 9 percent in the retail industry and 5 to 15 percent for low-wage industries overall. (See also Reynis, Segal and Bleeker [2005] for similar findings.)
A broader literature has looked at state and federal minimum wage increases and estimated their impact on workers’ earnings. In their comprehensive review of existing research, Belman and Wolfson (2014) estimate that changes in the minimum wage typically affect about 10 to 20 percent of the labor force (and sometimes as much as 30 percent), counting both directly and indirectly affected workers. The average wage increase of an affected worker depends on the size of the minimum wage increase and what the average worker was earning beforehand. As a concrete example, Schmitt (2013) analyzed federal minimum wage increases from 1989 to 2009 and estimated that affected workers’ wages rose between 8.4 and 13.6 percent.
2. Effects on use of public assistance programs
Does raising the minimum wage reduce reliance on means-tested public assistance programs? The answer may seem obvious, but West and Reich (2014) point out that the research question shows it to be more complex. If, for example, raising the minimum wage causes increased unemployment, more workers and families would have to rely on programs such as food stamps (the Supplemental Nutrition Assistance Program, or SNAP). The authors conduct a causal analysis of state and federal minimum wage increases from 1990-2012 and find that, on average, a 10 percent increase in the minimum wage reduces food stamp program enrollment by between 2.4 and 3.2 percent, and reduces program expenditures by 1.9 percent. West and Reich (2014b) conducted a comparable study on the causal effects of minimum wage increases on Medicaid, with similar findings. Zipperer (2014) also examined the effects of minimum wages on these public programs and obtained similar results.
More generally, since eligibility for programs such as SNAP and Medicaid are tied to the federal poverty level, Dube’s (2013) finding that higher minimum wages reduce the poverty rate suggests that we might also expect reductions in enrollments in public assistance programs.
3. Effects on the economy
A common question is whether raising the minimum wage might act as an economic stimulus and engine of job growth, as low-wage workers spend their increased earnings in local communities. Researchers at the Federal Reserve Bank of Chicago analyzed how a future federal minimum wage increase would affect aggregate household spending. The authors calculate that a $1.75 increase in the federal minimum wage (from $7.25 to $9.00 an hour) would raise aggregate household spending by roughly $48 billion in the short term, increasing GDP by 0.3 percent (Aaronson and French 2013). In a similar vein, the Economic Policy Institute recently estimated that the Harkin/Miller bill would result in an additional $35 billion in wages paid to affected workers by 2016. This projected rise in consumer spending would provide a net increase in GDP of $22.1 billion, creating roughly 85,000 new jobs (Cooper 2013).

83 Proposed Minimum Wage Law for Los Angeles
Prospective estimates require a series of assumptions about the future behaviors of workers, owners, and consumers and their interactions. For local laws, the size of the locality and the proportion of workers who live and spend their income in the locality are also important. 4. The effects of minimum wage laws on businesses
The impact of the minimum wage on businesses—how many workers they hire, whom they hire, the prices they charge for their goods and services, their location decisions—is one of the most researched topics in economics, with hundreds of studies published over the decades. We do not attempt to summarize the full literature here; for recent reviews see Schmitt (2013) and Belman and Wolfson (2014).
Economists’ understanding of minimum wage effects has undergone significant changes since the 1990s. This shift began with the groundbreaking work of Card and Krueger (1994), who analyzed employment in fast-food restaurants near the New Jersey and Pennsylvania border after New Jersey increased its state minimum wage. Card and Krueger found no measurable negative impact on employment.
Since then, economists have increasingly recognized that raising the minimum wage does not automatically mean that employment will fall. Increased labor costs can be absorbed through a variety of other channels. For example, if turnover declines, employers save on recruiting and training costs at the same time that they reap the benefits of more experienced workers who are more productive. When a cost increase affects all firms in an industry, firms can also raise their prices rather than reduce the number of employees. They may also experience lower profits. Modern economics therefore regards the employment effect of a minimum wage increase as a question that is not decided by theory, but by empirical testing.
Before proceeding, it is important to mention that existing research has only studied moderate increases in the minimum wage, of the size discussed in previous sections. These studies can only be suggestive of what might occur when minimum wages are increased significantly beyond existing local, state, or federal mandates.
A. Impact on employment and hours
Evidence from local minimum wage laws
Dube, Naidu and Reich (2007) studied the impact of San Francisco’s minimum wage law after it increased from $6.75 to $8.50 an hour in 2004, using a quasi-experimental research design. They surveyed a sample of restaurants before the wage increase, and then re-surveyed the same businesses nine to ten months after. The sample included restaurants from San Francisco as well as neighboring East Bay cities that were not covered by the policy, allowing the researchers to compare outcomes at restaurants affected by the minimum wage mandate with those that were not. The study also was able to compare outcomes at fast-food restaurants with outcomes at full-service restaurants.
After controlling for a variety of potential confounding factors, the authors found no statistically significant negative effects on either employment or the proportion of full-time jobs as a result of the San Francisco law. This finding holds for both full-service and fast-food restaurants (one might expect more

84 Proposed Minimum Wage Law for Los Angeles
sensitivity to a higher minimum wage in the latter). Restaurant employment in San Francisco rose slightly faster than in surrounding counties after the minimum wage increase, and again after San Francisco implemented two additional policies (paid sick leave and a health spending requirement). Trends in overall employment in San Francisco closely matched those in the surrounding counties during the same time period, indicating that the differential trends in restaurant employment were not caused by differences in economic growth between the two areas. Restaurants closed in San Francisco at a 2.8 percent lower rate than in nearby areas not covered by the law. This difference, however, was not statistically significant.
Belman and Wolfson (2014) provide the most extensive summary of the minimum wage research since Card and Krueger. They conclude that the employment effects of the minimum wage in the United States are “both vanishingly small and not statistically significant in even the most generous test” (p. 168). A separate review of minimum wage research by Schmitt (2013) similarly finds “the minimum wage has little or no discernible effect on the employment prospects of low-wage workers.”
Potter (2006) studied the impact of Santa Fe’s minimum wage law after it increased from $5.15 to $8.50 in 2004, a substantial increase of 65 percent (at that time, only businesses with 25 or more employees were covered). Potter also used a quasi-experimental research design to compare changes in employment at Santa Fe businesses before and after the ordinance went into effect and to changes in employment in nearby Albuquerque over the same time period. Potter found no statistically significant negative impact of Santa Fe’s minimum wage increase on Santa Fe employment, either at an absolute level or relative to Albuquerque.
Finally, Schmitt and Rosnick (2011) studied the impact of the above two laws, comparing employment trends in these cities before and after their minimum wage increases to control groups of surrounding suburbs and nearby metropolitan areas. The authors found no discernible negative effects on employment, even three years after the respective ordinances were implemented. The authors focused on fast-food restaurants, food services, retail trade, and other low-wage industries.
Several additional studies of Santa Fe and San Francisco have been produced by the Employment Policies Institute. In a study of Santa Fe, Yelowitz (2005a, 2005b) found an increase in the probability of unemployment for low-skilled workers and evidence of replacement of low-skilled adults by teens. In his study of San Francisco, Yelowitz (2012) found the opposite result: a decrease in teen work hours and no discernible effect on overall employment.
Unfortunately, both studies suffer from serious methodological problems that make the results unreliable. Since higher wages are likely to increase the labor supply, unemployment rates can increase even as the number of people who are employed also increases. Pollin and Wicks-Lim (2005) replicate Yelowitz’s (2005a) study but look at employment, rather than unemployment. They find no negative impact on employment. Furthermore, even if the reported results for each of the studies held, total compensation for teens and low-skilled workers would still have increased. Any employment or hours reductions would be more than offset by the increase in hourly earnings (Pollin and Wicks-Lim 2005; National Employment Law Project 2012). If the findings of the small number of case studies discussed above are taken on their own, it would be difficult to draw broad conclusions about the impact of minimum wage laws. However, the results from

85 Proposed Minimum Wage Law for Los Angeles
studies of city and county minimum wage laws are corroborated by detailed research on state and federal minimum wage laws that provide a much larger sample of events to study.
Dube, Lester and Reich (2010 and forthcoming) looked at every state and federal minimum wage increase in the U.S. between 1990 and 2011 and identified several hundred pairs of adjacent counties that were located on different sides of a state border with a minimum wage difference. This research design compares the employment trends of the most affected groups—teens and restaurants—across adjacent counties that were exposed to different minimum wage levels. It is therefore an excellent test of whether businesses relocate employment outside county borders to avoid being subject to a higher minimum wage. Using this research design, Dube, Lester and Reich (2010 and forthcoming) and Allegretto, Dube, Reich and Zipperer (2013) find no statistically significant effects of minimum wage increases on either employment or hours worked in restaurants and other low-wage industries, and among teens, controlling for a range of regional and local differences that previous research did not include. Allegretto, Dube and Reich (2011) use a similar strategy and find no employment effects among teens. Comparing multiple outlets of a large retail firm, Giuliano finds a small positive effect.
We highlight these studies because they combine state-of-the art econometric methods with the most detailed datasets available, allowing researchers to accurately control for differences in local economic conditions that could confound the analysis. They have been the most influential studies of the minimum wage since Card and Krueger (1995).
That said, the economics literature includes conflicting findings on the employment impacts of the minimum wage. Even if the employment impacts of minimum wage are zero, we would expect to find case studies clustered around that point, with some finding positive and others finding negative impacts (Schmitt 2013). However, most of the broader studies that find negative effects, as reviewed in Neumark and Wascher (2008), fail a fundamental necessary condition for identifying statistically unbiased estimates of minimum wage effects. The key issue is that their research design assumes that states that increase minimum wages are otherwise not different from those that do not increase minimum wages. Dube, Lester and Reich (2010) and Allegretto, Dube, Reich and Zipperer (2013) show that this assumption is incorrect. In the states that increased their minimum wages, employment among low-wage workers was already growing more slowly two years before the implementation of the minimum wage increases, compared to states that did not increase minimum wages. Existing differences in regional employment trends that are unrelated to minimum wage policy can explain the differences in outcomes after the increases. As Allegretto, Dube, Reich and Zipperer (2013) document, local comparisons make sense because nearby areas are much more similar than areas that are farther away. And when minimum wage effects are estimated using local comparisons—such as across adjacent counties on a state border—the negative effect on employment disappears.
Neumark, Salas and Wascher (2014a, b) have defended the earlier findings in Neumark and Wascher (1992). Allegretto, Dube, Reich and Zipperer (forthcoming), in turn have responded. Much of the debate still concerns the proper control groups to include in a regression. In a new approach, Totty (2014) examines minimum wage effects without prior decisions on what control groups should be included. He finds that the minimum wage does not have significant effects on employment.While this debate will undoubtedly continue, it should be noted that both sides now agree that they find extremely small employment effects of minimum wages in restaurants. Moreover, there are not effects
86 Proposed Minimum Wage Law for Los Angeles
on adults, who make up nearly 90 percent of minimum wage-affected workers nationwide (Aaronson, Agarwal and French 2013, Table A-3).
B. Impacts on firms’ costs
The impact of minimum wages on the overall cost structure of a business varies significantly by industry. The impact of the minimum wage on a firm’s operating costs will depend on the share of the workforce at or below the new minimum wage rate, their average wage before the increase, and the share of labor costs in total operating costs. Operating costs include not only labor, but also materials, rent, maintenance, supplies, taxes, utilities, and energy costs. An industry may have large numbers of low-wage workers, but if labor is a relatively small share of the total costs of the firm the wage increase will have a correspondingly small impact on the overall cost structure of the firm.
In a prospective study, Reich and Laitinen (2003) carried out a representative survey of San Francisco business establishments. They estimated that a 25.9 percent increase in the minimum wage from $6.75 to $8.50 would result in a 1.1 percent increase in the overall wage bill. When viewed from the perspective of operating costs, a 26 percent increase would result in 82.0 percent of establishments experiencing an increase in operating costs of less than 1 percent, and 95.2 percent experiencing an increase in operating costs of less than 5 percent. Breaking down results by industry, they estimated that 17.9 percent of restaurants would experience an increase in operating costs of 5 percent or more, as would 8.6 percent of retail establishments. For manufacturing, entertainment, hotel, and personal service firms, the estimated increase in operating costs was close to zero.
Pollin (2004) similarly estimated that the average increase in firms’ costs relative to sales under Santa Fe’s 2003 minimum wage ordinance would be 1 percent; the average cost increase for hotels relative to sales would be 3 percent.
Benner and Jayaraman (2012) analyzed the impact of a proposed increase in the federal minimum wage from $7.25 to $10.10 (a 39 percent increase, not accounting for inflation during the phase-in) on the food industry. They estimated a maximum increase in operating costs for the food service and drinking establishment industry of 2.25 percent over three years, and 1 percent in the retail food industry.
C. Impacts on prices
Since a higher minimum wage applies to all employers, a firm that serves the local market, like a restaurant, will be able to pass through a share of the higher costs without suffering a disadvantage relative to its competitors. Belman and Wolfson (2014) survey seven studies of price effects of the minimum wage, all of which found some impacts on prices in industries highly affected by the minimum wage, namely restaurants. Dube, Naidu and Reich (2007) found that restaurant prices in San Francisco rose 2.8 percent more than those in neighboring Alameda County, following the implementation of a 26 percent increase in the city’s minimum wage law. Aaronson (2001) found that a 10 percent increase in the minimum wage results in a 0.7 percent increase in restaurant prices. D. Impact on employee turnover
87 Proposed Minimum Wage Law for Los Angeles
The correlation between low wages and high employee turnover is well documented (Cotton and Tuttle 1986). Recent minimum wage and living wage research has identified that the effect is causal. Dube, Naidu and Reich (2007) found an increase in the average tenure of workers in limited-service restaurants of three and a half months. In an extensive causal study of minimum wage impacts on employment flows using representative U.S. data, Dube, Lester and Reich (forthcoming) found that a 10 percent increase in the minimum wage results in a 2.1 percent reduction in turnover for restaurant workers and a 2.0 percent reduction in turnover for teens. Brochu and Green (2011) obtained similar results with Canadian data.
Three studies analyzed the impact of living wage laws on employee turnover. A study of the Los Angeles Living Wage Ordinance (Fairris 2005) found a 35 percent reduction in turnover in firms that increased wages as a result of the law, with an average increase of 23 percent. Reich, Hall and Jacobs (2005) found an overall decrease in turnover at the San Francisco International Airport of 60 percent for firms that were highly impacted by mandated pay increases. Turnover of airport screeners fell by 80 percent following a 55 percent wage increase, from $5.75 to $10 per hour. Howes (2005) found a 17 percent decrease in turnover following a 13 percent wage increase for homecare workers in San Francisco. Putting the living wage studies together, Jacobs and Graham-Squire (2010) estimate that for every 1 percent increase in wages in low-wage service positions, turnover declines by an average of 1.45 percent. The impact may be smaller for broad minimum wage laws where all employers in a market increase their wages at the same time and the wage difference between firms remains the same (Manning 2011).
Employers incur significant costs from employee turnover. This includes both direct costs for recruitment, selection, and training of workers and the indirect costs associated with lost sales, poor customer relations, and lost productivity as new workers learn on the job. The cost of worker replacement varies based on compensation, firm size, and skill level of the job. Hinkin and Tracey (2000) conducted a detailed study of non-managerial staff at four hotels, two in Boston and two in Chicago. Taking into account both direct and indirect costs, they estimated replacement costs ranging from $1,322 for room service wait staff and $2,077 for a line cook to $7,658 for an administrative assistant in sales and catering. A study of the cost of supermarket turnover by the Coca Cola Research Council estimated the replacement cost for an $8 an hour non-union worker at $4,199 (Blake 2000). Boushey and Glynn (2012) find that the median cost of replacement for jobs paying $30,000 a year or less is 16.1 percent of an employee’s annual salary. A statistical analysis of California businesses by Dube, Freeman and Reich (2010) obtained similar results. Jacobs and Graham-Squire (2010) estimate that 18 percent of the costs of a wage increase for school cafeteria workers would be offset by lower turnover costs.
E. Impacts on firms’ operations and productivity
A higher minimum wage may reduce costs through additional channels that improve firm performance. In a small case study of quick service restaurants in Georgia and Alabama, Hirsch, Kaufman and Zelenska (2011) suggest how firms adjust to higher wage mandates. These authors analyzed detailed payroll data and also surveyed managers and employees about human resource practices. The authors found no negative effect from the minimum wage increase on employment or hours worked. Managers reported they could offset 23 percent of the labor cost increase through operational efficiencies. Ninety percent of the employers reported they had or would increase performance standards, including requiring better attendance, requiring more proficient and faster performance of job duties, having workers take on additional tasks, and more quickly terminating workers who were not performing. Managers reported
88 Proposed Minimum Wage Law for Los Angeles
economizing on non-labor inputs, including water, electricity, and food wastage.
Reich, Hall and Jacobs (2005) surveyed employers and employees at the San Francisco International Airport following the implementation of higher mandated compensation standards. Employers reported improvements in overall work performance (35%), employee morale (47%), absenteeism (29%), reductions in grievances (45%), reductions in disciplinary issues (44%), improvements in equipment maintenance (29%), reductions in equipment damage (24%), and improvements in customer service (45%). Employees reported that more skills were required of them (50%), that they were working harder on the job (44%), that they were experiencing greater stress on the job (43%) and that the pace of work had increased (37%).
Conclusion
In 1994 David Card and Alan Krueger published a groundbreaking study that changed how many economists view the minimum wage. They found no measurable negative impact on employment from minimum wage increases. As we reviewed above, a large body of research has since built upon their methodology. As a result, we have learned a great deal about how employers respond to increases in the minimum wage.
First, paying workers more can change their work performance. It can change their productivity, their attitude about their job, how hard they work, and their ability to make it to the job on time. Second, low-wage labor markets have high levels of job churning. Turnover levels are high as workers leave jobs looking for better wages or because they are unable to stay in their jobs due to poverty-related problems such as difficulties with transportation, child care, or health. As a result, rather than eliminating jobs, raising the minimum wages can reduce turnover and increase job stability. Third, firms can absorb higher labor costs through other means as well. They can pass on some of the increased costs to consumers through higher prices or earn lower profits. In short, firms use a combination of strategies to adjust to higher minimum wages without cutting jobs or hours (Schmitt 2013).
Nonetheless, it is important to emphasize again that the existing research literature is necessarily limited to the range of minimum wage increases that have been actually been implemented. While these studies are suggestive, they cannot tell us what might occur when minimum wages are increased significantly beyond existing local, state, or federal mandates.
References
Aaronson, Daniel. 2001. “Price Pass-Through and the Minimum Wage.” The Review of Economics and Statistics 83(1): 158-169.
Aaronson, Daniel, Sumit Agarwal and Eric French. 2012. “The Spending and Debt Responses to a Minimum Wage Hike.” American Economic Review, 102(7):3111-39.
Aaronson, Daniel and Eric French. 2013. “How Does a Federal Minimum Wage Hike Affect Aggregate Household Spending?” The Federal Reserve Bank of Chicago, Chicago Fed Letter, August 2013, Number 313. Available at: http://www.chicagofed.org/digital_assets/publications/chicago_fed_letter/2013/cflaugust2013_313.pdf
89 Proposed Minimum Wage Law for Los Angeles
Allegretto, Sylvia, Arindrajit Dube and Michael Reich. 2011. “Do Minimum Wages Really Reduce Teen Employment? Accounting for Heterogeneity and Selectivity in State Panel Data.” Industrial Relations 50(2): 205-240.
Allegretto, Sylvia, Arindrajit Dube, Michael Reich and Ben Zipperer. 2013. “Credible Research Designs for Minimum Wage Studies.” Working Paper, Institute for Research on Labor and Employment, UC Berkeley. Available at: http://www.irle.berkeley.edu/workingpapers/148-13.pdf.
Allegretto, Sylvia, Arindrajit Dube, Michael Reich and Ben Zipperer, forthcoming. “Response to Neumark, Salas and Wascher.”
Belman, Dale and Paul J. Wolfson. 2014. What Does the Minimum Wage Do? Kalamazoo, MI: W.E. Upjohn Institute for Employment Research.
Benner, Chris and Saru Jayaraman. 2012. “A Dime a Day: The Impact of the Miller/Harkin Minimum Wage Proposal on the Price of Food.” University of California Berkeley Food Labor Research Center, Food Chain Workers Alliance and Restaurant Opportunities Center. Available at: http://laborcenter.berkeley.edu/foodlabor/price_food12.pdf
Blake, Frank. 2000. “New Ideas for Retaining Store-Level Employees,” Coca-Cola Research Council. Atlanta, GA.
Brochu, Pierre, and David Green. 2011. “The Impact of Minimum Wages on Quit, Layoffand Hiring Rates.” IFS Working Paper 06/11. London: Institute for Fiscal Studies.
Boushey, Heather and Sarah Jane Glynn. 2012. “There are Significant Business Costs to Replacement Employees.” Center for American Progress. Available at: http://www.americanprogress.org/wp-content/uploads/2012/11/CostofTurnover.pdf.
Card, David and Alan B. Krueger 1994. “Minimum Wage and Employment: A Case Study of the Fast-Food Industry in New Jersey and Pennsylvania.” American Economic Review 84(4): 772-93.
Cooper, David. 2013. “Raising the Federal Minimum Wage to $10.10 Would Lift Wages for Millions and Provide a Modest Economic Boost.” Economic Policy Institute. Available at: http://www.epi.org/publication/raising-federal-minimum-wage-to-1010/.
Cotton, John L. and Jeffery M. Tuttle. 1986. “Employee Turnover: A Meta-Analysis and Review with Implications for Research.” Academy of Management Review 11(1): 55-70.
Dube, Arindrajit. 2013. “Minimum Wages and the Distribution of Family Incomes.” Unpublished paper. https://dl.dropboxusercontent.com/u/15038936/Dube_MinimumWagesFamilyIncomes.pdf
Dube, Arindrajit, Eric Freeman and Michael Reich. 2010. “Employee Replacement Costs.” IRLE Working Paper 201-10, UC Berkeley. Available at: http://www.irle.berkeley.edu/workingpapers/201-10.pdf.
Dube, Arindrajit, T. William Lester and Michael Reich. 2010. “Minimum Wage Effects Across State Borders: Estimates Using Contiguous Counties.” Review of Economics and Statistics 92(4): 945-964.

90 Proposed Minimum Wage Law for Los Angeles
Dube, Arindrajit, T. William Lester and Michael Reich. Forthcoming. “Minimum Wage Shocks, Employment Flows and Labor Market Frictions.” Journal of Labor Economics, Working Paper, Institute for Research on Labor and Employment, University of California Berkeley. http://escholarship.org/uc/item/76p927ks.
Dube, Arindrajit, Suresh Naidu, and Michael Reich. 2007. “The Economic Effects of a Citywide Minimum Wage.” Industrial and Labor Relations Review 60(4): 522-543.
Fairris, David. 2005. “The Impact of Living Wages on Employers: A Control Group Analysis of the Los Angeles Ordinance.” Industrial Relations 44(1): 84-105.
Giuliano, Laura. 2013. “Minimum Wage Effects on Employment, Substitution, and the Teenage Labor Supply: Evidence from Personnel Data.” Journal of Labor Economics 31(1): 155-194.
Hinkin, Timothy R. and J. Bruce Tracey. 2000. “The Cost of Turnover: Putting a Price on the Learning Curve.” Cornell Hotel and Restaurant Administration Quarterly 41(14): 18-19.
Hirsch, Barry T., Bruce Kaufman and Tetyana Zelenska. 2011. “Minimum Wage Channels of Adjustment.” IZA Discussion Paper No. 6132. Institute for the Study of Labor. Available at: http://www2.gsu.edu/~ecobth/IZA_HKZ_MinWageCoA_dp6132.pdf.
Howes, Candace. 2005. “Living Wages and Retention of Homecare Workers in San Francisco.” Industrial Relations 44(1): 139-163.
Jacobs, Ken and Dave Graham-Squire. 2010. “Labor Standards for School Cafeteria Workers, Turnover and Public Program Utilization.” Berkeley Journal of Employment and Labor Law 21(2): 447-458.
Jacobs, Ken and Michael Reich. 2014. “When do Mandates Work?” In Michael Reich, Ken Jacobs and Miranda Diets (eds.) When Mandates Work: Raising Labor Standards at the Local Level, pp. 1-43. Berkeley CA: University of California Press.
Manning, Alan. 2011. “Imperfect Competition in the Labor Market.” In O. Ashenfelter & D. Card (eds.), Handbook of Labor Economics. vol. 4, no. 5. Elsevier,National Employment Law Project. 2012. Reviewing the Research on Citywide Minimum Wage Increases. Research Analysis.
Neumark, David and William Wascher. 1992. “Employment Effects of Minimum and Subminimum Wage Laws.” Industrial and Labor Relations Review 46(1): 55-81.
Neumark, David and William Wascher. 2006. “Minimum Wages and Employment: A Review of Evidence from the New Minimum Wage Research.” National Bureau of Economic Research Working Paper 12663. Cambridge, MA: National Bureau of Economic Research. http://www.nber.org/papers/w12663.
Neumark, David, Ian Salas and William Wascher 2014a. “Revisiting the Minimum Wage-Employment Debate: Throwing out the Baby with the Bathwater.” Industrial and Labor Relations Review, ILR Review, Cornell University, ILR School, vol. 67(2.5), pages 608-64.
Neumark, David, Ian Salas and William Wascher 2014b. “More on Recent Evidence on the Effects of Minimum Wages in the United States.” NBER Working Paper Series 20619.
91 Proposed Minimum Wage Law for Los Angeles
Pollin, Robert. 2004. Expert Report submitted in New Mexicans for Free Enterprise v. City of Santa Fe, No. D-0101-CV-2003-468 (N.M. 1st Jud. Dist Ct., Mar. 9, 2004).
Pollin, Robert and Jeannette Wicks-Lim. 2005. “Comments on Aaron Yelowitz, ‘Santa Fe’s Living Wage Ordinance and the Labor Market’.” Political Economy Research Institute, Working Paper. http://scholarworks.umass.edu/cgi/viewcontent.cgi?article=1085&context=peri_workingpapers
Potter, Nicholas. 2006. “Measuring the Employment Impacts of the Living Wage Ordinance Santa Fe, New Mexico.” University of New Mexico, Bureau of Business and Economic Research. Available at: https://bber.unm.edu/pubs/EmploymentLivingWageAnalysis.pdf
Reich, Michael. 2012. “Increasing the Minimum Wage in San Jose: Benefits and Costs. IRLE CWED Policy Brief. http://www.irle.berkeley.edu/cwed/briefs/2012-01.pdf
Reich, Michael, Peter Hall and Ken Jacobs. 2005. “Living wage Policies at the San Francisco Airport: Impacts on Workers and Businesses.” Industrial Relations 44(1): 106-138.
Reich, Michael and Amy Laitinen. 2003. “Raising Low Pay in a High Income Economy: The Economics of a San Francisco Minimum Wage.” University of California, Berkeley, Institute for Research on Labor and Employment, Report for the San Francisco Board of Supervisors. Available at: http://irle.berkeley.edu/research/minimumwage/minwage_may03.pdf
Reynis, Lee, Myra Segal and Molly Bleeker. 2005. “Preliminary Analysis of the Impacts of the $8.50 Minimum Wage on Santa Fe Businesses, Workers and the Santa Fe Economy.” University of New Mexico, Bureau of Business and Economic Research. Revised December 27, 2005.
Schmitt, John. 2013. “Why Does the Minimum Wage Have No Discernible Effect on Employment?” Center for Economic and Policy Research. Available at: http://www.cepr.net/documents/publications/min-wage-2013-02.pdf
Schmitt, John and David Rosnick. 2011. “The Wage and Employment Impact of Minimum-Wage Laws in Three Cities.” Center for Economic and Policy Research. Available at: http://www.cepr.net/documents/publications/min-wage-2011-03.pdf
Totty, Evan 2014. “The Employment Effects of the Minimum Wage: A Factor Analytic Approach.” Krannert School of Management, Working Paper No. 1278. http://www.krannert.purdue.edu/programs/phd/working-papers-series/2014/1278.pdf
West, Rachel and Michael Reich. 2014. “The Effects of Minimum Wages on SNAP Enrollments and Expenditures.” Center for American Progress. Available at: http://www.americanprogress.org/issues/economy/report/2014/03/05/85158/the-effects-of-minimum-wages-on-snap-enrollments-and-expenditures/
Yelowitz, Aaron. 2005a. “Santa Fe’s Living Wage Ordinance and the Labor Market.” Employment Policies Institute. Available at: https://www.epionline.org/wp-content/studies/yelowitz_09-2005.pdf
Yelowitz, Aaron. 2005b. “How Did the $8.50 Citywide Minimum Wage Affect the Santa Fe Labor Market?” Employment Policies Institute. Available at: https://www.epionline.org/wp-content/studies/yelowitz_12-2005.pdf

92 Proposed Minimum Wage Law for Los Angeles
Yelowitz, Aaron. 2012. “The Labor Market Effects of Citywide Compensation Floors.” Employment Policies Institute. Available at: https://www.epionline.org/wp-content/uploads/2014/07/EPI_SanFrancisco_Studyv4.pdf
Zipperer, Ben. 2014. “Essays on the Minimum Wage.” Unpublished Ph.D. dissertation. Department of Economics, University of Massachusetts-Amherst.

93 Proposed Minimum Wage Law for Los Angeles
Appendix C: Los Angeles Neighborhood Impact Maps
This legend identifies the Community Planning Areas in the following maps.
Number Community Planning Area 1 Arleta - Pacoima 2 Bel Air - Beverly Crest 3 Boyle Heights 4 Brentwood - Pacific Palisades 5 Canoga Park - Winnetka - Woodland Hills - West Hills 6 Central City 7 Central City North 8 Chatsworth - Porter Ranch 9 Encino - Tarzana
10 Granada Hills - Knollwood 11 Harbor Gateway 12 Hollywood 13 Los Angeles International Airport 14 Mission Hills - Panorama City - North Hills 15 North Hollywood - Valley Village 16 Northeast Los Angeles 17 Northridge 18 Palms - Mar Vista - Del Rey 19 Port of Los Angeles 20 Reseda - West Van Nuys 21 San Pedro 22 Sherman Oaks - Studio City - Toluca Lake - Cahuenga Pass 23 Silver Lake - Echo Park - Elysian Valley 24 South Los Angeles 25 Southeast Los Angeles 26 Sun Valley - La Tuna Canyon 27 Sunland - Tujunga - Lake View Terrace - Shadow Hills - East La Tuna Canyon 28 Sylmar 29 Van Nuys - North Sherman Oaks 30 Venice 31 West Adams - Baldwin Hills - Leimert 32 West Los Angeles 33 Westchester - Playa del Rey 34 Westlake 35 Westwood 36 Wilmington - Harbor City 37 Wilshire
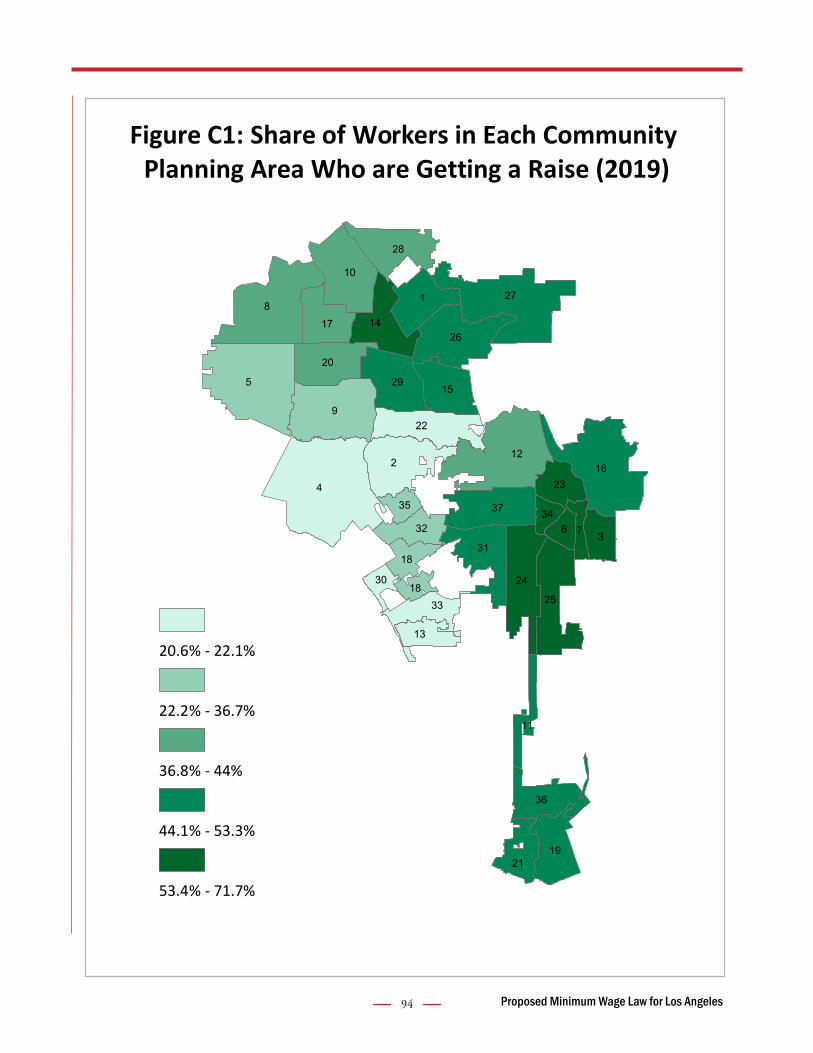
94 Proposed Minimum Wage Law for Los Angeles
4
5
8
9
2
27
1216
1
26
10
24
25
22
37
29
31
28
20
3
14
19
15
36
17
33
21
32
23
6 7
13
18
35
30
34
18
11
Figure C1: Share of Workers in Each Community Planning Area Who are Getting a Raise (2019)
20.6% - 22.1%
22.2% - 36.7%
36.8% - 44%
44.1% - 53.3%
53.4% - 71.7%

95 Proposed Minimum Wage Law for Los Angeles
4
5
8
9
2
27
1216
1
26
10
24
25
22
37
29
31
28
20
3
14
19
15
36
17
33
21
32
23
6 7
13
18
35
30
34
18
11
Figure C2: Distribution of Cumulative Income Increases by Community Planning Area (2019)
0 - 11
12 - 23
24 - 41
42 - 85
86 - 132
$
$
$
$
$
million
million
million
million
million

Institute for Research on Labor and Employmentirle.berkeley.edu
IRLE promotes multidisciplinary research on all aspects of the world of work and conduct numerous outreach programs. Its funding sources include the University of California, research grants and contracts, revenue from programs and publications and contributions from individuals, businesses, unions and community-based organizations.
Center on Wage and Employment Dynamicsirle.berkeley.edu/cwed
CWED was established within IRLE in 2007 to provide a focus for research and policy analysis on wage and employment dynamics in contemporary labor markets.
Center on Wage and Employment DynamicsUniversity of California, Berkeley2521 Channing Way #5555Berkeley, CA 94720-5555(510) 643-8140