The Programme Wide Annual Report 2003/04 - … Report 2003-4.pdf · New Deal for Communities: The...
207
New Deal for Communities: The National Evaluation The Programme Wide Annual Report 2003/04 Centre for Regional Economic and Social Research Sheffield Hallam University June 2004 The views contained in this report do not necessarily reflect those of the Neighbourhood Renewal Unit/Office of the Deputy Prime Minister.
-
Upload
truongtuyen -
Category
Documents
-
view
212 -
download
0
Transcript of The Programme Wide Annual Report 2003/04 - … Report 2003-4.pdf · New Deal for Communities: The...

New Deal for Communities: The National Evaluation
The Programme Wide Annual Report 2003/04
Centre for Regional Economic and Social Research Sheffield Hallam University
June 2004
The views contained in this report do not necessarily reflect those of the Neighbourhood Renewal Unit/Office of the Deputy Prime Minister.
New Deal for Communities: The National Evaluation
Annual Report 2003/4
ACKNOWLEDGEMENTS Thanks are due to the many people living in NDC areas or working for Partnerships or agencies who willingly gave their time to the national evaluation team during 2003/04. Without this assistance it would not have been possible to produce this Annual Report, or the 39 2003/04 Partnership specific reports. Thanks are also due to NRU officers who provided unstinting encouragement and guidance to the national evaluation team, in particular Allan Bowman, Caroline Keightley, David Riley and Gemma Penn. Organisations involved in the evaluation are listed below: Centre for Regional Economic and Social Research, Sheffield Hallam University Rose Ardron, Louise Bailey, Nicola Barraclough, Elaine Batty, Christine Beatty, Emma Bellamy, Jude Bennington, Sarah Blandy, Rionach Casey, Ian Cole, Sarah Corker, Sarah Coward, Tim Fordham, Steve Green, Mike Grimsley, Melanie Hall, Mary Hart, Paul Hickman, Rob Macmillan, Emma MacCoulough, Lisa Jones, Roy Jones, Paul Lawless, Julie Manning, Fran Marshall, Sarah Pearson, Kesia Reeve, David Robinson, Peter Wells, Sue Whittle Cambridge Economic Associates Hugh Begg, Angela Brennan, Steve Stevens, Peter Tyler, Colin Warnock Centre for Urban Policy Studies, University of Manchester Mark Baker, Michael Bradford, Noel Castree, Iain Deas, Kitty Lymperopoulou, Brian Robson, Fiona Smythe Cities Research Centre, University of the West of England Joanne Howard, Eileen Lepine, Ian Smith, Murray Stewart European Institute of Urban Affairs, Liverpool John Moores University Richard Evans, Craig Johnstone, Richard Meegan, Hilary Russell GFA Consulting Michael Beaman, Beverley Cook, Geoff Fordham, Shawn Fraser, Andrew Harrison, Rachael Knight-Fordham, Pete Richards, Chris Shellard Global Urban Research Unit, University of Newcastle upon Tyne Jon Coaffee, Lorna Dargan, Rose Gilroy Institute of Education, University of London Carol Campbell, David Gillborn, Alison Kirton, Marie Lall, Louise Morley, Claudine Rausch, John Hall Local Government Centre & Institute for Employment Research, University of Warwick Jonathan Davies, Crispian Fuller, Mike Geddes, Anne Green MORI/NOP Andy Cubie, Bobby Duffy, Patrick Fraser, Leon Page, David Peckham, Rachel Williams Northern Crime Consortium Sue Adamson, Kate Bowers, Kris Christmann, Norman Davidson, Alex Hirschfield, Shane Johnson, Ken Pease, Michelle Rogerson, Helen Selby Policy Research Institute, Leeds Metropolitan University Tim Bickerstaffe, Alison Darlow, Dave Devins, Lynne Dowson, Sally Halliday, Suzanne Hanson, Murray Hawtin, Ian Sanderson, Fiona Walton, Penny Wymer

New Deal for Communities: The National Evaluation
Annual Report 2003/4
School of Health and Related Research, University of Sheffield Lindsay Blank, Elizabeth Ellis, Liddy Goyder, Jean Peters Social Disadvantage Research Centre, University of Oxford Chelsie Antilla, Ilaria Covizzi, Chris Dibben, David McLennan, Michael Noble, George Smith, Asghar Zaidi Segal Quince Wicksteed Limited (SQW) Anita Bennett, Paul Convery, Charlotte Dent, Lisa McCrindle, Graham Thom, Tim Thorlby, Robert Turner, Geoff White Sustainable Cities Research Institute, Northumbria University Gill Davidson, Lynne Dobbs, Craig Moore, Fred Robinson, Keith Shaw This Report pulls together findings from across all of the evaluation tasks undertaken to date. Those primarily responsible for this Report include Peter Tyler and colleagues in CEA (Chapter 3), Murray Stewart and Joanna Howard in the Cities Research Centre (Chapter 8) and the following in CRESR: Rose Ardron, Louise Bailey, Nicola Barraclough, Elaine Batty, Christina Beatty, Mike Grimsley, Melanie Hall, Mary Hart, Lisa Jones, Roy Jones, Julie Manning, Fran Marshall, Sarah Pearson. Geoff Fordham (GFA Consulting) provided invaluable advice throughout. Paul Lawless CRESR Sheffield Hallam University April 2004 http://ndcevaluation.adc.shu.ac.uk/ndcevaluation/Home.asp
New Deal for Communities: The National Evaluation
Annual Report 2003/4
CONTENTS
EXECUTIVE SUMMARY ....................................................................................................... I
CHAPTER 1: INTRODUCTION ............................................................................................ 1
Evaluation Tasks And Outputs .............................................................................................. 1 Relationship To The Programme Wide Report 2002/03 And The 2005 Interim Evaluation.... 3 The Evaluation 2001-2005: Remaining Tasks....................................................................... 4 Structure To This Report....................................................................................................... 4
CHAPTER 2: NDC CHANGE DATA..................................................................................... 5
Introduction ........................................................................................................................... 5 Worklessness ....................................................................................................................... 5 Transitions From Worklessness .......................................................................................... 19 Education............................................................................................................................ 25 House Prices In NDC Areas: 2001 To 2002 ........................................................................ 28 Health ................................................................................................................................. 29 Conclusions ........................................................................................................................ 34
CHAPTER 3: VALUE FOR MONEY: EARLY FINDINGS ................................................... 35
Introduction ......................................................................................................................... 35 Early Evidence: The Project Level....................................................................................... 35 NDC Expenditure, Matched Funding And Outputs For The NDC Programme..................... 39 Next Steps In 2004/05......................................................................................................... 49
CHAPTER 4: DELIVERING CHANGE................................................................................ 50
Introduction ......................................................................................................................... 50 Factors Assisting And Constraining Delivery 2003/04 ......................................................... 50 Factors Affecting Delivery: Programme Level Change 2003/04 compared with 2002/03..... 59 Delivery Across The Five Outcome Areas........................................................................... 60
CHAPTER 5: NDC BOARD OPERATIONS ....................................................................... 68
Introduction ......................................................................................................................... 68 Elections ............................................................................................................................. 68 Membership ........................................................................................................................ 73 Roles And Responsibilities.................................................................................................. 86 Skills and Development....................................................................................................... 88 Legal Status........................................................................................................................ 91 Strategy And Forward Planning .......................................................................................... 92 Board Operations: Change 2002/03 To 2003/04................................................................. 92
CHAPTER 6: NDC PROGRAMME TEAMS: STAFFING, SYSTEMS AND AGENDAS...... 94
Introduction ......................................................................................................................... 94 Staffing And Human Resources .......................................................................................... 94 Management Systems ...................................................................................................... 103 Local Evaluation................................................................................................................ 107 Equalities And Diversity .................................................................................................... 110
CHAPTER 7: NDCS AND LOCAL COMMUNITIES.......................................................... 112
Introduction ....................................................................................................................... 112 Community Engagement In NDC Partnerships: 2003/04................................................... 112 Tensions In, And Barriers To, Community Involvement..................................................... 115 Involving BME Communities ............................................................................................. 117 Community Attitudes And Aspirations ............................................................................... 121

New Deal for Communities: The National Evaluation
Annual Report 2003/4
CHAPTER 8: MAINSTREAMING ..................................................................................... 128
Introduction ....................................................................................................................... 128 Organisational Engagement.............................................................................................. 129 Resource Management..................................................................................................... 140 Reshaping Mainstream Service Areas .............................................................................. 143 Learning For Sustainability................................................................................................ 162 Barriers And Drivers.......................................................................................................... 163
CHAPTER 9: NDC PARTNERSHIPS: EFFECTIVENESS IN DELIVERY......................... 167
Introduction ....................................................................................................................... 167 Partnership Effectiveness ................................................................................................. 167 Effectiveness and Worklessness....................................................................................... 187

New Deal for Communities: The National Evaluation
Annual Report 2003/4 i
EXECUTIVE SUMMARY
THE NDC PROGRAMME 2003/04: AN OVERVIEW This is a bridging report between the 2002/03 baseline (NRU Research Report No 7: NDC Programme Wide Report 2002/03) and the Interim Evaluation due summer 2005. As yet there is very little change data. However initial findings from the 2004 household survey will become available by November 2004, results from which will be of considerable value:
• They will provide in depth data in relation to three critical groups: those who stay, those who move in, and those who leave; attempts will be made to follow up a proportion of this last group.
• It seems probable that changes in (intermediate) outcomes are most likely to occur in the 2002-04 period in relation to attitudinal/behavioural considerations, such as knowledge, of and trust in, the NDC, fear of crime, etc; these changes will only be picked up via household surveys.
• It has not always been possible to indicate with any confidence what does 'work and why'; from early 2005 onwards there will be much more evidence about what has worked.
Three overarching Programme wide comments for 2003/04 should be made at the outset:
• 2003/04 was a year of consolidation for many Partnerships; it is often difficult to isolate significant changes at the individual NDC level compared with what emerged during 2002/03.
• Not surprisingly therefore Programme wide findings for 2003/04 show remarkable similarities with those which the national evaluation team highlighted for 2002/03.
• And where administrative change data is available for the 2001-03 period (see Chapter 2) it does not consistently suggest that Partnerships were then performing better, or worse, than their parent local authorities; bearing in mind the 'getting going' tasks and problems facing many NDCs in these early years, and the 10 year nature of the Programme, this is not surprising.
NDC Partnerships: Boards Staffing and Systems Whilst inevitably there are variations in structures and ways of working across 39 Partnerships, there is some limited evidence that, there was a closing of the gap between the 'best' and 'worst' Partnerships during 2003/04. Although a handful of Partnerships have experienced considerable upheaval, the view across the Programme is of stability and consolidation, with little in the way of substantial change in Boards, Partnership structures or systems.
Boards There is a sense that many Boards have matured through time. Around three quarters have majority resident representation and there is evidence of improvements in relation to the development of skills and clarity in relation to member roles and responsibilities. A number of NDCs have introduced more formal governance arrangements, including terms of reference and constitutions. Despite improvements in relation to skill levels, however, there is also evidence that resident Board members in particular (although not exclusively) need additional support to acquire an
New Deal for Communities: The National Evaluation
Annual Report 2003/4 ii
increasingly sophisticated range of skills through which to devise and evaluate local programmes. Some Boards still struggle to address strategic issues and agendas can be dominated by detail and personal concerns. Quite the biggest criticism in relation to Boards is the time commitment required of members.
Staffing Difficulties in relation to the recruitment and retention of skilled staff remains the key barrier to effective delivery. More than two-thirds of NDCs report difficulties in staff recruitment and most have skill gaps, particularly at more senior management levels. This undoubtedly reflects a national shortage of regeneration and renewal professionals, but may also be exacerbated where NDCs are keen to recruit local residents. Staffing issues also extend to projects, where the short term nature of funding has resulted in difficulties recruiting staff with appropriate skills. There is some evidence of a transition from Partnerships using secondees and consultants to having employed status staff teams. The role of the Chief Executive remains critical to effective functioning. Strong leadership impacts positively on performance but, change in, or an inability to recruit, a Chief Executive commonly has an unfortunate effect, contributing to a sense of uncertainty and insecurity. There is evidence that lack of a Chief Executive is associated with underspend.
Systems Although there is evidence of some improvements in relation to NDC systems, the rate of positive change is slowing down. Indeed assessments of Partnership systems is the only instance where observers are less enthusiastic in 2003/04 than they were in 2002/03. As the Programme progresses, there may be a need for more sophisticated systems to keep pace with, and to support, an increased level of delivery.
Programmes: Management, Projects and Progress Programme Management There are signs of improvements in relation to programme management including evidence that NDCs are now delivering a wide range of projects. Nevertheless, programme management and delivery skills are not always evident. Particular concerns in some Partnerships include limited connections between strategic priorities and projects; inadequate linkages across different themes and projects; weak procedures for risk assessment, and an associated lack of contingency planning; and limited project development and management skills, particularly in relation to larger capital projects.
Projects and Spend Case study project evaluations in all 39 NDCs suggest that many Partnerships are implementing projects that, as far as current evidence suggests, appear to be relatively well grounded in the available evidence base. Some projects reflect new and innovative ways of working with stakeholders, and there are promising indications that project implementation is based on, and in turns encourages, the involvement of mainstream agencies. Nevertheless, in almost half of these 39 projects, arrangements for continuation funding has not been considered in any detail, and more than one third anticipate a continued reliance on discretionary funding. In only a third of cases is the potential for mainstreaming considered a realistic option after NDC funding has ceased. There are obvious implications here for the long term sustainability of initiatives which NDCs are implementing. Not
New Deal for Communities: The National Evaluation
Annual Report 2003/4 iii
surprisingly an assessment of these 39 projects points to lower leverage ratios (NDC investment to all other sources of income) than applied, for instance, to SRB. The evaluation team has been able to classify by theme about £160 million of 2002/3 NDC spend, more than 90% of the total. This is a substantial increase on the £80m or so for 2001/02, of which it was then possible to classify by theme about £50m. As was the case in 2001/02, more was committed in 2002/03 to the four themes of housing and the physical environment, community development, education, and worklessness and relatively less to health or community safety. This scale of investment is unlikely to address some key outcome targets. For instance reducing levels of worklessness in all NDC areas to those of their parent authorities will require the creation of probably at least 40,000 jobs over 10 years. A relatively modest job creation figure of £20,000, suggest that of the order of £1bn needs to be spent over 10 years to achieve this one outcome. Early evidence suggests that statistically significant relationships exist between effectiveness as measured by spend and several variables: for example there is a negative relationship with the loss of a Chief Executive, and a positive relationship with NDC staff and Board members being on other renewal or regeneration forums
Progress in Relation to the Five Key Themes Progress within housing and physical environment continues to present significant challenges for most NDCs. As a consequence, much of the activity in this theme has concentrated on projects addressing the 'liveability' agenda: environmental improvements, changes to refuse collection services, street cleaning, neighbourhood wardens, etc. These projects provide evidence of 'quick wins' and are often assessed in a positive light by local NDC residents. Major housing capital schemes often pose problems because key decisions can be beyond the control of NDC Partnerships. Activity within the worklessness theme has tended to focus on 'softer' issues such as job brokerage and the delivery of training, where initiatives often involve close partnership with Jobcentre Plus and other labour market and economic development agencies. There is less evidence of progress in relation to job creation and, especially, business development. Links between NDC areas and nearby economic development opportunities are not always exploited. However, early evidence suggests that almost 1,800 job opportunities have been created through NDC project activity, and many of these are likely to have been taken up by local residents. Improved relationships with PCTs have facilitated progress within health. It is likely that in many NDCs major health projects, such as Healthy Living Centres, will come on line in the next year or so. There can however be a tendency to assume that once such a Centre is on stream 'health is done', a somewhat naive assumption reflecting a more general concern that for many NDCs, health remains the most difficult of the main outcome areas with which to engage. Many NDCs report reductions in crime levels although there is, as yet, no robust data by which to substantiate these claims. Nevertheless, in focus groups, residents are more aware of NDC activity in relation to crime and community safety than any other outcome area. Visible crime projects tend to attract positive comment from participants. Security improvements to homes, target hardening and CCTV installations have been commonly introduced by NDCs, and these, alongside improvements to community policing and the introduction of street wardens have contributed in many cases to residents feeling more secure in NDC neighbourhoods. Neighbourhood wardens in particular receive very favourable comments. Results from the 2004 MORI/NOP household survey will provide 2002-2004 change data in relation to perceptions and experiences of crime.

New Deal for Communities: The National Evaluation
Annual Report 2003/4 iv
In relation to education, NDCs have sometimes struggled to engage with local schools, often because of complications relating to local management arrangements. However, there is evidence that NDCs have increased levels of activity in relation to early years education and a number have instigated joint initiatives with Sure Starts and/or local primary schools. There is less evidence of activity in relation to adult education provision, and few NDCs are addressing higher education issues.
Working with Other Communities and Agencies Partnership working, with communities and other agencies, remains a cornerstone of NDC. All Partnerships have devoted considerable effort and resource to establishing relationships with a wide range of key stakeholders and there are numerous examples of effective, and innovative, practice.
Communities Across the Programme, there has been increased community involvement in planning and decision making, membership of NDC forums, and project design and development. Rather less progress has been made in terms of community engagement in project monitoring, appraisal and evaluation. But tensions in, or barriers to, community engagement remain including burn out of community champions, a sense amongst local residents that little is happening on the ground in some NDC areas, lack of an existing community infrastructure, and a continuing tendency to equate the 'local community' with residents to the neglect of business and voluntary groups. BME groups, in line with the community as a whole, tend to be more engaged in issues such as project design and development, rather than in project monitoring, appraisal or evaluation. In November 2002 10 Boards had a higher proportion of BME members than local BME populations would suggest, and 26 a lower proportion. Those figures had improved to 15 and 23 respectively by November 2003. Nevertheless, specific difficulties can arise for NDCs because of, say, the dispersed and diffuse nature of BME groups in some areas. Community cohesion can be weakened as a result of a sudden influx of asylum seekers. Few NDCs have succeeded in mainstreaming equalities issues as whole, there being little mention, for instance, of disability.
Agencies NDCs continue to be characterised by generally positive relationships with a wide range of mainstream agencies of which, across the Programme, the police and PCTs tend still to be seen in a more positive light than other agencies. Relationships with local authorities remain mixed. Some NDCs enjoy high level local authority representation on Boards and productive delivery arrangements with front line service managers. For others, relationships are characterised by tension, disagreements over accountable body arrangements, and inadequate support from local authorities at the strategic level. In some cases these difficulties are impacting negatively on delivery. Anecdotally there is, however, evidence that relationships with local councils appear to have improved in some cases. This is important since their local authority remains quite the most important agency with which NDCs have to engage because of council controlled or influenced mainstream services, potential political support, and a possible facilitating role in embedding NDCs in wider forums. Local authorities are almost always too the accountable body. As was the case in 2002/03, relationships of any kind appear relatively weak with some council departments, notably social services, and with district or regional wide labour market or economic development agencies such as Connexions or LSCs.

New Deal for Communities: The National Evaluation
Annual Report 2003/4 v
There is only limited evidence that NDCs integrate into wider neighbourhood renewal strategies or are making effective links with regional developments. Some NDCs do not liaise successfully with LSPs and few have established relationships with RDAs.
Mainstreaming As was the case in 2002/03, there is mixed experience in relation to mainstreaming. There are numerous examples of jointly funded projects and a sense too that many in NDCs and associated mainstream agencies are increasingly committed to resourcing and reshaping mainstream services. However:
• There is still considerable confusion about definitions.
• There is little attempt to 'map' mainstream investment into NDC areas, an exercise which is widely regarded as futile.
• Agencies report problems in improving their service delivery to NDCs, notably because of limited resources and the competing demands of other renewal partnerships.
• There is little in the way of learning from good examples.
Progress Towards Outcomes Whilst there is little robust evidence on which to assess progress against outcomes there are, at this stage, grounds for cautious optimism. Many NDCs themselves report reductions in crime levels. In addition more reliable secondary and administrative change data is now becoming available, especially with regard to worklessness, mainly for the period 2001 to 2003. In some respects NDCs are outperforming their local authorities, for instance in relation to rates and numbers of workless people. But in other respects they are doing less well, for instance exit rates from Incapacity Benefit (IB) and Severe Disability Allowance (SDA).
CHAPTER 1: INTRODUCTION This is the second Programme Wide Report produced by the national evaluation team. It is best seen as bridging the baseline 2002/03 Report (NRU Research Report No 7) and the Interim Evaluation due summer 2005, which will round off this first 2001-2005 phase of the evaluation. NDC remains quite the most important mechanism through which to address the most critical gap in our knowledge about neighbourhood renewal: what are the relationships between locality based interventions and longer term outcomes in areas such as worklessness, health, crime, education and housing? This report is primarily based on:
• The 39 2003/04 reports one for each Partnership.
• A comparison of these Partnership level findings with those for 2002/03.
• 39 project case studies evaluations, one in each Partnership.
• Work in 6 case study NDCs.
• And a limited, and as yet largely inconclusive, body of administrative data indicating change in NDC areas between about 2001 and early 2003.
A number of key tasks will be carried out in the remaining period of this 2001 to 2005 phase of the evaluation:
New Deal for Communities: The National Evaluation
Annual Report 2003/4 vi
• The 2004 MORI/NOP household survey.
• Collation and analysis of additional administrative change data.
• Two further sets of 39 Partnership Reports - a 'process' Report to be produced in November 2004 and a final overview report in spring 2005, tailored to the needs of each NDC and incorporating Partnership level change data.
• And the final Programme Wide Interim Report.
CHAPTER 2: NDC CHANGE DATA From autumn 2003 the evaluation team began to pick up administrative data which identified changes in NDC areas, usually between 2001 and 2002. An initial trawl of this first substantial portfolio of change data justifies a degree of cautious optimism. For some indicators virtually half or a majority of NDCs appeared to be outperforming their local authority in the period 2001 to 2002/03. This is true for:
• Rates and numbers of workless people.
• Rates of unemployment.
• Exit rates from Job Seekers Allowance (JSA).
• And, when contrasted with appropriate national averages, both comparative illness and comparative mortality.
In some instances, however, less than half of NDCs were outperforming their local authority:
• Residents with work limiting illness.
• Numbers of unemployed.
• Exit rates from IB/SDA.
• Change in staying on rates for pupils aged 17+.
There are some marked regional variations. The London NDCs for instance are characterised by higher house prices, and lower rates of illness and mortality; but they generally perform relatively less well in relation to labour market indicators. Worklessness data also provides an opportunity to compare relative change between 1999 to 2001 with that occurring between 2001 and 2002/03. This is especially useful in that 2001 can be seen as a baseline year for many NDCs. When comparing the two periods, more NDCs outperformed their parent authorities during 2001-2002/03 than had been the case in 1999-2001 in relation to:
• Numbers of residents with work limiting illness.
• Number of workless.
• JSA exit rates.
• IB/SDA exit rates.
But more NDC areas outperformed their parent authorities during 1999-2001 when compared with 2001-2002/03 with regard to:
• Rates of residents with work limiting illness.
• Rates of worklessness.

New Deal for Communities: The National Evaluation
Annual Report 2003/4 vii
• Number of unemployed.
• Unemployment rates.
CHAPTER 3: VALUE FOR MONEY: EARLY FINDINGS During 2003/04 the evaluation team, was able to assess in detail 39 case study project evaluations, one from each Partnership. Headline findings include:
• Projects appear generally to be well thought out in terms of using the available evidence base.
• About 40% of projects have a BME dimension to them.
• A number mention that necessary collaborative working is a novelty in their area, which possibly suggests that project implementation is enhancing the involvement of mainstream agencies; on the other hand almost a half have no firm view on how they might be funded post NDC.
• In 85% of cases, funding has been required for staffing, in 40% the purchase of equipment, and in 38% for accommodation costs.
• The average duration of these 39 projects is about three and half years and they employ about 4.7 people.
• About 60% are to be delivered by either public agencies or NDCs themselves.
• Factors which appear to encourage delivery include: developing robust delivery systems, being able to adjust to changing circumstances, maximising synergies with other partners, community involvement, and recognising the critical role played by key staff.
In relation to Programme wide expenditure and outputs for 2002/03 information from all 39 Partnerships suggests that:
• Around 2,068 projects were supported by about £161m NDC expenditure, associated other public sector investment of about £64m, £13m from the private sector and smaller contributions from the voluntary sector and elsewhere; average expenditure from all sources for these projects is about £104k. Average leverage ratios are about 0.55 but education is higher at about 0.94.
• 14 NDCs were able to comment on BME, as a percentage of total outputs: job creation is relatively low at 14% of outputs but the figure rises to over 30% in relation to residents accessing training, support for voluntary and community organisations, and people provided with information.
• Gross additionality is highest for worklessness projects (95%) and lowest in relation to housing and the physical environment (54%); displacement of activity within NDC areas is likely to be very low.
• An early estimation of net outputs suggests that for every £20k of public sector funding associated benefits include 0.3 jobs created/safeguarded, 7.7 pupils benefiting from school based projects, 6.7 from community safety schemes, 11 from personal development initiatives, and 8.5 from advice and guidance.
CHAPTER 4: DELIVERING CHANGE Factors which assisted delivery in 2002/03 did so again in 2003/04. The only exception is commitment to mainstreaming from stakeholder agencies, which received a marginally positive score in 2002/03 and a marginally negative score in 2003/04. Overall, most factors assist rather than constrain delivery. Nevertheless, Partnerships identify a number of factors
New Deal for Communities: The National Evaluation
Annual Report 2003/4 viii
as being relatively less helpful in 2003/04 than was the case in 2002/03: support from GOs and the NRU; partnership working; original delivery plans and internal evaluation activities. Factors identified as being more helpful in 2003/04 than in 2002/03 are community involvement; support from neighbourhood Renewal Advisors (NRAs); non-NDC policy initiatives; quality of local data; and design/implementation of projects. Factors identified as particularly assisting delivery are:
• Community involvement in planning and/or delivery.
• Support from GOs/ NRAs and the NRU.
• Partnership working.
Those issues which are seen as less likely to assist delivery include
• Staffing issues, which remains quite the most important impediment to delivery.
• Commitment to mainstreaming on the part of key agencies.
• Internal management/financial systems.
The 10 most frequently mentioned action points for individual Partnerships identified by the national evaluation's 39 teams relate to:
• Staffing and training (mentioned in 26 Partnership Reports).
• Project development (24).
• Links with agencies (23).
• Research, monitoring and evaluation (23).
• Equalities agendas (22).
• Resident/community involvement (22).
• Dissemination and promotion (21).
• Issues to do with the operation of the Board (20).
• Mainstreaming (20).
• Structures and processes (19).
The national evaluation's five theme teams collectively each year produce about 20 outputs reflecting policy and practice in relation to a series of issues. The key policy considerations emerging from the theme team outputs to date include:
• Problems relating to all aspects of staffing.
• Building successful links with partner agencies.
• Linking into wider policy agendas.
• The need to develop appropriate data exploitation and management information systems.
• The benefits and complexities of working with local residents.
CHAPTER 5: NDC BOARD OPERATIONS In relation to elections:
• Most NDC resident members are on Boards as a result of community elections, many of which are carried out by postal ballot.

New Deal for Communities: The National Evaluation
Annual Report 2003/4 ix
• Benefits ostensibly arising from elections including raising confidence and demonstrating accountability.
• However, there is also evidence that elections can prove costly and, time consuming and may result in some disruption of Board activities.
In terms of Board membership:
• There has been little change in Board sizes or membership across the Programme, although representation from residents, BME groups and agencies has tended marginally to increase.
• Most Boards consist of between 15 and 30 people; about 20% of representatives are from BME communities; about 40% are women; most are aged between 25 and 39; and the average time for Board membership is about a year and a half.
• 27 Partnership Boards have a resident majority; this is ostensibly slightly fewer than the 36 indicated in the 2002/03 Annual Report; this is due to complexities in recording a 'resident'.
• A wide range of agencies continue to be represented on NDC Boards. As was the case in 2002/03, local authorities, police authorities and PCTs are most commonly represented. There is less evidence of engagement on the part of other organisations such as social services departments or Connexions.
• 13 Partnerships experienced a change in the Chair of the Board during 2003/04 and 12 in Chief Executive. In six both changed.
• There may be scope for greater use of independent Chairs and directors.
In relation to Board roles and responsibilities:
• Board structures and processes have matured over time.
• There is evidence of improvement in relation to the clarity of Board member roles and responsibilities and development of skills.
• The biggest single criticism in relation to Board operations is the time commitment required as a result of involvement.
In relation to legal status
• Most NDCs either do not have a specific legal status or are companies limited by guarantee; 7 changed their legal status in the year prior to November 2003; none changed their accountable body.
In terms of strategic development
• Boards are beginning to address strategic and forward planning issues.
• There is scope for an increased focus on linking projects into wider, long-term strategies.
• Particular issues surround the identification of plausible outcomes, ensuring long term sustainability, the merits of developing an asset base, and exit strategies.
CHAPTER 6: NDC PROGRAMME TEAMS: STAFFING, SYSTEMS AND AGENDAS In relation to staffing:

New Deal for Communities: The National Evaluation
Annual Report 2003/4 x
• Across the Programme about 500 FTEs are employed out of the Management and Administration Budget; about 190 left in the 12 months prior to November 2003.
• Some 60% of employees are female and about a quarter live in the NDC area.
• Only a handful lose more than a third of staff each year; most employ people living in the area; most use a mixture of staff, secondees and consultants to deliver projects; most use consultants to undertake evaluation; and most employ temporary staff.
In relation to systems:
• Most Partnerships rate their systems as performing 'OK' in 2003/04. A majority identify improvements since 2002/03.
In terms of local evaluation:
• Across virtually all indicators, the position in 2003/04 improved compared with 12 months previously; in some instances such as carrying out an interim evaluation or evaluation altering projects, these improvements are considerable.
• Some themes remain relatively underdeveloped, such as the impact of projects on BME communities.
In relation to equalities and diversities:
• Most Partnerships look at the equalities implications of their strategies and projects; there is relatively less going on with regard to training for both staff and Board members on equalities issues.
• At least three-quarters of NDCs are developing, or have, some form of Race Equalities Strategy, although some are finding problems in so doing; there are numerous examples of NDCs supporting projects designed to bring benefits for BME communities and of providing race awareness training for staff and Board members.
• Across the Programme there is relatively more interest in race equalities than is true for gender and, especially, disability.
CHAPTER 7: NDCS AND LOCAL COMMUNITIES NDC Partnerships continue to place a strong emphasis on community engagement. Local residents are more involved in some tasks such as planning and decision making, membership of NDC forums, and project design and development, than others, such as project monitoring, appraisal and evaluation. Programme teams are generally more positive about the scale of community engagement than are either members of the Board or agencies involved in NDCs. There are numerous examples of Partnerships effecting or supporting initiatives designed to engage with, inform, or gain perspectives from, community groups. But there are tensions in, or barriers to, community engagement including:
• Burn out of community champions.
• A sense amongst some local residents that little is happening on the ground in some NDC areas.
• Lack of an existing community infrastructure in some localities.
New Deal for Communities: The National Evaluation
Annual Report 2003/4 xi
• A continuing tendency to equate the 'local community' with residents to the relative neglect of business and voluntary groups.
• A wide range of groups is seen as in some way 'hard to reach'.
The scale and scope of BME involvement in the Programme largely mirrors that for communities as whole. All three key constituencies, Board members, programme teams and agencies indicate that BME groups are more involved in areas such as planning and decision making, NDC forums, and project design and implementation, rather than in tasks such as project appraisal and monitoring. Partnerships have implemented a wide range of initiatives designed to involve and benefit different BME groups. But Partnerships can run into barriers:
• The dispersed and diverse nature of BME communities in some NDC areas.
• Questions relating to the legal status of some communities and individuals.
• The importance for all of those associated with NDCs to be sensitive to the needs of different BME communities.
A number of the 39 Partnership reports refer to community cohesion issues. Not surprisingly different perspectives emerge across the Programme, including evidence that diverse communities appear to get on reasonably well in London. Several respondents point to the vital importance of effective local communication programmes in strategies designed to foster community cohesion.
CHAPTER 8: MAINSTREAMING There remain mixed understandings and interpretations of 'mainstreaming' creating a continuing lack of clarity over the extent to which it is occurring. Mainstreaming is still widely seen as finding the resources to make sure NDC projects continue. Approaches to mainstreaming are generally ad hoc, with commitment often operational rather than strategic. In some cases this stems from the absence of senior level representation from main programme stakeholders. Agencies are well represented in NDC structures and vice versa, with health, police, housing and education increasingly visible and active. Jobcentre Plus has had resources to become engaged; other economic stakeholders are less visible or active. Relationships with, and engagement of, local authorities are increasing and improving; there is now more reliance on authorities and agencies delivering projects rather than NDCs running their own projects; this helps to build understanding of, and create commitment to, the reshaping of main programmes. The development of decentralised local government structures offers an area-based level down to which agencies can reach, and up to which NDCs can connect. Such structures provide the potential for real progress in reshaping main programme services. There is little attempt systematically to map spending; many NDCs regard it as a waste of time. SLAs and other agreements allow Partnerships to be clearer about what is to be done in the NDC area, but the growing relationship between NDCs and main programme agencies highlights the need for more formal specifications of what is expected from the mainstream.

New Deal for Communities: The National Evaluation
Annual Report 2003/4 xii
There is an increasing array of evidence pointing to collaborative planning in relation to programmes, joint projects, shared staff and resources, etc. The engagement of mainstream agencies is on the increase, but remains tentative in a number of policy areas. Barriers to agency engagement include a lack of staff and financial resources, centrally set performance targets, insufficient clarity of role, local politics, and internal NDC processes and procedures. Positive drivers for mainstream change include leadership, commitment and championing, a new maturity both within NDCs and in relationships between NDCs and others, and recognition of the role of professionals and practitioners. There is little evidence of significant learning from the NDC Programme. Activity remains predominantly focussed on project delivery; the role of the NDC as a laboratory for main programmes is scarcely appreciated. On balance there has been significant movement towards main programme engagement in resourcing and reshaping services, but progress remains slow and mixed across NDCs and across outcome areas.
CHAPTER 9: NDC PARTNERSHIPS: EFFECTIVENESS IN DELIVERY Effectiveness can be defined by expenditure (totals for 2001/02 and 2002/03 and forecast spend 2003/04). Both per capita and total expenditure vary across Partnerships: there are at least five-fold variations in both total and per capita expenditure between highest and lowest 'spenders'. Round 1 expenditure per capita patterns are consistently higher than for Round 2 Partnerships.
Statistically significant relationships have been identified, in particular for Round 1 Partnerships, between expenditure and three process variables:
• A loss of a Chief Executive and to a lesser extent a Chair.
• The 'Board Effectiveness Index'.
• And the engagement of Board members and/or NDC staff on other renewal/regeneration forums.
Statistically significant relationships have not as yet been found between expenditure and:
• Agencies being members of NDC Boards.
• The size of Boards; for Round 1 the association is negative: as Board size increases there is some limited evidence to indicate declining spend, but the opposite is the case for Round 2 NDCs.
• The proportion of Boards made up of local residents; but the direction of the relationship is inverse: increasing proportions are associated with lower levels of spend.

New Deal for Communities: The National Evaluation
Annual Report 2003/4 1
CHAPTER 1: INTRODUCTION
1.1. In summer 2001 the Neighbourhood Renewal Unit in the Office of the Deputy Prime Minister, (NRU/ODPM), commissioned a consortium of organisations, headed up by the Centre for Regional Economic and Social Research, (CRESR), at Sheffield Hallam University, to undertake the first phase of a national evaluation of New Deal for Communities (NDC). This phase is to culminate in the production of an Interim Evaluation in summer 2005.
1.2. 17 Pathfinder or Round 1 NDCs were announced in 1998 and a further 22 Round 2
Partnerships the following year. Initial Delivery Plans produced by the 39 secured a £50m grant per NDC, normally to be spent over 10 years. Approximately £2bn has been committed to the Programme as a whole. These 39 NDC Partnerships collectively represent one of the most important area based initiatives (ABIs) ever launched in England. In part this is because the fundamental design of NDC drew heavily on lessons learnt from ABIs implemented in the 1980's and 1990's. In particular:
• NDC intervention is based on a 10 year commitment to the 39 areas: change in these kinds of deprived areas is only likely to occur over a relatively long period of time as the recent 'Tackling Social Exclusion' report makes clear (ODPM; 2004).
• Transformation in NDC neighbourhoods is to be effected by Partnerships consisting of representatives from the local community, key agencies, business, and the voluntary sector.
• Local communities are at the heart of the NDC Programme.
• Problems are to be addressed in an intensive and co-ordinated fashion.
• Partnerships are to address five specific outcome areas: improving education, health, housing and the physical environment, and reducing crime and worklessness.
• And Partnerships are to work with other agencies to improve the delivery of mainstream services into NDC areas.
1.3. The 2001 'Review of the Evidence Base for Regeneration Policy and Practice
(DETR) concluded that one of the major gaps in then current knowledge was reliable research exploring longer term relationships between neighbourhood level intervention and outcomes. Because of the scale of investment and the time horizons involved, the NDC Programme provides an unprecedented opportunity through which to help reduce this gap. In essence NDCs can act 'as a test bed for what does and what does not work in renewal' (ODPM, 2003, Factsheet 9, New Deal for Communities).
1.4. The evidence emerging from the NDC Programme should thus play a key role in
informing the Government's overall neighbourhood renewal strategy which is intended to ensure that within 10 to 20 years no one is seriously disadvantaged by where they live.
EVALUATION TASKS AND OUTPUTS
1.5. The 2002/03 Programme Wide Report contains fuller details of the methods adopted by the evaluation team (NRU/ODPM, 2003, 'Research Report No 7: New Deal for Communities: Annual Report 2002/03': pages 22/23). But in brief, since summer 2001 the national evaluation team has carried out a range of tasks, including:

New Deal for Communities: The National Evaluation
Annual Report 2003/4 2
• An initial Scoping Phase in late 2001 which pulled together evidence from all 39 NDC areas.
• Harmonised Partnership based work involving interviews and other data collection and analysis techniques in all 39 NDCs in both 2002/03 and 2003/04.
• Collating and analysing an increasing array of secondary and administrative data by the Social Disadvantage Research Centre at Oxford.
• A household survey carried out by MORI/NOP in 2002 which involved the successful completion of about 500 questionnaires in each of the 39 NDC areas.
• A continuing programme of data analysis work designed to address key research questions inherent to the evaluation; for further details see 'How the Programme is being evaluated' on the evaluation's web site at:
http://ndcevaluation.adc.shu.ac.uk/ndcevaluation/Home.asp
• In selected NDC areas work exploring emerging policy/practice issues in the main outcome areas of worklessness, health, crime, education, and housing and the physical environment.
• Project level evaluations and Partnership expenditure patterns work carried out by Cambridge Economic Associates.
1.6. Evidence emerging from these, and other, tasks has been disseminated through a
range of outputs:
• 39 Partnership specific reports for both 2002/03 and 2003/04.
• A series of data analysis papers
• Other outputs such as the 2001 Scoping Report and policy papers from the five theme teams which have been made available on the evaluation's website.
• And the 2002/03 Programme Wide Report published by the NRU and available on: http://www.neighbourhood.gov.uk/publicationsdetail.asp?id=548
1.7. This Report represents the second NDC Programme wide output from the national
evaluation team. It draws on various sources of evidence which emerged during 2003/04, notably:
• Qualitative and quantitative data drawn from the second tranche of the 39 Partnership reports (i.e. these for 2003/04).
• Additional Partnership-level work undertaken by the five theme teams.
• Some early, although limited, administrative data indicating change in the 39 NDC areas.
• 39 case study project evaluations, one in each NDC area.
• Work on mainstreaming in 6 NDC case study areas.
Template Data
1.8. Specific mention should be made of evidence drawn from the first of these sources listed in 1.7: the 39 reports for 2003/04. These Reports contain a series of common templates addressing process issues such as community engagement, mainstreaming, constraints on delivery, etc. One reason for adopting this approach is to ensure a degree of standardisation across 39 separate outputs. It is almost certainly the case that no previous ABI evaluation has ever attempted to produce standardised local evaluation reports on such a scale. Considerable benefits flow from this:

New Deal for Communities: The National Evaluation
Annual Report 2003/4 3
• For many templates it is possible to compare results from 2003/04 with those for 2002/03; these comparisons are outlined in later sections of this report.
• As this broad approach is to be adopted in 2004/05, this will then provide the evaluation team with a three year run of template data.
• This will be a critical source of evidence through which to address a key gap in the ABI evidence base: what are the relationships between outcomes and process considerations such as community engagement, robustness of partnership working, mainstreaming, etc?
1.9. However, it is important to identify two potential shortcomings in the use and
interpretation of template data. 1.10. First, evidence to complete the templates is gleaned from a series of semi-structured
interviews with key players in, or associated with, Partnerships. Each of the 39 reports is based on perhaps 20 such interviews, often more. It is not possible to lay down precise guidelines to cover more than 400 interviews across the Programme. There may hence be a degree of inconsistency across the 39 Reports and the templates they contain. What is however relatively comforting is the close fit between Programme wide templates developed from work undertaken in 2003/04 when compared with those for 2002/03. This is readily apparent in relation say to the composition of NDC Boards, discussed in Chapter 5 or factors assisting or constraining delivery, outlined in Chapter 4.
1.11. Second, following feedback from the 39 evaluation teams it became apparent that
one of the assumptions underpinning Partnership-level work in 2002/03 was simply not working. The original idea was that it would make sense to categorise responses into three constituencies: Partnerships, key stakeholder agencies, and other agencies. In practice this distinction did not work. For 2003/04 the decision was made to re-classify constituencies into programme teams, boards and agencies. This has worked better and will be retained for 2004/05. It is still possible, however, to make comparisons between 2002/03 and 2003/04 based on amalgamated composite scores.
RELATIONSHIP TO THE PROGRAMME WIDE REPORT 2002/03 AND THE 2005 INTERIM EVALUATION
1.12. This 2003/04 Report is perhaps best seen as an intermediary bridge, linking the two more substantial Programme wide reports.
1.13. The 2002/03 Programme Wide Report (NRU/ODPM Research Report No 7) is
essentially a base-line pulling together a range of data sources: the 39 Reports, the 2002 household survey, the first set of secondary and administrative data, etc.
1.14. And the Interim Evaluation to be published in 2005 will use the full array of data
sources including three sets of the 39 Partnership reports, the 2002 and 2004 MORI/NOP household surveys, and an increasing portfolio of administrative change data. This evidence will be used to evaluate the programme within the three levels of analysis:
• Level One: what changes occur in NDC areas between 2001/02 and early 2005?
• Level Two: do manifestations of change in NDC areas differ from what is happening elsewhere?

New Deal for Communities: The National Evaluation
Annual Report 2003/4 4
• Level Three: to what extent can any NDC area changes be attributed to NDC Partnerships and/or any other influences?
THE EVALUATION 2001-2005: REMAINING TASKS
1.15. A number of tasks will be undertaken in the remaining 18 months or so of this first phase of the evaluation. These include:
• The third set of 39 Partnership specific reports based on stakeholder interviews.
• A final set of 39 Partnership 'overview reports' based on NDC level change data.
• The 2004 MORI/NOP household survey which, by returning to the same addresses as were visited in 2002, will produce both new cross-sectional data (provided by inmovers) but also longitudinal data (for stayers). Efforts will also be made to trace a proportion of those who left NDCs between 2002 and 2004.
• An increasing array of administrative change data specific to NDC areas; much of this relates to worklessness, but other streams are becoming available in relation to pupil specific educational attainment, incidence of crime, etc.
• Contextualising change in NDCs against a wide range of benchmarks.
• By March 2005, a final tranche of about 20 policy outputs produced by the five theme team to add to the 40 which had been produced by early April 2004.
• And a final pulling together of all process and outcome data into the 2005 Interim Evaluation Report.
STRUCTURE TO THIS REPORT
1.16. This report is structured as follows: Chapter 1 Introduction Chapter 2 NDC Change Data Chapter 3 Value for Money: Early Findings Chapter 4 Delivering Change Chapter 5 NDC Board Operations Chapter 6 NDC Programme Teams: Staffing, Systems and Agendas Chapter 7 NDCs and local communities Chapter 8 Mainstreaming Chapter 9 NDC Partnerships: Effectiveness in Delivery

New Deal for Communities: The National Evaluation
Annual Report 2003/4 5
CHAPTER 2: NDC CHANGE DATA
INTRODUCTION
2.1. This chapter reviews the extent to which change within NDC neighbourhoods can be observed in the period prior to the full establishment of many NDC Partnerships, from 1999 to 2001 and also between 2001 and 2002/03, both in absolute terms and relative to local and national benchmarks. It introduces the data thus far available for analysing change, drawing on the administrative data collated and analysed by the Social Disadvantage Research Centre, at the University of Oxford.
2.2. A number of caveats should be borne in mind:
• Data from different sources are made available at irregular intervals and cover different time periods.
• The collation and analysis of change data is ongoing and more administrative data will become available during this first phase of the evaluation. Administrative data represents one of two key sources of change data in NDC areas, the other being the MORI/NOP Household Survey. The first round of the survey was completed in 2002 and presented in New Deal for Communities Annual Report 2002/03.1 The second round of the survey will be completed in autumn 2004. Data from all sources will inform the 2005 Interim Programme Wide Report.
• At this stage, caution should be exercised in ascribing any changes in the data to Partnership interventions. Much of the analysis presented here reflects change occurring before the activities of many Partnerships could realistically be expected to have a measurable impact. Change should thus not at this stage be attributed to Partnership activity. Rather, the data presented here provide an indication of the trajectory of NDC areas. By 2005 a substantial portfolio of data will be available through which more accurately to address questions of attribution.
WORKLESSNESS
Defining worklessness
2.3. According to the commonly used research definition, set out by the International Labour Organization (ILO), the unemployed are those of working age who are without work, but who are available for, and have actively been seeking employment. The definition of worklessness used in this chapter includes people within the ILO definition who are also eligible for benefits. In addition, the count of workless individuals incorporates those who are without work due to ill health or disability. Thus, the definition used here defines a person as workless if there is evidence from the benefit system that they are involuntarily out of work.
2.4. The two key benefits claimed by people who are involuntarily out of the labour
market are Job Seeker’s Allowance (JSA) and Incapacity Benefit (IB)2. Job Seeker’s Allowance is for people below pensionable age who are unemployed, or who work less than 16 hours per week, and who are actively seeking full-time work. Claimants of JSA are required to ‘sign on’ at a Job Centre Plus fortnightly, where staff
1 Research Report 7: New Deal for Communities – The National Evaluation Annual Report 2002/03.
Neighbourhood Renewal Unit, 2003. See also: http://www.neighbourhood.gov.uk/publicationsdetail.asp?id=548 2 For detailed information on the benefits discussed in this chapter, see the Welfare Benefits and Tax
Credits Handbook 2004/2005 published by the Child Poverty Action Group.

New Deal for Communities: The National Evaluation
Annual Report 2003/4 6
determine whether or not the claimant continues to meet the requirements of the benefit. Incapacity Benefit is paid to people who are incapable of work, usually due to sickness, injury or disability. In addition to IB, Severe Disablement Allowance (SDA) is also paid to some people who are unable to work for the same reasons, with different qualifying rules based on levels of National Insurance contributions. However, SDA has not been available to new claimants since April 2001, and the majority of people currently receiving out-of-work benefits due to sickness, injury or disability claim IB rather than SDA. A relatively smaller number of people continue to claim SDA, and these people are considered in the analyses presented here. Overall, those who unable to work for reasons relating to illness or disability make up a significant proportion of the workless population: in 2001, approximately two-thirds of workless people in England were out of work due to sickness, injury or disability.
2.5. It is also possible, depending on data availability, to include in an analysis of
worklessness those people who are participating in New Deal training schemes, such as New Deal for Young People or New Deal for Lone Parents, thus indicating a desire to return to or enter the labour market. Some of the analysis presented here, especially for the period up to and including 2002, includes these people.
2.6. These benefits and programmes are administered by the Department for Work and
Pensions (DWP). Through agreements covering the confidentiality and use of the data, the DWP allows SDRC access to anonymised benefits data at individual level. These datasets provide the basis for much of the analysis presented here, allowing monitoring of trends and dynamics of worklessness in NDC areas. The major indicators of change available thus far include changes in rates of worklessness due to sickness as well as unemployment and changes in the numbers of workless people, which are unaffected by fluctuations in the underlying population.
2.7. As the evaluation progresses, more worklessness-related data is becoming
available. Newly-negotiated access to a database system established by the DWP for purposes of fraud detection will allow comprehensive analysis of patterns of worklessness in NDC areas. This system, known as GMSONE, keeps a continuous record of all benefit claimants and will allow detailed analysis of geographic migration, transitions in and out of benefit and associations between such migration and transitions and life events, such as illness, the arrival of a child or the establishment or breakdown of a marriage.
Measuring worklessness
2.8. There are several different ways of measuring change in worklessness over time. In this report change is measured as:
• Percentage change
• ‘relevant population’ change i.e. percentage change in numbers affected
2.9. If the change in the rate of, for example, workless adults (16 – 59 year olds) in an
area falls from 25% of the working-age population in 1999 to 20% of the working-age population in 2001, this can be presented as a change of five percentage points. It can also be presented in terms of the change in the relevant population – in this case the workless population, at the two time points. For example if there were 50 workless adults in an area in 1999 and 45 workless adults in 2001, this would represent a 10% fall in the actual numbers of workless adults in that area.

New Deal for Communities: The National Evaluation
Annual Report 2003/4 7
Change in Numbers of Workless People in NDC Areas 2001 to 2003
2.10. Figure 2.1 presents the numbers of people who were workless in each NDC area in 2001. The rest of this section examines changes from this baseline up to 2003.
Figure 2.1: Number of people workless in NDC areas, 2001
0
500
1000
1500
2000
2500
3000
Liv
erp
ool
Hackney
Birm
ingh
am
Ne
wcastle
D
oncaste
r
Kno
wsle
y
B
rad
ford
Manche
ste
r
Brighto
n
Sun
derland
Ha
rtle
pool
Nottin
gh
am
Sheffie
ld
Wolv
erh
am
pto
n
Leic
este
r
S
andw
ell
Ha
ringey
Birm
ingham
KN
Wals
all
Mid
dle
sbro
ugh
O
ldh
am
Coventr
y
Ro
chda
le
Salford
Bre
nt
Ne
wha
m
Derb
y
H
ull
Islin
gto
n
H's
mith &
Fulh
am
Lew
ish
am
Ply
mo
uth
Luto
n
N
orw
ich
S
outh
wark
Sou
tham
pto
n
Bristo
l
T
ow
er
Ham
lets
La
mbe
th
Nu
mb
er
of
peo
ple
wo
rkle
ss i
n 2
001
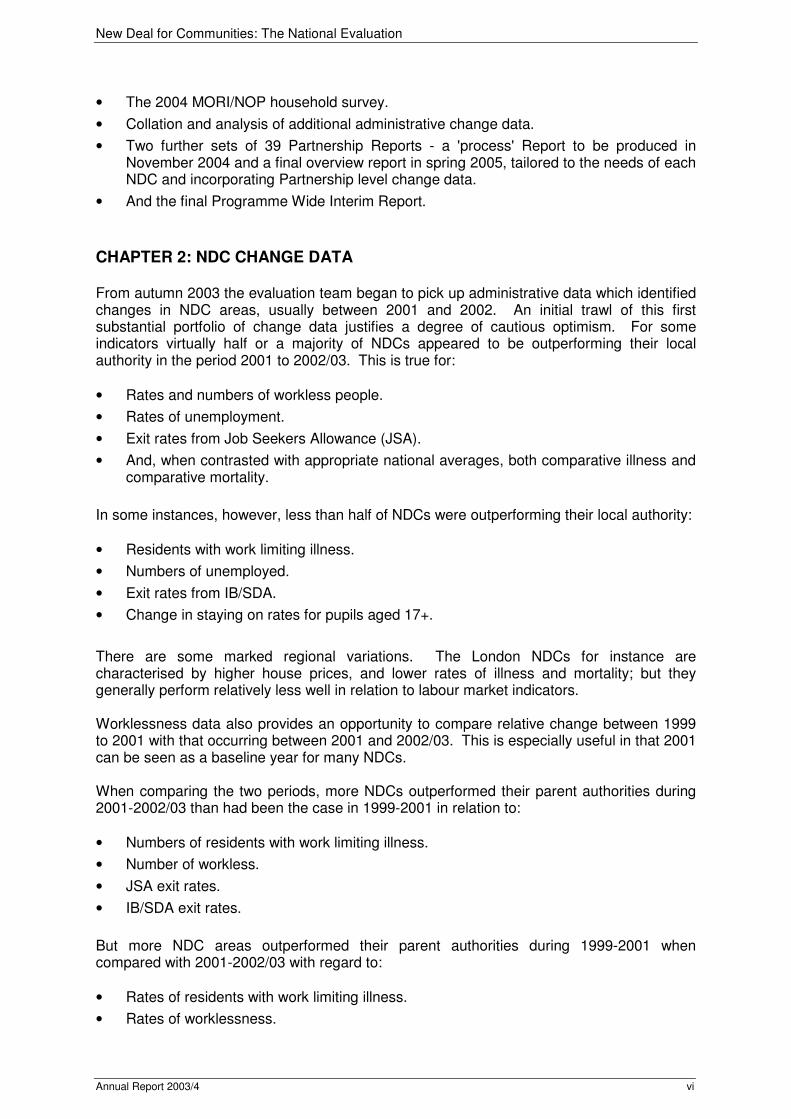
2.11. Figure 2.2 presents the percentage change in numbers of workless residents for
those NDC areas that saw an increase on this measure from 2001 to 2003. During this time period, 21 NDC areas, including all 10 in London, experienced an increase in the numbers of people workless. For 17 of these 21 areas, this increase contrasted with declining numbers of workless people from 1999 to 2001.
Measuring Change Over Time NDC X 1999 2001
Number of workless people 50 45 All adults aged 16-59 200 225 Worklessness rate 25% 20% NDC X shows a change of five percentage points, and a fall of 10% in the actual numbers of workless 16 – 59 year olds
New Deal for Communities: The National Evaluation
Annual Report 2003/4 8
Figure 2.2: NDC areas with an increase in workless people: 2001 to 2003
-30
-25
-20
-15
-10
-5
0
5
10
15
South
am
pto
n
Tow
er
Ham
lets
Islin
gto
n
Lam
beth
Bristo
l
South
wark
Bre
nt
Sunderland
Lew
isham
Luto
n
Hackney
Old
ham
Sandw
ell
H'S
mith &
Fulh
am
Derb
y
Haringey
Birm
ingham
A
Ply
mouth
New
ham
Brighto
n
Mancheste
r
% c
han
ge i
n n
um
bers
wo
rkle
ss
NDC 1999 - 2001 NDC 2001 to 2003 NDC average 1999 - 2001 NDC average 2001 to 2003
Base: 20 partnerships Source: SDRC Note: Worklessness measured here does not include people participating in New Deal programmes.
2.12. The number of workless residents in NDC areas as a whole decreased by 1.9%
between 2001 to 2003 compared with a decrease of less than 0.1% nationally. This compared to a fall of 5.1% in NDC areas as a whole in 1999-2001 and 5.0% nationally, indicating that NDC areas have followed a national trend of a tapering-off in declines in worklessness.
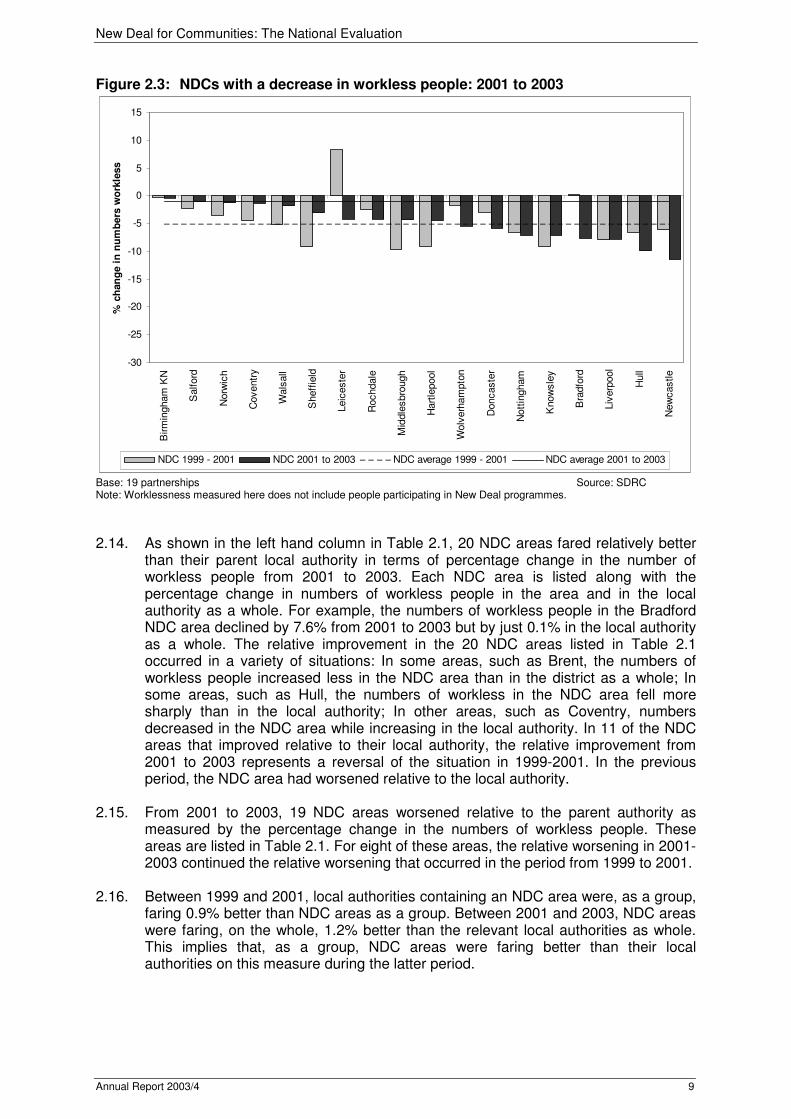
2.13. Figure 2.3 presents the percentage change in numbers of workless residents for
those NDC areas that experienced a decline in the numbers of workless people from 2001 to 2003. The numbers fell in 18 NDC areas. In 16 areas, this decrease represents a continuation of the pattern observed in the period from 1999 to 2001.
New Deal for Communities: The National Evaluation
Annual Report 2003/4 9
Figure 2.3: NDCs with a decrease in workless people: 2001 to 2003
-30
-25
-20
-15
-10
-5
0
5
10
15
Birm
ingham
KN
Salford
Norw
ich
Coventr
y
Wals
all
Sheff
ield
Leic
este
r
Rochdale
Mid
dle
sbro
ugh
Hart
lepool
Wolv
erh
am
pto
n
Doncaste
r
Nott
ingham
Know
sle
y
Bra
dfo
rd
Liv
erp
ool
Hull
New
castle
% c
han
ge i
n n
um
bers
wo
rkle
ss
NDC 1999 - 2001 NDC 2001 to 2003 NDC average 1999 - 2001 NDC average 2001 to 2003
Base: 19 partnerships Source: SDRC Note: Worklessness measured here does not include people participating in New Deal programmes.
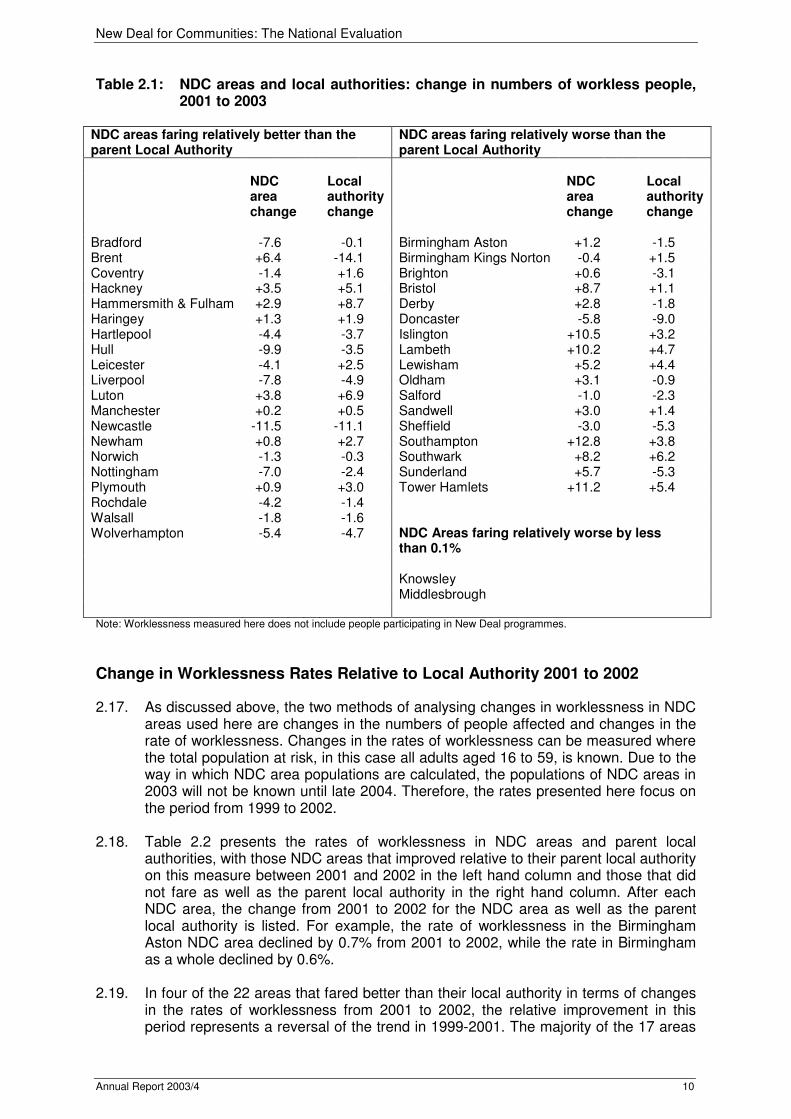
2.14. As shown in the left hand column in Table 2.1, 20 NDC areas fared relatively better
than their parent local authority in terms of percentage change in the number of workless people from 2001 to 2003. Each NDC area is listed along with the percentage change in numbers of workless people in the area and in the local authority as a whole. For example, the numbers of workless people in the Bradford NDC area declined by 7.6% from 2001 to 2003 but by just 0.1% in the local authority as a whole. The relative improvement in the 20 NDC areas listed in Table 2.1 occurred in a variety of situations: In some areas, such as Brent, the numbers of workless people increased less in the NDC area than in the district as a whole; In some areas, such as Hull, the numbers of workless in the NDC area fell more sharply than in the local authority; In other areas, such as Coventry, numbers decreased in the NDC area while increasing in the local authority. In 11 of the NDC areas that improved relative to their local authority, the relative improvement from 2001 to 2003 represents a reversal of the situation in 1999-2001. In the previous period, the NDC area had worsened relative to the local authority.
2.15. From 2001 to 2003, 19 NDC areas worsened relative to the parent authority as
measured by the percentage change in the numbers of workless people. These areas are listed in Table 2.1. For eight of these areas, the relative worsening in 2001-2003 continued the relative worsening that occurred in the period from 1999 to 2001.
2.16. Between 1999 and 2001, local authorities containing an NDC area were, as a group,
faring 0.9% better than NDC areas as a group. Between 2001 and 2003, NDC areas were faring, on the whole, 1.2% better than the relevant local authorities as whole. This implies that, as a group, NDC areas were faring better than their local authorities on this measure during the latter period.
New Deal for Communities: The National Evaluation
Annual Report 2003/4 10
Table 2.1: NDC areas and local authorities: change in numbers of workless people, 2001 to 2003
NDC areas faring relatively better than the parent Local Authority
NDC areas faring relatively worse than the parent Local Authority
NDC
area change
Local authority change
NDC area change
Local authority change
Bradford -7.6 -0.1 Birmingham Aston +1.2 -1.5 Brent +6.4 -14.1 Birmingham Kings Norton -0.4 +1.5 Coventry -1.4 +1.6 Brighton +0.6 -3.1 Hackney +3.5 +5.1 Bristol +8.7 +1.1 Hammersmith & Fulham +2.9 +8.7 Derby +2.8 -1.8 Haringey +1.3 +1.9 Doncaster -5.8 -9.0 Hartlepool -4.4 -3.7 Islington +10.5 +3.2 Hull -9.9 -3.5 Lambeth +10.2 +4.7 Leicester -4.1 +2.5 Lewisham +5.2 +4.4 Liverpool -7.8 -4.9 Oldham +3.1 -0.9 Luton +3.8 +6.9 Salford -1.0 -2.3 Manchester +0.2 +0.5 Sandwell +3.0 +1.4 Newcastle -11.5 -11.1 Sheffield -3.0 -5.3 Newham +0.8 +2.7 Southampton +12.8 +3.8 Norwich -1.3 -0.3 Southwark +8.2 +6.2 Nottingham -7.0 -2.4 Sunderland +5.7 -5.3 Plymouth +0.9 +3.0 Tower Hamlets +11.2 +5.4 Rochdale -4.2 -1.4 Walsall -1.8 -1.6 Wolverhampton -5.4 -4.7 NDC Areas faring relatively worse by less
than 0.1% Knowsley Middlesbrough Note: Worklessness measured here does not include people participating in New Deal programmes.
Change in Worklessness Rates Relative to Local Authority 2001 to 2002
2.17. As discussed above, the two methods of analysing changes in worklessness in NDC areas used here are changes in the numbers of people affected and changes in the rate of worklessness. Changes in the rates of worklessness can be measured where the total population at risk, in this case all adults aged 16 to 59, is known. Due to the way in which NDC area populations are calculated, the populations of NDC areas in 2003 will not be known until late 2004. Therefore, the rates presented here focus on the period from 1999 to 2002.
2.18. Table 2.2 presents the rates of worklessness in NDC areas and parent local
authorities, with those NDC areas that improved relative to their parent local authority on this measure between 2001 and 2002 in the left hand column and those that did not fare as well as the parent local authority in the right hand column. After each NDC area, the change from 2001 to 2002 for the NDC area as well as the parent local authority is listed. For example, the rate of worklessness in the Birmingham Aston NDC area declined by 0.7% from 2001 to 2002, while the rate in Birmingham as a whole declined by 0.6%.
2.19. In four of the 22 areas that fared better than their local authority in terms of changes
in the rates of worklessness from 2001 to 2002, the relative improvement in this period represents a reversal of the trend in 1999-2001. The majority of the 17 areas

New Deal for Communities: The National Evaluation
Annual Report 2003/4 11
that did not fare as well as their parent local authority on this measure between 2001 and 2002 had fared better in 1999-2001, indicating a relative worsening in the latter period. In the 1999 to 2001 period, the average rate of worklessness in NDC areas declined by 1.9%. From 2001 to 2002, the average decline was 0.3%. This parallels the trend observed in districts containing an NDC area, where the average change in the rate of worklessness was -1.2% in 1999-2001 and -0.1% in 2001-2002. On the whole, NDC areas improved relative to their parent local authorities over both periods, but the improvement was less well defined in 2001-2002.
Table 2.2: NDC areas and local authorities: changes in worklessness rates, 2001 to
2002
NDC areas faring relatively better than the parent Local Authority
NDC areas faring relatively worse than the parent Local Authority
NDC
area change
Local authority change
NDC area change
Local authority change
Birmingham Aston -0.7 -0.6 Birmingham Kings Norton -0.1 -0.6 Bradford -3.5 0.0 Brighton 0.0 -0.2 Brent +0.6 +0.9 Bristol +0.7 +0.1 Coventry -1.1 0.0 Derby 0.0 -0.2 Doncaster -2.1 -0.7 Hartlepool +0.2 -0.1 Hackney +0.3 +0.5 Islington +1.0 +0.3 Hammersmith & Fulham -0.3 +0.1 Lewisham +1.0 +0.4 Hull -3.7 -0.4 Luton +1.5 +0.2 Knowsley -1.4 -0.6 Manchester +0.2 -0.5 Lambeth +0.5 +0.6 Newham +0.2 0.0 Leicester -0.5 +0.1 Norwich +0.4 0.0 Liverpool -1.4 -0.6 Sandwell +0.2 -0.1 Middlesbrough -0.6 -0.1 Southampton +1.1 0.0 Newcastle -1.3 -0.4 Sunderland +1.5 -0.5 Nottingham -2.4 -0.5 Tower Hamlets +0.5 -0.4 Oldham -0.2 0.0 Walsall +0.2 0.0 Plymouth +0.4 +0.5 Rochdale -0.5 -0.1 Sheffield -1.1 -0.4
Southwark -0.4 +0.2
NDC Areas faring relatively worse by less than 0.1%
Wolverhampton -0.8 -0.4 Salford NDC Areas faring relatively better by less than 0.1%
Haringey Note: Worklessness measured here includes people participating in New Deal programmes.
Change in Numbers of Residents with Work Limiting Illness in NDC Areas: 2001 to 2003
2.20. The number of residents with work limiting illness in the 2001 to 2003 period increased by 2.9% in NDC areas as a whole compared with an increase of 7.2% in the 1999 to 2001 period. This represents an improvement of the trend of NDC areas relative to national trends: the increase was 2.1% in England between 2001 to 2003 and 5.0% in the 1999 to 2001 period.

New Deal for Communities: The National Evaluation
Annual Report 2003/4 12
Figure 2.4: NDC areas with an increase in the number of residents with work limiting illness: 2001 to 2003
-10
-5
0
5
10
15
20
25
Sunderland
Bristo
l
Derb
y
South
am
pto
n
Islin
gto
n
Tow
er
Ham
lets
Sandw
ell
Hackney
Birm
ingham
KN
Haringey
Ply
mouth
Brighto
n
Bre
nt
Nott
ingham
Mid
dle
sbro
ugh
Know
sle
y
Wolv
erh
am
pto
n
Hart
lepool
Lew
isham
Old
ham
Lam
beth
H's
mith &
Fulh
am
South
wark
Coventr
y
Wals
all
Doncaste
r
% c
han
ge i
n n
um
bers
wit
h w
ork
lim
itin
g i
lln
ess
NDC 1999 - 2001 NDC 2001 to 2003
NDC average 1999 - 2001 NDC average 2001 to 2003
Base: 26 partnerships Source: SDRC
2.21. Figure 2.4 presents the changes in the number of residents with work limiting illness
between 2001-2003 for those areas that observed an increase over this period. For 17 of these 26 areas, the increase was smaller than for the 1999-2001 period. On the other hand, the NDC areas in Sunderland, Bristol and Derby all experienced an increase of more than 15% in the numbers of residents with work limiting illness in the 2001-2003 period. In all three this change was significantly greater than the increase experienced in the previous period.
2.22. As shown in Figure 2.5, 13 NDC areas experienced a decrease in numbers of
residents with work limiting illness between 2001 and 2003. For 12 of these, this contrasted with an increase in the 1999-2001 period. Only one of the 10 NDC areas in London, West Ham & Plaistow in Newham, experienced a decline in the numbers with work limiting illness in the 2001-2003 period.

New Deal for Communities: The National Evaluation
Annual Report 2003/4 13
Figure 2.5: NDCs with a decrease in the number of residents with work limiting illness: 2001 to 2003
-10
-5
0
5
10
15
20
25
New
ham
Mancheste
r
Sheff
ield
Leic
este
r
Liv
erp
ool
Norw
ich
Birm
ingham
A
Luto
n
Hull
New
castle
Salford
Rochdale
Bra
dfo
rd
% c
han
ge i
n n
um
bers
wit
h w
ork
lim
itin
g i
lln
ess
NDC 1999 - 2001 NDC 2001 to 2003
NDC average 1999 - 2001 NDC average 2001 to 2003
Base: 13 partnerships Source: SDRC
2.23. Table 2.3 lists those NDC that fared relatively better and worse than their parent
local authorities in terms of the percentage change in numbers of residents with work limiting illness between 2001 and 2003. Each NDC area is listed along with the percentage change in numbers of people with work limiting illness in the NDC area itself and the local authority. For example, the number of people with work-limiting illness declined by 1.9% in the Birmingham Aston NDC area, but increased by 2.1% in Birmingham as a whole.
2.24. As shown in Table 2.3, 16 NDC areas improved their position relative to the parent
authority in the 2001 to 2003 period. Eight of the improving NDC areas in the 2001 to 2003 period experienced a decline in residents with work limiting illness against a background of increases in their parent authority. Three of these NDC areas experienced a sharper decline than that observed in the local authority as a whole, while five experienced a smaller increase in the numbers of people with work limiting illness than did the wider authority.
2.25. Also as shown in Table 2.3, 23 NDC areas experienced a worsening relative to their
local authority in terms of the percentage change in numbers of residents with work limiting illness in the 2001 to 2003 period. For three quarters of this group, this worsening relative to the parent authority in the 2001 to 2003 period was consistent with a relative worsening in the 1999 to 2001 period.
2.26. While the numbers of people with work limiting illness increased in the local
authorities of Sunderland, Derby, Southampton and Bristol, the percentage increase in the NDC areas in each of these cities was more than 10 percentage points greater than the increase observed in the local authority as a whole. On the other hand, the numbers of people with work limiting illness fell in the NDC areas in both Manchester and Liverpool, but these declines did not match those of the local authority as a whole.
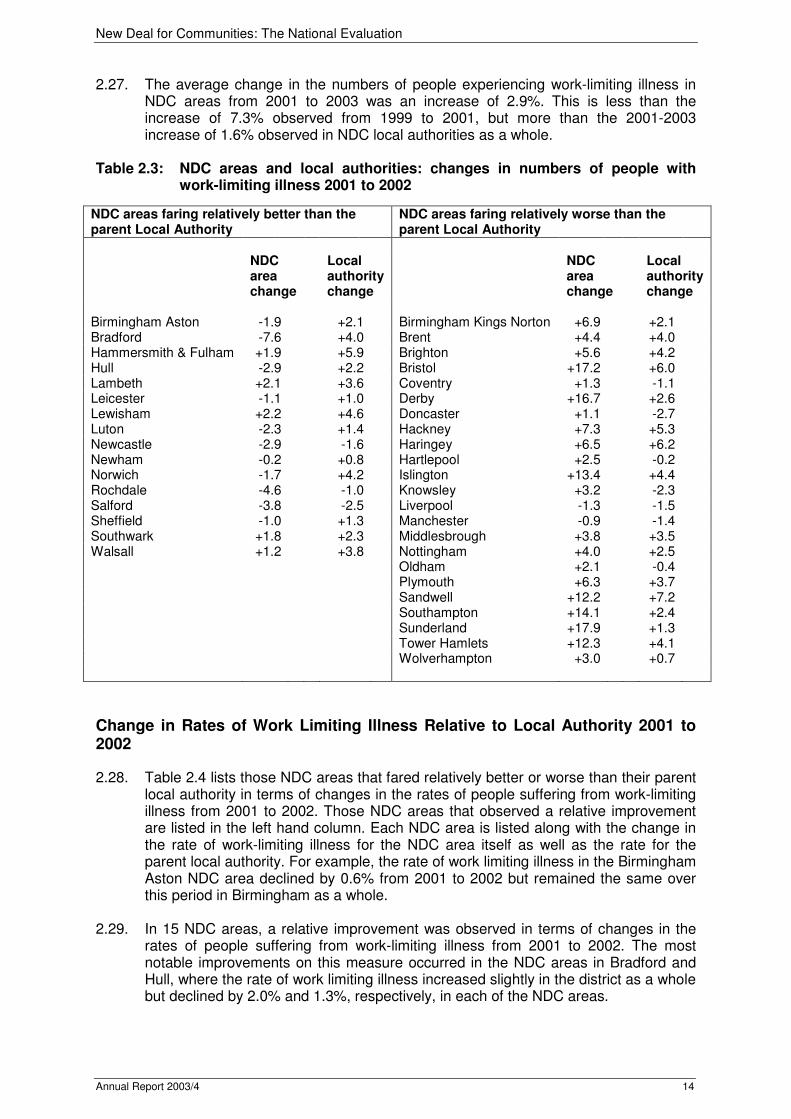
New Deal for Communities: The National Evaluation
Annual Report 2003/4 14
2.27. The average change in the numbers of people experiencing work-limiting illness in NDC areas from 2001 to 2003 was an increase of 2.9%. This is less than the increase of 7.3% observed from 1999 to 2001, but more than the 2001-2003 increase of 1.6% observed in NDC local authorities as a whole.
Table 2.3: NDC areas and local authorities: changes in numbers of people with
work-limiting illness 2001 to 2002
NDC areas faring relatively better than the parent Local Authority
NDC areas faring relatively worse than the parent Local Authority
NDC
area change
Local authority change
NDC area change
Local authority change
Birmingham Aston -1.9 +2.1 Birmingham Kings Norton +6.9 +2.1 Bradford -7.6 +4.0 Brent +4.4 +4.0 Hammersmith & Fulham +1.9 +5.9 Brighton +5.6 +4.2 Hull -2.9 +2.2 Bristol +17.2 +6.0 Lambeth +2.1 +3.6 Coventry +1.3 -1.1 Leicester -1.1 +1.0 Derby +16.7 +2.6 Lewisham +2.2 +4.6 Doncaster +1.1 -2.7 Luton -2.3 +1.4 Hackney +7.3 +5.3 Newcastle -2.9 -1.6 Haringey +6.5 +6.2 Newham -0.2 +0.8 Hartlepool +2.5 -0.2 Norwich -1.7 +4.2 Islington +13.4 +4.4 Rochdale -4.6 -1.0 Knowsley +3.2 -2.3 Salford -3.8 -2.5 Liverpool -1.3 -1.5 Sheffield -1.0 +1.3 Manchester -0.9 -1.4 Southwark +1.8 +2.3 Middlesbrough +3.8 +3.5 Walsall +1.2 +3.8 Nottingham +4.0 +2.5 Oldham +2.1 -0.4 Plymouth +6.3 +3.7 Sandwell +12.2 +7.2 Southampton +14.1 +2.4 Sunderland +17.9 +1.3 Tower Hamlets +12.3 +4.1 Wolverhampton +3.0 +0.7
Change in Rates of Work Limiting Illness Relative to Local Authority 2001 to 2002
2.28. Table 2.4 lists those NDC areas that fared relatively better or worse than their parent local authority in terms of changes in the rates of people suffering from work-limiting illness from 2001 to 2002. Those NDC areas that observed a relative improvement are listed in the left hand column. Each NDC area is listed along with the change in the rate of work-limiting illness for the NDC area itself as well as the rate for the parent local authority. For example, the rate of work limiting illness in the Birmingham Aston NDC area declined by 0.6% from 2001 to 2002 but remained the same over this period in Birmingham as a whole.
2.29. In 15 NDC areas, a relative improvement was observed in terms of changes in the
rates of people suffering from work-limiting illness from 2001 to 2002. The most notable improvements on this measure occurred in the NDC areas in Bradford and Hull, where the rate of work limiting illness increased slightly in the district as a whole but declined by 2.0% and 1.3%, respectively, in each of the NDC areas.
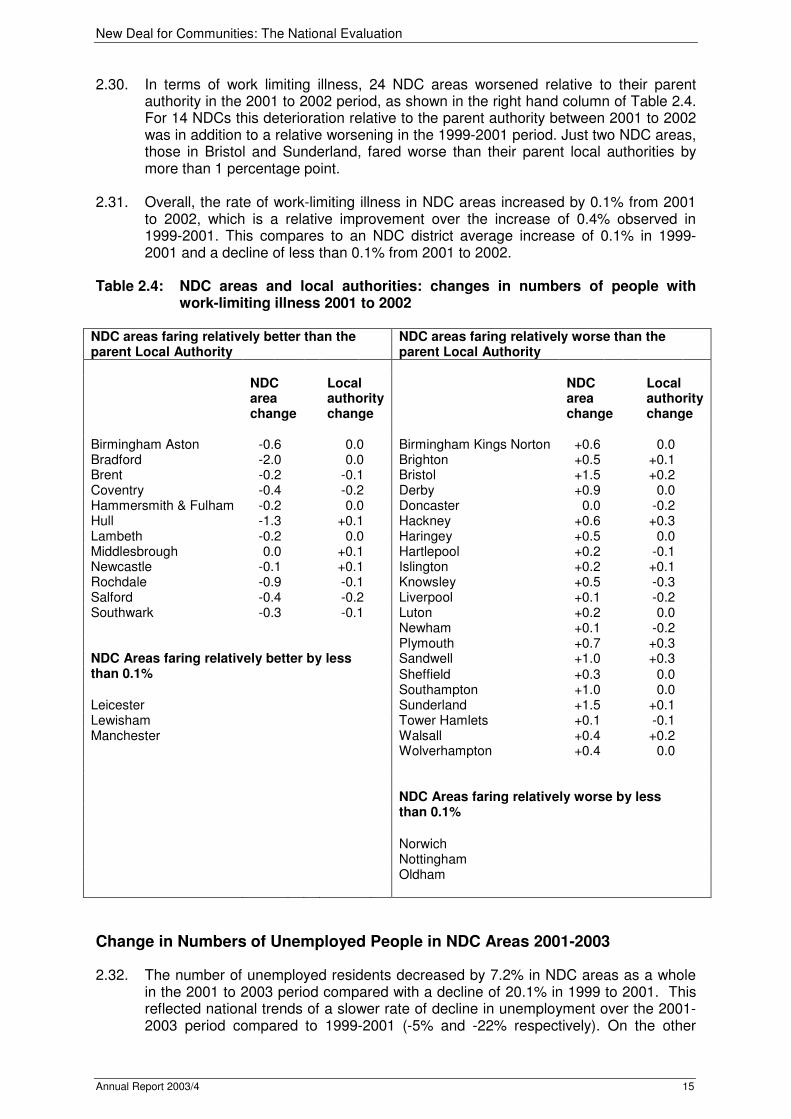
New Deal for Communities: The National Evaluation
Annual Report 2003/4 15
2.30. In terms of work limiting illness, 24 NDC areas worsened relative to their parent authority in the 2001 to 2002 period, as shown in the right hand column of Table 2.4. For 14 NDCs this deterioration relative to the parent authority between 2001 to 2002 was in addition to a relative worsening in the 1999-2001 period. Just two NDC areas, those in Bristol and Sunderland, fared worse than their parent local authorities by more than 1 percentage point.
2.31. Overall, the rate of work-limiting illness in NDC areas increased by 0.1% from 2001
to 2002, which is a relative improvement over the increase of 0.4% observed in 1999-2001. This compares to an NDC district average increase of 0.1% in 1999-2001 and a decline of less than 0.1% from 2001 to 2002.
Table 2.4: NDC areas and local authorities: changes in numbers of people with
work-limiting illness 2001 to 2002
NDC areas faring relatively better than the parent Local Authority
NDC areas faring relatively worse than the parent Local Authority
NDC
area change
Local authority change
NDC area change
Local authority change
Birmingham Aston -0.6 0.0 Birmingham Kings Norton +0.6 0.0 Bradford -2.0 0.0 Brighton +0.5 +0.1 Brent -0.2 -0.1 Bristol +1.5 +0.2 Coventry -0.4 -0.2 Derby +0.9 0.0 Hammersmith & Fulham -0.2 0.0 Doncaster 0.0 -0.2 Hull -1.3 +0.1 Hackney +0.6 +0.3 Lambeth -0.2 0.0 Haringey +0.5 0.0 Middlesbrough 0.0 +0.1 Hartlepool +0.2 -0.1 Newcastle -0.1 +0.1 Islington +0.2 +0.1 Rochdale -0.9 -0.1 Knowsley +0.5 -0.3 Salford -0.4 -0.2 Liverpool +0.1 -0.2 Southwark -0.3 -0.1 Luton +0.2 0.0 Newham +0.1 -0.2 Plymouth +0.7 +0.3
Sandwell +1.0 +0.3 NDC Areas faring relatively better by less than 0.1% Sheffield +0.3 0.0 Southampton +1.0 0.0 Leicester Sunderland +1.5 +0.1 Lewisham Tower Hamlets +0.1 -0.1 Manchester Walsall +0.4 +0.2 Wolverhampton +0.4 0.0
NDC Areas faring relatively worse by less than 0.1%
Norwich Nottingham Oldham
Change in Numbers of Unemployed People in NDC Areas 2001-2003
2.32. The number of unemployed residents decreased by 7.2% in NDC areas as a whole in the 2001 to 2003 period compared with a decline of 20.1% in 1999 to 2001. This reflected national trends of a slower rate of decline in unemployment over the 2001-2003 period compared to 1999-2001 (-5% and -22% respectively). On the other

New Deal for Communities: The National Evaluation
Annual Report 2003/4 16
hand, 14 NDC areas experienced an increase in the numbers of unemployed from 2001-2003, including 8 of the 10 London NDC areas. This is shown in Figure 2.6.
Figure 2.6: NDC areas with an increase in numbers unemployed: 2001 to 2003
-45
-40
-35
-30
-25
-20
-15
-10
-5
0
5
10
15
20Lam
beth
Luto
n
South
wark
Salford
South
am
pto
n
Tow
er
Ham
lets
Lew
isham
Bre
nt
Old
ham
Islin
gto
n
H's
mith &
Fulh
am
Birm
ingham
A
Mancheste
r
New
ham
% c
han
ge i
n n
um
ber
of
un
em
plo
yed
NDC 1999 - 2001 NDC 2001 to 2003
NDC average 1999 - 2001 NDC average 2001 to 2003
Base: 14 partnerships Source: SDRC
Figure 2.7: NDC areas with a decrease in numbers unemployed: 2001 to 2003
-45
-35
-25
-15
-5
5
15
Norw
ich
Hackney
Rochdale
Sheff
ield
Haringey
Coventr
y
Wals
all
Bra
dfo
rd
Leic
este
r
Ply
mouth
Sandw
ell
Bristo
l
Brighto
n
Birm
ingham
KN
Sunderland
Wolv
erh
am
pto
n
Doncaste
r
Hart
lepool
Mid
dle
sbro
ugh
Hull
Derb
y
Nott
ingham
Liv
erp
ool
New
castle
Know
sle
y
% c
han
ge i
n n
um
ber
of
un
em
plo
yed
NDC 1999 - 2001 NDC 2001 to 2003
NDC average 1999 - 2001 NDC average 2001 to 2003
Base: 25 partnerships Source: SDRC

New Deal for Communities: The National Evaluation
Annual Report 2003/4 17
2.33. As shown in Figure 2.7, 25 NDC areas experienced a decrease in the numbers of unemployed people between 2001 and 2003. For 22 of these, the percentage decrease in numbers of unemployed people was greater than the national rate of decline. In the Knowsley and Newcastle NDC areas, the numbers of unemployed people decreased by approximately one quarter in the 2001 to 2003 period.
2.34. Table 2.5 presents changes in the numbers of people unemployed in NDC areas and
parent local authorities, with those NDC areas that improved relative to their parent local authority on this measure between 2001 and 2003 in the left hand column and those that did not fare as well as the parent local authority in the right hand column. After each NDC area, the change from 2001 to 2003 for the NDC area as well as the parent local authority is listed. For example, the numbers of people unemployed in the Birmingham Kings Norton NDC area declined by 11.7% from 2001 to 2003, while the numbers in Birmingham as a whole declined by 6.6%.
Table 2.5: NDC areas and local authorities: changes in numbers of people
unemployed 2001 to 2003
NDC areas faring relatively better than the parent Local Authority
NDC areas faring relatively worse than the parent Local Authority
NDC
area change
Local authority change
NDC area change
Local authority change
Birmingham Kings Norton -11.7 -6.6 Birmingham Aston +4.6 -6.6 Brent +8.9 +31.5 Bradford -7.5 -7.8 Bristol -11.4 -10.9 Brighton -11.5 -16.2 Coventry -6.7 +8.2 Doncaster -15.5 -24.7 Derby -19.3 -9.7 Islington +5.4 +1.1 Hackney -2.8 +4.7 Lambeth +18.4 +5.9 Hammersmith & Fulham +4.7 +13.2 Lewisham +9.0 +4.1 Haringey -5.6 -3.3 Newcastle -24.1 -31.9 Hartlepool -16.6 -11.8 Norwich -0.4 -8.4 Hull -18.6 -11.0 Oldham +6.3 -2.7 Knowsley -27.9 -19.1 Salford +12.2 -1.8 Leicester -8.6 +5.0 Sheffield -5.4 -16.0 Liverpool -20.8 -13.1 Southampton +10.1 +7.3 Luton +14.8 +17.8 Southwark +14.3 +11.2 Manchester +2.8 +5.1 Sunderland -13.7 -20.7 Middlesbrough -17.6 -17.1 Tower Hamlets +10.0 +7.1 Newham +2.6 +5.7 Walsall -7.0 -11.8 Nottingham -19.3 -10.9 Plymouth -8.8 +1.0 Rochdale -2.96 -2.95
Sandwell -8.9 -7.6
Wolverhampton -15.4 -13.2
2.35. In eight of the 22 areas that fared better than their local authority in terms of changes
in the numbers of unemployed people from 2001 to 2003, the relative improvement in this period represents a continuation of the trend in 1999-2001. Seven of the 17 areas that did not fare as well as the parent local authority on this measure between 2001 and 2003 had fared better than the local authority in 1999-2001, indicating a relative decline in the latter period.
2.36. In the 1999 to 2001 period, the average number of unemployed people in NDC areas
declined by 20.1%. From 2001 to 2003, the average decline was 7.2%. This is similar to the trend observed in districts containing an NDC area, where the average

New Deal for Communities: The National Evaluation
Annual Report 2003/4 18
decline in the numbers of unemployed people was -21.6% in 1999-2001 and -4.9% in 2001-2003. Overall, NDC areas improved relative to their parent local authorities in the latter period.
Change in Unemployment Rates in NDC areas Relative to Local Authorities: 2001 to 2002
2.37. As shown in Table 2.6, 25 NDC areas experienced an improvement in change in unemployment rates relative to their parent authority from 2001 to 2002. These areas are listed in the left hand column of the table. Each NDC area is listed along with the change in the rate of unemployment in the NDC area and the change in the parent local authority. For example, the rate of unemployment in the Birmingham Kings Norton NDC area declined by 1.1% between 2001 and 2002, compared to a decline in Birmingham as a whole of 0.7%. The largest relative improvements on this measure occurred in the NDC area in Hull, where the unemployment rate decreased from 12.8% in 2001 to 10.0% percent in 2002, while decreasing by just 0.5%, from 6.6% to 6.1% in the local authority as a whole.
2.38. Despite the majority of NDC areas having fared better than their parent local
authorities on this measure between 2001 and 2002, this was a relative decline from the 1999 to 2001 period when 36 NDCs showed a relative improvement over their parent local authorities. Fourteen NDC areas experienced a deterioration relative to their parent authority in relation to change in unemployment rates during 2001-2002, shown in the left hand column of Table 2.6. This contrasted with an improvement relative to the parent authority for the majority in 1999-2001. It is worth noting that six of the NDC areas in London were among those that worsened relative to their local authority on this measure from 2001 to 2002.
2.39. Overall, NDC areas observed a greater decline in the rate of unemployment from
1999 to 2001 than from 2001 to 2002. In the first period, the average rate declined by 2.5% compared with a decline of 0.7% in 2001-2002. This is still relatively better than the decline observed in NDC districts as a whole, where the average decline from 1999 to 2001 was 1.5% as compared to 0.2% in 2001 to 2001.

New Deal for Communities: The National Evaluation
Annual Report 2003/4 19
Table 2.6: NDC areas and local authorities: Unemployment rates 2001 to 2002
NDC areas faring relatively better than the parent Local Authority
NDC areas faring relatively worse than the parent Local Authority
NDC
area change
Local authority change
NDC area change
Local authority change
Birmingham Kings Norton -1.1 -0.7 Birmingham Aston -0.2 -0.7 Bradford -1.6 -0.2 Islington +0.5 0.0 Brighton -0.9 -0.6 Lewisham +0.9 +0.2 Bristol -1.1 -0.3 Luton +0.8 +0.1 Coventry -0.8 0.0 Manchester +0.8 -0.2 Derby -1.5 -0.4 Norwich 0.0 -0.3 Doncaster -2.2 -0.6 Rochdale +0.4 0.0 Hackney -2.7 -0.2 Salford -0.2 -0.4 Hammersmith & Fulham -0.1 +0.1 Sunderland +0.1 -0.6 Haringey -0.9 -0.4 Tower Hamlets +0.2 -0.4 Hull -2.0 -0.5 Knowsley -2.1 -0.5 Leicester -1.2 -0.2
Liverpool -1.7 -0.6
NDC Areas faring relatively worse by less than 0.1%
Middlesbrough -0.9 -0.5 Newcastle -1.0 -0.5 Brent Nottingham -2.6 -0.7 Lambeth Oldham -0.3 0.0 Newham Plymouth -0.7 +0.1 Southampton Sandwell -1.1 -0.4 Sheffield -1.4 -0.4 Southwark -0.2 +0.2 Walsall -0.5 -0.2 Wolverhampton -1.2 -0.5 NDC Areas faring relatively better by less than 0.1%
Hartlepool
TRANSITIONS FROM WORKLESSNESS
2.40. Rather than examining the percentage or the numbers of people that are affected at any one time point or pair of time points, analysis of transitions links the complete dataset at a first time point to the complete dataset at a second time point. This allows analysis of the transitions that individuals have made between the first and second time points. Any one of nine possibilities will have happened to workless individuals between the first and second time points. These possible destinations are listed below and presented in Figure 2.8 for those who were workless in 2001.
• Continue claiming JSA: claiming JSA in 2001 and in 2003
• Continue claiming IB/SDA: claiming IB or SDA in both 2001 and 2003
• Move from JSA to IB: claiming JSA in 2001 (unemployed) but claiming IB in 2003 (ill or disabled)
• Move from IB/SDA to JSA: claiming IB or SDA in 2001 (ill or disabled) but claiming JSA in 2003 (unemployed)

New Deal for Communities: The National Evaluation
Annual Report 2003/4 20
• Move from the area: claiming out-of-work benefits at both time points but by the second time point had moved out of the area
• Cease claiming JSA: claiming JSA in 2001 but had ceased claiming benefit by 2003
• Cease claiming IB/SDA: claiming IB or SDA in 2001 but had ceased claiming benefit by 2003
• Moving from JSA to 60+: claiming JSA in 2001 but had reached the age of 60 by 2003 and are therefore no longer counted as working age for the purposes of these analyses
• Moving from IB/SDA to 60+: claiming IB/SDA in 2001 but had reached the age of 60 by 2003
2.41. These possible destinations are illustrated in Figure 2.8 for the workless population
of all 39 NDC areas as a whole. A substantial proportion of people (40%) who were workless in 2001 continued to claim work-limiting illness related benefits (IB or SDA) in 2003. The other most common outcomes were leaving JSA and moving from the area. Smaller, but still significant proportions of people who were workless in 2001 continued to claim JSA or ceased claiming IB/SDA by 2003. Less than 10% of all people who were workless in NDC areas in 2001 transitioned between benefits or reached pensionable age by 2003.
Figure 2.8: 2003 destinations of people who were workless in 2001: all NDC areas
2.42. The remaining analysis presented in this section focuses on those people who were
workless in 2001 but had left benefit by 2003.
Continue claiming JSA
10%
Move from JSA to IB
3%
Continue claiming IB/SDA
40%
Move from IB/SDA to JSA
1%
Move from JSA to age 60+
1%
Leave JSA
19%
Leave IB/SDA
8%
Move from IB/SDA to age 60+
2%
Leave the area
16%
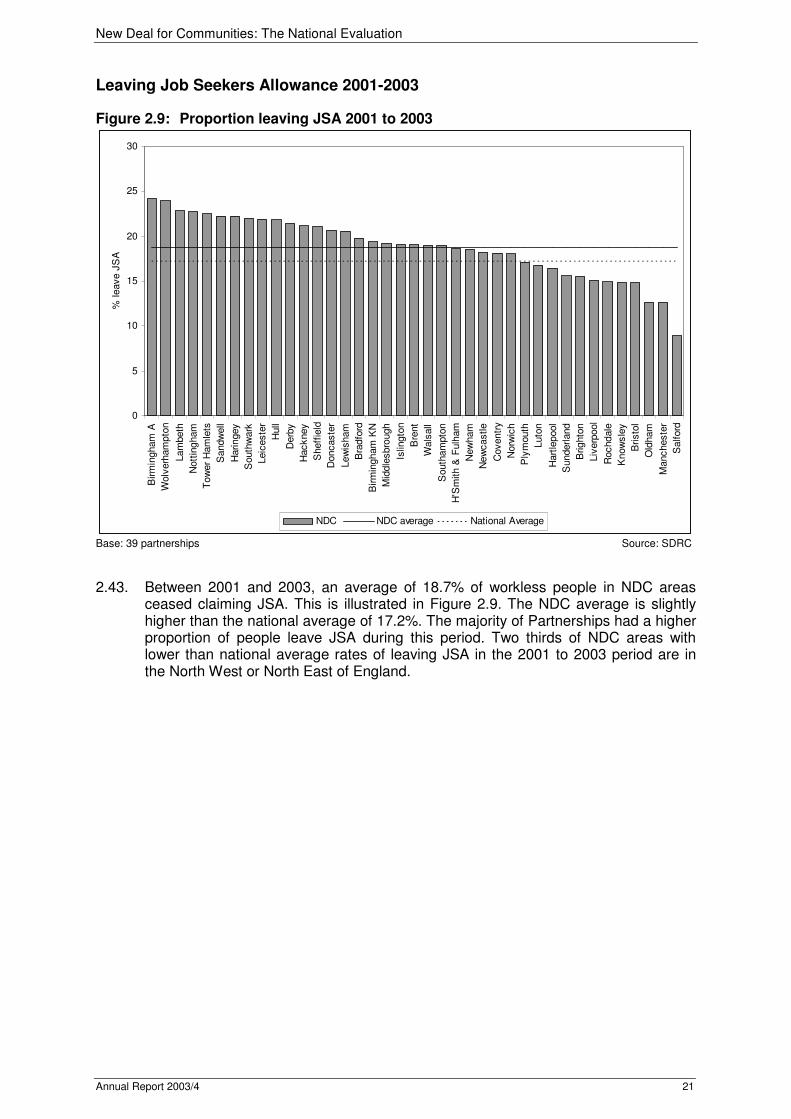
New Deal for Communities: The National Evaluation
Annual Report 2003/4 21
Leaving Job Seekers Allowance 2001-2003
Figure 2.9: Proportion leaving JSA 2001 to 2003
0
5
10
15
20
25
30B
irm
ingham
A
Wolv
erh
am
pto
n
Lam
beth
Nott
ingham
Tow
er
Ham
lets
Sandw
ell
Haringey
South
wark
Leic
este
r
Hull
Derb
y
Hackney
Sheff
ield
Doncaste
r
Lew
isham
Bra
dfo
rd
Birm
ingham
KN
Mid
dle
sbro
ugh
Islin
gto
n
Bre
nt
Wals
all
South
am
pto
n
H'S
mith &
Fulh
am
New
ham
New
castle
Coventr
y
Norw
ich
Ply
mouth
Luto
n
Hart
lepool
Sunderland
Brighto
n
Liv
erp
ool
Rochdale
Know
sle
y
Bristo
l
Old
ham
Mancheste
r
Salford
% leave J
SA
NDC NDC average National Average
Base: 39 partnerships Source: SDRC
2.43. Between 2001 and 2003, an average of 18.7% of workless people in NDC areas
ceased claiming JSA. This is illustrated in Figure 2.9. The NDC average is slightly higher than the national average of 17.2%. The majority of Partnerships had a higher proportion of people leave JSA during this period. Two thirds of NDC areas with lower than national average rates of leaving JSA in the 2001 to 2003 period are in the North West or North East of England.

New Deal for Communities: The National Evaluation
Annual Report 2003/4 22
Table 2.7: NDC areas and local authorities: exits from JSA 2001 to 2003
NDC areas faring relatively better than the parent Local Authority
NDC areas faring relatively worse than the parent Local Authority
NDC
area exits
Local authority exits
NDC area exits
Local authority exits
Birmingham Aston 24.2 21.4 Birmingham Kings Norton 19.4 21.4 Bradford 19.8 18.8 Brighton 15.5 20.8 Brent 19.0 18.9 Bristol 14.8 17.1 Coventry 18.1 16.3 Hackney 21.2 21.4 Derby 21.4 19.0 Haringey 22.2 24.1 Doncaster 20.6 16.9 Hull 21.9 22.0 Hammersmith & Fulham 18.6 17.9 Lewisham 20.6 22.2 Hartlepool 16.5 15.1 Luton 16.8 18.4 Islington 19.0 18.8 Manchester 12.6 14.1 Lambeth 22.9 22.7 Middlesbrough 19.2 20.1 Leicester 22.0 20.3 Newham 18.5 20.9 Liverpool 15.1 14.9 Norwich 18.1 19.3 Newcastle 18.2 15.6 Oldham 12.6 14.3 Nottingham 22.8 19.3 Salford 9.0 11.0 Plymouth 17.1 15.2 Rochdale 14.9 13.3
Sandwell 22.3 20.3
Sheffield 21.1 20.2
Southampton 18.9 16.0 Southwark 22.0 20.6 Sunderland 15.6 15.4 Tower Hamlets 22.5 21.6 Walsall 19.0 18.8 Wolverhampton 23.9 21.6 NDC Areas faring relatively better by less than 0.1% Knowsley
2.44. As seen in Table 2.7, 25 Partnerships had higher exit rates from JSA than their
parent authority in 2001-2003. These areas are listed in the left hand column of the table, along with the exit rate in the NDC area and in the local authority as a whole. For example, the proportion of workless people who ceased claiming JSA between 2001 and 2003 in the Birmingham Aston NDC area was 24.2%, compared with 21.4% in Birmingham as a whole. The majority of NDC areas that out-performed their parent local authority in 2001-2003 had also shown relative improvement in 1999-2001. Conversely, 13 of the 14 areas that did not fare as well as their parent local authority on this measure had also underperformed in 1999-2001.

New Deal for Communities: The National Evaluation
Annual Report 2003/4 23
Leaving Incapacity Benefit or Severe Disablement Allowance 2001-2003
Figure 2.10: Proportion leaving Incapacity Benefit or Severe Disablement Allowance 2001 to 2003
0
2
4
6
8
10
12
14
Salford
Rochdale
Norw
ich
Luto
n
Old
ham
South
am
pto
n
Ply
mouth
Islin
gto
n
Brighto
n
Doncaste
r
Mancheste
r
Hull
Wolv
erh
am
pto
n
Know
sle
y
Leic
este
r
New
ham
Bristo
l
Hart
lepool
H'S
mith &
Fulh
am
Derb
y
Liv
erp
ool
Coventr
y
New
castle
Birm
ingham
KN
Bra
dfo
rd
Lam
beth
Wals
all
Sunderland
Haringey
Nott
ingham
Tow
er
Ham
lets
Mid
dle
sbro
ugh
Hackney
Sandw
ell
Birm
ingham
A
South
wark
Sheff
ield
Bre
nt
Lew
isham
% leave I
B/S
DA
NDC National Average NDC average
Base: 39 partnerships Source: SDRC
2.45. Figure 2.10 shows the proportion of workless individuals in NDC areas in 2001 who
had ceased claiming Incapacity Benefit or Severe Disablement Allowance by 2003. The average for NDC areas as a whole was 8.3%, less than the national average of 9.6%. Just nine NDC areas exit rates from IB/SDA in the 2001-2003 period that were higher than the national average. Five of the ten NDC areas with the lowest exit rates, below 7.3%, are in London.

New Deal for Communities: The National Evaluation
Annual Report 2003/4 24
Table 2.8: NDC areas and local authority: exits from IB/SDA 2001 to 2003
NDC areas faring relatively better than the parent Local Authority
NDC areas faring relatively worse than the parent Local Authority
NDC
area exits
Local authority exits
NDC area exits
Local authority exits
Birmingham Kings Norton 7.5 7.3 Birmingham Aston 6.7 7.3 Brighton 9.7 8.2 Bradford 7.5 9.1 Hammersmith & Fulham 8.2 7.6 Brent 6.0 7.7 Haringey 7.4 7.1 Bristol 8.4 9.7 Hull 8.9 8.0 Coventry 7.9 9.3 Islington 9.7 7.8 Derby 8.2 8.7 Lambeth 7.5 6.8 Doncaster 9.3 10.6 Leicester 8.5 7.8 Hackney 6.9 7.6 Luton 11.0 10.6 Hartlepool 8.3 9.1 Norwich 11.6 8.9 Knowsley 8.6 9.4 Plymouth 10.0 9.3 Lewisham 5.9 6.9 Rochdale 12.6 11.4 Liverpool 8.1 8.9 Salford 13.3 11.7 Manchester 9.3 9.4 Southampton 10.5 10.2 Middlesbrough 7.0 7.6 Newcastle 7.9 9.2 Newham 8.4 9.3 Nottingham 7.3 8.4 Oldham 10.8 11.0 Sandwell 6.9 7.2 Sheffield 6.6 7.9 Southwark 6.7 7.5 Sunderland 7.4 9.2 Tower Hamlets 7.2 8.0 Walsall 7.4 9.3 Wolverhampton 8.7 9.1
2.46. NDC areas with an exit rate from IB/SDA higher than the local authority are listed in
the left hand column of Table 2.8. The NDC area is listed along with the rate of exit for the NDC area and the parent local authority. For example, 7.5% of workless people in 2001 in the Birmingham Kings Norton NDC area had ceased claiming IB/SDA by 2003, compared with 7.3% in Birmingham as a whole. Overall, 14 NDC areas had exit rates from IB/SDA in the 2001-2003 period which are higher than their parent authority. This was a reversal of the situation in the 1999-2001 period for 9 of these 14, which previously had exit rates lower than their parent authority.
2.47. Those NDC areas with an exit rate lower than the local authority are listed in the right
hand column of Table 2.8. More NDC areas (25) had lower exit rates from IB/SDA in the 2001-2003 period than those of their parent authority. All but 7 of the 25 also had lower rates than their parent authority in the 1999-2001 period.

New Deal for Communities: The National Evaluation
Annual Report 2003/4 25
EDUCATION
Staying on in school
2.48. The proportion of pupils staying on in full time non-advanced education in the post-compulsory stage (i.e. continuing in education below degree level) is available for 2001 and 2002.3 This indicator is developed from Child Benefit (CB) data, as CB is only paid to parents or carers of children aged 16 and over if those children remain in full time non-advanced education. The data used by SDRC focuses on young people aged 17, 18 and 19 whose parents/guardians continue to receive Child Benefit.
Figure 2.11: Proportion of pupils staying on in education 2002
0
10
20
30
40
50
60
70
80
Bre
nt
H's
mith&
Fulh
am
Tow
er
Ham
lets
Birm
ingham
A
Wolv
erh
am
pto
n
South
wark
Haringey
Bra
dfo
rd
Hackney
Lew
isham
Lam
beth
Sheff
ield
Sandw
ell
New
ham
Islin
gto
n
Luto
n
Mid
dle
sbro
ugh
New
castle
Know
sle
y
Nott
ingham
Liv
erp
ool
Bristo
l
Hart
lepool
Wals
all
Doncaste
r
Mancheste
r
South
am
pto
n
Birm
ingham
KN
Sunderland
Old
ham
Coventr
y
Brighto
n
Salford
Leic
este
r
Derb
y
Ply
mouth
Rochdale
Hull
Norw
ich
% s
tayin
g o
n
NDC NDC average National average
Base: 39 partnerships Source: SDRC
2.49. As shown in Figure 2.11, 11 NDC areas had a higher percentage of pupils staying on
at school in 2002 than the national average of 56.3%. Eight of these are in London. The NDC average staying on rate is 12 percentage points lower than the national average, but all 10 NDC areas in London exceeded the NDC average in 2002.
2.50. Staying on rates in full time education for those aged 17 and over, as measured by
child benefit, increased over the period 2001-2002 in NDC areas overall (the average for NDC areas increasing from 39.4% to 44.0%). This is shown in Figure 2.12. Thirty NDC areas showed an increase in staying on rates, while nine showed a, sometimes small, decrease. The increase in the majority of NDC areas occurred against a background of a national pattern of an increase in staying on rates over this same period, with the figure for England rising from 51.3% to 56.3%.
3 The transfer of Child Benefit to Inland Revenue in April 2003 may make it difficult to continue this
series.

New Deal for Communities: The National Evaluation
Annual Report 2003/4 26
Figure 2.12: Change in pupil staying on rates 2001 to 2002
-10
-5
0
5
10
15
20
Bre
nt
Lam
beth
South
wark
H's
mith&
Fulh
am
Bristo
l
Doncaste
r
Hackney
Wolv
erh
am
pto
n
Wals
all
Hart
lepool
Liv
erp
ool
South
am
pto
n
Know
sle
y
Sunderland
Birm
ingham
A
Sheff
ield
Lew
isham
Brighto
n
Leic
este
r
Nott
ingham
Old
ham
Hull
Derb
y
Ply
mouth
Mancheste
r
Mid
dle
sbro
ugh
Coventr
y
Salford
Birm
ingham
KN
Haringey
Tow
er
Ham
lets
Bra
dfo
rd
Sandw
ell
New
ham
Norw
ich
Luto
n
New
castle
Islin
gto
n
Rochdale
change in s
tayin
g o
n r
ate
s %
NDC National average
Base: 39 partnerships Source: SDRC
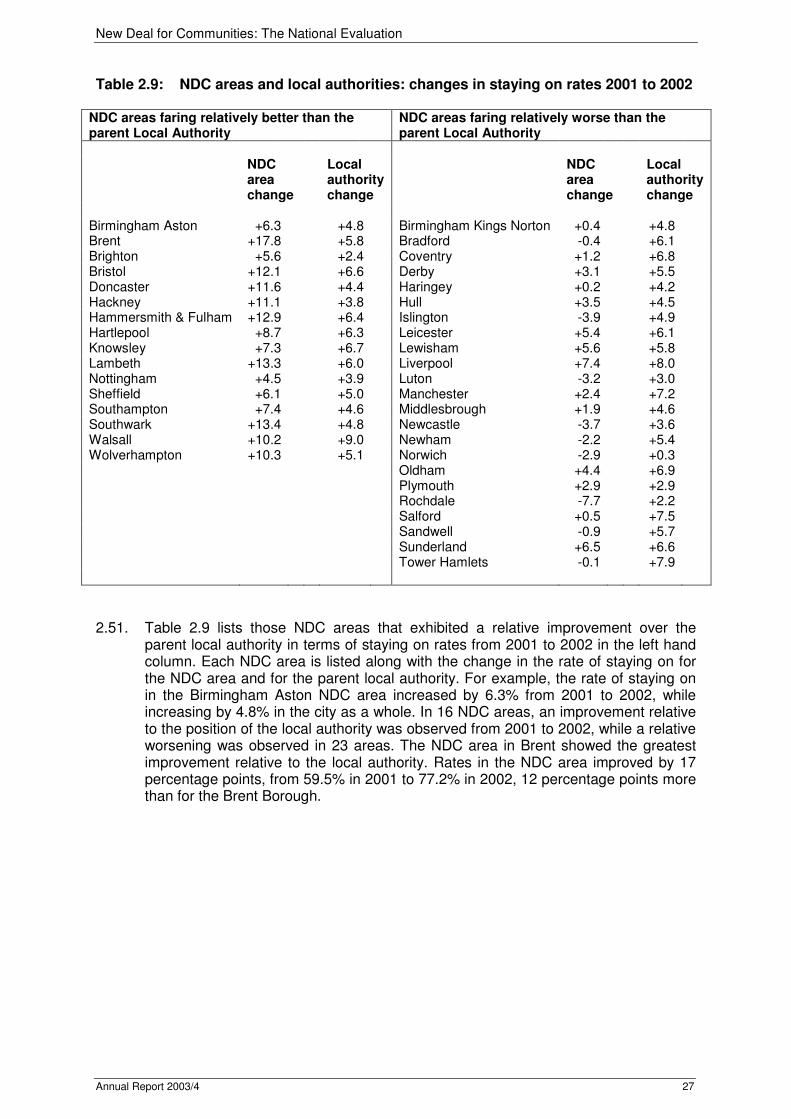
New Deal for Communities: The National Evaluation
Annual Report 2003/4 27
Table 2.9: NDC areas and local authorities: changes in staying on rates 2001 to 2002
NDC areas faring relatively better than the parent Local Authority
NDC areas faring relatively worse than the parent Local Authority
NDC
area change
Local authority change
NDC area change
Local authority change
Birmingham Aston +6.3 +4.8 Birmingham Kings Norton +0.4 +4.8 Brent +17.8 +5.8 Bradford -0.4 +6.1 Brighton +5.6 +2.4 Coventry +1.2 +6.8 Bristol +12.1 +6.6 Derby +3.1 +5.5 Doncaster +11.6 +4.4 Haringey +0.2 +4.2 Hackney +11.1 +3.8 Hull +3.5 +4.5 Hammersmith & Fulham +12.9 +6.4 Islington -3.9 +4.9 Hartlepool +8.7 +6.3 Leicester +5.4 +6.1 Knowsley +7.3 +6.7 Lewisham +5.6 +5.8 Lambeth +13.3 +6.0 Liverpool +7.4 +8.0 Nottingham +4.5 +3.9 Luton -3.2 +3.0 Sheffield +6.1 +5.0 Manchester +2.4 +7.2 Southampton +7.4 +4.6 Middlesbrough +1.9 +4.6 Southwark +13.4 +4.8 Newcastle -3.7 +3.6 Walsall +10.2 +9.0 Newham -2.2 +5.4 Wolverhampton +10.3 +5.1 Norwich -2.9 +0.3 Oldham +4.4 +6.9 Plymouth +2.9 +2.9 Rochdale -7.7 +2.2 Salford +0.5 +7.5 Sandwell -0.9 +5.7 Sunderland +6.5 +6.6 Tower Hamlets -0.1 +7.9
2.51. Table 2.9 lists those NDC areas that exhibited a relative improvement over the
parent local authority in terms of staying on rates from 2001 to 2002 in the left hand column. Each NDC area is listed along with the change in the rate of staying on for the NDC area and for the parent local authority. For example, the rate of staying on in the Birmingham Aston NDC area increased by 6.3% from 2001 to 2002, while increasing by 4.8% in the city as a whole. In 16 NDC areas, an improvement relative to the position of the local authority was observed from 2001 to 2002, while a relative worsening was observed in 23 areas. The NDC area in Brent showed the greatest improvement relative to the local authority. Rates in the NDC area improved by 17 percentage points, from 59.5% in 2001 to 77.2% in 2002, 12 percentage points more than for the Brent Borough.
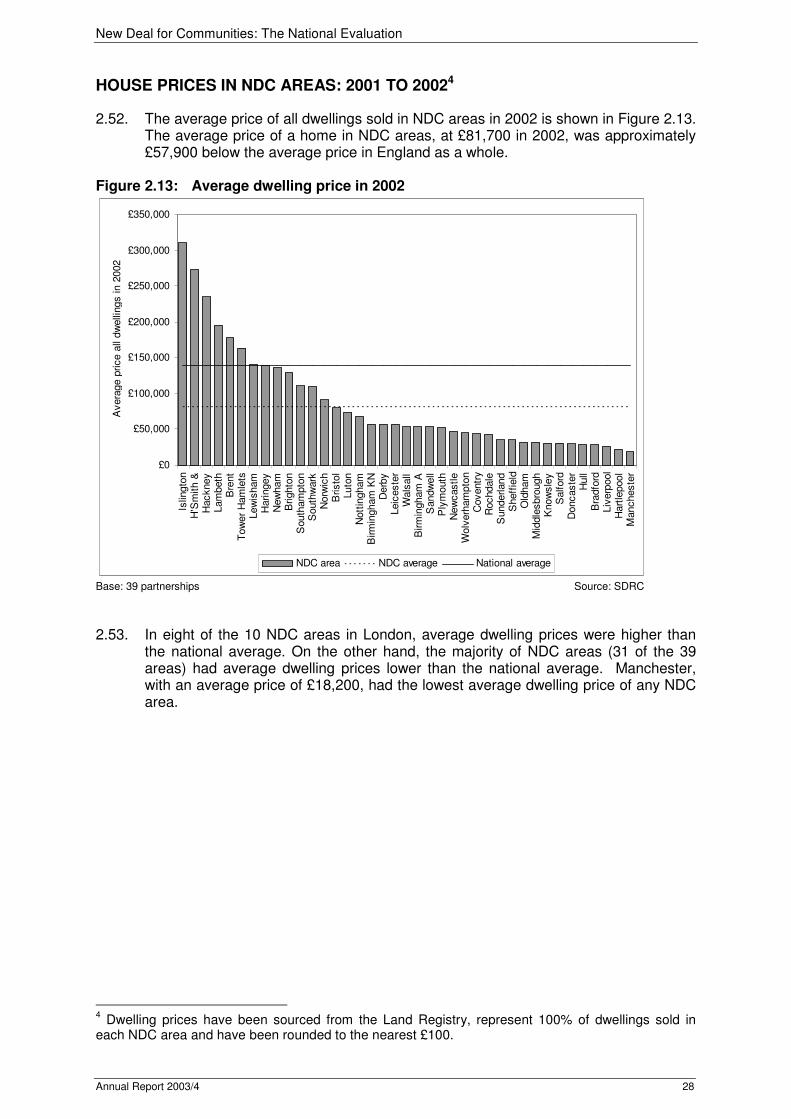
New Deal for Communities: The National Evaluation
Annual Report 2003/4 28
HOUSE PRICES IN NDC AREAS: 2001 TO 20024
2.52. The average price of all dwellings sold in NDC areas in 2002 is shown in Figure 2.13. The average price of a home in NDC areas, at £81,700 in 2002, was approximately £57,900 below the average price in England as a whole.
Figure 2.13: Average dwelling price in 2002
£0
£50,000
£100,000
£150,000
£200,000
£250,000
£300,000
£350,000
Islin
gto
nH
'Sm
ith &
Hackney
Lam
beth
Bre
nt
Tow
er
Ham
lets
Lew
isham
Haringey
New
ham
Brighto
nS
outh
am
pto
nS
outh
wark
Norw
ich
Bristo
lLuto
nN
ott
ingham
Birm
ingham
KN
Derb
yLeic
este
rW
als
all
Birm
ingham
AS
andw
ell
Ply
mouth
New
castle
Wolv
erh
am
pto
nC
oventr
yR
ochdale
Sunderland
Sheff
ield
Old
ham
Mid
dle
sbro
ugh
Know
sle
yS
alford
Doncaste
rH
ull
Bra
dfo
rdLiv
erp
ool
Hart
lepool
Mancheste
r
Avera
ge p
rice a
ll dw
elli
ngs in 2
002
NDC area NDC average National average
Base: 39 partnerships Source: SDRC
2.53. In eight of the 10 NDC areas in London, average dwelling prices were higher than
the national average. On the other hand, the majority of NDC areas (31 of the 39 areas) had average dwelling prices lower than the national average. Manchester, with an average price of £18,200, had the lowest average dwelling price of any NDC area.
4 Dwelling prices have been sourced from the Land Registry, represent 100% of dwellings sold in
each NDC area and have been rounded to the nearest £100.
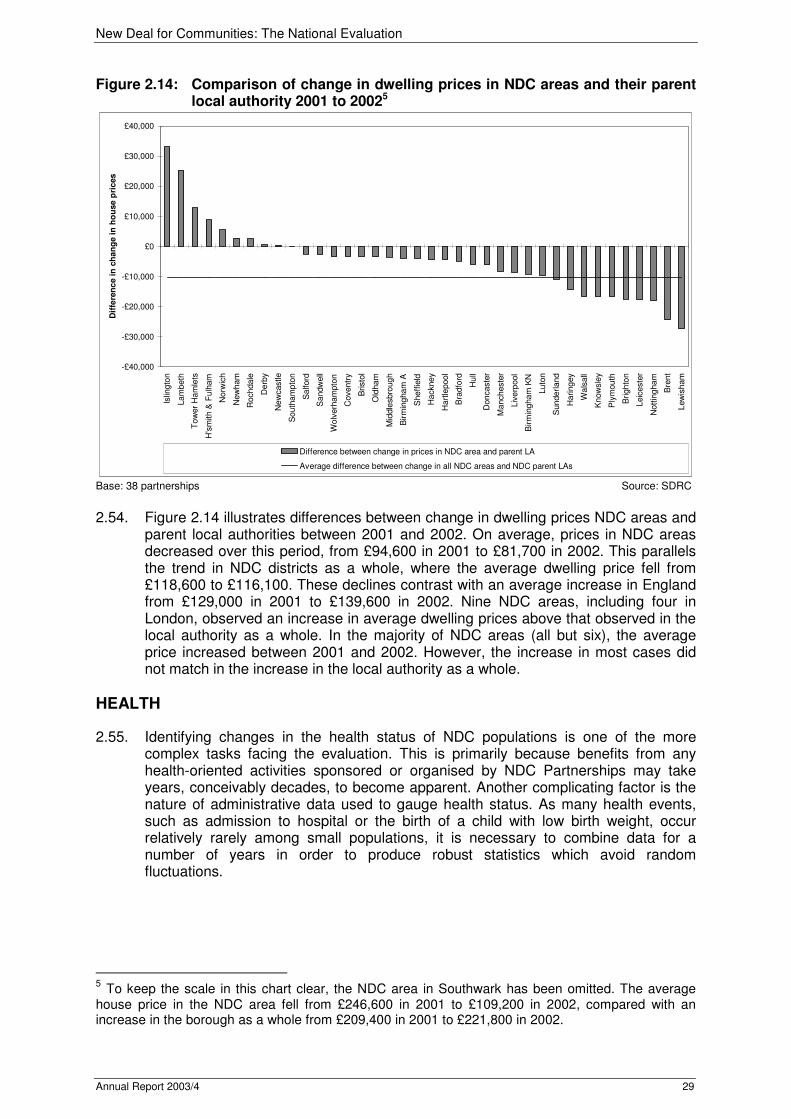
New Deal for Communities: The National Evaluation
Annual Report 2003/4 29
Figure 2.14: Comparison of change in dwelling prices in NDC areas and their parent local authority 2001 to 20025
-£40,000
-£30,000
-£20,000
-£10,000
£0
£10,000
£20,000
£30,000
£40,000
Islin
gto
n
La
mb
eth
To
wer
Ha
mle
ts
H's
mith
& F
ulh
am
No
rwic
h
New
ham
Roch
da
le
De
rby
Ne
wcastle
So
uth
am
pto
n
Sa
lford
Sa
ndw
ell
Wo
lverh
am
pto
n
Coven
try
Bri
sto
l
Old
ha
m
Mid
dle
sbro
ug
h
Bir
min
gha
m A
She
ffie
ld
Ha
ckne
y
Ha
rtle
poo
l
Bra
dfo
rd
Hu
ll
Don
caste
r
Ma
nch
este
r
Liv
erp
ool
Birm
ing
ha
m K
N
Lu
ton
Sun
derl
an
d
Ha
ring
ey
Wa
lsall
Kn
ow
sle
y
Ply
mou
th
Bri
gh
ton
Leic
este
r
Nott
ing
ha
m
Bre
nt
Lew
ish
am
Dif
fere
nc
e i
n c
ha
ng
e i
n h
ou
se
pri
ces
Difference between change in prices in NDC area and parent LA
Average difference between change in all NDC areas and NDC parent LAs
Base: 38 partnerships Source: SDRC
2.54. Figure 2.14 illustrates differences between change in dwelling prices NDC areas and
parent local authorities between 2001 and 2002. On average, prices in NDC areas decreased over this period, from £94,600 in 2001 to £81,700 in 2002. This parallels the trend in NDC districts as a whole, where the average dwelling price fell from £118,600 to £116,100. These declines contrast with an average increase in England from £129,000 in 2001 to £139,600 in 2002. Nine NDC areas, including four in London, observed an increase in average dwelling prices above that observed in the local authority as a whole. In the majority of NDC areas (all but six), the average price increased between 2001 and 2002. However, the increase in most cases did not match in the increase in the local authority as a whole.
HEALTH
2.55. Identifying changes in the health status of NDC populations is one of the more complex tasks facing the evaluation. This is primarily because benefits from any health-oriented activities sponsored or organised by NDC Partnerships may take years, conceivably decades, to become apparent. Another complicating factor is the nature of administrative data used to gauge health status. As many health events, such as admission to hospital or the birth of a child with low birth weight, occur relatively rarely among small populations, it is necessary to combine data for a number of years in order to produce robust statistics which avoid random fluctuations.
5 To keep the scale in this chart clear, the NDC area in Southwark has been omitted. The average house price in the NDC area fell from £246,600 in 2001 to £109,200 in 2002, compared with an increase in the borough as a whole from £209,400 in 2001 to £221,800 in 2002.
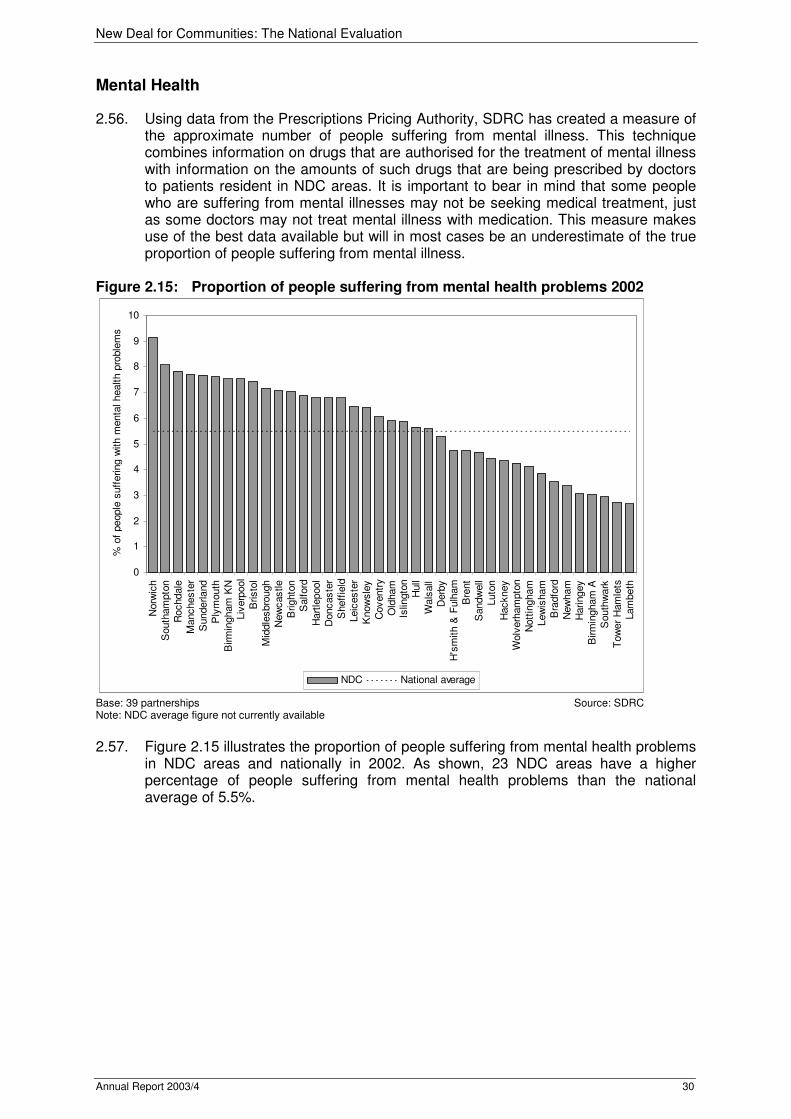
New Deal for Communities: The National Evaluation
Annual Report 2003/4 30
Mental Health
2.56. Using data from the Prescriptions Pricing Authority, SDRC has created a measure of the approximate number of people suffering from mental illness. This technique combines information on drugs that are authorised for the treatment of mental illness with information on the amounts of such drugs that are being prescribed by doctors to patients resident in NDC areas. It is important to bear in mind that some people who are suffering from mental illnesses may not be seeking medical treatment, just as some doctors may not treat mental illness with medication. This measure makes use of the best data available but will in most cases be an underestimate of the true proportion of people suffering from mental illness.
Figure 2.15: Proportion of people suffering from mental health problems 2002
0
1
2
3
4
5
6
7
8
9
10
Norw
ich
South
am
pto
n
Rochdale
Mancheste
r
Sunderland
Ply
mouth
Birm
ingham
KN
Liv
erp
ool
Bristo
l
Mid
dle
sbro
ugh
New
castle
Brighto
n
Salford
Hart
lepool
Doncaste
r
Sheff
ield
Leic
este
r
Know
sle
y
Coventr
y
Old
ham
Islin
gto
n
Hull
Wals
all
Derb
y
H's
mith &
Fulh
am
Bre
nt
Sandw
ell
Luto
n
Hackney
Wolv
erh
am
pto
n
Nott
ingham
Lew
isham
Bra
dfo
rd
New
ham
Haringey
Birm
ingham
A
South
wark
Tow
er
Ham
lets
Lam
beth
% o
f people
suff
ering w
ith m
enta
l health p
roble
ms
NDC National average
Base: 39 partnerships Source: SDRC Note: NDC average figure not currently available
2.57. Figure 2.15 illustrates the proportion of people suffering from mental health problems
in NDC areas and nationally in 2002. As shown, 23 NDC areas have a higher percentage of people suffering from mental health problems than the national average of 5.5%.
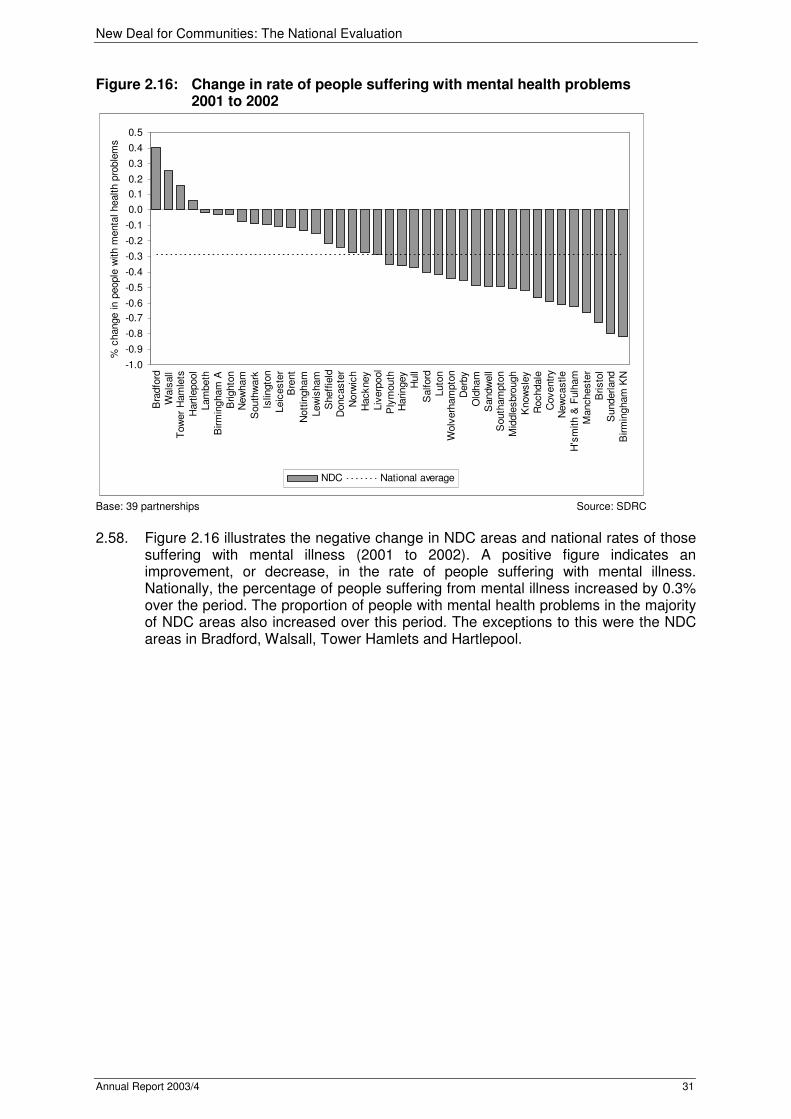
New Deal for Communities: The National Evaluation
Annual Report 2003/4 31
Figure 2.16: Change in rate of people suffering with mental health problems 2001 to 2002
-1.0
-0.9
-0.8
-0.7
-0.6
-0.5
-0.4
-0.3
-0.2
-0.1
0.0
0.1
0.2
0.3
0.4
0.5
Bra
dfo
rd
Wals
all
Tow
er
Ham
lets
Hart
lepool
Lam
beth
Birm
ingham
A
Brighto
nN
ew
ham
South
wark
Islin
gto
n
Leic
este
rB
rent
Nott
ingham
Lew
isham
Sheff
ield
Doncaste
r
Norw
ich
Hackney
Liv
erp
ool
Ply
mouth
Haringey
Hull
Salford
Luto
nW
olv
erh
am
pto
n
Derb
y
Old
ham
Sandw
ell
South
am
pto
n
Mid
dle
sbro
ugh
Know
sle
y
Rochdale
Coventr
yN
ew
castle
H's
mith &
Fulh
am
Mancheste
r
Bristo
lS
underland
Birm
ingham
KN
% c
hange in p
eople
with m
enta
l health p
roble
ms
NDC National average
Base: 39 partnerships Source: SDRC
2.58. Figure 2.16 illustrates the negative change in NDC areas and national rates of those
suffering with mental illness (2001 to 2002). A positive figure indicates an improvement, or decrease, in the rate of people suffering with mental illness. Nationally, the percentage of people suffering from mental illness increased by 0.3% over the period. The proportion of people with mental health problems in the majority of NDC areas also increased over this period. The exceptions to this were the NDC areas in Bradford, Walsall, Tower Hamlets and Hartlepool.

New Deal for Communities: The National Evaluation
Annual Report 2003/4 32
Table 2.10: NDC areas and local authorities: changes in mental illness rates, 2001 to 2002
NDC areas faring relatively better than the parent Local Authority
NDC areas faring relatively worse than the parent Local Authority
NDC
area change
Local authority change
NDC area change
Local authority change
Birmingham Aston 0.0 +0.2 Birmingham Kings Norton +0.8 +0.2 Bradford -0.4 +0.2 Bristol +0.7 +0.3 Brighton 0.0 +0.1 Coventry +0.6 +0.4 Hartlepool -0.1 0.0 Derby +0.5 +0.3 Islington +0.1 +0.3 Hackney +0.3 +0.2 Lambeth 0.0 +0.2 Hammersmith & Fulham +0.6 +0.1 Leicester +0.1 +0.1 Hull +0.4 +0.2 Luton +0.4 +0.5 Lewisham, +0.2 +0.1 Norwich +0.3 +0.4 Liverpool +0.3 +0.2 Nottingham +0.1 +0.2 Manchester +0.7 +0.3 Sheffield +0.2 +0.4 Middlesbrough +0.5 +0.4 Southwark +0.1 +0.2 Newcastle +0.6 +0.5 Tower Hamlets -0.1 0.0 Oldham +0.5 +0.3 Walsall -0.3 +0.2 Plymouth +0.4 +0.2 Rochdale +0.6 +0.4 Sandwell +0.5 +0.4
Southampton +0.5 +0.4 NDC Areas faring relatively better by less than 0.1% Sunderland +0.8 +0.7 Wolverhampton +0.4 +0.3 Newham Haringey
NDC Areas faring relatively worse by less than 0.1%
Brent Doncaster Knowsley Salford
2.59. Table 2.10 lists changes in the rates of mental illness in each NDC area along with
the change observed in the parent local authority from 2001 to 2002. Those NDC areas that fared relatively better than this local authority on this measure are listed in the left hand column. For example, the rate of people suffering from mental illness remained the same in the Birmingham Aston NDC area while the rate in Birmingham as a whole increased by 0.2% over this period.
2.60. 16 NDC areas improved their position relative to the local authority between 2001
and 2002 while 23 worsened. In most cases, differences in the rates of change between NDC areas and their parent local authorities were minor. The largest differences were observed in Bradford, where the rate of mental illness in the NDC area declined by 0.4% while increasing by 0.2% in the city as a whole, and in Birmingham, where the rate in the Kings Norton NDC area increased by 0.8% compared with an increase of 0.2% in the city as a whole.
Comparative Illness
2.61. General levels of illness in NDC areas are measured by a Comparative Illness Figure (CIF), which combines DWP data on people receiving illness-related benefits with

New Deal for Communities: The National Evaluation
Annual Report 2003/4 33
levels of illness that would be expected in a standardised population. The illness-related benefits used are IB and SDA, discussed above. In addition two other illness-related benefits are used for this analysis: Disability Living Allowance, paid to people who are generally below pensionable age to help with the costs of personal care or mobility assistance due to a disability and Attendance Allowance, paid to those over 65 to help with the additional costs of care they require due to a disability. The standardised population used in the calculation of the CIF is that for England as a whole.
Figure 2.17: Comparative illness figure 2002
0
50
100
150
200
250
300
350
Know
sle
y
Liv
erp
ool
Mancheste
r
New
castle
Sunderland
Hart
lepool
Coventr
yN
ott
ingham
Sheff
ield
Salford
Mid
dle
sbro
ugh
Ply
mouth
Bra
dfo
rd
Doncaste
r
Old
ham
Rochdale
Birm
ingham
AB
irm
ingham
KN
Bristo
l
Hull
Wolv
erh
am
pto
n
Leic
este
rT
ow
er
Ham
lets
Wals
all
Derb
y
Brighto
n
New
ham
Hackney
Sandw
ell
Haringey
Bre
nt
Islin
gto
nN
orw
ich
Lew
isham
H's
mith &
Fulh
am
Luto
n
South
am
pto
nS
outh
wark
Lam
beth
Com
para
tive illn
ess f
igure
NDC National average
Base: 39 partnerships Source: SDRC Note: NDC average figure not currently available
2.62. Figure 2.17 illustrates the national and NDC comparative illness figure for 2002.
Figures are standardised using the population of England as a whole, with the figure for England set to 100. A CIF of more than 100 indicates a higher level of illness and disability than would be expected given the age and sex distribution of the population in an NDC area. A score of 200 indicates that the levels of illness and disability in the area are twice as high as would be expected.
2.63. All 39 NDC areas have a higher level of illness and disability than would be expected
given their age and sex distributions, given the population of England as a whole. Two NDC areas, Knowsley and Liverpool, have levels of illness and disability three times greater than would be expected. Twelve NDC areas have a CIF between 200 and 300, indicted at least double the levels of illness and disability that would be expected.
2.64. In Figure 2.17, the 16 NDC areas in London, South East, South West and East of
England are shaded in black. The 10 NDC areas with the lowest relative levels of illness and disability, are all from these regions.
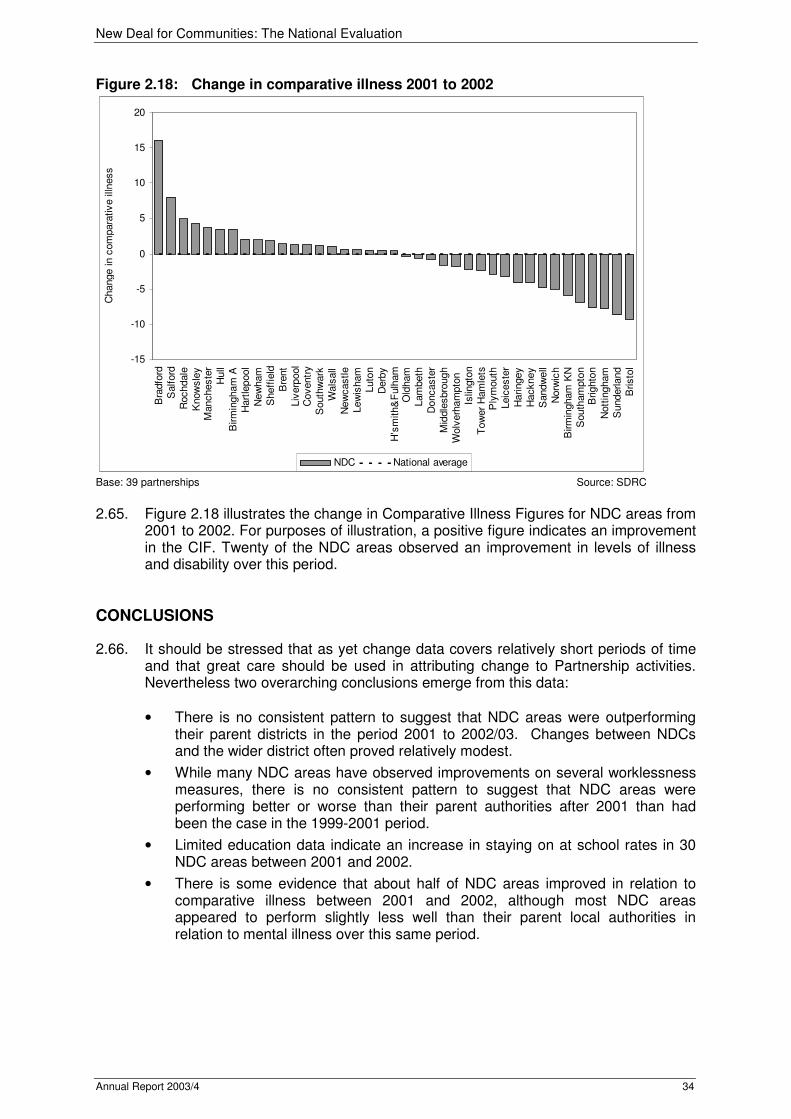
New Deal for Communities: The National Evaluation
Annual Report 2003/4 34
Figure 2.18: Change in comparative illness 2001 to 2002
-15
-10
-5
0
5
10
15
20
Bra
dfo
rd
Salford
Rochdale
Know
sle
yM
ancheste
r
Hull
Birm
ingham
A
Hart
lepool
New
ham
Sheff
ield
Bre
nt
Liv
erp
ool
Coventr
y
South
wark
Wals
all
New
castle
Lew
isham
Luto
n
Derb
y
H's
mith&
Fulh
am
Old
ham
Lam
beth
Doncaste
r
Mid
dle
sbro
ugh
Wolv
erh
am
pto
n
Islin
gto
n
Tow
er
Ham
lets
Ply
mouth
Leic
este
r
Haringey
Hackney
Sandw
ell
Norw
ich
Birm
ingham
KN
South
am
pto
nB
righto
n
Nott
ingham
Sunderland
Bristo
l
Change in c
om
para
tive illn
ess
NDC National average
Base: 39 partnerships Source: SDRC
2.65. Figure 2.18 illustrates the change in Comparative Illness Figures for NDC areas from
2001 to 2002. For purposes of illustration, a positive figure indicates an improvement in the CIF. Twenty of the NDC areas observed an improvement in levels of illness and disability over this period.
CONCLUSIONS
2.66. It should be stressed that as yet change data covers relatively short periods of time and that great care should be used in attributing change to Partnership activities. Nevertheless two overarching conclusions emerge from this data:
• There is no consistent pattern to suggest that NDC areas were outperforming their parent districts in the period 2001 to 2002/03. Changes between NDCs and the wider district often proved relatively modest.
• While many NDC areas have observed improvements on several worklessness measures, there is no consistent pattern to suggest that NDC areas were performing better or worse than their parent authorities after 2001 than had been the case in the 1999-2001 period.
• Limited education data indicate an increase in staying on at school rates in 30 NDC areas between 2001 and 2002.
• There is some evidence that about half of NDC areas improved in relation to comparative illness between 2001 and 2002, although most NDC areas appeared to perform slightly less well than their parent local authorities in relation to mental illness over this same period.
New Deal for Communities: The National Evaluation
Annual Report 2003/4 35
CHAPTER 3: VALUE FOR MONEY: EARLY FINDINGS
INTRODUCTION
3.1. The Value for Money (VFM) strand is contributing to the overall evaluation effort by examining:
• Expenditure associated with NDC activity.
• Ways in which these funds are being used.
• Outputs that they are generating.
• And ultimately, to assess whether, and to what extent, changes in outcomes in the 39 neighbourhoods can be attributed to the NDC programme.
3.2. The focus of the VFM strand of the evaluation in 2003/04 has been on:
• The analysis of 'micro' data relating to a sample of projects drawn from workbooks completed by the national evaluation team’s 39 local project evaluators. This provides a rich data set in relation to the activities and delivery mechanisms of projects; sources of expenditure used to fund them; outputs and outcomes they are anticipated to generate; and early lessons from project delivery.
• The collation and analysis of 'macro' data relating to NDC expenditure and matched funding at the project level across the Programme as a whole, as well as associated information on quantifiable outputs generated by projects.
EARLY EVIDENCE: THE PROJECT LEVEL
3.3. At the outset it must be stressed that 2003/04 was the first opportunity for the national evaluation team to look in depth at individual projects. Prior to that, many projects were still at the inception stage, and the national evaluation was more generally concerned with early lessons relating to Partnership process and Programme development at the local level. By 2003/04, however, there were enough projects underway across the 39 Partnerships to warrant closer inspection of activity on the ground, and to see what lessons were emerging which could inform the NDC Programme as a whole.
3.4. The themes used for sampling and analysis of projects are: community development;
community safety; education; health; housing and physical environment; and worklessness - the key outcome areas pursued through the NDC programme. The approach to project selection involved the national team’s 39 local evaluators identifying one project in each theme that was judged to be sufficiently advanced to merit attention. The final sample was selected to ensure representation across themes.
Project Design
Specification in Relation to Baseline Evidence and Effectiveness of Targeting
3.5. In general, the 39 projects appear to be well thought out in terms of the problems identified, wider policy issues, a sound analysis and interpretation of the available evidence base, and local knowledge. Across all themes, 58% of projects are tightly focused on particular target groups within the NDC area, while 42% are concerned to meet the broader needs of the population at large. Education and worklessness projects are more likely to be tightly focused on key groups than projects in other

New Deal for Communities: The National Evaluation
Annual Report 2003/4 36
themes. In relation to the success of the targeting effort, 36% of the projects were assessed by the evaluators as very good, 45% as good and 15% as average. None were assessed as poorly targeted, but themes where targeting efforts appeared to be less successful were health, and housing and physical environment.
BME Aspects of Project Design
3.6. Across these 39 projects 40% were reported as having some BME aspect to them. There was some variation by theme. Sample projects in the education and community development themes were more likely to have BME aspects than those in the housing and physical environment and worklessness themes. The limited BME dimension to worklessness projects in the sample is surprising since worklessness projects are more likely than some other themes to be targeted on particular groups.
Innovation and Best Practice in Design
3.7. Many of the case study project evaluations mentioned that collaborative working was something of a novelty in their area. On the one hand this confirms the need for 'joined up' solutions to problems which are typically complex and deeply embedded. On the other, and in a more optimistic vein, it points to more successful NDC funded projects emerging as role models of good practice in implementation and delivery. Major changes confirmed as new to particular NDC areas were:
• adopting an holistic approach aimed at tackling a problem in the round bearing in mind its likely underlying causes (e.g. health, community development);
• focussing in on particular target groups either as a preventative measure or in service delivery (education and community safety);
• and taking information about, and delivery of, the service to residents through the development of outreach, rather than relying on prospective beneficiaries travelling to some central location often outside the NDC area (e.g. worklessness, housing and physical environment).
Project Delivery
What was NDC Funding Used For?
3.8. A review of the 39 projects revealed that in 85% of cases funding had been required for staffing. This, of course, is to be expected since the vast majority of the projects in each of the theme groups are intended to improve, or plug gaps in, services, and provision of these services is typically labour intensive. The fact that 41% of projects involve the purchase of equipment, and 38% incur accommodation running costs, suggests that in about two fifths of cases there was some new or expanded local service delivery physically based in or near to the NDC area. Overall only 10% of projects involved building works on any scale and a further 5% works on environmental or security improvements.
How Long is NDC Funding For?
3.9. Overall the average duration of the sample projects is forecast at 3.4 years. It is interesting to note that the theme with the longest average planned project lifespan is housing and physical environment (7.5 years). This theme included a major housing stock transfer and renewal project that is likely to have elongated the mean duration. On the other hand, it is rather surprising to find that, on average, health projects have a planned duration of 1.9 years. Many of these depend for their success on changing attitudes, and, ultimately, lifestyles. It is widely recognised that progress in these areas typically depends on re-enforcement of the message and long-term
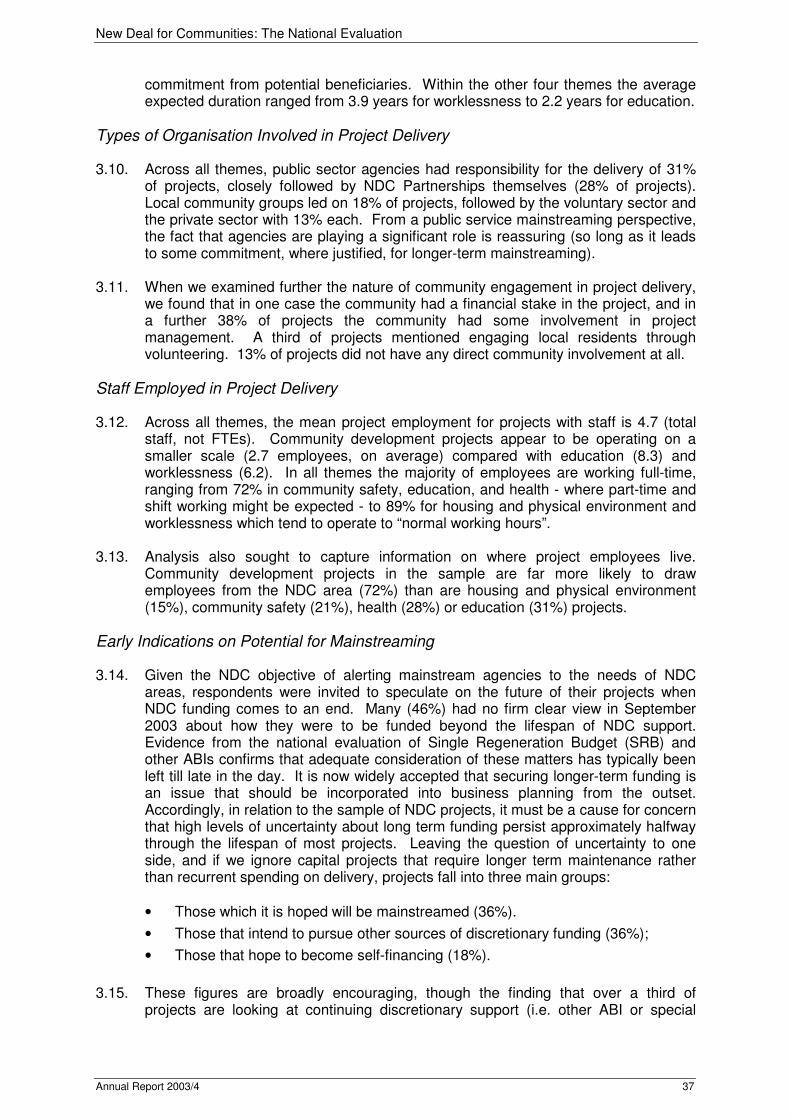
New Deal for Communities: The National Evaluation
Annual Report 2003/4 37
commitment from potential beneficiaries. Within the other four themes the average expected duration ranged from 3.9 years for worklessness to 2.2 years for education.
Types of Organisation Involved in Project Delivery
3.10. Across all themes, public sector agencies had responsibility for the delivery of 31% of projects, closely followed by NDC Partnerships themselves (28% of projects). Local community groups led on 18% of projects, followed by the voluntary sector and the private sector with 13% each. From a public service mainstreaming perspective, the fact that agencies are playing a significant role is reassuring (so long as it leads to some commitment, where justified, for longer-term mainstreaming).
3.11. When we examined further the nature of community engagement in project delivery,
we found that in one case the community had a financial stake in the project, and in a further 38% of projects the community had some involvement in project management. A third of projects mentioned engaging local residents through volunteering. 13% of projects did not have any direct community involvement at all.
Staff Employed in Project Delivery
3.12. Across all themes, the mean project employment for projects with staff is 4.7 (total staff, not FTEs). Community development projects appear to be operating on a smaller scale (2.7 employees, on average) compared with education (8.3) and worklessness (6.2). In all themes the majority of employees are working full-time, ranging from 72% in community safety, education, and health - where part-time and shift working might be expected - to 89% for housing and physical environment and worklessness which tend to operate to “normal working hours”.
3.13. Analysis also sought to capture information on where project employees live.
Community development projects in the sample are far more likely to draw employees from the NDC area (72%) than are housing and physical environment (15%), community safety (21%), health (28%) or education (31%) projects.
Early Indications on Potential for Mainstreaming
3.14. Given the NDC objective of alerting mainstream agencies to the needs of NDC areas, respondents were invited to speculate on the future of their projects when NDC funding comes to an end. Many (46%) had no firm clear view in September 2003 about how they were to be funded beyond the lifespan of NDC support. Evidence from the national evaluation of Single Regeneration Budget (SRB) and other ABIs confirms that adequate consideration of these matters has typically been left till late in the day. It is now widely accepted that securing longer-term funding is an issue that should be incorporated into business planning from the outset. Accordingly, in relation to the sample of NDC projects, it must be a cause for concern that high levels of uncertainty about long term funding persist approximately halfway through the lifespan of most projects. Leaving the question of uncertainty to one side, and if we ignore capital projects that require longer term maintenance rather than recurrent spending on delivery, projects fall into three main groups:
• Those which it is hoped will be mainstreamed (36%).
• Those that intend to pursue other sources of discretionary funding (36%);
• Those that hope to become self-financing (18%).
3.15. These figures are broadly encouraging, though the finding that over a third of
projects are looking at continuing discretionary support (i.e. other ABI or special
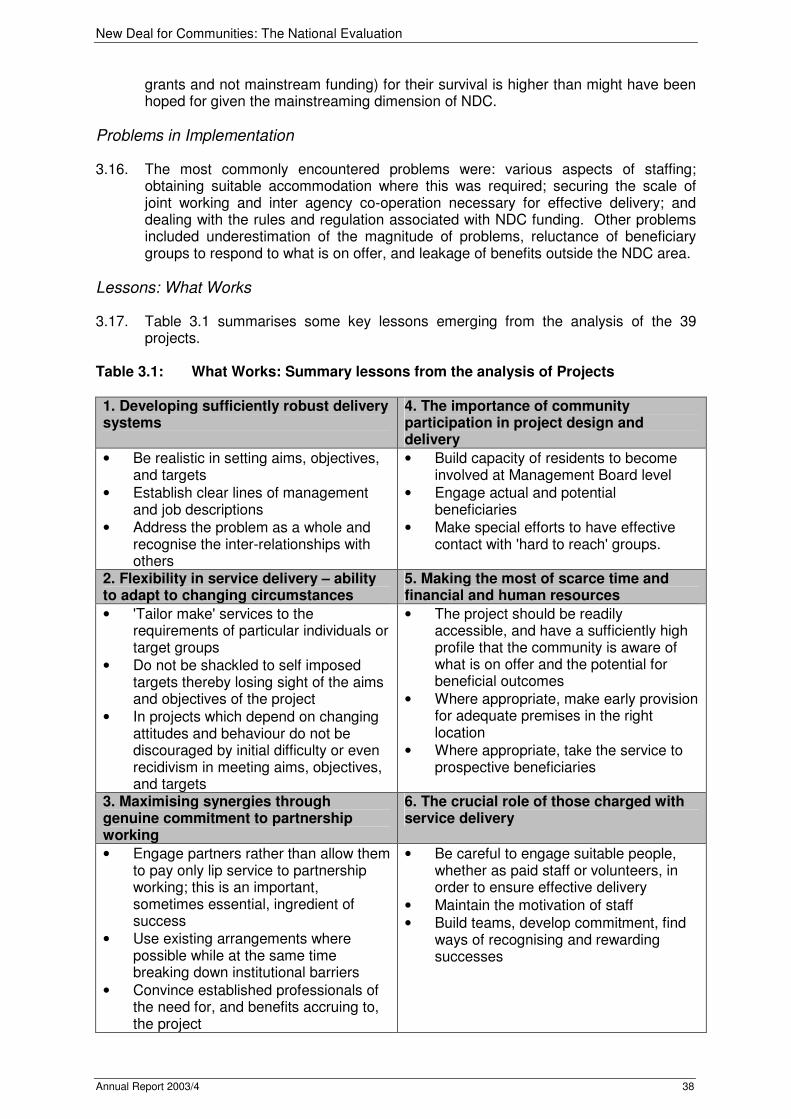
New Deal for Communities: The National Evaluation
Annual Report 2003/4 38
grants and not mainstream funding) for their survival is higher than might have been hoped for given the mainstreaming dimension of NDC.
Problems in Implementation
3.16. The most commonly encountered problems were: various aspects of staffing; obtaining suitable accommodation where this was required; securing the scale of joint working and inter agency co-operation necessary for effective delivery; and dealing with the rules and regulation associated with NDC funding. Other problems included underestimation of the magnitude of problems, reluctance of beneficiary groups to respond to what is on offer, and leakage of benefits outside the NDC area.
Lessons: What Works
3.17. Table 3.1 summarises some key lessons emerging from the analysis of the 39 projects.
Table 3.1: What Works: Summary lessons from the analysis of Projects 1. Developing sufficiently robust delivery systems
4. The importance of community participation in project design and delivery
• Be realistic in setting aims, objectives, and targets
• Establish clear lines of management and job descriptions
• Address the problem as a whole and recognise the inter-relationships with others
• Build capacity of residents to become involved at Management Board level
• Engage actual and potential beneficiaries
• Make special efforts to have effective contact with 'hard to reach' groups.
2. Flexibility in service delivery – ability to adapt to changing circumstances
5. Making the most of scarce time and financial and human resources
• 'Tailor make' services to the requirements of particular individuals or target groups
• Do not be shackled to self imposed targets thereby losing sight of the aims and objectives of the project
• In projects which depend on changing attitudes and behaviour do not be discouraged by initial difficulty or even recidivism in meeting aims, objectives, and targets
• The project should be readily accessible, and have a sufficiently high profile that the community is aware of what is on offer and the potential for beneficial outcomes
• Where appropriate, make early provision for adequate premises in the right location
• Where appropriate, take the service to prospective beneficiaries
3. Maximising synergies through genuine commitment to partnership working
6. The crucial role of those charged with service delivery
• Engage partners rather than allow them to pay only lip service to partnership working; this is an important, sometimes essential, ingredient of success
• Use existing arrangements where possible while at the same time breaking down institutional barriers
• Convince established professionals of the need for, and benefits accruing to, the project
• Be careful to engage suitable people, whether as paid staff or volunteers, in order to ensure effective delivery
• Maintain the motivation of staff
• Build teams, develop commitment, find ways of recognising and rewarding successes
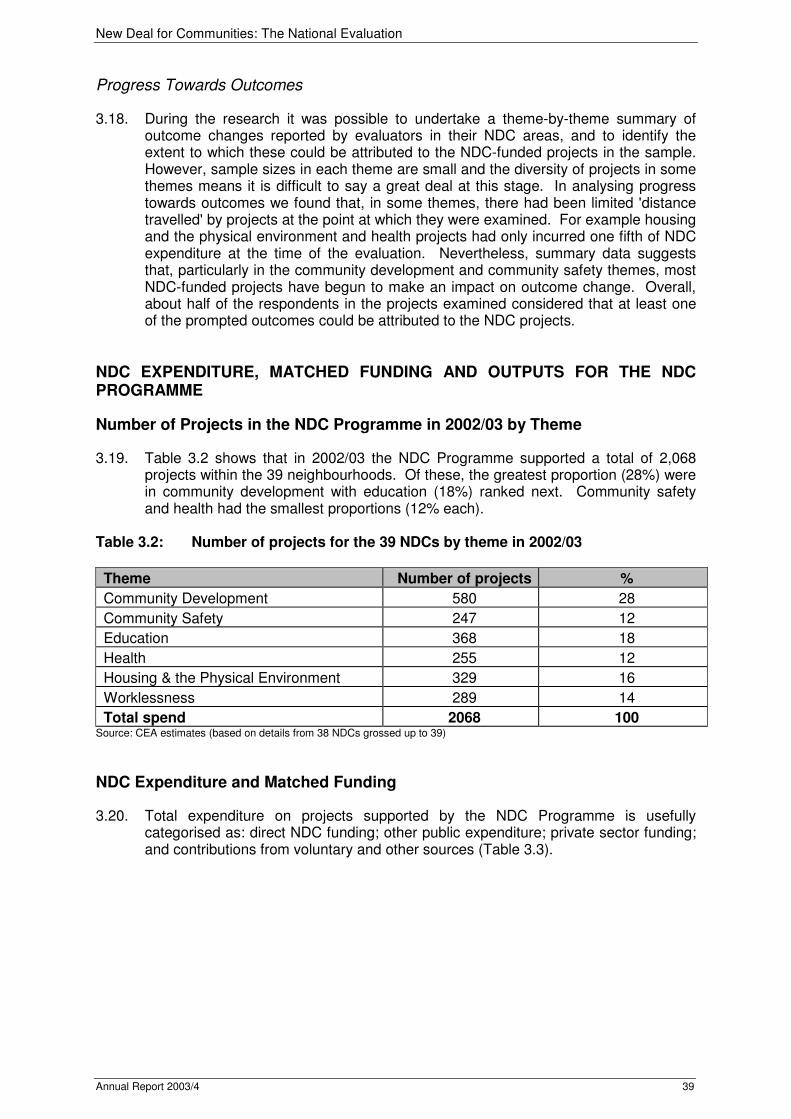
New Deal for Communities: The National Evaluation
Annual Report 2003/4 39
Progress Towards Outcomes
3.18. During the research it was possible to undertake a theme-by-theme summary of outcome changes reported by evaluators in their NDC areas, and to identify the extent to which these could be attributed to the NDC-funded projects in the sample. However, sample sizes in each theme are small and the diversity of projects in some themes means it is difficult to say a great deal at this stage. In analysing progress towards outcomes we found that, in some themes, there had been limited 'distance travelled' by projects at the point at which they were examined. For example housing and the physical environment and health projects had only incurred one fifth of NDC expenditure at the time of the evaluation. Nevertheless, summary data suggests that, particularly in the community development and community safety themes, most NDC-funded projects have begun to make an impact on outcome change. Overall, about half of the respondents in the projects examined considered that at least one of the prompted outcomes could be attributed to the NDC projects.
NDC EXPENDITURE, MATCHED FUNDING AND OUTPUTS FOR THE NDC PROGRAMME
Number of Projects in the NDC Programme in 2002/03 by Theme
3.19. Table 3.2 shows that in 2002/03 the NDC Programme supported a total of 2,068 projects within the 39 neighbourhoods. Of these, the greatest proportion (28%) were in community development with education (18%) ranked next. Community safety and health had the smallest proportions (12% each).
Table 3.2: Number of projects for the 39 NDCs by theme in 2002/03
Theme Number of projects %
Community Development 580 28
Community Safety 247 12
Education 368 18
Health 255 12
Housing & the Physical Environment 329 16
Worklessness 289 14
Total spend 2068 100 Source: CEA estimates (based on details from 38 NDCs grossed up to 39)
NDC Expenditure and Matched Funding
3.20. Total expenditure on projects supported by the NDC Programme is usefully categorised as: direct NDC funding; other public expenditure; private sector funding; and contributions from voluntary and other sources (Table 3.3).

New Deal for Communities: The National Evaluation
Annual Report 2003/4 40
Table 3.3: Total gross expenditure on all projects in the 39 NDC areas by theme for 2002-3 (£000s)
Theme NDC
Other public sector
Total public expenditure
Private sector
Voluntary/ all other
Total Expenditure
Community Development 35527 6790 42317 1658 254
44229
Community Safety 17293 7946 25239 313 1 25553
Education 20292 18128 38420 1003 27 39450
Health 12226 6171 18397 102 22 18521
Housing and the Physical Environment 33606 14661 48267 801 87
49155
Worklessness 20134 9989 30123 8815 12 38950 Total project spend 139078 63685 202763 12692 403 215858
Management/ administration* 22016 22016
22016
Total spend 161094 224779 237874 Source: CEA estimates (based on 26 NDCs who gave detail on NDC and Matched Funding) * Source NRU actual accruals for 2002-3.
3.21. Table 3.3 shows that, in 2002/03, direct NDC funding towards the Programme was £161.1m of which £139.1 was attributable to project spend. When funding from other public sector sources is taken into account (£63.6m) total public expenditure amounted to some £224.8m. Matching funding from the private sector was only £12.9m. That from the voluntary sector was even less at £0.4m. At first sight the latter two contributions appear to be disappointingly small. However, the problems of involving the private sector in area regeneration and neighbourhood renewal are well known; and resources available to the voluntary sector are relatively small. In interpreting the data it should be recalled that offerings from these sectors often comes in the form of donations of time or otherwise in kind, and they can make a disproportionate contribution to the success of project delivery and consequent outcomes. When expenditures from all sources are taken together, total expenditure on 2,068 projects in the 39 areas was about £215.9m in 2002/03.
3.22. By way of comparison, some limited evidence is available on total NDC expenditure
for 2001-2. This amounted to £81.5 m for all 39 NDCs. Although only 32 NDCs provided a breakdown of this actual expenditure by project, this was sufficient to allow for a thematic breakdown of spend by revenue and capital expenditure. This is shown in Table 3.4.
Table 3.4: NDC expenditure by theme for 2001/02
NDC EXPENDITURE Theme Revenue Capital Total*
Community Development 8790 5498 15079 Community Safety 4305 1903 6254 Education 4969 2986 8141 Health 2523 461 3068 Housing and the Physical Environment 5584 9662 16209 Worklessness 4767 1910 7551 Total spend 30938 22420 56302
*NB Total includes expenditure for Brighton which was not provided with a capital/revenue split. Source: CEA Estimates
3.23. Figures 3.1 and 3.2 illustrate NDC expenditure by theme for 2001/02 and 2002/03.
As is developed above in 3.24, there is evidence of substantially greater spend in 2002/03 than had occurred the previous year. However, the relative allocation of resources across the five outcome areas and community development remained

New Deal for Communities: The National Evaluation
Annual Report 2003/4 41
relatively consistent across the two years: less resource was allocated to health and community safety and more to community development and housing and the physical environment.
Figure 3.1: Absolute NDC expenditure by theme: 2001/02 and 2002/03
0
10000
20000
30000
40000
50000
60000C
om
munity
Develo
pm
ent
Com
munity
Safe
ty
Education
Health
Housin
g a
nd
the P
hysic
al
Environm
ent
Work
lessness
ND
C E
xpenditure
(£000s)
2001/2 2002/3
(2001/02 based on 32 NDCs and 2002/03 based on 39 NDCs) Source: CEA Estimates
Figure 3.2: Percentage NDC expenditure by theme: 2001/02 and 2002/03
0
5
10
15
20
25
30
35
Com
munity
Develo
pm
ent
Com
munity
Safe
ty
Education
Health
Housin
g a
nd t
he
Physic
al
Environm
ent
Work
lessness
% o
f N
DC
Expenditure
2001/2 2002/3
(2001/02 based on 32 NDCs and 2002/03 based on 39 NDCs) Source: CEA Estimates
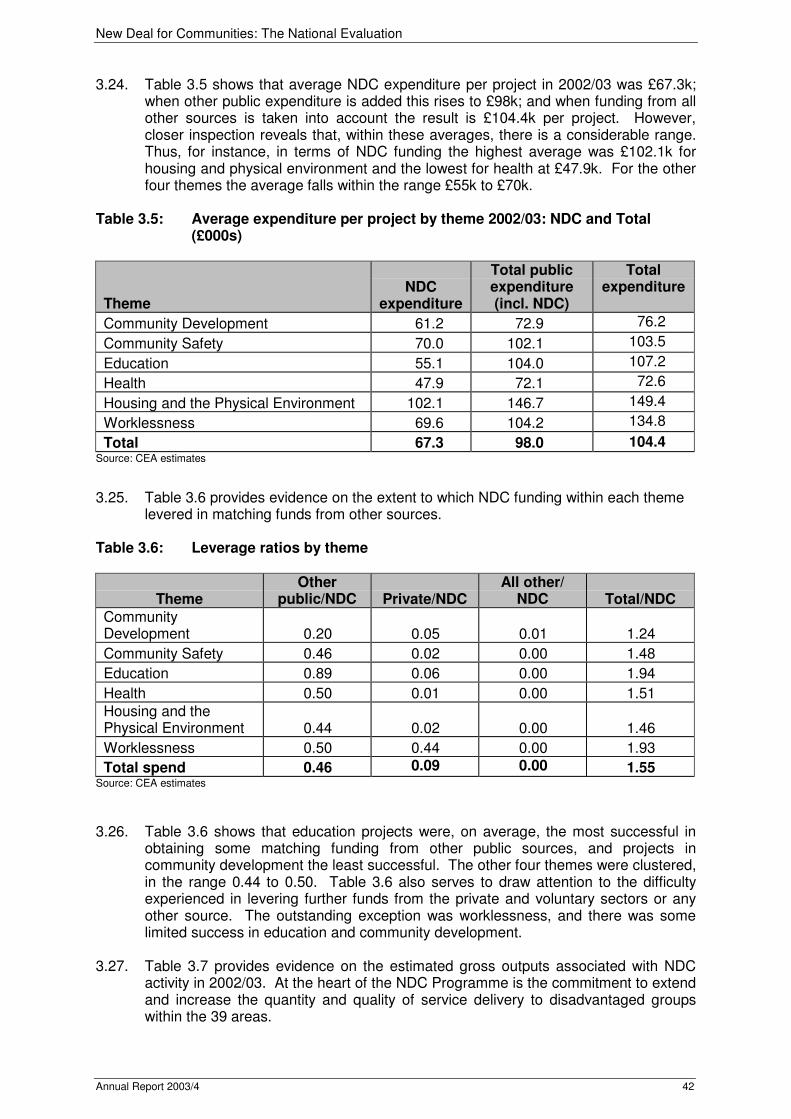
New Deal for Communities: The National Evaluation
Annual Report 2003/4 42
3.24. Table 3.5 shows that average NDC expenditure per project in 2002/03 was £67.3k; when other public expenditure is added this rises to £98k; and when funding from all other sources is taken into account the result is £104.4k per project. However, closer inspection reveals that, within these averages, there is a considerable range. Thus, for instance, in terms of NDC funding the highest average was £102.1k for housing and physical environment and the lowest for health at £47.9k. For the other four themes the average falls within the range £55k to £70k.
Table 3.5: Average expenditure per project by theme 2002/03: NDC and Total (£000s)
Theme NDC
expenditure
Total public expenditure (incl. NDC)
Total expenditure
Community Development 61.2 72.9 76.2
Community Safety 70.0 102.1 103.5
Education 55.1 104.0 107.2
Health 47.9 72.1 72.6
Housing and the Physical Environment 102.1 146.7 149.4
Worklessness 69.6 104.2 134.8
Total 67.3 98.0 104.4 Source: CEA estimates
3.25. Table 3.6 provides evidence on the extent to which NDC funding within each theme levered in matching funds from other sources.
Table 3.6: Leverage ratios by theme
Theme Other
public/NDC Private/NDC All other/
NDC Total/NDC
Community Development 0.20 0.05 0.01 1.24
Community Safety 0.46 0.02 0.00 1.48
Education 0.89 0.06 0.00 1.94
Health 0.50 0.01 0.00 1.51
Housing and the Physical Environment 0.44 0.02 0.00 1.46
Worklessness 0.50 0.44 0.00 1.93
Total spend 0.46 0.09 0.00 1.55 Source: CEA estimates
3.26. Table 3.6 shows that education projects were, on average, the most successful in
obtaining some matching funding from other public sources, and projects in community development the least successful. The other four themes were clustered, in the range 0.44 to 0.50. Table 3.6 also serves to draw attention to the difficulty experienced in levering further funds from the private and voluntary sectors or any other source. The outstanding exception was worklessness, and there was some limited success in education and community development.
3.27. Table 3.7 provides evidence on the estimated gross outputs associated with NDC
activity in 2002/03. At the heart of the NDC Programme is the commitment to extend and increase the quantity and quality of service delivery to disadvantaged groups within the 39 areas.

New Deal for Communities: The National Evaluation
Annual Report 2003/4 43
Table 3.7: Estimated gross outputs for the NDC Programme in 2002-03
Theme
Co
mm
un
ity
Develo
pm
en
t
Co
mm
un
ity
Safe
ty
Ed
ucati
on
Healt
h
Ho
usin
g/
ph
ysic
al
en
vir
on
men
t
Wo
rkle
ssn
es
s
To
tal
Jobs created 314 174 373 120 89 702 1772
Jobs safeguarded 311 196 145 87 39 265 1042
No. pupils benefiting from projects 8658 2468 67762 5808 1557 9646 95898
People trained got qualifications 753 274 2231 415 0 1672 5345
Residents accessing employment thru training
119 0 34 16 0 1800 1969
No. training weeks 1540 367 4246 1901 465 7622 16142
No. people trained got jobs previously unemployed
35 42 47 2 0 611 737
Young people on projects: person/social development
22497 4576 9758 2301 440 561 40132
No. from disadvantaged groups who got job
84 0 30 25 0 215 355
No. new business start-ups 6 0 0 0 0 143 149
No. businesses advised 416 44 86 0 21 1330 1896
No. improved dwellings 0 0 0 170 1509 2 1681
No. people benefiting from community safety initiatives
3269 76096 3004 0 11340 735 94443
No. community safety initiatives 182 2144 2 0 112 2 2443
No. youth crime prevention initiatives 44 191 13 2 0 0 250
No. properties buildings where security upgraded
41 10406 0 0 588 549 11585
Hectares of land improved/reclaimed for development
0 0 0 0 8 0 8
No local people access to new health/sports/cult opps
29808 2764 6001 3394 2894 101 44963
No. of new health /sports/cultural facilities 8 6 4 63 10 2 92
No. using improved health/sports/cult facilities
1542 0 2442 6379 0 0 10362
No. of improved health/sports/cultural facilities
6 0 0 11 21 0 38
No. buildings improved/brought back into use
10 0 4 4 4 17 38
No. voluntary/community organisations supported
2623 105 309 272 517 199 4025
No. individuals involved in voluntary work 2628 220 433 263 687 58 4289
No. new childcare places 284 11 101 4 0 294 694
No. of capacity building Initiatives carried out
211 4 17 66 123 17 438
Number of meetings/events 3613 36 925 607 280 1742 7203
No. people given information/assisted 4503 279 10691 5661 891 2881 24906
No. people consulted/involved 8039 0 3424 4295 8002 14 23775
No. residents taking up provision 11460 417 2461 1475 980 4186 20980 Source: CEA estimates
Black and Minority Ethnic (BME) Outputs
3.28. Table 3.8 summarises evidence in relation to the proportion of BME outputs for the 14 NDCs that provided information for 2002/03. There is significant variation

New Deal for Communities: The National Evaluation
Annual Report 2003/4 44
according to the category of output. Thus, job creation is relatively low at 14%, but training and support for voluntary and community groups are higher.
Table 3.8: Selected BME outputs as a % of total outputs Jobs created No. pupils
benefiting from
projects
No. people trained obt
quals
No. residents accessing emp thru
training etc
No. training weeks
Community Development
15.8 7.9
14.5 28.8 0.3
Crime/Safety 18.4 - - - 7.7
Education 6.0 11.2 5.8 - -
Health 11.4 12.8 12.1 - -
Housing/phys env
7.1 40.2 - - 0.5
Worklessness 16.3 - 30.7 32.7 5.2
Total 13.6 10.4 17.1 31.5 3.0
No. people trained obt jobs prev
unemp
Young people ben
projects promoting
personal/soc dev
No. targeted from
disadvantaged groups who obt a
job
No. people benefiting
from comm. Safety inits
No. given access to
new health/ sports/
cultural facs
Community Development
- 19.5 - 2.7 18.0
Crime/Safety 5.0 7.5 - 0.5 3.2
Education - 40.6 - 67.3 13.5
Health - 46.1 35.7 14.6 20.5
Housing/phys env
- 32.2 - 3.8 -
Worklessness 16.3 7.0 73.1 9.9 -
Total 12.4 25.3 64.3 1.2 16.9
No. voluntary/
comm. orgs supported
No. individuals involved in
vol work
No. people given
information/ assisted
No. people consulted/in
volved
No. residents taking up provision
Community Development
37.0 16.1 6.8 2.0 26.0
Crime/Safety - 13.2 46.7 - -
Education 24.6 36.5 88.6 14.4 4.7
Health 5.3 33.7 44.3 5.9 1.1
Housing/phys env
6.0 9.1 - 3.1 -
Worklessness 41.5 0.8 41.1 - 14.9
Total 31.8 17.6 33.7 3.2 9.6 Based on 14 NDCs
6 that provided BME output information (2002-3) Source: CEA Estimates
6 Bristol, Coventry, Hammersmith/Fulham, Hackney, Hartlepool, Lambeth, Lewisham, Luton, Manchester, Newham, Oldham,
Sandwell, Southwark, Tower Hamlets.
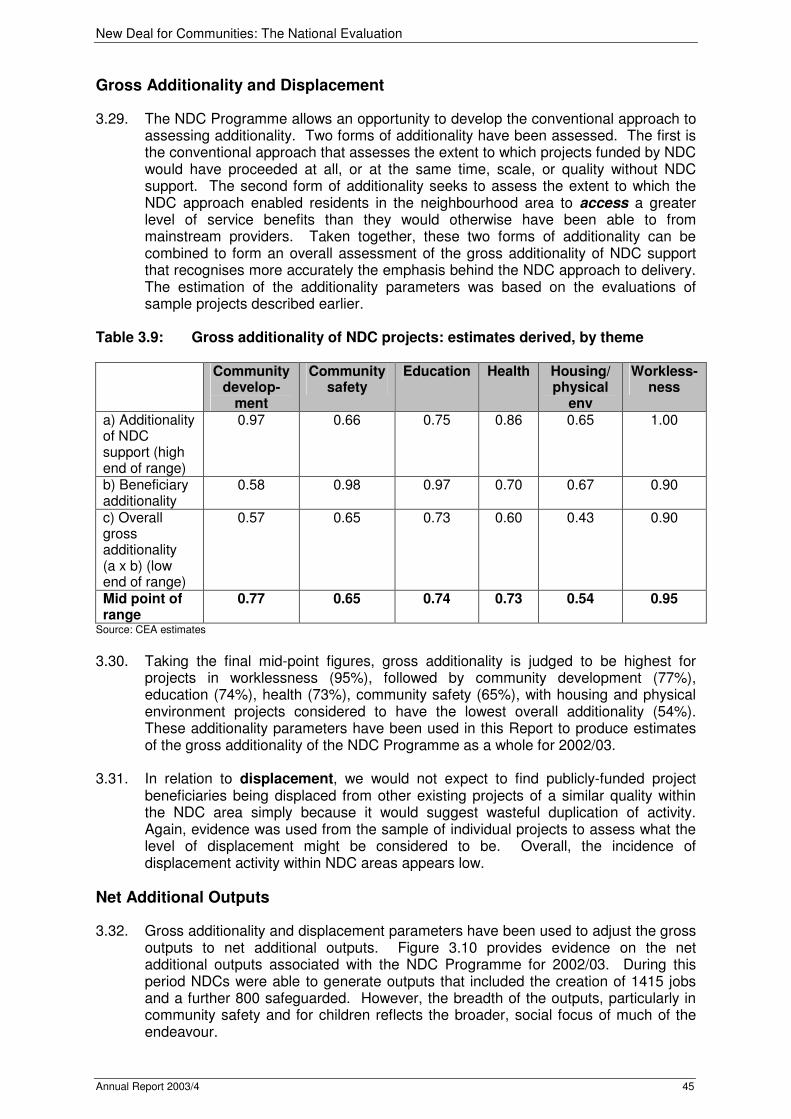
New Deal for Communities: The National Evaluation
Annual Report 2003/4 45
Gross Additionality and Displacement
3.29. The NDC Programme allows an opportunity to develop the conventional approach to assessing additionality. Two forms of additionality have been assessed. The first is the conventional approach that assesses the extent to which projects funded by NDC would have proceeded at all, or at the same time, scale, or quality without NDC support. The second form of additionality seeks to assess the extent to which the NDC approach enabled residents in the neighbourhood area to access a greater level of service benefits than they would otherwise have been able to from mainstream providers. Taken together, these two forms of additionality can be combined to form an overall assessment of the gross additionality of NDC support that recognises more accurately the emphasis behind the NDC approach to delivery. The estimation of the additionality parameters was based on the evaluations of sample projects described earlier.
Table 3.9: Gross additionality of NDC projects: estimates derived, by theme Community
develop-ment
Community safety
Education Health Housing/ physical
env
Workless-ness
a) Additionality of NDC support (high end of range)
0.97 0.66 0.75 0.86 0.65 1.00
b) Beneficiary additionality
0.58 0.98 0.97 0.70 0.67 0.90
c) Overall gross additionality (a x b) (low end of range)
0.57 0.65 0.73 0.60 0.43 0.90
Mid point of range
0.77 0.65 0.74 0.73 0.54 0.95
Source: CEA estimates
3.30. Taking the final mid-point figures, gross additionality is judged to be highest for
projects in worklessness (95%), followed by community development (77%), education (74%), health (73%), community safety (65%), with housing and physical environment projects considered to have the lowest overall additionality (54%). These additionality parameters have been used in this Report to produce estimates of the gross additionality of the NDC Programme as a whole for 2002/03.
3.31. In relation to displacement, we would not expect to find publicly-funded project
beneficiaries being displaced from other existing projects of a similar quality within the NDC area simply because it would suggest wasteful duplication of activity. Again, evidence was used from the sample of individual projects to assess what the level of displacement might be considered to be. Overall, the incidence of displacement activity within NDC areas appears low.
Net Additional Outputs
3.32. Gross additionality and displacement parameters have been used to adjust the gross outputs to net additional outputs. Figure 3.10 provides evidence on the net additional outputs associated with the NDC Programme for 2002/03. During this period NDCs were able to generate outputs that included the creation of 1415 jobs and a further 800 safeguarded. However, the breadth of the outputs, particularly in community safety and for children reflects the broader, social focus of much of the endeavour.

New Deal for Communities: The National Evaluation
Annual Report 2003/4 46
Table 3.10: Net additional outputs: 2002/03
Theme
Co
mm
un
ity
Develo
pm
en
t
Co
mm
un
ity
safe
ty
Ed
ucati
on
Healt
h
Ho
usin
g &
P
hysic
al
En
vir
on
men
t
Wo
rkle
ssn
es
s
All t
hem
es
Net
ad
dit
ion
ality
ra
tio
Jobs created 242 114 263 82 48 666 1415 80%
Jobs safeguarded 239 128 102 59 21 252 801 77%
No. pupils benefiting from projects
6665 1614 47724 3957 843 9152 69955 73%
No. people trained obt quals 580 179 1571 283 0 1586 4199 79%
No. residents accessing emp thru training etc
92 0 24 11 0 1708 1835 93%
No. training weeks 1185 240 2990 1296 252 7232 13195 82%
No. people trained obt jobs prev unemp
27 28 33 1 0 580 669 91%
Young people ben projects promoting personal/social dev
17318
2993 6872 1568 238 533 29521 74%
No. targeted from disadvantaged groups who obt a job
65 0 21 17 0 204 307 87%
No. new business start-ups 5 0 0 0 0 136 140 94%
No. businesses advised 320 29 60 0 11 1262 1682 89%
No. improved dwellings 0 0 0 116 816 2 934 56%
No. people benefiting from comm. Safety inits
2516 49778 2115 0 6137 698 61245 65%
No. community safety initiatives 140 1403 2 0 61 2 1607 66%
No. youth crime prev inits 34 125 9 1 0 0 170 68%
No properties buildings where security upgraded
32 6807 0 0 318 521 7678 66%
Hectares of land impd/reclaimed for dev
0 0 0 0 4 0 4 54%
No. local people access to new health/sports/cult opps/facs
22946
1808 4226 2313 1566 96 32956 73%
No. of new health/sports/cultural facs
6 4 3 43 5 2 63 68%
Nos. using improved health/sports/cult facs
1187 0 1720 4347 0 0 7253 70%
No. of improved health/sports/cultural facs
5 0 0 7 11 0 24 62%
No. buildings improved//brought back into use
7 0 3 2 2 16 31 81%
No. vol/comm. Orgs supported 2019 69 218 185 280 189 2960 74%
No individuals involved in vol work
2023 144 305 179 372 55 3078 72%
No. new childcare places 219 8 71 2 0 279 579 83%
No. of capacity building inits carried out
162 3 12 45 67 16 305 70%
Number of meetings/events 2781 24 651 414 151 1653 5674 79%
No. people given information/assisted
3466 183 7530 3857 482 2734 18252 73%
No. people consulted/involved 6188 0 2412 2927 4331 14 15871 67%
No. residents taking up provision 8822 273 1733 1005 530 3972 16335 78% Source: CEA estimates
New Deal for Communities: The National Evaluation
Annual Report 2003/4 47
Outputs Per £20,000 of Additional Public Sector Funding
3.33. Table 3.11 sets out the six thematic baskets and one overall basket of net outputs generated to date per £20,000 of additional public sector funding. Across the NDC Programme as a whole over the period 2002/03 we estimate that for every £20,000 of public sector funding (cash or in kind) the benefits included 0.3 jobs created or safeguarded, 7.7 pupils from school-based projects, 6.7 people from community safety initiatives, 10.9 young people benefited from projects particularly those promoting personal development, and 8.5 residents received advice, guidance or counselling on careers or work-related topics. Business and physical impacts were low at this stage in the work of the NDC Partnerships.
3.34. The final column of Table 3.11 provides some comparative data from the recent SRB
evaluation, which also adopted a “basket” approach to the measurement of cost-effectiveness. It is difficult to make direct comparisons between them – because the mix of outputs in the basket will relate to the mix of projects and project activities as well as the generally poor quality of output monitoring. In order to say whether the NDC was performing equally well in VFM terms, we would need to compare a sample of NDC projects of a similar scale in similar areas that had the same mix of activities as comparator programmes. This is something that will be examined further as the national evaluation progresses. However, at this stage it appears that the outputs generated by the sample of projects appear to be somewhat lower per £20,000 of public spend for most outputs. This may be explained in part by the early stage at which many NDC projects are at, and by the likelihood that the mix of output generation differs from the sample of 20 case studies used in the SRB evaluation. (ODPM 2003 Evaluation of the Single Regeneration Budget: A Partnership for Regeneration).
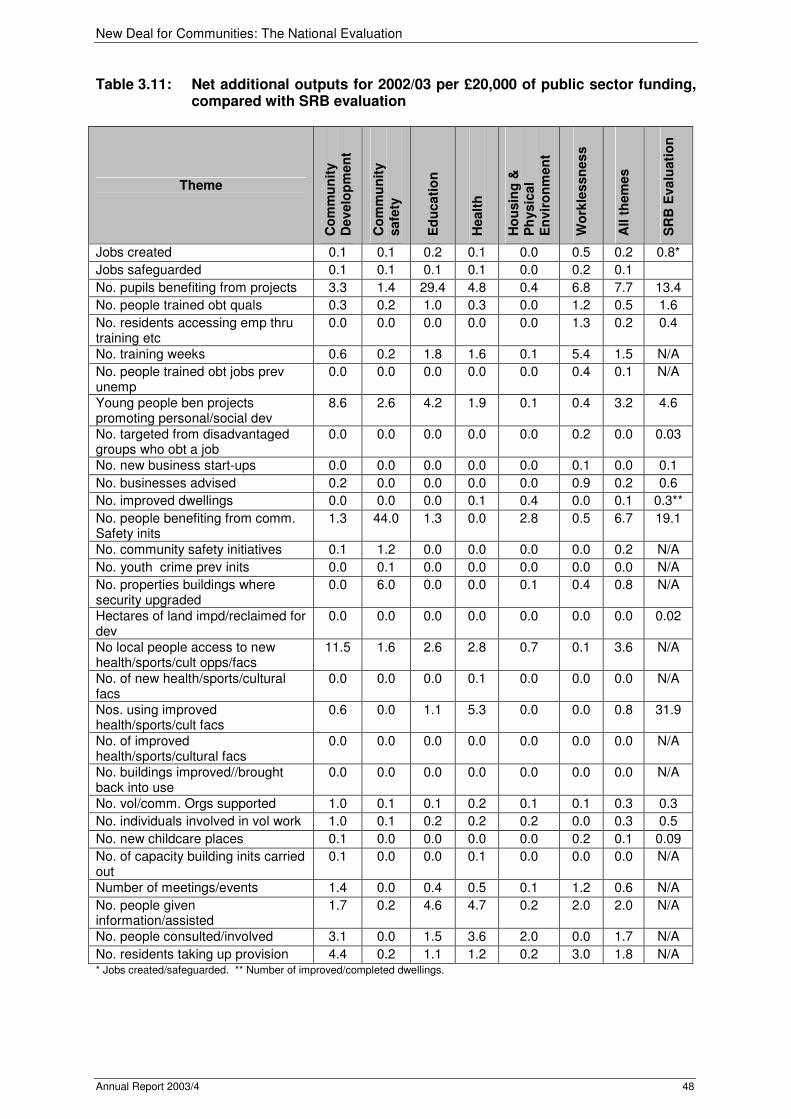
New Deal for Communities: The National Evaluation
Annual Report 2003/4 48
Table 3.11: Net additional outputs for 2002/03 per £20,000 of public sector funding, compared with SRB evaluation
Theme
Co
mm
un
ity
Develo
pm
en
t
Co
mm
un
ity
safe
ty
Ed
ucati
on
Healt
h
Ho
usin
g &
P
hysic
al
En
vir
on
men
t
Wo
rkle
ssn
es
s
All t
hem
es
SR
B E
va
luati
on
Jobs created 0.1 0.1 0.2 0.1 0.0 0.5 0.2 0.8*
Jobs safeguarded 0.1 0.1 0.1 0.1 0.0 0.2 0.1
No. pupils benefiting from projects 3.3 1.4 29.4 4.8 0.4 6.8 7.7 13.4
No. people trained obt quals 0.3 0.2 1.0 0.3 0.0 1.2 0.5 1.6
No. residents accessing emp thru training etc
0.0 0.0 0.0 0.0 0.0 1.3 0.2 0.4
No. training weeks 0.6 0.2 1.8 1.6 0.1 5.4 1.5 N/A
No. people trained obt jobs prev unemp
0.0 0.0 0.0 0.0 0.0 0.4 0.1 N/A
Young people ben projects promoting personal/social dev
8.6 2.6 4.2 1.9 0.1 0.4 3.2 4.6
No. targeted from disadvantaged groups who obt a job
0.0 0.0 0.0 0.0 0.0 0.2 0.0 0.03
No. new business start-ups 0.0 0.0 0.0 0.0 0.0 0.1 0.0 0.1
No. businesses advised 0.2 0.0 0.0 0.0 0.0 0.9 0.2 0.6
No. improved dwellings 0.0 0.0 0.0 0.1 0.4 0.0 0.1 0.3**
No. people benefiting from comm. Safety inits
1.3 44.0 1.3 0.0 2.8 0.5 6.7 19.1
No. community safety initiatives 0.1 1.2 0.0 0.0 0.0 0.0 0.2 N/A
No. youth crime prev inits 0.0 0.1 0.0 0.0 0.0 0.0 0.0 N/A
No. properties buildings where security upgraded
0.0 6.0 0.0 0.0 0.1 0.4 0.8 N/A
Hectares of land impd/reclaimed for dev
0.0 0.0 0.0 0.0 0.0 0.0 0.0 0.02
No local people access to new health/sports/cult opps/facs
11.5 1.6 2.6 2.8 0.7 0.1 3.6 N/A
No. of new health/sports/cultural facs
0.0 0.0 0.0 0.1 0.0 0.0 0.0 N/A
Nos. using improved health/sports/cult facs
0.6 0.0 1.1 5.3 0.0 0.0 0.8 31.9
No. of improved health/sports/cultural facs
0.0 0.0 0.0 0.0 0.0 0.0 0.0 N/A
No. buildings improved//brought back into use
0.0 0.0 0.0 0.0 0.0 0.0 0.0 N/A
No. vol/comm. Orgs supported 1.0 0.1 0.1 0.2 0.1 0.1 0.3 0.3
No. individuals involved in vol work 1.0 0.1 0.2 0.2 0.2 0.0 0.3 0.5
No. new childcare places 0.1 0.0 0.0 0.0 0.0 0.2 0.1 0.09
No. of capacity building inits carried out
0.1 0.0 0.0 0.1 0.0 0.0 0.0 N/A
Number of meetings/events 1.4 0.0 0.4 0.5 0.1 1.2 0.6 N/A
No. people given information/assisted
1.7 0.2 4.6 4.7 0.2 2.0 2.0 N/A
No. people consulted/involved 3.1 0.0 1.5 3.6 2.0 0.0 1.7 N/A
No. residents taking up provision 4.4 0.2 1.1 1.2 0.2 3.0 1.8 N/A * Jobs created/safeguarded. ** Number of improved/completed dwellings.

New Deal for Communities: The National Evaluation
Annual Report 2003/4 49
NEXT STEPS IN 2004/05
3.35. In assessing the impact of NDC on final outcomes there are a number of difficult conceptual and measurement problems to be overcome. Thus, for instance, change often takes place slowly, and expenditure in individual domains is often relatively small compared with mainstream expenditure. However, gross outcome changes behind any net change figures attributable to NDC-stimulated intervention might be considerably higher. It is, therefore, important to establish the gross and net position of key outcome indicators. Movement of people onto and off housing estates in inner city and peripheral urban areas can have a considerable effect on outcome changes. The household survey work is likely to be especially helpful in this respect.
3.36. In the next phase of the work due towards the end of 2004 we will compile
information from the household survey and other secondary and administrative sources that will enable outcome indicators to be calibrated. We will be able to assess changes in gross and net outcome indicators. The intention is that for each outcome area research will compare the nature and the form of the intervention according to the projects implemented and the basic theory of change involved. It will then bring information on net outputs alongside the evidence revealed about changes in key outcomes that have taken place and seek to attribute the contribution of NDC on the basis of research from social survey, project and beneficiary survey work.
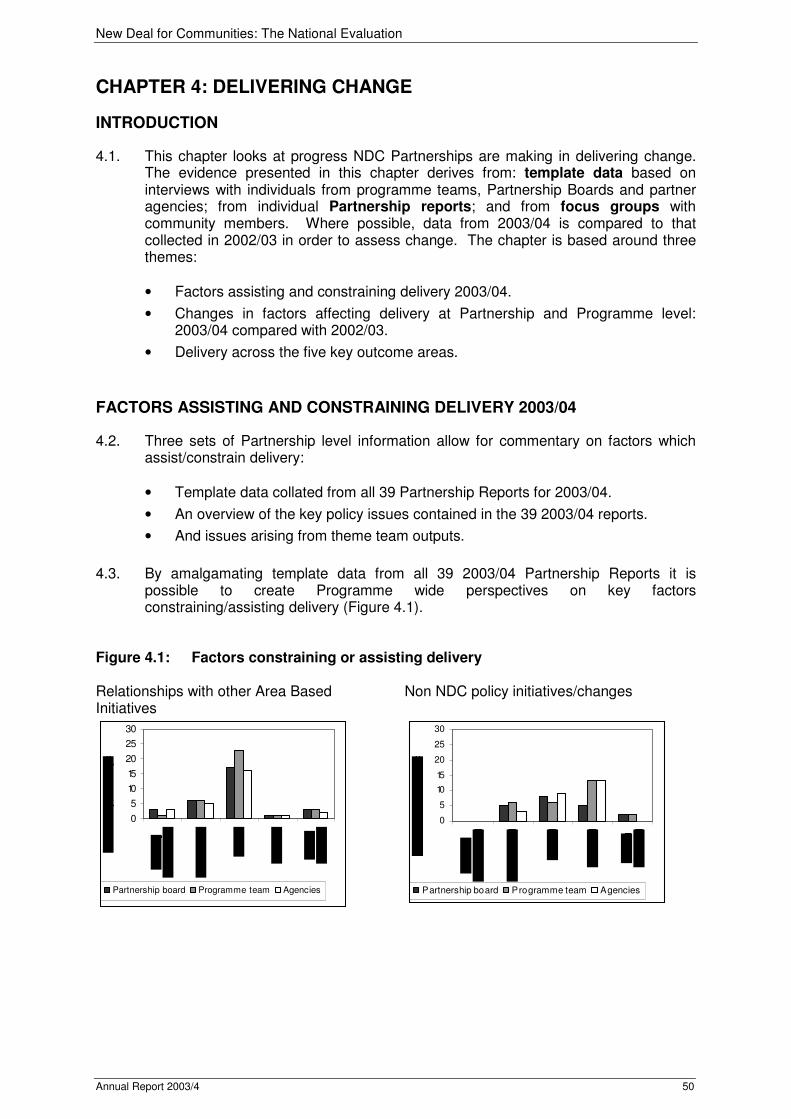
New Deal for Communities: The National Evaluation
Annual Report 2003/4 50
CHAPTER 4: DELIVERING CHANGE
INTRODUCTION
4.1. This chapter looks at progress NDC Partnerships are making in delivering change. The evidence presented in this chapter derives from: template data based on interviews with individuals from programme teams, Partnership Boards and partner agencies; from individual Partnership reports; and from focus groups with community members. Where possible, data from 2003/04 is compared to that collected in 2002/03 in order to assess change. The chapter is based around three themes:
• Factors assisting and constraining delivery 2003/04.
• Changes in factors affecting delivery at Partnership and Programme level: 2003/04 compared with 2002/03.
• Delivery across the five key outcome areas.
FACTORS ASSISTING AND CONSTRAINING DELIVERY 2003/04
4.2. Three sets of Partnership level information allow for commentary on factors which assist/constrain delivery:
• Template data collated from all 39 Partnership Reports for 2003/04.
• An overview of the key policy issues contained in the 39 2003/04 reports.
• And issues arising from theme team outputs.
4.3. By amalgamating template data from all 39 2003/04 Partnership Reports it is
possible to create Programme wide perspectives on key factors constraining/assisting delivery (Figure 4.1).
Figure 4.1: Factors constraining or assisting delivery Relationships with other Area Based Initiatives
0
5
10
15
20
25
30
Partnership board Programme team Agencies
Non NDC policy initiatives/changes
0
5
10
15
20
25
30
Partnership board Programme team Agencies
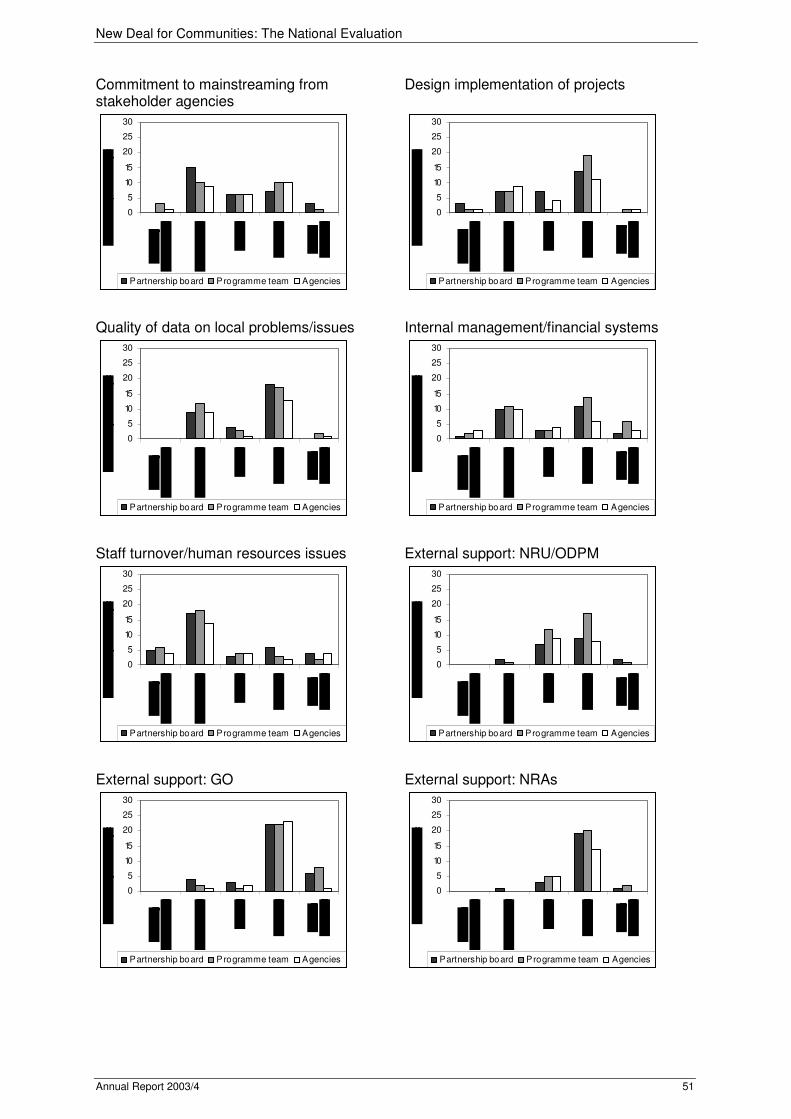
New Deal for Communities: The National Evaluation
Annual Report 2003/4 51
Commitment to mainstreaming from stakeholder agencies
0
5
10
15
20
25
30
Partnership board Programme team Agencies
Design implementation of projects
0
5
10
15
20
25
30
Partnership board Programme team Agencies
Quality of data on local problems/issues
0
5
10
15
20
25
30
Partnership board Programme team Agencies
Internal management/financial systems
0
5
10
15
20
25
30
Partnership board Programme team Agencies
Staff turnover/human resources issues
0
5
10
15
20
25
30
Partnership board Programme team Agencies
External support: NRU/ODPM
0
5
10
15
20
25
30
Partnership board Programme team Agencies
External support: GO
0
5
10
15
20
25
30
Partnership board Programme team Agencies
External support: NRAs
0
5
10
15
20
25
30
Partnership board Programme team Agencies

New Deal for Communities: The National Evaluation
Annual Report 2003/4 52
Internal evaluation activities
0
5
10
15
20
25
30
Partnership board Programme team Agencies
Quality of evidence base for regeneration practitioners
0
5
10
15
20
25
30
Partnership board Programme team Agencies
Original delivery plan
0
5
10
15
20
25
30
Partnership board Programme team Agencies
Community involvement in planning and/or delivery
0
5
10
15
20
25
30
Partnership board Programme team Agencies
Involvement in hard to reach groups in planning and/or delivery
0
5
10
15
20
25
30
Partnership board Programme team Agencies
Involvement of BME communities in planning and/or delivery
0
5
10
15
20
25
30
Partnership board Programme team Agencies
Partnership working
0
5
10
15
20
25
30
Partnership board Programme team Agencies
Community cohesion
0
5
10
15
20
25
30
Partnership board Programme team Agencies
Source: CRESR
New Deal for Communities: The National Evaluation
Annual Report 2003/4 53
4.4. As Figure 4.1 demonstrates, there are consistent patterns across different groups of interviewees, although programme team respondents are generally more positive in identifying factors which assist delivery. As was the case in 2002/03, the factors identified as particularly assisting delivery are:
• Community involvement in planning and/or delivery.
• Support from GOs/NRAs and the NRU.
• Partnership working.
4.5. Those issues which are seen as less likely to assist delivery include:
• Staffing issues.
• Commitment to mainstreaming on the part of key agencies.
• Internal management/financial systems.
4.6. Sections 4.7 to 4.18 provide a discussion of key assisting/constraining factors.
Community Involvement in Planning and/or Delivery
4.7. As is discussed in Chapter 7, NDCs universally attach considerable importance to community involvement and have implemented a variety of innovative and imaginative schemes to increase levels of engagement. Respondents highlight the valuable contributions of residents, in providing a wealth of local knowledge, skills, and information to support the delivery of NDC programmes. As Chapter 7 also highlights however, community engagement is seen as time consuming and complex. These findings echo those outlined in the 2004 National Audit Office (NAO) report: for NDCs community engagement is an unrelenting task (NAO, 2004, An Early Progress Report on the NDC Programme). Nevertheless, there is a strong sense in Partnerships that whilst the involvement of local people can slow down the delivery process, ultimately it strengthens it. It is likely that as community representatives continue to gain experience of NDC processes and procedures, their confidence will grow and their positive impact on the delivery process increase.
The co-location of a number of regeneration initiatives has proved a valuable factor in increasing levels of community engagement in Manchester. NDC, New East Manchester Ltd Regeneration Company, the Education Action Zone (EAZ) and the Sports Action Zone (SAZ) have all become more accessible to the local community as a result of being on the same premises. An open door policy means that the Partnership is able to provide administrative and technological resources for community use and the building is seen by residents as an important central focus. Various projects run through the centre have also facilitated community engagement.
Support From GOs/NRAs and the NRU/ODPM
4.8. The 2004 NAO report on the NDC Programme identified senior level support from Government Offices as vital to NDC success. This is supported by the evaluation. External support from GO's, NRU/ODPM and Neighbourhood Renewal Advisors (NRAs) is identified by Partnerships as a significant factor in assisting delivery. The NRU/ODPM was identified by one Partnership as being particularly helpful in dealing with sticking points and encouraging networking and communication between NDCs. Partnerships have made increasing use of NRA support for a range of issues including the development of theme programmes, assistance with equalities issues, and community engagement. Whilst GO support has been critical in enhancing delivery, there may however, be scope on occasions for GOs be more proactive in

New Deal for Communities: The National Evaluation
Annual Report 2003/4 54
their approach to NDCs, anticipating problems before they arise, rather than reacting to Partnership-led demands, and also in brokering improved relationships between Partnerships and key agencies. The proposed GO Performance Management system will be a valuable tool for highlighting instances where additional support is needed to enable GOs to take on this role.
Newcastle NDC has received valuable NRA support in negotiating with Newcastle City Council over the formation of an ALMO. The NRA worked directly with the Home and Environment Group. It is hoped that this crucial step forward in delivering the housing and physical environment theme will lead to an improved physical environment in the neighbourhood, and in turn, to a raised profile for the Partnership.
Partnership Working
4.9. All constituencies agree that partnership working has assisted delivery. Progress has often been made locally in relation to health and crime in particular as a result of joint working on projects. There has generally been a growing understanding of the advantages of partnership working on the part of both NDCs and agencies and an apparent greater willingness to engage in collaborative working. However, agency respondents also express concerns about striking a balance between fully engaging with Partnerships, whilst not wanting to be seen to dominate local agendas.
4.10. In some NDCs, relationships with the local authority have remained problematic.
Non-compatible procedures and systems and different time scales have resulted in some instances in unproductive relationships which can constrain delivery. These issues are discussed further in 8.18 to 8.24.
4.11. There is evidence that NDCs are engaging in joint working with other ABIs and other
partnership structures as a vehicle for the joint delivery of initiatives and for linking into wider regeneration fora. Partnerships make frequent mention of productive relationships with PCTs, Sure Starts and LSPs. A fuller discussion of NDC engagement with other agencies is discussed in Chapter 8.
In Rochdale, the introduction of joint initiatives between NDC and Sure Start is aimed at securing improvements in the delivery of children's facilities, family support and related training provision. Projects include additional NDC funding to secure: the construction of 3 children's centres as opposed to the 2 that can be funded from Sure Start; NDC and Sure Start funding for the Homestart project offering enhanced volunteer support for families experiencing stress; and joint involvement in the development of a centre for vocational excellence at the local college.
Staff Turnover/Human Resources
4.12. Problems arising from staff turnover and human resource issues were identified as most likely to constrain, and least likely to assist, delivery in 2002/03. These problems have persisted into 2003/04. Whilst most Partnerships have made significant progress in pulling together staff teams, the recruitment and retention of high calibre personnel has proved problematic and many NDCs have experienced skills gaps, particularly at senior management level. In some NDCs, key posts have been vacant throughout the last twelve months, often significantly constraining delivery. For NDCs that have achieved full, or near full, staff complements, the appointment of key programme managers is identified by all constituencies as a crucial factor in supporting delivery.

New Deal for Communities: The National Evaluation
Annual Report 2003/4 55
4.13. Staff retention issues in some NDCs have been exacerbated by lack of management capacity, uncertainty around roles and responsibilities, lack of clear parameters for both programme teams and Boards, and insufficient attention to staff training, team building and development. Staffing issues are discussed in more detail in Chapter 6 and issues surrounding Boards in Chapter 5.
Commitment to Mainstreaming from Stakeholder Agencies
4.14. Relationships between NDCs and mainstream agencies are reviewed in Chapter 8. During 2003/04, a lack of commitment to mainstreaming on the part of stakeholder agencies was again identified as a factor constraining delivery. This is especially problematic as Partnerships move away from the implementation of relatively small, often fully NDC funded, 'quick-win' projects towards major capital schemes often requiring participation, and commitment from a range of mainstream agencies. However, Partnerships often cite joint working with Police and PCTs in particular as improving services. In Coventry, local GPs are involved in chairing theme groups and this has proved valuable in securing community trust. Additionally, the local authority has appointed senior managers and officers as designated NDC contacts, making it much easier for the Board and NDC staff to make effective and appropriate links with local authority services. In Sheffield, the 'Advancing Together' agreement between the NDC and Sheffield City Council guarantees existing level of local authority funding and services to the NDC area for three years and is thus providing a positive basis on which to deliver additional NDC initiatives.
Original Delivery Plan
4.15. Original delivery plans are seen as providing a focus and direction for the programme. Round 2 Partnerships have, or are in the process of, revisiting their Delivery Plans. Some will be seeking to update these to reflect changes in base line data, evolving aspirations and more realistic outcomes, targets and milestones. Some Partnerships consider their original Delivery Plans to be weak, unhelpful and out of date giving no clear direction to the programme.
Quality of Data
4.16. There are divergent views regarding the quality of data. Overall, Partnerships find much data to be of value particularly that arising from the 2002 MORI/NOP Household survey. In Newham, delivery has been assisted by the availability of good local data relating to crime, education and health. However, there are still difficulties in obtaining disaggregated data for local services and in relation to key population groups. Partnerships highlight particular difficulties around health, education and asylum seekers.
Project Design, Implementation and Evaluation
4.17. Overall, the design and implementation of projects is considered to have assisted delivery. However, a number of issues merit comment. A few Partnerships indicate poorly developed internal systems resulting in long drawn out appraisal and approval processes. This can lead to the repeated resubmission to Boards of projects for approval. Procedures to take forward projects from an initial idea to worked up costed proposals are not always in place. Agencies highlight a degree of complexity and lack of clarity in relation to project development. This problem can be exacerbated by a shortage of staff with appropriate project development skills. Where local evaluation procedures are in place, Partnerships indicate that evaluation may produce useful information with which to monitor success. However, evaluation can also be viewed as time consuming and bureaucratic. The scale of local evaluation activities is discussed in Chapter 6, sections 6.33 to 6.36.
New Deal for Communities: The National Evaluation
Annual Report 2003/4 56
Internal Management and Financial Systems
4.18. Internal management issues can still be a cause for concern. Large staff complements are difficult to manage without robust internal management structures being in place. Regular meetings and reporting appear to be a feature of many NDCs, but internal and external communication issues may still need attention.
The 39 NDC Reports 2003/04: Key Policy Issues
4.19. Each of the 39 local evaluation teams was asked to provide Partnerships with about ten key policy issues arising from work carried out in 2003/04. The 10 most frequently mentioned action points relate to:
• Staffing and training (26).
• Project development (24).
• Links with agencies (23).
• Research, monitoring and evaluation (23).
• Equalities agendas (22).
• Resident/community involvement (22).
• Dissemination and promotion (21).
• Issues to do with the operation of the Board (20).
• Mainstreaming (20).
• Structures and processes (19).
4.20. There are clearly marked similarities with the list of constraints discussed in sections
4.2 to 4.18 derived from template data.
Theme Team Outputs: Key Policy Issues
4.21. The national evaluation's five theme teams collectively each year produce about 20 policy and practice outputs. Each output reflects work in a number of case study NDCs. The outputs for 2002/03 are on the public website. The 20 produced during 2003/04 will be lodged there in 2004. The table below outlines key policy issues emerging from these 40 or so outputs. Outputs which are publicly available are listed as specific Research Reports (RRs); those not yet on the public web site are listed by an indicative title.
4.22. Because these outputs are not based on any comprehensive coverage of activities in
all NDCs, there is no attempt to quantity policy issues which arise. The main issues identified by the theme teams impacting on delivery are:
• Problems relating to aspects of staffing.
• Building successful links with partner agencies.
• Linking into wider policy agendas.
• The need to develop appropriate data exploitation and management information systems.
• The benefits and complexities of working with local residents.
• And ensuring projects can be supported by appropriate local infrastructure, especially childcare facilities.

New Deal for Communities: The National Evaluation
Annual Report 2003/4 57
Table 4.2: Theme Team Outputs: Policy Implications
Theme Example
Programme team and board issues
Staffing and training
Projects can often run into staffing problems
• e.g. in relation to insecurity for those on time limited contracts: youth diversionary projects RR5 pp.11;
• delays in staffing and secondments may inhibit longer term strategic planning e.g. in relation to teenage pregnancy initiatives RR7 pp.19;
• staff turnover hampers project development Mental Health (2003/04 Report)
Community and interagency relations
Links with agencies importance of ensuring delivery is based on working with partners:
• linking with other agencies re teenage pregnancy policies RR7 pp.12;
• vital role of links with LA or LEA e.g. in education RR10;
• co-ordination to facilitate the development of other sectors: Raising Educational Achievement in Disadvantaged Areas (2003/04 Report).
Equalities and engagement of groups (e.g. BME groups, gender)
• complexities of getting BME initiatives off the ground see RR12;
• specialist support required by some groups, e.g. parents needing English as an additional language Parental Involvement in Education (2003/04 Report).
Resident/community involvement • importance of projects engaging directly and locally with clients on an outreach basis and of ensuring capacity is there for projects to maintain a personal involvement with clients -e.g. in relation to employment skills RR6 pp.9;
• tensions between what NDCs think should happen and views of local community e.g. asylum seekers RR18 pp.22;
• difficult to achieve longer term outcomes causing officers and residents to be disappointed with the level of engagement - The Involvement of NDC Residents in the Formulation of Strategies to Tackle Low Demand and Unpopular Housing (2003/04 Report).
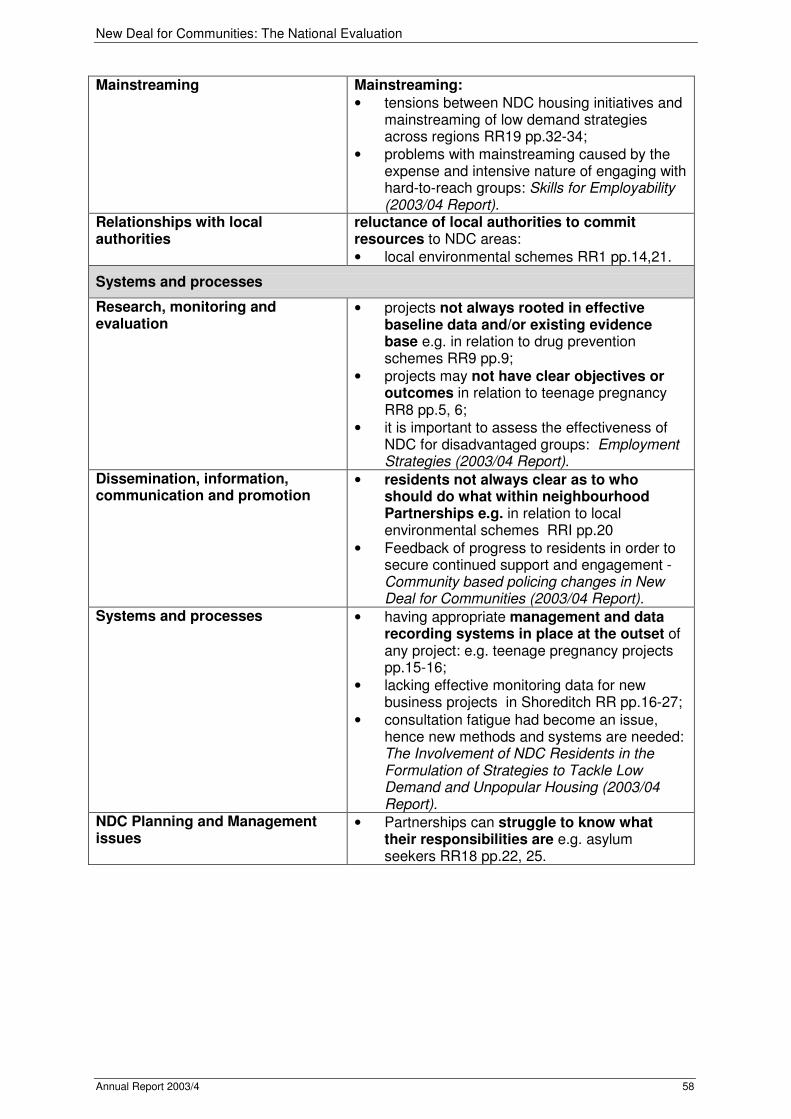
New Deal for Communities: The National Evaluation
Annual Report 2003/4 58
Mainstreaming Mainstreaming:
• tensions between NDC housing initiatives and mainstreaming of low demand strategies across regions RR19 pp.32-34;
• problems with mainstreaming caused by the expense and intensive nature of engaging with hard-to-reach groups: Skills for Employability (2003/04 Report).
Relationships with local authorities
reluctance of local authorities to commit resources to NDC areas:
• local environmental schemes RR1 pp.14,21.
Systems and processes
Research, monitoring and evaluation
• projects not always rooted in effective baseline data and/or existing evidence base e.g. in relation to drug prevention schemes RR9 pp.9;
• projects may not have clear objectives or outcomes in relation to teenage pregnancy RR8 pp.5, 6;
• it is important to assess the effectiveness of NDC for disadvantaged groups: Employment Strategies (2003/04 Report).
Dissemination, information, communication and promotion
• residents not always clear as to who should do what within neighbourhood Partnerships e.g. in relation to local environmental schemes RRI pp.20
• Feedback of progress to residents in order to secure continued support and engagement - Community based policing changes in New Deal for Communities (2003/04 Report).
Systems and processes • having appropriate management and data recording systems in place at the outset of any project: e.g. teenage pregnancy projects pp.15-16;
• lacking effective monitoring data for new business projects in Shoreditch RR pp.16-27;
• consultation fatigue had become an issue, hence new methods and systems are needed: The Involvement of NDC Residents in the Formulation of Strategies to Tackle Low Demand and Unpopular Housing (2003/04 Report).
NDC Planning and Management issues
• Partnerships can struggle to know what their responsibilities are e.g. asylum seekers RR18 pp.22, 25.

New Deal for Communities: The National Evaluation
Annual Report 2003/4 59
Delivery
Delivery, progress and development
• delays in projects for various reasons e.g. not having all partners on board re educational achievement projects RR10 pp.18;
• sustainability of projects e.g. cash support for getting people into HE projects RR11 pp.11;
• importance of locating projects within wider policy or market context labour market for skills for employability projects RR6 pp.1-2.
Strategic thinking • problems for NDCs may point to policy changes needed at other levels of government e.g. asylum seekers RR18 pp.29.
Finance and funding • opportunities to use community based resources to address local problems-word of mouth within community may be best to enhance self employment RR16 pp.28;
• Unanticipated demands on services: can be a problem to coordinate sudden demands e.g. asylum seekers RR18 pp.23;
• Accessing funds can be difficult and time consuming: Delivering Play Spaces in NDC areas (2003/04 report).
NDC area facilities • clients unable to access courses / projects because of lack of childcare facilities - Life Long Learning and the New Deal for Communities (2003/04 report).
• projects need an appropriate accommodation strategy; lack of appropriate accommodation for teenage pregnancy schemes RR8 pp.9.
Source: CRESR
FACTORS AFFECTING DELIVERY: PROGRAMME LEVEL CHANGE 2003/04 COMPARED WITH 2002/03
4.23. Figure 4.2 indicates factors impacting on delivery for 2002/03 and 2003/04. There are markedly similar patterns across the two sets of data. Most factors which assisted delivery in 2002/03 also did so in 2003/04. The only exception is commitment to mainstreaming from stakeholder agencies, which received a marginally positive score in 2002/03 and a marginally negative score in 2003/04.
4.24. Most factors receive a positive score, that is overall, most observers consider that
they assist rather than constrain delivery. Nevertheless, Partnerships identify a number of factors as being relatively less helpful in 2003/04 than was the case in 2002/03: support from GOs and the NRU/ODPM; partnership working; original delivery plans and internal evaluation activities. Factors identified as being more helpful in 2003/04 than in 2002/03 are community involvement; support from NRAs; non-NDC policy initiatives; quality of local data; and design/implementation of projects.

New Deal for Communities: The National Evaluation
Annual Report 2003/4 60
Figure 4.2: Factors constraining or assisting delivery: 2002/03 and 2003/04
-30
-20
-10
0
10
20
30
Com
munity
involv
em
ent
Exte
rnal support
: G
O
Part
ners
hip
work
ing
Exte
rnal support
:
NR
As
Rela
tionship
s w
ith
oth
er
AB
Is
Exte
rnal support
: N
RU
Origin
al deliv
ery
pla
n
Involv
em
ent
of
BM
E
gro
ups
Qualit
y o
f evid
ence
base
Inte
rnal evalu
ation
activitie
s
Non N
DC
polic
y
initia
tives/c
hanges
Qualit
y o
f lo
cal data
Involv
em
ent
of
hard
to
reach g
roups
Desig
n/im
ple
menta
tion
of
pro
jects
Inte
rnal
managem
ent/
financia
l
Com
mitm
ent
to
main
str
eam
ing
Hum
an r
esourc
e
issues
Them
e s
core
2002/3 2003/4
Source: CRESR
DELIVERY ACROSS THE FIVE OUTCOME AREAS
4.25. In all 39 NDCs, programme teams, Boards and agency representatives were asked about factors which constrained or assisted delivery in relation to the five main outcome areas. Responses are outlined below in relation to each theme. Additionally, some 78 focus groups with NDC residents explored perceptions of successes and problems in the key outcome areas. Findings from these sessions are also incorporated below (for a fuller discussion of focus groups see Chapter 7, section 7.31 to 7.33).
Housing and the Physical Environment
4.26. Housing continues to present significant challenges for NDCs, primarily because of the scale of resources needed in relation to NDC budgets. Particularly acute (although different) issues face two groups of NDCs: those in London and those in or close to the Housing Market Renewal Pathfinders in the Midlands and North. A number of Partnerships have recognised that, while housing-led strategies alone will not transform NDC areas, a significant improvement in the quality of housing stock, allied to changes in the tenure mix (for some Partnerships) is probably a necessary condition in achieving wider outcomes.
4.27. In general, relatively little substantive progress has been made since last year.
Some NDCs have been developing masterplans for the area which may provide the basis for raising investment finance. Elsewhere Partnerships are preparing for stock transfer ballots, explicitly drawing on the lessons from those NDCs where residents have voted against stock transfer. But there is little evidence that Partnerships are working on alternative housing strategies should stock transfer propositions be rejected.

New Deal for Communities: The National Evaluation
Annual Report 2003/4 61
4.28. Most activities under this theme focus on environmental improvements, addressing the ‘liveability’ agenda, both for its own sake and as highly visible evidence of progress and change. It is also proving an effective way of engaging with local communities through the organisation of clean-up campaigns and so on.
4.29. Factors which commentators identify as assisting progress in housing and the
physical environment include:
• Dedicated NDC workers/co-ordinators.
• Visible environmental improvements.
• Involvement of all key stakeholders: RSLs, Local Authority and Residents.
• A robust strategy able to cope with uncertainty and change.
• Joint working of housing providers and residents.
4.30. Constraining factors include:
• Uncertainty surrounding stock transfer votes.
• Difficult and tense relationships with Local Authorities in some Partnerships.
• Lack of a Housing Strategy within some NDCs.
• Lack of physical change in the environment.
• Limited engagement with Housing Market Renewal Pathfinders - an issue being addressed by the NRU/ODPM through mutual Board representation.
4.31. Focus group discussions with NDC residents identified a range of successes and
problems in relation to the delivery of housing and physical environment projects.
Successes
4.32. Most respondents identified improvements in the physical environment rather than those which related directly to housing stock, although, in areas where improvements to housing stock had taken place these were generally well received by NDC residents. Participants in a number of focus groups felt that areas were cleaner as a result of NDC work. Some gave examples of projects which have contributed to this, including environmental clean ups, removal of abandoned cars, improvements to allotments, regeneration of public gardens and parks. One participant in Middlesbrough stated that 'the area is now better maintained than it used to be. There is more evidence of street cleaning and litter picking, and the gardens of empty houses are now being tidied regularly.'
4.33. Residents in Doncaster described the improved physical appearance of the NDC
area which they considered used to be a run down market area, but which now contains a lively market, restaurants, cafes and new residential property. Most people in the focus groups felt proud that they lived in or near the NDC area and many knew people who would like to live or work there. They considered regeneration of the area had attracted new business and employment and that it had become a safer place to live.
4.34. In Sheffield, Salford and Manchester NDCs focus group participants gave examples of new facilities which had improved the physical environment. These included leisure facilities, additional housing and shops. There is some concern in at least one NDC, however, that new facilities may not be valued and were at risk from vandalism.

New Deal for Communities: The National Evaluation
Annual Report 2003/4 62
4.35. Participants in Rochdale, Manchester, Middlesbrough and Coventry NDCs discussed improvements in housing, from small schemes to large scale master planning exercises. Amongst residents in the West Bowling area of Bradford NDC area, there was a general consensus that there had been significant external improvements to the housing stock. Focus group participants in Middlesbrough noted that
'Private landlords also seem to be making improvements to their properties – a sign that they think the area is worth investing in'.
4.36. Similarly in Wolverhampton, participants stated that there are now waiting lists for
housing in the local area, where until recently there had been a problem with empty properties.
4.37. Many of those attending focus groups commented that they would like local
Partnerships to improve housing conditions in NDC areas. These aspirations focused on refurbishment of derelict dwellings and improving housing standards, including replacing windows and getting rid of damp. Some suggestions related to improving security, such as introducing concierge systems and housing management companies.
Problems
4.38. The main concerns expressed in relation to housing and the physical environment were lack of progress in housing improvement programmes, and, as a consequence, the continued existence of derelict and sub-standard housing in NDC areas. Derelict and sub-standard housing contribute to a poor physical environment. Participants in a number of focus groups were frustrated about the physical appearance of their neighbourhoods. Others raised concerns about dumping, and its implications for environmental hygiene and appearance.
Worklessness
4.39. The 2004 NAO report on the NDC Programme specifically identified this theme as proving somewhat problematic across the Programme: 'exclusion from work is damaging for individuals and NDC neighbourhoods'. There is a sense that systematic links may not always exist between NDC areas and economic development opportunities nearby. In some instances this reflects the fact that residents tend largely to look for jobs in the immediate vicinity, often displaying little interest in the wider labour market. This is a critical issue for NDC Partnerships, since experience of past small area programmes indicates that it is not possible to stimulate substantial and lasting economic regeneration and job creation within small areas.
4.40. Respondents point to a number of factors which assist delivery:
• Partnership working – relationships with Jobcentre Plus have been generally successful (see Chapter 8, paragraph 8.56).
• The delivery of outreach services by partner agencies.
• Dedicated theme managers/co-ordinators.
• Local labour market/ availability of jobs locally.
• Improved knowledge of barriers to work.
• The development of local training opportunities.
4.41. Constraints fall into two broad areas:

New Deal for Communities: The National Evaluation
Annual Report 2003/4 63
External constraints:
• ‘Post-code discrimination’ on the part of local employers.
• Low skill levels.
• Lack of suitable childcare provision.
• Lack of training organisations.
• Difficulties in engaging local communities (including business communities).
And internal constraints:
• An unclear approach and/or a lack of a worklessness strategy.
• Lack of staff and theme managers.
4.42. Focus group discussions with NDC residents identified a range of successes and
problems in relation to worklessness.
Successes
4.43. Only a few focus groups identified achievements in the worklessness theme. Responses from most of those that did so concerned perceptions of increased employment opportunities for residents. However, this was more frequently mentioned as a difficulty for the local NDC rather than a success.
4.44. But successes were identified in Birmingham Kings Norton, where half of the staff in
the local nursery are residents who have been trained using NDC funding. In Manchester and Kings Norton NDCs, projects which aim to overcome some of the barriers to entering the workplace, such as childcare and training were identified as achievements of the previous year.
4.45. Other achievements in worklessness were identified in Bradford NDC, where there
was a feeling amongst participants that business conditions have improved in the area as a direct result of NDC. Participants mentioned that small business and new business start-up grants have helped. In Knowsley, participants were aware of North Huyton Intermediate Labour Market project and two had been on it. All were full of praise: 'it was excellent'; 'all the skills I learned in so little time'; 'I'd not been in work for 16 years' were among comments made. Similarly in Derby, participants acknowledged that the NDC was providing future potential job opportunities for residents by providing courses such as forklift truck driving.
Problems
4.46. Some focus group respondents made reference to lack of employment opportunities for residents in the area. Participants identified the need for more and better paid jobs as critical to the successful regeneration of NDC areas. The extent to which 'outsiders' had benefited from new employment opportunities was also a contentious issue in some instances.
4.47. Attendees generally want NDCs to provide more employment opportunities
especially for local people. Means of achieving this are seen as encouraging new businesses into the area, managed work spaces, new office space, and offering financial support to businesses in the area. Attendees identified barriers to work which could be overcome by the provision of childcare and better training opportunities including apprenticeship schemes. Those in Rochdale, Nottingham, Hull and Haringey suggest initiatives to encourage local employers to employ local people: bursaries for training, supporting local groups, and grants for employers

New Deal for Communities: The National Evaluation
Annual Report 2003/4 64
employing a high percentage of local people. In one NDC attendees think that there is a need to more clearly link jobs with local redevelopment:
''Why not take young people and train them to be brickies and have local employment contracts specifying that developers should take on local young people?'
Health
4.48. The 2002/03 Programme Wide report suggested that many Partnerships were struggling to define a role for themselves in relation to health, and were finding it hard to establish close working relationships with PCTs, largely because the latter were still bedding in. During 2003/04 many NDCs have enjoyed improved relations with their local PCT. Most are engaged in some kind of joint activity, though at this stage much of it is still limited to research and development work. Partnerships appear to have continued their learning process encouraged by a willingness on the part of many PCTs to work more closely with NDCs in order to link mainstream health services with NDC initiatives.
4.49. Several factors are seen as assisting delivery in health:
• Dedicated staff/theme manager.
• Support and Board involvement from PCT.
• High levels of resident interest and enthusiasm, and well attended theme groups.
• NRA involvement.
• Rolling out of smaller health projects such as smoking cessation and walking schemes.
4.50. Constraining factors clustered around;
• Difficulties in working with some PCTs: evidence of continuing difficulties stemming from the creation of PCTs.
• Lack of wider partnership working.
• Local health cultures, and poor lifestyles.
• Lack of a health strategy and strategic thinking.
• Lack of dedicated theme manager/co-ordinator.
• Health is not always seen by resident Board representatives as a pressing issue.
4.51. Focus Group respondents made few references to successes or problems relating to health. Those that did comment on success referred mainly to increased access to GPs and specific projects such as healthy eating and diabetes initiatives.
Crime
4.52. Some NDCs report reduced crime levels, compared with district level changes. However robust change data does not yet exist by which to validate these claims. Results from the second wave of the household survey will provide crime experience data in late 2004. In many areas there continues to be an apparent inconsistency between actual levels of crime (both recorded and self-reported) and fear of crime, with the latter running ahead of the former. There are signs in at least some areas, however, that the introduction of wardens, often working well with local police, are reducing levels of fear of crime. Warden schemes are proving popular with
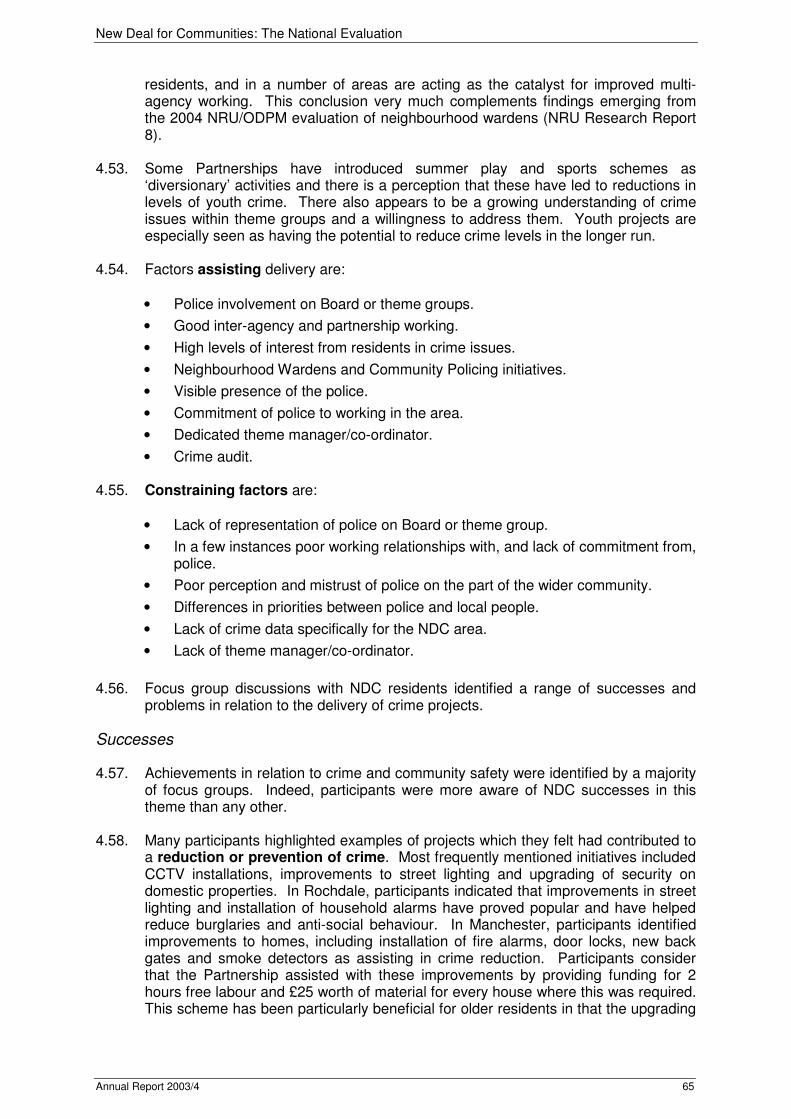
New Deal for Communities: The National Evaluation
Annual Report 2003/4 65
residents, and in a number of areas are acting as the catalyst for improved multi-agency working. This conclusion very much complements findings emerging from the 2004 NRU/ODPM evaluation of neighbourhood wardens (NRU Research Report 8).
4.53. Some Partnerships have introduced summer play and sports schemes as
‘diversionary’ activities and there is a perception that these have led to reductions in levels of youth crime. There also appears to be a growing understanding of crime issues within theme groups and a willingness to address them. Youth projects are especially seen as having the potential to reduce crime levels in the longer run.
4.54. Factors assisting delivery are:
• Police involvement on Board or theme groups.
• Good inter-agency and partnership working.
• High levels of interest from residents in crime issues.
• Neighbourhood Wardens and Community Policing initiatives.
• Visible presence of the police.
• Commitment of police to working in the area.
• Dedicated theme manager/co-ordinator.
• Crime audit. 4.55. Constraining factors are:
• Lack of representation of police on Board or theme group.
• In a few instances poor working relationships with, and lack of commitment from, police.
• Poor perception and mistrust of police on the part of the wider community.
• Differences in priorities between police and local people.
• Lack of crime data specifically for the NDC area.
• Lack of theme manager/co-ordinator.
4.56. Focus group discussions with NDC residents identified a range of successes and
problems in relation to the delivery of crime projects.
Successes
4.57. Achievements in relation to crime and community safety were identified by a majority of focus groups. Indeed, participants were more aware of NDC successes in this theme than any other.
4.58. Many participants highlighted examples of projects which they felt had contributed to
a reduction or prevention of crime. Most frequently mentioned initiatives included CCTV installations, improvements to street lighting and upgrading of security on domestic properties. In Rochdale, participants indicated that improvements in street lighting and installation of household alarms have proved popular and have helped reduce burglaries and anti-social behaviour. In Manchester, participants identified improvements to homes, including installation of fire alarms, door locks, new back gates and smoke detectors as assisting in crime reduction. Participants consider that the Partnership assisted with these improvements by providing funding for 2 hours free labour and £25 worth of material for every house where this was required. This scheme has been particularly beneficial for older residents in that the upgrading

New Deal for Communities: The National Evaluation
Annual Report 2003/4 66
of security in their homes has improved their safety and increased their confidence significantly. Similar schemes were identified in other NDCs.
4.59. Many focus groups referred to an increase in police numbers and neighbourhood
wardens as an achievement for the local Partnership. For example, in Nottingham wardens were identified as successful:
'They are in close contact with residents. They take time to talk to people. They have the respect of the community and are not seen as a threat'.
4.60. Similarly, the East Manchester Neighbourhood Wardens are popular with residents. The Wardens patrol the area 7 days a week and 'go above and beyond duty' in helping to maintain the neighbourhood. A change to community policing in Sunderland NDC was thought to be significant in reducing anti-social behaviour in the area.
4.61. Some focus groups think that fear of crime has declined as a result of some of the
initiatives above. In Rochdale, participants indicated that:
'The installation of CCTV in the town centre has cut the number of brawls and improved community safety and additional, more visible, policing has boosted community confidence and made the street environment less threatening'.
4.62. Groups in Sheffield and Sunderland consider that residents are feeling safer inside
and outside their homes. Projects aimed at young people are identified in Bristol as diverting them away from crime.
Problems
4.63. The main problem in relation to crime identified by focus groups is lack of progress and that as a consequence high levels of crime still persists in NDC area. Particular emphasis is often placed on crimes relating to drugs, anti-social behaviour and vandalism. In some areas, increased levels of policing are thought to have had little impact on crime levels. A focus group in one NDC highlighted the introduction of neighbourhood wardens and police patrols on bicycles as 'key failures' the last twelve months. In another, participants were aware of a community police project but expressed concern that they rarely saw officers in their neighbourhood. It was thought that this is because they have too much paperwork and prioritised other issues.
Education
4.64. Many Partnerships have had difficulties in engaging with local schools not least because of the implications of 'local management schemes' for educational provision across the board. In some instances too, particularly in London, educational provision is further complicated because of external agencies being brought in to manage education. But more initiatives are being effected in conjunction particularly with primary schools. It can become more of a problem dealing with secondary education since few are located in NDC areas. But there is little to indicate many NDCs are addressing that issue by focussing specifically on pupils in the Partnership area. There is not a great deal to suggest much in the way of adult education provision across the Programme and, other than in a few instances, little is as yet being done in relation to higher education.
4.65. Assisting factors are considered to be:
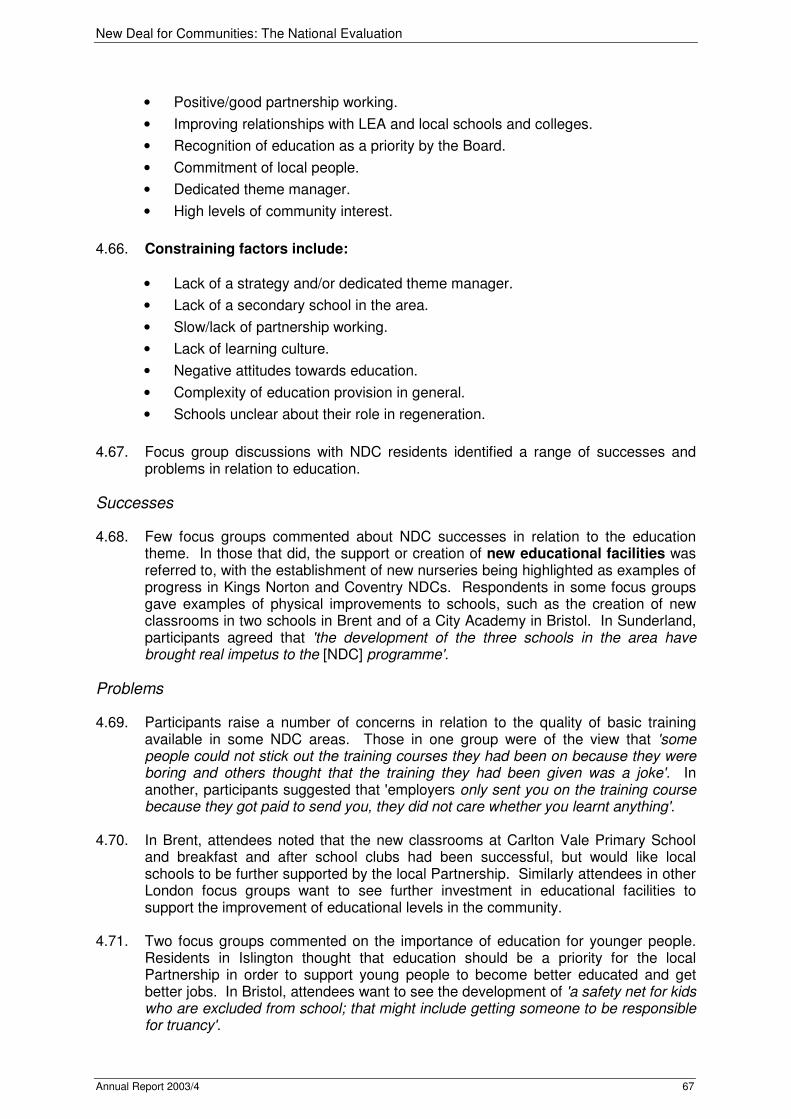
New Deal for Communities: The National Evaluation
Annual Report 2003/4 67
• Positive/good partnership working.
• Improving relationships with LEA and local schools and colleges.
• Recognition of education as a priority by the Board.
• Commitment of local people.
• Dedicated theme manager.
• High levels of community interest.
4.66. Constraining factors include:
• Lack of a strategy and/or dedicated theme manager.
• Lack of a secondary school in the area.
• Slow/lack of partnership working.
• Lack of learning culture.
• Negative attitudes towards education.
• Complexity of education provision in general.
• Schools unclear about their role in regeneration.
4.67. Focus group discussions with NDC residents identified a range of successes and
problems in relation to education.
Successes
4.68. Few focus groups commented about NDC successes in relation to the education theme. In those that did, the support or creation of new educational facilities was referred to, with the establishment of new nurseries being highlighted as examples of progress in Kings Norton and Coventry NDCs. Respondents in some focus groups gave examples of physical improvements to schools, such as the creation of new classrooms in two schools in Brent and of a City Academy in Bristol. In Sunderland, participants agreed that 'the development of the three schools in the area have brought real impetus to the [NDC] programme'.
Problems
4.69. Participants raise a number of concerns in relation to the quality of basic training available in some NDC areas. Those in one group were of the view that 'some people could not stick out the training courses they had been on because they were boring and others thought that the training they had been given was a joke'. In another, participants suggested that 'employers only sent you on the training course because they got paid to send you, they did not care whether you learnt anything'.
4.70. In Brent, attendees noted that the new classrooms at Carlton Vale Primary School
and breakfast and after school clubs had been successful, but would like local schools to be further supported by the local Partnership. Similarly attendees in other London focus groups want to see further investment in educational facilities to support the improvement of educational levels in the community.
4.71. Two focus groups commented on the importance of education for younger people.
Residents in Islington thought that education should be a priority for the local Partnership in order to support young people to become better educated and get better jobs. In Bristol, attendees want to see the development of 'a safety net for kids who are excluded from school; that might include getting someone to be responsible for truancy'.

New Deal for Communities: The National Evaluation
Annual Report 2003/4 68
CHAPTER 5: NDC BOARD OPERATIONS
INTRODUCTION
5.1. This chapter discusses issues relating to NDC Boards. Evidence is drawn from template data and from interviews with key stakeholders in all 39 Partnerships. Wherever possible, data for 2003/4 is compared with that available for 2002/03. The chapter is structured around seven themes:
• Elections.
• Membership.
• Roles and responsibilities.
• Skills and development.
• Legal status.
• Strategy and forward planning.
• Board operations 2003/04 compared with 2002/03.
ELECTIONS
5.2. Figure 5.1 illustrates that in most (32) NDCs resident Board members are elected through community ballot.
5.3. In the remaining seven Partnerships, resident Board members are selected by other
means. In these Partnerships voting and election rights are confined to people who have attended certain groups, such as theme groups, or are members of community or residents' associations. In Derby, for instance, 20 resident Board members are nominated through theme groups. Membership of theme groups is open, and residents are entitled to vote at the third meeting they attend.
5.4. Figure 5.1 shows methods of election. The most common method is through postal
ballot, which for a few Partnerships is undertaken in conjunction with other techniques. For example Knowsley offers voters a choice of postal ballot or polling station. Partnerships' preference for postal voting was prompted in large part by recent experience in UK local elections in which turnout increased significantly. Few Partnerships offered voters the option of telephone voting.
5.5. In recent years there have been experiments using postal and e-voting (including
telephone voting) in parts of England. A MORI survey found the main reason these methods increase turnout is the convenience they offer voters.

New Deal for Communities: The National Evaluation
Annual Report 2003/4 69
Figure 5.1: Method of elections
0
5
10
15
20
25
30
Posta
l ballo
t
Polli
ng s
tation
Tele
phone v
oting
Ele
ctr
onic
voting
Num
ber
of
Part
ners
hip
s
Base: 32 Partnerships Source: CRESR
5.6. Figures 5.2 and 5.3 look at the frequency and last date of open elections. In 13
Partnerships, elections are held annually. Seven hold bi-annual elections and in a further nine, new members are elected every three years. 18 Partnerships indicate that their most recent election had been in 2003 and 10 in 2002. Research suggests that frequent local elections can adversely affect turnout. At this stage of the NDC Programme it is impossible to say whether this will occur.
Figure 5.2: Frequency of elections
0
2
4
6
8
10
12
14
More
than o
nce
a y
ear
Every
Year
Every
2 y
ears
Every
3 y
ears
Num
ber
of
Part
ners
hip
s
Base: 31 Partnerships Source: CRESR

New Deal for Communities: The National Evaluation
Annual Report 2003/4 70
Figure 5.3: Date of most recent election
0
2
4
6
8
10
12
14
16
18
20
2001
2002
2003
Num
ber
of
Part
ners
hip
s
Base: 31 Partnerships Source: CRESR
5.7. Accurate turnout data is difficult to obtain but as is illustrated in Figure 5.4, NDCs
have experienced varying degrees of success. In the most recent elections dating from 2001, the average turnout figure was 22%, with a low of 11% but two Partnerships recording 37%. 11 Partnerships achieved between 11% and 20% turnout, and nine 21% to 30%. In only four did more than 31% of the eligible population vote.
Figure 5.4: Turnout for most recent NDC elections
0
2
4
6
8
10
12
14
11%
to 2
0%
21%
to 3
0%
31%
to 3
7%
Num
ber
of
Part
ners
hip
s
Base: 26 Partnerships Source: CRESR

New Deal for Communities: The National Evaluation
Annual Report 2003/4 71
5.8. In areas where Partnerships report low turnouts, qualitative evidence suggests that tensions and conflict between NDC Partnerships and the wider community may have been contributing factors.
5.9. One means of gauging the 'success' of NDC elections is to compare turnout rates
with those for the most recent local authority elections7. It should be noted that the method used to extract turnout figures for local authority elections is somewhat crude. Most Partnerships fall within more than one electoral ward. For this analysis a very simple mean figure has been calculated.
5.10. Figure 5.5 outlines the difference between Partnerships' most recent NDC elections,
dating from 2001, and the latest local elections. Minus figures apply to Partnerships where NDC turnout was lower than the local election turnout.
5.11. Most Partnerships record lower turnout figures for their NDC elections than for most
recent local elections. Only six NDC areas achieved higher turnout rates. In 17 cases turnouts were lower than for local elections.
5.12. In some instances this can be explained by local factors. For example Hartlepool
has had well-publicised mayoral elections which attracted a particularly high turnout. In Newcastle local elections in all four wards covered by the NDC area had achieved a particularly high turnout rate. This may have been due to postal voting having been introduced for the first time.
Figure 5.5: Differences between NDC and local election turnouts
-30
-25
-20
-15
-10
-5
0
5
10
15
Islin
gto
n
Hackney
Sandw
ell
Bra
dfo
rd
Ply
mouth
Luto
n
Birm
ingham
KN
Lam
beth
Liv
erp
ool
Wolv
erh
am
pto
n
Rochdale
Haringey
Know
sle
y
Tow
er
Ham
lets
New
ham
Sheff
ield
Bre
nt
H's
mith &
Fulh
am
Nott
ingham
Leic
este
r
Norw
ich
Old
ham
New
castle
Diffe
rence b
etw
een N
DC
turn
out
and local ele
ction t
urn
out
Source: CRESR; LA election figures from Local Government Chronicle Elections Centre, University of Plymouth
7 For a more detailed discussion of turnout at NDC and local elections, see Rallings, C., Thrasher, M.,
Cheal, B, and Borisyuk, G. (Forthcoming) The New Deal for Communities: Assessing Procedures and Voter Turnout at Partnership Board Elections. Environment and Planning C.

New Deal for Communities: The National Evaluation
Annual Report 2003/4 72
5.13. The type of election appears to have little effect on turnout. Four of the six with a positive difference held postal ballots, and two both postal and polling ballots. Among the other 17 most organised postal ballots, but this group also includes Partnerships that held postal and polling, polling only, and telephone, or a combination of all three.
5.14. Comparing NDC with local elections is at best only a gauge as to the Partnership's
success in bolstering turnout. Local election turnout can be strongly influenced by factors such as the marginality of the seat, how often elections are held, the importance of the election, and the parties that are standing.
5.15. Possible reasons why most NDC areas experience lower turnouts than local
elections include the fact that NDC elections are non-partisan. This can reduce cues for non-informed voters. It is also possible that voters, particularly those who have recently voted in council elections, may suffer voter fatigue. An important reason for non-participation in elections generally is perceptions among the electorate of lack of relevance. This may help explain low NDC election turnout. Conversely research also shows that the perceived salience of an election and the visibility of elected officials and institutions are key motivators to vote. Some NDC Partnerships may look to provide more publicity for their elections and candidates, and do more to raise the profile of Board members and the NDC itself. By 2005 the research team will be able to compare how trust in, and knowledge of, a Partnership impacts on election turnout.
5.16. Only four Partnerships held a second election during 2003/04, and the data is
inconclusive. However, as more Partnerships repeat their election process this measure can be used to inform future reports.
5.17. Turnout for NDC elections in Leicester and Rochdale reduced two and four
percentage points to 12% and 20% respectively, while in Newcastle it increased by four percentage points to 17%. Meanwhile Luton NDC's turnout increased dramatically from a disappointing 3% to 29%. To achieve this turn around, in the lead up to the election the Partnership ran information events on the election process and candidates canvassed the community.
5.18. There are a variety of methods that NDC Partnerships may employ in order to
increase turnout rates in future elections. Although the majority have postal voting, few offer telephone voting and none currently offer e-voting. Partnerships can also probably influence turnout by ensuring that elections are well publicised in the local media, and the electorate is given opportunities to meet candidates. It is also important that Partnerships help ensure enough people contest seats to make voters think elections are of relevance to themselves.
5.19. Respondents in Partnerships identify a number of benefits flowing from formal
elections:
• Raising the confidence of elected Board Members.
• Demonstrating accountability.
• Acting as a mechanism for attracting new resident Board members.
5.20. However, there can be disadvantages in that elections can:
• Be costly: some NDCs report a reluctance to spend money on elections, especially where turnout has been low.
• Prove time consuming: one NDC estimated that the time 'costs' associated with electing and training five new Board members were up to two 'person years'.

New Deal for Communities: The National Evaluation
Annual Report 2003/4 73
• Be disruptive to Board operations and detract from NDC operations.
• Cause a division between elected and non-elected members; issues surrounding representation and accountability can be especially problematic when turnout has been low.
• Destabilise the Board.
• Result in few new candidates
• Result in the loss of valuable experience amongst existing Board members.
5.21. Additionally, there is some evidence that open elections have not always been
particularly successful in recruiting representatives from BME communities or in attracting young people to stand for election. NDCs may need to consider alternative ways of recruiting and supporting representatives from these communities. In Bradford, for instance, the Partnership is exploring ways of engaging young people through co-opting representatives from the youth forum onto working groups, an approach adopted by other NDCs including Shoreditch. In Sandwell, the potential for open elections is being piloted within the Pakistani community.
MEMBERSHIP
Size of Boards
5.22. Figure 5.6 illustrates the size of Boards. This shows a broad range, from 12 in Manchester to 43 in Derby. However, as is illustrated in Figure 5.7, the majority have between 15 and 30 members on their Boards.

New Deal for Communities: The National Evaluation
Annual Report 2003/4 74
Figure 5.6: Number of Board members by Partnership
0
5
10
15
20
25
30
35
40
45
50
Derb
y
Liv
erp
ool
H's
mith &
Fulh
am
Coventr
y
Know
sle
y
Bra
dfo
rd
Nott
ingham
Hull
New
ham
Tow
er
Ham
lets
Hackney
Hart
lepool
Rochdale
Sandw
ell
Wals
all
Islin
gto
n
Luto
n
South
wark
Birm
ingham
KN
Haringey
New
castle
Ply
mouth
Wolv
erh
am
ton
Lew
isham
Mid
dle
sbro
ugh
Sunderland
Bre
nt
Bristo
l
Lam
beth
Old
ham
Leic
este
r
Sheff
ield
South
am
pto
n
Birm
ingham
Brighto
n
Norw
ich
Salford
Mancheste
r
num
ber
of
board
mem
bers
Source: CRESR
Figure 5.7: Number of Board members by NDCs
0
2
4
6
8
10
12
14
16
18
20
0 -
4
5 -
9
10 -
14
15 -
19
20 -
24
25 -
29
30 -
34
35 -
39
40 -
44
Number of board members
Num
ber
of
ND
C's
Base: 38 partnerships Source: CRESR
5.23. Figure 5.8 indicates the extent to which the size of Boards changed between
2002/03 and 2003/04. Most Boards did not change and only a handful decreased in size.
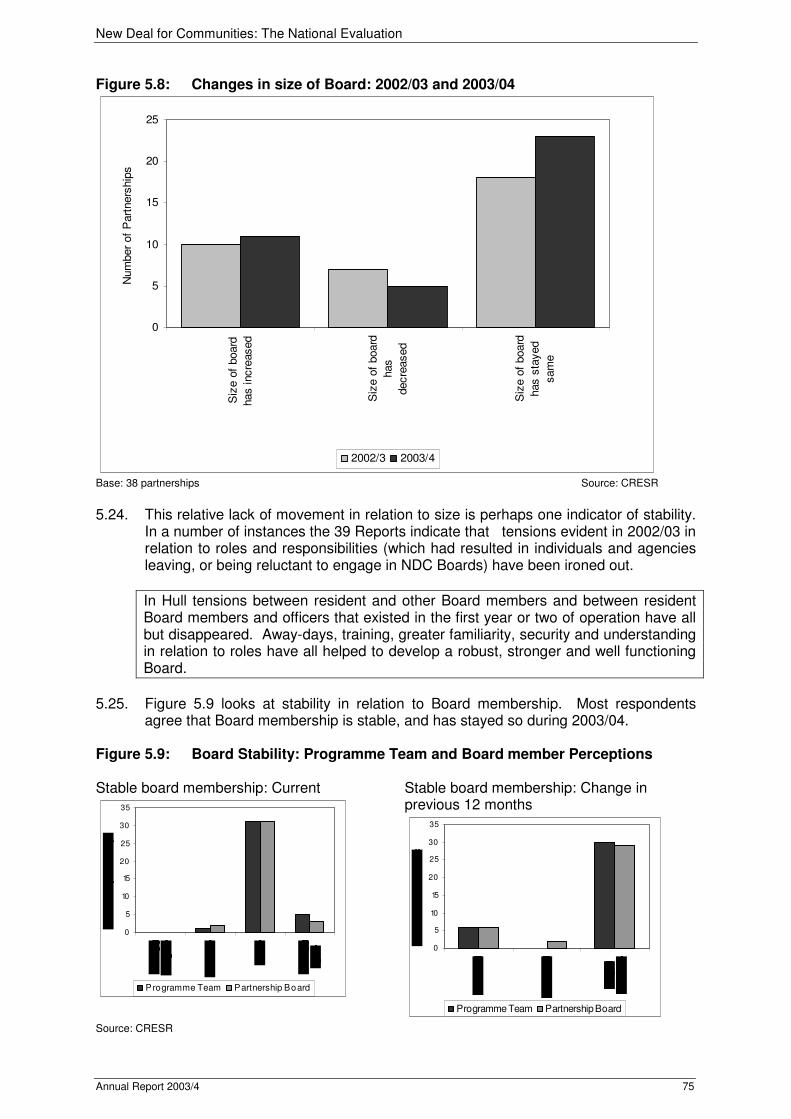
New Deal for Communities: The National Evaluation
Annual Report 2003/4 75
Figure 5.8: Changes in size of Board: 2002/03 and 2003/04
0
5
10
15
20
25
Siz
e o
f board
has incre
ased
Siz
e o
f board
has
decre
ased
Siz
e o
f board
has s
tayed
sam
e
Num
ber
of
Part
ners
hip
s
2002/3 2003/4
Base: 38 partnerships Source: CRESR
5.24. This relative lack of movement in relation to size is perhaps one indicator of stability.
In a number of instances the 39 Reports indicate that tensions evident in 2002/03 in relation to roles and responsibilities (which had resulted in individuals and agencies leaving, or being reluctant to engage in NDC Boards) have been ironed out.
In Hull tensions between resident and other Board members and between resident Board members and officers that existed in the first year or two of operation have all but disappeared. Away-days, training, greater familiarity, security and understanding in relation to roles have all helped to develop a robust, stronger and well functioning Board.
5.25. Figure 5.9 looks at stability in relation to Board membership. Most respondents
agree that Board membership is stable, and has stayed so during 2003/04. Figure 5.9: Board Stability: Programme Team and Board member Perceptions Stable board membership: Current
0
5
10
15
20
25
30
35
Programme Team Partnership Board
Stable board membership: Change in previous 12 months
0
5
10
15
20
25
30
35
Programme Team Partnership Board
Source: CRESR
New Deal for Communities: The National Evaluation
Annual Report 2003/4 76
BME Representation
5.26. Figure 5.10 illustrates BME representation on NDC Boards. BME representation ranges from 0% in Brighton, Middlesbrough, Norwich, Rochdale, Salford and Southampton to 64% in Nottingham. The average across all Partnerships is 20%.
Figure 5.10: BME representation on NDC Boards
0
10
20
30
40
50
60
70
Nott
ingham
South
wark
Bra
dfo
rd
Sheff
ield
Tow
er
Ham
lets
Birm
ingham
A
Hackney
New
ham
Luto
n
Haringey
Bre
nt
Lew
isham
New
castle
Doncaste
r
Birm
ingham
KN
Islin
gto
n
Lam
beth
Sunderland
Bristo
l
Leic
este
r
Sandw
ell
Know
sle
y
Old
ham
Ply
mouth
Wolv
erh
am
pto
n
Hart
lepool
Hull
Wals
all
Coventr
y
Liv
erp
ool
Derb
y
Brighto
n
Mid
dle
sbro
ugh
Norw
ich
Rochdale
Salford
South
am
pto
n
Mancheste
r
Perc
enta
ge o
f board
mem
bers
NDC NDC average
Base: 38 partnerships Source: CRESR
5.27. Figure 5.11 looks at the extent to which BME representation on NDC Boards
changed during 2003/04. In most the level of BME participation on NDC Boards has increased or stayed the same. BME Board membership remained the same in 17 Partnerships, increased in 11 and decreased in 6. A slightly larger number of NDCs increased BME representation on Boards than was the case in 2002/03. In November 2002 some 10 Boards had a higher proportion of BME Board members than local BME populations would suggest and 26 a lower proportion. Those figures had changed to 15 and 23 by November 2003.

New Deal for Communities: The National Evaluation
Annual Report 2003/4 77
Figure 5.11: BME representation on NDC Boards: changes 2002/03 to 2003/04
0
5
10
15
20
25
BM
E b
oard
mem
bers
incre
ased
BM
E b
oard
mem
bers
decre
ased
BM
E b
oard
mem
bers
sta
yed t
he
sam
e
Num
ber
of
Part
ners
hip
s
2002/3 2003/4
Base: 38 partnerships Source: CRESR
5.28. Partnerships continue to experience difficulties in ensuring that Boards reflect the full
diversity of NDC neighbourhoods. Partnerships highlight particular difficulties in recruiting Black African and Black Caribbean residents to sit on Boards. In others, particularly where communities are very diverse, there is an awareness that to consider Board members as representatives of particular ethnic communities might be perceived as 'tokenistic'. At least one NDC, for instance has resisted the appointment of a Board member to represent minority ethnic interests on the grounds that there is no single minority ethnic viewpoint, but rather a diverse range of backgrounds and interests.
Gender
5.29. Figure 5.12 shows the percentage of female Board members. Most have between 40 and 49 per cent of female board members, although only 6 have 50% or more. The proportion of female members ranges from 17 per cent in Walsall to 56 per cent in Southampton. The average across all NDCs is 39 per cent.
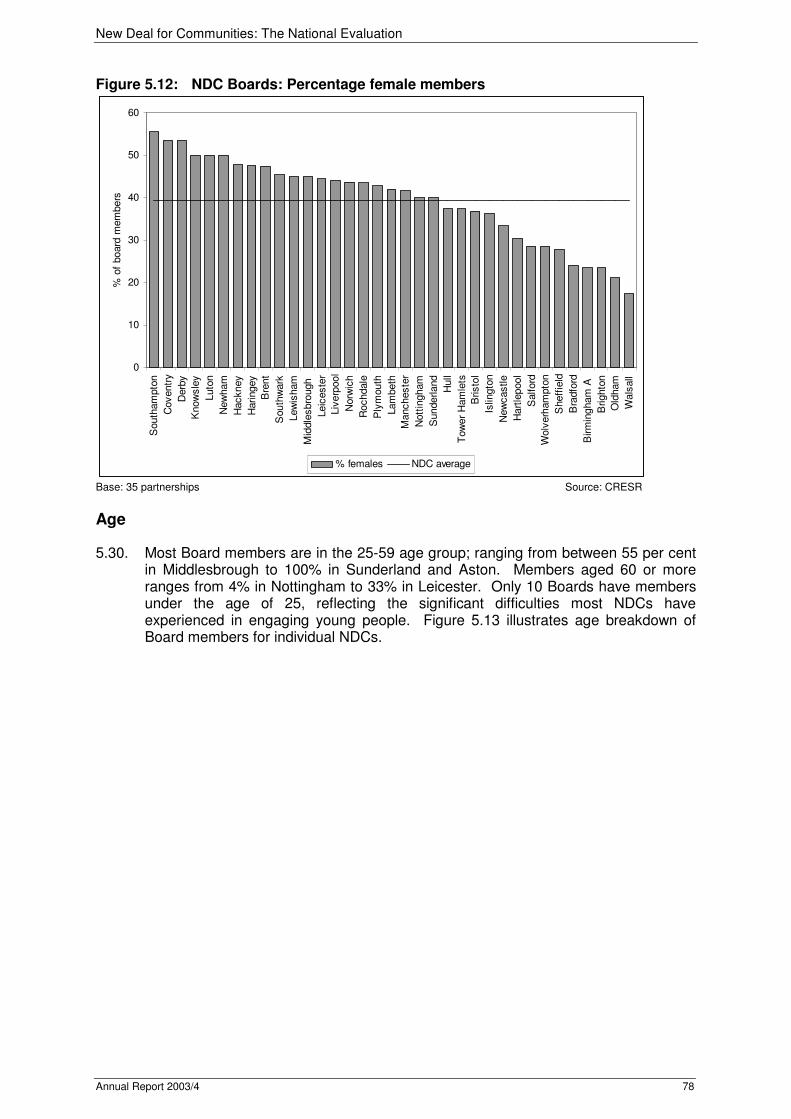
New Deal for Communities: The National Evaluation
Annual Report 2003/4 78
Figure 5.12: NDC Boards: Percentage female members
0
10
20
30
40
50
60
South
am
pto
n
Coventr
y
Derb
y
Know
sle
y
Luto
n
New
ham
Hackney
Haringey
Bre
nt
South
wark
Lew
isham
Mid
dle
sbro
ugh
Leic
este
r
Liv
erp
ool
Norw
ich
Rochdale
Ply
mouth
Lam
beth
Mancheste
r
Nott
ingham
Sunderland
Hull
Tow
er
Ham
lets
Bristo
l
Islin
gto
n
New
castle
Hart
lepool
Salford
Wolv
erh
am
pto
n
Sheff
ield
Bra
dfo
rd
Birm
ingham
A
Brighto
n
Old
ham
Wals
all
% o
f board
mem
bers
% females NDC average
Base: 35 partnerships Source: CRESR
Age
5.30. Most Board members are in the 25-59 age group; ranging from between 55 per cent in Middlesbrough to 100% in Sunderland and Aston. Members aged 60 or more ranges from 4% in Nottingham to 33% in Leicester. Only 10 Boards have members under the age of 25, reflecting the significant difficulties most NDCs have experienced in engaging young people. Figure 5.13 illustrates age breakdown of Board members for individual NDCs.
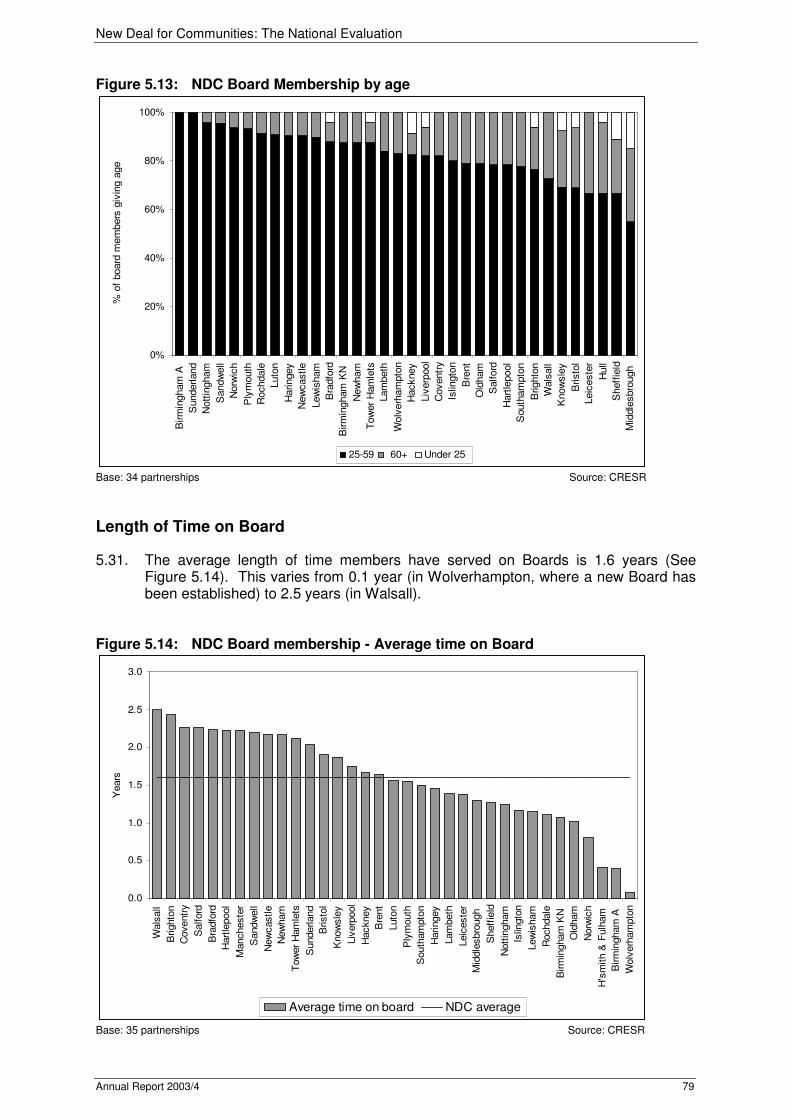
New Deal for Communities: The National Evaluation
Annual Report 2003/4 79
Figure 5.13: NDC Board Membership by age
0%
20%
40%
60%
80%
100%
Birm
ingham
A
Sunderland
Nott
ingham
Sandw
ell
Norw
ich
Ply
mouth
Rochdale
Luto
n
Haringey
New
castle
Lew
isham
Bra
dfo
rd
Birm
ingham
KN
New
ham
Tow
er
Ham
lets
Lam
beth
Wolv
erh
am
pto
n
Hackney
Liv
erp
ool
Coventr
y
Islin
gto
n
Bre
nt
Old
ham
Salford
Hart
lepool
South
am
pto
n
Brighto
n
Wals
all
Know
sle
y
Bristo
l
Leic
este
r
Hull
Sheff
ield
Mid
dle
sbro
ugh
% o
f board
mem
bers
giv
ing a
ge
25-59 60+ Under 25
Base: 34 partnerships Source: CRESR
Length of Time on Board
5.31. The average length of time members have served on Boards is 1.6 years (See Figure 5.14). This varies from 0.1 year (in Wolverhampton, where a new Board has been established) to 2.5 years (in Walsall).
Figure 5.14: NDC Board membership - Average time on Board
0.0
0.5
1.0
1.5
2.0
2.5
3.0
Wals
all
Brighto
n
Coventr
y
Salford
Bra
dfo
rd
Hart
lepool
Mancheste
r
Sandw
ell
New
castle
New
ham
Tow
er
Ham
lets
Sunderland
Bristo
l
Know
sle
y
Liv
erp
ool
Hackney
Bre
nt
Luto
n
Ply
mouth
South
am
pto
n
Haringey
Lam
beth
Leic
este
r
Mid
dle
sbro
ugh
Sheff
ield
Nott
ingham
Islin
gto
n
Lew
isham
Rochdale
Birm
ingham
KN
Old
ham
Norw
ich
H's
mith &
Fulh
am
Birm
ingham
A
Wolv
erh
am
pto
n
Years
Average time on board NDC average
Base: 35 partnerships Source: CRESR
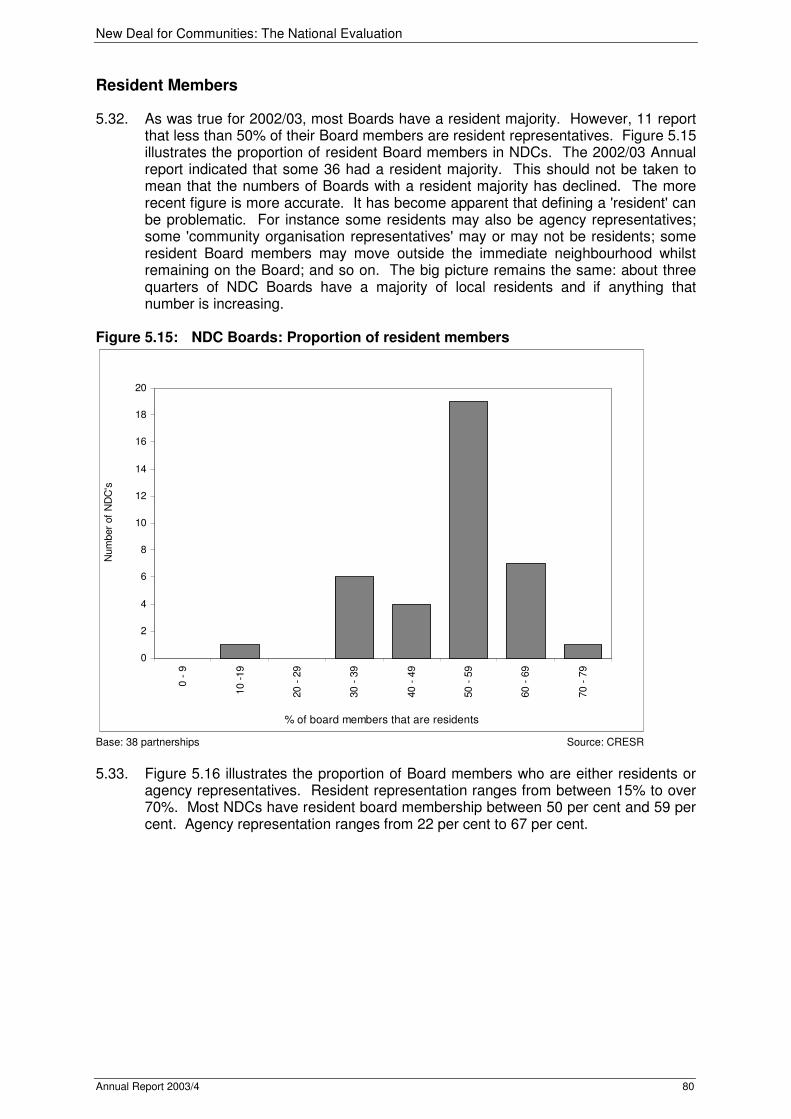
New Deal for Communities: The National Evaluation
Annual Report 2003/4 80
Resident Members
5.32. As was true for 2002/03, most Boards have a resident majority. However, 11 report that less than 50% of their Board members are resident representatives. Figure 5.15 illustrates the proportion of resident Board members in NDCs. The 2002/03 Annual report indicated that some 36 had a resident majority. This should not be taken to mean that the numbers of Boards with a resident majority has declined. The more recent figure is more accurate. It has become apparent that defining a 'resident' can be problematic. For instance some residents may also be agency representatives; some 'community organisation representatives' may or may not be residents; some resident Board members may move outside the immediate neighbourhood whilst remaining on the Board; and so on. The big picture remains the same: about three quarters of NDC Boards have a majority of local residents and if anything that number is increasing.
Figure 5.15: NDC Boards: Proportion of resident members
0
2
4
6
8
10
12
14
16
18
20
0 -
9
10 -
19
20 -
29
30 -
39
40 -
49
50 -
59
60 -
69
70 -
79
% of board members that are residents
Num
ber
of
ND
C's
Base: 38 partnerships Source: CRESR
5.33. Figure 5.16 illustrates the proportion of Board members who are either residents or
agency representatives. Resident representation ranges from between 15% to over 70%. Most NDCs have resident board membership between 50 per cent and 59 per cent. Agency representation ranges from 22 per cent to 67 per cent.

New Deal for Communities: The National Evaluation
Annual Report 2003/4 81
Figure 5.16: NDC Board Representation: residents and agencies
0
20
40
60
80
100
Mancheste
r
Know
sle
y
Sandw
ell
Bristo
l
Sunderland
Liv
erp
ool
Salford
Coventr
y
Hull
Rochdale
Lam
beth
Birm
ingham
A
Brighto
n
New
ham
Lew
isham
Derb
y
Hart
lepool
Wolv
erh
am
pto
Old
ham
Bre
nt
Tow
er
Ham
lets
Bra
dfo
rd
New
castle
Norw
ich
South
wark
Nott
ingham
Hackney
Birm
ingham
Haringey
H's
mith&
Fulh
a
Sheff
ield
Wals
all
Mid
dle
sbro
ugh
Ply
mouth
South
am
pto
n
Islin
gto
n
Luto
n
Leic
este
r
% o
f board
mem
bers
% of board from agencies % of resident board members % other
Base: 38 partnerships Source: CRESR
5.34. Figure 5.17 looks at the extent to which Partnerships experienced change in
numbers of resident Board members in the previous twelve months. Again, the overall picture is one of stability; with over half the Partnerships reporting no change in the numbers of resident representatives. However, more Partnerships increased the numbers of resident Board members in 2003/04 than was the case in 2002/03.
Sheffield NDC carried out significant restructuring of the Board during 2003. The key change to the composition of the Board has been to increase the level of community representation. This was in response to concerns around the balance between community representation and other agencies on the Board, the importance of representing a range of interests and groups, and the need to lessen the work load placed on community representatives. The level of voluntary sector representation on the Board has also been boosted.
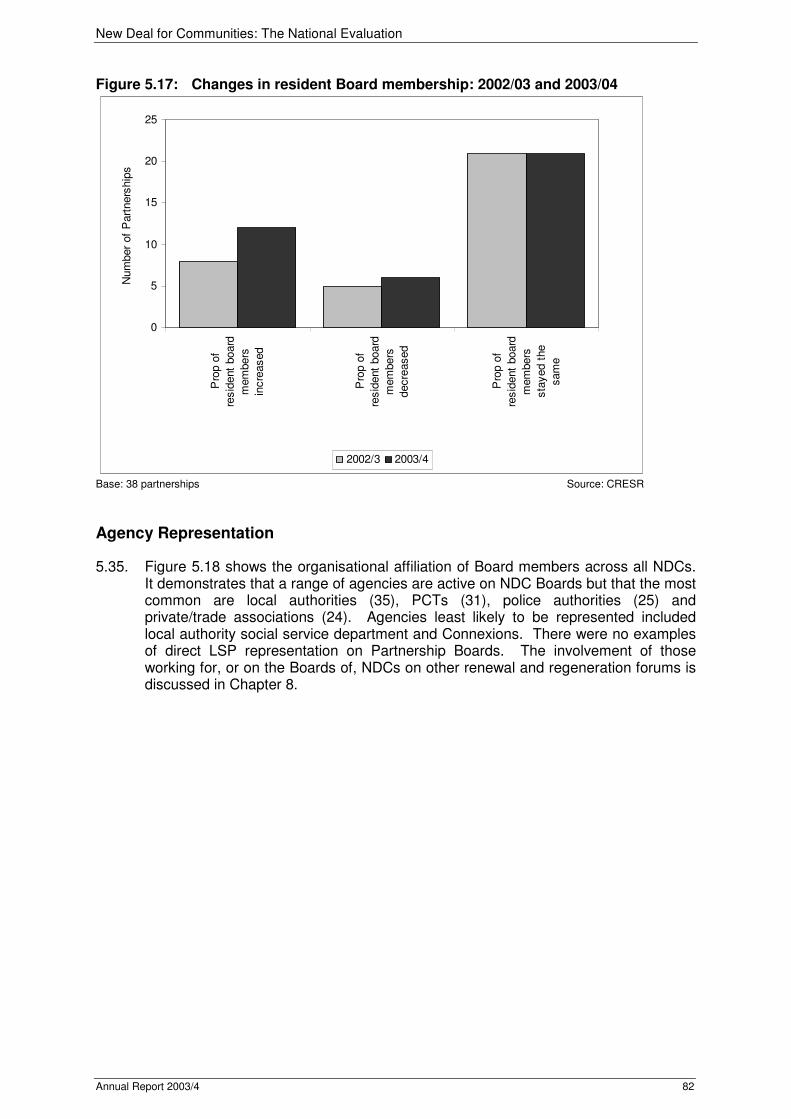
New Deal for Communities: The National Evaluation
Annual Report 2003/4 82
Figure 5.17: Changes in resident Board membership: 2002/03 and 2003/04
0
5
10
15
20
25
Pro
p o
f
resid
ent
board
mem
bers
incre
ased
Pro
p o
f
resid
ent
board
mem
bers
decre
ased
Pro
p o
f
resid
ent
board
mem
bers
sta
yed t
he
sam
e
Num
ber
of
Part
ners
hip
s
2002/3 2003/4
Base: 38 partnerships Source: CRESR
Agency Representation
5.35. Figure 5.18 shows the organisational affiliation of Board members across all NDCs. It demonstrates that a range of agencies are active on NDC Boards but that the most common are local authorities (35), PCTs (31), police authorities (25) and private/trade associations (24). Agencies least likely to be represented included local authority social service department and Connexions. There were no examples of direct LSP representation on Partnership Boards. The involvement of those working for, or on the Boards of, NDCs on other renewal and regeneration forums is discussed in Chapter 8.

New Deal for Communities: The National Evaluation
Annual Report 2003/4 83
Figure 5.18: Agency affiliation of Board members
0
5
10
15
20
25
30
35
40
LA
PC
T
Polic
e
Private
/tra
de a
ssocia
tion
Oth
er
IEA
Job c
entr
e p
lus
LS
C
Housin
g a
ssocia
tion
Centr
al govern
ment
RS
L
MoP
/ele
cte
d m
em
ber
Youth
serv
ices
Govern
ment
off
ice
Sure
sta
rt
Connexio
ns
Socia
l serv
ices
LS
P
Num
ber
of
ND
C's
Agencies
Base: 38 partnerships Source: CRESR
5.36. Figures 5.19 and 5.20 illustrate the numbers of agencies represented on NDC
Boards. Number of agencies ranged from 1 to 10. Figure 5.19: Number of Agencies on NDC Boards by Partnership
0
2
4
6
8
10
12
Derb
y
Liv
erp
ool
Bristo
l
Birm
ingham
A
Bre
nt
Coventr
y
H's
mith &
Fulh
am
Hackney
Lew
isham
New
ham
Rochdale
Bra
dfo
rd
Brighto
n
Haringey
Hart
lepool
Islin
gto
n
Lam
beth
Sandw
ell
Tow
er
Ham
lets
Wolv
erh
am
pto
n
Birm
ingham
KN
Luto
n
Norw
ich
South
wark
Sunderland
Wals
all
Leic
este
r
Mancheste
r
New
castle
Old
ham
Ply
mouth
Sheff
ield
South
am
pto
n
Mid
dle
sbro
ugh
Salford
Hull
Nott
ingham
Know
sle
y
Num
ber
of
Agencie
s o
n N
DC
board
NDC Average number of agencies on board
Base: 38 partnerships Source: CRESR
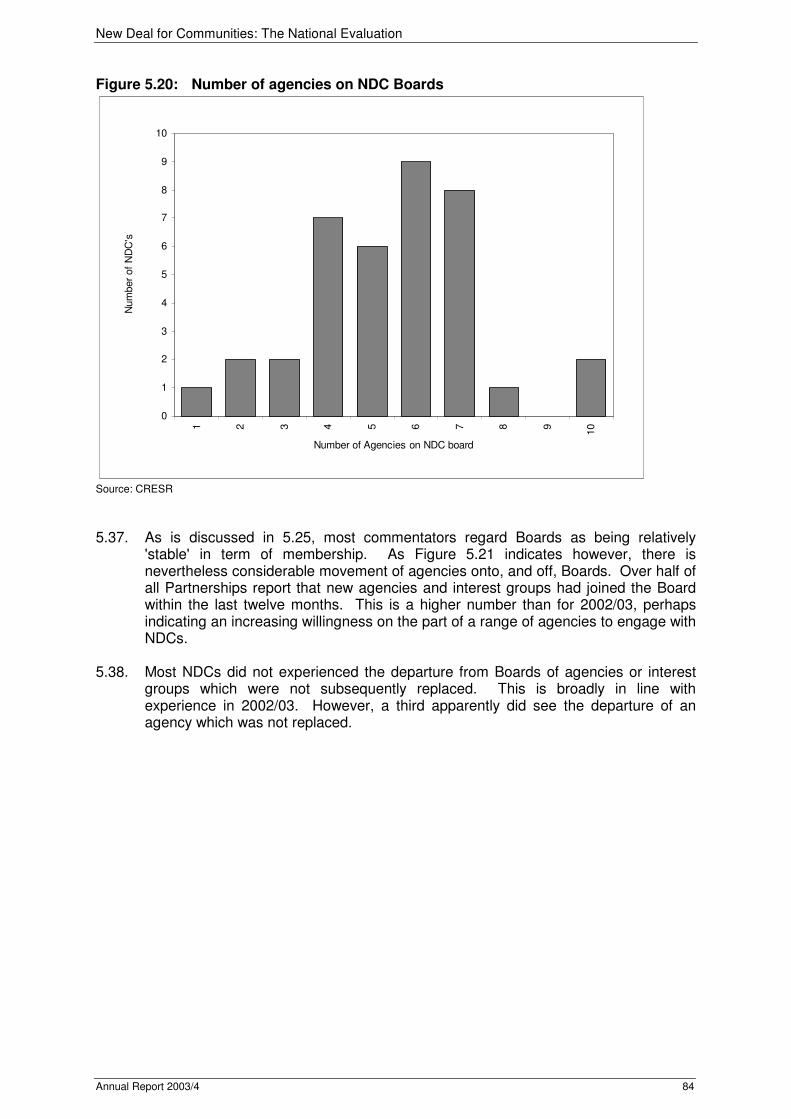
New Deal for Communities: The National Evaluation
Annual Report 2003/4 84
Figure 5.20: Number of agencies on NDC Boards
0
1
2
3
4
5
6
7
8
9
10
1 2 3 4 5 6 7 8 9
10
Number of Agencies on NDC board
Num
ber
of
ND
C's
Source: CRESR
5.37. As is discussed in 5.25, most commentators regard Boards as being relatively
'stable' in term of membership. As Figure 5.21 indicates however, there is nevertheless considerable movement of agencies onto, and off, Boards. Over half of all Partnerships report that new agencies and interest groups had joined the Board within the last twelve months. This is a higher number than for 2002/03, perhaps indicating an increasing willingness on the part of a range of agencies to engage with NDCs.
5.38. Most NDCs did not experienced the departure from Boards of agencies or interest
groups which were not subsequently replaced. This is broadly in line with experience in 2002/03. However, a third apparently did see the departure of an agency which was not replaced.

New Deal for Communities: The National Evaluation
Annual Report 2003/4 85
Figure 5.21: Change in agencies represented on NDC Boards over the last 12 months (2002/03 and 2003/04)
0
5
10
15
20
25
30
Have n
ew
agencie
s o
r
inte
rest
gro
ups join
ed
the b
oard
?
Have
agencie
s o
r
inte
rest
gro
ups left
the
board
and n
ot
been
repla
ced?
Num
ber
of
Part
ners
hip
s
Yes (2002/3) No (2002/3) Yes (2003/4) No (2003/4)
Source: CRESR
Chairs and Chief Executives
5.39. Figure 5.22 indicates that Chairs and Chief Executives remained the same in most Partnerships in 2003/04. However, a significant number changed either the Chair or the Chief Executive in 2003/04 (13 and 12 respectively) and 6 Partnerships experienced a change in both during 2003/04. In 3 the post of Chief Executive was vacant at the time of data collection. As is discussed in Chapter 9, the loss of a Chief Executive is often associated with relative underspend.
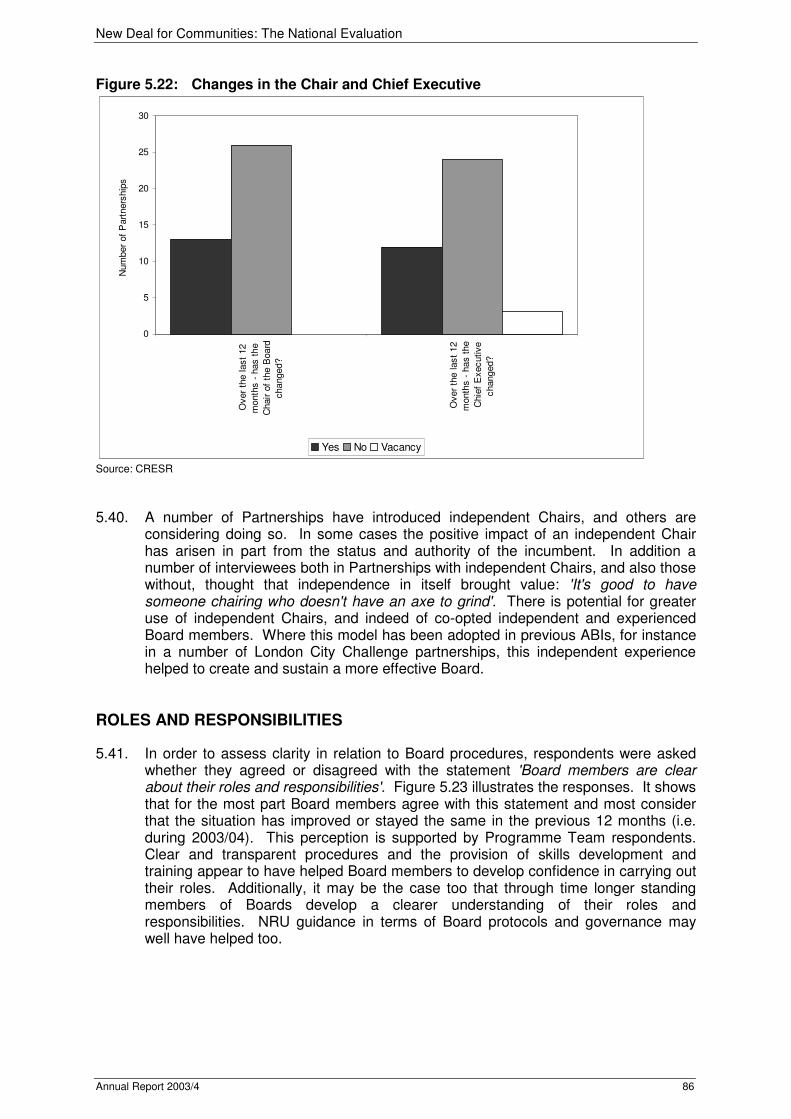
New Deal for Communities: The National Evaluation
Annual Report 2003/4 86
Figure 5.22: Changes in the Chair and Chief Executive
0
5
10
15
20
25
30
Over
the last
12
month
s -
has t
he
Chair o
f th
e B
oard
changed?
Over
the last
12
month
s -
has t
he
Chie
f E
xecutive
changed?
Num
ber
of
Part
ners
hip
s
Yes No Vacancy
Source: CRESR
5.40. A number of Partnerships have introduced independent Chairs, and others are
considering doing so. In some cases the positive impact of an independent Chair has arisen in part from the status and authority of the incumbent. In addition a number of interviewees both in Partnerships with independent Chairs, and also those without, thought that independence in itself brought value: 'It's good to have someone chairing who doesn't have an axe to grind'. There is potential for greater use of independent Chairs, and indeed of co-opted independent and experienced Board members. Where this model has been adopted in previous ABIs, for instance in a number of London City Challenge partnerships, this independent experience helped to create and sustain a more effective Board.
ROLES AND RESPONSIBILITIES
5.41. In order to assess clarity in relation to Board procedures, respondents were asked whether they agreed or disagreed with the statement 'Board members are clear about their roles and responsibilities'. Figure 5.23 illustrates the responses. It shows that for the most part Board members agree with this statement and most consider that the situation has improved or stayed the same in the previous 12 months (i.e. during 2003/04). This perception is supported by Programme Team respondents. Clear and transparent procedures and the provision of skills development and training appear to have helped Board members to develop confidence in carrying out their roles. Additionally, it may be the case too that through time longer standing members of Boards develop a clearer understanding of their roles and responsibilities. NRU guidance in terms of Board protocols and governance may well have helped too.

New Deal for Communities: The National Evaluation
Annual Report 2003/4 87
Figure 5.23: Board membership: clarity in relation to roles and responsibilities Roles and Responsibilities: Current
0
5
10
15
20
25
30
35
Programme Team Partnership Board
Roles and Responsibilities: Change in previous 12 months
0
5
10
15
20
25
30
35
Programme Team Partnership Board
Source: CRESR 5.42. However, other more critical comments emerged from the 39 Reports:
• 'It is a matter of concern that, for two years in a row, and now four years into the Programme, a significant minority of Board members have doubts about the role they and their colleagues should be playing'.
• 'Overall there was a consensus from the programme team that there has been an increased understanding of roles but only by some, with others questioning whether some Board members will ever have the capacity to play their role correctly'.
• 'A spirit of partnership is difficult to detect and the minutes (of Board meetings) reveal that collective responsibility is not always the norm. Directors representing the agencies are not all playing as full a role as they might'.
Accountability
5.43. Respondents were asked whether they agreed with the statement 'Appropriate structures for accountability for Board members are being developed or are in place'. Responses are detailed in Figure 5.24. Programme Team and Board respondents in a majority of Partnerships agree with the statement. Furthermore, accountability structures are seen to have improved in the previous twelve months.

New Deal for Communities: The National Evaluation
Annual Report 2003/4 88
Figure 5.24: Board membership: structures for accountability
Appropriate structures: Current
0
5
10
15
20
25
30
35
Programme Team Partnership Board
Appropriate structures: Change in previous 12 months
0
5
10
15
20
25
30
35
Programme Team Partnership Board
Source: CRESR
Time Commitment
5.44. Respondents were asked to comment on the statement: 'Board members are generally happy with the time commitment required of them by NDC'. . Programme Teams in 16, and Board respondents in 15, Partnerships indicate a degree of dissatisfaction with the time commitments associated with Board membership. Additionally, although respondents in most Partnerships suggest that there has been little change in the time commitment required of Board members, in a few the situation apparently deteriorated during 2003/04. (Figure 5.25).
Figure 5.25: Board Membership: time commitments Time commitment: Current
0
5
10
15
20
25
30
35
Programme Team Partnership Board
Time commitment: Change in previous 12 months
0
5
10
15
20
25
30
35
Programme Team Partnership Board
Source: CRESR
SKILLS AND DEVELOPMENT
5.45. Respondents were asked whether they agreed or disagreed with the statement 'Board members have the necessary skills to carry out their roles effectively'. As Figure 5.26 indicates, respondents are divided on their views. However a majority think that the situation has improved or stayed the same in the previous twelve months.
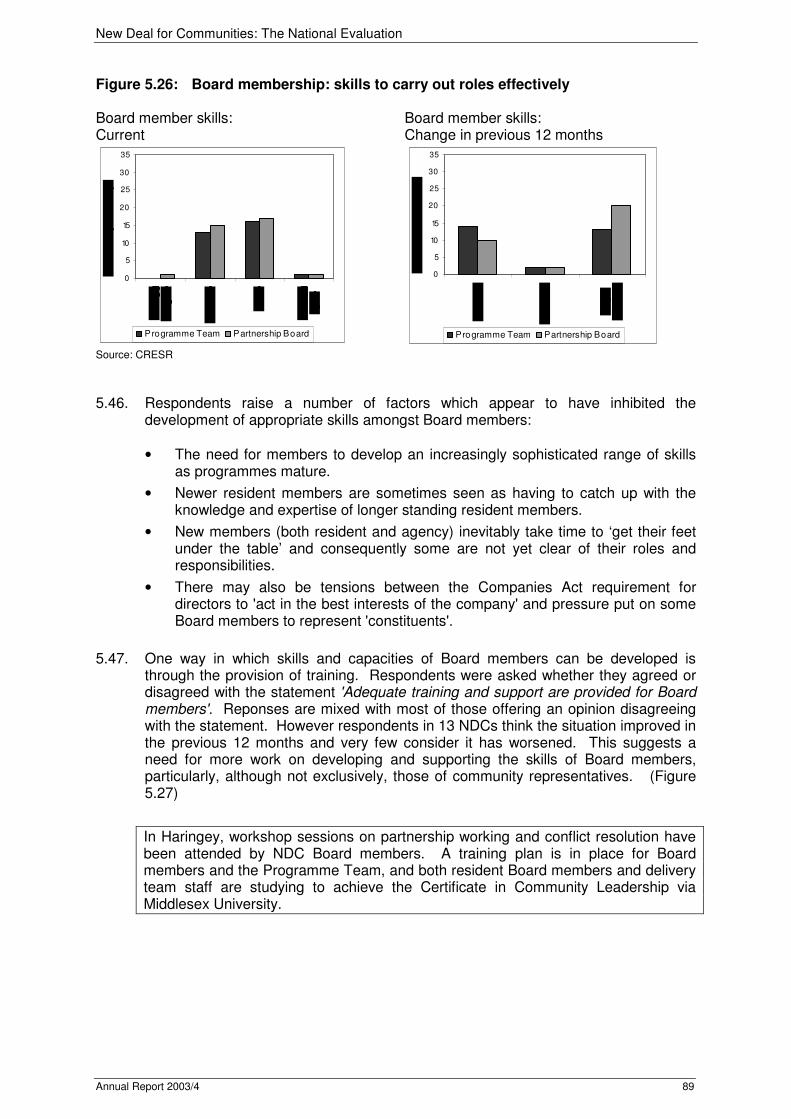
New Deal for Communities: The National Evaluation
Annual Report 2003/4 89
Figure 5.26: Board membership: skills to carry out roles effectively Board member skills: Current
0
5
10
15
20
25
30
35
Programme Team Partnership Board
Board member skills: Change in previous 12 months
0
5
10
15
20
25
30
35
Programme Team Partnership Board
Source: CRESR
5.46. Respondents raise a number of factors which appear to have inhibited the
development of appropriate skills amongst Board members:
• The need for members to develop an increasingly sophisticated range of skills as programmes mature.
• Newer resident members are sometimes seen as having to catch up with the knowledge and expertise of longer standing resident members.
• New members (both resident and agency) inevitably take time to ‘get their feet under the table’ and consequently some are not yet clear of their roles and responsibilities.
• There may also be tensions between the Companies Act requirement for directors to 'act in the best interests of the company' and pressure put on some Board members to represent 'constituents'.
5.47. One way in which skills and capacities of Board members can be developed is
through the provision of training. Respondents were asked whether they agreed or disagreed with the statement 'Adequate training and support are provided for Board members'. Reponses are mixed with most of those offering an opinion disagreeing with the statement. However respondents in 13 NDCs think the situation improved in the previous 12 months and very few consider it has worsened. This suggests a need for more work on developing and supporting the skills of Board members, particularly, although not exclusively, those of community representatives. (Figure 5.27)
In Haringey, workshop sessions on partnership working and conflict resolution have been attended by NDC Board members. A training plan is in place for Board members and the Programme Team, and both resident Board members and delivery team staff are studying to achieve the Certificate in Community Leadership via Middlesex University.
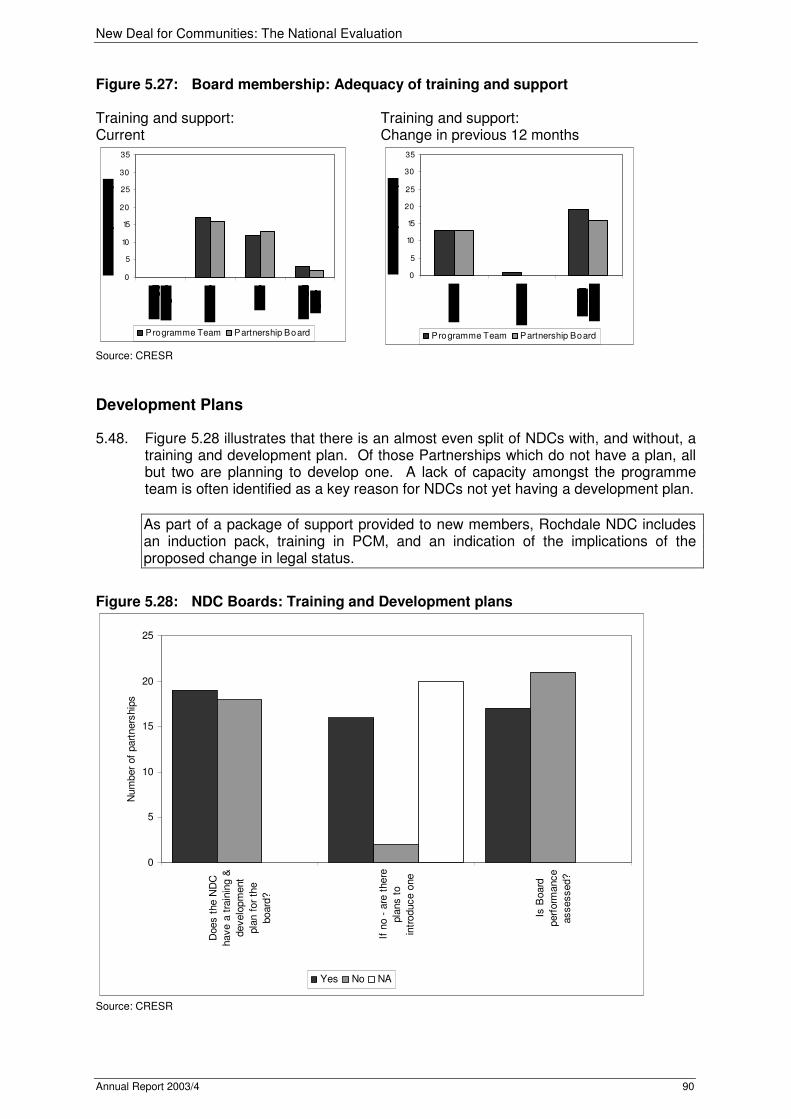
New Deal for Communities: The National Evaluation
Annual Report 2003/4 90
Figure 5.27: Board membership: Adequacy of training and support Training and support: Current
0
5
10
15
20
25
30
35
Programme Team Partnership Board
Training and support: Change in previous 12 months
0
5
10
15
20
25
30
35
Programme Team Partnership Board
Source: CRESR
Development Plans
5.48. Figure 5.28 illustrates that there is an almost even split of NDCs with, and without, a training and development plan. Of those Partnerships which do not have a plan, all but two are planning to develop one. A lack of capacity amongst the programme team is often identified as a key reason for NDCs not yet having a development plan.
As part of a package of support provided to new members, Rochdale NDC includes an induction pack, training in PCM, and an indication of the implications of the proposed change in legal status.
Figure 5.28: NDC Boards: Training and Development plans
0
5
10
15
20
25
Does t
he N
DC
have a
tra
inin
g &
develo
pm
ent
pla
n f
or
the
board
?
If n
o -
are
there
pla
ns t
o
intr
oduce o
ne
Is B
oard
perf
orm
ance
assessed?
Num
ber
of
part
ners
hip
s
Yes No NA
Source: CRESR
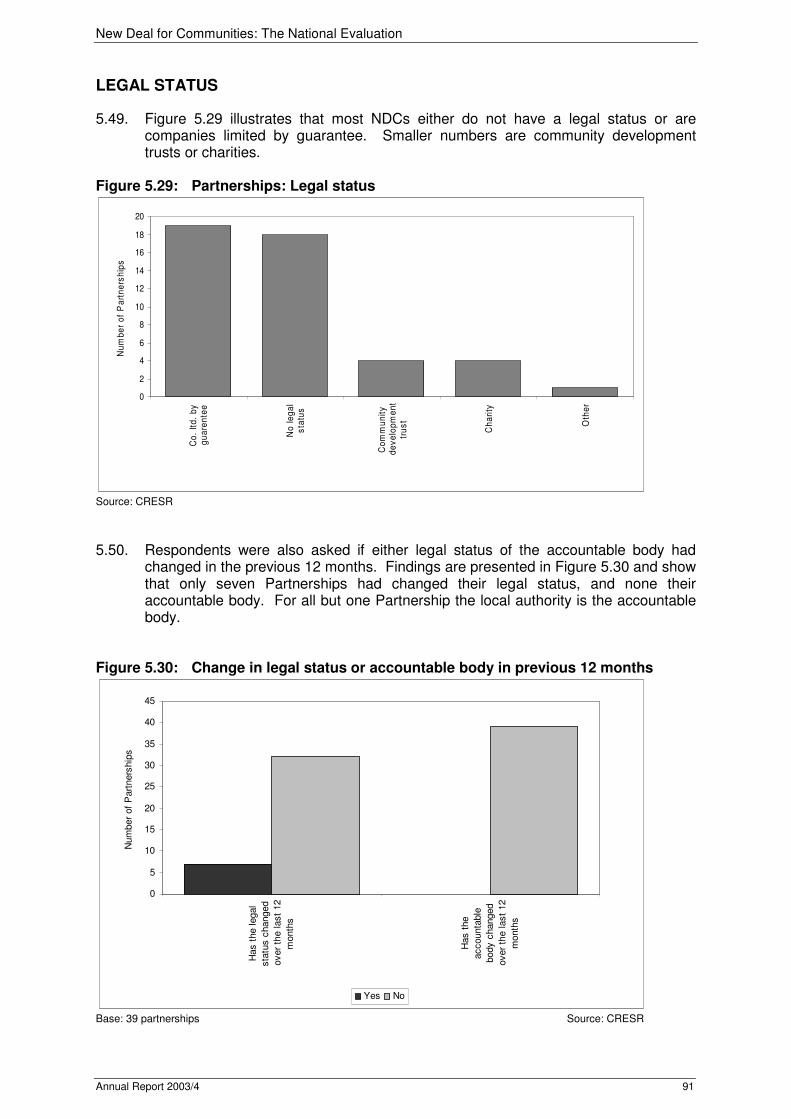
New Deal for Communities: The National Evaluation
Annual Report 2003/4 91
LEGAL STATUS
5.49. Figure 5.29 illustrates that most NDCs either do not have a legal status or are companies limited by guarantee. Smaller numbers are community development trusts or charities.
Figure 5.29: Partnerships: Legal status
0
2
4
6
8
10
12
14
16
18
20
Co
. lt
d.
by
gu
are
nte
e
No
le
ga
ls
tatu
s
Co
mm
un
ity
de
ve
lop
me
nt
tru
st
Ch
ari
ty
Oth
er
Nu
mb
er
of
Pa
rtn
ers
hip
s
Source: CRESR 5.50. Respondents were also asked if either legal status of the accountable body had
changed in the previous 12 months. Findings are presented in Figure 5.30 and show that only seven Partnerships had changed their legal status, and none their accountable body. For all but one Partnership the local authority is the accountable body.
Figure 5.30: Change in legal status or accountable body in previous 12 months
0
5
10
15
20
25
30
35
40
45
Has t
he legal
sta
tus c
hanged
over
the last
12
month
s
Has t
he
accounta
ble
body c
hanged
over
the last
12
month
s
Num
ber
of
Part
ners
hip
s
Yes No
Base: 39 partnerships Source: CRESR
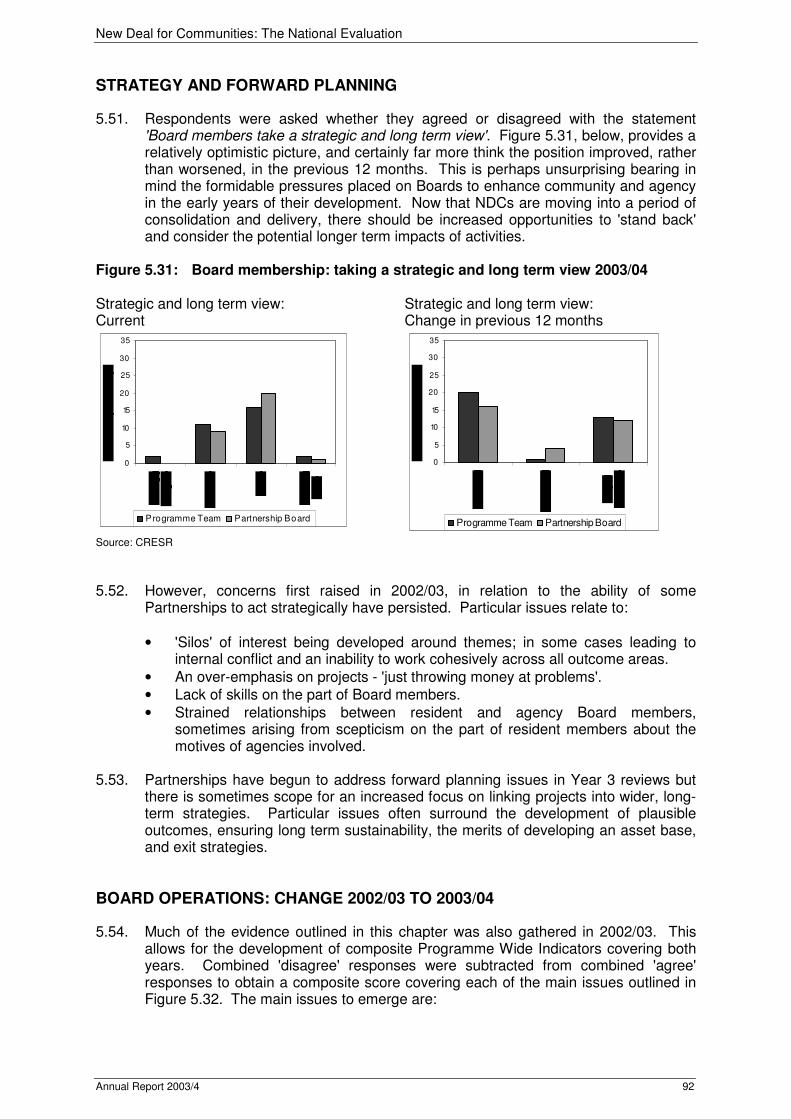
New Deal for Communities: The National Evaluation
Annual Report 2003/4 92
STRATEGY AND FORWARD PLANNING
5.51. Respondents were asked whether they agreed or disagreed with the statement 'Board members take a strategic and long term view'. Figure 5.31, below, provides a relatively optimistic picture, and certainly far more think the position improved, rather than worsened, in the previous 12 months. This is perhaps unsurprising bearing in mind the formidable pressures placed on Boards to enhance community and agency in the early years of their development. Now that NDCs are moving into a period of consolidation and delivery, there should be increased opportunities to 'stand back' and consider the potential longer term impacts of activities.
Figure 5.31: Board membership: taking a strategic and long term view 2003/04 Strategic and long term view: Current
0
5
10
15
20
25
30
35
Programme Team Partnership Board
Strategic and long term view: Change in previous 12 months
0
5
10
15
20
25
30
35
Programme Team Partnership Board
Source: CRESR
5.52. However, concerns first raised in 2002/03, in relation to the ability of some
Partnerships to act strategically have persisted. Particular issues relate to:
• 'Silos' of interest being developed around themes; in some cases leading to internal conflict and an inability to work cohesively across all outcome areas.
• An over-emphasis on projects - 'just throwing money at problems'.
• Lack of skills on the part of Board members.
• Strained relationships between resident and agency Board members, sometimes arising from scepticism on the part of resident members about the motives of agencies involved.
5.53. Partnerships have begun to address forward planning issues in Year 3 reviews but
there is sometimes scope for an increased focus on linking projects into wider, long-term strategies. Particular issues often surround the development of plausible outcomes, ensuring long term sustainability, the merits of developing an asset base, and exit strategies.
BOARD OPERATIONS: CHANGE 2002/03 TO 2003/04
5.54. Much of the evidence outlined in this chapter was also gathered in 2002/03. This allows for the development of composite Programme Wide Indicators covering both years. Combined 'disagree' responses were subtracted from combined 'agree' responses to obtain a composite score covering each of the main issues outlined in Figure 5.32. The main issues to emerge are:

New Deal for Communities: The National Evaluation
Annual Report 2003/4 93
• There is a close relationship between assessments for each of the two years; issues which respondents were relatively positive about in 2002/03, such as Board stability, were again in 2003/04 assessed relatively optimistically; others such as time commitments involved were consistently seen over the two year period in a less positive light.
• Of the nine Board criteria, five were assessed more highly in 2003/04 than was the case the year before.
• And the three issues which consistently tend to attract relatively more critical comment than others are having the necessary skills, the provision of adequate training, and time commitments involved.
Figure 5.32: Composite score by theme for 2002/03 and 2003/04
-10
-5
0
5
10
15
20
25
30
35
40
Board
mem
bers
hip
is s
table
Appro
priate
str
uctu
res f
or
accounta
bili
ty
Rela
tionship
s
betw
een B
oard
and
sta
ff a
re h
arm
onio
us
Rela
tionship
s w
ithin
the B
oard
are
harm
onio
us
Cle
ar
about
role
s
and r
esponsib
ilities
Take a
str
ate
gic
&
long t
erm
vie
w
Have t
he n
ecessary
skill
s
Adequate
tra
inin
g
and s
upport
are
pro
vid
ed
Happy w
ith t
ime
com
mitm
ent
Them
e s
core
2002/3 2003/4
Source: CRESR

New Deal for Communities: The National Evaluation
Annual Report 2003/4 94
CHAPTER 6: NDC PROGRAMME TEAMS: STAFFING, SYSTEMS AND AGENDAS
INTRODUCTION
6.1. This section explores issues relating to Partnerships':
• Staffing and human resources.
• Management Systems
• Local evaluation.
• Equalities and diversity.
STAFFING AND HUMAN RESOURCES
6.2. The 39 evaluation teams explored a range of staffing issues. Results are outlined below. These need to be treated with caution since it is clear that on occasions individual respondents in Partnerships may have problems in always identifying 'Management and Administration' staff as opposed to those working in projects funded or in some way supported by NDCs.
6.3. Across the Programme about 500 FTE staff (508 based on 38 Partnerships) are
funded out of the management and administration budget. As is laid out in Table 6.1 all but a handful of NDCs employ between 5 and 20 people as 'Management and Administration' staff.
Table 6.1: Management and Administration Budget: FTE staff employed 2003/04 Number of Partnerships
0 to 4.9 0 5 to 9.9 11 10 to 14.9 15 15 to 19.9 7 20 to 24.9 3 25+ 2
Base: 38 Partnerships Source: CRESR
6.4. Partnerships were also asked about those employed in projects funded by NDCs.
The figures are outlined below but should be seen as broad estimations of reality and not accurate enumerations. Partnership staff will not always be aware of just how many people are employed in projects they support. But about 1950 (FTE) staff are employed through projects (based on 34 NDC Partnerships).
Table 6.2: FTEs employed through project funding Number of Partnerships
0 to 9.9 7 10 to 19.9 9 20 to 29.9 4 30 to 39.9 2 40 to 49.9 1 50+ 11
Base: 34 Partnerships Source: CRESR
Base: 34 Partnerships Source: CRESR

New Deal for Communities: The National Evaluation
Annual Report 2003/4 95
6.5. Most NDCs report difficulties in recruiting staff and there are significant skills shortages in some teams. This seems to apply in particular to project management and appraisal skills. In some cases, recruitment difficulties have led to the appointment of staff with relatively little previous regeneration and renewal experience.
6.6. Across the Programme about 150 staff left NDCs (based on 38 Partnerships). In
three cases more than 10 staff left. However, as is outlined in Table 6.3, for most Partnerships staff turnover is relatively modest; only a small number of Partnerships experienced turnover of more than one third of their staff during 2003/4.
Table 6.3: Staff leaving in previous 12 months Number of Partnerships
0 2 1 8 2 6 3 7 4 0 5 4 6 4 7 2 8 0 9 2
10+ 3 Base: 38 Partnerships Source: CRESR
6.7. Alternatively 413 people (based on 38 Partnerships) were recruited in the year from
to November 2003. Table 6.4: Staff recruitment in previous 12 months Number of Partnerships
0 to 4 14 5 to 9 7 10 to 14 6 15 to 19 5 20+ 6
Base: 38 Partnerships Source: CRESR
6.8. In relation to gender, across the Programme about 62% employees are female.
This varies from 30% in Bradford to 90% in Wolverhampton.
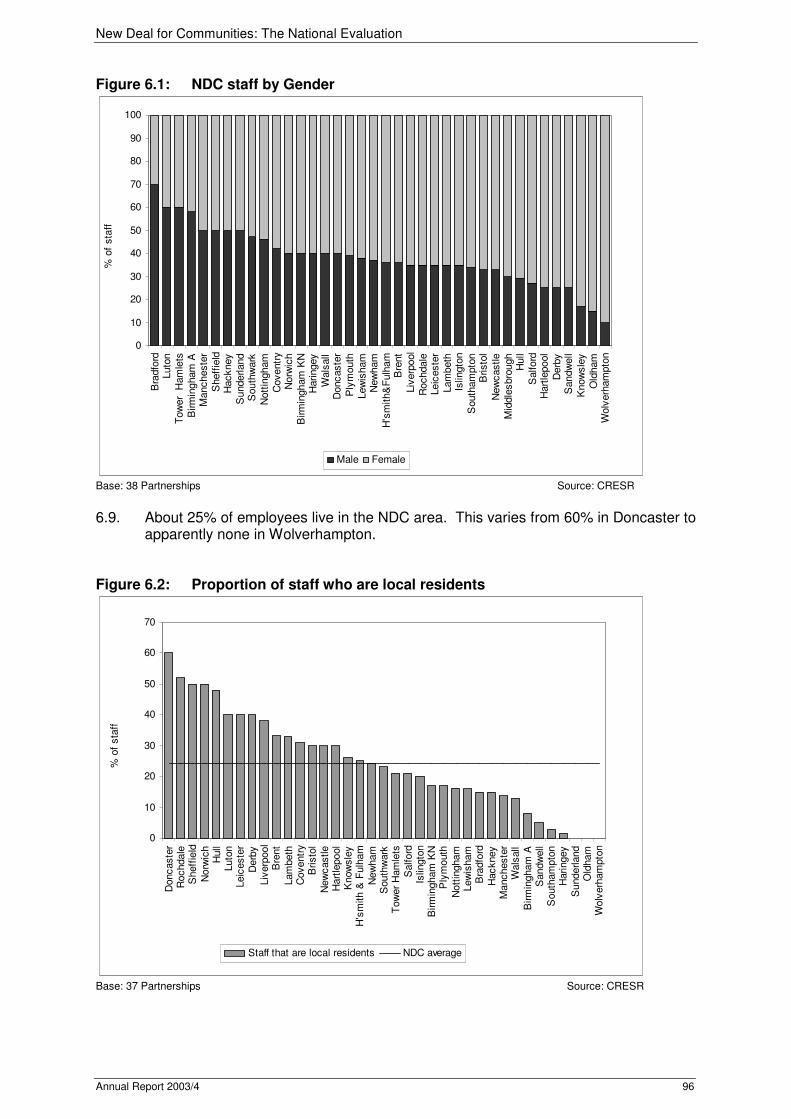
New Deal for Communities: The National Evaluation
Annual Report 2003/4 96
Figure 6.1: NDC staff by Gender
0
10
20
30
40
50
60
70
80
90
100
Bra
dfo
rdLuto
n
Tow
er
Ham
lets
Birm
ingham
AM
ancheste
r
Sheff
ield
Hackney
Sunderland
South
wark
Nott
ingham
Coventr
yN
orw
ich
Birm
ingham
KN
Haringey
Wals
all
Doncaste
r
P
lym
outh
Lew
isham
New
ham
H's
mith&
Fulh
am
Bre
nt
Liv
erp
ool
Rochdale
Leic
este
r
Lam
beth
Islin
gto
n
South
am
pto
nB
risto
l
New
castle
M
iddle
sbro
ugh
Hull
Salford
Hart
lepool
Derb
yS
andw
ell
Know
sle
y
Old
ham
Wolv
erh
am
pto
n
% o
f sta
ff
Male Female
Base: 38 Partnerships Source: CRESR
6.9. About 25% of employees live in the NDC area. This varies from 60% in Doncaster to
apparently none in Wolverhampton. Figure 6.2: Proportion of staff who are local residents
0
10
20
30
40
50
60
70
Doncaste
rR
ochdale
Sheff
ield
Norw
ich
Hull
Luto
nLeic
este
r
Derb
yLiv
erp
ool
Bre
nt
Lam
beth
Coventr
yB
risto
l
New
castle
Hart
lepool
Know
sle
yH
'sm
ith &
Fulh
am
New
ham
South
wark
Tow
er
Ham
lets
Salford
Islin
gto
nB
irm
ingham
KN
Ply
mouth
Nott
ingham
Lew
isham
Bra
dfo
rd
Hackney
Mancheste
rW
als
all
Birm
ingham
AS
andw
ell
South
am
pto
nH
aringey
Sunderland
Old
ham
Wolv
erh
am
pto
n
% o
f sta
ff
Staff that are local residents NDC average
Base: 37 Partnerships Source: CRESR
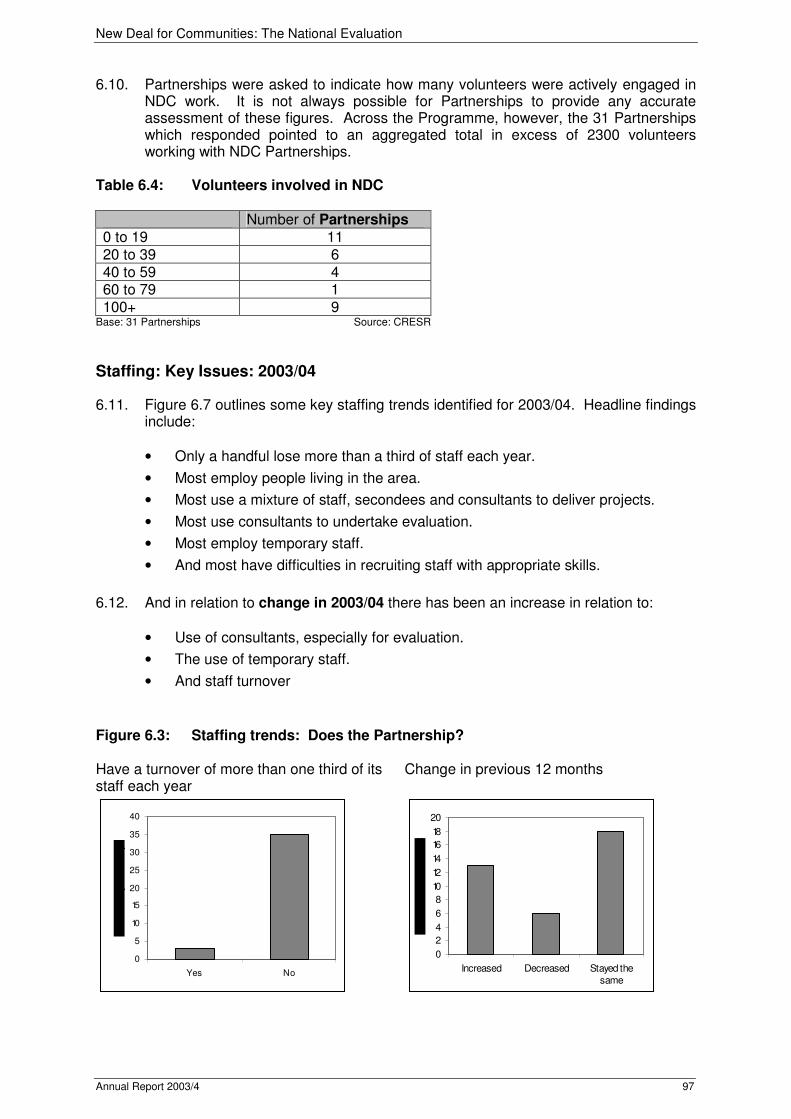
New Deal for Communities: The National Evaluation
Annual Report 2003/4 97
6.10. Partnerships were asked to indicate how many volunteers were actively engaged in NDC work. It is not always possible for Partnerships to provide any accurate assessment of these figures. Across the Programme, however, the 31 Partnerships which responded pointed to an aggregated total in excess of 2300 volunteers working with NDC Partnerships.
Table 6.4: Volunteers involved in NDC
Number of Partnerships 0 to 19 11 20 to 39 6 40 to 59 4 60 to 79 1 100+ 9
Base: 31 Partnerships Source: CRESR
Staffing: Key Issues: 2003/04
6.11. Figure 6.7 outlines some key staffing trends identified for 2003/04. Headline findings include:
• Only a handful lose more than a third of staff each year.
• Most employ people living in the area.
• Most use a mixture of staff, secondees and consultants to deliver projects.
• Most use consultants to undertake evaluation.
• Most employ temporary staff.
• And most have difficulties in recruiting staff with appropriate skills.
6.12. And in relation to change in 2003/04 there has been an increase in relation to:
• Use of consultants, especially for evaluation.
• The use of temporary staff.
• And staff turnover
Figure 6.3: Staffing trends: Does the Partnership? Have a turnover of more than one third of its staff each year
0
5
10
15
20
25
30
35
40
Yes No
Change in previous 12 months
0
2
4
6
8
10
12
14
16
18
20
Increased Decreased Stayed the
same

New Deal for Communities: The National Evaluation
Annual Report 2003/4 98
Experience difficulty in recruiting staff with appropriate skills
0
5
10
15
20
25
30
35
40
Yes No
Change in previous 12 months
0
5
10
15
20
25
30
35
40
Increased Decreased Stayed the
same
Employ labour from within the NDC area
0
5
10
15
20
25
30
35
40
Yes No
Change in previous 12 months
0
5
10
15
20
25
Increased Decreased Stayed the
same
Employ own staff to deliver projects
0
5
10
15
20
25
30
35
40
Yes No
Change in previous 12 months
0
5
10
15
20
25
30
35
40
Increased Decreased Stayed the
same
Employ management and administrative staff
0
5
10
15
20
25
30
35
40
Yes No
Change in previous 12 months
0
5
10
15
20
25
Increased Decreased Stayed the
same
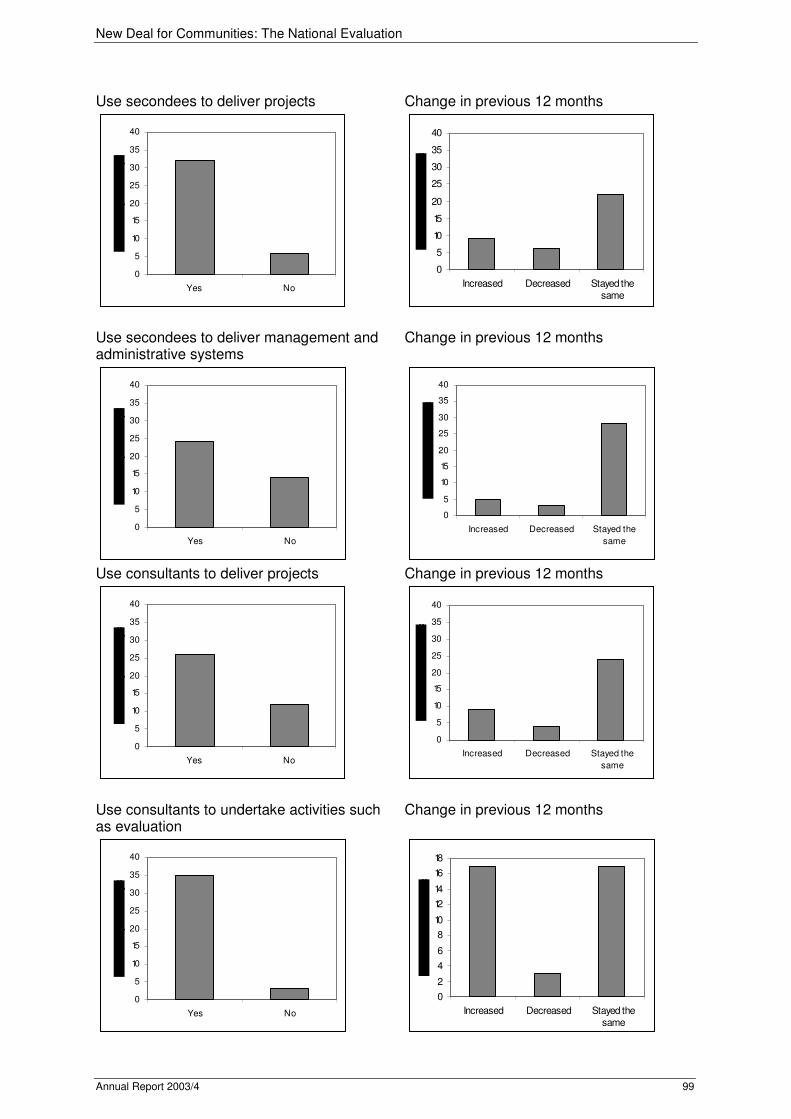
New Deal for Communities: The National Evaluation
Annual Report 2003/4 99
Use secondees to deliver projects
0
5
10
15
20
25
30
35
40
Yes No
Change in previous 12 months
0
5
10
15
20
25
30
35
40
Increased Decreased Stayed the
same
Use secondees to deliver management and administrative systems
0
5
10
15
20
25
30
35
40
Yes No
Change in previous 12 months
0
5
10
15
20
25
30
35
40
Increased Decreased Stayed the
same
Use consultants to deliver projects
0
5
10
15
20
25
30
35
40
Yes No
Change in previous 12 months
0
5
10
15
20
25
30
35
40
Increased Decreased Stayed the
same
Use consultants to undertake activities such as evaluation
0
5
10
15
20
25
30
35
40
Yes No
Change in previous 12 months
0
2
4
6
8
10
12
14
16
18
Increased Decreased Stayed the
same
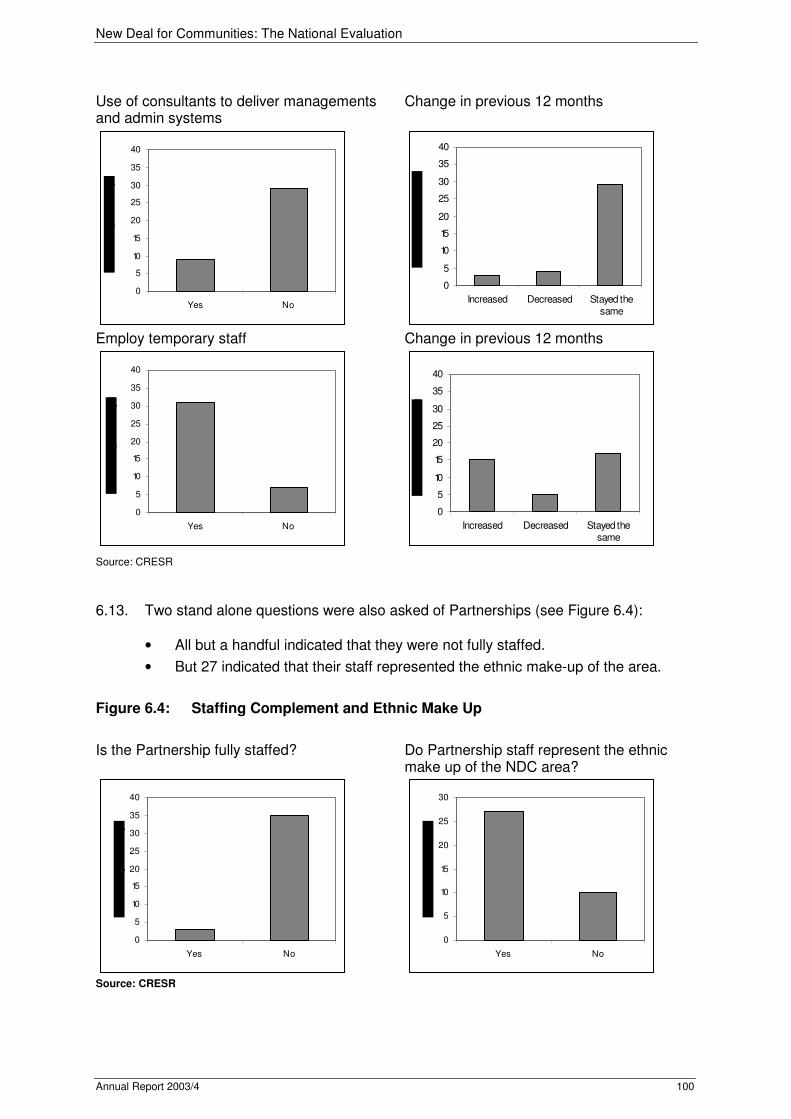
New Deal for Communities: The National Evaluation
Annual Report 2003/4 100
Use of consultants to deliver managements and admin systems
0
5
10
15
20
25
30
35
40
Yes No
Change in previous 12 months
0
5
10
15
20
25
30
35
40
Increased Decreased Stayed the
same
Employ temporary staff
0
5
10
15
20
25
30
35
40
Yes No
Change in previous 12 months
0
5
10
15
20
25
30
35
40
Increased Decreased Stayed the
same
Source: CRESR
6.13. Two stand alone questions were also asked of Partnerships (see Figure 6.4):
• All but a handful indicated that they were not fully staffed.
• But 27 indicated that their staff represented the ethnic make-up of the area.
Figure 6.4: Staffing Complement and Ethnic Make Up
Is the Partnership fully staffed?
0
5
10
15
20
25
30
35
40
Yes No
Do Partnership staff represent the ethnic make up of the NDC area?
0
5
10
15
20
25
30
Yes No
Source: CRESR
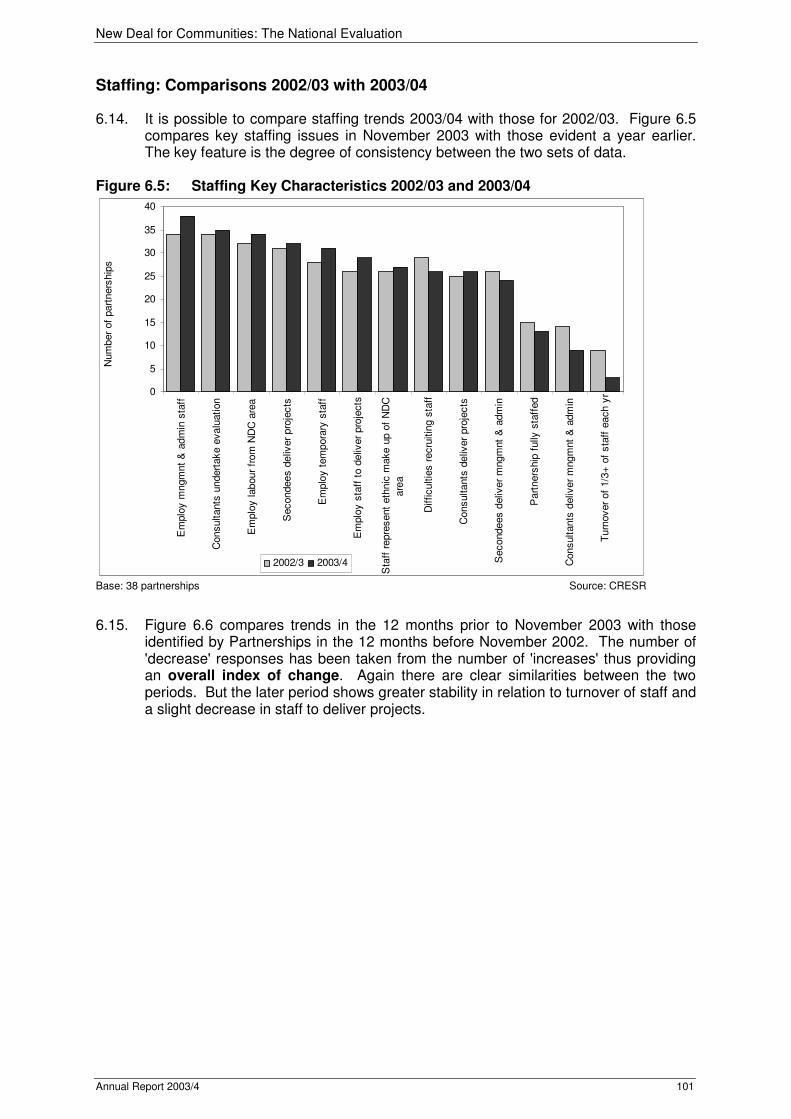
New Deal for Communities: The National Evaluation
Annual Report 2003/4 101
Staffing: Comparisons 2002/03 with 2003/04
6.14. It is possible to compare staffing trends 2003/04 with those for 2002/03. Figure 6.5 compares key staffing issues in November 2003 with those evident a year earlier. The key feature is the degree of consistency between the two sets of data.
Figure 6.5: Staffing Key Characteristics 2002/03 and 2003/04
0
5
10
15
20
25
30
35
40
Em
plo
y m
ngm
nt
& a
dm
in s
taff
Consultants
undert
ake e
valu
ation
Em
plo
y labour
from
ND
C a
rea
Secondees d
eliv
er
pro
jects
Em
plo
y t
em
pora
ry s
taff
Em
plo
y s
taff
to d
eliv
er
pro
jects
Sta
ff r
epre
sent
eth
nic
make u
p o
f N
DC
are
a
Difficultie
s r
ecru
itin
g s
taff
Consultants
deliv
er
pro
jects
Secondees d
eliv
er
mngm
nt
& a
dm
in
Part
ners
hip
fully
sta
ffed
Consultants
deliv
er
mngm
nt
& a
dm
in
Turn
over
of
1/3
+ o
f sta
ff e
ach y
r
Num
ber
of
part
ners
hip
s
2002/3 2003/4
Base: 38 partnerships Source: CRESR
6.15. Figure 6.6 compares trends in the 12 months prior to November 2003 with those identified by Partnerships in the 12 months before November 2002. The number of 'decrease' responses has been taken from the number of 'increases' thus providing an overall index of change. Again there are clear similarities between the two periods. But the later period shows greater stability in relation to turnover of staff and a slight decrease in staff to deliver projects.

New Deal for Communities: The National Evaluation
Annual Report 2003/4 102
Figure 6.6: Staffing Trends 2002/03 and 2003/04
-10
-5
0
5
10
15
20
25
30
35
40
Em
plo
y m
ngm
nt
& a
dm
in s
taff
Em
plo
y labour
from
ND
C a
rea
Use c
onsultants
to u
ndert
ake
evalu
ation
Em
plo
y s
taff
to d
eliv
er
pro
jects
Difficultie
s in r
ecru
itin
g s
taff
Em
plo
y t
em
pora
ry s
taff
Turn
over
of
more
than a
1/3
of
sta
ff
each y
r
Use c
onsultants
to d
eliv
er
pro
jects
Use s
econdees t
o d
eliv
er
pro
jects
Use s
econdees t
o d
eliv
er
mngm
nt
&
adm
in
Use c
onsultants
to d
eliv
er
mngm
nt
&
adm
in
Num
ber
of
part
ners
hip
s
2002/3 2003/4
Base: 38 partnerships Source: CRESR
Qualitative Evidence: Recruitment and Retention
6.16. Virtually all of the 39 2003/04 Partnership reports make some reference to problems in recruiting and retaining staff. Some reports make reference to a national shortage of professionals which can make recruitment difficult or time consuming:
• In one NDC, staffing issues are identified by many as a continuing constraint on the development of the programme which has been delayed in the past by a shortage of suitably qualified staff.
• In another, staff with specific theme based knowledge are the most difficult to recruit. The Partnership has tended to recruit people with more general regeneration skills and train them.
6.17. Some Partnerships have found recruitment to be more time consuming than had
been anticipated and as a result, progress and delivery had been delayed. 6.18. High staff turnover is seen as a problem by Partnerships:
• In some NDCs projects have suffered as a result of staff turnover and allied difficulties in recruiting for short term funded projects.
• Partnerships suffering from high staff turnover identify problems of overload and stress on remaining staff, undermining their ability to operate effectively, damaging the NDC reputation, and thereby further exacerbating problems of retention and recruitment.
• Other Partnerships benefit from low staff turnover despite sometimes experiencing difficulties in other arenas.

New Deal for Communities: The National Evaluation
Annual Report 2003/4 103
6.19. Staffing problems may be accentuated where Partnerships are keen to recruit local residents especially because of a lack of relevant experience among local residents seeking employment.
6.20. At least nine reports comment on the role and impact of the Chief Executive. One
positive observation suggested that:
‘There is strong but flexible leadership. The Chief Executive is happy to make time for Board members, residents, partners and others and has spent a lot of time supporting Board members. Board members greatly value his open and down to earth style'.
6.21. There are instances where a change of Chief Executive has apparently created a
degree of uncertainty and insecurity:
• ‘The resignation [of the Chief Executive] came as a shock. What was crucial for the Partnership was the way in which everyone ‘rallied round’ recognising the importance of NDC moving forward. This demonstrates the underlying robustness of the Partnership’.
• In another NDC, the departure of the Chief Executive and the transition arrangements were identified as a main reason for 6 out of 13 staff leaving over a 12 month period.
6.22. Paragraphs 9.10 to 9.14 explore the relationship between expenditure and the loss of key personnel.
6.23. In a few instances, however respondents suggested that changes in Chief Executive
can also bring a boost of energy and activity or a much needed sense of stability.
Staffing and the Impact on Delivery
6.24. A number of Partnership reports identify good staff teams having a positive impact on delivery and operation of the Partnership. Examples include:
• In Derby the Board is supported by an enthusiastic and committed staff team. A number of factors were identified having assisted delivery, one of which is limited staff turnover and good human resource management.
• In Haringey respondents from agencies think that a stable team, Board and agency representatives are providing much need continuity and stability to the programme.
• In Bradford the professionalism and expertise of Partnership staff are identified as assisting progress.
MANAGEMENT SYSTEMS
6.25. Figure 6.7 identifies perceptions of management systems in late 2003 and assesses the degree to which changes occurred in the previous 12 months. Key findings include:
• Most programme teams rate project development, appraisal and Management Information Systems, as being 'OK' and consider the situation to have improved in the previous 12 months. However, fewer respondents in all constituencies consider that Partnerships are performing 'well' in these areas.
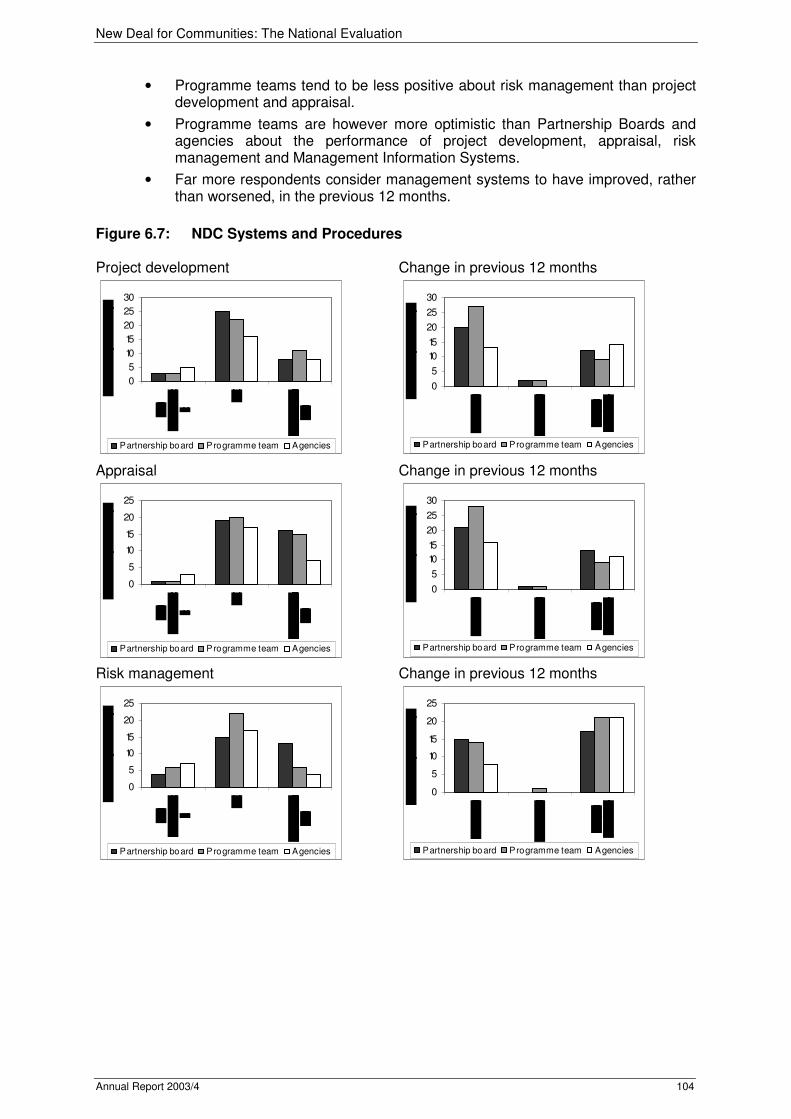
New Deal for Communities: The National Evaluation
Annual Report 2003/4 104
• Programme teams tend to be less positive about risk management than project development and appraisal.
• Programme teams are however more optimistic than Partnership Boards and agencies about the performance of project development, appraisal, risk management and Management Information Systems.
• Far more respondents consider management systems to have improved, rather than worsened, in the previous 12 months.
Figure 6.7: NDC Systems and Procedures Project development
0
5
10
15
20
25
30
Partnership board Programme team Agencies
Change in previous 12 months
0
5
10
15
20
25
30
Partnership board Programme team Agencies
Appraisal
0
5
10
15
20
25
Partnership board Programme team Agencies
Change in previous 12 months
0
5
10
15
20
25
30
Partnership board Programme team Agencies
Risk management
0
5
10
15
20
25
Partnership board Programme team Agencies
Change in previous 12 months
0
5
10
15
20
25
Partnership board Programme team Agencies

New Deal for Communities: The National Evaluation
Annual Report 2003/4 105
Management Information systems
0
5
10
15
20
25
Partnership board Programme team Agencies
Change in previous 12 months
0
5
10
15
20
25
Partnership board Programme team Agencies
Source: CRESR
6.26. These quantitative findings are backed up by more qualitative evidence:
‘Shoreditch continues to be a sound, well managed Partnership with a clear vision, strategy and structures. Strategy and vision were clearly set out in the original delivery plan and the subsequent annual plans have endorsed and extended this vision. There are clear links between Programme strategies and plans and project activity.’
6.27. And in Southwark, the evaluation identified that ‘internal systems have been
consolidated during the last year and are now more robust.’
Tower Hamlets Housing Programme – a resident panel, known as the Resident Steering Group, has been set up to give real involvement to local people in the ongoing development of the housing master plan for Ocean. A similar format is being developed for the neighbourhood management element of the Programme, with the setting up of a Neighbourhood Management Task Panel.
6.28. However, other Partnership reports are less enthusiastic. In one, respondents claim
that there are ‘no clear systems in place across regeneration themes as Programme Managers have had no line management framework in which PCM could be consistently applied’. This is because the ‘previous contracted regeneration company did not develop sufficiently robust or consistent systems regarding the monitoring, evaluation and development of projects across themes.’
6.29. In another, project approval procedures are criticised as lacking consistency with one
respondent commenting that approval processes are ‘Byzantine – convoluted and unpredictable’.
6.30. Interestingly, bearing in mind the role which System K is to play in project monitoring,
one report commented:
‘There was considerable criticism about System K largely because it does not reflect qualitative measurements for those factors that people felt were important in the development of projects, and also because it is easy to get a ‘green light’ even if the project is failing, and visa-versa.’
Partnerships Systems: Change 2002/03 to 2003/04
6.31. Figures 6.8 and 6.9 review the extent to which respondents are confident that NDC Partnerships have implemented robust systems in relation to appraisal, project development, risk management and management information systems. For each

New Deal for Communities: The National Evaluation
Annual Report 2003/4 106
respondents were asked to assign one of the following assessments: 'still working at it'; 'performing OK' or 'performing well'. Each assessment is assigned a score - minus one for 'still working at it', zero for 'performing OK', and plus one for 'performing well'. Scores for 2003/04 are compared with those for 2002/03 in order to assess the extent to which change has occurred across the Programme.
Figure 6.8: NDC Systems and Procedures: Scores (2002/03 and 2003/04)
0
2
4
6
8
10
12
14
16
Appra
isal
Pro
ject
develo
pm
ent
Ris
k
Managem
ent
Managem
ent
Info
rmation
Syste
ms
Them
e s
core
2002/3 2003/4
Base: 38 partnerships Source: CRESR Figure 6.9: Systems and Procedures: change in performance in 'last 12 months'
0
5
10
15
20
25
30
Appra
isal
Pro
ject
develo
pm
ent
Managem
ent
Info
rmation
Syste
ms
Ris
k
Managem
ent
Them
e s
core
2002/3 2003/4
Base: 38 partnerships Source: CRESR
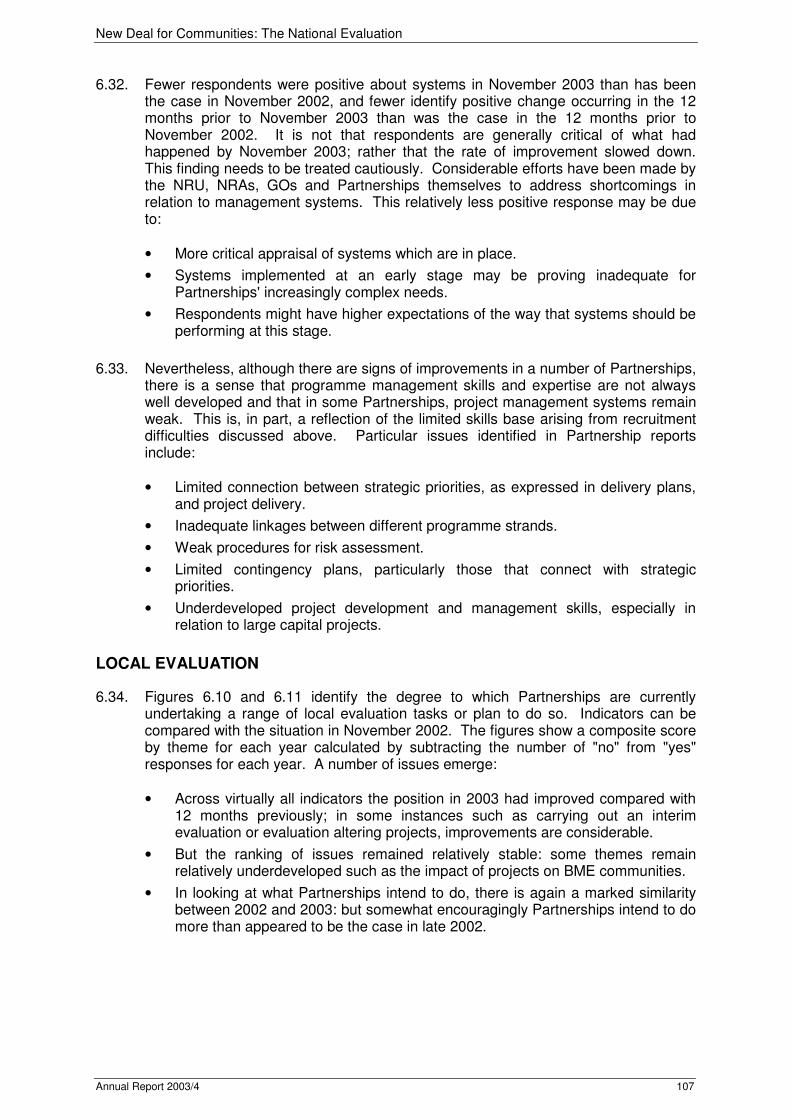
New Deal for Communities: The National Evaluation
Annual Report 2003/4 107
6.32. Fewer respondents were positive about systems in November 2003 than has been the case in November 2002, and fewer identify positive change occurring in the 12 months prior to November 2003 than was the case in the 12 months prior to November 2002. It is not that respondents are generally critical of what had happened by November 2003; rather that the rate of improvement slowed down. This finding needs to be treated cautiously. Considerable efforts have been made by the NRU, NRAs, GOs and Partnerships themselves to address shortcomings in relation to management systems. This relatively less positive response may be due to:
• More critical appraisal of systems which are in place.
• Systems implemented at an early stage may be proving inadequate for Partnerships' increasingly complex needs.
• Respondents might have higher expectations of the way that systems should be performing at this stage.
6.33. Nevertheless, although there are signs of improvements in a number of Partnerships,
there is a sense that programme management skills and expertise are not always well developed and that in some Partnerships, project management systems remain weak. This is, in part, a reflection of the limited skills base arising from recruitment difficulties discussed above. Particular issues identified in Partnership reports include:
• Limited connection between strategic priorities, as expressed in delivery plans, and project delivery.
• Inadequate linkages between different programme strands.
• Weak procedures for risk assessment.
• Limited contingency plans, particularly those that connect with strategic priorities.
• Underdeveloped project development and management skills, especially in relation to large capital projects.
LOCAL EVALUATION
6.34. Figures 6.10 and 6.11 identify the degree to which Partnerships are currently undertaking a range of local evaluation tasks or plan to do so. Indicators can be compared with the situation in November 2002. The figures show a composite score by theme for each year calculated by subtracting the number of "no" from "yes" responses for each year. A number of issues emerge:
• Across virtually all indicators the position in 2003 had improved compared with 12 months previously; in some instances such as carrying out an interim evaluation or evaluation altering projects, improvements are considerable.
• But the ranking of issues remained relatively stable: some themes remain relatively underdeveloped such as the impact of projects on BME communities.
• In looking at what Partnerships intend to do, there is again a marked similarity between 2002 and 2003: but somewhat encouragingly Partnerships intend to do more than appeared to be the case in late 2002.

New Deal for Communities: The National Evaluation
Annual Report 2003/4 108
Figure 6.10: Local Evaluation: 'Current Position' - 2002/03 and 2003/04
-35
-30
-25
-20
-15
-10
-5
0
5
10
15
20
25
30
35
Managem
ent
responsib
ility
Pro
ject
specific
evalu
ation
Inte
rim
evalu
ations
Pro
cedure
s f
or
obta
inin
g info
Resulted in p
roje
ct
change
Built
evalu
ation into
str
uctu
res
Involv
ed local people
Str
uctu
res f
or
involv
em
ent
Consultants
for
som
e e
valu
ation
Researc
h w
ith b
eneficia
ries
Involv
ed B
ME
gro
ups
Team
or
sta
ff e
mplo
yed
Evalu
ation p
lan
Resulted in p
rogra
mm
e c
hange
Rolli
ng p
rogra
mm
e
Cro
ss-c
utt
ing e
valu
ation
Pro
gra
mm
e f
or
dis
sem
ination
Impact
on B
ME
gro
ups
Consultants
for
all
evalu
ation
Them
e S
core
2002/3 2003/4
Base: 38 partnerships Source: CRESR Figure 6.11: Local Evaluation: Future Plans 2002/03 and 2003/04
-35
-30
-25
-20
-15
-10
-5
0
5
10
15
20
25
30
35
Resulted in p
roje
ct
change
Pro
ject
specific
evalu
ation
Evalu
ation p
lan
Managem
ent
responsib
ility
Resulted in p
rogra
mm
e c
hange
Impact
on B
ME
gro
ups
Involv
ed B
ME
gro
ups
Str
uctu
res f
or
involv
em
ent
Rolli
ng p
rogra
mm
e
Involv
ed local people
Pro
gra
mm
e f
or
dis
sem
ination
Researc
h w
ith b
eneficia
ries
Cro
ss-c
utt
ing e
valu
ation
Pro
cedure
s f
or
obta
inin
g info
Inte
rim
evalu
ations
Built
evalu
ation into
str
uctu
res
Consultants
for
som
e e
valu
ation
Team
or
sta
ff e
mplo
yed
Consultants
for
all
evalu
ation
Them
e s
core
2002/3 2003/4
Base: 38 partnerships Source: CRESR 6.35. Qualitative information suggests that a small group of NDCs appear to be
undertaking little local evaluation activity, although a number have identified this to be a priority for 2004/05. Reasons given for lack of activity include:

New Deal for Communities: The National Evaluation
Annual Report 2003/4 109
• Resource constraints (especially staff).
• Funding for evaluation had not been considered in the project costs.
• The overall approach to evaluation is still being considered.
6.36. However, other NDCs have a local evaluation strategy in place often with dedicated
staff.
Bradford Trident produced an evaluation strategy in 2002 which sets out a three year programme of activities to undertake programme, project and cross-cutting theme evaluations. The Board committed £180,000 to the evaluation programme and stipulated that a key outcome should be the development of local evaluation capacity. The aim is for a significant proportion of evaluation activities to be undertaken by the local community in the third year of the programme. An evaluation and research officer has also been recruited. This officer is a local resident with previous experience in regeneration. An evaluation steering group includes community Board members and officers. During the first year’s work programme, local evaluators were recruited and trained to undertake some evaluation tasks (including interviewing, support with focus groups and data inputting). The first year’s work programme also included a series of focus groups. These were with specific groups from the community and included, lone parents, Bangladeshi women and people with physical disabilities.
6.37. Other good practice examples are outlined in Table 6.5. Table 6.5: Local Evaluation Activities NDC
EXAMPLES
Coventry The Education Task Group has a rolling programme of monitoring and evaluation using qualitative approaches and being undertaken by the Department of Sociology, University of Warwick.
Doncaster The Partnership has worked throughout to build evaluation plans into projects and management processes. The Board has now agreed funding for an evaluation team. NDC projects will be able to commission the evaluation team to undertake work for them. All projects are being planned in such a way as to include evaluation funding. The Partnership team will commission theme and scheme evaluation, and where appropriate evaluation of the role/input of other partner agencies, such as DMBC or the PCT. Initially the evaluation manager will be on a two year contract. The intention is for the evaluation team to establish itself as a community enterprise working to generate income to become sustainable. It will be able to undertake evaluation work for other organisations as well as the NDC. Local people can be involved in evaluation work at all levels, either through projects or through the evaluation team. Survey work will be part of the evaluation process and a community survey team will be established.
Hammersmith & Fulham
Evaluation caused re-assessment of way street cleaning on housing estates was being undertaken. Carnival & Events – residents involved in reviewing past year’s outcome and re-appraising project for new ideas for current year.
Kings Norton Re-commissioning of existing projects as a result of evaluation: Groundwork Environmental Task Force, Community Psychologist.
Lambeth Splitting the Jobs Employment and Training Theme Group into an

New Deal for Communities: The National Evaluation
Annual Report 2003/4 110
NDC
EXAMPLES
Education and Youth Theme Group and Business, Employment and Training Theme Group as result of evaluation.
Sandwell A local evaluation project was established in 2002 for three years. An evaluation officer is in place and the project aims to develop a local evaluation strategy which links with other national and regional evaluations. During the last twelve months several evaluations of projects have been commissioned. A local evaluation group brings together evaluators (including the national evaluation researchers). This has met on an ad hoc basis during the last twelve months. The NDC evaluation officer is part of a regional evaluation network which brings together all of the West Midlands NDCs to provide support and information about evaluation.
EQUALITIES AND DIVERSITY
6.38. Figure 6.12 outlines Programme wide evidence in relation to a range of equalities activities in 2003/04. Responses are given for Boards, programme teams and agencies. A number of themes emerge:
• Project monitoring and training tend to be less in evidence than, say, targeting of projects at BME groups and insisting that equalities are considered as part of the project approval process.
• Programme teams are consistently more optimistic about all equalities issues than are agencies; this may be due to the teams simply knowing more of what is going on within the NDC; but it could also be due in part to agency representatives simply being more aware of national agendas.
Figure 6.12: Equalities activities
0
5
10
15
20
25
30
Does t
he N
DC
monitor
the R
ace
equalit
y im
pacts
of
ND
C p
roje
cts
Does t
he N
DC
monitor
oth
er
equalit
ies im
pacts
of
ND
C p
roje
cts
Has t
he N
DC
im
ple
mente
d a
n
equalit
ies p
olic
y/s
trate
rgy
Are
there
equalit
ies issues
consid
ere
d a
s a
conditio
n o
f pro
ject
appro
val
Is t
here
evid
ence o
f B
ME
led/t
arg
ate
d N
DC
pro
jects
Does t
he N
DC
pro
vid
e r
ace
equalit
y/d
ivers
ity t
rain
ing f
or
Board
mem
bers
Does t
he N
DC
pro
vid
e r
ace
equalit
y/d
ivers
ity t
rain
ing f
or
sta
ff
Num
ber
of
part
ners
hip
s
Partnership board Programme Team Agencies
Source: CRESR

New Deal for Communities: The National Evaluation
Annual Report 2003/4 111
6.39. Reports mention instances where NDC or partner-agency funding has been used to enhance engagement with or support for BME communities:
• A community resource centre has proven a valuable asset to Hartlepool.
• Sunderland has helped unite a diverse community through work with the Bangladeshi community centre.
• In Hackney, events such as a Somali day are widely considered to have been successful.
• In Middlesbrough, the local authority has allocated Community Cohesion funding to facilitate engagement with BME communities.
6.40. In relation to staffing and training:
• Training in diversity and equality issues has been provided in many NDCs.
• A number of Partnerships have appointed equalities staff, such as advisors and co-ordinators (Brighton, Lewisham, Nottingham and Southwark for instance), and a BME outreach worker (Liverpool).
6.41. In relation to overall strategy, all Partnerships make some reference to racial
equality issues. In most, the construction and implementation of a racial equalities strategy is seen as essential. A number of Partnerships are currently developing race equalities strategies (or have plans to do so), although some are doing so without any great confidence. In all:
• Race equalities policies or action plans had been implemented in at least 25 NDCs. Others state they are in the process of developing one.
• Race equalities strategies go under a range of titles including: BME strategy, and a 'hard to reach' groups strategy.
6.42. Some areas without a racial equality strategy attributed this to the size of the BME
population. In a few NDCs with overwhelmingly white populations, such policies can be seen as unnecessary: 'The BME population in the area is a small proportion of the total and is not co-located in particular parts of the area - so there is no sense of a visible BME issue' . Whilst understandable at one level this attitude can create other problems. For instance it may not help address issues of intolerance towards asylum seekers which is becoming a live issue in many NDC areas. It will not either help engender more imaginative responses to other equalities issues such as, for instance, disability, which is a largely neglected across the Programme.
6.43. Conversely, in a few Partnerships where the BME community is large and well
established, race equality is seen as already mainstreamed across all activities. Specific strategies and policies are thus not deemed necessary since the consideration of racial diversity already apparently underpins the work of the Partnership.

New Deal for Communities: The National Evaluation
Annual Report 2003/4 112
CHAPTER 7: NDCS AND LOCAL COMMUNITIES
INTRODUCTION
7.1. NDC is committed to work with communities. The 2002/03 Annual Report detailed the degree to which Partnerships had tried to engage with their local communities, with often impressive results. It also concluded that engaging local communities is a long term process, a finding very much confirmed in the 2004 National Audit report on the NDC Programme. This chapter revisits the 'community dimension' under 4 main headings:
• Community engagement.
• Tensions in, and barriers to, community involvement.
• Involving BME communities
• Community attitudes and aspirations.
COMMUNITY ENGAGEMENT IN NDC PARTNERSHIPS: 2003/04
7.2. 'Community engagement' refers to a wide range of activities including consultation with, involvement of, and participation by, the local community. Such involvement is seen as likely to improve the success of regeneration programmes, such as NDC, by encouraging better decision making, making programme delivery more effective, and making sustainable the benefits of such programmes. For these outcomes to happen, as many people as possible need to be involved (DETR, 1997, Involving Communities in Urban and Regional Regeneration). However as 'Searching for Solid Foundations: Community Involvement in Urban Policy' (ODPM, 2002) makes clear, a range of factors can constrain community engagement including openness of public organisations, and the relative strength of existing community networks.
7.3. The 2002/03 Annual Programme Wide Report showed how Partnerships and
agencies in most NDC areas considered that there had been increases in community involvement in the areas of strategy and planning, and the appraisal, monitoring and evaluation of projects over the previous year. A year on most Partnerships and stakeholders are reporting further increases in community activity in these kinds of activities.
7.4. Work undertaken by each of the 39 teams in 2003/04 explored the degree to which
community involvement increased in the previous 12 months in relation to the seven Partnership tasks outlined in Figure 7.1. Attempts were made to establish the views of three constituencies: the Board, the programme team, and agencies. Findings include:
• The three constituencies tend to have similar views on many aspects of community engagement, but the programme team tends to be more optimistic in its views of the scale of community engagement.
• Across the piece, observers share the view that the community has become more involved in a range of Partnership tasks; there is little evidence to indicate any decrease.
• And there is general agreement that the community has become more involved in certain tasks such as planning and decision making, membership of NDC forums, and project design and development rather than, say, project monitoring and evaluation.
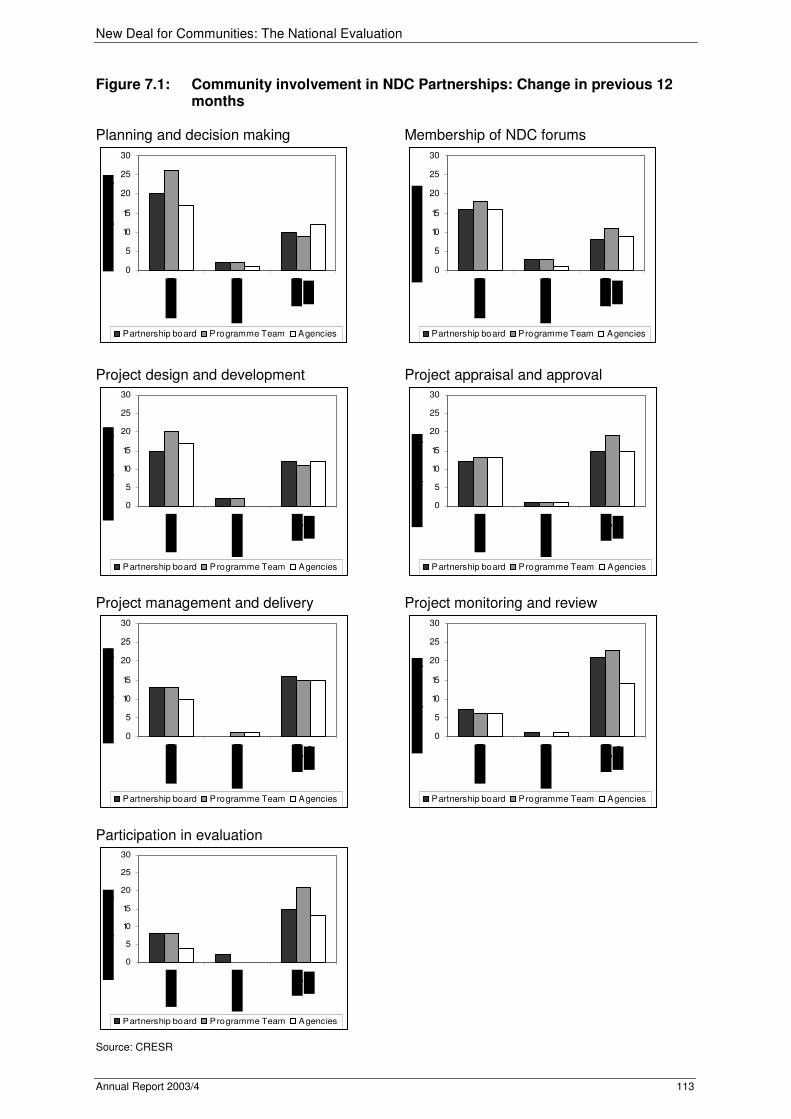
New Deal for Communities: The National Evaluation
Annual Report 2003/4 113
Figure 7.1: Community involvement in NDC Partnerships: Change in previous 12 months Planning and decision making
0
5
10
15
20
25
30
Partnership board Programme Team Agencies
Membership of NDC forums
0
5
10
15
20
25
30
Partnership board Programme Team Agencies
Project design and development
0
5
10
15
20
25
30
Partnership board Programme Team Agencies
Project appraisal and approval
0
5
10
15
20
25
30
Partnership board Programme Team Agencies
Project management and delivery
0
5
10
15
20
25
30
Partnership board Programme Team Agencies
Project monitoring and review
0
5
10
15
20
25
30
Partnership board Programme Team Agencies
Participation in evaluation
0
5
10
15
20
25
30
Partnership board Programme Team Agencies
Source: CRESR
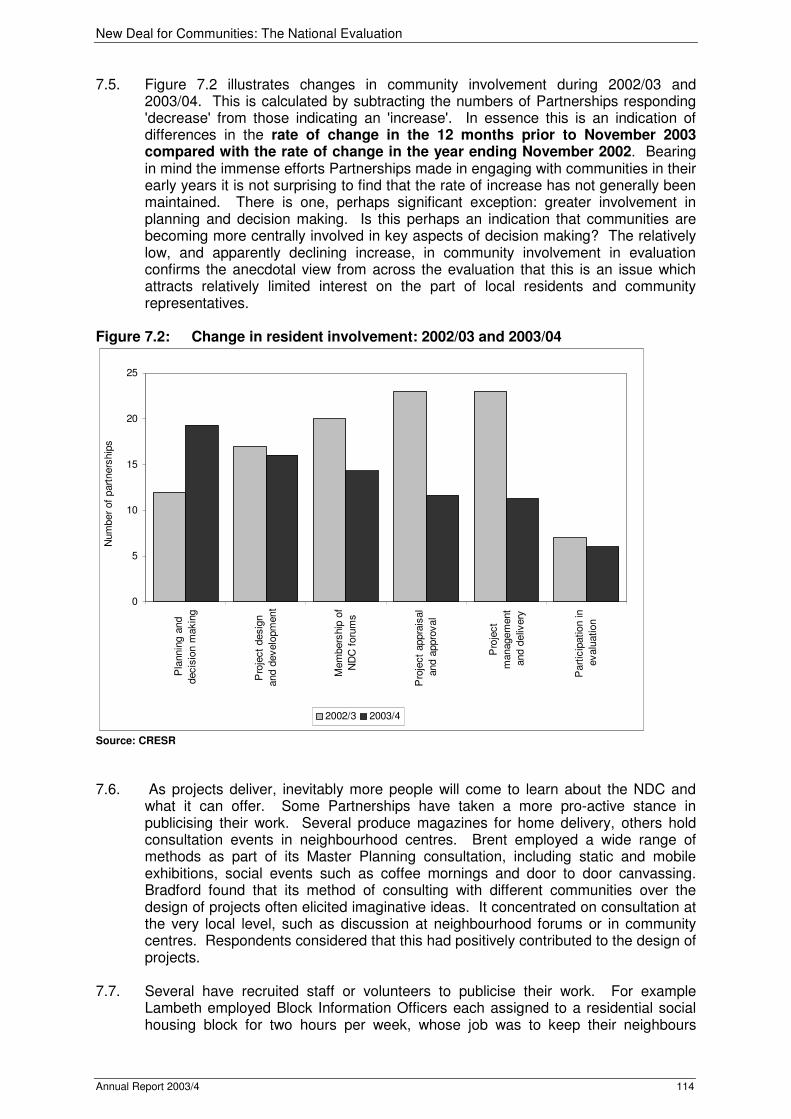
New Deal for Communities: The National Evaluation
Annual Report 2003/4 114
7.5. Figure 7.2 illustrates changes in community involvement during 2002/03 and 2003/04. This is calculated by subtracting the numbers of Partnerships responding 'decrease' from those indicating an 'increase'. In essence this is an indication of differences in the rate of change in the 12 months prior to November 2003 compared with the rate of change in the year ending November 2002. Bearing in mind the immense efforts Partnerships made in engaging with communities in their early years it is not surprising to find that the rate of increase has not generally been maintained. There is one, perhaps significant exception: greater involvement in planning and decision making. Is this perhaps an indication that communities are becoming more centrally involved in key aspects of decision making? The relatively low, and apparently declining increase, in community involvement in evaluation confirms the anecdotal view from across the evaluation that this is an issue which attracts relatively limited interest on the part of local residents and community representatives.
Figure 7.2: Change in resident involvement: 2002/03 and 2003/04
0
5
10
15
20
25
Pla
nnin
g a
nd
decis
ion m
akin
g
Pro
ject
desig
n
and d
evelo
pm
ent
Mem
bers
hip
of
ND
C f
oru
ms
Pro
ject
appra
isal
and a
ppro
val
Pro
ject
managem
ent
and d
eliv
ery
Part
icip
ation in
evalu
ation
Num
ber
of
part
ners
hip
s
2002/3 2003/4
Source: CRESR
7.6. As projects deliver, inevitably more people will come to learn about the NDC and
what it can offer. Some Partnerships have taken a more pro-active stance in publicising their work. Several produce magazines for home delivery, others hold consultation events in neighbourhood centres. Brent employed a wide range of methods as part of its Master Planning consultation, including static and mobile exhibitions, social events such as coffee mornings and door to door canvassing. Bradford found that its method of consulting with different communities over the design of projects often elicited imaginative ideas. It concentrated on consultation at the very local level, such as discussion at neighbourhood forums or in community centres. Respondents considered that this had positively contributed to the design of projects.
7.7. Several have recruited staff or volunteers to publicise their work. For example
Lambeth employed Block Information Officers each assigned to a residential social housing block for two hours per week, whose job was to keep their neighbours

New Deal for Communities: The National Evaluation
Annual Report 2003/4 115
informed about the Master Planning process, to listen to people's concerns and to feed these back. Unsurprisingly, local awareness of the NDC was perceived to be high. Partnerships able to foster a positive relationship with the local media found this helpful in raising community awareness and involvement.
7.8. Some NDCs have concentrated on making their premises as accessible and
welcoming as possible for the public. For example Manchester has promoted its building as an 'open door' facility for local residents designed to provide space and administrative and technological resources for community use. Local people regard it as an important central focus.
7.9. 'Quick win' projects creating visible benefits to the community are helpful in
increasing knowledge of, and interest in, NDCs. One example of innovative practice is provided by Manchester's Eastserve project, which is the delivery vehicle for rolling out the East Manchester ICT Strategy designed to make the area one of the most wired-up communities in the UK. The website has had a major overhaul. More residents and groups are adding content to the site and the project continues to deliver online services alongside the City Council, enabling residents of East Manchester to interact with Council departments, whilst at the same time helping to increase recognition of the Partnership.
TENSIONS IN, AND BARRIERS TO, COMMUNITY INVOLVEMENT
7.10. Many tensions flagged up in the 2002/03 Programme Wide report emerged again in 2003/04. Some relate to what might be described as a more general apathy in relation to all aspects of community Involvement in renewal:
• Some Partnerships indicated that residents are becoming disillusioned with the process as they are not being provided with any tangible evidence of results.
• Other respondents consider there is a general sense of apathy within communities, whether as a whole, or within certain sub groups:" There is not a big pool of people out there who want to be involved. 75% of residents have not heard of the NDC but it's not for want of trying."
7.11. In other instances tensions surround the role which a relatively small group of
people can often play in individual NDCs:
• In many Partnerships it is a small group of local people who tend to do all the work; a respondent from one NDC summed up this common concern: "There aren't a lot of people involved in the process from outside the steering group so you're always dealing with the same small numbers of people who are stretched in many ways".
• Some community champions are withdrawing their support, either completely or partly, as they suffer 'burnout'; once the initial flush of excitement that accompanies is over, support can wane; as the 2002/03 Annual Report highlighted it will be important to 'reward' these local champions of NDC, and to have effective succession policies in place.
• Small groups of people may become local experts, but this may actually inhibit potential 'joiners'; there is a concern that 'new blood' may be running out. Some Partnerships are aware of these problems, and are looking to address questions such as off-putting terminology, a generally more open approach to new recruits, Board training events and, partnership building sessions.
• Community champions can be seen to represent particular groups defined by age, gender, ethnicity, geography or tenure: although the NDC may have a resident majority, this can mask the fact that this majority may not be

New Deal for Communities: The National Evaluation
Annual Report 2003/4 116
representative (Joseph Rowntree Foundation, 2000, Strengthening community leaders in area regeneration).
7.12. In other instances more fundamental questions of power were raised:
• concern was expressed that local agencies were taking control as they had more experience of delivery as well as power to access funds; there was a perception in a few NDCs that agencies were taking decisions outside of formal structures; in one NDC a respondent felt that community led projects were subject to longer and tougher scrutiny than agency-led projects.
7.13. There remains the perennial problem of apparently 'hard to reach groups'. The
term itself, although much used, may not be especially helpful as it implies that such groups are difficult to access, and begs the question of 'hard' for whom. However there is little doubt that in the past mainstream organisations and agencies may not have put enough energy into seeking the views of a wide range of groups. Amongst groups identified by respondents as being hard to reach are:
young people asylum seekers disabled people old people all ethnic groups refugees women lone parents transient populations men people with learning
difficulties geographical communities
parents of young children people with mental health problems
business community
people from different housing tenures
leaseholders voluntary sector
people whose first language is not English
people with long term health problems
carers
7.14. The two 'hard to reach' groups which Partnerships appeared to concentrate on most
are BME populations (see 7.20 to 7.30) and young people (most NDC areas have higher than average rates of young people). Different methods have been employed to try to engage these groups. For example Liverpool NDC has appointed two new outreach workers, one for the BME community and one for young people. In Hartlepool young people worked with an interior design company to design an internet café. Several NDCs publish a youth magazine, run youth conferences and youth forums, and have specific seats on their boards for young people, although these are not always filled. For a fuller discussion on issues relating to NDCs and young people see 'Research Report 20 Young People in NDC Areas: Findings from Six Case Studies' (http://ndcevaluation.adc.shu.ac.uk/ndcevaluation/Home.asp).
7.15. There are numerous examples of Partnerships keen to improve their links with
specific groups. Brent has set up a Widening Participation Group with nine task groups whose remit Is to engage 'hard to reach groups' in the local community. Each task group worked on an Action Plan which will be pulled together into a Community Inclusiveness Plan. Bradford has made an active effort to extend ways in which different communities are listened to. The Partnership introduced a range of new methods, including a Faith Forum and a Youth Forum. Walsall NDC has established a Traveller's Forum which has been active in project development.
7.16. Other examples of good practice reflect experience in engaging with particular
communities. A few Partnerships have made efforts to engage asylum seekers by setting up ESOL courses and information centres for these people. However, several respondents highlight the dangers that can arise from concentration on certain populations. This can alienate other groups, who feel they are missing out.
New Deal for Communities: The National Evaluation
Annual Report 2003/4 117
7.17. Few Partnerships specifically refer to any attempts to engage members of the local business community, or voluntary sector organisations.
7.18. It can be difficult to foster a sense of community, and thereby community
involvement, when the area has few existing community networks. This tends to mean the area accommodates fewer community champions and to be less in a state of 'community readiness'. Several NDCs point to a lack of any sense of shared community. Some areas are an amalgamation of several smaller, but distinct, neighbourhoods. Others are bisected by physical barriers such as major roads, and several lack community facilities, banks or supermarkets (see 2002/03 Annual Report 2.9).
The representation structure in Coventry has been identified as an example of good practice in terms of fostering a sense of community. Participation is based upon representation from the four residents' associations contained within the area. Three people from each association are elected. Respondents assess this as a successful and robust mechanism for participation within a context of very low turnout levels (as low as 3% for one polling station at local council elections).
7.19. NDCs sometimes need to make difficult decisions to sustain community
engagement. Middlesbrough NDC took the decision to remain in its cramped office space in the centre of the area, rather than take the opportunity to move to a more spacious, but peripheral, site. Gradually the six communities that make up this NDC are beginning to come together, and board members from the six different Residents Associations are starting to represent the views of all neighbourhoods other than their own.
INVOLVING BME COMMUNITIES
7.20. NDC areas vary considerably in terms of their ethnic composition. The MORI/NOP Household Survey 2002 highlighted that the majority of respondents across all NDC areas are white (76%). The remaining populations consist of Asian and Black communities (10% each), and Chinese communities and Mixed/other communities (each 2%). Within NDC areas inevitably there are much greater variations ranging from 78% to less than 1% (see the NDC Programme Wide Annual Report 2002/03, Section 6).
7.21. Figure 7.3 illustrates the involvement of BME communities in the Programme. The
left column indicates the scale of BME involvement in specific activities and the right the degree to which any such involvement changed in the 12 months prior to November 2003. Care has to be used in interpreting these trends. For example it is possible that answers will, at least marginally, reflect the scale and composition of BME communities in NDC areas. Nevertheless, BME engagement is a critical issue for many Partnerships and the intention is that this evidence will be revisited in 2004/05. This 2003/04 evidence indicates that:
• Programme teams are consistently more optimistic about BME engagement than are Boards, and especially, agencies; it may be that those working in NDCs can become somewhat introspective possibly not appreciating the scale of BME engagement occurring in other mainstream/renewal agencies.
• However, even allowing for different constituency perspectives on BME activities, the evidence suggests most observers consider local BME communities are engaged in most activities; the exception, in line with evidence

New Deal for Communities: The National Evaluation
Annual Report 2003/4 118
in relation to community engagement as whole, relates to monitoring and evaluation.
• In relation to change in the previous 12 months, more observers characterise BME engagement 'staying the same'; but there is hardly any evidence to indicate of any decrease in involvement.
Figure 7.3: BME involvement in NDCs Strategic planning and decision making
0
5
10
15
20
25
30
35
Yes No
Partnership board Programme team Agencies
Change in previous 12 months
0
5
10
15
20
25
30
35
Increased Decreased Stayed same
Partnership board Programme team Agencies
Membership of NDC forums
0
5
10
15
20
25
30
35
Yes No
Partnership board Programme team Agencies
Change in previous 12 months
0
5
10
15
20
25
30
35
Increased Decreased Stayed same
Partnership board Programme team Agencies
Project design and development
0
5
10
15
20
25
30
35
Yes No
Partnership board Programme team Agencies
Change in previous 12 months
0
5
10
15
20
25
30
35
Increased Decreased Stayed same
Partnership board Programme team Agencies
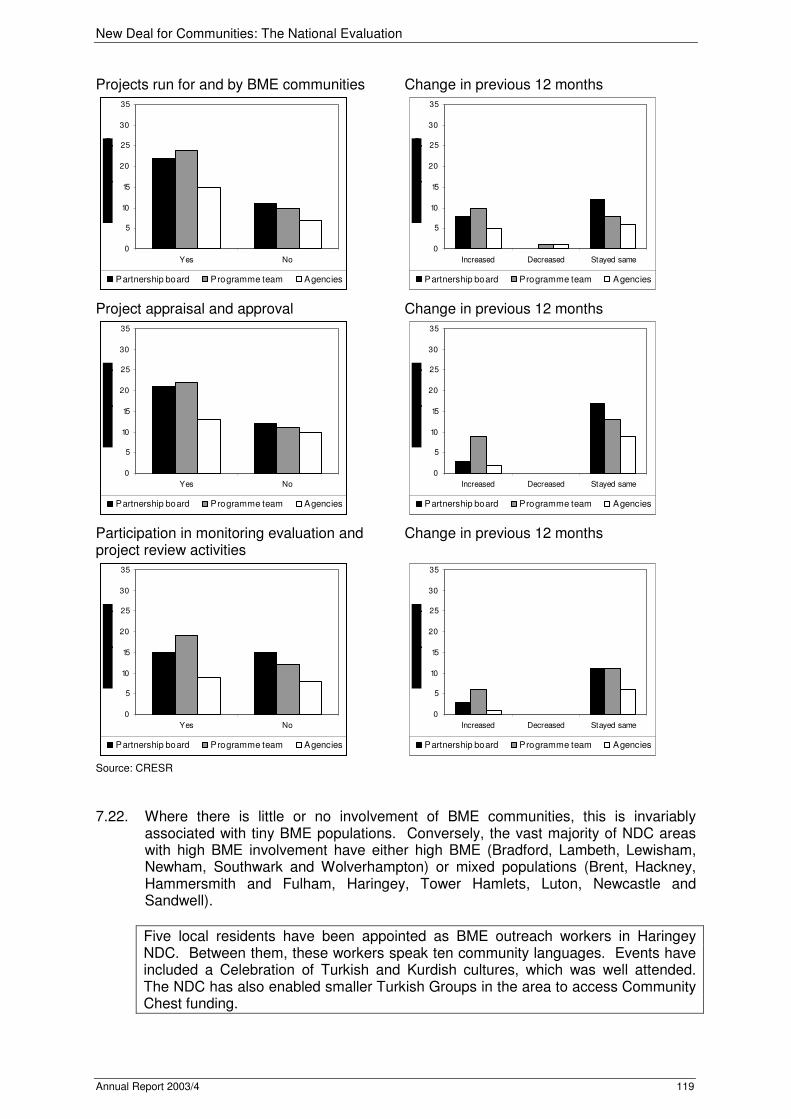
New Deal for Communities: The National Evaluation
Annual Report 2003/4 119
Projects run for and by BME communities
0
5
10
15
20
25
30
35
Yes No
Partnership board Programme team Agencies
Change in previous 12 months
0
5
10
15
20
25
30
35
Increased Decreased Stayed same
Partnership board Programme team Agencies
Project appraisal and approval
0
5
10
15
20
25
30
35
Yes No
Partnership board Programme team Agencies
Change in previous 12 months
0
5
10
15
20
25
30
35
Increased Decreased Stayed same
Partnership board Programme team Agencies
Participation in monitoring evaluation and project review activities
0
5
10
15
20
25
30
35
Yes No
Partnership board Programme team Agencies
Change in previous 12 months
0
5
10
15
20
25
30
35
Increased Decreased Stayed same
Partnership board Programme team Agencies
Source: CRESR 7.22. Where there is little or no involvement of BME communities, this is invariably
associated with tiny BME populations. Conversely, the vast majority of NDC areas with high BME involvement have either high BME (Bradford, Lambeth, Lewisham, Newham, Southwark and Wolverhampton) or mixed populations (Brent, Hackney, Hammersmith and Fulham, Haringey, Tower Hamlets, Luton, Newcastle and Sandwell).
Five local residents have been appointed as BME outreach workers in Haringey NDC. Between them, these workers speak ten community languages. Events have included a Celebration of Turkish and Kurdish cultures, which was well attended. The NDC has also enabled smaller Turkish Groups in the area to access Community Chest funding.

New Deal for Communities: The National Evaluation
Annual Report 2003/4 120
7.23. In relation to engagement many Reports identify enhanced links between NDC and BME communities. Links with the Somali community have been built on in Haringey, Sheffield and Tower Hamlets. In Norwich, relationships with travellers have improved and there are better links between Oldham NDC and the area's Indian Association.
7.24. In some NDCs relationships have been put onto a more formal basis through the
creation or maintenance of specific committees or fora:
• In Coventry the BME Forum 'is now again making concerted efforts to develop an identity and sense of purpose, offering the potential for a greater contribution in the future'.
• In Brent, Luton, Newham, Nottingham and Plymouth NDC, race equality groups are specifically identified, as is a multi-cultural forum in Hammersmith and Fulham.
Constraints to BME Community Engagement
7.25. Particular barriers can be faced when NDCs try to engage BME communities:
• The size and nature of the BME community poses a challenge to a number of Partnerships. This can be especially apparent where a BME community is small and broadly spread: 'Engaging with widely dispersed BME families is difficult, particularly when there are no BME groups through which needs can be assessed and activity channelled'.
• Recruitment and engagement can be complicated when individuals are trying to maintain a low profile for legal purposes, often bound up with issues of illegal immigration.
• Lack of awareness of BME issues and needs. It may be the case that some NDCs lack a full understanding of the scale or needs of BME populations in their areas.
• Some NDCs can have a tendency to perceive BME communities as a single, homogenous group. Many have learnt through time to acknowledge the diversity of apparently homogenous groups and to avoid attempting to engage different communities through single organisations. Some strategies for BME engagement specifically avoid singling out and dividing communities. For example, Sheffield considers 'projects designed for particular communities could be divisive' and as such, 'the focus should be on comprehensive projects that meet the needs of the whole community'. In Bradford the 2003/04 Partnership Report comments in relation to Asian or Asian British - Pakistani communities that neither is 'seen as a single community: both contain a number of different communities reflecting ethnic, religious, economic and demographic differences' and that the Partnership had been successful in recognising the differences between, and within, groups.
7.26. Other constraints to engagement with BME groups mentioned in individual reports include the presence of BNP support and language barriers between Partnership staff and communities whose first language is not English.
The Manchester NDC has worked closely with the Tung Sing Housing Association and Chinese support groups in the neighbourhood planning process. Other initiatives include following Chinese customs such as changing the numbering of the houses to end in 3's, promoting celebrations of the Chinese New Year, and organising community events promoting different cultures.
New Deal for Communities: The National Evaluation
Annual Report 2003/4 121
Cohesion and BME Communities
7.27. A number of the 39 2003/04 Partnership reports address the issue of community cohesion. In general where evaluation teams have considered this as an issue they tend to emerge with positive assessments, especially in London. The Lewisham Report suggests there have been 'harmonious community relations for more than a generation, there is no shared memory of conflict and there is a strong spirit of “getting along with each other” without any regard for race or ethnicity'. And in Newham 'the area is very mixed ethnically and culturally: it was generally felt that different groups managed to coexist reasonably well'. Other reports suggest that although various groups appear successfully to coexist, they do not socialise with one another.
7.28. Factors identified as contributing to cohesion in NDC communities included:
• The availability of small grants schemes.
• Community engagement teams.
• Newsletters, widespread dissemination of NDC activities.
• Community enthusiasm.
7.29. And factors constraining progress on community cohesion were:
• Geographical and physical barriers.
• Historical divides, and area rivalries.
• Transient populations.
• Lack of existing community organisations.
• No clear community engagement strategy.
• Lack of communication and marketing of NDC activities.
• Lack of appropriate consultation, and community engagement.
• Different regeneration activities operating in different areas.
• Community cohesion activities being time consuming.
7.30. As NDC programmes roll out, many Partnerships will be faced with community
tensions, often driven by inaccurate perceptions as to 'where the money has gone'. In this inevitably sometimes tense environment, Partnerships will need to consider both overall strategy and more immediate operational issues. Partnerships will therefore find two recent documents of value. 'Community cohesion advice for those designing, developing and delivering ABIs' (Home Office, ODPM, 2003) provides some telling guidance for renewal partnerships such as seeking to create 'thematic' as well as 'geographical' funding streams. It also points to the importance of good communication and marketing strategies, in the development of which Partnerships should find the 2003 ODPM publication 'Media and PR Toolkit' particularly helpful.
COMMUNITY ATTITUDES AND ASPIRATIONS
7.31. The 39 local evaluation teams were asked to probe the views of NDC residents by conducting at least two focus groups in each area. The following questions were used as a basis for focus group discussions:
• What is the relationship of participants to the NDC Partnership?

New Deal for Communities: The National Evaluation
Annual Report 2003/4 122
• What do participants know about the NDC Partnership and its activities? Do they feel well informed?
• What activities has the NDC Partnership undertaken to encourage local people to become involved?
• How successful have these been?
• How well is the NDC doing in engaging all sections of the local community?
7.32. And over the past twelve months:
• What have been the three key successes/achievements of the NDC Partnership?
• What have been the three key difficulties/tensions?
• Is there any evidence that the NDC Partnership is making a difference to the local area?
• What would you like the NDC Partnership to do more/less of?
7.33. In all:
• 76 focus groups discussions took place in 38 NDC Partnerships, involving 630 people.
• On average, there were eight attendees for each focus group. The number of participants ranged from two to 40. The number of focus groups per Partnership ranged from one to seven.
• Most were conducted with NDC residents; six contained only female participants, and four only males; eight (67 people) were attended by only BME groups: of these, three groups were attended by only Africans and one group was attended by only Asians. One group was attended by young people Asian people. Eleven were attended entirely by young people involving 135 participants.
Table 7.1: Details of focus group constituents Constituent No. of focus groups NDC residents 25 Young people 11 Tenants group 8 BME communities 8 Volunteers & community representatives 7 NDC project based group 4 Community group (non-NDC) 2 Older people 6 Working age women 2 Other+ 7 TOTAL 78
(+ Others included adults, no involvement with NDC, single parents, working age men and NDC staff. 7.34. Findings from these focus groups provide rich and detailed evidence in relation to a
range of issues:
• Community engagement.
• Information and communication.
• Projects and delivery.
New Deal for Communities: The National Evaluation
Annual Report 2003/4 123
• And contrasting views of different constituencies.
Community Engagement
Successes
7.35. A number of focus groups indicate that there have been increases in the level of community engagement in NDCs in the previous 12 months. Some residents in Derby NDC who were engaged as volunteers, said that they enjoyed the work they were doing and the sense of achievement and appreciation gained from being involved.
7.36. Participants in focus groups in Haringey and Sunderland gave examples of better
links with BME groups, in the former as a result of community engagement projects such as the Black history month, and Turkish and Kurdish cultural events. Focus group participants making these comments were ethnically diverse including attendees from BME groups and White British Communities.
7.37. Participants in Manchester NDC, identified a significant increase in community
groups and new members; in Sandwell groups felt that there was more support to community groups in the area as a result of NDC.
Constraints
7.38. A number of critical comments were raised by participants in relation to community engagement. Several focus group members in one NDC think that the reason the NDC is not attracting new active members is that even when people know about the Partnership, they believe they could have little influence over it. They were also disheartened by the time consuming and complex processes of achieving anything, as well as the lack of support given to new people.
7.39. In some areas, participants comment on the difficulties of widening engagement from
small groups of individuals. Participants in one area expressed the view that 'the NDC is not for us' and were unaware of what the Partnership had done
7.40. Others point to issues such as dominance by individual residents, timing and length
of meetings, lack of appreciation of resident involvement by Partnerships and lack of community led projects. In some areas, limited engagement appears to have contributed to feelings of mis-trust and a belief that the programme is not truly community driven: 'when the NDC was launched there was a high expectation that real changes would happen and that the programme would be led and managed by the community' which was not felt to be the case now. In another, participants wanted to see 'the development of a programme to address community participation. There is a clear desire to encourage more members of the community to be involved in NDC but mechanisms are required that measure involvement more qualitatively and listen to residents more vigorously'.
7.41. Others feared that the NDC was becoming too much like the council by having patronising attitudes to local people. 'Telling people what will be good for them, and not listening to what local people want.'
7.42. Participants in at least two focus groups considered that there was still some way to
go before all sections of the community were involved in the NDC process. Groups which remained isolated from their local NDC included refugees and asylum seekers, young people, people in their 30s and 40s (possibly because they are working and so find meeting times inconvenient) and single parents. In one NDC, the failure to

New Deal for Communities: The National Evaluation
Annual Report 2003/4 124
appeal to the wider community was identified as contributing to lack of community cohesion in the area:' We should have a say throughout the process not when decisions are made. We should have the option to be on forums which cater for our needs'.
7.43. Participants elsewhere considered that inadequate meeting facilities were hindering community capacity
'At the moment, the Community Centre has poor premises and a lot of staffing problems that affect its opening times; currently the Centre is open only 2-3 days a week and only for a few hours. The NDC has developed plans for improvements for the Community Centre but residents are sceptical about the quality of these improvements, given the poor quality of the new Housing Office.... residents would like the NDC to make alternative provisions for the period that the Centre will be closed for these improvements'.
7.44. Suggestions made by participants to improve community engagement included
remuneration for resident Board members, more elections, listening to what the community wants, and more residents on NDC sub-groups and panels. More training for residents to become involved were seen to be needed, combined with events designed to develop greater levels of trust and commitment amongst current Board members.
Information and Communication
Successes
7.45. No focus group identified communication as a main achievement of their NDC in the previous year, although when prompted a number were aware of newsletters and leaflets distributed by the NDC.
Constraints
7.46. Lack of information about what NDCs are trying to do was identified as a problem in a number of NDCs. In some areas participants indicated that this had contributed to an atmosphere of mis-trust amongst residents. Residents prioritised lack of information in relation to NDC events and what NDC resources had been spent on. In one NDC, it was felt that there was no information about what the Partnership has spent the money on and that there 'would be an outcry' if this information was provided.
7.47. Focus groups also revealed that some residents think communication between
Partnerships and residents is poor. The style and means of communication were criticised and groups referred to the use of unhelpful and potentially discriminatory 'jargon'. Although many Partnerships have used newsletters and other media to assist communication, these were not always well received. Participants in one focus group felt that the NDC newspaper was 'too posh and glossy' and that it was important to 'shout about what NDC is doing in the area and this would foster more support generally'. In another, a participant felt that 'the brochures and publications from the NDC give a biased view of what is really happening in the community. They describe the initiatives that are taking place and the successes in the area and how everything is getting better, but bear no relation to what is actually happening in the community'.
7.48. Some participants consider their local NDC has over-consulted and that it is now 'time for action'. Additional concerns relate to the need for all groups to be

New Deal for Communities: The National Evaluation
Annual Report 2003/4 125
represented in consultations and inappropriate consultation methods. In relation to the latter point some residents expressed concern about Partnerships using written questionnaires in areas with low literacy levels. Participants were also aggrieved when feedback on consultations had not taken place.
7.49. A range of suggestions emerged from focus groups designed to improve
communications within NDC areas. These included:
• More face to face information sessions, resident surgeries, and neighbourhood consultations.
• Accurate feedback sessions.
• More information on issues such as spend, and the availability of NDC jobs.
• Increasing and improved use of the media including positive support from the local press.
• A focus group consisting entirely of young people suggested that if the NDC was to be successful then it had to sell itself more successfully and this needed to be done in a no nonsense fashion, ‘keeping it real’, ‘adopting a no suit and ties approach’ and ‘engage at ‘grass root levels’.
• Local magazines which appealed to all age groups, containing information relevant to all members of the community.
• Visiting other neighbourhoods with successful projects.
• Improved mechanisms through which to measure success and evaluate progress.
• 'Board Directors need to be much more proactive and get out into the community and help publicise events, particularly in their local area. A Board Directors’ surgery in local area to hear residents concerns and take their issues forward'.
Projects and Delivery
7.50. There was a view from a number of focus groups that not enough projects were visible, contributing to a belief that local Partnerships were failing to deliver or progress. In one case participants wanted 'more visual projects - that people can literally see. This would provide some evidence of action and progress'. Similarly, participants in another stated that the NDC needed to 'increase the scale of projects and needs to start doing something to get the community spirit going, to start doing something positive for the community'. And in another: 'looking from the outside, projects appear to be taking a long time to get started. After nearly three years little has changed; we understand that it has taken a long time to purchase (a key) site though there is no information on how the building could be used to the benefit of the community. We are not sure how the new Master Planning exercise will affect the development of (this site'). Early optimism from community groups when NDC funding was approved has in some cases turned to frustration and demoralization at the apparent inertia evident in some local programmes.
7.51. There were some concerns about how decisions affecting projects were being made.
Some wanted a reduction in the paperwork involved. In one focus group residents indicated they would like to see one umbrella organisation which would help local residents to bid for, and set up, small projects to ensure that NDC money trickles down to residents projects.
7.52. To improve continuity and management, participants want to see fewer staffing
changes combined with clarity in relation to who was doing what:' far from being community led, it was felt, the programme is driven by consultants and controlled by professional staff'.
New Deal for Communities: The National Evaluation
Annual Report 2003/4 126
7.53. Participants in a number of focus groups point to the need for improved relationships with agencies. In part this is driven by the sentiment that the NDC appeared powerless when dealing with some agencies. Participants were not happy with the comment which came too often from NDCs: 'you can’t blame the Partnership – it's got no power'.
7.54. Others raised concerns about sustaining projects. Residents who have been active
in their local NDCs may themselves begin to recognise the importance of capacity building in order to sustain activity. One focus group was keen that a particular project should be sustainable, and hoped that the wider community could run it after the initial five year period. Therefore their relationship with the programme team was gradually changing: ‘We realised we couldn’t do it at the beginning, and we relied on the team. We see them as guardians’.
Contrasting Views of Different Constituencies
BME Groups
7.55. In some areas, participants considered that NDC activities had resulted in greater levels of understanding in relation to cultural diversity. This is perceived as important since provision of facilities should be consistent with cultural needs.
7.56. However, BME participants in focus groups also highlighted a continuation of racial
tensions in some NDC areas, differences between racial groups still not always understood by some NDC Partnerships, and barriers to the engagement of specific BME groups not being addressed. Some participants also considered that Partnerships had failed to address imbalances in employment opportunities experienced by particular BME groups or to challenge apparent inequalities in their treatment by the local police.
7.57. Barriers to engagement highlighted by BME groups include the use of
inappropriate language and jargon; insufficient use of interpreters; and Partnerships ignoring cultural and religious issues and different working patterns when arranging events.
Young People
7.58. Most focus groups were aware of examples of youth projects which some had been involved with and thought to be successful. Examples of projects and facilities identified by focus group participants as achievements by NDCs included sports facilities, holiday activities, events, outreach programme, support for families and funding designated for youth projects. Some also pointed to youth forums and youth strategies as examples of how the involvement of young people in NDC had increased.
7.59. Various initiatives were identified by young people as examples of successful NDC
activity:
• A focus group of young mothers identified the local nursery, the master planning exercise, and neighbourhood wardens as achievements.
• A group of young unemployed white males felt that there were more job opportunities available as a result of NDC interventions.
• Young focus group participants in a London NDC were positive in relation to a number of NDC projects such as youth projects, ESOL classes, a new park, more youth clubs, youth workers, wardens, street refurbishment, and housing repairs/improvements/security doors.

New Deal for Communities: The National Evaluation
Annual Report 2003/4 127
• A group of young females in the West Midlands felt that the Partnership's approach to young people through the establishment of the youth forum and young people's strategy was successful in increasing involvement.
7.60. Young people however also point to a number of issues which they see as not being
adequately addressed: the physical appearance of NDC areas, dereliction, litter, vandalism and lack, or loss, of green space. Additionally, despite many groups identifying youth projects as a success, there remains a feeling amongst many young participants that there is 'nothing to do' and that facilities are still lacking. This was widely seen as being important in that additional facilities would help keep young people off the streets, an especially useful outcome because there was a perception that young people were responsible for crime in the local area. Problems relating to crime, especially drug related crime were also frequently mentioned by young people themselves. This need for additional facilities was reflected in a number of focus groups. One in Sandwell attended by young people thought that there is a need for a leisure centre in the area or 'places for chilling out' and shelters, where they could 'escape the rain and chat'. One participant suggested that the NDC fund a drop in centre which could put on courses similar to their Personal and Social Education classes at school – looking at issues around health, drugs, smoking and so on, and perhaps also offering counselling.
7.61. Young people had lots of other ideas about the kinds of developments they would
like to see in their area: learning activities related to future careers; homework clubs; activities related to music and design technology, including a recording studio and a place to see live bands; and more outdoors activities, including football pitches, skate parks and swimming pools.
7.62. Participants with younger children, also wanted NDCs to support better access to
youth worker, additional provision for younger children (play areas and nursery education) and better support for families.
Older People
7.63. Like younger people, older participants were particularly concerned about the state of the physical environment in NDC areas. Examples of success were identified as improvements to open spaces and gardens and the removal of abandoned vehicles. However, the general level of cleanliness in the area remained a major concern for this age group with dirt, litter, graffiti and abandoned cars all being perceived as difficulties which NDCs had not fully overcome.
7.64. Older participants also valued projects and activities which gave opportunities to
meet people and make friends. Successful examples included exercise classes, faith forums, and gardening clubs. In Lewisham participants noted that a History Trail activity led by the NDC Development Worker which involved children from the local primary school talking to older residents had proved successful. A number of residents at that session now attend a regular history group which meets once a month.
7.65. The areas of most concern to older people were crime and accessibility and
availability of services. The only specific crime that was identified was vandalism, but participants remained concerned about personal safety.
7.66. A number of participants found accessing services difficult, especially shops and
health services. Many were unable to access these without transport. Difficulties relating to pavements not being maintained, and bikes on pavements were also identified as preventing people walking to services.
New Deal for Communities: The National Evaluation
Annual Report 2003/4 128
CHAPTER 8: MAINSTREAMING
INTRODUCTION
8.1. For some years, and most clearly since the cross-cutting Treasury led review of Government Interventions in Deprived Areas (HM Treasury 2000) it has been accepted that main programmes should bear the weight for tackling deprivation even if targeted initiatives still have a role to play. 'Mainstreaming’ has thus been a major theme within neighbourhood policy, and indeed within all ABI thinking, with the Audit Commission and the Regional Co-ordination Unit, for example, striving to identify and spread good practice about the role of main programmes.
8.2. In Chapter 7 of the NDC 2002/03 Annual Programme Wide Report, the evidence
there was that mainstreaming was slow to develop and that there remained a set of barriers to strengthening the contribution which main programmes might make to neighbourhood renewal. This chapter charts progress with mainstreaming in 2003/04.
8.3. The chapter is based on information collected in 2003/04:
• 39 sets of templates from the local NDC research studies, providing responses to a common set of questions.
• 39 sets of commentaries on these templates based on interviews with local stakeholders (Board members, programme teams, agencies).
• In depth studies of mainstreaming in the six NDC case study areas: Bristol, Liverpool, Middlesbrough, Nottingham, Haringey, Coventry.
Lack of Shared Understanding
8.4. There remains widespread lack of shared understanding about what mainstreaming means. The concepts of mainstreaming are contested and often misunderstood. Agencies have different views: ‘change the way we work to focus on specific issues and deliver services in different geographical areas’; ‘rolling out good projects’; ‘bending and enhancing funding’; and ‘absorbing the costs of projects once they end’. There is as yet little general debate about agreeing approaches to mainstreaming, or consistency of view between, or even within, stakeholder agencies. There is relatively little reference to the work of the Audit Commission, to NRU definitions, or to renewal.net as sources of information about what mainstreaming might be. GOs emphasise the importance of mainstreaming but have no consistent interpretation of what this means. Typical of a number of responses were:
A lack of shared understanding across the Partnership of what mainstreaming is about and its relevance to the required outcomes at the end of the NDC programme. Mainstreaming is still not particularly well understood and means different things to different people
8.5. This weakness in understanding is reinforced by the fact that there appears to be as yet little strategic thinking about mainstreaming. The complexity of the task is stated as a barrier, with mainstreaming being ‘referred to in an ad hoc way rather than being considered holistically or strategically’.
8.6. The absence of shared understandings does not of itself inhibit action, and indeed in
some localities the search for definition (and also ‘mapping’) is regarded as a
New Deal for Communities: The National Evaluation
Annual Report 2003/4 129
diversion from getting on with managing neighbourhood change. Nevertheless it is clear that providing some framework within which different approaches to mainstreaming can be discussed is likely to encourage more concerted action.
8.7. Following, but developing, the usages of NRU and the Audit Commission, and also
reflecting the thinking within the evaluation of Local Strategic Partnerships for which mainstreaming is also an issue, a framework is used below which identifies four main dimensions to mainstreaming:
• An ‘organisational engagement’ dimension’ which addresses whether there is ‘top down’ organisational commitment to mainstreaming, echoing the Audit Commission’s corporate policies category. This dimension includes material relating to issues of both corporate commitment and structural arrangements. (8.8 to 8.31 )
• A ‘resource management’ dimension which looks at resource planning and allocation and at whether mainstream resources are or are not being diverted into NDCs. (8.32 to 8.44)
• a ‘reshaping services dimension’ which asks whether existing services are being delivered in different ways or whether new forms of main programme delivery are being attempted (8.45 to 8.65)
• ‘Sustainability’ dimension which assesses whether progress is being made in learning lessons from the bottom up from NDCs and transferred into main programme thinking and allocation of long term resources (8.66 to 8.69).
A number of negative barriers as well as positive drivers, are set out 8.70 to 8.80.
ORGANISATIONAL ENGAGEMENT
Engagement of NDCs with Other Bodies
8.8. Evidence from across the Programme suggests extensive engagement of NDCs with other organisations, and significant attention being made to NDCs in strategic planning documents. In terms of representation on structures (Figure 8.1) there is strong linkage with Local Strategic Partnerships, with 35 NDCs represented in LSP structures, and also extensive membership of organisations within the five key policy areas. In health, housing, worklessness, community safety, and education, two thirds (although not necessarily the same NDCs in each policy area) are represented on agency bodies. NDCs are also well represented (29) in Sure Start structures. Less evident are linkages to Learning and Skills Council (16 NDCs) and Connexions (18 NDCS), the higher representation for worklessness as a whole being probably explained by links with Jobcentre Plus.
8.9. There is relatively little representation on organisations committed to environmental
agendas (16 NDCs) or with race equality agencies (also 15 NDCs).

New Deal for Communities: The National Evaluation
Annual Report 2003/4 130
Figure 8.1: NDC Representation of NDC on other bodies
0
5
10
15
20
25
30
35
40
LSP
Health
Housin
g
Sure
Sta
rt
Com
munity
Safe
ty
Work
lessness
Education
Connexio
ns
LSC
Environm
ent
Race E
qualit
y
Num
ber of NDC's
Body or working party
Base: 39 partnerships Source: CRESR 8.10. Information was collected from all 39 NDCs about the engagement of agencies in
relation to sixteen agencies. Seven areas of possible engagement were identified – forward strategy, mapping spend, main programme spend, joint project work, a physical presence in the area, increased resourcing, changed patterns of delivery.
Strategic Commitment
8.11. Approaches to mainstreaming can be ad hoc, and reflect the finding from a number of NDCs that commitment is often operational rather than strategic. ‘Most relations are built on project-specific concerns rather than any longer term objectives’. In some cases this is seen as the absence of senior level representation from stakeholders:
The Trust has expressed concern over the lack of senior representatives from partner agencies and an unwillingness to move beyond low level engagement ‘Insufficient influence of Board representatives within their own organisations or their lack of direct control over the budgets of the agencies they informally represent has limited effective engagement There is not yet a strategic basis on which mainstreaming can be considered. The relationship with the borough is not robust at strategic level – possible reluctance to engage on these issues.
8.12. In part this reflects tensions felt by agency representatives regarding the relative importance of the NDC as opposed to their own organisation:
The cabinet member for Housing is member of NDC board but has been slow to support the progress of the (NDC) agenda within (the borough); few of the partner agencies saw a clear fit with the NDC. To this extent there were clear limits to commitment, and limited enthusiasm.
8.13. A different observation is that linkages and commitment are to be found in inter-personal relationships rather than embedded in organisational relations.

New Deal for Communities: The National Evaluation
Annual Report 2003/4 131
Although individual representatives express commitment, there is no real sense that additional mainstream resources will support the NDC agenda or that service delivery will be changed to respond to local need.
8.14. In some localities it appears that organisational commitment from the mainstream
arises as a consequence of exchange relationships. When the NDC puts in resources which complement or supplement departments or agencies, the degree of commitment to collaborative working increases, and it is more likely that the NDC becomes integrated into corporate strategies. In other areas, however, commitment comes without such strings, notably where there is clear evidence of strong leadership. There are a number of NDCs where it appears that a new face has altered the nature of relations between NDCs and stakeholder agencies, introducing a longer term perspective into discussions, generating stronger corporate commitment from local authorities and/or agencies
NDCs and the Local Strategic Partnership
8.15. Whilst 35 NDCs report some membership (from board or staff) on the LSP or its structures, commentaries point to variable relationships. The LSP can be seen as a key positive driver in support of the NDC:
The LSP commitment to pilot Neighbourhood Management through the NDC area will enable ideas to be tested and if seen to be effective to be applied elsewhere in the borough The Programme Director and [NDC] Chair now share the task of representing the [NDC] on the LSP, NDC officers sit on some of its theme groups. The NDC has a place on the LSP, The New Deal Chief Executive chairs the Neighbourhood Renewal Working Group
8.16. At the same time, that NDCs are not always engaged with, indeed may be excluded from, LSP arenas:
The policies of the Borough and the nascent LSP do not seem to be geared to reinforcing the NDC programme. There are few real links between the Partnership and the LSP and the former played no real role in shaping the Community Strategy. Although (the NDC is) involved in most of the LSP sub groups, the LSP as a whole does not appear to view (NDC) activities as having an important influence on its main activities. The LSP has yet to make an impact in terms of a Community Development Strategy that could offer a framework in which mainstream players might routinely bend programmes in developing joined-up regeneration strategies that would encompass a range of ABIs including NDCs. Although the NDC is involved in most of the LSP sub groups, the LSP as a whole does not appear to view the NDCs activities as having an important influence on its main activities
8.17. However, it is clear that engagement with LSPs has grown in the past year and that in many cases a positive relationship is developing. NDC Partnerships are also increasingly present on other forums:

New Deal for Communities: The National Evaluation
Annual Report 2003/4 132
A member of the Middlesbrough NDC is a member of the shadow board of the housing organisation which will take over the Council’s housing stock once the transfer is completed) Nottingham NDC has developed strategic city-wide links around Worklessness and Race Equality. The NDC is also now more engaged with the strategic alliance of Local Area Partnerships and attends some forums on their behalf.
In Bradford the Programme team has actively developed links with other organisations and partnerships at both the community and local authority levels……in addition to its participation in Bradford Vision, programme managers also sit on a range of groups and partnerships operating across Trident and in some cases across Bradford.
NDCs and the Local Authority
8.18. The local authority role is central for the NDC Programme:
The direct involvement of the Chief Executive, rather than a lower ranking senior officer as before, was widely regarded as a positive move The Council is the accountable body and the biggest service provider. That relationship has become stronger over the past year at the strategic level and, in the case of some services, also at the operational level The Borough is an important, natural partner for the NDC, closely involved with the NDC’s management and services. The Borough played a critical role during the Partnership’s previous period of difficulty and has supplied practical support during the period of recovery. The Council has added to its representation on the board, and this has significantly improved responsiveness to the issues arising at the Board, and on some of the sub groups.
8.19. This is not universal:
A poor CPA has led to Council ‘distraction’ and lack of support for NDC activities, There is not an effectively implemented corporate strategy with regards to New Deal. This is further hampered with no coherent political leadership on how to tackle the problematic issue of dedicating effort and finance to a New Deal area that is perceived to have already won the Lottery with the successful New Deal bid at the expense of the other nine neighbourhood renewal areas.
8.20. Nor are good relations necessarily spread throughout the council. It is clear that for some services the level of support to the NDC area has been less than hoped for:
The evaluation of the Estate Maintenance project together with the report of the NRA on neighbourhood management illustrate graphically the challenge of getting the local authority to change its practices and to the tension between borough wide (recycling) targets and the capacity to respond to resident priorities.
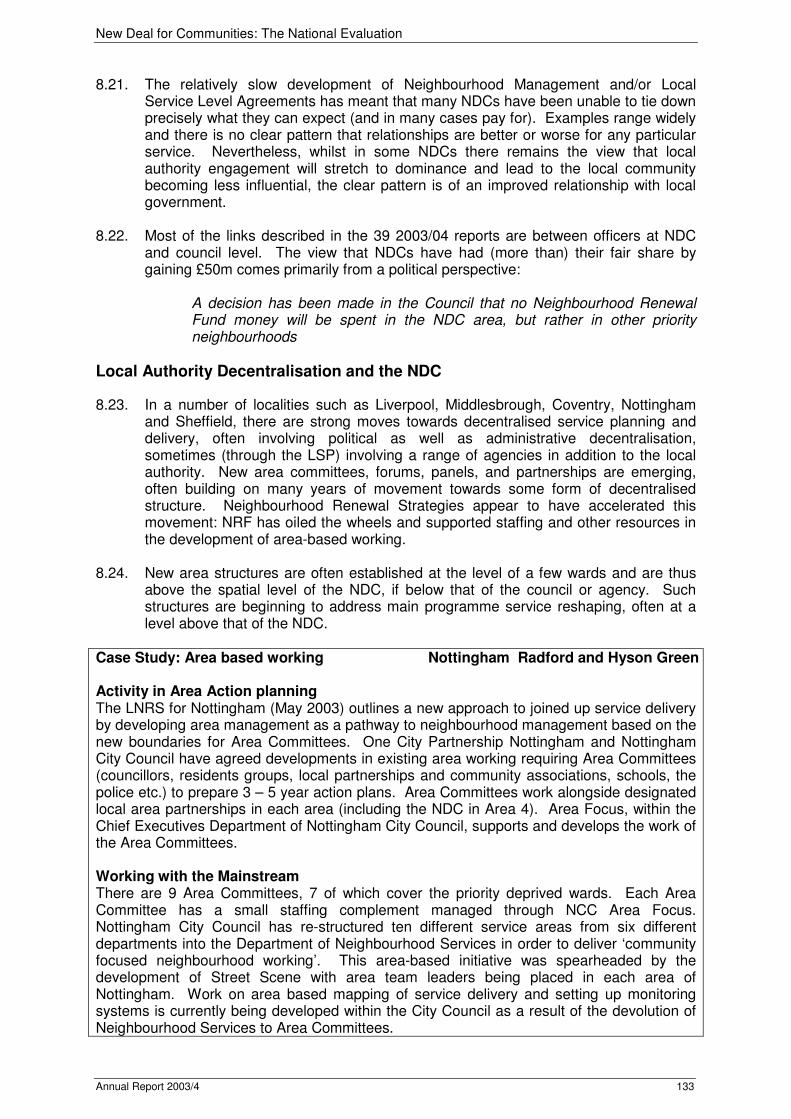
New Deal for Communities: The National Evaluation
Annual Report 2003/4 133
8.21. The relatively slow development of Neighbourhood Management and/or Local Service Level Agreements has meant that many NDCs have been unable to tie down precisely what they can expect (and in many cases pay for). Examples range widely and there is no clear pattern that relationships are better or worse for any particular service. Nevertheless, whilst in some NDCs there remains the view that local authority engagement will stretch to dominance and lead to the local community becoming less influential, the clear pattern is of an improved relationship with local government.
8.22. Most of the links described in the 39 2003/04 reports are between officers at NDC
and council level. The view that NDCs have had (more than) their fair share by gaining £50m comes primarily from a political perspective:
A decision has been made in the Council that no Neighbourhood Renewal Fund money will be spent in the NDC area, but rather in other priority neighbourhoods
Local Authority Decentralisation and the NDC
8.23. In a number of localities such as Liverpool, Middlesbrough, Coventry, Nottingham and Sheffield, there are strong moves towards decentralised service planning and delivery, often involving political as well as administrative decentralisation, sometimes (through the LSP) involving a range of agencies in addition to the local authority. New area committees, forums, panels, and partnerships are emerging, often building on many years of movement towards some form of decentralised structure. Neighbourhood Renewal Strategies appear to have accelerated this movement: NRF has oiled the wheels and supported staffing and other resources in the development of area-based working.
8.24. New area structures are often established at the level of a few wards and are thus
above the spatial level of the NDC, if below that of the council or agency. Such structures are beginning to address main programme service reshaping, often at a level above that of the NDC.
Case Study: Area based working Nottingham Radford and Hyson Green Activity in Area Action planning The LNRS for Nottingham (May 2003) outlines a new approach to joined up service delivery by developing area management as a pathway to neighbourhood management based on the new boundaries for Area Committees. One City Partnership Nottingham and Nottingham City Council have agreed developments in existing area working requiring Area Committees (councillors, residents groups, local partnerships and community associations, schools, the police etc.) to prepare 3 – 5 year action plans. Area Committees work alongside designated local area partnerships in each area (including the NDC in Area 4). Area Focus, within the Chief Executives Department of Nottingham City Council, supports and develops the work of the Area Committees. Working with the Mainstream There are 9 Area Committees, 7 of which cover the priority deprived wards. Each Area Committee has a small staffing complement managed through NCC Area Focus. Nottingham City Council has re-structured ten different service areas from six different departments into the Department of Neighbourhood Services in order to deliver ‘community focused neighbourhood working’. This area-based initiative was spearheaded by the development of Street Scene with area team leaders being placed in each area of Nottingham. Work on area based mapping of service delivery and setting up monitoring systems is currently being developed within the City Council as a result of the devolution of Neighbourhood Services to Area Committees.

New Deal for Communities: The National Evaluation
Annual Report 2003/4 134
Area Plans are intended to identify the NRS themes where performance/outcomes at local level are poorest relative to the wider community and then to set out proposals for sustainable changes to mainstream services with the aim of achieving national floor targets. The purpose of the Action Plan is to bring about permanent improvements to service delivery rather than one-off projects. £5k has been made available from the Neighbourhood Renewal Fund for each area to develop its action plan. In addition, OCPN has put together a package of core funding for local area partnerships over a 2 year period drawn from NRF/CEF/ERDF Area 4 covers three wards. More than two-thirds of it falls within a Neighbourhood Renewal Area. The NDC area crosses all 3 ward boundaries. Staffing in Area 4 consists of 3 full time posts. The designated local area partnership is the Partnership Council which is playing a lead role in the development of the Area Action plan. A Steering Group includes the Partnership Council, NDC, LEARN, Nottingham City Council, local area learning facilitator, Sure Start, Primary Care Trust, Police, Voluntary and Community sector Forum, Area 4 Committee, and the Area 4 Co-ordinator. The intention within the Action Plan is to roll out successful NDC projects that show links with floor targets: health facilitators; sports development worker; trainee teacher assistant posts; regeneration apprentices; discretionary grants and childcare vouchers for residents into employment. Delivery mechanisms and lead agencies are not yet defined but the successful NDC approach to BME recruitment of trainee teaching assistant posts has been mainstreamed from NDC to area wide, as has the successful YIP. NDC research on domestic violence is included in the Action Plan in order to stimulate an area wide approach (not explicitly eligible for NRF as not covered by floor targets but identified as a significant local issue and priority). Some barriers to mainstreaming NDC innovation have emerged, e.g. Community Health Facilitators is a difficult project to prioritise under health theme as there is no obvious agency to take it forward; and insufficient funding is available for regeneration apprentices. Barriers and Drivers The co-existence of Area Action planning with NDC may raise a number of issues: NDC performance is seen by some as being less effective than it ought to be given the scale of resource available; NDC systems appear to some to block progress; NDC is said not to have engaged with other initiatives which may become disillusioned by the experience of engaging with NDC; there is insufficient evidence available on the effectiveness of NDC interventions and their performance as exemplars; NDC attendance at meetings is intermittent; lack of trust/confidence in NDC from agencies. Messages about mainstreaming are thus not clear: agencies have not significantly changed their practices as a result of working with NDC; no SLAs are in place with the local authority; there is concern over the capping of NRF because of the existence of NDC funding. There are benefits of area working for NDC: integration with a wider area agenda, a route to local service deliverers via the Area Co-ordinator, greater understanding from partners as to what NDC is about, maximisation of resources in the NDC area (e.g. extension of Sure Start boundaries). There are benefits for Area 4 through the use of NDC funds to lever in additional funding, NDC can get non-NRF specific issues onto the agenda (e.g. domestic violence). Joint working between NDC and Area 4 is now moving forward through a partnership agreement.

New Deal for Communities: The National Evaluation
Annual Report 2003/4 135
NDCs and Agencies
8.25. Overall there is ambivalence about the extent of commitment to mainstreaming (Table 8.1.)
• Board members are more pessimistic about agency commitment to mainstreaming than programme teams or agencies themselves. In 15 NDCs Board members regard agency commitment to mainstreaming as a constraint to programme delivery, as opposed to 13 NDCs where programme team interviewees take this view, and 10 where agency representatives see commitment to mainstreaming as a constraint.
• At the same time there is also a view that stakeholder agency commitment to mainstreaming has assisted delivery (in 10 NDCs for Board members, in 11 for programme team, in 10 for agencies).
• More significant may be the fact that in 14 NDCs (Board members), 15 NDCs (programme team) and 18 NDCs (agencies), responses show neutral or 'don’t know' results.
• Many involved with NDCs do not know what is expected of mainstreaming and thus are neutral/lacking knowledge of whether it is being achieved
Table 8.1: 'Commitment to mainstreaming' from stakeholder agencies as constraining or assisting delivery Factor SC C N A GA NI DK/NC Total (N)
Partnership Board View 0 15 6 7 3 0 8 39 Programme team view 3 10 6 10 1 0 9 39 Agency view 1 9 6 10 0 0 12 38
Responses to Template asking about factors constraining (SC/C) or assisting (GA/A) delivery. Unclear and missing answers are excluded. Don't know (DK) and no consensus responses have been combined. Base: 39 partnerships Source: CRESR
Agency Role
8.26. Agencies were asked about the extent to which, in the last year, there had been changes in relation to eight possible roles (see Figure 8.2).In general agencies considered that their roles in relation to NDC had increased in the last year:
• In 11 NDCs membership of the Board and/or one of its groups had increased, and in only one case decreased.
• Greater collaboration on specific projects was reported in 27 NDCs.
• Links with the Partnership had increased (25 NDCs), as had general networking (24 NDCs).
• Agency consultation with residents was reported to have risen in 20 NDCs.
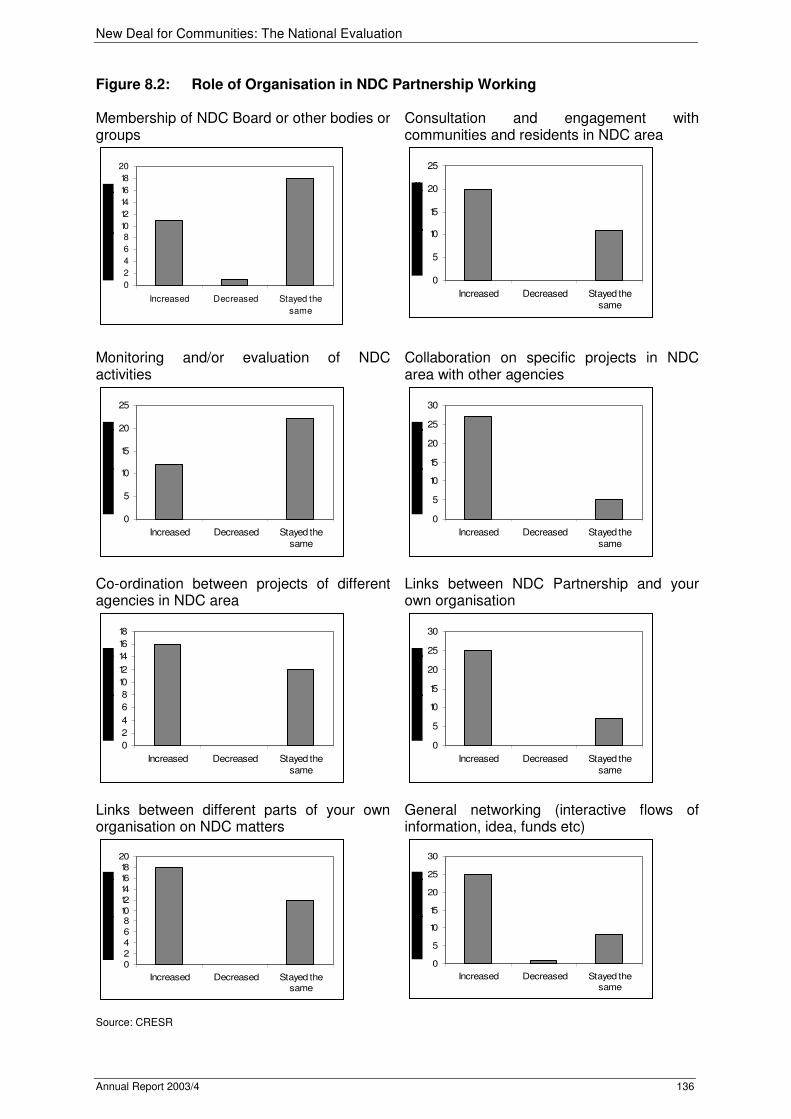
New Deal for Communities: The National Evaluation
Annual Report 2003/4 136
Figure 8.2: Role of Organisation in NDC Partnership Working Membership of NDC Board or other bodies or groups
0
2
4
6
8
10
12
14
16
18
20
Increased Decreased Stayed the
same
Consultation and engagement with communities and residents in NDC area
0
5
10
15
20
25
Increased Decreased Stayed thesame
Monitoring and/or evaluation of NDC activities
0
5
10
15
20
25
Increased Decreased Stayed the
same
Collaboration on specific projects in NDC area with other agencies
0
5
10
15
20
25
30
Increased Decreased Stayed the
same
Co-ordination between projects of different agencies in NDC area
0
2
4
6
8
10
12
14
16
18
Increased Decreased Stayed the
same
Links between NDC Partnership and your own organisation
0
5
10
15
20
25
30
Increased Decreased Stayed the
same
Links between different parts of your own organisation on NDC matters
024
68
101214
161820
Increased Decreased Stayed thesame
General networking (interactive flows of information, idea, funds etc)
0
5
10
15
20
25
30
Increased Decreased Stayed the
same
Source: CRESR

New Deal for Communities: The National Evaluation
Annual Report 2003/4 137
Agency Activity
8.27. Agencies were asked whether they agreed/strongly agreed that their agency was engaged in some or all of a range of policy, structural and operational activities in relation to the NDC (see Figure 8.3). Interviewees were asked whether there had been changes since the previous year. Agencies report considerable engagement with NDCs. In 37, agencies agreed/strongly agreed with the proposition that in the last 12 months there had been a positive contribution to NDC working; in 36 there has been joint planning of projects; in 30 NDC representatives of the NDC Partnership have been involved in partnerships and joint working initiated by the organisation; in 33 cases NDCs have been included in organisational strategy development. There is also reported commitment to changing the way mainstream services are delivered (24 NDCs), and to the development or revision of structures for working in partnership in NDC area (25 NDCs). Only in relation to increasing mainstream resources and evaluation of their approach do more agencies disagree than agree. Only 12 NDCs agreed with the proposition that they had increased the level of mainstream funding available to the NDC area; and only 15 agreed that they had evaluated their approach
Figure 8.3: Agency Activities in relation to NDCs: Change in previous 12 months Organisation has considered NDC in the development of strategies
0
5
10
15
20
25
30
35
Strongly agree Agree Disagree Strongly Disagree
Num
ber
of
part
ners
hip
s
Representatives of NDC Partnership have been involved
0
5
10
15
20
25
30
35
Strongly agree Agree Disagree Strongly Disagree
Num
ber
of
part
ners
hip
s
Organisation has been involved in the joint planning of projects
0
5
10
15
20
25
30
35
Strongly agree Agree Disagree Strongly Disagree
Num
ber
of
part
ners
hip
s
Organisation developed/revised structures for working in Partnership in the NDC area
0
5
10
15
20
25
30
35
Strongly agree Agree Disagree Strongly Disagree
Num
ber
of
part
ners
hip
s

New Deal for Communities: The National Evaluation
Annual Report 2003/4 138
Organisation increased level of mainstream funding available - NDC area
0
5
10
15
20
25
30
35
Strongly agree Agree Disagree Strongly Disagree
Num
ber
of
part
ners
hip
s
Organisation worked with NDC to change the way mainstream services delivered
0
5
10
15
20
25
30
35
Strongly agree Agree Disagree Strongly Disagree
Num
ber
of
part
ners
hip
s
Organisation made a positive contribution to the work of the NDC Partnership
0
5
10
15
20
25
30
35
Strongly agree Agree Disagree Strongly Disagree
Num
ber
of
part
ners
hip
s
Organisation has evaluated its approach to working with the NDC
0
5
10
15
20
25
30
35
Strongly agree Agree Disagree Strongly Disagree
Num
ber
of
part
ners
hip
s
Source: CRESR
8.28. Linkages, with LSPs, local authorities, and agencies are supported by a range of
structural arrangements which are beginning to draw together stakeholder interests building links between NDCs and main programmes. Examples include:
• Brighton: The NDC area is the largest of five priority areas identified by the LSP. The council is keen that NDC helps to deliver significant change in the area. To encourage this the NDC reports every six months to the local authority, through the Director of Performance Management, and there is an annual review by the LSP of progress in each of the five areas.
• Middlesbrough: There has been a change in the level of partnership links between WMNT and Middlesbrough Council, with the Chief Executive becoming increasingly involved in the work of WMNT. He attends Board meetings, Human Resources meetings, and the Whinney Banks re-development steering group.
• Plymouth: The Heads of Service Group previously set up to liaise with the NDC was not thought to work as well as it might and it has now been replaced by an Internal Reference Group. This involves councillors and officers including a Devonport Councillor and Board member, the Regeneration Portfolio holder, the Director of Housing and the Director with corporate responsibilities for NDC and the LSP. The appointment of a Director to hold corporate responsibility for NDC appears helpful. At present, officer level meetings offer an opportunity for links to be established between DRC and the LSP, and for physical regeneration issues to be considered, including links between plans for Devonport and those for other parts of the city.
8.29. However, arrangements do not always work smoothly. Progress in engaging
agencies has been hindered by a number of factors such as a slow build up of the thematic sub-groups in which agencies engage, the occasional insistence (by

New Deal for Communities: The National Evaluation
Annual Report 2003/4 139
Partnership Boards) that only Board members make up the membership of the sub groups, uneven attendance at NDC meetings by agencies, and at LSP/LA meetings, by NDC staff. In addition agency representation in NDC structures can be insufficiently senior, patchy in terms of attendance, and reflective of personal rather than organisational commitment.
Representation has been patchy with a number of consecutive meetings having been missed during 2003/03. Representation is also at an inappropriate level and there is limited feedback to senior managers within the organisation Periodic bouts of hostility and “stand off” between partners
8.30. This is more than offset, however, by increasing familiarity between NDC and agencies, greater understanding, more joint working, recognised protocols for interagency working, and jointly resourced projects. This is beginning to pave the way for mainstreaming which might take the form of reshaping services and re-allocating resources. A flavour of the change over the year comes from Middlesbrough one of the six NDC case studies in the national evaluation.
Middlesbrough Stronger partnership links with a number of mainstream providers are in evidence. This is generally considered to be an important step in what is seen as the long-term process of having successful services and activities mainstreamed. Focusing on the health and environment themes, the growing involvement of the PCT in WMNT’s Health Team and the drafting of a Service Level Agreement with the Council’s environmental department, Street Scene, have been the most significant developments, leading to closer relationships being forged between WMNT staff and respective agencies. It is hoped that these developing relationships will lead to a number of benefits through joint service development, resource sharing, and the commitment to develop and pilot new approaches to service delivery in the NDC area. Some barriers to mainstreaming exist, notably the general lack of available resources in Middlesbrough, and high levels of deprivation throughout the area, which reduce the opportunity for bending resources into the NDC area. However, other potential barriers have diminished for at least some of WMNT’s theme areas. SLA development means that there is more information available about what services the area is entitled to, and there is also a growing commitment to the area from mainstream agencies. The WMNT Board increasingly recognises the importance of mainstreaming, as shown by the Improvement Plan, which identifies making progress in mainstreaming as one of its ten key priorities for 2003-2004. The health theme has been selected as an early area for work of this nature. However, attention is now being turned to other WMNT themes (for instance, a number of education activities are to be developed, part-funded by local schools). Continued progress in neighbourhood management and SLA development is likely to be made over the coming months.
Summary of Organisational Engagement
8.31. The overall impression from evidence currently available is of some movement in agency commitment and engagement. There is variability amongst NDCs. There is variability too across agencies, some of which, in policing and health, are strongly engaged, whilst others, in the economy and employment fields, less so. The involvement of the LSP is again mixed with some LSPs driving new approaches to

New Deal for Communities: The National Evaluation
Annual Report 2003/4 140
mainstreaming but others being largely inactive. Local authority linkages have improved in extent and scope, though again there is variability amongst authorities and across departments within authorities.
RESOURCE MANAGEMENT
Continuity Funding
8.32. The most common usage of the term mainstreaming is that which refers to ‘continuity funding': the wish or intention to maintain resources for successful projects when NDC funding runs out.
Mainstreaming seems to be generally understood as agencies taking on NDC initiated projects to ensure their sustainability Agencies/authorities "taking over" new initiatives that have been put in place by the NDC. Mainstreaming is defined by the majority of respondents as taking over and funding successful projects.
8.33. Even this apparently widely shared definition conceals different understandings. For
some (often those engaged in project delivery), the acquisition of continuity funding is a means to maintain projects as separate entities run by residents in and for the community. For others, ensuring continuity is about making sure that whilst activities or projects are continued, this is done with the commitment and assurance from mainstream agencies that resources are available. For some NDCs therefore definitions are more about tying down arrangements for mainstreaming from the outset.
Mainstreaming has been built into some projects so that they are initially NDC funded, but an agreement has been reached with mainstream service providers that they will provide continuation funding or will mainstream the service provided by the project after NDC funding has ceased.
8.34. In a different NDC one interviewee saw mainstreaming as
A synonym for sustainability which led him to only support strategies and projects that he knew had a good chance of being funded long term. This meant in the earlier days of this NDC dampening down some of the more ambitious ideas of the community.
Mapping Expenditure
8.35. Despite some evidence that agencies are engaged in mapping spend, detailed commentaries point out some of the difficulties.
A number of partner agencies commented on the difficulties of mapping spending into the NDC area and questioned the value of such exercises, preferring to monitor levels of service delivery and quality. The LNRS identifies that quantifying resources by area has proved difficult for partners but intends to continue with this work. Neighbourhood Services can identify spend by Area Committee and arrangements are being made to supply figures for spend and activity in the NDC area.

New Deal for Communities: The National Evaluation
Annual Report 2003/4 141
Very few mainstream players have actually mapped their spend down to ward level and this is proving to be a key issue for the Trust in attempting to develop a robust baseline and in determining a future delivery strategy for local services.
Bending Expenditure
8.36. There is evidence of spending being bent towards reshaped services in NDC areas. In one NDC:
Slightly over half the agencies involved to some degree had changed their pattern of service delivery in the NDC which is widely viewed as a form of mainstreaming. It is worth stressing that agency involvement in the programme itself has improved over the last year, if from a low base position in some cases. One crude indication of this is that NDC has secured more match funding from its partners. Whereas match only accounted for 25% of spend for years 1 and 2, the percentage has now climbed to 44% of total approvals to date.
8.37. Interviews highlighted a degree of scepticism about resource bending.
Only very limited evidence that mainstream funding to the NDC area had increased. One organisation reported that as its overall funding had actually decreased, its contribution to the NDC had also probably fallen. There have been no substantial changes to funding arrangements, with most contributions to the NDC centring on in-kind support such as officer time and match funding. There is little evidence of main programme spend on NDC activities … although the streetlighting project has generated increased revenue costs which are being met by the City Council. The main focus of the Council to date appears to be on changing patterns of service delivery rather than increasing resources. There is some joint project funding, but more limited evidence of mainstream spend on NDC activities. Resources to the NDC area do not generally seem to have increased and reported changes in delivery patterns are not necessarily NDC related or driven, even where they are helpful or complementary - this is the case with changes in policing. Increases in resources is evident amongst the Police, Jobcentre Plus, the LEA, local authority and social landlords. Other important aspects of mainstreaming such as main programme spend on NDC activities, having a physical presence in the area, and changing patterns of delivery are not occurring. The extent to which mainstreaming is occurring is not yet clear, partly because partners are not working to an agreed definition. What is evident is that the NDC has thus far found it difficult to persuade agencies to bend mainline resources into the NDC area given competing demands upon their resources and existing commitments.

New Deal for Communities: The National Evaluation
Annual Report 2003/4 142
Reverse Mainstreaming
8.38. There were several accusations (again difficult to prove) of ‘reverse mainstreaming’. Tension between the needs of the whole borough or district (especially where many wards are disadvantaged) and those of the NDC, linked with pressures on mainstream budgets, leads to concerns about ‘negative or reverse mainstreaming:
The understandable response by the Council, given the pressure to reduce or limit the growth of its mainstream budgets across the borough, has been to view NDC funds as a means of offsetting reduced core expenditure and protecting existing services. The LEA is undertaking a substantial building programme in the area, but there is concern that NDC money is subsidising this investment. Senior managers see the NDC as another funding stream in which to substitute existing funding. Experiences of mainstreaming therefore have to be put within the context of spending trends and possibilities of money subsidising activities which could have taken place irrespective of the NDC programme.
8.39. There is, however, the perception that much joint work with the local authority and
agencies is occurring and that there is growing mutual interdependence, with NDCs beginning to influence expenditure and local authorities and agencies closer to reviewing spending patterns.
Agreements
8.40. Increasing relationships between NDCs and main programme agencies has begun to highlight the need for formal specification of what can be expected from the mainstream. Whilst NRU guidance has emphasised the importance of SLAs progress has been slow:
‘There is a general absence of service level agreements to identify the services the NDC area is entitled to and to identify whether resources or services are additional or not'.
8.41. Nevertheless in a number of localities SLAs exist including Hammersmith and Fulham, Liverpool, Southwark, Lambeth, Nottingham, Hackney, Middlesbrough, and Walsall. Other NDCs report movement towards SLAs, with encouragement from GOs and/or NRAs.
8.42. In Sheffield a specific agreement, 'Advancing Together', provides a public declaration
of a closer relationship between the Council and the NDC, a package of short term actions to achieve visible improvements, and of long term support to deliver major transformational projects. With this agreement comes a ‘pledge from the Council and the NHS to continue with work already underway and to continue with existing levels of spending on mainstream services. BNDC will not be used to substitute for council funding’.
Joint Planning
8.43. There is movement too towards a clearer understanding of the existence of service plans, or, at most, the emergence of a complementary programme/project planning process:

New Deal for Communities: The National Evaluation
Annual Report 2003/4 143
Bradford: Most agencies interviewed had developed joint projects with Bradford Trident. This reflects the approach taken by the Trident board and programme team which is to develop projects with key agencies and for them to take responsibility for delivery. Such an approach has been taken with Business Link, Police, BCHT and the PCT. Agencies reported that there were ‘healthy tensions’ in this approach with project plans having to be developed in conjunction with Trident and having to take account of community consultation. Brighton: There was agreement amongst the agency respondents that NDC representatives had been involved in joint working initiated by the respective organisation and that the latter had made a positive contribution to the work of the NDC Partnership. There was also agreement that the organisation had been involved in the joint planning of projects and that they had worked to change the way that mainstream services are delivered
8.44. Much of the evidence, however, suggests that joint planning takes place in relation to projects rather than whole programmes of delivery. Agencies, whether working in isolation, or within an LSP joint structure, are generally unwilling or unable to take their planning processes down to the level of an NDC which tend to be too small an area for realistic planning processes. Projects to be undertaken in NDC areas as joint work with the NDC are acceptable but service planning and reshaping needs may need to be considered at a larger spatial scales.
RESHAPING MAINSTREAM SERVICE AREAS
Reshaping Services
8.45. Assuring continuity funding for NDC projects remains the main thrust of mainstreaming. Many NDCs, however, have increasingly moved beyond the forward funding definition to see mainstreaming as the use of NDC funding and activity to reshape services. This creates new challenges:
As (NDC) has launched its own projects, this has created some tension and lack of clarity about its role: is (NDC) a service provider in its own right or a co-ordinator to guide and broker improvements of others’ services, only stepping in to fill gaps when there is no possibility at all of mainstream agency involvement? NDC needs to influence the way providers deliver services locally, rather than simply focusing on NDC resources to provide or buy in all of the services for the NDC area. NDC is a pilot and ‘demonstrator’ for the wider adoption of new innovative delivery across a wider area. NDC provides something extra, new and different over and above what is usually provided, and over time, some aspects of this additional provision will become embodied in mainstream services
8.46. This process involves increased reference to engaging residents and making service
planning and delivery more locally responsive:
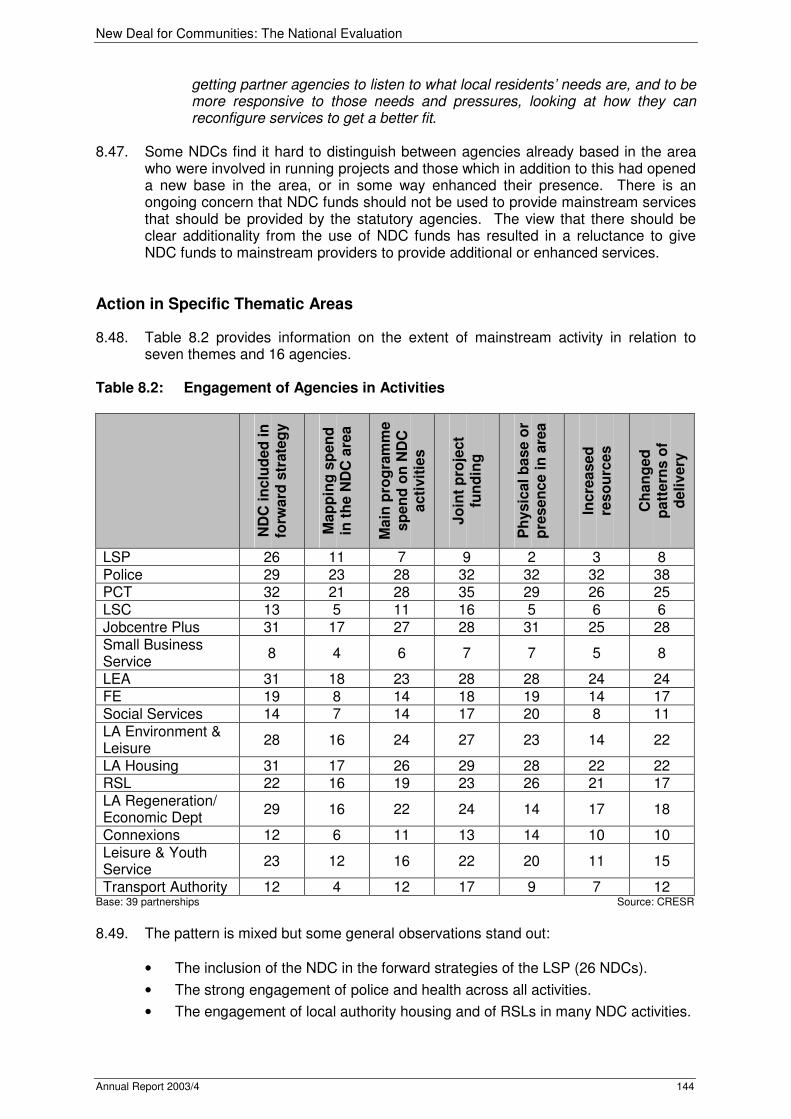
New Deal for Communities: The National Evaluation
Annual Report 2003/4 144
getting partner agencies to listen to what local residents’ needs are, and to be more responsive to those needs and pressures, looking at how they can reconfigure services to get a better fit.
8.47. Some NDCs find it hard to distinguish between agencies already based in the area
who were involved in running projects and those which in addition to this had opened a new base in the area, or in some way enhanced their presence. There is an ongoing concern that NDC funds should not be used to provide mainstream services that should be provided by the statutory agencies. The view that there should be clear additionality from the use of NDC funds has resulted in a reluctance to give NDC funds to mainstream providers to provide additional or enhanced services.
Action in Specific Thematic Areas
8.48. Table 8.2 provides information on the extent of mainstream activity in relation to seven themes and 16 agencies.
Table 8.2: Engagement of Agencies in Activities
Base: 39 partnerships Source: CRESR 8.49. The pattern is mixed but some general observations stand out:
• The inclusion of the NDC in the forward strategies of the LSP (26 NDCs).
• The strong engagement of police and health across all activities.
• The engagement of local authority housing and of RSLs in many NDC activities.
ND
C i
nclu
ded
in
fo
rward
str
ate
gy
Map
pin
g s
pen
d
in t
he N
DC
are
a
Main
pro
gra
mm
e
sp
en
d o
n N
DC
acti
vit
ies
Jo
int
pro
ject
fun
din
g
Ph
ysic
al b
ase o
r p
resen
ce i
n a
rea
Incre
ased
re
so
urc
es
Ch
an
ged
p
att
ern
s o
f d
eli
very
LSP 26 11 7 9 2 3 8 Police 29 23 28 32 32 32 38 PCT 32 21 28 35 29 26 25 LSC 13 5 11 16 5 6 6 Jobcentre Plus 31 17 27 28 31 25 28 Small Business Service
8 4 6 7 7 5 8
LEA 31 18 23 28 28 24 24 FE 19 8 14 18 19 14 17 Social Services 14 7 14 17 20 8 11 LA Environment & Leisure
28 16 24 27 23 14 22
LA Housing 31 17 26 29 28 22 22 RSL 22 16 19 23 26 21 17 LA Regeneration/ Economic Dept
29 16 22 24 14 17 18
Connexions 12 6 11 13 14 10 10 Leisure & Youth Service
23 12 16 22 20 11 15
Transport Authority 12 4 12 17 9 7 12
New Deal for Communities: The National Evaluation
Annual Report 2003/4 145
• The lesser presence of the Small Business Service, Social Services, Connexions, the Learning and Skills Council, and the Local Transport Authority.
• The high incidence of changes in patterns of service delivery by the police (38 NDCs).
• The extent of joint funding by health authorities (35 NDCs).
• Widespread inclusion of the NDC in forward strategies (with the exception of LSC, Connexions, SBS).
• Modest progress on mapping spend.
• Many agencies having a physical base/presence in the area, (with the exception again of economic/employment agencies).
• And a number of agencies increasing their spending and again many (with the exception of RSLs) changing patterns of delivery.
8.50. It should also be noted that there were differences between groups interviewed. In
one local report the evaluators ‘were struck by the variations in the response which revealed the limited knowledge of many Board members about the engagement of service providers’. Another local report noted that:
There were also some stark differences of opinions between senior managers on whether particular agencies were engaged ....occasionally Board and senior manager views contrasted starkly with some opinions expressed by the agencies themselves, who in general were more positive than Directors or senior managers.
Health
8.51. There appear to be relatively strong links between NDCs and health organisations. 31 NDCs are said to be represented in health structures; In 29 the NDC is included in forward planning in health; in 35 there is joint project funding; in 29 there is a physical presence in the area; in 25 there have been changed patterns of delivery. Most interestingly, in health there are 28 NDCs where there is claimed to be main programme spend and 26 where there are increased levels of spending.
The PCT was mentioned by several respondents as an example of an agency which is committed to mainstreaming, but this was thought to be primarily because of its more diverse nature and its lack of baggage from previous experience, unlike other more established agencies which have much more unified structure and practices.
8.52. Examples of good practice range from the general (examples of collaboration and
joint working) to the particular (support for improved delivery through GP surgeries, capital investment and related long-term commitment to revenue based provision).
Sandwell: Health work in Greets Green provides an exemplary approach to mainstreaming, with progress on strategy, funding, practice and policy, and clear evidence of mainstream practice shifting as a result of engagement with and experience of NDC working. Mainstream funding is committed for enhanced nursing. Following restructuring of the PCT a new post of Neighbourhood Health Manager has been created jointly funded by PCT/NDC and a neighbourhood health management team has been set up Hull: Long-term commitment is being secured through the Minor Injuries Unit to be established in the Village Centre.

New Deal for Communities: The National Evaluation
Annual Report 2003/4 146
In Tower Hamlets the PCT is making substantial investment (around £500,000) in the forthcoming health centre. Social Services showing signs of rethinking its relationship with NDC. Despite the many entangled difficulties over the search for premises the conversion work is now in progress, with plans to open for business early in 2004. This will enable a major shift in the way health and care services are delivered in the area. It will provide an accessible physical base for a range of services supported by NDC and its partners, linked to the Independent Living Network. In Lewisham there is an excellent relationship with the Primary Care Trust – the chair is a member of the Board – and its Development Manager helped to manage the Health Impact Assessment and is closely involved with the Theme Group and a number of projects. The NDC’s original Delivery Plan included a Healthy Living Centre as a key resource to supply a wide range of healthcare and leisure facilities to meet the service gaps in the area. However, the planning for this facility lacked a realistic timescale and, although capital costs would be financed by the NDC, it did not have a sustainable revenue source identified. The Partnership has been helped by an experienced NRA and has moved to commission a definitive feasibility study. The PCT is positioned as a key partner to help configure this project. The NDC has prioritised a number of health services, particularly sexual health, mental illness and better nutrition, that are also priority themes for the PCT.
Case study: Health West Middlesbrough Neighbourhood Trust (WMNT) Health activity:
• WMNT recruited and trained two local BME residents to provide health mentoring to other members of WMNT’s BME community. This was a pilot project, which ended in March 2003. One of the Health Mentors has now been employed by the PCT for five hours per week, providing a similar mentoring service to BME communities across Middlesbrough.
• Community Involvement Health Co-ordinator has set up a number of health activity groups, such as Active for Life and walking networks.
• Classes for weight management and smoking cessation have been developed, with local residents training as health mentors.
• The Home Office-funded drug reduction pilot project provides local support for people with addictions and has helped to change local attitudes towards drug use.
• Six SLAs have been put in place with health providers to deliver various local health services (e.g. Substance Misuse Counsellor, Child Psychologist, School Nursing Sister).
Re-organisation of structures within WMNT has occurred with the formation of Theme Sub-Groups, whose role is to consider proposed projects, support Theme Managers in developing strategies, and monitor impacts. The PCT’s Director of Health Improvement and Public Health (who is also the PCT representative on the WMNT Board) chairs the new Health Theme Sub-Group. Working with the mainstream With some jointly funded projects between WMNT and the PCT, progress has been made towards having some of WMNT’s local health projects built into mainstream service provision. The former Health Theme Manager pump primed a number of local services using NDC funding for 6-month pilot periods. The PCT then agreed to take on successful

New Deal for Communities: The National Evaluation
Annual Report 2003/4 147
services (i.e. those that had a high uptake), such as a chiropody clinic run in a local community centre, running them as part of mainstream provision. A more recent example of a mainstreamed project is the BME Health Mentors Project. A number of services originally developed by the Health Team have since been handed over to mainstream providers. For instance, the Reducing Drugs and Alcohol project set up a drop-in service for young people affected by drugs. Middlesbrough Youth Service is now running the drop-in, and its focus has broadened to include unemployment and other issues as well as drugs. In addition, a Trainee Drug Outreach Worker employed by WMNT on the Reducing Drugs and Alcohol project is to become part of a new Youth Team being set up by the Youth Service in West Middlesbrough as part of the Youth Services SLA. Barriers and Drivers A number of factors have contributed to the positive steps towards mainstreaming in health. When the previous Health Manager left in March 2003, the PCT took over management of the health theme as an interim measure. However, it has now been decided that the PCT will continue to lead the theme. The increased PCT involvement appears to be seen by both WMNT and the PCT as a positive move, as it will mean that the Health Team is likely to become more embedded in mainstream health structures previously. One PCT staff member stated that ‘mainstreaming is the future as it is the only way that the PCT will be able to engage with WMNT and its health team’. SLA development has been an important process in encouraging the WMNT Theme Managers and other staff to engage more fully with their respective partner agencies. An officer of GONE was particularly impressed by the PCT’s increasing role in the health theme and apparent commitment to changing service delivery in West Middlesbrough, which he felt had already led to ‘demonstrable improvements’ in local health services. SLAs have been developed by the Health Team, with Middlesbrough PCT, and with Tees and North Yorkshire NHS Trust.
Crime and Disorder
8.53. Police engagement runs at high levels, and in virtually all NDCs there is appreciation of such strong commitment and engagement.
Brighton: changes are most apparent in terms of the police and the local authority community safety team. The extent and positive impact of joint working between eb4U, the police, and the local authority to tackle crime and disorder was seen by several consultees as the level to which the others should aspire. Hull: The police are one of the best examples of co-operation and mainstreaming. As a direct result of PRNDC they have agreed to a long-term commitment on the estate through building a local office on the Village Centre site.
8.54. The 39 2003/04 evaluation reports point to a number of levels of engagement:
strategic, additional policing, senior officer presence on the Partnership Board, and increased local presence in the area:
Coventry: Police have provided general support to the NDC, both strategically and in the task groups, and specifically through various crime projects. They have also been responsive to NDC projects which have uncovered unreported crimes and anti-social behaviour, by diverting resources into the area.

New Deal for Communities: The National Evaluation
Annual Report 2003/4 148
Bristol: The police and Community at Heart have come to an arrangement over the management of local police resources and the introduction of wardens in the area. The police have put more resources into the area and have accepted the experimental notion of an area-dedicated team for the New Deal area. It is not clear whether this is a working model that could be used across the Bristol area although the police have introduced a dedicated team for St Pauls (to the west of the New Deal area). Wolverhampton: In response to an identified need to tackle prostitution in the area, and kick started by an NDC funded police constable, a police team was established to tackle vice. The NDC post has been matched by four further officers redeployed from existing resources and the CDRP has established a prostitution task group. With the Home Office Crime Fighting Team, comprising 12 constables and a sergeant, this means NDC has 17 extra police plus 1 funded by NDC. Luton: Partnership working between the Trust, the Safer Luton Partnership and the police has demonstrated the value of co-operation in delivering the Reducing Burglary Project which has entailed visits to all homes in the NDC area, a detailed security check and the subsequent fitting of appropriate equipment. This has proved to be successful in reaching the wider community in terms of raising awareness of crime issues and in going some way to dealing with the fear of crime issue. Tower Hamlets: Community Safety partnership working has been effective, particularly linked to Neighbourhood Wardens and drugs prevention work, but resource problems and London-wide demands may have limited the police’s response to mainstreaming so far. The council is keen to work with NDC in a new borough-wide approach to anti-social behaviour. Hammersmith and Fulham: The involvement of the police in the NDC has been seen in a very positive light since its inception and the local team is very well regarded as providing a specific service to the NDC area. The project is jointly funded between the NDC and police main programme funds and there has been an effort by the police to ensure the team is always at full strength. The impact of the team appears to be supported by the crime statistics for the area compared to those for the division as a whole and it will be interesting to see if any lesson can be taken from this project to affect the normal policing throughout the division.
8.55. Policing is not universally unproblematic, however. There are observations about the vulnerability of police engagement to external pressures on resources, and the possible threat to long term presence and service change. In one NDC:
The police had previously joint-funded a project with the NDC Partnership to put extra police hours into the NDC area. Changes in local policing over the last year as a result of the Force Change Programme has meant that the COPS Area 1 Team has been increasingly under-resourced, and it has therefore been unable to maintain its former close relationship with the NDC (with which it shares an office base). This situation has been exacerbated by personnel changes, with the COPS Inspector leaving his post and the NDC Community Safety Theme Manager being on long-term sick leave this year.
Worklessness
8.56. Worklessness provides an example where a clear expression of national policy and dedicated resources have pushed forward changes in service delivery. Jobcentre

New Deal for Communities: The National Evaluation
Annual Report 2003/4 149
Plus managers are directed to engage with NDCs as a result of dedicated local resources. The result has been a more targeted response in NDC areas, seconded staff and widespread appreciation of the engagement of Jobcentre Plus.
Norwich: Without exception, respondents identified Jobcentre Plus as the agency which was most engaged in helping NELM to deliver its strategy Sheffield: Jobcentre Plus is also playing a critical role in mainstreaming services. The District Manager is keen to increase the level of resources into Burngreave, and there is some evidence to suggest that they feel that they ‘are not being sufficiently challenged’ around issues of resource allocation. Coventry: Jobcentre Plus remains fully committed to the NDC through the impetus provided by the strategic guidance and extra funding to the DWP. The main Jobcentre Plus representative is co-funded by the NDC. An outreach worker attends the NDC once a week and there is a fulltime secondee at the NDC. Hull: PRNDC has two secondees from the Jobcentre Plus which has proved very beneficial. There are close links between PRNDC and Business Start-Up. Private sector shopping units are being provided and have already attracted a probable investor. Bradford: In the Jobs and Business theme of the Programme, strong links have been developed with Jobcentre Plus and Business Link. Both organisations were delivering Trident funded projects, with some funding coming from other regeneration programmes (for example European Structural Funds). This has enhanced the provision of mainstream services in the area.
8.57. There are, however, difficulties in reconciling some of Jobcentre Plus national targets
and commitment to a wider geographical area than the NDC. The local Haringey case study illustrates some of the issues which can emerge. It should be stressed that this reflects the situation in early 2004.
Case Study: Employment Haringey Seven Sisters, Haringey Employment Activity
• From national sources, there is a budget for (each) NDC of £50k covering staff costs and non-staff costs (e.g. job fairs), in addition to normal main programme spend. The latter comes through the Department of Work and Pensions (DWP) Neighbourhoods Team.
• Outreach workers are being used to target specific groups (asylum seekers, lone parents) to get as many as possible on to training schemes. The previous focus had been around issues of childcare, now it is on training.
• Jobcentre Plus staff levels have actually reduced in the NDC area from a previous two secondees to only one in place. There is not an Enterprise Manager in place.
• The NDC is in one of the most severely deprived wards in the borough. All are allocated additional Jobcentre Plus points if they can successfully target difficult to place groups from the ‘deprived’ priority areas. National rules for Jobcentre Plus inhibit the prioritisation of NDC areas, except to the extent that residents comply with criteria.
• Job fairs have been funded 50/50 (Jobcentre Plus and NDC); one event Jobcentre Plus provided 15 advisers. Local schools and community centres have been used to

New Deal for Communities: The National Evaluation
Annual Report 2003/4 150
provide Jobcentre Plus open days and Breakfast Clubs.
Working with the mainstream The relationship between NDC and Jobcentre Plus/DWP is complicated. The theme group want projects delivered by local service providers, although there is a concern, seemingly well founded, that Jobcentre Plus does not have faith in local agencies’ ability to deliver. Bending the main programme should be straightforward because there is a Service Level Agreement in place, which clearly sets out aims and objectives. However, some Jobcentre Plus staff feel that when attempts have been made to bend mainstream programmes into the NDC (Stansted Runway to Work, GWINTO – Training in the Gas and Water Industry, Telesales training), the theme group has put obstacles in the way, with the consequence that service providers have been put off. A Jobcentre Plus view was that good relationships built up with service providers have been damaged by working with the NDC. It was also argued that it was becoming increasingly difficult to convince Senior Management of the benefits of working with the NDC. Most concern within the Haringey NDC Partnership has been expressed regarding the perceived lack of progress with the worklessness agenda. A report produced by an NRA, this year for the NDC stated, “there are concerns regarding the functioning of the employment Theme Group and the ability of the DWP to deliver mainstream interventions”. If there is additionality it is because Jobcentre Plus secondees have been placed with the NDC, and the Haringey Manager sits on the Partnership Board. Job fairs have taken place but these also happen in the other priority areas (as does the secondment of staff to other area based initiatives e.g. Northumberland Park). DWP/Jobcentre Plus, however, have a plethora of employment schemes across the borough, and are committed to working in partnership. They have been involved in the borough wide employment partnership and are currently going through the process of reviewing and agreeing the Haringey Employment Strategy. The Strategy highlights how it will work in partnership with a number of different agencies within the council, the PCT, educational institutions, private sector service providers, and various ABIs (SRB, SureStart).
Business Development
8.58. Qualitative data suggests relatively little in the way of active NDC engagement with economic development or business support. Experience has proved mixed:
Tower Hamlets: Some initial steps have been taken to develop a dialogue with local businesses, through targeted consultations and the creation of a local Business Association, but feedback suggests levels of anxiety and uncertainty among the relatively small group of local traders, particularly with regard to the housing programme. The lack of collective awareness of Small Business Service activity is telling and suggests there is more work to be done to build partnership with local small firms and with bigger employers near Ocean and to maximise local potential.
8.59. The Bristol case-study provides some insight into issues confronting business
development.

New Deal for Communities: The National Evaluation
Annual Report 2003/4 151
Case Study: Business Development Bristol: Community at Heart Activity in Business development:
• A small business project (£230,000 over three years) provides business advice and development as well as £36,000 on a micro-finance initiative to support business development; provided by an external agency BEST (Bristol East Side Traders) which is to apply for a further £500,000 for continuation.
• On top of this there is a raft of private sector business support. e.g. secondments, mentoring in schools, etc. but little of this is directed directly to business development,
In practice, service delivery to disadvantaged entrepreneurs is achieved through a raft of smaller agencies working in the city with whom Business Links has developed a relationship on Objective 2 projects: these include Bristol Area Community Enterprise Network (BRAVE); Bristol Enterprise Development Fund (BEDF); Bristol East Side Traders (BEST); Business Match (based in the local authority’s business support team); The Co-operative Development Agency (CDA); The Centre for Employment and Enterprise Development (CEED); Community Services Volunteers (CSV) Avon Training Ltd; East Bristol Enterprise (EBE); and Knowle West Development Trust (KWDT). All this comes under the Bristol Means Business project that is targeted at Objective 2 areas (the NDC is within the Objective 2 area). The feature of this partnership is that each organisation has its own area of expertise. Thus CEED tends to specialise in helping enterprise in the black community whilst the CSV specialises in advice to anyone wanting to set up a co-op. The NDC is only indirectly involved through BEST (which provides the business support service funded through the NDC). Working with the Mainstream In theory the basic mainstream ‘resource’ for business development within Bristol as a whole comes from:
• Business West/Small Business Service with much of the social inclusion expenditure (around £1.2 million p.a) coming from EU Objective 2 funding.
• The EDO of the local authority (annual budget c £400,000) does not have a particular officer dedicated to the NDC area; instead officers work within three broad teams: North, South and Central. It is estimated that 5 (of 18) officers have worked in some way on the NDC.
• The RDA is in a position to influence business development, but, despite meetings, there has been little concrete progress in relation to how the RDA will engage with the New Deal area.
Neither EDO nor Business West has a dedicated officer for the NDC area. The EDO works in three broad area teams that look at all neighbourhood renewal areas in their zone. Business West has an officer to co-ordinate the Bristol Means Business project. BEST (as agency proxy for Business West) has two dedicated staff on the ground (each at 0.8 FTE) who manage business advice and business development. However despite this Business Links has adopted outreach workers to offer business advice as a response to the neighbourhood agenda. This is for peripheral estates (such as Southmead) rather than for inner city areas and is funded out of Objective 2 monies. Barriers and Drivers The EDO is inhibited by the need to demonstrate impact across all neighbourhood renewal areas (of which the NDC is only one) and by a project development culture. Thus EDO officers state that the NDC area has an infrastructure in place for dealing with their issues (along with some funding): it is not for the local authority to continue to be pro-active (after high levels of early involvement and continued engagement in specific projects such as
New Deal for Communities: The National Evaluation
Annual Report 2003/4 152
Church Road re-development). The difficulties for Business Links in working with the NDC seem to be a shortage of time and staff resources to get involved, together with early failures of attempts to contact the NDC, and with the dominance of performance targets. Business Links recorded the difficulty of meeting both a social inclusion agenda and general business support function where key targets relate to the number of businesses seen, the increase in productivity (of businesses in general) and customer satisfaction from service users. Where Business Links organisations had failed to meet any one of these targets they have lost their contract from the SBS. The current social inclusion agenda is funded through time-limited EU funds. The local authority is committed to a neighbourhood renewal agenda across the city but thinks that the NDC has a certain infrastructure to deal with the issues it has chosen. Over the past 2 years the EDO has put forward projects that have subsequently been refused funding by the NDC Board. The EDO is currently working primarily with the second tier of NR areas where there is little or no business support. The current position is that the EDO will assist the NDC team when they are asked but they do not have the time or resources to be pro-active within the NDC area when other neighbourhood renewal areas have no business support infrastructure.
Education
8.60. Local Education Authority presence in NDC working often appears to be strong. In 31 cases the NDC is included in the forward learning strategy, 28 NDCs are included in joint project funding, 28 also have a presence in the area. In more than 20 NDCs there are claims of increased spending and changes in patterns of delivery. This may be because in many schools in NDC areas achievement levels have been low and the LEA is targeting its efforts on supporting struggling schools.
Sandwell: In relation to education, there is now explicit mainstream engagement with George Salter school and non NDC resources are mobilised to support improvement, to which the NDC is adding its own resources for community based work rather than in school work. Middlesbrough: The WMNT Education Zone has developed close links with the Local Education Authority. The Education Theme Manager attends Sure Start Local and Middlesbrough Sure Start Partnerships, the 14-19 years area-wide partnership, and Head Teachers and Early Years Officer Groups. WMNT is also mentioned in a new proposal submitted by the LEA for local Children’s Centres (a Centre is to be established in Whinney Banks Primary School). The LEA is mapping its spend on all schools in the NDC area. The LEA also provides 25% of the funding for Classroom Assistants in primary schools in the NDC area, with WMNT paying 75%. Lewisham: Deptford Green secondary school and the area’s primary schools are extensively involved with the NDC which is funding a wide range of supplementary services in the schools. These include community support workers, truancy and pupil advocacy services, educational trips and a driving skills project. The 3 primary schools in the area have formed a consortium to bid for external funding and other support (the “Triangle Schools”) that has been helped by the level of NDC supported activity in all three schools. The NDC has begun to develop links with Haberdasher Aske’s school to help develop higher attainment in the area’s primary schools. Proposers of the new Crossways Academy which will be developed on a former school site on the NDC’s boundary have shown a great deal of enthusiasm for involvement with the NDC and its new principal has joined the education theme group.

New Deal for Communities: The National Evaluation
Annual Report 2003/4 153
Lewisham College is also becoming closely involved, particularly through a family learning service piloted during the year which aims to attract adults into learning, to improve basic skills and to help children with homework. The College is also collaborating with the NDC and Borough in a Tutor Development Project which aims to increase the numbers of basic skills tutors in the area.
8.61. However there can be tensions between NDCs and local schools. Schools can see
additional NDC funded nursery facilities as either in competition with themselves or as unnecessary. Elsewhere schools and LEAs are subject to pressures to improve mainstream provision and standards. This should have a pay off for residents of NDC areas in due course. In the meantime such scrutiny may inhibit direct collaboration with the NDC:
Bristol: The local education authority has come through its Ofsted ordeal but lost key staff that had been taking forward its education and regeneration agenda. There is sometimes a lack of dialogue and apparent interest. This has become more complicated since the only secondary school has successfully opted out of the LEA to become a City Academy, although the relationship between the City Academy and the New Deal is strong. The main vehicle of mainstream working in the area in education comes through the Education Action Zone team that is itself a time-limited organisation.
Case Study: Education Coventry Activity in Education Projects have been initiated through the NDC’s education task group. These are three-year projects where mainstreaming discussions will occur towards their end. Projects include:
• The parental outreach service giving support to parents and children with special needs.
• Childcare expansion team to increase the number of childminders in the area thus creating opportunities for a career in childminding.
• Outreach workers designed to reduce exclusions and improve attendance at local schools.
• Learning mentors intended to help overcome barriers to learning in schools and raise achievement through pastoral care.
• The Lets Create project promotes art and creativity at four local schools.
• The Children’s Resource Centre offers a local venue from which play resources can be borrowed; it hosts courses and training for parents.
• The LEA has two large school building programmes in the NDC area, an investment of around £4 million, which is being run through the education budget; NDC funding is going alongside to create better services and facilities for the residents of the area.
Working with the mainstream Senior managers from the LEA believe that the organisation has bent significant resources into the NDC area, which means less for other disadvantaged areas in the city. In this sense, investment into the area is greater than would have been the case without the NDC. There is also strong senior management commitment from the LEA in supporting the NDC Board, which is not recorded as mainstreaming, but which takes up time. There has been no significant discussion of changing service delivery, beyond the Early Years and community centres. The LEA has been a recipient of NDC funding through the implementation of an extensive range of projects, such as learning mentors. There have been no significant changes in staffing levels arising from NDC activities. Increases that
New Deal for Communities: The National Evaluation
Annual Report 2003/4 154
have arisen from NDC projects, such as learning mentors and parent link workers, have been modest. Barriers and Drivers The existence of the NDC presented an opportunity to say to the local community that the LEA can develop something that will better meet the needs of the area by adding NDC funding to the school building programme. NDC money has therefore allowed some community aspirations to complement existing LEA commitments. In the opinion of a senior LEA manager, the school building programme can to some extent provide the “seed corn” for starting to think differently about services that are provided in schools and subsequently spreading best practice. Within the context of education, this means bringing multi-agency teams and services together under the umbrella of ‘extended schools’ provision. This requires dialogue and engagement from the start rather than having services and projects bolted on at some later stage. However, LEA funding is ‘hypothecated' which leaves little flexibility for innovation.
Housing, Environment and Neighbourhood Management
8.62. Housing is critical to many NDC programmes. Elements of some housing programmes can however remain unresolved. This is because major capital work is often required, there needs to be major consultation around housing change, and because housing has been an important and cherished local government function (professionally and politically) which many local authorities seek to protect.
NDC Housing Policies: Tensions in Implementation
• Housing renewal raises fundamental questions about the future of the neighbourhood, the nature of the local housing market, changes in tenure mix, and potential for in and out migration from the area.
• Housing proposals require extensive and properly conducted community consultation
• Housing change may involve considerable capital investment so that it is difficult in terms of strategy, spend and politics to change course once started.
• In some areas new national initiatives (especially Housing Market Renewal Pathfinders) have been introduced into already complex local situations, further complicating and sometimes delaying progress.
• The context is hugely complex in terms of policies, institutions, partners and end users. There may be several registered social landlords (RSLs) with holdings in the area, as well as owner occupiers and private landlords most of whom have some say in the action even if only to delay implementation of changes.
• Problems are often much larger than resources available to tackle them, dictating both what can be done, and when.
• In many NDCs, the local authority has been receptive with the NDC featuring in the capital programme; but local authority housing plans have their own priorities, and their own (limited) resources.
• There is often a lack of capacity in relation to planning, project management and technical skills required for complex housing renewal issues (e.g. handling CPOs).
8.63. Main programme involvement in NDC activities can be grouped under three main
heads: strategic planning and major capital programmes; housing management; and environmental/ neighbourhood management.
• Strategic planning and major capital programmes

New Deal for Communities: The National Evaluation
Annual Report 2003/4 155
Bristol: there has been progress on mainstreaming with the signing of a memorandum of understanding between the local authority and Community at Heart. The local authority has assigned an officer to manage the relationship and some progress has been made in outlining a series of options for the re-development of local authority housing in the area. However problems and delays associated with public consultation along with a well organised resistance to current options has delayed physical progress on the ground.
Brent: the Housing Department has played a full role in supporting and facilitating plans for physical renewal, including the commitment of significant staff resources to South Kilburn NDC’s office to manage the programme from there. Hammersmith and Fulham: the housing department has seen the NDC as a “test bed” and has been able to learn from the structure of the Board when planning the ALMO (Arms Length Management Organisation) that will take over housing management responsibility.
• Housing management
Southwark: the Council’s local housing management function has been re-jigged to provide a local housing manager based on the Estate. This more tailored arrangement has improved engagement with the Partnership and led to the joint funding of a small project Hull: PRNDC is involving a RSL in developing a small estate, which will include bungalows that have been identified as a need for the area.
• Environmental/neighbourhood management
Knowsley Council is using North Huyton as a pilot for borough-wide Neighbourhood Management, building on the existing North Huyton Neighbourhood Agreement and a working group comprising residents, officers from KMBC, the police, the NDC Neighbourhood Action Team, and Knowsley Housing Trust. KMBC has allocated designated officers from Environmental and Operational Services to North Huyton and established a service co-ordinators group. An important development has been the joint appointment by KMBC and the NDC of a Neighbourhood Manager. KMBC has also seconded a senior officer to lead on the implementation of the housing Masterplan.
Lewisham: Eckington Green refurbishment and the area lighting programme have been successfully delivered with the Borough Council. Improvements to the housing stock in the area rely extensively on the Borough’s Housing Department and Hyde Housing. The major redevelopment and refurbishment scheme at Kender is a good symbolic indication of things “happening in the area”, although the NDC has had a relatively limited involvement. The NDC is therefore in the relatively privileged position of influencing the development activities of other agencies, rather than trying to redevelop housing stock itself.
Case study: Housing Kensington Regeneration, Liverpool (KNDC) Housing activity

New Deal for Communities: The National Evaluation
Annual Report 2003/4 156
KNDC’s housing programme, amounting to over £200 million public and private sector investment, is set in the context of Liverpool City Council (LCC)’s Housing Strategy in which the city’s inner core is a priority. The housing strategy seeks to make closer links between housing programmes and neighbourhood renewal, and the NDC area, one of six designated priority housing renewal areas, also lies within the HMRI Pathfinder area. At the same time, the council has been developing a new Neighbourhood Management Service bringing together locally based services. Working with the mainstream The main delivery agent is Community 7 (C7), a community-based association set up to improve social housing within the KNDC area. It is a subsidiary of Riverside Housing Association, which in effect, means that C7 is bending additional Riverside resources into the area. For the other dozen RSLs with holdings in Kensington there are both push and pull factors affecting their decisions about spend, for example if their stock is in neighbourhoods that could be due for clearance. KNDC Housing Strategy has a potential total ceiling of £37m supported by mainstream funding from a range of partners (LCC, EP, private sector, NWDA, C7, Housing Corporation), bringing the (as yet not totally confirmed) amount to £185m. Public sector leverage is £95m, including £38m from the City Council, and £54m from private sector. More Housing Corporation main programme funding is going into the area than if there had not been an NDC, but the HC’s own remit means that it has to be channelled to RSLs via C7. There has been a shift away from housing for rent to combining this with housing for sale. The fact that there are now more agencies involved should also help towards an effective forward strategy. It is difficult for the NDC to engage with private landlords, especially the smaller ones. Little is likely to happen until there is legislation (pending) to bring in licensing. LCC has been piloting a voluntary landlord accreditation scheme and a registration scheme for HMOs in Kensington. The local authority has to enforce the scheme. Kensington NDC area is being used as a proving ground for the accreditation and registration schemes with a view to their roll-out across the LCC and HMRI area. LCC has a key role in delivering KNDC’s physical programme, is responsible for the development and delivery of its own Housing Strategy and Investment, the HMRI and Neighbourhood Management Services, and is responsible for delivering the private sector housing strategy which is very significant for KNDC, because it encompasses the NR Assessment work and financial packages that can be offered to home owners. Barriers and Drivers A barrier to effective delivery of the housing strategy is that there is no single body in the lead, no clear ownership of the strategy, and some lack of capacity in the three organisations – LCC, KNDC and Community 7 (e.g. lack of project management skills/resource, lack of effective overall control and budgetary management, absence of risk management). An additional challenge is that partnership working between NDC and C7, the Housing Corporation and LCC has taken a long time to develop: getting partner commitment to stick to collective decisions in the face of individual stakeholder interests. The onus was on NDC to lay out the way the programme should unfold and the responsibilities of partners but this was not easy with partners over whom NDC has no power, particularly LCC which is the NDC Accountable Body. An additional complicating factor has been staff turnover in the council Housing Directorate so that new relationships keep having to be forged as new people come in with different ideas. A driver is that there is greater clarity about the respective roles of KNDC, LCC and C7. The City Council has put its commitments in writing, and an agreement has been reached that C7 will deliver neighbourhood management and use NDC funding to employ the manager and wardens.

New Deal for Communities: The National Evaluation
Annual Report 2003/4 157
Case Study: Neighbourhood Management Liverpool Kensington Regeneration Neighbourhood Management activity Neighbourhood management activities to date are limited, since devolved working has only recently been established. In June 2003, KNDC agreed that Community 7 (C7), the community-based housing association created as part of the NDC programme, should deliver improved housing and neighbourhood services in the area. After some deliberation, the Board agreed to delegate approval of funding for the appointment of a Neighbourhood Manager and Warden Team to the relevant NDC sub-committee. C7 were asked to recruit and manage the Neighbourhood Manager and Wardens supported by KNDC funding. The priorities for neighbourhood management in the first year included housing management of social tenancies, developing an antisocial behaviour strategy, street cleaning, lighting and maintenance, wardens, and a number of environmental services. Some of these activities are directly managed from C7 resources, such as management of social housing and responses to anti-social behaviour. For others, it is necessary to influence the quality or quantity of services through agreements or contracts with agencies directly responsible for them. The Neighbourhood Manager is responsible for managing a multidisciplinary team including Environmental Health Officers, Housing Management staff, maintenance officers, private sector renewal staff and 12 Wardens. Working with the mainstream The wider context is the City Council’s plan to devolve delivery of housing and neighbourhood services to more local areas, mainly with LCC as the driving force. KNDC Board members saw this as requiring Liverpool City Council (LCC) to combine a delivery and policing role. They were concerned to establish neighbourhood management in a way that maximised local accountability, acknowledging that LCC would inevitably be the main service provider. KNDC is putting in £219,000 p.a. for 7 years and C7, £100,000 p.a. for 9 years. The assumption is that it will be possible to trim back after 7 years, but there is also awareness that there would probably then be a need to raise funding from other sources. Although LCC is funding neighbourhood management in other places and is contributing here through seconded staff and service delivery, the Neighbourhood Warden scheme is particular to Kensington because it was such a priority for residents. KNDC and C7 adopted a model of neighbourhood management based upon that of INCLUDE, the pilot scheme in Liverpool recognised nationally as a model of good practice. In addition lessons from the national Neighbourhood Management pilots have been studied. LCC has a statutory responsibility for many of the key environmental functions and has established a long-term relationship with a private sector joint venture partner for street cleansing, highway maintenance, including street lighting and green space, including parks. The intention is that economies of scale will ensure delivery to an agreed standard at the same time as allowing for long term re-investment. Barriers and Drivers In one way, the Neighbourhood Manager needs to see his job as making the Council do its job, and that agents LCC has contracted do theirs. The view is that, if this happens, it would bend the mainstream in real terms because services will be delivered to standards that should be, but currently are not, in place. The Neighbourhood Manager should identify waste and overlaps, thereby making services more efficient, but will also find gaps that need filling. At present, C7, the Wardens and the EHOs are all located in different offices. Co-location is planned and is seen as essential for cross fertilisation and engendering a better corporate culture.

New Deal for Communities: The National Evaluation
Annual Report 2003/4 158
Case study: Environment West Middlesbrough Neighbourhood Trust (WMNT) Environment activity
• The Carter Park project (£200,000 to develop the site of a former blind school into a park) has faced difficulties with the preferred supplier of environmental improvements proving unsatisfactory to residents. Hence a need arose to terminate the contract and develop an alternative approach to environmental work which more closely involved the borough council.
• Community Caretakers and Street Wardens (part of WMNT’s community safety theme) who patrol the NDC area and tackle environmental problems such as fly-tipping and abandoned cars.
• Recent projects include an all weather pitch, the creation of new parking facilities, and an area-wide clean up.
• Framework for a WMNT Environmental Improvements Strategy, with the aim of providing a more structured approach to WMNT’s environmental improvement work.
• A “Housing and the Living Environment Theme” Sub-Group was set up towards the end of 2003, to consider proposed projects, lend strategic support to the Theme Manager, and monitor impacts.
Working with the mainstream The developing relationship between WMNT and the Council has led to closer working between the two agencies and the commitment jointly to develop and fund a number of projects which are additional to the ordinary level of spending that Middlesbrough Council allots to West Middlesbrough for environmental services. The area has been earmarked as a pilot area for testing new approaches to Street Scene service delivery. This will result in some Council resources being ‘bent’ towards the NDC area. The first step has been the appointment of a Green and Clean Co-ordinator (a local resident) in January 2004, funded by the Council and managed on a day-to-day basis by the WMNT Environment and Neighbourhood Improvements Manager. A Service Level Agreement has been developed with Middlesbrough Council’s environmental services department, Street Scene. The draft SLA was presented to the Board in September 2003. The SLA provides a useful baseline for monitoring mainstream service performance and mapping future service development, and progress in mainstreaming. Barriers and Drivers Evaluation of the three year Environmental Community Chest scheme revealed that people did not feel it had made much of a visual impact on the NDC area, possibly because it consisted of a number of small projects spread over a wide area. In addition uncertainty over, and slow progress with, the flagship housing project at Central Whinney Banks prevented improvement work on a key green space. Finally progress in improving environmental outcomes was slower than expected; this is thought to be partly due to the failure to appoint an Environmental Projects Officer, although a temporary part-time appointment was made early in 2004. Termination of the partnership agreement between WMNT and the Groundwork Trust left WMNT without a delivery agent for environmental projects, and increased pressure to assemble a staff team more focused on delivering improvements. However, WMNT has been able to secure additional support in this area from the Council, and a pilot is planned to contract Middlesbrough Council to manage WMNT Environmental Development of the Street Scene. The SLA is considered to have been an important process in helping to develop and strengthen the relationship between WMNT and Street Scene. There is now a commitment from the Street Scene team to take an entirely fresh approach to service delivery. They have decided to use this relationship to mutual advantage and have earmarked West Middlesbrough as a pilot area for considering
New Deal for Communities: The National Evaluation
Annual Report 2003/4 159
some radical new ways for delivering their service…'it is proposed that the service should become much more responsive to the day-to-day changing needs of neighbourhoods’.
Transport
8.64. Accessibility and transport issues do not figure strongly in NDC planning and activity and NDCs tend not to figure strongly in the forward plans of transport authorities (in only 12 cases). In 17 NDCs, however, there is said to be joint project funding, and in 12 changed patterns of delivery.
Coventry: Working through the transport group, Centro has helped with a community minibus project and a business service improvement project that aims to extend local bus coverage on Sundays in Manor Farm and Henley Green. A further project involves explicit Centro involvement in developing a new bus link between all areas and Alderman, thus helping to address the poor access from the south of the WEHM area. Discussions are presently underway with Travel Coventry to amend certain issues that have arisen. Hull: The Transport Authority may be providing a new transport interchange outside the village centre, and is amenable to bus route changes as a result of negotiations with the NDC. Lewisham: the Partnership has an ambition to improve the traffic environment and bus services and this has led to initial discussions with Transport for London. However, major changes will require significant political support from the Borough, through the LSP, and from the Mayor and GLA. In this context, the NDC has taken the bold step of commissioning a masterplanning exercise for the area to influence wider land use priorities, transport, particularly future road and rail development, and High Street, green space, recreational and business uses. The Borough has agreed a local PSA target to reduce the number of unlicensed and abandoned vehicles.
Case Study Transport Bristol Community at Heart Transport Activity
• The Dings neighbourhood is benefiting from a liveability initiative started up independently of NDC, but which the Partnership is now part funding. The sustainable transport NGO, Sustrans, is implementing a Home Zone scheme as part of an EU-funded transport project on which Bristol City Council is a partner. Sustrans has conducted extensive consultation for a plan that will reshape the Dings’ streets to minimise the impact of cars and create more space for walking, cycling and recreation. This contributes to one of the city council’s transport targets in its Community Strategy.
• Improvements to kerbs, footpaths, potholes, road crossings, school routes through main programme highways budgets
• Cycling: extension of the Bath/Bristol cycle track using Section 106 funding from the Castle Park development
• Community Transport: The NDC employed a community transport development officer (now left), but the project was not hugely successful. In addition the purchase of a community bus (mainly for the older persons’ group) was less effective than it might have been and illustrates the problems of communities owning/running/maintaining/managing their own community transport. There is now a new arrangement with Community Transport, Bristol.
• Urban Bus Challenge is funding a new bus service which links wards adjoining New

New Deal for Communities: The National Evaluation
Annual Report 2003/4 160
Deal to the city centre.
Working with the mainstream Major mainstream agencies fall within both public and private sectors: the Local Transport Authority (Bristol City Council) and the private bus operators. Links with operators are few and far between (no talks for eighteen months), although in the early days of NDC there were discussions with First Bus about service adjustments. Latterly commercial pressures have led operators to focus attention on major routes. There are traffic and transport objectives in the Neighbourhood Renewal Strategy (air quality, accident reduction, home zones, public transport use) and the NDC area may benefit from these (e.g. the next city wide showcase bus route is planned to go along Church Road – a major route accessing the NDC area). There are few explicit links between the LTA and the New Deal, other than over the Dings Home Zone, where staff from the council are supporting the initiative. It is, however, facilitated/managed by Sustrans on behalf of the council. There has been some discussion with the Strategic Rail Authority over improvements to Lawrence Hill station (disability access and improvements). Barriers and Drivers Efforts had been made to have an SLA with Traffic and Transport regarding local highways maintenance etc. and a draft was prepared. The city council wanted amendments so the SLA was never followed up to the signing off stage. In general, although access is a major issue, transport has not been treated as a key area. Will the new requirement for accessibility planning within the main programme Transport Plan bring a different emphasis to issues of accessibility and neighbourhood renewal?
Social Services
8.65. Direct linkages with social services are generally weak. This may in part be a function of the fact that social services tend to get involved in other initiatives such as Sure Start, with which NDCs often do have close links. Equally social service departments may hold to traditions of universality, meeting individual needs wherever they occur and may hence be less familiar with area-based approaches to provision.
Knowsley: KMBC will be seeking to use NDC as test-bed to take forward initiatives like Integrated Children Services to the neighbourhood level. Two Social Services teams are to operate in the proposed Family Centre, but the initiative is still at the planning stage in terms of changing patterns of delivery. Hull: PRNDC is in negotiations with Hull College over the proposed community college on the Village Centre site. Social Services are providing a Family Resource Centre on the Village Centre site Brent: Social Services contributed mainstream funding for three education support workers in South Kilburn schools and has been willing to commit sustainable match funding to project proposals; this would result in tripartite funding of School/Family Liaison / Welfare Officers (SKNDC, Education, and Social Services).
Case study: Social Services Haringey Seven Sisters Social Services activity: Links are developing with the NDC via the Community Development and Inclusion

New Deal for Communities: The National Evaluation
Annual Report 2003/4 161
Programme, especially in projects that come under the umbrella of the NDC’s Youth Outreach and Inclusion Projects. The linkages with YOIP and Social Services are primarily via the Youth Justice Plan and the Haringey Youth Offending Service. The Haringey Youth Offending Service (YOS) is designed to prevent (re)offending by children and young people living in Haringey. It is a multi-agency partnership consisting of staff from Social Services, Education, Police, Probation and Health services. Even though linkages are neither mature nor formal, progress is being made. NDC project funding is to train two young people on advanced Modern Apprenticeships, to become Youth Justice Workers (paid for from the Employment Theme budget). There is only one current example of joint funding of additional Social Services activity in the NDC area: to convert a derelict children’s home into a community resource and support centre for the children and young people of Haringey (not specifically from within the NDC). The building was in need of extensive refurbishment, but Social Services did not have the funds to do it alone. As a one-off capital expenditure NDC allocated £60k to the overall refurbishment costs of £200k. The Centre will offer services such as social services assessment, advice, counselling, support and advocacy. It will be paid for, managed, and run by LBH Social Services (with support from LBH Education). It will become a centre of excellence for Social Services aimed at supporting children and young people across the borough. Working with the mainstream Although there is a health and social care theme within the NDC, contact and interaction with Social Services is limited. There have been no attempts by Social Services to map spend in the NDC area (difficult since resources are not allocated on a neighbourhood or ward basis). However respondents say that there has been an attempt to try to ‘bend’ resources to where they are most needed, predominately in Wards in the East of the Borough Barriers and drivers The lack of interaction with Social Services may have resulted from the fact that the theme has been dominated by the development of the local Healthy Living Centre (with the PCT). There is no natural platform of engagement between Social Services and NDC, unlike the natural partnerings of NDC and police under the Community Safety theme, or with DWP under the employment theme. The Victoria Climbie enquiry and a weak CPA have led to council concerns about capacity, management and the need for restructuring. If increased resources have been placed in any area in Haringey it is more likely to be as a result of adopting more efficient working practices because of the recommendations from the CPA and SSI or because of changing political priorities towards Child Services or Asylum: ‘how can a special case for the NDC area be made when deprivation doesn’t recognise boundaries’? The culture within the council hierarchy inhibits bending, with council departments in general ‘not very good at talking to each other’. Bureaucracy, therefore, was perceived as major barrier to bending services. The remit of Social Services seemed so broad to the NDC that establishing a usable point of contact was perceived as difficult. Day to day pressures in social services inhibit taking stock or looking at alternative ways of doing things of forming partnerships. One respondent felt” we don’t get the opportunity to be proactive … We have become performance obsessed. Charging from one target to another”. Also a project focus can pull resources away from partnership building; NDC officers felt that they had been focussed on getting the Health Centre up and running, to the detriment of developing relationships with Social Services.

New Deal for Communities: The National Evaluation
Annual Report 2003/4 162
LEARNING FOR SUSTAINABILITY
8.66. Whilst evidence highlights some progress in linking NDC activities to main programmes, it is also clear that there are problems: a continuing non-strategic approach to mainstreaming, lack of definition, absence of shared understanding, and lack of measurement. Pressures on delivery have been enormous, and NDCs have faced major staffing and other constraints in relation to the development of long term sustainability. Many NDCs, therefore have focused on the short term and have not especially invested in sharing their experience. Equally many LSPs have failed to engage with NDCs in order to learn lessons for wider neighbourhood renewal strategies.
8.67. There are, however, examples of localities where several stakeholders including
Partnerships, LSPs, and local authorities are coming to accept that NDCs represent something much more than an opportunity to spend £50m.
A desire to take a broader, non monetary view of mainstreaming and to consider the benefits to the town at large that could result from mainstreaming’. Some agencies commented on ‘changing approaches in terms of working in partnership and finding ways of involving residents. For some agencies this was an area of mutual learning with skills in working with young people being given, while more skills in working with the BME community being learned ‘The NDC has stepped back from its initial priority of getting projects going to giving greater consideration to evaluating what is working and to making successful projects or approaches to service delivery sustainable in the long term'. Liverpool Partnership Group (LPG) prepared the Community Strategy for the city, which includes the Neighbourhood Renewal Strategy for the twenty three neighbourhoods falling within the NRU definition of deprived neighbourhoods. Having drawn up the strategy, LPG felt that there was a need for key leaders responsible for delivery of the NRS, to come together to look at new ways of working so that they could influence changes necessary to achieve targets. LPG invited Common Purpose to customise and run an “Infuse” programme for a diverse group of senior people with responsibility for delivery. This was a five day programme, the first two being residential, and the following three in the form of briefings against the main themes of the NRS. In Nottingham, the Radford and Hyson Green NDC, has from the start recognised the challenge of ‘mainstreaming' – commissioning a Neighbourhood Renewal Adviser to identify barriers and opportunities; developing a model to help stakeholders understand mainstreaming; linking NDC working with emerging Action Area focus of the Nottingham One City Partnership. OCP has itself worked with the Greater Nottingham Learning Partnership to put together a Skills and Knowledge plan for neighbourhood renewal. It is intended to use this plan to enhance understanding of mainstreaming within the NDC Partnership.
8.68. Nevertheless these examples seem to be the exception rather than the rule. More
typical seems to be the view that the main relationship is about allocating funds.
More significantly, the LSP, who are seen as heavily influenced by the Borough, have made an explicit policy decision not to devote NRF fund money to (the NDC area) on the basis that the existence of the NDC

New Deal for Communities: The National Evaluation
Annual Report 2003/4 163
programme meant that it would be fairer to focus these additional resources elsewhere’
8.69. The NDC Programme appears to remain predominantly a project delivery programme, even if there are numerous examples of positive collaborative working and increased evidence of resource sharing. Learning seems to rest with individuals rather than organisations, and the role of the NDC as a laboratory, pilot, or demonstration project is appreciated in only a few localities.
BARRIERS AND DRIVERS
Constraints on Agency Engagement
8.70. If agencies report positive engagement with NDCs they also recognise a number of constraints on the extent to which they are able to participate in NDC work (Table 8.3). In the majority of instances (32 NDCs) agencies report that the culture of their own organisation does not represent a constraint; nor does a lack of skills or competences represent a constraint (84%). There are, however clear views that involvement with NDCs is inhibited by a lack of staff resources (in 22 NDCs), lack of financial resources (17), the demands made by other partnerships (12), and the complexity of working relationships (16).
8.71. The indications are that these two last factors – complexity and demands from other
partnerships - had increased in significance in the last year, although in general the level of constraints on agency involvement has stayed much the same. Indeed some constraints have reduced, notably the perceived fit of objectives between NDC and agencies, and clarity over respective roles.
Table 8.3: Constraints facing agencies in engaging with NDCs
Yes No DK NC Total
Own agency lacked enough staff resources 22 13 4 39
Own agency lacked skills and competencies 2 35 2 39
Own agency lacked financial resources 17 18 4 39
Own agency couldn't fulfil or prioritise time commitments 7 23 1 8 39
Culture of own agency limited commitment/enthusiasm 2 32 1 3 38
Silos of self interest within own agency 6 27 5 38
Fit between agency objectives and those of NDC 9 26 4 39
Clarity of role 11 25 1 2 39
Appropriateness or relevance of role 5 29 1 3 38
NDC Partnership dominated by single partner 3 33 2 1 39
Complexity of relationships, tasks etc 18 16 5 39
Demands from other partnerships 12 19 1 6 38
Base: 39 partnerships Source: CRESR
Negative Barriers
8.72. Lack of staff and financial resources was quoted in more than one NDC.
Lack of staff and financial resources were constraining factor in working with the NDC Partnership. There was also a strong feeling that the clarity of their role, or most probably the lack of clarity, was a constraint on partnership work. The views of a number of consultees could be characterised as the NDC too often saying what it wanted to do and asking how mainstream

New Deal for Communities: The National Evaluation
Annual Report 2003/4 164
providers could help; consultees believed a better approach would be for the Partnership to ask what mainstream providers were struggling with and how they might assist with wider agendas. Lack of staff and resources, and difficulty fulfilling or prioritising time commitments are barriers that have increased over the last twelve months. In some cases this has resulted in a lack of time to discuss issues and ideas. Agencies also perceive the Partnership to be relatively well-resourced. Agency respondents have felt constrained by their inability to match 'like with like' in terms of resources, and by internal processes and external pressures which have mitigated against joint working. Jobcentre Plus, for instance, despite policy level support for a job brokerage project, and the existence of an SLA, has been unable to provide referrals because internal systems do not currently allow eligibility checks to be carried out by NDC staff, and because Personal Advisers have a choice of over 80 training providers for client referral.
8.73. The lack of financial resource was linked to the demands of central government
performance targets.
Organisational constraints stem from funding arrangements, systems and procedures, levels of funding and central government restrictions, including targets and performance management arrangements. For statutory organisations, such as the PCT, these processes make mainstreaming extremely difficult and can therefore account for the lack of depth to changing service provision, such as changes to patterns of delivery.
8.74. There was also some recognition of an insufficient clarity of role, that had
accentuated a lack of co-ordination between NDC and agencies and between agencies themselves.
A number of respondents felt that there was still not a good enough fit between the organisational objectives of partner agencies and those of the NDC. There has been little progress this year in developing Service Level Agreements for example. It is sometimes difficult for partners to wear a variety of ‘hats’ in different settings, such as the LSP and Board, and expectations of the roles of strategic partners are not always clearly set out, with assumptions sometimes made that things will happen by osmosis. Some respondents noted problems with lack of co-ordination and information sharing and consequent duplication among organisations; interdepartmental/ agency rivalry and secrecy had hindered progress. Others thought that agencies were only willing to work with the NDC if they stood to gain from the activity
8.75. At the same time it is clear that agency and local authority engagement, can be
inhibited by local politics. Much of this has to do with the perception that the NDC area has been favoured already. Thus the NDC is sometimes competing for attention on a very overcrowded stage. The larger the local authority area and the greater the extent of deprivation/other regeneration funding, the more the likelihood is that less importance/distinctiveness will be attached to the NDC.
The NDC is located in a Borough where most of the big public agencies have co-terminous boundaries and where every ward in the Borough comes within the 10% most deprived in England, and there are many ABIs with good cases
New Deal for Communities: The National Evaluation
Annual Report 2003/4 165
for mainstreaming across the Borough. This presents an almost unique situation with regard to mainstreaming.
8.76. In some instances it was argued that NDC processes and procedures created barriers.
Some partners questioned NDC’s competence and capacity to deliver and felt that partner contributions were undervalued and under used - “NDC are not asking or learning from partners.” Some still found the NDC to be insular. One agency did indicate that they found the transactions costs of working with the New Deal to be significantly higher than working with other regeneration-related funding mechanisms. Agencies felt the NDC had an 'inability to spend', had suffered staffing shortages, and was sometimes inflexible to work with, while expecting agencies to change their working style. The demands of other activities in the regeneration field such as LSPs and HMRPs, were increasingly cited as important calls on time which meant less dedicated staff time could be spent on the NDC. ‘NDC bureaucracy drives agency partners mad’. This they attributed mainly to the behaviour of certain members of the Partnership Board, rather than the programme team.
Positive Drivers
8.77. There is widespread recognition of the leadership role played by senior figures in maintaining main programme engagement, and in providing a role model for, possibly more reluctant middle management. Thus leadership, commitment and championing were identified as key drivers.
The new Chief Executive has been an important factor in improving partnership working, not least because of his good reputation in the city – he is seen as a ‘guarantor of public credibility’ for the NDC. In one respect the NDC has a critical advantage over many of its counterparts elsewhere. The local MP and senior councillors and officers within the accountable body have persistently pressed the NDC and its partner agencies to raise their game and make a lasting difference
8.78. A fresh approach and new relationships can assist in moving mainstreaming
forward. Thus whilst rare there are examples of main programme agencies seeing the NDC as an area for piloting new approaches.
Agencies like the PCT that bring little baggage from previous experience because they are new organisations and are prepared to think and try local solutions, have so far proved the most fertile ground for considering innovation in mainstream service provision. A number of mainstream projects have been piloted in the NDC, before being more widely implemented across the borough.
8.79. Some interviewees recognise the existence of a new maturity within NDCs and in
relationships between NDCs and others:
Improving relationships with statutory agencies, and an increasing clarity around the meaning of mainstreaming, have mean that Partnership staff now

New Deal for Communities: The National Evaluation
Annual Report 2003/4 166
feel they are more able to put pressure on statutory agencies to change service delivery. The growing maturity of the Board has reduced the frustrations previously felt by agency representatives and improved their perception of the potential benefits of collaboration with other agencies through NDC structures.
8.80. Finally, there is also a recognition that NDCs have now settled down and are showing that good professionals and practitioners have a real value.
Agencies are more optimistic about collaboration with the Partnership now that there is more continuity and certainty from dealing with permanent staff team – in particular theme managers. The influence NDC can exercise is partly a feature of the level of trust in it and the quality of its relationships. Having the time and skills to foster links is an important factor and building team capacity is a relevant consideration Much of this progress [in partnership working] is the result of the Trust attracting experienced and well-connected practitioners. The current Programme Director’s background has also helped; unlike her predecessor, she was formerly a Council Officer and her experience facilitates engagement between the NDC and the local authority.
New Deal for Communities: The National Evaluation
Annual Report 2003/4 167
CHAPTER 9: NDC PARTNERSHIPS: EFFECTIVENESS IN DELIVERY
INTRODUCTION
9.1. This chapter explores some of the relationships between effectiveness and a range of process issues discussed in previous chapters including:
• Composition and characteristics of Boards (Chapter 5).
• The inter-actions between NDC Boards and mainstream agencies (Chapter 8).
9.2. At the end of this chapter an attempt is also made to identify some of the early
relationships between effectiveness (as measured again by spend) and change in one key outcome areas: worklessness.
PARTNERSHIP EFFECTIVENESS
9.3. This section addresses the relationships between the effectiveness of Boards and six variables:
• The stability of key personnel: Chief Executives and Chairs.
• A Board effectiveness index.
• The engagement of NDC personnel in other agencies and fora.
• Agency involvement on NDC Boards.
• Size of NDC Boards.
• And the proportion of residents on Boards.
9.4. Analyses outlined in this chapter were undertaken towards the end of 2003 when not
all Partnerships were able to provide a full data set. Nevertheless this will not affect the broad conclusions outlined below. During 2004/05 this work will be developed to incorporate more comprehensive data sets and further to refine Partnership effectiveness indices'.
Programme and Partnership Level Expenditure
9.5. In this, initial and inevitably tentative, analysis, effectiveness is defined as Partnership expenditure. There are problems with this definition. Simply because a Partnership has relatively high per capita/total expenditure figures may not necessarily imply that money has always been spent effectively in transforming the neighbourhood. Expenditure figures also refer to Partnership spend and not to any associated expenditure by key agencies. However, in this latter context it is worth pointing out that early analysis of 39 case study projects suggest relatively low leverage rates across the Programme (see 3.20 and 3.21).
9.6. Expenditure nevertheless currently represents the best indicator of effectiveness. It
might be hard to argue for example that any low spending Partnership could be classified as 'effective'. In any event it should be stressed that this paper represents an initial analysis. As more change data becomes available the evaluation team will return to Board effectiveness in early 2005.
9.7. Table 9.1 ranks Partnerships by per capita expenditure, and Figure 9.1 indicates
spending profiles per Partnership over this three year period according to figures provided by the NRU (outturn for 2001/02 and 2002/03 and November 2003

New Deal for Communities: The National Evaluation
Annual Report 2003/4 168
estimates for 2003/04). Table 9.1 also provides total expenditure by Partnership. Key headline findings include:
• Programme wide expenditure has increased year on year.
• Most Partnerships also reveal increased spending over this three year period-although there are some which do not including Luton, Norwich, Sandwell, and Sunderland.
• In general, per capita expenditure rankings map reasonably well onto rankings for total expenditure; there are some instances where Partnerships spend more per capita than total expenditure patterns might suggest: Hull and Bristol for example; alternatively there are some where total expenditure patterns obscure relatively low per capita spending patterns: Hackney and Brighton for instance.
• As would be expected there are marked variations across the Programme in relation to both total and per capita spend: After discarding some Partnerships at the bottom of the list which have endured considerable and continuing problems, it is interesting to note that Southampton's per capita expenditure is about one-seventh of that for Hull and one fifth the total expenditure achieved by Manchester.
Table 9.1: Expenditure by Partnership, 2001/02 - 2003/04 ranked by highest total per capita expenditure
Partnership
Per capita expenditure
2001/02 (£)
Per capita expenditure
2002/03 (£)
Per capita expenditure
forecast 2003/04 (£)
Per capita expenditure
Total (£)
Total Expenditure
(£)
Hull 1,010 1,279 1,940 4,229 24,191,676 Manchester 760 920 2,014 3,695 31,109,884 Bristol 466 1,031 1,217 2,714 14,493,534
Norwich 313 1,139 835 2,287 18,344,146 Middlesbrough 485 744 949 2,178 16,523,399
Nottingham 469 826 842 2,137 17,760,091 Newham 564 788 711 2,063 20,304,781 Bradford 487 733 815 2,034 22,280,480
Tower Hamlets 383 642 817 1,842 13,520,738 Newcastle 297 541 724 1,562 14,461,860
Hartlepool 194 534 705 1,434 12,600,746 Rochdale 113 568 695 1,376 11,086,955
Plymouth 114 575 657 1,347 6,385,663 Haringey 179 435 718 1,332 13,905,551 Southwark 207 517 545 1,270 9,313,609
Luton 77 779 387 1,243 9,638,357 Lambeth 127 391 713 1,231 8,632,042
Sandwell 272 448 510 1,230 14,107,164 Derby 60 162 916 1,137 9,932,997 Brighton 260 375 473 1,108 18,737,476
Brent 90 300 653 1,042 7,583,227 Liverpool 136 454 446 1,035 11,609,437
Salford 71 371 551 993 9,015,253 Leicester 186 387 368 940 11,511,382
Sunderland 191 414 329 934 8,506,851 Hackney 398 289 246 933 18,946,343 Doncaster 67 313 537 917 8,539,579
Coventry 57 176 679 911 6,388,029

New Deal for Communities: The National Evaluation
Annual Report 2003/4 169
Birmingham Kings Norton 176 223 492 891 8,157,046 Sheffield 106 306 468 880 7,528,335 Lewisham 80 319 470 869 7,210,784 Hammersmith & Fulham 77 236 519 832 8,017,395 Oldham 40 220 559 820 7,429,671
Knowsley 76 252 433 760 7,027,538 Walsall 52 332 349 732 8,396,810
Southampton 90 212 349 651 6,154,339 Islington 52 166 303 522 4,817,833 Wolverhampton 34 145 306 486 5,158,317 Birmingham Aston 62 60 154 276 4,663,238 Total 221 441 595 1,257 463,992,556
Source: NRU Figure 9.1: Total expenditure profiles (per capita) 2001/02 - 2003/04
0
500
1,000
1,500
2,000
2,500
3,000
3,500
4,000
4,500
Hull
Mancheste
r
Bristo
l
Norw
ich
Mid
dle
sbro
ugh
Nott
ingham
New
ham
Bra
dfo
rd
Tow
er
Ham
lets
New
castle
Hart
lepool
Rochdale
Ply
mouth
Haringey
South
wark
Luto
n
Lam
beth
Sandw
ell
Derb
y
Brighto
n
Bre
nt
Liv
erp
ool
Salford
Leic
este
r
Sunderland
Hackney
Doncaste
r
Coventr
y
Birm
ingham
KN
Sheff
ield
Lew
isham
H'S
mith &
Fulh
am
Old
ham
Know
sle
y
Wals
all
South
am
pto
n
Islin
gto
n
Wolv
erh
am
pto
n
Birm
ingham
A
Per capita expenditure 01/02 (£) Per capita expenditure 02/03 (£) Per capita expenditure forecast 03/04 (£)
Base: 39 partnerships Source: NRU
Expenditure by Rounds 1 and 2
9.8. Table 9.2 provides an indication of total and per capita expenditure by Rounds 1 and 2. It is interesting to note that although the expected discrepancy in expenditure per capita between Rounds evident in 2001/02 narrowed markedly the following year, there still remain differences in forecast spending patterns for 2003/04 between the two Rounds.
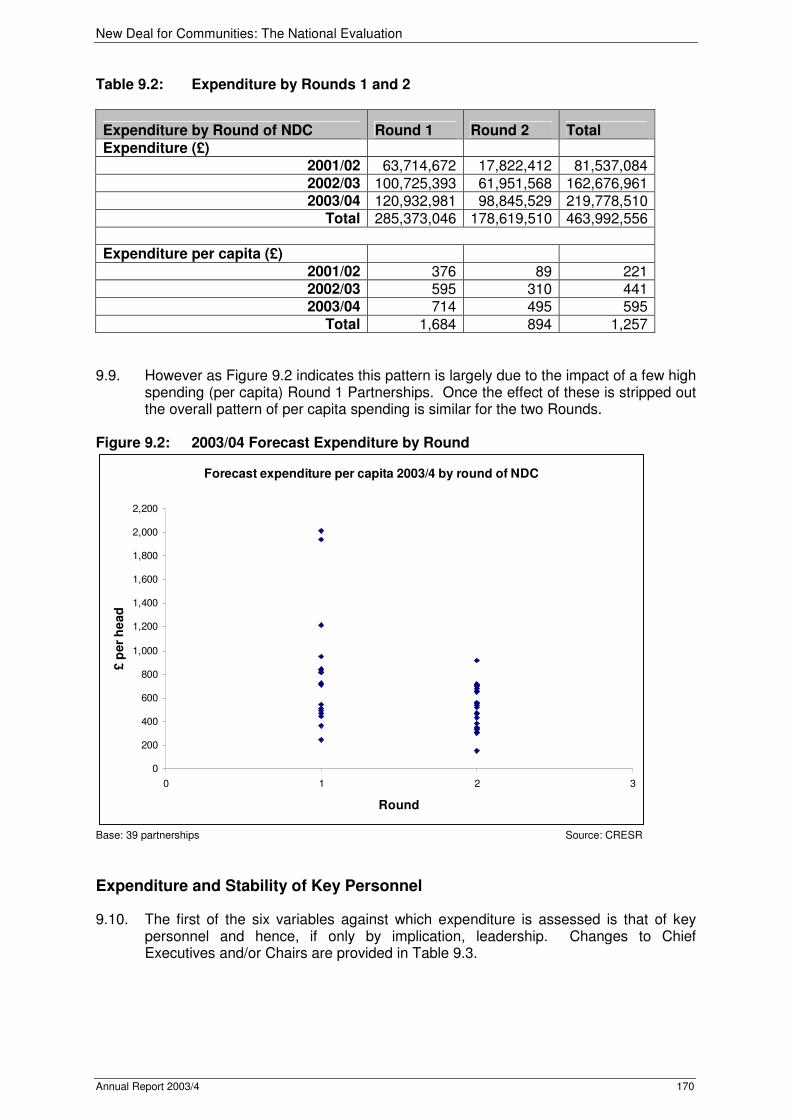
New Deal for Communities: The National Evaluation
Annual Report 2003/4 170
Table 9.2: Expenditure by Rounds 1 and 2
Expenditure by Round of NDC Round 1 Round 2 Total
Expenditure (£) 2001/02 63,714,672 17,822,412 81,537,084 2002/03 100,725,393 61,951,568 162,676,961 2003/04 120,932,981 98,845,529 219,778,510
Total 285,373,046 178,619,510 463,992,556
Expenditure per capita (£)
2001/02 376 89 221 2002/03 595 310 441 2003/04 714 495 595
Total 1,684 894 1,257 9.9. However as Figure 9.2 indicates this pattern is largely due to the impact of a few high
spending (per capita) Round 1 Partnerships. Once the effect of these is stripped out the overall pattern of per capita spending is similar for the two Rounds.
Figure 9.2: 2003/04 Forecast Expenditure by Round
Forecast expenditure per capita 2003/4 by round of NDC
0
200
400
600
800
1,000
1,200
1,400
1,600
1,800
2,000
2,200
0 1 2 3
Round
£ p
er
he
ad
Base: 39 partnerships Source: CRESR
Expenditure and Stability of Key Personnel
9.10. The first of the six variables against which expenditure is assessed is that of key personnel and hence, if only by implication, leadership. Changes to Chief Executives and/or Chairs are provided in Table 9.3.
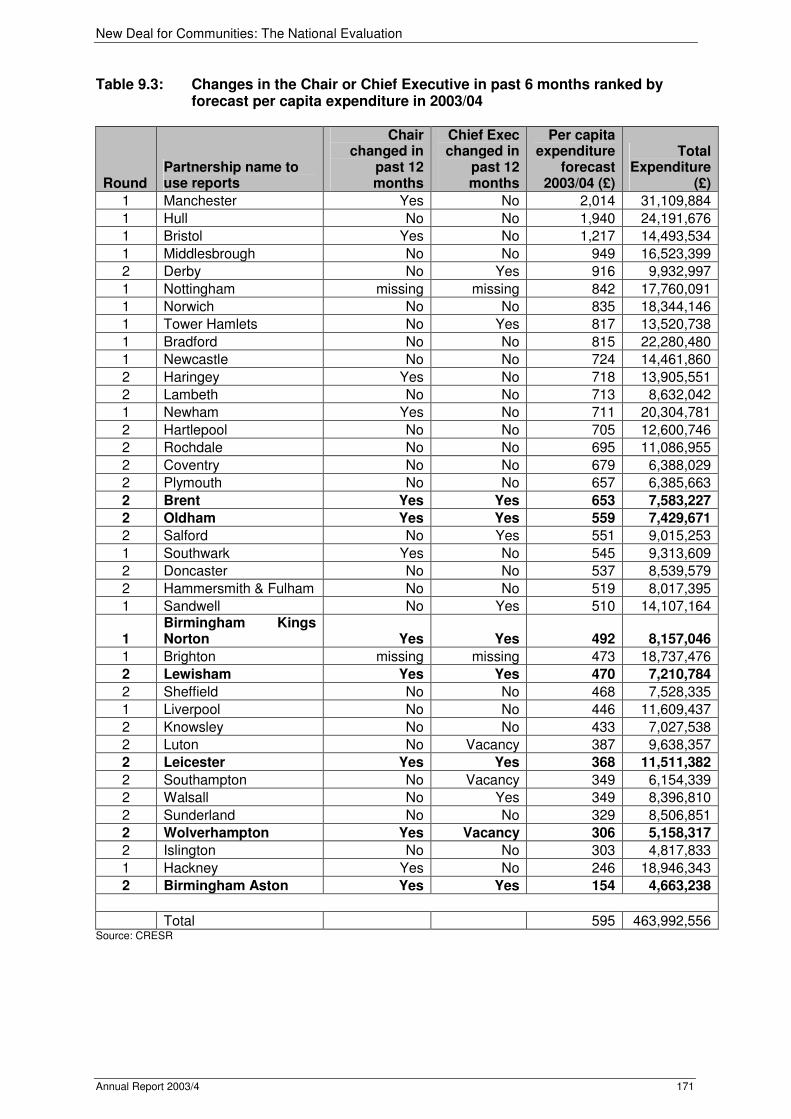
New Deal for Communities: The National Evaluation
Annual Report 2003/4 171
Table 9.3: Changes in the Chair or Chief Executive in past 6 months ranked by forecast per capita expenditure in 2003/04
Round Partnership name to use reports
Chair changed in
past 12 months
Chief Exec changed in
past 12 months
Per capita expenditure
forecast 2003/04 (£)
Total Expenditure
(£)
1 Manchester Yes No 2,014 31,109,884
1 Hull No No 1,940 24,191,676
1 Bristol Yes No 1,217 14,493,534
1 Middlesbrough No No 949 16,523,399
2 Derby No Yes 916 9,932,997
1 Nottingham missing missing 842 17,760,091
1 Norwich No No 835 18,344,146
1 Tower Hamlets No Yes 817 13,520,738
1 Bradford No No 815 22,280,480
1 Newcastle No No 724 14,461,860
2 Haringey Yes No 718 13,905,551
2 Lambeth No No 713 8,632,042
1 Newham Yes No 711 20,304,781
2 Hartlepool No No 705 12,600,746
2 Rochdale No No 695 11,086,955
2 Coventry No No 679 6,388,029
2 Plymouth No No 657 6,385,663
2 Brent Yes Yes 653 7,583,227
2 Oldham Yes Yes 559 7,429,671
2 Salford No Yes 551 9,015,253
1 Southwark Yes No 545 9,313,609
2 Doncaster No No 537 8,539,579
2 Hammersmith & Fulham No No 519 8,017,395
1 Sandwell No Yes 510 14,107,164
1 Birmingham Kings Norton Yes Yes 492 8,157,046
1 Brighton missing missing 473 18,737,476
2 Lewisham Yes Yes 470 7,210,784
2 Sheffield No No 468 7,528,335
1 Liverpool No No 446 11,609,437
2 Knowsley No No 433 7,027,538
2 Luton No Vacancy 387 9,638,357
2 Leicester Yes Yes 368 11,511,382
2 Southampton No Vacancy 349 6,154,339
2 Walsall No Yes 349 8,396,810
2 Sunderland No No 329 8,506,851
2 Wolverhampton Yes Vacancy 306 5,158,317
2 Islington No No 303 4,817,833
1 Hackney Yes No 246 18,946,343
2 Birmingham Aston Yes Yes 154 4,663,238
Total 595 463,992,556 Source: CRESR

New Deal for Communities: The National Evaluation
Annual Report 2003/4 172
9.11. Figure 9.3 and Table 9.4 show the range of forecast expenditure for 2003/04 in NDCs where a Chair or Chief Executive or both has left in the previous 12 months, compared with those where this has not occurred. There is a consistent pattern: Partnerships which have seen changes in Chief Executives and Chairs tend to spend less in absolute terms than do those characterised by stability in senior positions. The most revealing indication of this is presented at the bottom of Table 9.4 which looks at expenditure over the full three year period. It can be argued that this represents too long a period since the change in key personnel data refers to the 'previous 12 months'. However this twelve months period in any event covers parts of both 2002/03 and 2003/04 and a loss of a key player may reflect a longer period of instability and tension. Per capita expenditure over this three year period in Partnerships where there has been a change in both posts is just about half the average of those where this did not occur.
Figure 9.3: Forecast Expenditure by status of Key Personnel
Forecast expenditure 2003/04 by whether the chair or chief exec has
left in past 12 months
0
200
400
600
800
1,000
1,200
1,400
1,600
1,800
2,000
2,200
£ p
er
head
Base: 39 partnerships Source: CRESR
Chair left
Y N Y Y N N
Exec left Both left
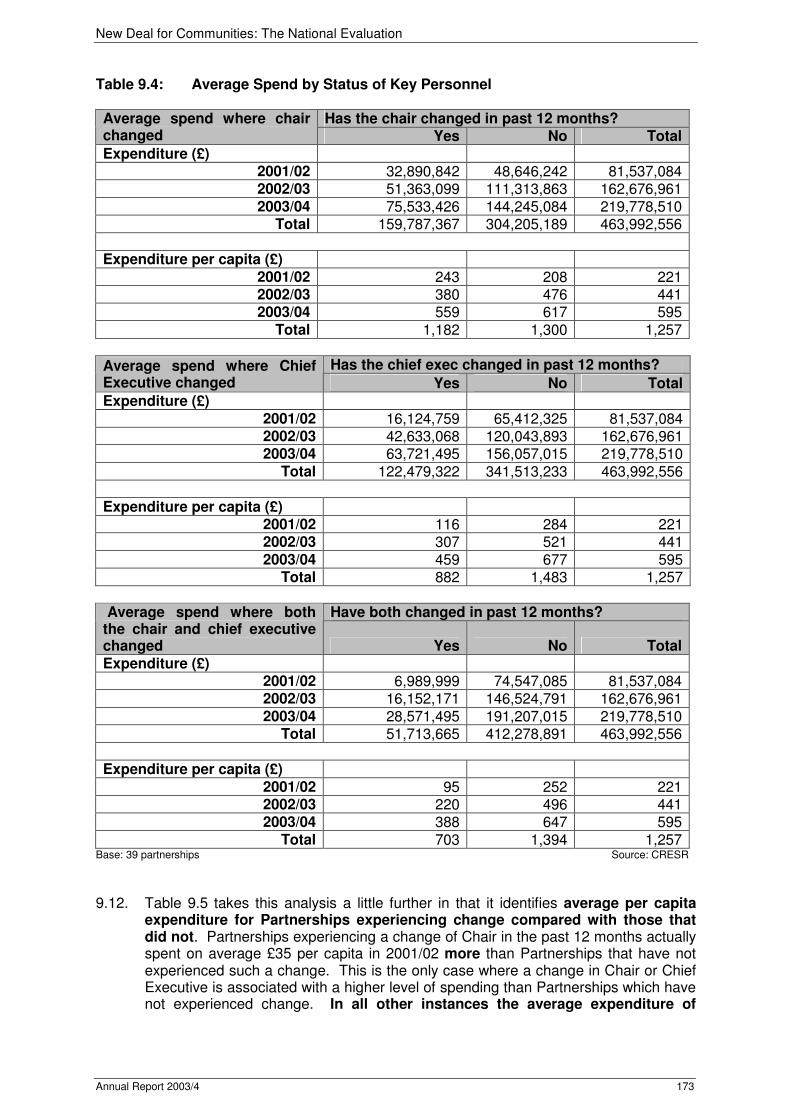
New Deal for Communities: The National Evaluation
Annual Report 2003/4 173
Table 9.4: Average Spend by Status of Key Personnel
Has the chair changed in past 12 months? Average spend where chair changed Yes No Total
Expenditure (£) 2001/02 32,890,842 48,646,242 81,537,084 2002/03 51,363,099 111,313,863 162,676,961 2003/04 75,533,426 144,245,084 219,778,510
Total 159,787,367 304,205,189 463,992,556
Expenditure per capita (£)
2001/02 243 208 221 2002/03 380 476 441 2003/04 559 617 595
Total 1,182 1,300 1,257
Has the chief exec changed in past 12 months? Average spend where Chief Executive changed Yes No Total
Expenditure (£) 2001/02 16,124,759 65,412,325 81,537,084 2002/03 42,633,068 120,043,893 162,676,961 2003/04 63,721,495 156,057,015 219,778,510
Total 122,479,322 341,513,233 463,992,556 Expenditure per capita (£)
2001/02 116 284 221 2002/03 307 521 441 2003/04 459 677 595
Total 882 1,483 1,257
Have both changed in past 12 months? Average spend where both the chair and chief executive changed Yes No Total
Expenditure (£) 2001/02 6,989,999 74,547,085 81,537,084 2002/03 16,152,171 146,524,791 162,676,961 2003/04 28,571,495 191,207,015 219,778,510
Total 51,713,665 412,278,891 463,992,556
Expenditure per capita (£)
2001/02 95 252 221 2002/03 220 496 441 2003/04 388 647 595
Total 703 1,394 1,257 Base: 39 partnerships Source: CRESR
9.12. Table 9.5 takes this analysis a little further in that it identifies average per capita
expenditure for Partnerships experiencing change compared with those that did not. Partnerships experiencing a change of Chair in the past 12 months actually spent on average £35 per capita in 2001/02 more than Partnerships that have not experienced such a change. This is the only case where a change in Chair or Chief Executive is associated with a higher level of spending than Partnerships which have not experienced change. In all other instances the average expenditure of
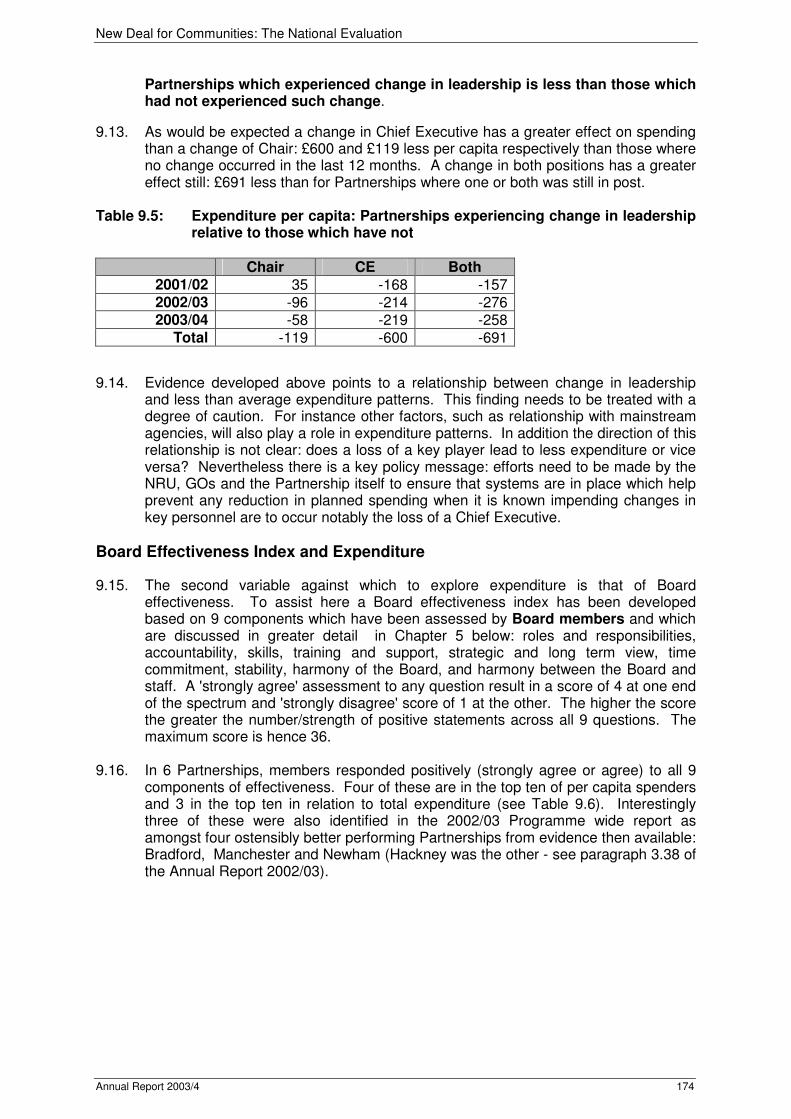
New Deal for Communities: The National Evaluation
Annual Report 2003/4 174
Partnerships which experienced change in leadership is less than those which had not experienced such change.
9.13. As would be expected a change in Chief Executive has a greater effect on spending than a change of Chair: £600 and £119 less per capita respectively than those where no change occurred in the last 12 months. A change in both positions has a greater effect still: £691 less than for Partnerships where one or both was still in post.
Table 9.5: Expenditure per capita: Partnerships experiencing change in leadership relative to those which have not
Chair CE Both 2001/02 35 -168 -157 2002/03 -96 -214 -276 2003/04 -58 -219 -258
Total -119 -600 -691
9.14. Evidence developed above points to a relationship between change in leadership and less than average expenditure patterns. This finding needs to be treated with a degree of caution. For instance other factors, such as relationship with mainstream agencies, will also play a role in expenditure patterns. In addition the direction of this relationship is not clear: does a loss of a key player lead to less expenditure or vice versa? Nevertheless there is a key policy message: efforts need to be made by the NRU, GOs and the Partnership itself to ensure that systems are in place which help prevent any reduction in planned spending when it is known impending changes in key personnel are to occur notably the loss of a Chief Executive.
Board Effectiveness Index and Expenditure
9.15. The second variable against which to explore expenditure is that of Board effectiveness. To assist here a Board effectiveness index has been developed based on 9 components which have been assessed by Board members and which are discussed in greater detail in Chapter 5 below: roles and responsibilities, accountability, skills, training and support, strategic and long term view, time commitment, stability, harmony of the Board, and harmony between the Board and staff. A 'strongly agree' assessment to any question result in a score of 4 at one end of the spectrum and 'strongly disagree' score of 1 at the other. The higher the score the greater the number/strength of positive statements across all 9 questions. The maximum score is hence 36.
9.16. In 6 Partnerships, members responded positively (strongly agree or agree) to all 9
components of effectiveness. Four of these are in the top ten of per capita spenders and 3 in the top ten in relation to total expenditure (see Table 9.6). Interestingly three of these were also identified in the 2002/03 Programme wide report as amongst four ostensibly better performing Partnerships from evidence then available: Bradford, Manchester and Newham (Hackney was the other - see paragraph 3.38 of the Annual Report 2002/03).

New Deal for Communities: The National Evaluation
Annual Report 2003/4 175
Table 9.6: Board Effectiveness and Expenditure: Highest Scoring Partnerships
Partnership Composite indicator on Board
effectiveness
Rank on total expenditure per
capita
Rank on total Expenditure
Bradford 35 8 3 Manchester 33 2 1 Knowsley 32 34 33 Newham 30 7 4 Brent 27 21 29 Newcastle 27 10 11
9.17. In 6 other Partnerships members responded positively (strongly agree or agree) to 8
of the 9 questions on effectiveness. However only 2 of these are in the top ten spenders per capita and two in the top ten of total expenditure (see Table 9.7).
Table 9.7: Board Effectiveness and Expenditure: Second tier Partnerships
Partnership Composite indicator on Board
effectiveness
Rank on total expenditure per
capita
Rank on total Expenditure
Hartlepool 28 11 15 Brighton 27 20 6 Hull 25 1 2 Tower Hamlets 25 9 14 Birmingham Kings Norton 24 29 27 Sheffield 24 30 30
9.18. In only one instance did Board members respond negatively (strongly disagree or
disagree) to all 9 questions: Luton Marsh Farm with a composite score of 18. This Partnership is ranked 16th in relation to per capita expenditure and 20th on total expenditure. It is possible to score lower than Luton if Partnerships have responded no consensus, don't know or no comment to any of the nine component parts of the indicator. Table 9.8 shows that there are 12 Partnerships with a score equal to or lower than Luton but these do not consistently appear at the bottom of the league of spenders. Bristol and Nottingham are third and sixth respectively on spend per capita, yet have amongst the lowest scores on the composite indicator.
Table 9.8: Board Effectiveness and Expenditure: Lowest Ranked Partnerships
Partnership Composite indicator on Board
effectiveness
Rank on total expenditure per
capita
Rank on total Expenditure
Derby 18 19 19 Hammersmith & Fulham 18 32 28 Haringey 18 14 13 Southwark 18 15 21 Lambeth 17 17 23 Plymouth 17 13 35 Walsall 17 35 26 Coventry 15 28 34 Salford 13 23 22 Bristol 12 3 10
Sunderland 12 25 25 Nottingham 10 6 8

New Deal for Communities: The National Evaluation
Annual Report 2003/4 176
9.19. Statistical relationships between the composite indicator of Board effectiveness and expenditure per capita have been explored for both 2003/04 alone and for all of the 2001/02 to 2003/04 period. No clear linear relationship exists. The correlation coefficient is only 0.2 for both sets of spend data. A regression model indicates that the composite score for Board effectiveness is not a significant explanatory variable in predicting total expenditure per capita or expenditure per capita for 2003/04.
9.20. The composite indicator of Board effectiveness is however a significant variable in
explaining total expenditure. Figure 9.4 shows the relationship between the composite indicator for Board effectiveness and total expenditure 2001/04. The relationship though significant, is not very strong. This is confirmed by a correlation coefficient of 0.39 significant at the 0.05 level.
The regression line shown on the Figure 9.4 plots the results from the following regression model: y=3,396,153 + 402,171(x) or total expenditure = £3,396,153 + £402,171 (composite score on Board effectiveness) (R2=0.15, significant at 0.05 level) This indicates that the composite score of Board effectiveness is a significant explanatory variable in predicting: 15% of total expenditure.
Figure 9.4: Total Expenditure 2001-2004 by composite indicator of Board effectiveness
403020100
35,000,000
30,000,000
25,000,000
20,000,000
15,000,000
10,000,000
5,000,000
0
Note: Excludes Wolverhampton as entire Board has changed in past 12 months. Source: CRESR
Total expenditure (£ ) 2001/04
Composite indicator of Board effectiveness
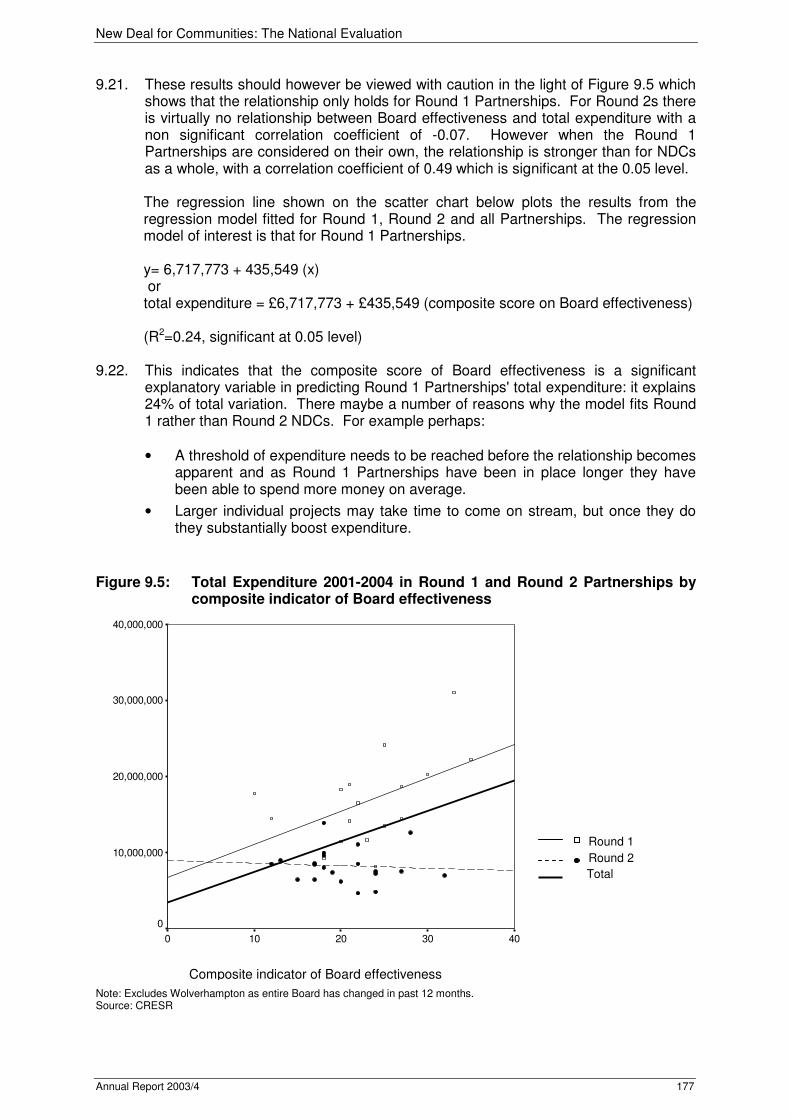
New Deal for Communities: The National Evaluation
Annual Report 2003/4 177
9.21. These results should however be viewed with caution in the light of Figure 9.5 which shows that the relationship only holds for Round 1 Partnerships. For Round 2s there is virtually no relationship between Board effectiveness and total expenditure with a non significant correlation coefficient of -0.07. However when the Round 1 Partnerships are considered on their own, the relationship is stronger than for NDCs as a whole, with a correlation coefficient of 0.49 which is significant at the 0.05 level.
The regression line shown on the scatter chart below plots the results from the regression model fitted for Round 1, Round 2 and all Partnerships. The regression model of interest is that for Round 1 Partnerships. y= 6,717,773 + 435,549 (x) or total expenditure = £6,717,773 + £435,549 (composite score on Board effectiveness) (R2=0.24, significant at 0.05 level)
9.22. This indicates that the composite score of Board effectiveness is a significant
explanatory variable in predicting Round 1 Partnerships' total expenditure: it explains 24% of total variation. There maybe a number of reasons why the model fits Round 1 rather than Round 2 NDCs. For example perhaps:
• A threshold of expenditure needs to be reached before the relationship becomes apparent and as Round 1 Partnerships have been in place longer they have been able to spend more money on average.
• Larger individual projects may take time to come on stream, but once they do they substantially boost expenditure.
Figure 9.5: Total Expenditure 2001-2004 in Round 1 and Round 2 Partnerships by composite indicator of Board effectiveness
403020100
40,000,000
30,000,000
20,000,000
10,000,000
0
Note: Excludes Wolverhampton as entire Board has changed in past 12 months. Source: CRESR
Composite indicator of Board effectiveness
Round 1
Round 2
Total

New Deal for Communities: The National Evaluation
Annual Report 2003/4 178
NDC Membership of Other Agencies and Fora
9.23. A third variable through which to assess effectiveness is that of NDC engagement with other agencies: is there any evidence to indicate that expenditure is related to the involvement of NDC Board members or staff on other renewal/regeneration bodies? Information indicating the degree to which NDC staff or Board members are members of other bodies and working parties is outlined in sections 8.8 and 8.9 but for the sake of convenience, repeated in Table 9.9.
Table 9.9: NDC Board or Staff membership of other Bodies
Agency
% of NDCs with representation of staff or
Board members on agency
LSP 82
Health 69
Housing 69
Sure Start 64
Community safety 64
Education 64
Worklessness 62
Connexions 41
LSC 36
Environment 33
Race Equality 33 Source: CRESR
9.24. Each NDC has been given a score of 1 to 11 based on membership of bodies. 9.25. Figure 9.6 shows the relationship between the numbers of bodies/working parties to
which staff and or Board members of NDCs belong and total expenditure. The two variables have a correlation coefficient of 0.45 which is significant at the 0.01 level. Round 2 data shows no significant correlation between the two variables but for Round 1 Partnerships the relationship is strong. The correlation coefficient for total expenditure and the number of agencies that staff and/or Board members are involved in is 0.61 for Round 1 NDCs which is significant at the 0.05 level.
9.26. The regression model of interest is that for Round 1 Partnerships.
y= 5,673,406 + 1,465,508 (x) or total expenditure = £5,673,406 + £1,465,508 (number of agencies staff/Board are on) (R2=0.38, significant at 0.05 level) This indicates that the number of agencies staff and Board members are involved with is a significant explanatory variable in predicting Round 1 Partnerships' total expenditure. It explains 38% of total variation in expenditure.

New Deal for Communities: The National Evaluation
Annual Report 2003/4 179
Figure 9.6: Total expenditure and number of types of bodies/working groups attended by NDC staff and Board members.
1211109876543210
35,000,000
30,000,000
25,000,000
20,000,000
15,000,000
10,000,000
5,000,000
0
Source: CRESR
9.27. Evidence suggests that two Partnerships belong to all 11 bodies/working groups.
Both are in the top 10 of spenders.
Partnership Total Expenditure Total number of agencies NDC belong to
Rank of total expenditure
Norwich 18,344,146 11 7
Bradford 22,280,480 11 3
9.28. A further 6 indicate staff or Board members belong to 10 of the 11 bodies/working
groups listed. However only one of these is in top 10 of spenders.
Partnership Total Expenditure Total number of agencies NDC belong to
Rank of total expenditure
Hull 24,191,676 10 2
Derby 9,932,997 10 19
Hartlepool 12,600,746 10 15
Oldham 7,429,671 10 31
Sheffield 7,528,335 10 30
Knowsley 7,027,538 10 33
9.29. At the other end of the spectrum, three Partnerships indicate staff or Board members
belong to only one of the 11 bodies/working groups listed.
Total expenditure (£ ) 2001/04
Composite indicator of Board effectiveness
Round 1
Round 2
Total
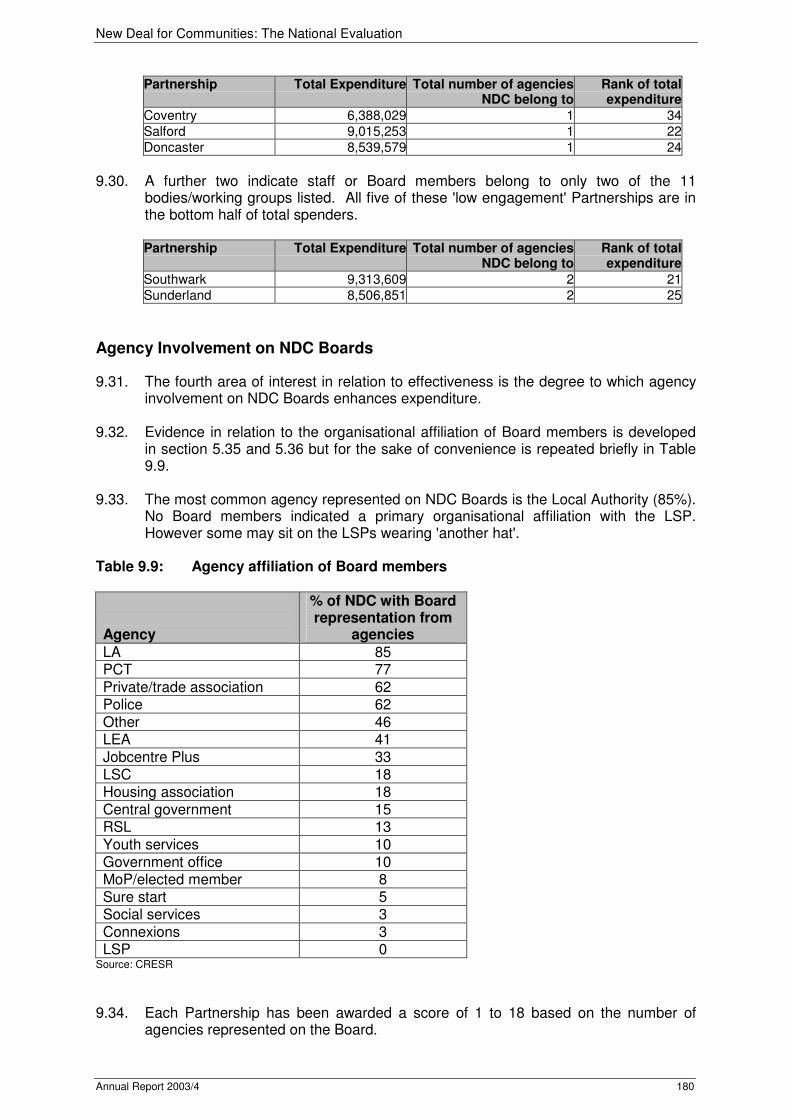
New Deal for Communities: The National Evaluation
Annual Report 2003/4 180
Partnership Total Expenditure Total number of agencies NDC belong to
Rank of total expenditure
Coventry 6,388,029 1 34
Salford 9,015,253 1 22
Doncaster 8,539,579 1 24
9.30. A further two indicate staff or Board members belong to only two of the 11
bodies/working groups listed. All five of these 'low engagement' Partnerships are in the bottom half of total spenders.
Partnership Total Expenditure Total number of agencies
NDC belong toRank of total expenditure
Southwark 9,313,609 2 21
Sunderland 8,506,851 2 25
Agency Involvement on NDC Boards
9.31. The fourth area of interest in relation to effectiveness is the degree to which agency involvement on NDC Boards enhances expenditure.
9.32. Evidence in relation to the organisational affiliation of Board members is developed
in section 5.35 and 5.36 but for the sake of convenience is repeated briefly in Table 9.9.
9.33. The most common agency represented on NDC Boards is the Local Authority (85%).
No Board members indicated a primary organisational affiliation with the LSP. However some may sit on the LSPs wearing 'another hat'.
Table 9.9: Agency affiliation of Board members Agency
% of NDC with Board representation from
agencies
LA 85 PCT 77 Private/trade association 62 Police 62 Other 46 LEA 41 Jobcentre Plus 33 LSC 18 Housing association 18 Central government 15 RSL 13 Youth services 10 Government office 10 MoP/elected member 8 Sure start 5 Social services 3 Connexions 3 LSP 0
Source: CRESR
9.34. Each Partnership has been awarded a score of 1 to 18 based on the number of agencies represented on the Board.
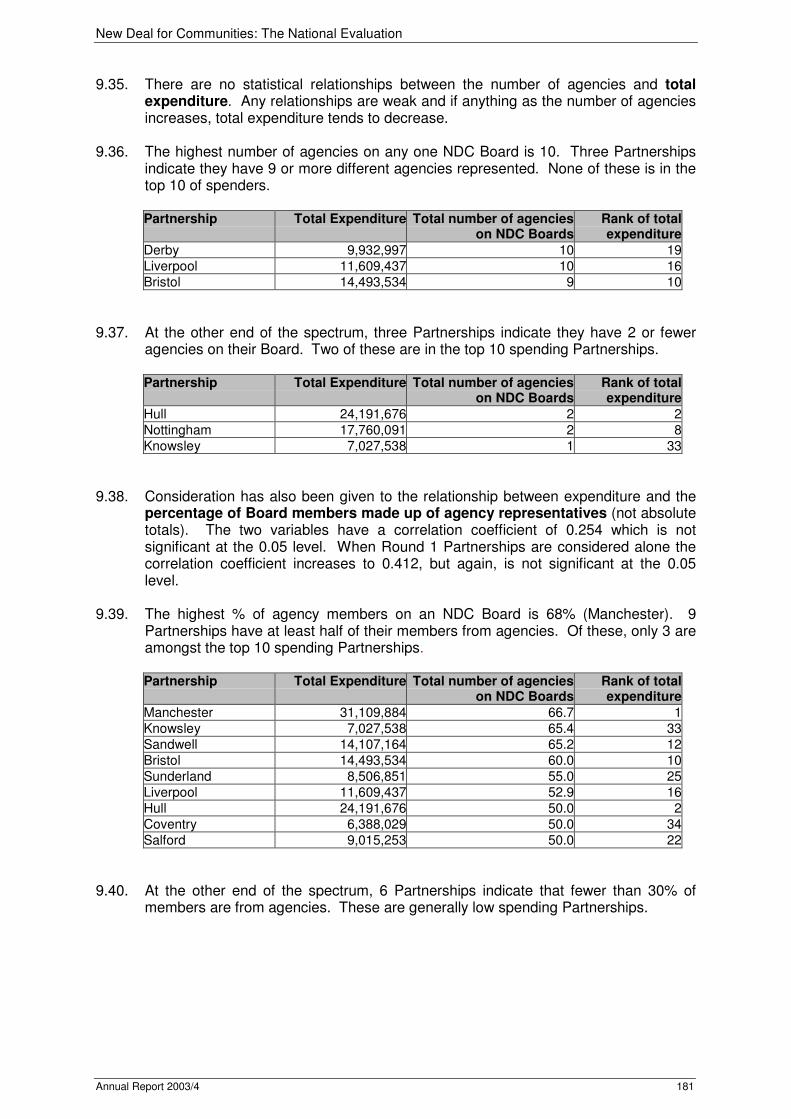
New Deal for Communities: The National Evaluation
Annual Report 2003/4 181
9.35. There are no statistical relationships between the number of agencies and total expenditure. Any relationships are weak and if anything as the number of agencies increases, total expenditure tends to decrease.
9.36. The highest number of agencies on any one NDC Board is 10. Three Partnerships
indicate they have 9 or more different agencies represented. None of these is in the top 10 of spenders.
Partnership Total Expenditure Total number of agencies
on NDC BoardsRank of total expenditure
Derby 9,932,997 10 19
Liverpool 11,609,437 10 16
Bristol 14,493,534 9 10
9.37. At the other end of the spectrum, three Partnerships indicate they have 2 or fewer
agencies on their Board. Two of these are in the top 10 spending Partnerships.
Partnership Total Expenditure Total number of agencies on NDC Boards
Rank of total expenditure
Hull 24,191,676 2 2
Nottingham 17,760,091 2 8
Knowsley 7,027,538 1 33
9.38. Consideration has also been given to the relationship between expenditure and the
percentage of Board members made up of agency representatives (not absolute totals). The two variables have a correlation coefficient of 0.254 which is not significant at the 0.05 level. When Round 1 Partnerships are considered alone the correlation coefficient increases to 0.412, but again, is not significant at the 0.05 level.
9.39. The highest % of agency members on an NDC Board is 68% (Manchester). 9
Partnerships have at least half of their members from agencies. Of these, only 3 are amongst the top 10 spending Partnerships.
Partnership Total Expenditure Total number of agencies
on NDC BoardsRank of total expenditure
Manchester 31,109,884 66.7 1
Knowsley 7,027,538 65.4 33
Sandwell 14,107,164 65.2 12
Bristol 14,493,534 60.0 10
Sunderland 8,506,851 55.0 25
Liverpool 11,609,437 52.9 16
Hull 24,191,676 50.0 2
Coventry 6,388,029 50.0 34
Salford 9,015,253 50.0 22
9.40. At the other end of the spectrum, 6 Partnerships indicate that fewer than 30% of
members are from agencies. These are generally low spending Partnerships.
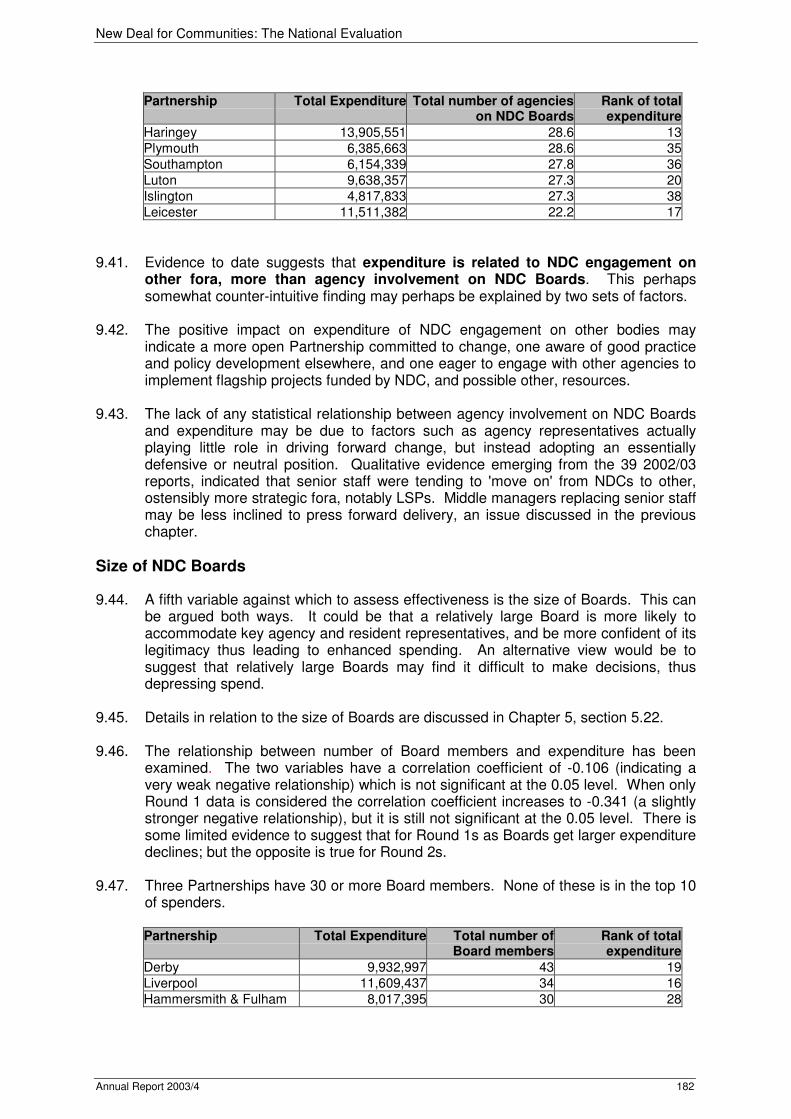
New Deal for Communities: The National Evaluation
Annual Report 2003/4 182
Partnership Total Expenditure Total number of agencies
on NDC BoardsRank of total expenditure
Haringey 13,905,551 28.6 13
Plymouth 6,385,663 28.6 35
Southampton 6,154,339 27.8 36
Luton 9,638,357 27.3 20
Islington 4,817,833 27.3 38
Leicester 11,511,382 22.2 17
9.41. Evidence to date suggests that expenditure is related to NDC engagement on
other fora, more than agency involvement on NDC Boards. This perhaps somewhat counter-intuitive finding may perhaps be explained by two sets of factors.
9.42. The positive impact on expenditure of NDC engagement on other bodies may
indicate a more open Partnership committed to change, one aware of good practice and policy development elsewhere, and one eager to engage with other agencies to implement flagship projects funded by NDC, and possible other, resources.
9.43. The lack of any statistical relationship between agency involvement on NDC Boards
and expenditure may be due to factors such as agency representatives actually playing little role in driving forward change, but instead adopting an essentially defensive or neutral position. Qualitative evidence emerging from the 39 2002/03 reports, indicated that senior staff were tending to 'move on' from NDCs to other, ostensibly more strategic fora, notably LSPs. Middle managers replacing senior staff may be less inclined to press forward delivery, an issue discussed in the previous chapter.
Size of NDC Boards
9.44. A fifth variable against which to assess effectiveness is the size of Boards. This can be argued both ways. It could be that a relatively large Board is more likely to accommodate key agency and resident representatives, and be more confident of its legitimacy thus leading to enhanced spending. An alternative view would be to suggest that relatively large Boards may find it difficult to make decisions, thus depressing spend.
9.45. Details in relation to the size of Boards are discussed in Chapter 5, section 5.22. 9.46. The relationship between number of Board members and expenditure has been
examined. The two variables have a correlation coefficient of -0.106 (indicating a very weak negative relationship) which is not significant at the 0.05 level. When only Round 1 data is considered the correlation coefficient increases to -0.341 (a slightly stronger negative relationship), but it is still not significant at the 0.05 level. There is some limited evidence to suggest that for Round 1s as Boards get larger expenditure declines; but the opposite is true for Round 2s.
9.47. Three Partnerships have 30 or more Board members. None of these is in the top 10
of spenders.
Partnership Total Expenditure Total number of Board members
Rank of total expenditure
Derby 9,932,997 43 19
Liverpool 11,609,437 34 16
Hammersmith & Fulham 8,017,395 30 28

New Deal for Communities: The National Evaluation
Annual Report 2003/4 183
At the other end of the spectrum, nine have fewer than 20 Board members. Two are high spenders but most are not.
Partnership Total Expenditure Total number of
Board membersRank of total expenditure
Lambeth 8,632,042 19 23
Brent 7,583,227 19 29
Sheffield 7,528,335 18 30
Leicester 11,511,382 18 17
Southampton 6,154,339 18 36
Birmingham Aston 4,663,238 17 39
Norwich 18,344,146 16 7
Salford 9,015,253 14 22
Manchester 31,109,884 12 1
The Proportion of Residents on Boards
9.48. The final variable against which to assess effectiveness as measured by expenditure is the proportion of Board membership made up of local residents. It can be argued that a higher proportion of residents might help expenditure in that more ideas may be forthcoming and Boards may feel more confident in taking forward initiatives. Alternatively it may be that a higher proportion of residents deflects Boards from expenditure, particularly of a more controversial, possibly strategic, nature.
9.49. Paragraph 5.32 provides details of resident membership of NDC Boards 9.50. The relationship between the proportion of resident Board members and expenditure
is explored in Figure 9.7. The two variables have a correlation coefficient of -0.154 (indicating a weak negative relationship) which is not significant at the 0.05 level. When Round 1 Partnerships are analysed the correlation coefficient increases to -0.218 (a slightly stronger negative relationship), but which is still not significant at the 0.05 level.
Regression models have been fitted for Round 1, Round 2 and for all Partnerships. The regression model of most interest is that for Round 1 Partnerships.
y= 21,674,533 - 105,475 (x) or total expenditure = £21,674,533 - £105,475 (percentage of Board members) (R2=0.048, not significant at 0.05 level)
This indicates that the percentage of residents on a Round 1 Board is not a significant explanatory variable in predicting total expenditure (only explaining 5% of the total variation in this expenditure). However, it is interesting thing to note that the relationship is negative: as the percentage of resident members increases - total expenditure decreases.
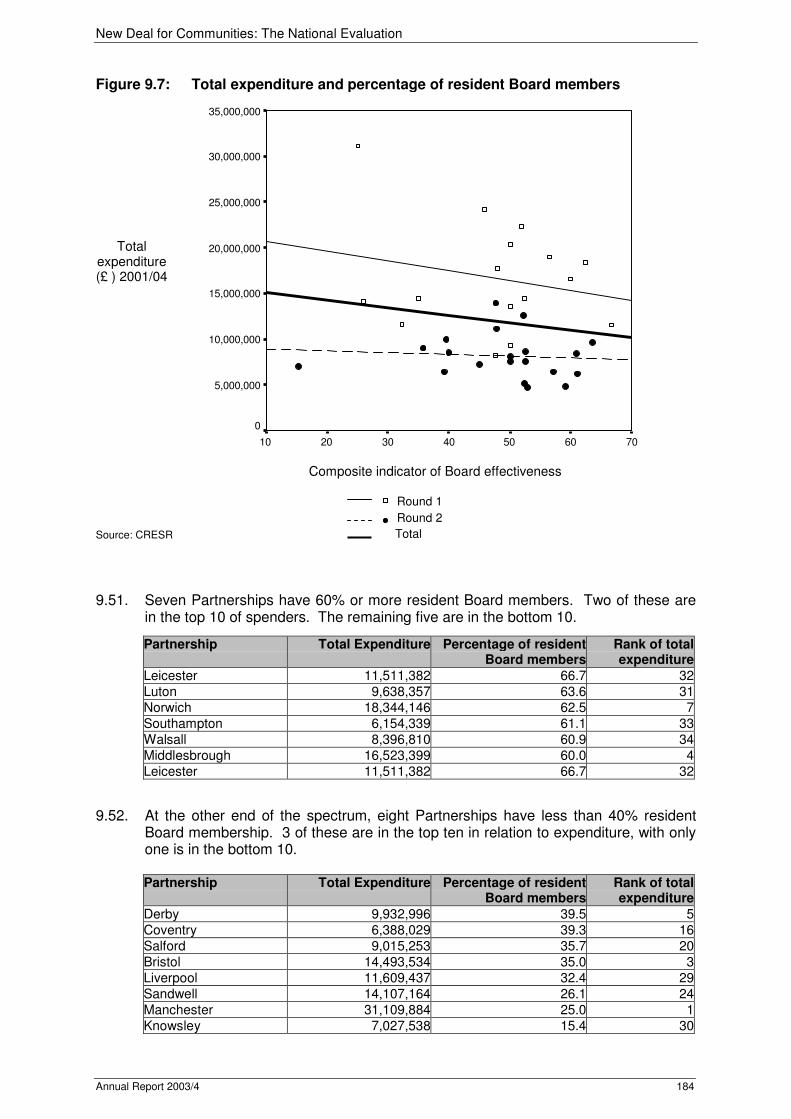
New Deal for Communities: The National Evaluation
Annual Report 2003/4 184
Figure 9.7: Total expenditure and percentage of resident Board members
70605040302010
35,000,000
30,000,000
25,000,000
20,000,000
15,000,000
10,000,000
5,000,000
0
Source: CRESR
9.51. Seven Partnerships have 60% or more resident Board members. Two of these are
in the top 10 of spenders. The remaining five are in the bottom 10.
Partnership Total Expenditure Percentage of resident Board members
Rank of total expenditure
Leicester 11,511,382 66.7 32
Luton 9,638,357 63.6 31
Norwich 18,344,146 62.5 7
Southampton 6,154,339 61.1 33
Walsall 8,396,810 60.9 34
Middlesbrough 16,523,399 60.0 4
Leicester 11,511,382 66.7 32
9.52. At the other end of the spectrum, eight Partnerships have less than 40% resident Board membership. 3 of these are in the top ten in relation to expenditure, with only one is in the bottom 10.
Partnership Total Expenditure Percentage of resident
Board membersRank of total expenditure
Derby 9,932,996 39.5 5
Coventry 6,388,029 39.3 16
Salford 9,015,253 35.7 20
Bristol 14,493,534 35.0 3
Liverpool 11,609,437 32.4 29
Sandwell 14,107,164 26.1 24
Manchester 31,109,884 25.0 1
Knowsley 7,027,538 15.4 30
Total expenditure (£ ) 2001/04
Composite indicator of Board effectiveness
Round 1
Round 2
Total
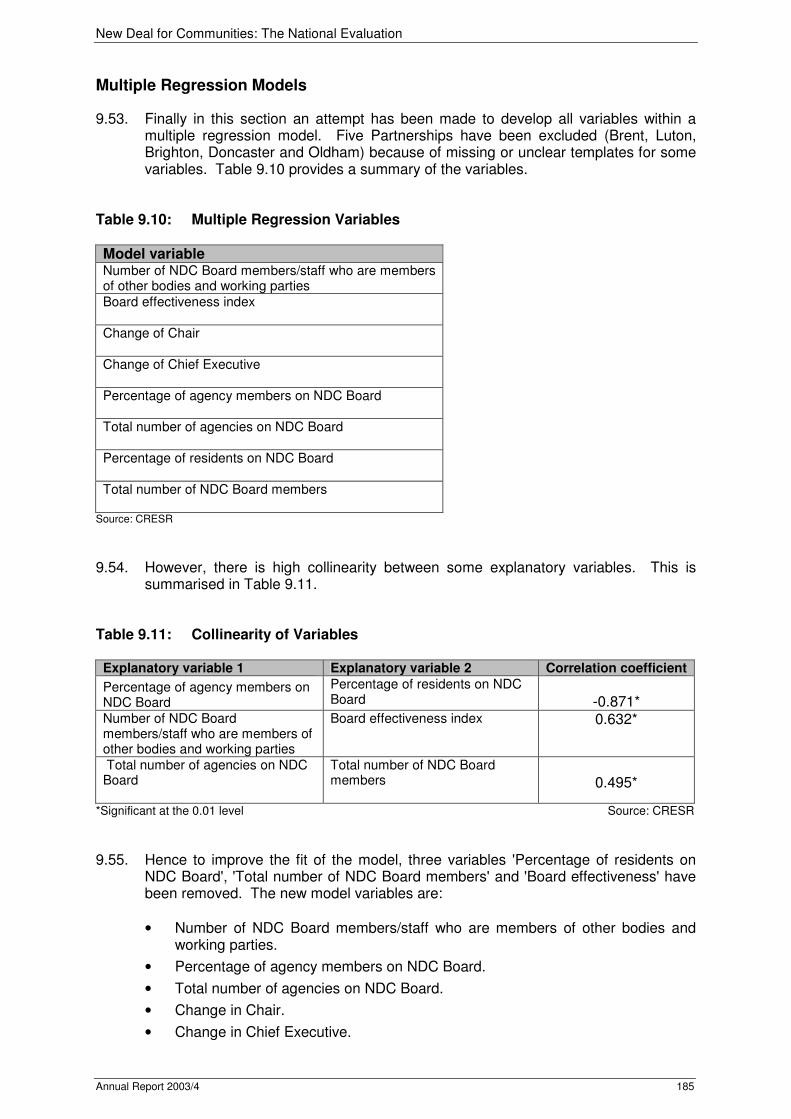
New Deal for Communities: The National Evaluation
Annual Report 2003/4 185
Multiple Regression Models
9.53. Finally in this section an attempt has been made to develop all variables within a multiple regression model. Five Partnerships have been excluded (Brent, Luton, Brighton, Doncaster and Oldham) because of missing or unclear templates for some variables. Table 9.10 provides a summary of the variables.
Table 9.10: Multiple Regression Variables Model variable Number of NDC Board members/staff who are members of other bodies and working parties
Board effectiveness index
Change of Chair
Change of Chief Executive
Percentage of agency members on NDC Board Total number of agencies on NDC Board
Percentage of residents on NDC Board
Total number of NDC Board members
Source: CRESR
9.54. However, there is high collinearity between some explanatory variables. This is
summarised in Table 9.11. Table 9.11: Collinearity of Variables Explanatory variable 1 Explanatory variable 2 Correlation coefficient
Percentage of agency members on NDC Board
Percentage of residents on NDC Board
-0.871*
Number of NDC Board members/staff who are members of other bodies and working parties
Board effectiveness index 0.632*
Total number of agencies on NDC Board
Total number of NDC Board members
0.495*
*Significant at the 0.01 level Source: CRESR
9.55. Hence to improve the fit of the model, three variables 'Percentage of residents on
NDC Board', 'Total number of NDC Board members' and 'Board effectiveness' have been removed. The new model variables are:
• Number of NDC Board members/staff who are members of other bodies and working parties.
• Percentage of agency members on NDC Board.
• Total number of agencies on NDC Board.
• Change in Chair.
• Change in Chief Executive.
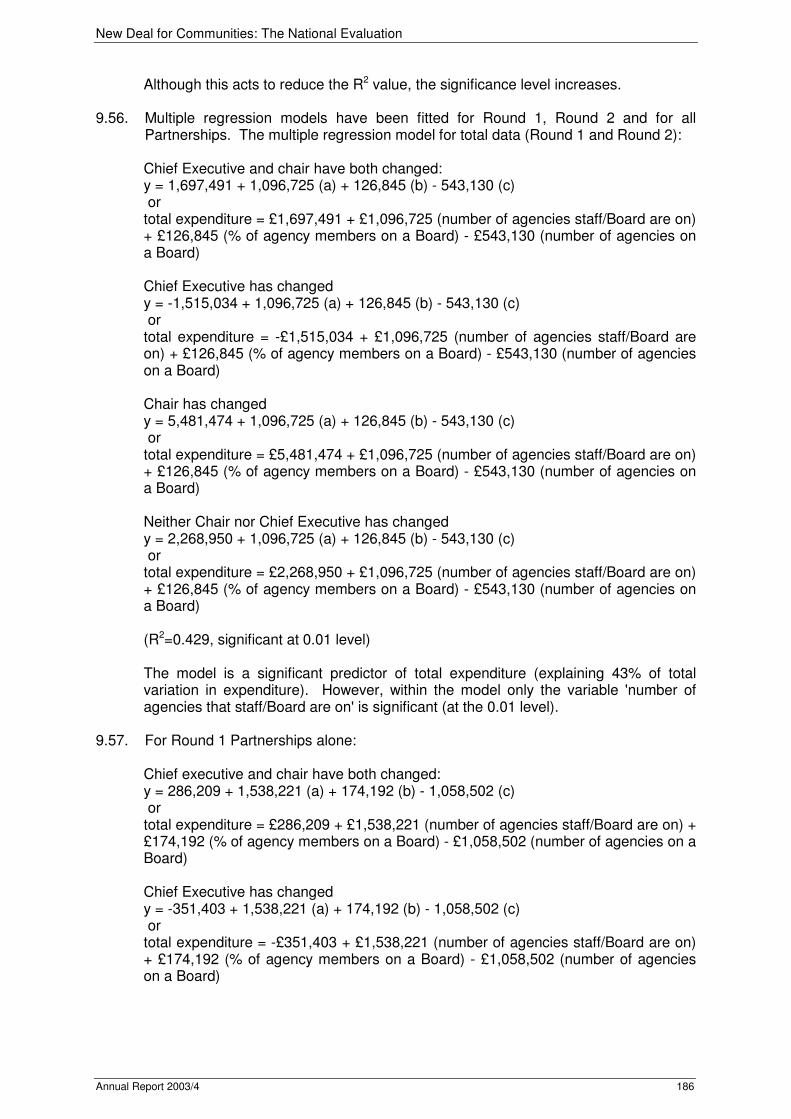
New Deal for Communities: The National Evaluation
Annual Report 2003/4 186
Although this acts to reduce the R2 value, the significance level increases. 9.56. Multiple regression models have been fitted for Round 1, Round 2 and for all
Partnerships. The multiple regression model for total data (Round 1 and Round 2):
Chief Executive and chair have both changed: y = 1,697,491 + 1,096,725 (a) + 126,845 (b) - 543,130 (c) or total expenditure = £1,697,491 + £1,096,725 (number of agencies staff/Board are on) + £126,845 (% of agency members on a Board) - £543,130 (number of agencies on a Board) Chief Executive has changed y = -1,515,034 + 1,096,725 (a) + 126,845 (b) - 543,130 (c) or total expenditure = -£1,515,034 + £1,096,725 (number of agencies staff/Board are on) + £126,845 (% of agency members on a Board) - £543,130 (number of agencies on a Board) Chair has changed y = 5,481,474 + 1,096,725 (a) + 126,845 (b) - 543,130 (c) or total expenditure = £5,481,474 + £1,096,725 (number of agencies staff/Board are on) + £126,845 (% of agency members on a Board) - £543,130 (number of agencies on a Board) Neither Chair nor Chief Executive has changed y = 2,268,950 + 1,096,725 (a) + 126,845 (b) - 543,130 (c) or total expenditure = £2,268,950 + £1,096,725 (number of agencies staff/Board are on) + £126,845 (% of agency members on a Board) - £543,130 (number of agencies on a Board) (R2=0.429, significant at 0.01 level) The model is a significant predictor of total expenditure (explaining 43% of total variation in expenditure). However, within the model only the variable 'number of agencies that staff/Board are on' is significant (at the 0.01 level).
9.57. For Round 1 Partnerships alone:
Chief executive and chair have both changed: y = 286,209 + 1,538,221 (a) + 174,192 (b) - 1,058,502 (c) or total expenditure = £286,209 + £1,538,221 (number of agencies staff/Board are on) + £174,192 (% of agency members on a Board) - £1,058,502 (number of agencies on a Board) Chief Executive has changed y = -351,403 + 1,538,221 (a) + 174,192 (b) - 1,058,502 (c) or total expenditure = -£351,403 + £1,538,221 (number of agencies staff/Board are on) + £174,192 (% of agency members on a Board) - £1,058,502 (number of agencies on a Board)
New Deal for Communities: The National Evaluation
Annual Report 2003/4 187
Chair has changed y = 7,064,854 + 1,538,221 (a) + 174,192 (b) - 1,058,502 (c) or total expenditure = £7,064,854 + £1,538,221 (number of agencies staff/Board are on) + £174,192 (% of agency members on a Board) - £1,058,502 (number of agencies on a Board) Neither Chair nor Chief Executive has changed y = 3,264,613 + 1,538,221 (a) + 174,192 (b) - 1,058,502 (c) or total expenditure = £3,264,613 + £1,538,221 (number of agencies staff/Board are on) + £174,192 (% of agency members on a Board) - £1,058,502 (number of agencies on a Board) (R2=0.891, significant at 0.01 level) This model is a significant predictor of Round 1 total expenditure (explaining 89% of total variation in expenditure). All variables within the model are significant.
EFFECTIVENESS AND WORKLESSNESS
9.58. As is developed in Chapter 2, there is currently little in the way of change data. But there is more for worklessness than for any other outcome area. The relationship between spend and outcomes will take on increasing significance as the evaluation unfolds because of its role in attribution. One of the first 'sieves' through which to explore positive net change at the Partnership level in worklessness (and indeed other outcome areas as well) will be that of spend. If Partnerships in conjunction with partner agencies are spending little on projects or initiatives which might plausibly impact on worklessness, net change cannot realistically be attributed to NDC activity.
9.59. Evidence is available which helps identify what initiatives Partnerships wish to adopt in interventions designed to reduce worklessness. During summer 2002 the national evaluation team undertook a review of all 39 of the original Delivery Plans. This identified the main outcomes assumed by Partnerships and projects designed to attain these targets. It should be stressed that this analysis is based on the early aspirations of, often interim, Partnerships and not on actions. The most frequently mentioned outcomes were:
• Reducing unemployment.
• Helping new business start-ups.
• Boosting household earnings.
• Attacking unemployment amongst BME groups.
• Improving skills amongst local residents.
9.60. And to achieve these outcomes, the most frequently mentioned projects in the 39
original Delivery Plans were:
• Training and skill centres.
• Business development initiatives.
• Business training.
• Childcare facilities.
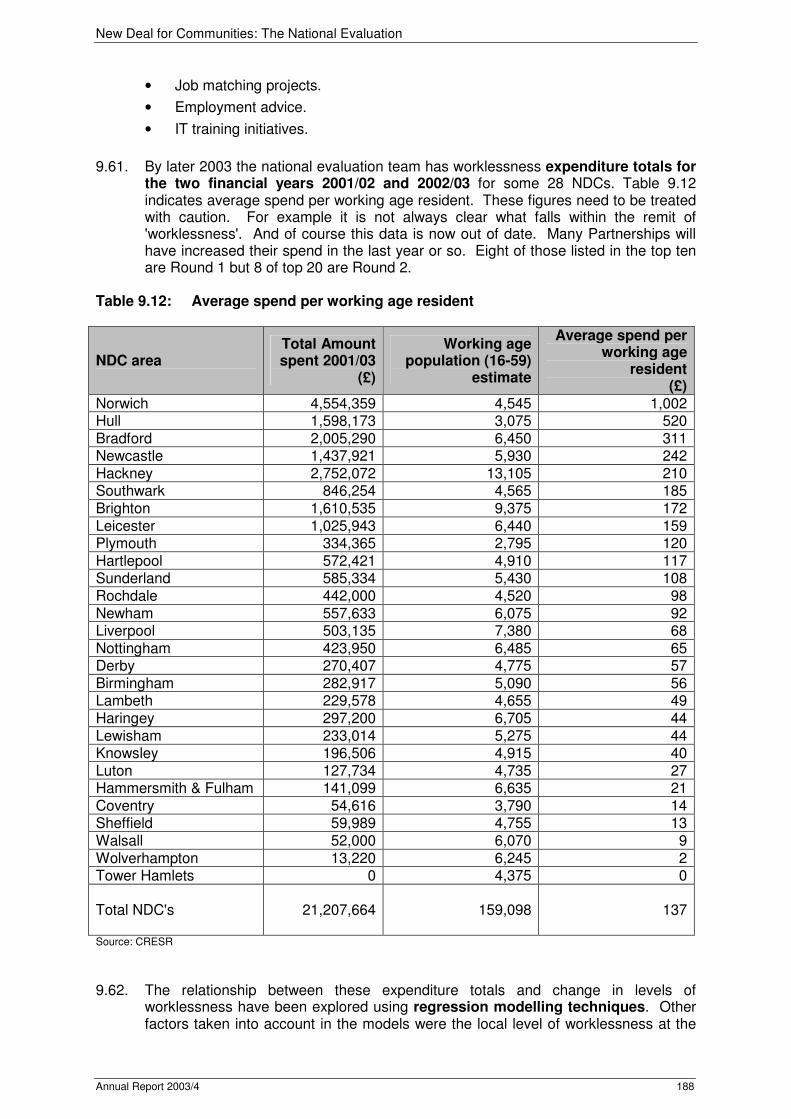
New Deal for Communities: The National Evaluation
Annual Report 2003/4 188
• Job matching projects.
• Employment advice.
• IT training initiatives.
9.61. By later 2003 the national evaluation team has worklessness expenditure totals for
the two financial years 2001/02 and 2002/03 for some 28 NDCs. Table 9.12 indicates average spend per working age resident. These figures need to be treated with caution. For example it is not always clear what falls within the remit of 'worklessness'. And of course this data is now out of date. Many Partnerships will have increased their spend in the last year or so. Eight of those listed in the top ten are Round 1 but 8 of top 20 are Round 2.
Table 9.12: Average spend per working age resident
NDC area Total Amount spent 2001/03
(£)
Working age population (16-59)
estimate
Average spend per working age
resident (£)
Norwich 4,554,359 4,545 1,002 Hull 1,598,173 3,075 520 Bradford 2,005,290 6,450 311 Newcastle 1,437,921 5,930 242 Hackney 2,752,072 13,105 210 Southwark 846,254 4,565 185 Brighton 1,610,535 9,375 172 Leicester 1,025,943 6,440 159 Plymouth 334,365 2,795 120 Hartlepool 572,421 4,910 117 Sunderland 585,334 5,430 108 Rochdale 442,000 4,520 98 Newham 557,633 6,075 92 Liverpool 503,135 7,380 68 Nottingham 423,950 6,485 65 Derby 270,407 4,775 57 Birmingham 282,917 5,090 56 Lambeth 229,578 4,655 49 Haringey 297,200 6,705 44 Lewisham 233,014 5,275 44 Knowsley 196,506 4,915 40 Luton 127,734 4,735 27 Hammersmith & Fulham 141,099 6,635 21 Coventry 54,616 3,790 14 Sheffield 59,989 4,755 13 Walsall 52,000 6,070 9 Wolverhampton 13,220 6,245 2 Tower Hamlets 0 4,375 0 Total NDC's
21,207,664 159,098 137
Source: CRESR
9.62. The relationship between these expenditure totals and change in levels of
worklessness have been explored using regression modelling techniques. Other factors taken into account in the models were the local level of worklessness at the

New Deal for Communities: The National Evaluation
Annual Report 2003/4 189
start of the NDC programme and the rate of change occurring in the wider local authority area. So far the models have shown that no significant relationship exists between change in worklessness and expenditure. However, it should be noted that this analysis was of a purely exploratory nature and when complete data is available for all 39 NDCs, for a longer period of time, these findings may change.
9.63. This is of course a 10 year programme during which time it can be assumed that total spend undertaken by Partnerships and partner agencies on worklessness (and other themes) will increase substantially. Statistical relationships may well emerge as the evaluation evolves. In addition the evaluation team will also look to refine this first and relatively crude analysis of outcomes and expenditure patterns. For instance once project expenditure data is available one question to ask will be the degree to which worklessness outcomes appear more readily to achieve using supply side, as opposed to demand led, initiatives.
9.64. But just to reflect briefly on the scale of investment in worklessness outlined in Table
9.13 in the context of NDCs in their wider labour market. This table indicates the decrease in absolute numbers which would be required to bring worklessness figures in NDCs down to that of their parent local authority. In 2002 this amounted to about 20,000 people. Job creation costs vary considerably. Some evidence indicates jobs being created in training for less than £10k, in other more intensive physical development schemes job creation costs can be recorded at more than £50k per job. Certainly a figure of £20k might not be wildly out as an average. This suggests that solely to achieve the outcome of reducing worklessness to the local authority district for those resident in the area in 2002 would cost of the order of £400m. But of course the 2002 MORI /NOP household survey pointed out that about 25% of people intend to leave the NDC within two years. Hence it might not be unrealistic to suggest that over a 10 year period it may be necessary to create 40,000 jobs at a cost which might not be far off a billion pounds. It seems probable that vastly greater sums will be need to be spent by Partnerships and mainstream agencies if NDC worklessness figures are to equate more with those prevailing in parent local authorities as whole.
Table 9.13: Reduction in the number of workless residents needed to bring NDC in line with parent authority worklessness rates 2002
% workless in 2002
NDC
Working age population NDC LA
difference in rates
Decrease in workless needed to
bring NDC to LA rate of
worklessness
Doncaster 5,698 31.8 13.4 18.4 1,047
Sheffield 4,754 29.7 11.7 18.0 855 Coventry 3,790 28.6 11.4 17.2 652
Newcastle 5,932 32.3 15.8 16.5 978 Knowsley 4,913 37.7 21.3 16.3 803
Plymouth 2,797 28.2 12.0 16.2 452 Sunderland 5,431 32.7 16.6 16.1 876 Liverpool 7,378 35.2 21.8 13.4 990
Bradford 6,449 25.0 12.1 13.0 836 Hartlepool 4,912 32.6 19.8 12.8 629
Brent 4,590 23.4 10.9 12.5 575 Manchester 4,757 27.7 15.6 12.2 579 Birmingham Kings Norton 5,091 25.4 14.5 10.9 555
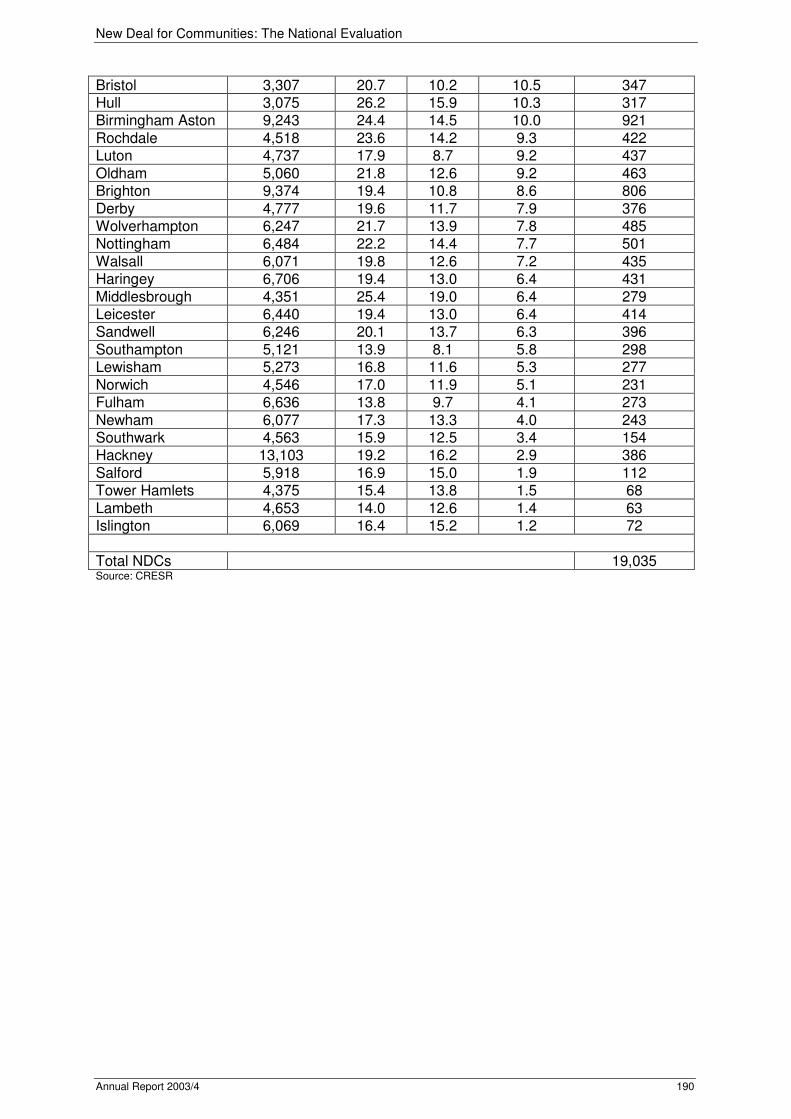
New Deal for Communities: The National Evaluation
Annual Report 2003/4 190
Bristol 3,307 20.7 10.2 10.5 347 Hull 3,075 26.2 15.9 10.3 317 Birmingham Aston 9,243 24.4 14.5 10.0 921
Rochdale 4,518 23.6 14.2 9.3 422 Luton 4,737 17.9 8.7 9.2 437
Oldham 5,060 21.8 12.6 9.2 463 Brighton 9,374 19.4 10.8 8.6 806
Derby 4,777 19.6 11.7 7.9 376 Wolverhampton 6,247 21.7 13.9 7.8 485 Nottingham 6,484 22.2 14.4 7.7 501
Walsall 6,071 19.8 12.6 7.2 435 Haringey 6,706 19.4 13.0 6.4 431
Middlesbrough 4,351 25.4 19.0 6.4 279 Leicester 6,440 19.4 13.0 6.4 414 Sandwell 6,246 20.1 13.7 6.3 396
Southampton 5,121 13.9 8.1 5.8 298 Lewisham 5,273 16.8 11.6 5.3 277
Norwich 4,546 17.0 11.9 5.1 231 Fulham 6,636 13.8 9.7 4.1 273
Newham 6,077 17.3 13.3 4.0 243 Southwark 4,563 15.9 12.5 3.4 154 Hackney 13,103 19.2 16.2 2.9 386
Salford 5,918 16.9 15.0 1.9 112 Tower Hamlets 4,375 15.4 13.8 1.5 68
Lambeth 4,653 14.0 12.6 1.4 63 Islington 6,069 16.4 15.2 1.2 72
Total NDCs 19,035 Source: CRESR