The Productivity of Public Charter Schools
44
The Productivity of Public Charter Schools Larry Maloney Jay F. May Sheree T. Speakman Patrick J. Wolf Albert Cheng Meagan Batdorff July 2014
Transcript of The Productivity of Public Charter Schools

The Productivity of Public Charter Schools
Larry Maloney
Jay F. May
Sheree T. Speakman
Patrick J. Wolf
Albert Cheng
Meagan Batdorff
July 2014

The Productivity of Public Charter Schools
Patrick J. Wolf
Albert Cheng
Meagan Batdorff
Larry Maloney
Jay F. May
Sheree T. Speakman
July 2014
School Choice Demonstration Project
Department of Education Reform
University of Arkansas
201 Graduate Education Building
Fayetteville, AR 72701
479-575-6345
www.uaedreform.org/the-productivity-of-charter-schools

Following is a list of corrections to the report, The Productivity of Public Charter Schools, released on July 22, 2014 by the School Choice Demonstration Project at the University of Arkansas. These corrections are current as of July 26, 2014 and are reflected in this edition of the report.
1) Location: Page 17, paragraph 3
Previous, Incorrect Reading:
As described in Table 5, most of the states in our study achieved higher levels of charter school cost effectiveness because the NAEP scores of charter students were higher than those for TPS students even while charters received less funding than TPS. In the area of math, the charter sectors in these 11 states produced more with less: Delaware, Illinois, Pennsylvania, Maryland, Massachusetts, Michigan, Minnesota, Ohio, Texas, Utah, and Wisconsin. In the area of reading, the charter sectors in these 13 states produced more with less: Arizona, California, Colorado, Delaware, District of Columbia, Florida, Georgia, Hawaii, Idaho, Oregon, New Mexico, North Carolina, and Utah. The charter sectors in the remaining 11 states in math and 9 states in reading were more cost effective because their student test scores were equal
Current, Correct Reading:As described in Table 5, most of the states in our study achieved higher levels of charter school cost effectiveness because the NAEP scores of charter students were higher than those for TPS students even while charters received less funding than TPS. In the area of math, the charter sectors in these 11 jurisdictions produced more with less: District of Columbia, California, Oregon, Idaho, Arizona, Delaware, Colorado, New Mexico, Georgia, North Carolina, and Utah. In the area of reading, the charter sectors in these 12 states produced more with less: California, Oregon, Florida, Idaho, Arizona, Delaware, Colorado, New Mexico, Georgia, North Carolina, Utah, and Hawaii. The charter sectors in the remaining 11 states in math and 10 states in reading were more cost effective because their student test scores were equal to or slightly lower than the TPS scores while their funding levels were significantly lower than the TPS.
2) Location: Page 20, Table 5
Description of Changes: Table 5 on page 21 has been edited to reflect the changes in page 17, paragraph 3 (see above).
The Productivity of Public Charter Schools
Errata

The University of Arkansas was founded in 1871 as the flagship institution of higher education for the state of Arkansas. Established as a
land grant university, its mandate was threefold: to teach students, conduct research, and perform service and outreach.
The College of Education and Health Professions established the Department of Education Reform in 2005. The department’s mission is to advance education and economic development by focusing on the improvement of academic achievement in elementary and secondary schools. It conducts research and demonstration projects in five primary areas of reform: teacher quality, leadership, policy, accountability, and school choice.
The School Choice Demonstration Project (SCDP), based within the Department of Education Reform, is an education research center devoted to the non-partisan study of the effects of school choice policy and is staffed by leading school choice researchers and scholars. Led by Dr. Patrick J. Wolf, Professor of Education Reform and Endowed 21st Century Chair in School Choice, SCDP’s national team of researchers, institutional research partners and staff are devoted to the rigorous evaluation of school choice programs and other school improvement efforts across the country. The SCDP is committed to raising and advancing the public’s understanding of the strengths and limitations of school choice policies and programs by conducting comprehensive research on what happens to students, families, schools and communities when more parents are allowed to choose their child’s school.

Table of ContentsExecutive Summary . . . . . . . . . . . . . . . . . . . . . . . . . . . . . . . . . . . 6
The Productivity of Charter Schools . . . . . . . . . . . . . . . . . . . . . 8
Appendix A . . . . . . . . . . . . . . . . . . . . . . . . . . . . . . . . . . . . . . . . . . 36
Appendix B . . . . . . . . . . . . . . . . . . . . . . . . . . . . . . . . . . . . . . . . . . 38
Appendix C . . . . . . . . . . . . . . . . . . . . . . . . . . . . . . . . . . . . . . . . . . 43
About the Authors . . . . . . . . . . . . . . . . . . . . . . . . . . . . . . . . . . . 44
The Productivity of Public Charter Schools

The ProducTiviTy of Public charTer SchoolS 6
People often wish to know how much bang they get for their buck. This calculation is often referred to as either cost effectiveness or return on investment (ROI). In the US, taxpayers invest substantial sums of money – nearly $600 billion last year – in K-12 public education. Moreover, public charter schools are emerging as increasingly common alternatives to traditional public schools (TPS) within the public school sector. What levels of cost effectiveness and ROI do charter schools yield in the US compared with TPS? How do those differences vary across states with a substantial charter schooling sector? These important policy questions motivate this study. This report follows on the heels of the April 2014 national charter school revenue study released by the School Choice Demonstration Project at the University of Arkansas, Charter School Funding: Inequity Expands. It draws upon what we know about how much money is invested in public charter schools and TPS, how much student achievement is generated by the two public school sectors, and what economic payoff we can expect to realize due to these educational investments.
Our calculation of cost effectiveness is based on the funding levels and aggregate performance of students in a given state’s charter and TPS sectors on the National Assessment of Educational Progress (NAEP). We express cost effectiveness in terms of the NAEP points resulting per $1000 invested per pupil in each of the charter and TPS sectors. Our measure of return on investment (ROI) is based on the lifetime economic returns from the cognitive ability developed during years in charter schooling versus schooling in traditional public schools. By cognitive ability we mean knowledge as commonly measured by intelligence and achievement tests, or what is often called learning. Greater cognitive ability
(learning) is associated with higher lifetime earnings as a person’s knowledge and skills are rewarded economically in the workplace.
We find that while charter schools in some states have uneven performance, the average charter in this study outperforms TPS on both the cost effectiveness and the ROI measures, overall and for each of the states and the District of Columbia (DC) for which we have complete data on all of the elements in our calculations. Specifically:
• Comparing NAEP achievement obtained in public charter schools versus TPS for 21 states and DC, we find (Figure ES 1):
o The public charter school sector delivers a weighted average of an additional 17 NAEP
The Productivity of Public Charter Schools
Figure ES 1: NAEP Points per $1000 Investment in Public Charter versus Traditional Public Schools
Diffe
renc
es in
NAE
P Po
ints
per $
1000
of I
nves
tmen
t
Traditional Public SchoolsCharter Schools
Math Achievement Reading Achievement
60
50
40
30
20
10
0
Note: All data pertain to the 2010-2011 academic year. Revenue data adapted from Charter School Funding: Inequity Expands, by Batdorff et al., 2014, http://www.uaedreform.org/charter-funding-inequity-expands/. Achievement data adapted from http://nces.ed.gov/nationsreportcard/naepdata/dataset.aspx.
Executive Summary

The ProducTiviTy of Public charTer SchoolS 7
points per $1000 invested in math, representing a productivity advantage of 40% for charters;
o In reading, the public charter sector delivers an additional 16 NAEP points per $1000 invested, representing a productivity advantage of 41% for charters;
o Percentage differences in cost effectiveness for charters compared to that for TPS in terms of NAEP math score points per $1000 invested ranges from 7 percent (Hawaii) to 109 percent (Washington DC);
o Percentage differences in cost effectiveness for charters compared to that for TPS in terms of NAEP reading score points per $1000 invested ranges from 7 percent (Hawaii) to 122 percent (Washington DC).
• Comparing lifetime economic returns to learning obtained in public charter schools versus TPS for 20 states and DC, we find (Figure ES 2):
o In all states, charter schools deliver a greater ROI than do TPS;
o The public charter school ROI exceeds the TPS ROI by a weighted average of almost 3 percent assuming a student has a single year of charter schooling but is 19 percent assuming that a child attends charter schools for half of their K-12 education (6.5 years);
o The higher ROI for charters compared to TPS ranges from +0.4 percent (New Mexico) to +4 percent (Washington DC) assuming a single year of charter schooling and from 3 percent to 33 percent assuming a student spends half of their K-12 years in charters.
Special thanks go to Eric Hanushek and Margaret Raymond of Stanford University and Robert Costrell of the University of Arkansas who provided insightful
comments and suggestions based on an independent review of a preliminary draft of this report. We also appreciate the guidance of Gary Larson and Ida Linden of Larson Communications regarding how to make this complicated work understandable to researchers and the public. We are grateful to Marlo Crandall of Remedy Creative for graphic design and formatting enhancements. We thank Evan Rhinesmith and Sivan Tuchman for research assistance. The generous contributions of all of these people greatly improved the report. Any remaining flaws are solely attributable to the report authors.
This work was made possible by a research grant from the Walton Family Foundation. We thank them for their support and acknowledge that the content of the report is entirely the responsibility of the research team and does not necessarily reflect the positions of the Foundation or the University of Arkansas.
Figure ES 2: Additional Percentage Return on Investment for Charter Schools Relative to TPS
20
18
16
14
12
10
8
6
4
2
0
Years of Charter Schooling
Diffe
renc
es in
Rat
e of
Ret
urn
Rela
tive
to T
radi
tiona
l Pub
lic S
choo
ls
1 Year 6.5 Years
20
18
16
14
12
10
8
6
4
2
0
Years of Charter Schooling
Diffe
renc
es in
Rat
e of
Ret
urn
Rela
tive
to T
radi
tiona
l Pub
lic S
choo
ls1 Year 6.5 Years
Note: All data pertain to the 2010-2011 academic year. Figure shows additional returns on investment for charter schools relative to traditional public schools, as if both sectors received per-pupil revenues equal to that of charter schools. Revenue data adapted from Charter School Funding: Inequity Expands, by Batdorff et al., 2014, http://www.uaedreform.org/charter-funding-inequity-expands/. Achievement data provided by CREDO, Stanford University.

The ProducTiviTy of Public charTer SchoolS 8
Introduction
This is the first national study of the productivity of public charter schools relative to district schools. This report is a follow up to the charter school revenue study, Charter School Funding: Inequity Expands, released in April 2014 by the School Choice Demonstration Project at the University of Arkansas.1 That study was authored by the same research team that crafted this report. In the revenue study, per pupil revenues for public charter schools and traditional public schools (TPS) were compared. The research team found that during the 2010-11 school year (FY11), charter-school students across 30 states and the District of Columbia on average received $3,814 less in funding than TPS students, a funding gap of 28.4 percent.
While the revenue study sought to determine whether there was a funding disparity between charter and TPS students, and if the gap has been closing or growing over the past nine years, this report extends the scope of that research by asking a different but related question: What is the relative productivity of public charter schools and TPS, both in terms of their cost effectiveness and their return on investment (ROI)? The fact that a funding disparity between charter and TPS exists, as demonstrated in our prior report, is not the only relevant issue in the charter school debate. Addressing how productively the two public school sectors operate is equally important, especially since U.S. governments spent collectively nearly $600 billion on K-12 public education in 2012.2 It matters not only how much but also how well schools use public funds.3 If funding is equal across the two sectors in a given state, the school sector that generates larger student achievement gains is more productive. If student achievement gains are equal across the two sectors in
a given state, the school sector that receives less per-pupil revenue is more productive. We explore these issues in this analysis of charter schools and TPS across 28 states and the District of Columbia (see Appendix A for a description of the states included in this study and the reasons why other states were excluded).
Schools deliver a return on the total revenues that they receive by using those revenues to produce learning gains that subsequently generate higher levels of lifetime earnings for students. As organizations, schools receive revenues that are converted into educational inputs such as teachers, other school staff, textbooks, computers, and facilities. As a result of the mobilization of these inputs – teachers teaching, other staff supporting, textbooks being read and computers being used – students gain a certain amount of learning which is often measured (however imperfectly) by standardized tests. Our first measure of productivity is a cost effectiveness analysis. In this analysis, we consider how many test score points students gain on the 2010-11 National Assessment of Educational Progress (NAEP) for each $1000 invested in their public education in the charter compared to the TPS sectors. Our second measure of productivity goes further. Specifically, we calculate a return on investment (ROI) by converting the learning gains developed over time by students in the public charter and TPS sectors into an estimate of the economic returns over a lifetime for students and comparing those returns to the revenue amounts invested in their education.
The analyses we present in this report indicate that charter schools are more productive than TPS, either because they produce higher student gains at a lower cost or because they produce similar or only slightly lower student outcomes at a significantly lower cost.
The Productivity of Public Charter Schools

The ProducTiviTy of Public charTer SchoolS 9
These results hold for all states in our analytic samples and both in terms of the number of NAEP score points generated per $1000 invested and in terms of the lifetime economic returns to learning. According to the cost effectiveness analysis that uses NAEP scores, all 21 states and the District of Columbia in our sample have charter sectors that produce more NAEP points per $1000 spent than do their TPS. Likewise, the analysis that uses economic returns to learning indicates that the charter school ROI is higher than the TPS ROI for all 20 states and the District of Columbia in our study sample. The charter school advantage regarding ROI is largest for the District of Columbia, where investments in charter schooling yield an additional 4 percent return for a single year of charter schooling and a 33 percent return for 6.5 years in a public charter school compared to a TPS.
Our analysis leads to the major conclusion from the study (also the fourth and final finding from our national charter school revenue study):
Finding: Charter schools tend to exhibit more productivity than traditional public schools.
We proceed as follows. In the next section we discuss the general concepts of cost effectiveness and ROI. We then present our approach for and results of calculating cost effectiveness figures in terms of NAEP scores produced by the charter sector compared to the TPS sector. We follow that analysis by describing our approach for and results of calculating the ROI in terms of the economic benefits of learning for students who spend one or 6.5 years in the charter sector, and the rest of their schooling in the TPS
sector, compared to students who spend their entire K-12 education enrolled in the TPS sector. Finally we discuss the limitations of the study and draw conclusions.
Cost Effectiveness and Return on Investment (ROI)
Our purpose is to explore the productivity of charter schools compared to TPS. In other words, does charter schooling appear to be a more cost-effective means of delivering public education and do students who attend charter schools realize greater economic benefits per dollar of investment? To answer this question, we calculate cost effectiveness and return on investment (ROI) figures for charter and TPS for all states with a sufficient charter school presence that also had data available to inform our calculations.4 This is the first study with a national scope to explicitly examine the important issue of the cost effectiveness and ROI of public charter schools compared to TPS.
First, we define the terms that are central to our study. Cost effectiveness is a measurement of “the efficacy of a program in achieving given intervention outcomes in relation to the program costs.”5 In our case, the intervention is charter schooling as an alternative to education in a TPS. Charter schools are public schools that operate on a charter contract that usually grants them autonomy from direct control by the local school district and freedom from certain regulations in exchange for a commitment to achieve specific performance objectives. We define traditional public schools (TPS) as any public school that is not a charter school. The outcomes used in the cost effectiveness analysis are student math and reading achievement scores on the National Assessment of
The analyses we present in this report indicate that charter schools are more productive than TPS, either because they produce higher student gains at a lower cost or because they produce similar or only slightly lower student gains at a significantly lower cost.

The ProducTiviTy of Public charTer SchoolS 10
Educational Progress (NAEP). Program costs are the average per-pupil revenues allocated to students in the two public school sectors, charter and TPS. We express the cost effectiveness of public charter and TPS in terms of average student NAEP scores in math and reading obtained per $1000 of revenue.
Cost Effectiveness = NAEP Score / Cost of Investment
Return on investment is commonly defined as:
A performance measure used to evaluate the efficiency of an investment or to compare the efficiency of a number of different investments. To calculate ROI, the benefit (return) of an investment is divided by the cost of the investment; the result is expressed as a percentage or a ratio.6
We apply the concept in precisely this way in our second analysis herein – as a means to compare the relative efficiency of investment in public charter schools compared to investment in traditional public schools.
The ROI figures used in our analysis are benefit-to-cost ratios where returns in the form of estimated lifetime earnings are used in the numerator and per-pupil revenues are used in the denominator.
ROI = Income Returns to Investment / Cost of Investment
It is best to think of the ROI comparison as a thought experiment. Imagine two students who differ in that one attends a public charter school for some of his primary and secondary schooling and the other only attends a TPS. They are otherwise approximately similar in background demographic characteristics, and both attend traditional public schools for all other school years. This analysis uses achievement gains for these two students to calculate the returns to their lifetime earnings for every dollar invested into their thirteen years of schooling.
Investment costs inform the denominator of the ROI figures. These costs are drawn from the per-pupil revenue figures for Fiscal Year 2010-11 (FY11) reported
in our previously released revenue study. That study was produced by a research team with 70 years of collective finance experience in various industries, including intergovernmental fiscal relations and public school districts. The study was explicitly and deliberately a study of the revenues received by public charter schools and traditional public school districts. The recording of revenues received by charter and district schools is generally more concise and accurate than is the recording of expenditures made by such schools because revenues more closely follow mandatory fund accounting practices. All public and private sources of revenue, with the exception of bond monies, were counted when and if they actually ended up at a public charter school or traditional public school district. For example, revenue earmarked for charter school transportation that “passed through” a TPS district on its way to the charter was counted as charter school revenue, because that is where it ended up, and not counted as traditional public school revenue. We confirmed where revenue ended up by systematically reviewing audited district and charter school financial reports. The revenue calculations from the study quite simply and accurately capture how much was invested in public charter and traditional public schools in FY11. All financial and achievement data used in this analysis are from FY11. For additional details regarding the revenue study methodology, please see Appendix B.
The main conclusion of our charter school revenue study was that, on average, charter schools nationally received $3,814 less in revenue per-pupil than did traditional public schools. Critics of the report, including Gary Miron and Bruce D. Baker, claimed that the charter school funding gap we reported is largely due to charter schools enrolling fewer disadvantaged students than TPS.7 Miron stated that, “Special education and student support services explains most of the difference in funding.”8 Baker specifically claimed that charter schools enroll fewer students who qualify for free lunch and therefore suffer from deep poverty, compared to TPS.9
We provide evidence with which to test these claims that the charter school funding gap is due to charters

The ProducTiviTy of Public charTer SchoolS 11
under-enrolling disadvantaged students, and that the gap would disappear if charters simply enrolled more special education students.10 To the first point, Table 1 includes aggregate data about the student populations served by the charter and TPS sectors for the 31 states in our revenue study. The states are sorted by the extent to which their charter sector enrolls a disproportionate percentage of free lunch students compared to their TPS sector. A majority of the states in our study (16 out of 31) have charter sectors that enroll a higher percentage of free lunch students than their TPS sector – directly contradicting Baker’s claim. Hawaii charters enroll the same percentage of free lunch students as do Hawaii TPS. For a minority of the states in our study (14 out of 31), their charter school sector enrolls a lower percentage of free lunch students than does their TPS sector.
The middle three columns of Table 1 compare the charter and TPS sectors regarding the broader low-income measure of participation in the free and reduced-priced lunch (FRL) program. Charter sectors enroll more disadvantaged students than TPS sectors in 18 of the 31 states in our revenue study using FRL as a measure of disadvantage.
The three columns of data on the far right side of Table 1 present a similar comparison of student populations by rates of official special education designation. Special education designation rates across charter and TPS sectors are both less readily available and less reliable than other measures of student disadvantage. Several studies indicate that schools in the TPS sector designate students as requiring special education services at higher rates than do schools in the charter or private school sectors.11 In spite of this measurement bias across school sectors, we see that at least four states in our revenue study – Illinois, Texas, North Carolina and New Mexico – include charter sectors that enroll a similar or higher proportion of students requiring special education services than their respective TPS sectors, while 16 states appear to have lower proportions of students with special needs in their charter sectors compared to their TPS sectors. For 11 states insufficient data are available to make the comparison.
The data indicate that the charter school sectors in our revenue study tend to enroll more low-income students than their TPS, using either free lunch only or FRL as the measure of poverty, but less students with special education designations. Might the difference in special education enrollment rates across the charter and TPS sectors explain the charter school funding gap, as some people suggest? The weighted average special education enrollment rates for the 20 states in our study that reported those data were 6.1 percent for charters and 9.1 percent for TPS. The special education enrollment gap between the two sectors in our sample was 3 percentage points, which is consistent with the gap nationally, as reported by Marcus A. Winters.12 In order for the extra 3 percent of student enrollments in special education in TPS to explain the $3,814 per-pupil revenue gap between the sectors, each additional student enrolled in TPS beyond the charter rate of 6.1 percent of student enrollments would have to bring with them $127,133 in revenue (i.e. $3,814/0.03). Few special education students across the country are funded at such a high level, much less the millions of students that would be required for the narrow gap in special education enrollment in charter schools to explain away more than a fraction of the large charter school funding gap that we uncovered in our revenue study.
The claims by Baker and Miron that differences in the enrollment rates of disadvantaged students across the charter and TPS sectors largely explains the gap in funding is inconsistent with the actual evidence. The charter sectors in our study actually tend to enroll a higher percentage of low-income students than the TPS sectors, regardless of whether one uses free lunch or FRL as the poverty measure. The special education enrollment gap of just 3 percentage points is far too small to explain much of the charter school funding gap, even if many of the additional special education students in the TPS sector had the most severe, highest cost, disabilities imaginable. As our revenue study concluded, a far more obvious explanation for the large charter school funding gap is that state and local policies and practices deny public charter schools access to some educational funding streams, whether

The ProducTiviTy of Public charTer SchoolS 12
Table 1: Selected Student Enrollment Characteristics across the Charter and TPS Sectors
Free-Price Lunch Students Only (%)
Free- or Reduced-Price Lunch Students (%) Special Education Students (%)
State Charter TPS Difference (Charter - TPS) Charter TPS Difference
(Charter - TPS) Charter TPS Difference (Charter - TPS)
Illinois 73.5 39.5 34.0 79.9 44.9 35.0 14.4 13.1 1.3Missouri 69.1 36.7 32.4 74.0 43.7 30.3 N/A N/A N/ANew Jersey 57.4 26.7 30.7 69.4 32.1 37.3 9.1 16.2 -7.1
Connecticut 55.0 28.8 26.2 67.6 33.7 33.9 7.2 11.4 -4.2
New York 66.5 40.6 26.0 77.3 47.5 29.8 N/A N/A N/AMaryland 58.5 33.0 25.5 66.9 39.6 27.3 12.0 12.4 -0.4Michigan 64.5 39.1 25.3 70.0 44.5 25.5 N/A N/A N/AMinnesota 48.3 27.6 20.7 55.9 35.6 20.3 12.8 13.3 -0.5Indiana 57.2 38.5 18.7 65.3 46.2 19.1 11.4 14.7 -3.3Louisiana 74.3 58.5 15.9 80.1 65.4 14.7 N/A N/A N/APennsylvania 45.7 32.4 13.2 54.5 38.1 16.4 N/A 15.2 N/ATexas 56.0 43.1 12.9 72.2 60.8 11.4 11.1 10.8 0.3Massachusetts 41.7 29.6 12.1 50.3 34.8 15.5 12.2 17.9 -5.7Wisconsin 48.1 37.7 10.4 54.9 44.7 10.2 N/A N/A N/AOhio 44.4 36.5 7.8 48.1 42.2 5.9 14.1 14.9 -0.8North Carolina 48.9 47.2 1.7 56.8 53.9 2.9 8.5 7.5 1.0Hawaii 36.3 36.3 0.0 45.0 46.9 -1.9 8.0 10.1 -2.1
Arizona 32.3 35.4 -3.1 39.4 45.8 -6.4 8.0 12.3 -4.3District of Columbia 63.1 67.8 -4.6 82.4 79.7 2.7 12.9 14.4 -1.5Utah 23.5 31.3 -7.8 28.4 39.0 -10.6 10.8 11.1 -0.3California 38.4 46.5 -8.1 46.8 54.3 -7.5 7.5 11.5 -4.0Colorado 24.9 33.9 -9.0 30.7 40.8 -10.1 5.7 9.7 -4.0Florida 39.0 48.5 -9.5 48.8 56.6 -7.8 N/A N/A N/AGeorgia 41.3 50.9 -9.6 48.6 57.6 -9.0 7.9 10.0 -2.1Delaware 30.1 42.9 -12.8 37.8 48.5 -10.7 6.5 11.0 -4.5Arkansas 33.3 50.1 -16.8 48.0 64.7 -16.7 5.4 11.6 -6.2New Mexico 41.7 62.4 -20.7 48.3 68.5 -20.2 14.1 14.1 0.0South Carolina 23.8 48.9 -25.0 30.0 55.1 -25.1 N/A 14.2 N/AIdaho 10.2 37.6 -27.4 15.2 46.7 -31.5 N/A N/A N/ATennessee 11.7 48.0 -36.3 71.5 55.3 16.2 N/A N/A N/AOregon 12.8 51.8 -39.0 12.8 51.8 -39.0 N/A N/A N/A
Notes: All numbers are percentages. N/A indicates that data were not available for special education students. Among FRL students, free-lunch or reduced-price lunch status was unknown in a few cases. In these cases, these students were counted as free-lunch students for the TPS sector and reduced-price lunch students for the charter school sector. All FRL data are available primarily from http://nces.ed.gov/ccd/elsi/ but see Appendix C for exceptions and documentation of other sources of data for some states. Note also that many TPS and charter schools in Oregon and Idaho did not report any FRL figures, and more reliable data sources are not available.

The ProducTiviTy of Public charTer SchoolS 13
intentionally or unintentionally. That reality, much more so than the characteristics of the students in the sectors, explains the gap.
Nevertheless, for the productivity analyses we present in the remainder of this report, we control for the student characteristics of poverty and special education status, either through regression adjustment for the cost effectiveness component or through similar student matching for the return on investment (ROI) component.
Cost Effectiveness Using NAEP Achievement Scores
Our first examination of the relative productivity of the charter and TPS sectors focuses on the NAEP score points reported by each sector for each $1000 in revenue per pupil received in FY11. Before we consider the intricacies of this cost effectiveness analysis, we examine the extent to which two key components of such a calculation – school funding and student achievement – generally interact with each other. Specifically, to what extent is higher per-pupil spending associated with higher levels of student achievement for most of the states in our study? The question of the extent to which money matters in education has been fiercely contested over the years.13 We have 22 state data points with which to explore that question here and make no causal claims, since some states may spend relatively more on education than other states precisely because they have low student achievement, not vice-versa. A good example of this likely endogenous relationship between
spending and achievement is Washington, DC.
An overview of the relationship between achievement and funding for all public schools, charter and traditional combined, is provided in Figure 1. The plot in the upper panel shows the relationship between per-pupil spending and achievement for the 21 states in our analysis as well as the District of Columbia. The relationship is negative — more spending is associated with lower achievement. However, the District of Columbia is an outlier in the sample, located in the lower right corner of the plot, because of its extremely high per-pupil spending and low achievement levels. The plot in the lower panel excludes DC. Once the District of Columbia is removed, the relationship between spending and achievement becomes positive and approximately reverses in magnitude. The fact that associations between spending and achievement can change so dramatically based on the inclusion or exclusion of a single data point illustrates the fragility of that relationship. In fact, by including one additional state (Louisiana) that is not in our analysis because of peculiarities in funding due to monies from hurricane relief, any systematic relationship between spending and achievement disappears, a finding that is widely documented in other educational research.14
Moreover, these scatterplots combine the spending and achievement for public charter and TPS into one statewide average. For our purposes of evaluating the cost effectiveness of public charter schools relative to TPS, those combined averages need to be disaggregated by school sector.
As our revenue study concluded, a far more obvious explanation for the large charter school funding gap is that state and local policies and practices deny public charter schools access to some educational funding streams, whether intentionally or unintentionally. That reality, much more so than the characteristics of the students in the sectors, explains the gap.

The ProducTiviTy of Public charTer SchoolS 14
There are many ways by which one school sector can be more cost effective than another. If funding is equal across the two sectors, the school sector that generates larger student achievement gains is more cost effective. If student achievement gains are equal across the two sectors, the school sector that receives less per-pupil revenue is more cost effective. If the sectors are equal neither in their funding nor in their student achievement, the sector with an achievement advantage that is greater in magnitude than its funding advantage is more cost effective. Naturally, if one school sector generates higher student achievement even when it is funded at lower levels than the other sector, it is more cost effective. Finally, a sector that generates slightly lower achievement levels but is funded well below the other sector also is more cost effective. The charter school sectors in our study are more cost effective than their TPS for these last two reasons: they either generate higher student achievement at lower cost or they generate slightly lower student achievement at much lower cost.
Calculating the Relative Cost Effectiveness of Charter and TPS Using NAEP Scores
Conceptually, cost effectiveness is a function of how much was invested in an activity and what result was obtained for that investment. One effort, among many, that we expect schools to make is to contribute to the cognitive development of their students. Cognitive development is the nurturing of intellectual ability and knowledge in students that we expect schools to support, commonly measured by standardized tests. Throughout this report, we
refer to cognitive development simply as “learning.” The NAEP is the only standardized test to measure learning that is administered to students in every U.S. state. Therefore, to estimate the cost effectiveness for the public charter and TPS sectors, we draw upon the results of our revenue study, which tracked the resources flowing into charter and traditional public
Figure 1: The Relationship between Revenue and Achievement by State: Charter and Traditional Public School Sectors Combined
NAE
P Ac
hiev
emen
t (in
stan
dard
dev
iatio
ns)
NAE
P Ac
hiev
emen
t (in
stan
dard
dev
iatio
ns)
Including DC
3.000
2.000
1.000
0.000
-1.000
-2.000
-3.000
-4.0000.00 5.00 10.00 15.00 20.00 25.00 30.00
Excluding DC
Per Pupil Revenues (in $1000s)
Per Pupil Revenues (in $1000s)
3.000
2.000
1.000
0.000
-1.000
-2.000
-3.000
-4.0000.00 5.00 10.00 15.00 20.00 25.00 30.00
Note: All data pertain to the 2010-2011 Academic Year. Revenue data adapted from Charter School Funding: Inequity Expands, by Batdorff et al., 2014, http://www.uaedreform.org/charter-funding-inequity-expands/. Achievement data adapted from http://nces.ed.gov/nationsreportcard/naepdata/dataset.aspx

The ProducTiviTy of Public charTer SchoolS 15
schools in 2011, along with the 2011 math and reading results of the NAEP for 8th grade students by state for the charter and TPS school sectors. Eighth-grade scores are more appropriate for this analysis than 12th or 4th grade scores. Fourth-grade NAEP scores likely understate all of the student learning that occurs throughout the K-12 educational process because fourth graders have many more years of education remaining. In contrast, 12th grade NAEP scores likely overstate levels of student learning because they do not include lower achieving students who have dropped out of school – an event that typically occurs between 9th and 12th grade. Using 8th grade NAEP scores reduces these measurement concerns, while still providing valid measures of student learning. We express the results of the cost-effectiveness analysis in terms of the average number of NAEP test score points per $1000 invested that year in the charter and TPS sectors.
This approach to calculating school-sector cost effectiveness and the data that underlay it has important limitations that we acknowledge here. The NAEP is a cross-sectional test, applied to a representative sample of students in each state in a given year. Different students are tested each year, meaning that analysts are unable to measure student-level achievement gains. The achievement levels measured by the NAEP at a single point in time are made up of some unknown combination of what the student learned in previous years plus what they learned in the year they were tested. Moreover, NAEP scores differ across states in part because student populations differ across states, and learning is influenced by student background as well as by what happens in school. These factors, which
bias any single estimation of the cost effectiveness in terms of NAEP scores for a given school sector in a given state, likely exert similar influence in both the public charter school and TPS sectors in most cases. Therefore, although the estimation of cost effectiveness for any one school sector in any particular state could be significantly biased, the differences in cost effectiveness between the charter and TPS sectors in a given state are likely to be less biased than sector-specific estimates, as any factors that equally bias the calculation for each sector cancel each other out through subtraction. One exception to the general expectation that biases will approximately cancel each
other out in our analysis is the influence of student background factors on NAEP achievement levels, as student composition is not the same between charter schools and TPS within the same state. Thus, in our cost effectiveness analysis, we account for these differences in student characteristics for charters and TPS. Specifically, we use a method called regression analysis to account for the influence of student characteristics on NAEP scores. We outline the methods below but mention one more caveat before doing so.
NAEP also is a limited measure of school sector productivity because it only measures student achievement in math and reading. Schooling affects a number of other student abilities and traits, including science achievement, grit, conscientiousness, and civic values to name but a few. For our cost effectiveness calculations, we have to make the simplifying assumption that all revenues received by schools in FY11 contributed to math and reading achievement, with half supporting math and half supporting reading. As with the data limitation described above, we
The charter school sectors in our study are more cost effective than their TPS for these last two reasons: they either generate higher student achievement at lower cost or they generate slightly lower student achievement at much lower cost.

The ProducTiviTy of Public charTer SchoolS 16
know that was not actually the case but the extent to which school resources were devoted to student outcomes besides math and reading was likely very similar in the charter and TPS sectors. As a result, the differences between the NAEP cost effectiveness calculations for charters and TPS are not likely to be biased by this focus exclusively on math and reading. One could, instead, assume that only one-seventh of school revenues were spent on math and another one-seventh on reading in both the charter and TPS sectors and the relative cost effectiveness calculations below would equal each other in percentage terms.
Example of NAEP Cost Effectiveness Computation: Arizona
We use the state of Arizona to illustrate how we compute cost effectiveness measures for charters and TPS, as it represents a typical state in our analysis. Because the US Department of Education calculates NAEP scores based on distinctive scales for each subject area, we were unable, easily and transparently, to combine math and reading scores into one composite score. Thus, we calculate separate cost effectiveness measures for math achievement and reading achievement.
Our cost effectiveness calculation is a ratio of NAEP achievement to per-pupil spending. It can be expressed as:
Cost Effectiveness = NAEP Achievement Points / Per-Pupil Revenue
Figures in the numerator are simply taken from reports published by the US Department of Education. During the 2010-2011 school year, Arizona’s 8th graders in charter schools scored an average of 285 on the NAEP math exam, while 8th graders in traditional public schools scored an average of 278. In reading, 8th graders in charter school scored 265 while those in TPS scored 260. If funding were constant across the two sectors, Arizona charter schools would exhibit greater cost effectiveness because the achievement of their students is higher. However, these ratios change again when we also consider the revenues that the schools
receive. Figures for the denominator are taken from our previously released revenue study. Arizona charter schools received $7,783 per student during the 2010-2011 school year. Given our simplifying assumption that all school revenue either benefits math or reading achievement, we divide $7,783 by 2. Thus $3,891.50 was directed to benefit math and reading achievement, respectively. The same calculation is done for TPS. Arizona’s TPS received $9,532 per pupil. Thus $4,766 was directed to benefit math and reading achievement, respectively.
For simplicity, we express these spending figures in thousands of dollars. Dividing these spending figures into the NAEP math and reading scores for charter schools and TPS yields the following cost effectiveness figures.
NAEP math cost effectiveness for charter schools = 285 / 3.89 = 73.26 NAEP points per $1000 spent
NAEP math cost effectiveness for TPS = 278 / 4.77 = 58.28 NAEP points per $1000 spent
NAEP reading cost effectiveness for charter schools = 265 / 3.89 = 68.12 NAEP points per $1000 spent
NAEP reading cost effectiveness for TPS = 260 / 4.77 = 54.51 NAEP points per $1000 spent.
However, these figures could be biased because of differences in student composition across charter and TPS sectors within a given state. While it does appear that charter schools serve a more disadvantaged population of students, as discussed earlier, accounting for these differences in student composition in our cost effectiveness calculations instead of presenting estimates that are likely biased, would make our results more accurate and informative. Thus, we use regression analysis to estimate differences in NAEP points per $1000 invested across the two schooling sectors while controlling for student characteristics,

The ProducTiviTy of Public charTer SchoolS 17
such as the percentage of students who qualify for free lunch, students who qualify for reduced-price lunch, the percentage of students classified as needing special education15, and the percentage of students who are White. We also include a cost of living adjustment to capture differences in the costs of education across states.16 Based on the results of the regression analysis, we adjust the above estimates of NAEP scores per $1000 invested to account for differences in student composition for charters and TPS within each state. This corrects any bias in our cost effectiveness figures that may arise due to the differences in student composition.17
Specifically for Arizona, the adjusted math NAEP scores per $1000 invested in charter schools is 67 NAEP points per $1000 spent, which is slightly less than the unadjusted estimate of 73 NAEP points per $1000 shown above. The adjusted cost effectiveness estimate for charter schools in reading is 63 NAEP points per $1000. On the other hand, the TPS sector in Arizona generates about 48 and 45 NAEP points per dollar in math and reading, respectively. These adjusted cost-effectiveness estimates are presented in Table 2 and Table 3. As displayed in Table 4.1 and Table 4.2, these estimates reflect a difference of about 18 NAEP points per $1000 invested in favor of Arizona charter schools. Put another way, our estimates suggest that Arizona charter schools are 38 and 39 percent more cost effective in math and reading achievement, respectively, compared to Arizona TPS. The roots of the Arizona public charter school cost effectiveness advantage is that Arizona charters generate higher NAEP scores than TPS even while being funded at a lower level.
Complete Cost Effectiveness Results
Estimates of cost effectiveness for charter schools and TPS for the remaining states in our analytic sample are displayed in Tables 2 and 3. Tables 4.1 and 4.2 summarize the difference across the two sectors by showing the absolute and proportional advantages of charter schools relative to TPS in cost effectiveness (i.e., NAEP points reported per $1000 invested). Differences in cost effectiveness are calculated as
charter school cost effectiveness minus TPS cost effectiveness, so that a positive number indicates an advantage in cost effectiveness for charter schools. Though cost effectiveness differs significantly across states, the weighted average for our sample is an extra 17 and 16 NAEP points for charter students in math and reading, respectively, per $1000 in revenue. The absolute charter school sector advantage represents a proportional benefit of about 40 percent in math and 41 percent in reading. The charter school advantage in cost effectiveness is smallest in Hawaii – where charter cost effectiveness is 3 points higher in math (7 percent) and reading (7 percent) – and Illinois – where the charter NAEP cost effectiveness is 5 points higher in math (12 percent) and reading (13 percent). In contrast, for the remaining 20 jurisdictions in our study, the cost effectiveness advantage for charter schools in math ranges from an extra 9 points (18 percent) in Ohio to an extra 27 points (53 percent) in Oregon. Again excluding Hawaii and Illinois where the charter and TPS cost effectiveness figures are similar to each other, the cost effectiveness advantage for charter schools in reading ranges from an extra 9 points (19 percent) in Ohio to an extra 26 points (54 percent) in Oregon.
As described in Table 5, most of the states in our study achieved higher levels of charter school cost effectiveness because the NAEP scores of charter students were higher than those for TPS students even while charters received less funding than TPS. In the area of math, the charter sectors in these 11 jurisdictions produced more with less: District of Columbia, California, Oregon, Idaho, Arizona, Delaware, Colorado, New Mexico, Georgia, North Carolina, and Utah. In the area of reading, the charter sectors in these 12 states produced more with less: California, Oregon, Florida, Idaho, Arizona, Delaware, Colorado, New Mexico, Georgia, North Carolina, Utah, and Hawaii. The charter sectors in the remaining 11 states in math and 10 states in reading were more cost effective because their student test scores were equal to or slightly lower than the TPS scores while their funding levels were significantly lower than the TPS. Charter schools produced slightly less achievement with much less funding.

The ProducTiviTy of Public charTer SchoolS 18
Table 2: NAEP Achievement Levels per Thousand Dollars Invested for Math Achievement
Traditional Public Schools Charter Schools
State Raw NAEP Math Score
Per Pupil Revenue in Math
(in $1000s)
Adjusted NAEP Points per
$1000 Invested Raw NAEP Math Score
Per Pupil Revenue in Math
(in $1000s)
Adjusted NAEP Points per $1000
Invested
Arizona 278 $4.77 48 285 $3.89 67California 273 $5.89 33 277 $4.16 51Colorado 291 $5.55 53 302 $4.39 70
Delaware 282 $6.93 45 296 $5.16 63
District of Columbia 255 $16.41 13 267 $10.04 27Florida 278 $5.09 46 283 $4.02 70Georgia 279 $6.53 47 263 $4.24 61Hawaii 278 $7.08 42 278 $5.28 45Idaho 286 $4.13 61 311 $3.07 87Illinois 283 $6.73 42 269 $5.70 47Maryland 288 $9.55 34 265 $5.88 43Massachusetts 298 $8.97 35 307 $7.07 50Michigan 281 $6.56 51 262 $4.74 69Minnesota 295 $7.42 53 283 $5.71 64New Mexico 274 $5.35 47 277 $5.17 62North Carolina 286 $4.99 54 295 $4.14 68Ohio 290 $5.88 53 265 $4.29 62Oregon 283 $5.48 51 282 $3.06 77Pennsylvania 287 $9.17 47 262 $6.25 64Texas 290 $5.54 41 295 $5.35 52Utah 283 $4.02 57 292 $3.18 71Wisconsin 289 $8.38 51 264 $4.94 70National Sample Average 283 $6.41 43 279 $4.66 60
Note: All data pertain to the 2010-2011 Academic Year. Revenue data adapted from Charter School Funding: Inequity Expands, by Batdorff et al., 2014, http://www.uaedreform.org/charter-funding-inequity-expands/. Achievement data adapted from http://nces.ed.gov/nationsreportcard/naepdata/dataset.aspx. Total per-pupil revenues are divided equally between reading and math. NAEP Points per $1000 Invested adjust for cost of living and student characteristics including free- or reduced-price lunch status, special education status, and race (whether a student is white or not).
Though cost effectiveness differs significantly across states, the weighted average for our sample is an extra 17 and 16 NAEP points for charter students in math and reading, respectively, per $1000 in revenue.

The ProducTiviTy of Public charTer SchoolS 19
Table 3: NAEP Achievement Levels per Thousand Dollars Invested for Reading Achievement
Traditional Public Schools Charter Schools
State NAEP Reading Score
Per Pupil Revenue in Reading(in $1000s)
Achievement Level per $1000
Invested NAEP Reading
Score
Per Pupil Revenue in Reading(in $1000s)
Achievement Level per $1000
Invested
Arizona 260 $4.77 45 265 $3.89 63California 255 $5.89 30 253 $4.16 48Colorado 269 $5.55 49 286 $4.39 66
Delaware 265 $6.93 42 275 $5.16 59
District of Columbia 237 $16.41 11 249 $10.04 24Florida 262 $5.09 43 270 $4.02 66Georgia 263 $6.53 44 244 $4.24 57Hawaii 257 $7.08 39 262 $5.28 42Idaho 267 $4.13 57 289 $3.07 82Illinois 266 $6.73 38 254 $5.70 43Maryland 271 $9.55 31 253 $5.88 43Massachusetts 275 $8.97 33 282 $7.07 46Michigan 266 $6.56 48 256 $4.74 65Minnesota 270 $7.42 50 265 $5.71 60New Mexico 255 $5.35 44 263 $5.17 58North Carolina 263 $4.99 50 276 $4.14 64Ohio 269 $5.88 49 248 $4.29 58Oregon 264 $5.48 47 267 $3.06 73Pennsylvania 268 $9.17 44 258 $6.25 60Texas 262 $5.54 38 252 $5.35 48Utah 267 $4.02 53 274 $3.18 67Wisconsin 268 $8.38 47 248 $4.94 66National Sample Average 262 $6.41 39 261 $4.66 56
Note: All data pertain to the 2010-2011 Academic Year. Revenue data adapted from Charter School Funding: Inequity Expands, by Batdorff et al., 2014, http://www.uaedreform.org/charter-funding-inequity-expands/. Achievement data adapted from http://nces.ed.gov/nationsreportcard/naepdata/dataset.aspx. Total per-pupil revenues are divided equally between reading and math. NAEP Points per $1000 Invested adjust for cost of living and student characteristics including free- or reduced-price lunch status, special education status, and race (whether a student is white or not).

The ProducTiviTy of Public charTer SchoolS 20
Table 4.1: Math Cost Effectiveness Differentials
State
Cost Effectiveness Differential
(in Adjusted Math NAEP Points/$1000
of Revenue)
Percentage Difference (Relative to Traditional
Public Schools)
Oregon 27 52.89Idaho 26 42.88Florida 23 50.46Wisconsin 20 38.91California 18 54.49Arizona 18 37.99Michigan 18 34.66Colorado 18 33.37National Sample Average
17 39.80
Delaware 17 37.46Pennsylvania 17 35.59New Mexico 15 32.16Utah 15 25.82DC 14 108.81Massachusetts 14 40.23Georgia 14 30.25North Carolina 14 26.38Texas 11 26.23Minnesota 10 19.13Maryland 9 25.67Ohio 9 17.88Illinois 5 12.22Hawaii 3 6.86
Note: All data pertain to the 2010-2011 Academic Year. States are ranked by cost effectiveness differential. Revenue data adapted from Charter School Funding: Inequity Expands, by Batdorff et al., 2014, http://www.uaedreform.org/charter-funding-inequity-expands/. Achievement data adapted from http://nces.ed.gov/nationsreportcard/naepdata/dataset.aspx. Total per-pupil revenues divided equally between reading and math. NAEP Points per $1000 Invested adjust for cost of living and student characteristics including free- or reduced-price lunch status, special education status, and race (whether a student is white or not).
Table 4.2: Reading Cost Effectiveness Differentials
State
Cost Effectiveness Differential
(in Adjusted Reading NAEP Points/$1000
of Revenue)
Percentage Difference (Relative to Traditional
Public Schools)
Oregon 26 54.49Idaho 25 44.00Florida 22 52.16Wisconsin 19 40.27Arizona 18 39.27California 17 57.03Michigan 17 35.92Colorado 17 34.46National Sample Average
16 41.44
Delaware 16 38.85Pennsylvania 16 36.98New Mexico 15 33.30Massachusetts 14 42.25Georgia 14 31.40North Carolina 14 27.25Utah 14 26.65DC 13 121.82Maryland 12 38.71Texas 10 27.45Minnesota 10 19.92Ohio 9 18.68Illinois 5 13.09Hawaii 3 7.41
Note: All data pertain to the 2010-2011 Academic Year. States are ranked by cost effectiveness differential. Revenue data adapted from Charter School Funding: Inequity Expands, by Batdorff et al., 2014, http://www.uaedreform.org/charter-funding-inequity-expands/. Achievement data adapted from http://nces.ed.gov/nationsreportcard/naepdata/dataset.aspx. Total per-pupil revenues divided equally between reading and math. NAEP Points per $1000 Invested adjust for cost of living and student characteristics including free- or reduced-price lunch status, special education status, and race (whether a student is white or not).

The ProducTiviTy of Public charTer SchoolS 21
The greater cost effectiveness of charter schools relative to TPS in terms of NAEP points reported per $1000 in revenue for our sample as a whole is largely the result of the lower funding levels for charters. Across our sample, the weighted average NAEP math achievement is 283 points for TPS and 279 for public charter schools, a small difference of 4 NAEP points favoring TPS. The NAEP advantage for TPS relative to charter schools on the reading section of the NAEP is an even smaller, 1 point, on average. When adjusting for differences in student demographic characteristics between charters and TPS, the difference in NAEP math achievement is only 3 points but now favoring charter schools. Charters score 275 points and TPS score 272 points after adjusting for levels of student disadvantage. In NAEP reading, there is no difference as both charters and TPS score about 256 NAEP points. The charter schools in our analysis, however, receive a weighted average of 37.5 percent less revenue per pupil than the TPS in our analysis. As a group, charters are producing NAEP scores that are similar to TPS at more than one-third less in revenues received.
Calculating ROI in Terms of Economic Returns to Education
As discussed above, our cost effectiveness calculation using NAEP scores has important limitations. Most importantly, it is merely descriptive, not causal, because charter schools might be reporting higher NAEP scores per $1000 invested than TPS because of the characteristics of students attracted to the charter school sector and not because they actually do a better job educating similar students and at a lower cost. Also, test scores are merely an intermediate outcome of education. Ultimately, we want schools to
educate students so that they mature to responsible and productive adults, capable of the demands of self-regulation and participation in the national economy. A more meaningful calculation of returns to schooling would move beyond mere cost effectiveness to examine return on investment (ROI) in the form of lifetime earnings that could be expected from similar students educated in the charter versus TPS sectors. We produce just such an estimate in this section. We
Table 5: Form of NAEP Cost Effectiveness for Charter Schools by Subject Area
Form of Cost Effectiveness
Math Cost Effectiveness Differential
Reading Cost Effectiveness Differential
Higher NAEP Scores at Lower Cost
1. District of Columbia2. California3. Oregon4. Idaho5. Arizona6. Delaware7. Colorado8. New Mexico9. Georgia10. North Carolina11. Utah
1. California2. Oregon3. Florida4. Idaho5. Arizona6. Delaware7. Colorado8. New Mexico9. Georgia10. North Carolina11. Utah12. Hawaii
Lower NAEP Scores at Lower Cost
1. Florida2. Massachusetts3. Wisconsin4. Pennsylvania5. Michigan6. Texas7. Maryland8. Minnesota9. Ohio10. Illinois11. Hawaii
1. District of Columbia2. Massachusetts3. Wisconsin4. Maryland5. Pennsylvania6. Michigan7. Texas8. Minnesota9. Ohio10. Illinois
Note: A state is ranked higher when its charter school sector has greater cost effectiveness relative to its traditional public school sector based upon the respective NAEP test. Revenue data used to derive cost effectiveness differentials are adapted from Revenue data adapted from Charter School Funding: Inequity Expands, by Batdorff et al., 2014, http://www.uaedreform.org/charter-funding-inequity-expands/. Achievement data adapted from http://nces.ed.gov/nationsreportcard/naepdata/dataset.aspx.

The ProducTiviTy of Public charTer SchoolS 22
also examine the extent to which ROI varies based on the amount of time a given student spends in charters versus TPS.
The achievement data we use to inform the ROI calculations that follow is based on the careful student matching methodology employed in the CREDO national charter school study. CREDO matched each charter school student in its study to one or more students in a nearby TPS who shared key student characteristics of that charter school student, including prior achievement levels, federal lunch status, ethnicity, and special education status, thereby generating “virtual control records”.18 A recent study by Robert Bifulco determined that such matching techniques that use student demographics, prior achievement, and student proximity to each other generate comparison groups that are nearly as similar as those formed in “gold standard” random assignment studies.19 Any reader concerned that student background factors might undermine our productivity calculations is thus advised to focus on the ROI calculations below, that more explicitly provide apples-to-apples comparisons of student populations.
Charter school students typically split time between the public charter and TPS sectors. The learning that charter students accumulate and the revenues invested in their education depend on the amount of time they are enrolled in charter schools. To account for the varying durations of charter enrollment in our ultimate calculation of productivity in terms of ROI regarding lifetime earnings, we calculate two different ROIs to create a range of estimates for the returns to charter schooling relative to TPS. First, we assume that students spend only one year in charter schools and the remaining twelve years of schooling in traditional public schools. Second, we assume that students
spend half of their time (i.e., 6.5 years) in each of the two school sectors. This second case provides an upper bound, so to speak, for the ROI of charter schools. While a student could hypothetically spend all thirteen years of schooling in a charter school, such cases are extremely rare, since, until recently, it was uncommon to have charter schools operating locally at all levels of K-12 education in an area. Hence, as a practical matter, we refrain from calculating the ROI for thirteen years of charter schooling as an upper bound, though it can be done mechanically. In sum, we calculate three ROI figures for each state — one ROI figure for education exclusively in traditional public schools and two ROI figures for charter schooling, assuming a single year or 6.5 years of charter school education. The calculation of the ROI for 6.5 years of charter schooling is not merely the ROI for 1 year multiplied by 6.5, since each additional year of charter schooling affects both the numerator (learning gains) and the denominator (amount of money invested) of the ROI calculation.
Calculating the Relative ROI of Charter and TPS Using the Economic Returns to Education
ROI is given by the following ratio:
ROI (Return on Investment) = Income Returns to Investment / Cost of Investment
For TPS students, the denominator for the ROI calculation is the per-pupil revenue figure from our
...most of the states in our study achieved higher levels of charter school cost effectiveness because the NAEP scores of charter students were higher than those for TPS students even while charters received less funding than TPS

The ProducTiviTy of Public charTer SchoolS 23
prior revenue study for traditional public schools multiplied by thirteen years of schooling:
TPS Cost of Investment = Per-Pupil Revenue for TPS × 13 years of TPS
There are two cost estimates for charter-school students, depending upon how many years they are assumed to spend in charter schools. For instance, if it is assumed that the charter school student only spends one year in charter schools and spends the remaining twelve years of primary and secondary schooling in traditional public schools, then the costs consist of the single-year, per-pupil revenue figure for charter schools added to twelve times the per-pupil revenue figure for TPS. More generally,
Charter Cost of Investment = (cost for time in charter schools) + (cost for time in TPS) = (charter annual per-pupil revenue) × (years
in charter schools) + (TPS annual per-pupil revenue) × (years in TPS).
The numerator of the ROI figures consists of the sum of two components, namely, (a) the average lifetime earnings for workers in a particular state and (b) additional increases or decreases to average lifetime earnings based on learning gains realized in charter or traditional public schools. Charter school students will experience learning gains attributed to both charter and TPS depending on how much time they are enrolled in each sector. If a particular school sector realizes fewer learning gains than the state average, then lifetime earnings will be lower for students educated in that sector. Conversely, greater learning gains within a school sector will generate higher lifetime earnings. In other words,
Income Returns to Investment for Students in TPS = average lifetime earnings for workers in a
particular state + changes to lifetime earnings based on learning gains exclusively in TPS
and
Income Returns to Investment for Students in Charters = average lifetime earnings for workers in a
particular state + changes to lifetime earnings based on learning gains in charters (for either 1 or 6.5 years) and traditional public schools (for the remainder of K-12 education).
Estimates of average lifetime earnings for workers in each state can be derived using the Current Population Survey. Collected annually by the Census Bureau, this dataset provides information about the average income for US workers of various ages. For our analysis, we take the average income for all full-time, full-year workers ages 25-70 in each state in 2010, the year that most closely aligns with the rest of our data. Aggregating average income by age yields an estimate of lifetime earnings for a worker.20
Next, we compute the second component of the income returns to educational investment: changes to average lifetime earnings based on learning gains realized in the charter or TPS sectors. Here we use the student achievement data provided by CREDO for all the states in our sample. CREDO calculated the differences in learning gains for charter school students compared to TPS students on individual state accountability tests by carefully matching charter school students to their “virtual twins” in nearby traditional public schools and tracking achievement gains for the two similar groups over time.21 Learning gains relative to the state average are calculated for charter and TPS students within each state, based on the CREDO data. These within-state learning gains are converted to standard deviations in order to place them on a common metric to allow for comparisons across states.
At this point, we have the differences in learning gains for students in the charter and TPS sectors for each state in our ROI analysis based on the careful longitudinal research of CREDO. Next we need to match those data with a reliable estimate of what

The ProducTiviTy of Public charTer SchoolS 24
benefits can be attributed to these learning gains. In a study published in a prominent peer-reviewed academic journal, Stanford economist Eric Hanushek estimates that for every one standard deviation increase in cognitive ability – what we call learning – there is approximately a 13 percent gain to lifetime earnings. However, only 70 percent of learning gains in school persist from year to year.22 Thus, multiplying together 0.13, 0.7, and the learning gains for charter school or TPS students within a state produces an estimate of the differences in lifetime earnings relative to the average worker in that state for those respective students. Adding these differences to the average lifetime earnings for workers in the state yields an estimate of the lifetime earnings for these students. Differences from average earnings due to yearly changes in learning are compounded by the number of years that a student attends either a charter or TPS to capture the earnings gains that result from all thirteen years of primary and secondary schooling.
Figure 2 provides initial descriptive information about the relative funding levels, based on our revenue study, and student achievement gains, based on the CREDO data, for the charter and TPS sectors in the sample of states included in this ROI analysis. Each state’s charter schools are categorized by how well they are funded relative to TPS (the horizontal axis), how well their students perform on standardized achievement tests relative to “virtual twin” TPS students (the vertical axis), and how large of a share charters represent in their statewide K-12 market (size of the circle).
The figure has four quadrants in which to plot the states with substantial charter school populations whose data we were able to use for this study. The statewide charter sectors that are underfunded relative to TPS yet outperform TPS in terms of CREDO-calculated student learning gains appear in the top left quadrant. The charter sectors that appear underfunded but underperform relative to TPS appear in the bottom left quadrant. None of the observations are to the right of the vertical axis because the revenue study determined that only one state – Tennessee –
had public charter schools funded on par with TPS. Every other state in the study funded charters at levels below TPS. The state-level observations are limited to the two left-side quadrants, denoting 11 charter populations that are underfunded yet outperform relative to TPS (upper quadrant) and 10 charter school populations that are underfunded and underperform relative to TPS (lower quadrant).
The size of the circles in Figure 2 vary based on the proportion of K-12 students enrolled in public charter schools. Again, DC is an outlier, as District of Columbia public charter schools are dramatically underfunded relative to TPS in the District but significantly outperform TPS in student achievement gains for carefully matched students, and DC charters enroll a large proportion of the city’s schoolchildren. The other large circle in Figure 2 belongs to the combined cities of Kansas City and St. Louis, Missouri. In 2010-11, when our data were collected, charter schools were permitted only within those two cities in Missouri, and they enrolled a large share of the local public education students there. The state with the largest charter school market share is Arizona, in which almost 12 percent of its public school students are enrolled in charters.
An Example of an ROI Computation Using Economic Returns to Education: Arkansas
The data points in Figure 2 are based simply on charter and TPS revenue differentials, presented in our revenue study, and student achievement gain differentials, drawn from the CREDO National Charter School Study. Our calculation of ROI in terms of the economic returns to education is more complex, as demonstrated in the example of how we compute the ROI for students in Arkansas, another state in our study.
The end goal is to compute the following ratio:
ROI = Income Returns to Investment / Cost of Investment

The ProducTiviTy of Public charTer SchoolS 25
Arkansas Traditional Public Schools
We begin with traditional public schools. As with the examples of the NAEP cost effectiveness calculation for Arizona that we presented previously, we display the results of spreadsheet calculations that computed the numbers to many decimal places. As a result, the numerical result used in this report may differ slightly, due to rounding conventions, from the result that would have been obtained using whole numbers.
The denominator comprises the cost of investing in a child’s thirteen years of primary and secondary schooling in TPS. According to the revenue study, the per-pupil revenue for traditional public schools in Arkansas for FY11, weighted to account for urban funding levels where applicable, is $12,521. Multiplying this single-year per-pupil revenue amount by thirteen
results in the following estimate for the total cost of this investment:
$12,521 × 13 years = $162,776.
We now compute the returns to lifetime earnings, or the numerator of the ROI figure for Arkansas TPS. According to data provided by the US Census Bureau, the net present value of lifetime earnings for the average full-time, full-year worker in Arkansas is about $723,509. We then use CREDO data to adjust this average lifetime-earnings figure based upon the learning gains of Arkansas TPS students who are similar to those who attend charter schools. CREDO’s comparison sample of Arkansas TPS students exhibited achievement growth that was 0.001 standard deviations above the state average. In other words, the comparison sample of TPS students that the CREDO
Figure 2: Charter School Funding and Performance
Charters have higher studentachievement but lower funding
Student Achievement Di�erences(in standard deviations)
Charters have higher studentachievement and higher funding
Charters have lower studentachievement and lower funding
Per-Pupil Revenues(in standarddeviations)
Charters have lower studentachievement but higher funding
Charters Perform Better than Traditional Public Schools
TN
MINMMN FL
IL
GAIN
CO
NC
UTAZOHARPA OR
MA
KC/STL
NJ
NY
DC
Traditional Public Schools Perform Better than Charters
Note: All data pertain to the 2010-2011 Academic Year. For display purposes, the x- and y-axes are not on the same scale. Units on the x-axis represent one standard deviation. Units on the y-axis represent 0.1 standard deviation. Revenue data adapted from Charter School Funding: Inequity Expands, by Batdorff et al., 2014, http://www.uaedreform.org/charter-funding-inequity-expands/. Achievement data provided by Center for Research on Education Outcomes (CREDO). Size of bubble denotes proportions of students in charter schools in the state/district.

The ProducTiviTy of Public charTer SchoolS 26
researchers selected and matched to the population of charter students in the state were typical Arkansas students for making estimates of annual achievement growth. Applying Hanushek’s estimates, the lifetime earnings for these TPS students is,
$723, 509 × [1 + (0.001 SD) × (0.13/SD) × (0.70)]13 = $724,524.
Note that the conversion from yearly test score gains to income is compounded 13 times — one for each year of TPS attendance — because we are assuming that these students spend all 13 years of their primary and secondary schooling in traditional public schools.
Placing the returns to lifetime earnings estimate over the cost of investment estimate yields the ROI figure for TPS in Arkansas:
ROI for traditional public schools = $724,524 / $162,776 = $4.45.
In other words, for every dollar of investment over thirteen years of schooling, students who attend Arkansas traditional public schools exclusively capture a return of about $4.45.
Arkansas Charter Schools
Calculating the ROI for Arkansas public charter schools depends on how many years the student spends in charters. To reiterate our assumptions, we provide two estimates throughout this analysis, each assuming a different duration of charter school attendance. Specifically, we assume that students spend (a) only one year in charter schools and the rest in TPS; or (b) half of their time (i.e., 6.5 years) in each of the two school sectors.
Per-pupil revenue for charter schools in Arkansas in FY11 was $8,392. Assuming that the student only spends one year in Arkansas charter schools, the estimated cost of investing in an Arkansas student’s thirteen years of schooling — one year of charter schooling and twelve years of traditional public schooling — is then equal to:
$8,392 + ($12,521 × 12 years) = $158,644.
Similarly, the cost of education for a student who spends half of her schooling in charter schools and the other half in traditional public schools is:
($8,392 × 6.5 years) + ($12,521 × 6.5 years) = $135,933.
There are two different calculations of the returns to the investment, depending on how much time the student has spent in charter schools. Charter school students in Arkansas exhibited achievement growth that was 0.027 standard deviations below the state average, excluding the comparison sample of TPS students. Thus, the estimated lifetime earnings for an Arkansas charter school student who attends charter schools for only one year and TPS for twelve years is:
$723,509 × [1 + (-0.027 SD) × (0.13/SD) × (0.70)] × [1 + (0.001 SD) × (0.13/SD) × (0.70)]12 = $722,647.
Students who spend half of their time in charter and traditional public schools, respectively, are projected to have lifetime earnings equal to:
723,509 × [1 + (-0.027 SD) × (0.13/SD) × (0.70)]6.5 [1 + (0.001 SD) × (0.13/SD) × (0.70)]6.5 = $712,415.
Substituting the costs of investment and estimated lifetime earnings into an ROI figure yields the following: If the student attends Arkansas charter schools for one year, the ROI is equal to:
ROI for charter schools = $722,647 / $158,644 = $4.56.
If a student spends half his thirteen years of schooling in charter schools, then we have:
ROI for charter schools = $712,415 / $135,933 = $5.24.
In summary, Arkansas traditional public schools generate $4.45 in returns to lifetime income for every dollar of investment. Arkansas charter schools

The ProducTiviTy of Public charTer SchoolS 27
generate a range between $4.56 and $5.24 in returns to lifetime income for every dollar of investment, depending on the number of years spent in a charter school. Therefore, charter schooling in Arkansas delivers a higher ROI than traditional public schools of between $0.11 and $0.79 per dollar spent.
Complete Results for the ROI Computations Using Economic Returns to Education
The differences in the ROI totals across the charter and TPS sectors which are central to this study are displayed in Table 6. We see that the charter school sector in all states in the analysis have a greater ROI than the traditional public school sector, using the metric of economic returns to education. As shown in the final row, the result is unchanged when aggregated to the national level, which is simply a weighted average of the results from Washington, DC and the 20 states that are included in the ROI analysis. Based on our multi-state sample, each dollar invested in a public charter school for a single year, on average, produces an ROI that is $0.14 higher than the ROI from a dollar invested in a traditional public school. Computed over 6.5 years, an education in a public charter school yields, on average, an ROI that is $1.05 higher than an education in a TPS. The higher ROI in the charter sector is the case even for states in which charter school students exhibit lower learning gains than TPS, as in Arizona, Ohio, and Pennsylvania, because the difference in their lower funding levels relative to TPS
is larger than the difference in their lower student achievement gains relative to TPS. The advantages of charter schools over TPS in ROI regarding the economic returns to education, in percentage terms, range from 0.4 percent for a single year of charter school education in New Mexico to 33 percent for 6.5 years of charter schooling in Washington, DC.
Figures 3.1 and 3.2 display the differences in ROI between charter schools and TPS for each state. These figures also rank order the states by how much greater the ROI is for their charter schools than for their TPS. Again, it is evident that while the relative differences in ROI between the two sectors widely varies across states, in no state is the ROI greater for TPS than it is for charter schools.
The careful reader may notice that we do not report actual ROI numbers for traditional public schools and charter schools outside of the example of Arkansas that was used to explain our methodology. The reason that we do not report the absolute ROI
calculations, by sector, for all the states is because of a significant limitation to how lifetime earnings are estimated. Lifetime earnings is a product of the earnings a worker would obtain if they had 0 years of formal education plus the added earnings that they receive for each year of formal schooling. That is, we are
Based on our multi-state sample, each dollar invested in a public charter school for a single year, on average, produces an ROI that is $0.14 higher than the ROI from a dollar invested in a traditional public school.
We see that the charter school sector in all states in the analysis have a greater ROI than the traditional public school sector, using the metric of economic returns to education.

The ProducTiviTy of Public charTer SchoolS 28
attributing all of a worker’s learning to K-12 schooling, when, in actuality, even a completely uneducated worker would have a certain level of learning and therefore some lifetime earnings not attributable to formal education. The problem is that, in the modern era, we do not observe any workers entirely lacking in formal education, since schooling is compulsory through age 16. The result is that our ROI estimates for each dollar spent on education will be upwardly biased by a certain fixed but unknown amount. Fortunately, that bias is likely to be approximately consistent across the comparison of charters and
TPS, so that our calculation of the difference in ROI across the sectors will be unbiased (because the fixed bias component on both sides of the comparison will cancel out). That is why we focus the reader’s attention on the difference in the lifetime ROI to education across the charter and TPS sectors and not on the actual computed value of the ROI for each sector.
A second limitation in our ROI calculations likely biases our analysis against the public charter school sector. We estimate the lifetime earnings of students
Table 6: ROI Comparisons between Charter and Traditional Public Schools
Charter Schooling for 1 Year Charter Schooling for 6.5 Years
State ROI Difference(Charter ROI – TPS ROI) ROI Difference (%) ROI Difference
(Charter ROI – TPS ROI) ROI Difference (%)
Arkansas 0.10 2.34 0.79 17.75Arizona 0.11 1.18 0.75 8.35Colorado 0.13 1.56 0.92 11.16
District of Columbia 0.15 4.16 1.16 32.83
Florida 0.12 1.64 0.88 11.69Georgia 0.16 2.79 1.21 21.44Illinois 0.08 1.17 0.55 8.16Indiana 0.14 2.75 1.07 21.02Massachusetts 0.13 2.25 0.92 16.15Michigan 0.14 2.69 1.01 19.92Minnesota 0.11 1.85 0.81 13.35Missouri 0.10 2.56 0.72 18.81New Jersey 0.16 3.18 1.22 24.05New Mexico 0.03 0.40 0.18 2.65New York 0.11 3.09 0.85 23.36North Carolina 0.09 1.31 0.61 9.2Ohio 0.11 1.78 0.81 13.14Oregon 0.21 3.24 1.71 26.15Pennsylvania 0.09 2.19 0.71 16.57Tennessee 0.05 0.84 0.33 5.60Utah 0.14 1.48 1.01 10.60Sample Average 0.14 2.52 1.05 18.95
Note: All data pertain to the 2010-2011 Academic Year. Revenue data used in ROI projections adapted from Charter School Funding: Inequity Expands, by Batdorff et al., 2014, http://www.uaedreform.org/charter-funding-inequity-expands/. Achievement data used in ROI projections provided by Center for Research on Education Outcomes (CREDO).

The ProducTiviTy of Public charTer SchoolS 29
Figure 3.1: State-level Return on Investment for Charter Schools Relative to Traditional Public Schools
-1 0 1 2 3 4 5
IL
NMTN
AZNCUTCOFL
OHMNPA
MAAR
Sample AverageMOMIIN
GANYNJ
ORDC
Percentage Differences
One Year of Charter Schooling
Figure 3.2: State-level Return on Investment for Charter Schools Relative to Traditional Public Schools
-10 0 10 20 30 40
NMTN
ILAZNCUTCOFL
OHMNMAPAAR
MOSample Average
MIIN
GANYNJ
ORDC
Percentage Differences
Six and One-Half Years of Charter Schooling
Note: All data pertain to the 2010-2011 Academic Year. Revenue data used in ROI projections adapted from Charter School Funding: Inequity Expands, by Batdorff et al., 2014, http://www.uaedreform.org/charter-funding-inequity-expands/. Achievement data used in ROI projections provided by Center for Research on Education Outcomes (CREDO).
Note: All data pertain to the 2010-2011 Academic Year. Revenue data used in ROI projections adapted from Charter School Funding: Inequity Expands, by Batdorff et al., 2014, http://www.uaedreform.org/charter-funding-inequity-expands/. Achievement data used in ROI projections provided by Center for Research on Education Outcomes (CREDO).

The ProducTiviTy of Public charTer SchoolS 30
in the charter and TPS sectors as differing based on the different achievement gains produced by similar students in each sector, as estimated by CREDO. Those differential achievement gains favor the charter sector in 11 states but favor the TPS sector in the remaining 10 states in the sample. School sectors might also differ regarding the levels of educational attainment they produce for their students, with attainment defined as the years of schooling and the completion of certain educational milestones such as high school graduation and college enrollment. Although there have been no national studies of the effect of public charter schooling on student educational attainment, the few localized studies that exist find that attending a charter school increases a student’s likelihood of graduating high school and attending college by an estimated 7 to 15 percentage points.23 Since educational attainment influences lifetime earnings just as learning does,24 if public charter schools nationally tend to produce higher levels of educational attainment than TPS, the actual advantage of charters relative to TPS regarding ROI is likely higher than what we have estimated here. In other words, ours are conservative estimates of the charter school ROI advantage, since they do not account for differences in student educational attainment.
Discussion, Study Limitations, and Conclusions
Our analysis indicates that charter schools are consistently more productive than traditional public schools across both cost effectiveness and return on investment calculations for all the states in the study.
The actual dollar amounts in the ROI should not be taken as the official figures for reporting purposes. Indeed, changing the assumed average figure for lifetime earnings will yield significantly different ROI figures, though the ROI for charter schools remains greater in all cases. Similarly, changing Hanushek’s estimates of gains to lifetime earnings from improvements in learning (i.e., 0.13) or his estimate of how much of those gains persist from year to year
(i.e., 0.70) would not alter the findings that charter schools produce higher ROI across the 20 states and DC in our sample, since there is no reason to think that such adjustments would affect the charter school sector differently from the traditional public
school sector. In other words, while raw ROI numbers may change, comparative ROI figures, especially in percentage form, will not. That is why, in the analysis, we emphasize the differences in ROI across the sectors overall and within states rather than mention the absolute ROI numbers for each sector.
We also acknowledge that numerous other factors besides differences in learning affect income. In fact, estimates of lifetime earnings may be sensitive to whether one considers educational attainment, learning, or both elements as responsible for a person’s lifetime economic productivity.25 This is yet another reason we emphasize ROI differences, instead of absolute ROI numbers for each sector. Since we do not account for the differential effect of charter schooling on educational attainment, because only a few localized studies of that question have been conducted, yet the evidence emerging indicates that charters outperform TPS in boosting student attainment, if anything our estimates of the charter school advantage regarding ROI are conservative.
Our analysis indicates that charter schools are more productive than traditional public schools consistently across both cost effectiveness and return on investment calculations for all the states in the study.

The ProducTiviTy of Public charTer SchoolS 31
Another general limitation of the data used for this analysis is that the NAEP cost effectiveness analysis uses cross-grade averages for the denominator of per-pupil investment and the economic returns to education ROI uses cross-grade averages for both the denominator and the numerator (average achievement differential across charters and TPS). Both the funding differential regarding charters and TPS and their student achievement differential might vary based on student grade level. Unfortunately, we lack the data required to develop ROIs specific to the revenue and achievement for students in various grades. Yet like the many other data limitations we discuss, differences found across grade levels are likely to be approximately similar in both the charter and TPS sectors. Although they might bias our calculations of the absolute value of the ROI for either sector in any given state, they are unlikely to bias the differences in ROI between the sectors that are highlighted in this study. The descriptive results from this exploratory analysis remain: Charter schools exhibit greater cost effectiveness and a higher ROI than traditional public schools.
Our data and analyses do permit us to describe certain differences in conditions and performance of the charter school sectors across the states in our study. Table 7 provides a descriptive ranking of the 28 jurisdictions included in one or both of our productivity analyses regarding critical elements of their public charter school environments and outcomes. All of the elements calculate differences between the state’s charter and TPS sectors. Lower
rankings indicate better conditions or performance of charters relative to their TPS in that specific state compared to the states ranked higher. The states highlighted in red all have public charter school sectors that enroll higher proportions of low-income students in the Federal Lunch Program than do their state TPS. Readers who want to limit their consideration to public
charter school sectors that disproportionately serve low-income students can do so by focusing on the states highlighted in red.
We see that the state-level public charter sectors that serve a higher proportion of low-income students than their state-level TPS include many top performing charter sectors. The 13 charter sectors with particularly challenging student populations include the 3rd (DC), 5th
(NC), and 6th (MA) best charter sectors relative to their TPS sectors in NAEP math performance. They also include the 3rd (NC), 4th (DC), and 9th (MA) best charter sector performers (again, relative to their state-level TPS) in NAEP reading achievement. The state-level charter sectors that enroll a higher percentage of low-income students than their TPS also include the 1st (DC), 6th (MA), and 7th (WI) best charter performers regarding relative cost effectiveness as well as the 1st (DC), 5th (MA), 6th (MO), 7th (MI), and 9th (MN) best charter sectors regarding CREDO estimates of performance on state assessments relative to comparable students in TPS. Finally, the charter sectors that disproportionately enroll low-income students include the 1st (DC), 6th (IN), 7th (MI), and 8th (MO) best state-level charter populations regarding higher return on investment relative to their TPS. Not only do nearly half of the charter school sectors in our study enroll a higher percentage of low-income students
As discussed in our cost effectiveness analysis, it appears to be likely that much of the basis for the higher productivity of public charter schools rests on the fact that they receive less funding and therefore are highly disciplined in their use of those education dollars.

The ProducTiviTy of Public charTer SchoolS 32
Table 7: State Charter School Rankings on Conditions and Performance Relative to Their TPS
Revenue Disparity
Performance Differential (unadjusted) on NAEP
Cost Effectiveness Differential Performance
Differential on State
Assessments
Return on Investment Differential
State Math Reading Math ReadingOne Year
of Charter Schooling
6.5 Years of Charter Schooling
Arizona 6 8 11 8 8 17 18 18Arkansas 18 n/a n/a n/a n/a 18 9 9California 13 11 13 2 2 n/a n/a n/a
Colorado 10 4 2 12 13 15 15 15
Delaware 14 2 5 9 9 n/a n/a n/aDistrict of Columbia 28 3 4 1 1 1 1 1Florida 9 9 7 4 4 11 14 14Georgia 19 17 20 14 15 10 5 5Hawaii 15 14 10 22 22 n/a n/a n/aIdaho 8 1 1 5 5 n/a n/a n/aIllinois 7 16 18 21 21 13 19 19Indiana 20 n/a n/a n/a n/a 12 6 6Maryland 27 19 19 18 10 n/a n/a n/aMassachusetts 17 6 9 6 6 5 10 11Michigan 16 18 15 11 12 7 7 7Minnesota 12 15 14 19 19 9 12 12Missouri 21 n/a n/a n/a n/a 6 8 8New Jersey 25 n/a n/a n/a n/a 3 3 3New Mexico 2 12 6 13 14 8 21 21New York 26 n/a n/a n/a n/a 4 4 4North Carolina 5 5 3 15 17 14 17 17Ohio 11 22 22 20 20 21 13 13Oregon 22 13 12 3 3 19 2 2Pennsylvania 23 21 16 10 11 20 11 10Tennessee 1 n/a n/a n/a n/a 2 20 20Texas 3 10 17 16 16 n/a n/a n/aUtah 4 7 8 17 18 16 16 16Wisconsin 24 20 21 7 7 n/a n/a n/a
Notes: All data pertain to the 2010-2011 Academic Year. States are ranked based upon differences in outcomes between charters and TPS within the same state. States rank higher on Revenue Disparity when percentage differences in per-pupil revenues between charters and TPS are smaller. States rank higher on NAEP performance, cost effectiveness, and return on investment when percentage differences in these outcomes are larger in favor of charters than for TPS. States rank higher on state-assessment performance when differences in achievement on these exams (expressed in terms of within-state standard deviations) is larger in favor of charters than for TPS. Rows highlighted in red indicate that the state’s charter school sector serves a greater proportion of students qualifying for free- or reduced-priced lunch than that of the state’s traditional public school sector. Revenue data adapted from Charter School Funding: Inequity Expands, by Batdorff et al., 2014, http://www.uaedreform.org/charter-funding-inequity-expands/. Achievement data used in ROI projections provided by Center for Research on Education Outcomes (CREDO). NAEP Achievement data adapted from http://nces.ed.gov/nationsreportcard/naepdata/dataset.aspx

The ProducTiviTy of Public charTer SchoolS 33
than their respective TPS, but many of those that face such a challenge perform quite well on productivity measures, relative to their state-level TPS, compared to the state-level charter sectors in our study that enroll a lower proportion of low-income students than their respective TPS. Any claim that the higher productivity of charters relative to TPS is because charters serve a more advantaged population would be undermined by these findings, as all charter sectors outperform their TPS on productivity measures even though half of the charter sectors enroll a more low-income population of students than their TPS.
It is difficult to say with confidence what would happen if more money were invested in the charter school sector, thereby shrinking the current level of funding inequity which exists in all of the states that we studied except for Tennessee. The limited data that we have suggests that higher per-pupil spending at the state level is associated with higher
levels of student achievement, but the relationship is weak. What we can say, based on our limited exploratory analysis of the ROI for charter and TPS sectors is that the results suggest that the charter sectors in our sample jurisdictions are operating in a more productive manner than the TPS sector at the funding and student achievement levels that currently exist. As discussed in our cost effectiveness analysis, it appears to be likely that much of the basis for the higher productivity of public charter schools rests on the fact that they receive less funding and therefore are highly disciplined in their use of those education dollars. Although we have argued that students in public charter schools should be funded at a level that is more equal to the student funding levels in TPS, that argument is grounded in equity more so than any empirical certainty that charter schools would continue to be more productive than traditional public schools were all public schools funded equally.
Endnotes
1 Batdorff, M., Maloney, L., May, J., Speakman, S., Wolf, P. J., & Cheng, A. 2014. Charter school funding: Inequity increases. School Choice Demonstration Project, University of Arkansas, Fayetteville, AR, accessed on June 1, 2014, from http://www.uaedreform.org/wp-content/uploads/charter-funding-inequity-expands.pdf
2 Dixon, M. 2014. Public education finances: 2012. U.S. Department of Commerce, Economics and Statistics Administration, Census Bureau, May, Figure 1, p. xi.
3 See for example Boser, U. 2014. Return on educational investment: 2014: A district-by-district evaluation of U.S. educational productivity. Center for American Progress, Washington, DC, July 2014, accessed on July 9, 2014, from http://cdn.americanprogress.org/wp-content/uploads/2014/07/ROI-report.pdf
4 States were included in the revenue study if their charter sectors comprised 1 percent of statewide public school enrollments or more. States were included in our cost effectiveness study if they were (1) included in the revenue study and (2) listed their NAEP scores separately by charter and TPS sector. States were included in our ROI analysis if they were (1) included in the revenue study and (2) granted CREDO permission to share aggregate charter and TPS performance data from the CREDO National Charter School Study with us for purposes of this report. The states included in each of the productivity calculations and the reasons states were excluded are provided in Appendix A.
The ProducTiviTy of Public charTer SchoolS 34
5 Rossi, P. H., Lipsey, M. W., & Freeman, H. E. 2004. Evaluation: A systematic approach, Seventh Edition. Thousand Oaks, CA: Sage, p. 425.
6 Investopedia. Return on investment – ROI, accessed on June 3, 2014, from http://www.investopedia.com/terms/r/returnoninvestment.asp.
7 Morones, A. “Charter schools receive inequitable funding, says report.” Charters and Choice Blog, Education Week, May 1, 2014; Baker, B.D. 2014. Review of “Charter School Funding: Inequity Expands.” National Education Policy Center, University of Colorado, Boulder.
8 As quoted in Morones, A. “Charter schools receive inequitable funding, says report.” Charters and Choice Blog, Education Week, May 1, 2014.
9 Baker, B.D. 2014. Review of “Charter School Funding: Inequity Expands.” National Education Policy Center, University of Colorado, Boulder.
10 In addition, it is well established that the public charter school sector nationally enrolls a disproportionate percentage of African American and Latino students a fewer white students than does the traditional public school sector. We exclude those data from these comparisons because extra funding is not tied to student race and ethnicity the way that extra funding tends to be tied to student poverty and special education.
11 See for example Winters, M. 2014. Why the gap? Special education and New York City charter schools. Center for Reinventing Public Education, Bothell, WA, accessed on June 11, 2014, from http://www.crpe.org/publications/why-gap-special-education-and-new-york-city-charter-schools; Winters, M. 2014. Understanding the charter school special education gap: Evidence from Denver, Colorado. Center for Reinventing Public Education, Bothell, WA, accessed on June 30, 2014, from http://www.crpe.org/sites/default/files/CRPE_Specialed_Denver_Report.pdf; Wolf, P. J., Fleming, D. J., & Witte, J. F. 2012. Special choices: Do voucher schools serve students with disabilities? Education Next, 12(3), Summer, pp. 16-22, accessed on June 11, 2014, from http://educationnext.org/special-choices/.
12 Winters, M. 2014. Why the gap? Special education and New York City charter schools. Center for Reinventing Public Education, Bothell, WA, accessed on June 11, 2014, from http://www.crpe.org/publications/why-gap-special-education-and-new-york-city-charter-schools; Winters, M. 2014. Understanding the charter school special education gap: Evidence from Denver, Colorado. Center for Reinventing Public Education, Bothell, WA, accessed on June 30, 2014, from http://www.crpe.org/sites/default/files/CRPE_Specialed_Denver_Report.pdf.
13 See for example Burtless, G. (ed.), 1996. Does money matter? The effect of school resources on student achievement and adult success. Washington, DC: Brookings.
14 Costrell, R., Hanushek, E., & Loeb, S. 2008. What do cost functions tell us about the cost of an adequate education? Peabody Journal of Education, 83(2), 198-223.
15 We use reported percentages of special education students to impute percentages of special education students for states that were missing this information. For charter schools missing these figures, we impute the smallest reported figure among charter schools. For TPS, we imputed the largest reported figure among TPS.
16 Taylor, L. & Fowler, W.J. 2006. A comparable wage approach to geographic cost adjustment. Washington, DC: US Department of Education.
17 More specifically, observations in the regression are at the state-by-sector level. We regress NAEP scores per $1000 on a charter school dummy, the percentage of free-or reduced-priced lunch students, the percentage of White students, the percentage of special education students, and the comparable wage index derived by Taylor and Fowler (2006). We then take coefficient estimates from the regression as well as observed values to compute predicted values of NAEP scores per $1000 for charters and TPS within each state.
18 CREDO. National charter school study: 2013. Stanford, CA; For other work using similar methodology, see for example Davis, D. H., & Raymond, M. E. 2012. Choices for studying choice: Assessing charter school effectiveness using two quasi-experimental methods. Economics of Education Review, 31(2), pp. 225-236; Gleason, P., Clark, M., Tuttle, C.C., & Dwoyer, E. 2010. The evaluation of charter school impacts: Final report. (NCEE 2010-4029). National Center for Education Evaluation and Regional Assistance, Institute of Education Sciences, U.S. Department of Education, Washington, DC. Accessed March 16, 2012, from: http://www.mathematica-mpr.com/publications/pdfs/education/charter_school_impacts.pdf
19 Bifulco, R. 2012. Can nonexperimental estimates replicate estimates based on random assignment in evaluations of school choice? A within-study comparison. Journal of Policy Analysis and Management, 31(3), pp. 729-751.

The ProducTiviTy of Public charTer SchoolS 35
20 SeeforuseofsimilarmethodsJulian,T.&Kominski,R.2011.Educationandsyntheticwork-lifeearningsestimate.Washington,DC:USCensusBureau.WealsofollowHanushek,E.A.2011.Theeconomicvalueofhigherteacherquality.Economics of Education Review, 30,466-479whoassumesthatincomesriseannuallyby1percentduetoimprovementsineconomicproductivityandusea3percentdiscountratetocalculatethenetpresentvalueoflifetimeearnings.Earningsfiguresarediscountedtowhentheworkeris18yearsold,theageatwhichhepresumablyfinishesreceivingbenefitsandinvestmentsfromK-12schooling.
21 CREDO.2013.National charter school study 2013.Stanford,CA:StanfordUniversity.
22 Hanushek,E.A.2011.Theeconomicvalueofhigherteacherquality.Economics of Education Review,30,466-479.
23 SeeforexampleBooker,K.,Sass,T.R.,Gill,B.,&Zimmer,R.2008.Going beyond test scores: Evaluating charter school impact on educational attainment in Chicago and Florida.RANDEducationworkingpaperseries,WR-610-BMG,August2008;Booker,K.,Gill,B.,Sass,T,&Zimmer,R.2014.Charter High Schools’ Effects on Long-Term Attainment and Earnings.MathematicaPolicyResearchWorkingPaper,January,availableathttp://www.mathematica-mpr.com/publications/pdfs/education/charter_long-term_wp.pdf;Angrist,J.D.,Cohodes,S.R.,Dynarski,S.M.,Pathak,P.A.,&Walters,C.R.2013.Stand and deliver: Effects of Boston’s charter high schools on college preparation, entry, and choice.NationalBureauofEconomicResearchWorkingPaper19275;DobbieW.,&Fryer,R.2013. The Medium-Term Impacts of High-Achieving Charter Schools on Non-Test Score Outcomes.Cambridge,MA:NationalBureauofEconomic Research.
24 SeeforexampleHungerford,T.&Solon,G.1987.Sheepskin effects in the return to education. The Review of economics and statistics 69(1),pp.175-77.
25 Hanushek,E.A.,Schwerdt,G.,Weiderhold,S.,&Woessmann,L.2013.Returns to skills around the world: Evidence from PIAAC.NBERWorkingPaperNo.19762.Washington,DC:NationalBureauofEconomicResearch.
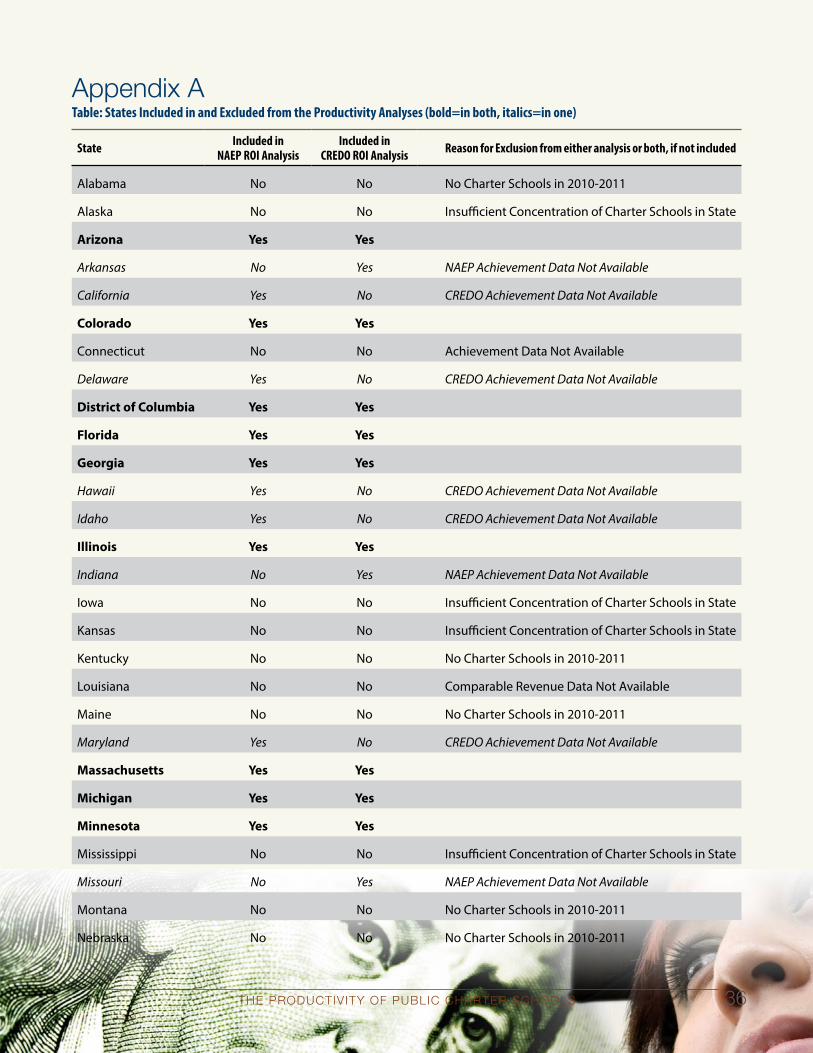
The ProducTiviTy of Public charTer SchoolS 36
Appendix A Table: States Included in and Excluded from the Productivity Analyses (bold=in both, italics=in one)
State Included in NAEP ROI Analysis
Included in CREDO ROI Analysis Reason for Exclusion from either analysis or both, if not included
Alabama No No No Charter Schools in 2010-2011
Alaska No No Insufficient Concentration of Charter Schools in State
Arizona Yes Yes
Arkansas No Yes NAEP Achievement Data Not Available
California Yes No CREDO Achievement Data Not Available
Colorado Yes Yes
Connecticut No No Achievement Data Not Available
Delaware Yes No CREDO Achievement Data Not Available
District of Columbia Yes Yes
Florida Yes Yes
Georgia Yes Yes
Hawaii Yes No CREDO Achievement Data Not Available
Idaho Yes No CREDO Achievement Data Not Available
Illinois Yes Yes
Indiana No Yes NAEP Achievement Data Not Available
Iowa No No Insufficient Concentration of Charter Schools in State
Kansas No No Insufficient Concentration of Charter Schools in State
Kentucky No No No Charter Schools in 2010-2011
Louisiana No No Comparable Revenue Data Not Available
Maine No No No Charter Schools in 2010-2011
Maryland Yes No CREDO Achievement Data Not Available
Massachusetts Yes Yes
Michigan Yes Yes
Minnesota Yes Yes
Mississippi No No Insufficient Concentration of Charter Schools in State
Missouri No Yes NAEP Achievement Data Not Available
Montana No No No Charter Schools in 2010-2011
Nebraska No No No Charter Schools in 2010-2011

The ProducTiviTy of Public charTer SchoolS 37
State Included in NAEP ROI Analysis
Included in CREDO ROI Analysis Reason for Exclusion from either analysis or both, if not included
Nevada No No Insufficient Concentration of Charter Schools in State
New Hampshire No No Insufficient Concentration of Charter Schools in State
New Jersey No Yes NAEP Achievement Data Not Available
New Mexico Yes Yes
New York No Yes NAEP Achievement Data Not Available
North Carolina Yes Yes
North Dakota No No No Charter Schools in 2010-2011
Ohio Yes Yes
Oklahoma No No Insufficient Concentration of Charter Schools in State
Oregon Yes Yes
Pennsylvania Yes Yes
Rhode Island No No Insufficient Concentration of Charter Schools in State
South Carolina No No Achievement Data Not Available
South Dakota No No No Charter Schools in 2010-2011
Tennessee No Yes NAEP Achievement Data Not Available
Texas Yes No CREDO Achievement Data Not Available
Utah Yes Yes
Vermont No No No Charter Schools in 2010-2011
Virginia No No Insufficient Concentration of Charter Schools in State
Washington No No No Charter Schools in 2010-2011
West Virginia No No No Charter Schools in 2010-2011
Wisconsin Yes No CREDO Achievement Data Not Available
Wyoming No No Insufficient Concentration of Charter Schools in State

The ProducTiviTy of Public charTer SchoolS 38
Two obvious components for the cost effectiveness and return on investment (ROI) analyses are funding dollars and student performance results. Acceptance of either of these productivity analyses requires understanding and comfort with both of these elements. The purpose of this section is to explain the rationale for financial analytical methodologies. The objective is to enable reviewers of this productivity study to become participants. By breaking down the specific reasons behind methodological decisions for the financial analysis the hope is that reviewers will be empowered to form opinions around specifics of the analysis as a means to offer constructive input as informed crowd-sourced participants for improving future analysis.
The financial analysts adopted various analysis methodologies for the April 30, 2014 comparative analysis of district vs. charter school funding that informed the report Charter School Funding: Inequity Expands. The analysis objective was to explore changes in funding disparities between FY03, FY07 and FY11; and to inform assessments of equity and funding mechanisms. The overarching goal was to produce an independent and objective analysis – without directly or indirectly incorporating either a charter advocate bias, a district bias, or an anti-charter bias. Appendix A – Methodology in the revenue study that preceded this report extensively describes and documents methodologies used in the analysis; in addition, report text descriptions, figure notes, and endnotes in chapters and in the monograph further describe specific treatments. Appendix A provides:
• description of state and focus area selections;
• explanation of analysis data sources;
• discussion of the use of revenues;
• description for use of state official counts for enrollments;
• inclusions and exclusions of revenue items;
• definitions for revenue source classifications;
• description of the “statewide” and “focus area” domains of the study;
• inflation adjustment descriptions;
• description of how extrapolation was used sparingly in cases where data gaps exist;
• explanation of what “magnitude of disparity” means;
• extensive explanation (4 pages) of how to read the Figure 3 financial results chart, and how to replicate the weighted value calculations, inclusive of easy to follow numerical examples to ease the process of analysis replication and verification; and,
• enrollments by state.
The focus of this discussion is on the underlying rationale for methodological choices.
Which concept of equity? Equity viewed from the perspective of, and goal, to match organizational funding for status quo organizational operations in common between districts and charter schools? Or, equity from the perspective, and goal, to equalize funding for specific student needs and have that funding level follow students to whatever school they choose to attend?
The analysis goal was to shed knowledge on evaluations of equity. But, which concept of equity? There are differing views on equity. A common view of equity in many states, like Pennsylvania (see the PA chapter), treats district operations as the focus and goal of equity – a district operational view of equity. This perspective suggests a charter school should receive specific funding only for an overlapping subset of operations that their host district maintains. This method of funding charter schools encourages maintenance of the district status quo regarding funding and mathematically ignores students and innovation.
Another perspective of equity, based on weighted student values (aka backpack funding), places the focus of equity on students and innovation. This view of equity envisions dollars following students, regardless of the school they attend, based on weighted student needs and encourages productivity increases and innovation. California’s new Local Control Funding Formula is most like this view of equity (see the CA chapter). This perspective shows promise to be highly efficient and may more easily and accurately achieve and maintain equity over time, even as educational processes and organizational structures inevitably change. For a concise description of this perspective of equity see, the chapter entitled, “Funding for Student’s Sake: How to Stop Financing Tomorrow’s Schools Based on Yesterday’s
Appendix B: Revenue Analysis Methodology Rationale — Why we did what we did in the financial analysis?

The ProducTiviTy of Public charTer SchoolS 39
Priorities” by Larry Miller, Marguerite Roza, and Suzanne Simburg in the SEA of the Future: Building the Productivity Infrastructure, Volume 3, May 2014.1
Two educational programs that differ greatly across districts, entire states and charter schools are Pre-K and Adult Education – some offering extensive programs and others offering none. For this reason, the financial analysts elected to analyze comparable K-12 revenues, exclusive of Pre-K and Adult Education revenues and enrollments.
The financial analysts elected to respect and include all perspectives of equity objectively by not making any adjustments to K-12 funding differences, which otherwise could be viewed as taking an advocacy position depending on one’s view of equity.
The types of adjustments most requested of the analysis team by charter advocates and anti-charter advocates include, but are not limited to: adjustment for special education differences, adjustment for other student demographic differences, adjustment for transportation differences, adjustment for state requirements applicable to one sector but not the other, adjustment for philanthropic non-public revenues, and/or adjustment for capital funding differences.
The analysis does not include any of the potential adjustments noted immediately above. To avoid the appearance of taking an advocate’s position, the financial analysts elected to provide a universal total disparity amount. Advocates can adjust the total disparity amount, as desired, to illustrate their advocacy position. To advocates with a weighted student perspective, all of these potential adjustments could appear to violate their viewpoint. To advocates with a district operational perspective some of the adjustments could appear to violate their viewpoint. Instead, there were no adjustments made to total revenue dollars analyzed.
By doing so, the analysis most closely matches the weighted student perspective of equity, but more importantly, it provides a completely unbiased and objective base result in the form of a per pupil funding difference between districts and charter schools that
1 Gross, B., and Jochim, A. (eds.). (2014). Building the Productivity Infrastructure. The SEA of the Future, 3. San Antonio, TX: Building State Capacity & Productivity Center at Edvance Research, Inc.
anyone can then easily adjust for the purpose of demonstrating their unique perspective of equity.
The financial analysts elected this position because painstaking effort is required to analyze primary data in state systems of record at the smallest unit of general ledger accounts – which often requires analyzing tens-of-thousands of accounting detail line items in a state. Because of that great effort and time required it is unlikely that other researchers will decide to invest the same level of effort and accuracy to compute the base starting point for an effective and objective analysis for the computation of the total difference in funding levels between districts and charter schools. Whereas, it is relatively easy to collect the revenue and other metrics required to make the isolated adjustments noted above, and simply subtract (or add, as needed) those per pupil differences from the total difference we analyzed. Each advocate can explain his or her rationale for their concept of equity, compute the adjustments, document the adjustments, and apply the adjustments to our total analyzed per pupil difference. This approach enables the financial analysis team to avoid taking a single advocacy position regarding the concept of equity, and allow for multiple appropriate uses of the data.
Specific advocacy-based analysis results or independent universal analysis results?
As described above, the financial analysts elected to provide universal analysis results that advocates of any position can use to illustrate their perspective of equity. In hindsight, the analysis results illustrate the short-comings of funding mechanisms spawned of a district operational view of equity, and the potential benefits of mechanisms inspired by a weighted student perspective of equity.
Academic research of authoritative sources or private sector-inspired use of primary data from official systems of record?
Studies often use authoritative sources. The problem of doing so in K-12 education is that much authoritative sourced data is inaccurate, aggregated too much to be useful for any analysis outside of the authoritative source, and/or has the potential to include classification and aggregation bias at multiple levels (school, district, state, and federal). The National Center for Education Statistics (NCES), in their Common Core of Data report writer, details three types of data quality issues in their reporting: 1) data that are not applicable; 2) data that are missing; and 3) data that do not meet NCES data

The ProducTiviTy of Public charTer SchoolS 40
quality standards.2 In addition, most NCES data reports cannot separate non-LEA charter schools from district schools and reports them in district totals. Some reporting aggregates all charter schools with district schools. Also, the required level of detail missing from NCES data can render it impossible to accurately differentiate issues like “Other” revenue sources vs. Local revenue sources.
Charter school authoritative sources, such as regional and national charter organizations, generally do not collect detailed charter revenue data; and, frequently do not provide accurate listings of charter schools, enrollment counts for specific fiscal years, and occasionally report approved maximum levels of enrollment as opposed to actual enrollments. In addition, some states do not collect revenue data from charter schools – thus, making state reporting, and federal roll-up reporting also inaccurate.
The financial analysts elected a methodology that emphasized private sector-inspired use of primary data from official state systems of record.
The Data Quality Campaign (DQC) has made significant progress in getting states to adopt statewide data warehouses; and many of those efforts include making detailed fiscal data from their state finance systems available for public use.3 In cases like California, the analysts downloaded revenue data from the state’s SACS and ALT financial reporting systems of record. That data consisted of 94,542 line items detailing school and district financial accounts based on the state’s chart of accounts. While this data was excellent for breaking out sources of revenues, it still lacks some desired specificity. The SACS system imbeds individual charter school data with host district data, inseparably. However, for the purpose of examining aggregated charter school data it was possible, using an understanding of their chart of accounts, to differentiate district revenues from charter school revenues. The resulting analysis is significantly more accurate than district vs. charter data at NCES. California is a good example of the status of state data quality in systems of record: not perfect, but good
2 U.S. Department of Education, National Center for Education Statistics, Common Core of Data (CCD), “Public Elementary/Secondary School Universe Survey”, 2010-11 v.2a. http://www.dataqualitycampaign.org/your-states-progress/#chart.
3 For a state-by-state DQC progress map see: http://www.dataqualitycampaign.org/your-states-progress/#chart.
enough and better than other national authoritative sources (for users with deep knowledge of state charts of account and financial reporting practices).
A downside of using data from state systems of record is simply the additional work required to analyze 94,542 lines of accounts, as in California’s case. The system of record for each state is different. For the analysis of all states selected for study, there is no single source of accurate data at a sufficient level of detail. The advantage of using data from state systems of record is access to sufficient detail to perform more precise categorizations of revenues by sources and having the detail necessary to appropriately match schools with revenues to schools for which enrollments are included, and vice versa, to assure accurate per pupil calculations.
A study of revenues or of expenditures?
The overarching goal was to inform equity discussions based on how districts and charter schools are funded, so the financial analysts elected to study revenues. District and state finance systems provide sufficient levels of revenue detail to make the necessary classifications for the Revenue Study’s methodology.
One benefit of analyzing revenues vs. expenditures is that expenditures are subject to greater district and state decision-making and roll-up structures, which provides greater potential for unintentional and intentional roll-up bias, and original entry posting and judgment error. Districts and states use fund accounting. Fund accounting regiments the recording of revenues in finance systems to follow general ledger fund structures. Local, state and federal governments independently initiate revenue transactions. Whereas, schools and districts initiate most expenditure transactions in greater numbers of transactions with less regimentation. Those increased numbers of district and charter school expenditure posting decisions can generate a greater number of classification and judgment errors, and additional roll-up structures are required to simplify reporting of these greater number of original transactions and accounts, which generates greater opportunity for unintentional and intentional roll-up reporting bias.
Which revenues, given the challenges of intergovernmental fiscal relationships?
The three financial analysts that conducted the original data gathering to inform the Revenue Study -- Meagan

The ProducTiviTy of Public charTer SchoolS 41
Batdorff, Larry Maloney, and Jay May -- bring to the analysis more than 70 years of collective finance experience in a number of different industries, and more than 50 years of experience specific to K-12 education. Those experiences include school district and state general ledger system experience, and experience in intergovernmental fiscal relationships.
A district and/or state general ledger contains various types of credits, most of which are revenues; and various types of debits, most of which are expenditures. Most general ledger systems also contain Balance Sheet accounts, and other types of accounts.
The financial analysts include in all discussions of K-12 revenues only those accounts that truly represent revenues for either the district sector or the charter sector in the analysis.
Credits in state general ledger systems, such as Transfers, that are not revenues are not included as revenues because they are not revenues. Pass-through funding for charter schools that pass through the host district are not effectively district revenues and are not included as district revenues (even if a district or the state calls them district revenues). Pass-through charter revenues are included as charter revenues only. District and State general ledger systems provide sufficient detail coding to make these determinations for appropriate inclusions and exclusions. In all discussions in Appendix A – Methodology of the Revenue Study references to included and excluded revenues, and references to using revenues from all sources for all funds are references to real revenues by sector, not to all credits in general ledger systems. See Appendix A for specific inclusions and exclusions.
Which student enrollments? District and charter enrollments from NCES, state, districts, regional or national charter management organizations, or other sources?
States are relatively consistent about providing official counts of student enrollment. In some cases these counts are combined district and charter counts, and require additional research and work to differentiate the charter counts from the district counts. All other authoritative sources for enrollment have significant short-comings as they do for revenue amounts.
The financial analysts used official state counts for enrollments, and for demographic enrollments when available at the state level.
There are no specific authoritative sources that routinely provide a detailed matching of school revenues with school enrollments, to assure that an analysis includes only schools with both revenues and enrollments.
Therefore, the financial analysts used various Excel tools and methods for assuring that every school included in the analysis with revenues also had enrollments; and every school that had enrollments, also had revenues.
These tools include: sorting for visual inspections, use of the =VLOOKUP Excel function, use of advanced filtering to simplify comparative searching of unique line items, and various other methods. The financial analysts rely on their research and analytical processes to assure that schools have properly matched revenues and enrollments. Analysts excluded schools without matching revenues and enrollments.
Narrow the analysis to only those regions that have perfect disaggregated demographic data for matching district and charter students, or keep the analysis broad enough to provide a state representation of results and a multi-state representation of results using demographic proxies and aggregated demographic contextual data for a reasonable alignment of district and charter school students?
Perfect disaggregated demographic data with excellent specification that completely and specifically matches individual district students with charter students are rare across states; and would require sampling. Differing state funding laws and practices make application of sampled results across dissimilar states impractical and ineffective.
The analysts used actual state primary data for the revenue analysis, no data sampling. This methodology may not utilize perfectly disaggregated demographic data, but does provide a reasonable means for effective comparisons of funding levels in context with student demographics.
Analysts selected 48 urban/metropolitan focus areas for analysis. The funding levels for the students in the district (or districts) in the focus area are compared to the funding levels for the students in charter schools in the same focus area. This effective matching process by urban/metropolitan vs. suburban/rural characteristics includes approximately 47% of all students in charter schools. Each of the 48 focus areas, and their resulting analyses, have precise matching by this characteristic.
Charter schools teach a larger percent-to-total of students in urban areas than do district schools. The

The ProducTiviTy of Public charTer SchoolS 42
financial analysts created a weighting factor that projects that same charter proportional urban vs. suburban characteristic on to districts. Appendix A – Methodology fully describes this weighting factor with example data. For additional context, Figure 3 in each state chapter shows the urban setting percent-to-total of students in districts and charter schools. In addition, Figure 11 in each chapter provides percent-to-total demographic data for free or reduced-price lunch eligible students, Title I populations of students, and Special Education population of students. Collectively, these demographic statistics provide relevant context for funding differences. This context can help reviewers of the analysis reach a decision regarding whether or not their concept of equity and interpretation of the context is sufficient to warrant their own further analysis of adjustments to the funding disparity.
How are data gaps and exceptions handled? Completely eliminate the data from the analysis, show the data and note the exception but exclude it from aggregate totals, or other?
Across 30 states and the District of Columbia some data exceptions and gaps exist. In general, the financial analysts elected to handle data exceptions by noting the exception and excluding the state or focus area affected from the aggregate totals in the analysis, without eliminating any data. In the case of gaps in data, such as rare instances where data did not exist for certain charter schools, extrapolations were utilized and noted. Analysts excluded school data from the analysis in cases where a school had revenues but no enrollment or enrollment but no revenues – to assure accurate per pupil calculations.
Should analysis results match public reporting by authoritative sources – NCES, states, districts, charter organizations, other researchers?
The financial analysts are not aware of any other district vs. charter funding study of this scope that includes revenues from all sources and all funds, inclusive of capital items and presented by funding source. No authoritative source would have similar reportable data. Therefore, the research team chose not to attempt to match the results of the revenue study with other authoritative sources; although analysts performed reasonableness tests using other authoritative sources.
The report’s monograph reaches conclusions. What was the perspective of the analyst team in reaching these conclusions?
The analytic team used a student and parent perspective to reach conclusions in the monograph. Parents of students pay taxes to fund “public education” – they don’t pay separate taxes at different rates for district-provided traditional public education vs. charter school-provided public education. The unit of measure for parents is their child. Is their child receiving equitable resources? The framework for reaching conclusions in the monograph is the perspective of students and parents.
By example, parents may choose to send their child to a school with no transportation. Those parents may do so because they would rather see those funds go toward instruction, the arts, or to sports. This perspective is consistent with a weighted student perspective of equity, is consistent with state charter laws that specifically name innovation as the purpose for charter schools, and is consistent with state constitutions that call for a general and uniform public school system.
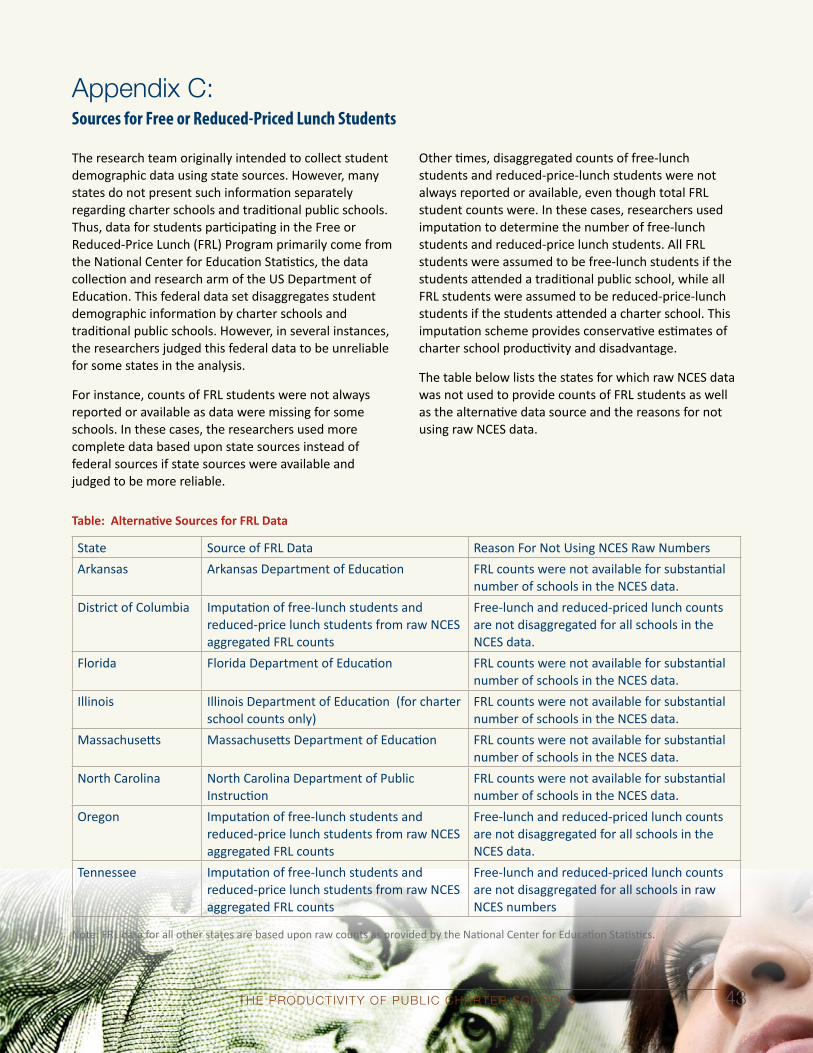
The ProducTiviTy of Public charTer SchoolS 43
Appendix C:Sources for Free or Reduced-Priced Lunch Students
The research team originally intended to collect student demographic data using state sources. However, many states do not present such information separately regarding charter schools and traditional public schools. Thus, data for students participating in the Free or Reduced-Price Lunch (FRL) Program primarily come from the National Center for Education Statistics, the data collection and research arm of the US Department of Education. This federal data set disaggregates student demographic information by charter schools and traditional public schools. However, in several instances, the researchers judged this federal data to be unreliable for some states in the analysis.
For instance, counts of FRL students were not always reported or available as data were missing for some schools. In these cases, the researchers used more complete data based upon state sources instead of federal sources if state sources were available and judged to be more reliable.
Other times, disaggregated counts of free-lunch students and reduced-price-lunch students were not always reported or available, even though total FRL student counts were. In these cases, researchers used imputation to determine the number of free-lunch students and reduced-price lunch students. All FRL students were assumed to be free-lunch students if the students attended a traditional public school, while all FRL students were assumed to be reduced-price-lunch students if the students attended a charter school. This imputation scheme provides conservative estimates of charter school productivity and disadvantage.
The table below lists the states for which raw NCES data was not used to provide counts of FRL students as well as the alternative data source and the reasons for not using raw NCES data.
Table: Alternative Sources for FRL Data
State Source of FRL Data Reason For Not Using NCES Raw NumbersArkansas Arkansas Department of Education FRL counts were not available for substantial
number of schools in the NCES data.District of Columbia Imputation of free-lunch students and
reduced-price lunch students from raw NCES aggregated FRL counts
Free-lunch and reduced-priced lunch counts are not disaggregated for all schools in the NCES data.
Florida Florida Department of Education FRL counts were not available for substantial number of schools in the NCES data.
Illinois Illinois Department of Education (for charter school counts only)
FRL counts were not available for substantial number of schools in the NCES data.
Massachusetts Massachusetts Department of Education FRL counts were not available for substantial number of schools in the NCES data.
North Carolina North Carolina Department of Public Instruction
FRL counts were not available for substantial number of schools in the NCES data.
Oregon Imputation of free-lunch students and reduced-price lunch students from raw NCES aggregated FRL counts
Free-lunch and reduced-priced lunch counts are not disaggregated for all schools in the NCES data.
Tennessee Imputation of free-lunch students and reduced-price lunch students from raw NCES aggregated FRL counts
Free-lunch and reduced-priced lunch counts are not disaggregated for all schools in raw NCES numbers
Note: FRL data for all other states are based upon raw counts as provided by the National Center for Education Statistics.

The ProducTiviTy of Public charTer SchoolS 44
Sheree T. SpeakmanSheree Speakman, founder and CEO of CIE Learning, works on public and private education projects supporting the common goal of deep learning for all teachers and students. CIE identifies and integrates learning pathways across neighborhoods and communities. Previously she served as the Evaluation Director of the Walton Family Foundation working with the K-12 Education Reform, Environment, and Home Region program teams on performance analysis. Ms. Speakman also was the Chief Operating Officer for British Schools of America from 2005 to 2007, a PK-12 school operator in the U.S. She chairs the Board of Councilors at the University of Southern California’s Rossier School of Education. Sheree received an A.B. from Albion College in Michigan and a M.B.A. from the University of Chicago.
About the AuthorsPatrick J. WolfDr. Wolf is Distinguished Professor of Education Policy and 21st Century Endowed Chair in School Choice in the Department of Education Reform at the University of Arkansas in Fayetteville. He has authored, co-authored, or co-edited four books and over 100 journal articles, book chapters, and policy reports on school choice, special education, public management, civic values, and campaign finance. Dr. Wolf’s latest book, The School Choice Journey, will be published by Palgrave Macmillan in the fall of 2014. He received his Ph.D. in Political Science from Harvard University in 1995.
Jay F. MayMr. May is founder of, and senior consultant for, EduAnalytics, LLC, a consulting practice focused on hands-on data-based initiatives to improve student performance. Mr. May’s client work includes developing technology infrastructure for various aspects of student performance management – student information systems, instructional data management systems, assessment results delivery and analysis frameworks. Mr. May, a CPA, has expertise in K-12 education finances and provides research, consulting, and analysis for various aspects of funding equity and allocation. He is a co-inventor of In$ite® - the Finance Analysis Model for Education® - a patented software tool for school-level and district-level expenditure analysis. Mr. May also provides expert witness analysis and testimony regarding state equity lawsuits.
Meagan BatdorffMeagan Batdorff is founder of Progressive EdGroup, LLC, an education research, writing, and policy group focused on supporting effective K – 12 education practices. A Teach for America alumnus, Meagan is heading into her 20th year working in education. She divides her efforts between education research and school design and start-up. Over the years, her research in the areas of school finance, educational practices and education policy has supported her work in the successful design and start-up of dozens of charter schools across the country. In addition, Meagan has won over $50 million in grants for education organizations, schools and districts.
Albert ChengMr. Cheng graduated from the University of California, Berkeley with a degree in pure mathematics and became a public high school math teacher in the San Francisco Bay Area. He has since left his teaching job and is now a Ph.D. student and Distinguished Doctoral Fellow in the Department of Education Reform at the University of Arkansas. There, he conducts program evaluations and other empirical research of educational-policy-relevant issues, such as school choice. Mr. Cheng primarily studies non-test-score outcomes, such as civic values, non-cognitive skills, and long-run life outcomes for students who receive their schooling outside traditional public schools.
Larry MaloneyMr. Maloney is president of Aspire Consulting and has investigated expenditure patterns of the nation’s public schools on behalf of states and individual school districts since 1992. Mr. Maloney participated in the research team for the Fordham Institute revenue study in 2005 and the Ball State University revenue study in 2010. Recent projects include evaluations of revenues and expenditure patterns of ten major metropolitan school districts and the charter schools located within their boundaries. He served as the evaluator for a U.S. Department of Education program designed to enhance the level of products and services provided by state charter associations. Additionally, he provided the financial analysis for the U.S. Government Accountability Office study of Title I expenditures and the U.S. Department of Education National Charter School Finance Study.