The Process Enterprise: How Process Transformation Changes the Business Tom Coleman Chief...
77
1 The Process Enterprise: How Process Transformation Changes the Business Tom Coleman Chief Information and Process Officer Process Owner, Strategic Planning Sloan Valve Company ABPMP Chicago Chapter Meeting October 14, 2009 Sears Holding Corporation Hoffman Estates
-
Upload
nicholas-cunningham -
Category
Documents
-
view
216 -
download
0
Transcript of The Process Enterprise: How Process Transformation Changes the Business Tom Coleman Chief...

The Process Enterprise:How Process Transformation Changes the Business
Tom ColemanChief Information and Process OfficerProcess Owner, Strategic PlanningSloan Valve Company
ABPMP Chicago Chapter MeetingOctober 14, 2009
Sears Holding CorporationHoffman Estates

AgendaSloan OverviewStrategic FocusThe Strategic ChallengeThe Path to ChangeThe ResultsThe ImpactQ&A

SloanOverview

4
Sloan Company Overview103 year old companyPrivately held, mid-sizedMfr. of specialized plumbing
productsSystems:
Business Suite Business Process Analysis
5
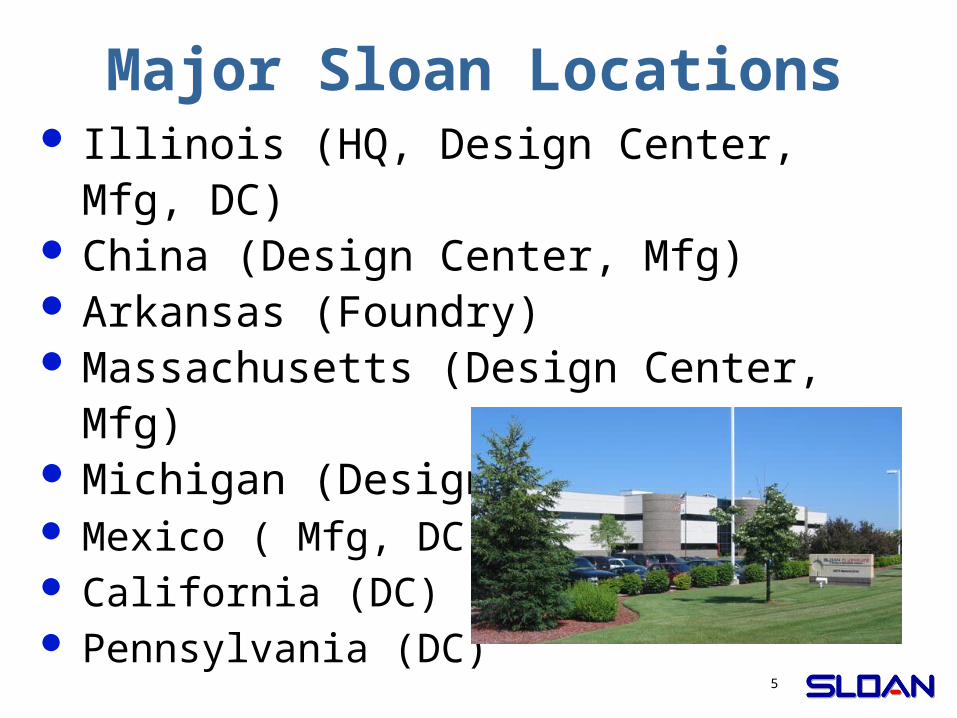
Major Sloan Locations Illinois (HQ, Design Center, Mfg, DC) China (Design Center, Mfg) Arkansas (Foundry) Massachusetts (Design Center, Mfg) Michigan (Design Center, Mfg) Mexico ( Mfg, DC) California (DC) Pennsylvania (DC)

6
Sloan Products

Strategic Focus

8
What Are We Trying To Do?CashA/R
InventoryEquipmentPropertyGoodwill
Human CapitalInformation CapitalOrganization Capital
Tangible Assets
Intangible Assets
Liqu
idity
Read
ines
s
Adapted from: Kaplan and Norton 2004
Strategy and Process
What? How?

9
Sample Strategic Planning Process
CoreIdeology
SWOTValuePlan
StrategicGoals
EmployeePerformanceManagement
• Core Values• Mission• Vision• BHAG
• SWOT • Value Discipline• Value Prop (VP) - Financial Val Prop - Customer Val Prop
• Financial• Customer• Process• Resource
• Functions• Teams• Individuals
What is our visionof today & the future?
To achieve our visionhow should we appearto our customers& stakeholders?
How shall we achieve ourfinancial andcustomer goals?
What resourcesdo we need andhow is ourReadiness?
What can we discover about the market, competitors, and ourselves?
What must functions, teams, and individuals do?
Discovery

10
Sample Strategic Planning Process
CoreIdeology
SWOTValuePlan
StrategicGoals
EmployeePerformanceManagement
• Core Values• Mission• Vision• BHAG
• SWOT • Value Discipline• Value Prop (VP) - Financial Val Prop - Customer Val Prop
• Financial• Customer• Process• Resource
• Functions• Teams• Individuals
What is our visionof today & the future?
To achieve our visionhow should we appearto our customers& stakeholders?
How shall we achieve ourfinancial andcustomer goals?
What resourcesdo we need andhow is ourReadiness?
What can we discover about the market, competitors, and ourselves?
What must functions, teams, and individuals do?
Discovery

11
• Creating a unique and sustainable competitive position
• Assimilating, attaining, and extending best practices
OperationalEffectiveness
ValueDiscipline(StrategicPosition)
Run the same races faster Choose to run a different race
Achieving Superior Performance
Operational Effectiveness is Not Strategy

12
Strategy is not only about ways to get
better…more importantly, strategy formulation is about finding ways to get…
differentSource: Michael Porter

13
“Undifferentiated products and services allow the customer to capture most of the
value.”
Michael PorterAuthor and Professor
Harvard Business School
14
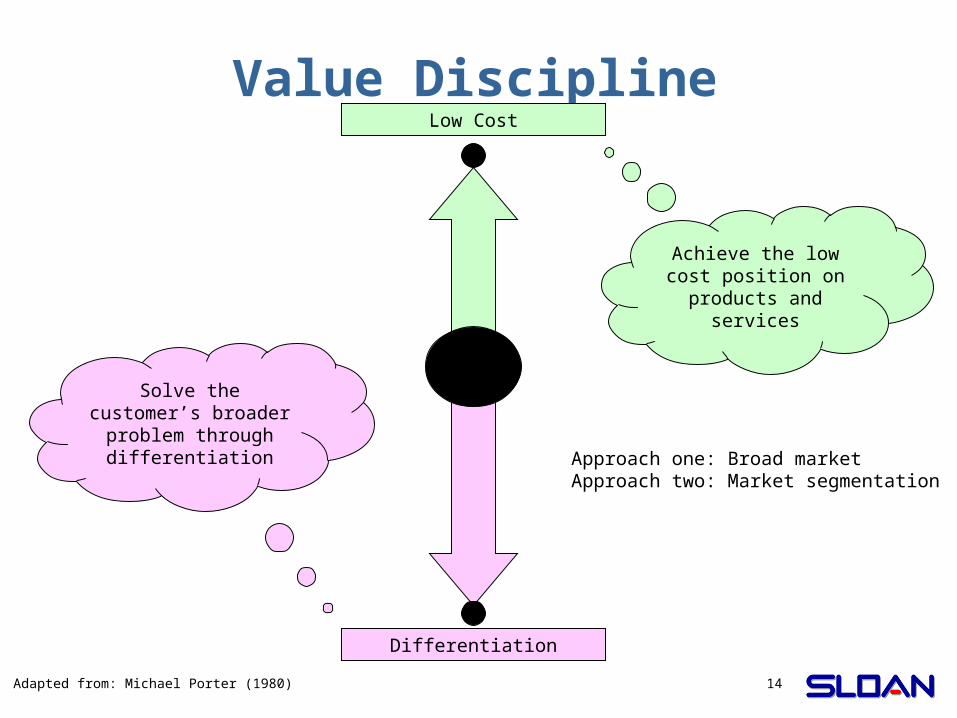
Value DisciplineLow Cost
Differentiation
Adapted from: Michael Porter (1980)
Achieve the low cost position on products
and services
Solve the customer’s broader problem
through differentiation Approach one: Broad market
Approach two: Market segmentation

15
Value DisciplineBest Total Cost
Best Total Solution Best Product Innovation
Adapted from: Michael Treacy and Fred Wiersema 1995
Achieve the low cost position on product and service support
Solve the customer’s broader problem and share in the benefit
Build a better product for which
customers will pay a premium

16
Value DisciplineBest Total Cost
Best Total Solution Best Product Innovation
Adapted from: Norton and Kaplan 2003/2004
Achieve the low cost position on product and service support
Solve the customer’s broader problem and share in the benefit
Build a better product for which
customers will pay a premium
Lock-in
17
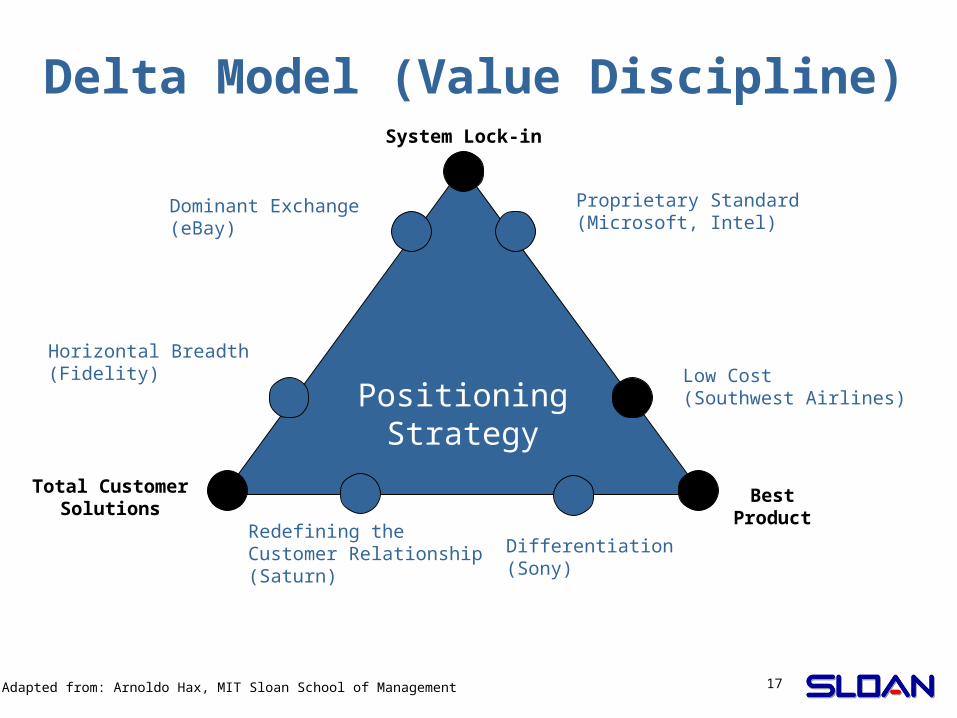
Delta Model (Value Discipline)
PositioningStrategy
System Lock-in
Total CustomerSolutions
BestProduct
Proprietary Standard(Microsoft, Intel)
Low Cost(Southwest Airlines)
Differentiation(Sony)
Dominant Exchange(eBay)
Horizontal Breadth(Fidelity)
Redefining the Customer Relationship(Saturn)
Adapted from: Arnoldo Hax, MIT Sloan School of Management

18
Strategy Vs Customer Value Attributes
Michael Treacy and Fred Wiersema
Image
Price Quality Time Selection Functionality Service Relationships Brand
Best TotalCost
n n n n o o o n SmartShopper
Best CustomerSolution
o o o o o n n n TrustedBrand
Best ProductInnovation
o o n o n o o n BestProduct
n Differentiator Strategy
o General Requirement
Adapted from Kaplan and Norton 2001
Product and Service Attributes Relationship

19
Aligning Strategy to ProcessesStrategy
InnovationProcesses
CustomerManagementProcesses
OperationalProcesses
BestProduct
Innovation
- Invention- Product Development- Exploitation- Speed to market
o o
Best TotalCustomerSolution
o
- Solution Development- Customer Service- Relationship Mgt- Advisory Services
o
Best TotalCost
o o- Supply Chain Mgt- Operations Efficiency- Capacity Management
Adapted from Kaplan and Norton 2001 / Treacy & Wiersema 1995
= Meets general requirements

20
Sample Strategic Planning Process
CoreIdeology
SWOTValuePlan
StrategicGoals
EmployeePerformanceManagement
• Core Values• Mission• Vision• BHAG
• SWOT • Value Discipline• Value Prop (VP) - Financial Val Prop - Customer Val Prop
• Financial• Customer• Process• Resource
• Functions• Teams• Individuals
What is our visionof today & the future?
To achieve our visionhow should we appearto our customers& stakeholders?
How shall we achieve ourfinancial andcustomer goals?
What resourcesdo we need andhow is ourReadiness?
What can we discover about the market, competitors, and ourselves?
What must functions, teams, and individuals do?
Discovery
21
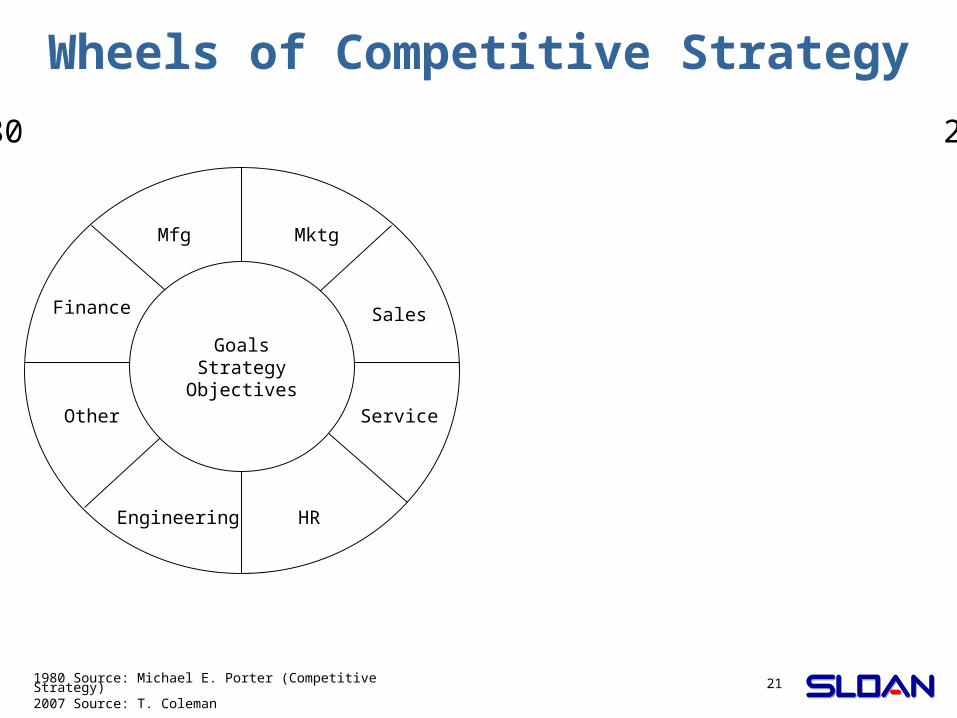
Wheels of Competitive Strategy
1980 Source: Michael E. Porter (Competitive Strategy)2007 Source: T. Coleman
GoalsStrategy
Objectives
Finance
Mfg Mktg
Sales
Service
HREngineering
Other
1980 2007

22
Strategic Focus Areas
Vision &Strategy
Products& Services
SupplyChain
Customer
Information Capital & Technology
Financial Resources
Human Resources
Six focus areas(AKA “strategic themes”)
Note: Alfred Chandler: Structure follows strategy

23
Wheels of Competitive Strategy
1980 Source: Michael E. Porter (Competitive Strategy)2007 Source: T. Coleman
GoalsStrategy
Objectives
Finance
Mfg Mktg
Sales
Service
HREngineering
Other
1980 2007
OrderTo
CashProcess
Demand GenerationProcess
New ProductDevelopment
Process
SloanStrategy
andGoals
CustomerSupportProcess
FunctionsFu
nctions
Funct
ions Functions

24
Old Functions Vs Processes
Information Technology (IT)
Finance
Human Resources (HR)
Marketing Sales Mat Mgt Mfg QA Research Des EngTech Support
Demand Generation
Product Development & Lifecycle Mgt
Order Acquisition
Cust Support
Order-to-Cash
Strategic Planning
Source-to-Pay

25
New Functions Vs Processes
Information Technology & Process Mgt (IT & BPM)
Financial Capital Mgt
Human Resource Mgt (HR)
Customer Relationships Supply Chain Product Dev & Lifecycle Mgt
Demand Generation
Product Development & Lifecycle Mgt (Domain Divided)
Order Acquisition
Cust Support
Order-to-Cash
Strategic Planning
Source-to-Pay
Note: Alfred Chandler: Structure follows strategy

26
New Functions Vs Processes
Information Technology & Process Mgt (IT & BPM)
Financial Capital Mgt
Human Resource Mgt (HR)
Customer Relationships Supply Chain Product Dev & Lifecycle Mgt
Demand Generation
Product Development & Lifecycle Mgt (Domain Divided)
Order Acquisition
Cust Support
Order-to-Cash
Strategic Planning
EPO’sEPOEPO’s
Source-to-Pay
EPO’sEPO’sEPO’s

27
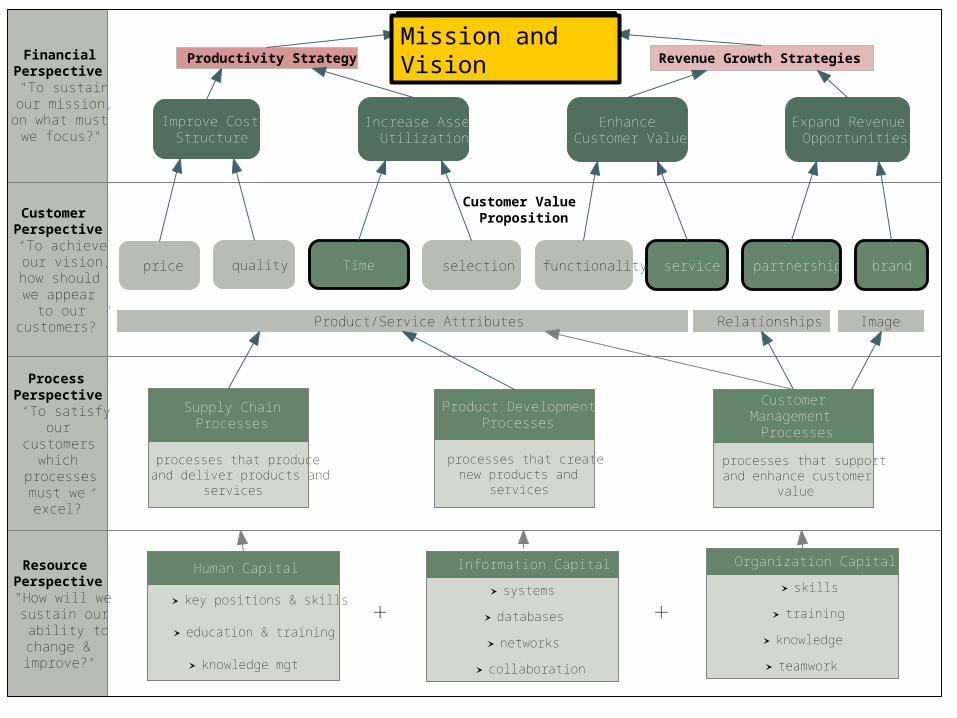
FinancialPerspective"To sustainour mission,
on what mustwe focus?"
CustomerPerspective“To achieveour vision,how shouldwe appear
to ourcustomers?”
ProcessPerspective“To satisfy
ourcustomers
whichprocessesmust weexcel?”
ResourcePerspective"How will wesustain ourability tochange &improve?"
Organization Capital
skills
training
knowledge
teamwork
Human Capital
key positions & skills
education & training
knowledge mgt
Supply ChainProcesses
processes that produceand deliver products and
services
CustomerManagement
Processes
processes that supportand enhance customer
value
Product DevelopmentProcesses
processes that createnew products and
services
Customer ValueProposition
price quality Time selection functionality service partnership brand
Product/Service Attributes Relationships Image
Sloan Vision & MissionProductivity Strategy Revenue Growth Strategies
Improve CostStructure
Increase AssetUtilization
EnhanceCustomer Value
Expand RevenueOpportunities
+ +
Information Capital
systems
databases
networks
collaboration
Mission and Vision
The financial value proposition goals go here
The customer value proposition goals go here
The process goals go here
The IT, HR, and the corporate enabling goals go here
28
FinancialPerspective"To sustainour mission,
on what mustwe focus?"
CustomerPerspective“To achieveour vision,how shouldwe appear
to ourcustomers?”
ProcessPerspective“To satisfy
ourcustomers
whichprocessesmust weexcel?”
ResourcePerspective"How will wesustain ourability tochange &improve?"
Organization Capital
skills
training
knowledge
teamwork
Human Capital
key positions & skills
education & training
knowledge mgt
Supply ChainProcesses
processes that produceand deliver products and
services
CustomerManagement
Processes
processes that supportand enhance customer
value
Product DevelopmentProcesses
processes that createnew products and
services
Customer ValueProposition
price quality Time selection functionality service partnership brand
Product/Service Attributes Relationships Image
Sloan Vision & MissionProductivity Strategy Revenue Growth Strategies
Improve CostStructure
Increase AssetUtilization
EnhanceCustomer Value
Expand RevenueOpportunities
+ +
Information Capital
systems
databases
networks
collaboration
Mission and Vision

29
Pro
ces
s Core Processes Belong Here(Not mere tasks/projects)
30
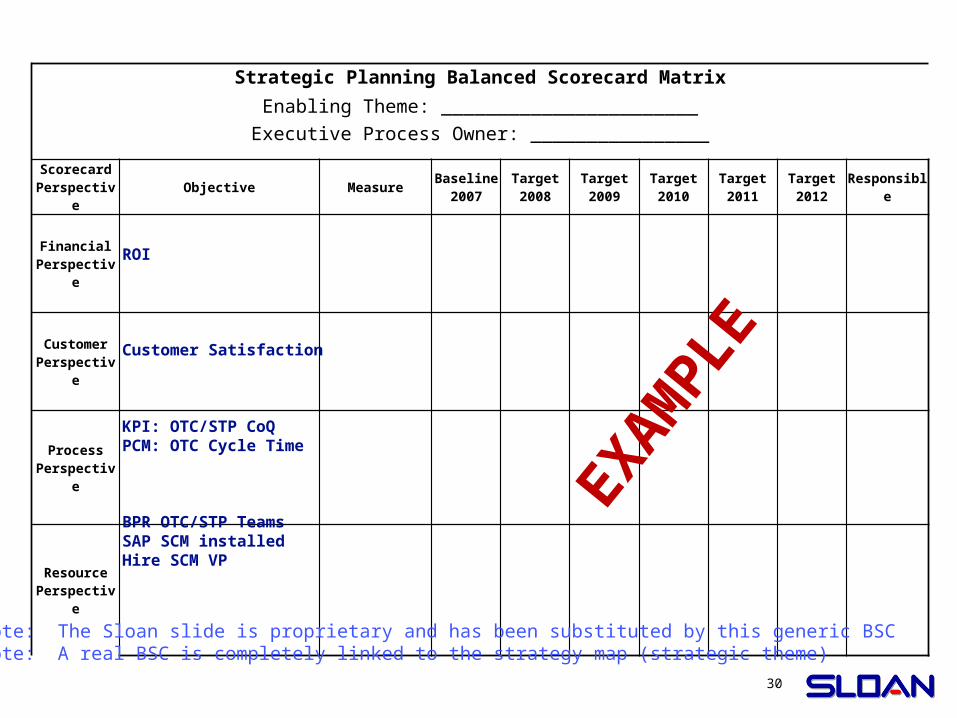
Strategic Planning Balanced Scorecard Matrix
Enabling Theme: _______________________
Executive Process Owner: ________________
ScorecardPerspective
Objective MeasureBaseline
2007Target2008
Target2009
Target2010
Target2011
Target2012
Responsible
FinancialPerspective
CustomerPerspective
ProcessPerspective
ResourcePerspective
ROI
Customer Satisfaction
KPI: OTC/STP CoQPCM: OTC Cycle Time
BPR OTC/STP TeamsSAP SCM installedHire SCM VP
EXAM
PLE
Note: The Sloan slide is proprietary and has been substituted by this generic BSCNote: A real BSC is completely linked to the strategy map (strategic theme)

31
Sample Strategic Planning Process
CoreIdeology
SWOTValuePlan
StrategicGoals
EmployeePerformanceManagement
• Core Values• Mission• Vision• BHAG
• SWOT • Value Discipline• Value Prop (VP) - Financial Val Prop - Customer Val Prop
• Financial• Customer• Process• Resource
• Functions• Teams• Individuals
What is our visionof today & the future?
To achieve our visionhow should we appearto our customers& stakeholders?
How shall we achieve ourfinancial andcustomer goals?
What resourcesdo we need andhow is ourReadiness?
What can we discover about the market, competitors, and ourselves?
What must functions, teams, and individuals do?
Discovery

32
The Challenge

33
Strategic Order-to-Cash Goals
1. Develop avg. delivery from X days to X days
2. Improve inventory turnover from X turns to X
3. Achieve X% perfect order performance
4. Improve quality from X sigma to X sigma for OTC
5. Improve DSO from X days to X days
6. Develop a program to better transition of NPDI to
OTC
7. Develop a rigorous education and training program
for OTC process performers
8. Look for ways to change our operational practices to
become more eco-friendly (lighting, packaging, and
cradle-to-cradle program, etc.)

34
. Terms today do not facilitate the timely receipt of cash / - ( . ., 1 ) - . Credit policy consumes significant available OAP OTC lead time e g day OAP
- . Possible lack of correlation between orders on credit hold and invoice collections which affects total customer lead time ( ?). Mexico has different terms and they are informal with respect for handling China
There is a disconnect between commission payouts and cash receipts ( ) Scrap process informal without ownership reporting issue - ( . ., ) Union contract a problem for perceived to be vision for OTC e g Midwest DC @ FKP Orders that have shipped and even delivered are not deemed to be closed today and may be modified ( ) -- - Mixing of standard product and special orders special finish lead time issue
Customers return products without an RMA number Existence of obsolete or seldom used parts
Wrong people making decisions affecting orders , , , . Invoicing problems associated with pricing quality quantity expedited shipments . Inventory is not accurate
- . Weak handling of the returns sub process of OTC ( ) Reject Matl for Rework RMR is not followed
( ) Inaccurate bill of materials BOM ( . ., , ) Discipline is not uniformly applied e g union contract other Customer shipping errors unacceptable
.No perfect order performance tracking and metric - / ( . ., , - , .).Lack of comprehensive under standing about profits benefits versus what it cost in OTC to do it e g old low volume product etc
No global common metrics for OTC No global common reporting tool for OTC metrics Lack of variance analysis
( . ., - )We have very limited automation for information processing e g bar codes ( . ., ) . China is not on SAP e g China resulting in lack of information and synchronization
, - Due to WIP processing methods scrap material cannot be processed in real time . A need for automated SAP processing for foundry scrap
( )Manually updating prices in Augusta every Monday morning time consuming No visibility of overseas items coming in or promise dates
Manifests are manually intensive 9 Manifests are sending only tracking numbers back to SAP
( , .)No integration between tracking numbers and handling units weights etc - ( - : )Delivery processing is not real time post goods issue PGI
Customers are requiring detailing packing for advanced notification Innovation ( . ., , ). Communications problems within sites e g quality problems production schedules ( . ., , ). Communications problems with other Sloan sites e g quality problems production schedules
. Inventories build at times when large volume deliveries occur from China versus JiT , , Substandard collaboration between Operations Quality and Customer Service -- ( ) Engineering changes lack of communication lines with all parties affected including customers
Lack of communications with Credit on order handling plans Lack of understanding of who is responsible and accountable for information and resolution - ( / - )Each location's prod schedule is not synchronized for published lead times especially slow moving non stock and old parts , -When demand exceeds supply we keep promising the customer the same lead time- Lead times are too long
Accuracy of promise dates- Lead times are misrepresented to customers
’ We don t ask customers what delivery dates they would like to have Lack of a quick change set up program to support OTC objectives Lack of product knowledge on the floor Lack of work instructions and training TQM principals are not being used in the process . Need for continuing education and training to support continuous improvement
. No corporate sales and operations planning for new and existing products - ( ) Lack of rough cut capacity planning resource requirements planning
-- - No forecasting must anticipate long lead items Not doing real forecasting to include integration with promos and supply chain ( ) No total productive maintenance system TPM ( ) . Lack of statistical process controls SPC knowledge and controls - .New product lead times are such that orders go past due and are sold before OTC can fulfill Lack of coordination of new products into OAP and OTC
- We take orders with standard lead times for new products not available ’ ; .We don t know the customers requested delivery date we may not deliver products timely to their need
.Frequent problems having clean orders in OTC ’ ; . OTC doesn t always know what the customer wants it appears that the customer does not know what they want & . PTP is not controlling purchase at the raw materials and S OP level causing surplus inventory ( . ., ) No vendor mgt program e g receive product from vendors with wrong counts but not caught until too late
, Vendors deliver materials late creates shortages ( / )Raw material availability is a problem for certain commodities AMI substitutes
Purchase material shortages 2 ( ). We cannot take a clean order and deliver it in four days ATO and days MTS on average or whatever the customer and competitive situations dictates - . All product are promised to customers with the same lead time
/ / ( . ., , . ). Collections DSO AR is not collecting ASAP e g disputes terms vs actual . Sloan does not have one face to the customer / . Lack of order coordination driven into assembly fulfillment ( )Lack of capacity planning CRP
/ & Kanban QR levels not dynamically set based on S OP plans and OTC constraints/ - Kanban QR use needs to be re reviewed to meet strategic plan
. Expedited customer orders adversely affect other previously promised orders -- Multiple shipping locations customer gets multiple shipments Customer returns material and we lose it
Too many materials shortages Finished good inventory strategies lacking that prevent complete shipments
; Inaccurate promise dates cause us to spend a lot of money on expedited shipments no way of calculating accurate promise delivery dates The returns goods process at all locations is inadequate Lack of supply management MTS items intended for DC are sent to regular customers instead Too much rework No way to verify customer claims about order inaccuracies - ( ) We take orders with standard lead times for products under revision ECM not available
( , , )Length of time for documentation to get through the system MDM cost of products BOM's Process Change Mgt in shop not engaged
( , - - , ).Lack of product lifecycle mgt discontinuations end of life product rationalization ( )Tool Mgt System is not used as part of a solution
Tactical Order-to-Cash
Problems List

35
OTC Metric Laggard* Avg* BIC* Sloan ’07
Perfect Order Performance 81% 88% 95% X%
A. Orders in Compliance to quality 85% 94% 98% X%
B. Orders complete/on-time 89% 91% 96% X%
C. Orders with correct doc 89% 91% 96% X%
Finished Goods Inventory turns 3 turns 13 turns 28 turns X turns
Inventory costs as share of revenue 30%($76M)
14%($35M)
5%($12M)
X%($X M)
Quality 1.81 σ($XM)
3.68 σ($XM)
5.04 σ($XM)
X σ($XM)
Order-to-cash cycle time * * * X to X days
Order-to-Cash KPI Benchmarks
* Aberdeen

36
OTC Metric Laggard* Avg* BIC* Sloan ’07
Inventory Record Accuracy (not $) 81% 91% 97% X% (FG)
First Pass Yield 62.2% 98.6% 99.9% X%
Defects per Mil. Opportunities (DPMO) 382,000 13,000 200 X
Overall Equipment Effectiveness 68% 84% 93% X%
Productivity at Constraint Work Centers - - - X%
Efficiency at Constrain Work Centers - - - X%
Utilization of Direct Labor 61% 74% 88% X%
Manufacturing Schedule Compliance 75% 88% 95% X%
Logistics Costs as % of Sales 20% 14% 5% X%
Order-to-Cash PCM Benchmarks
* Tolerances used to calculate accuracy vary widely and do not comply with APICS recommended best practices or best practice cycle count policies
* Aberdeen

The Path
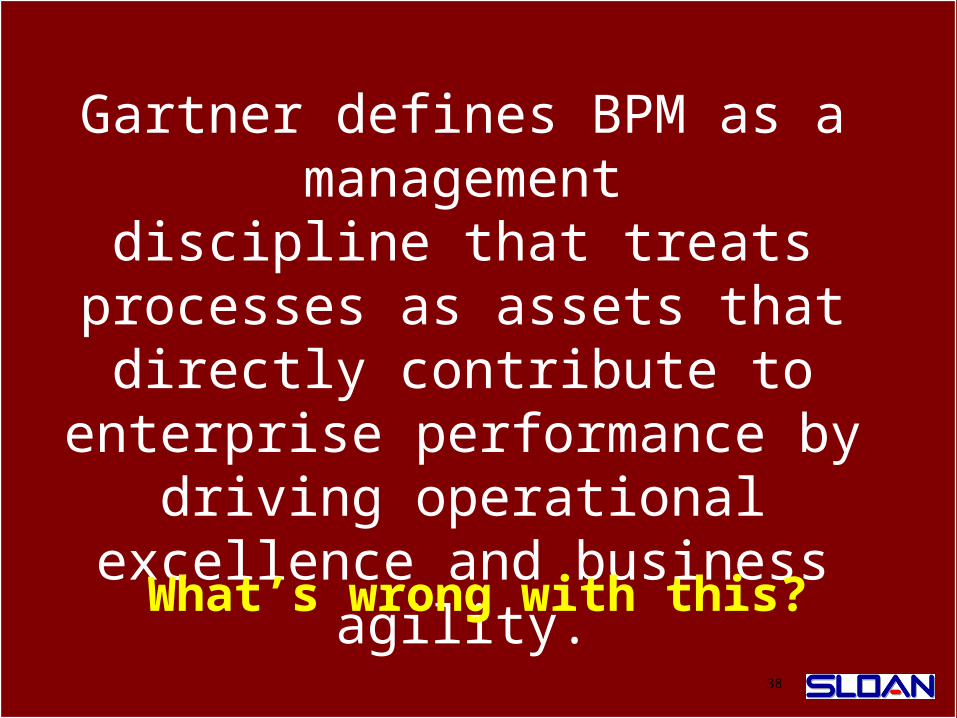
Gartner defines BPM as a management
discipline that treats processes as assets that directly
contribute to enterprise performance by
driving operational excellence and business agility.
What’s wrong with this?

BPM is a managementdiscipline that treats
processes as assets that directly drive enterprise
performance through operational excellence,
business agility, and strategic differentiation.
40
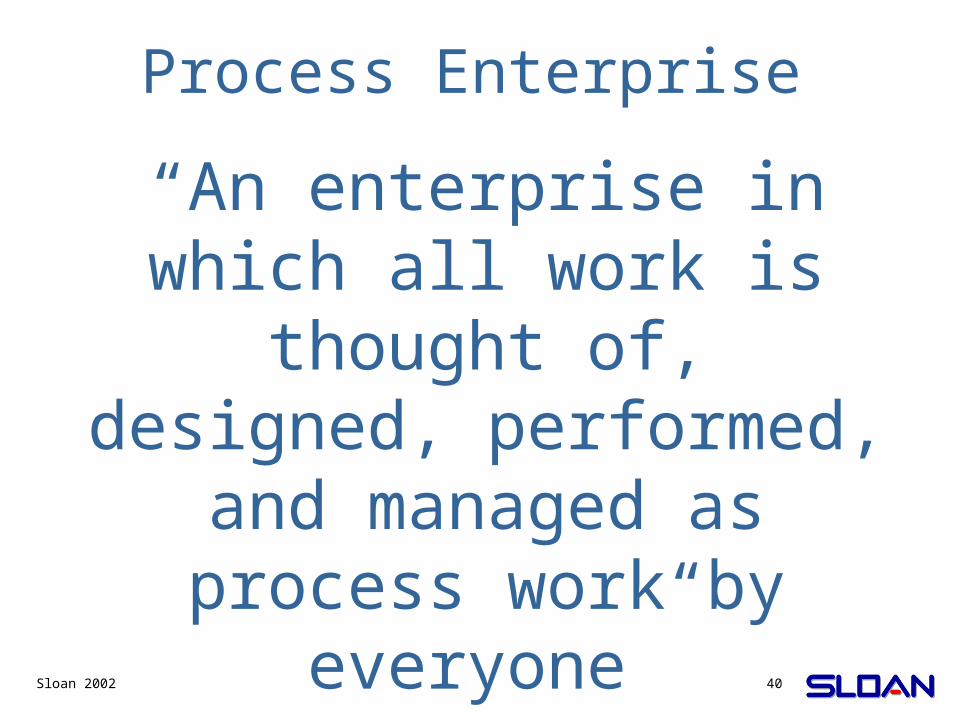
Process Enterprise
“An enterprise in which all work is thought of, designed, performed,
and managed as process work by
everyone”Sloan 2002

41
“An organized group of related tasks that
work together to create value for
customers.”
Source: Michael Hammer
Process Definition
A “Process” is end-to-end

42
Process Direction at Sloan1. Easy To Do Business With (ETDBW)2. Focus on customers and outcomes3. Define goals in customer terms4. Use metrics for improving, not just accounting5. Form a collaborative, team-based organization6. Embrace a vision beyond enterprise boundaries7. See work and design work in end-to-end terms
(governance, core, and enabling processes)8. Continuously learn9. Think outside the box10. Focus beyond improvement to design
Source concepts adapted from The Agenda (Dr. Michael Hammer)

43
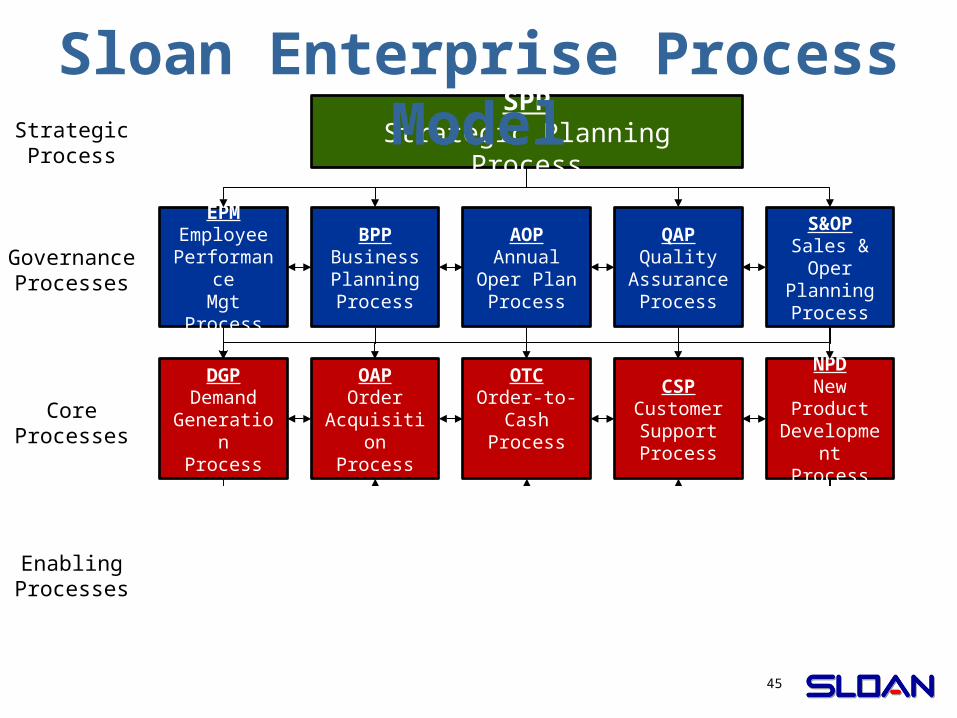
DGPDemand
GenerationProcess
OAPOrder
AcquisitionProcess
STPSource-to-Pay
Process
OTCOrder-to-Cash
Process
CSPCustomerSupportProcess
SPPStrategic Planning Process
EPMEmployee
PerformanceMgt Process
BPPBusiness PlanningProcess
QAPQuality
AssuranceProcess
S&OPSales & Oper
PlanningProcess
MDMMaster
DataMgt Process
ECMEngineering
ChangeMgt Process
PCMShop Process
ChangeMgt Process
NPDNew ProductDevelopment
Process
AOPAnnual
Oper PlanProcess
BPMBusiness
Process MgtProcess
StrategicProcess
GovernanceProcesses
CoreProcesses
EnablingProcesses
Sloan Enterprise Process Model

44
DGPDemand
GenerationProcess
OAPOrder
AcquisitionProcess
STPSource-to-Pay
Process
OTCOrder-to-Cash
Process
CSPCustomerSupportProcess
SPPStrategic Planning Process
EPMEmployee
PerformanceMgt Process
BPPBusiness PlanningProcess
QAPQuality
AssuranceProcess
S&OPSales & Oper
PlanningProcess
MDMMaster
DataMgt Process
ECMEngineering
ChangeMgt Process
PCMShop Process
ChangeMgt Process
NPDNew ProductDevelopment
Process
AOPAnnual
Oper PlanProcess
BPMBusiness
Process MgtProcess
StrategicProcess
GovernanceProcesses
CoreProcesses
EnablingProcesses
Sloan Enterprise Process Model
45
DGPDemand
GenerationProcess
OAPOrder
AcquisitionProcess
STPSource-to-Pay
Process
OTCOrder-to-Cash
Process
CSPCustomerSupportProcess
SPPStrategic Planning Process
EPMEmployee
PerformanceMgt Process
BPPBusiness PlanningProcess
QAPQuality
AssuranceProcess
S&OPSales & Oper
PlanningProcess
MDMMaster
DataMgt Process
ECMEngineering
ChangeMgt Process
PCMShop Process
ChangeMgt Process
NPDNew ProductDevelopment
Process
AOPAnnual
Oper PlanProcess
BPMBusiness
Process MgtProcess
StrategicProcess
GovernanceProcesses
CoreProcesses
EnablingProcesses
Sloan Enterprise Process Model

46
DGPDemand
GenerationProcess
OAPOrder
AcquisitionProcess
STPSource-to-Pay
Process
OTCOrder-to-Cash
Process
CSPCustomerSupportProcess
SPPStrategic Planning Process
EPMEmployee
PerformanceMgt Process
BPPBusiness PlanningProcess
QAPQuality
AssuranceProcess
S&OPSales & Oper
PlanningProcess
MDMMaster
DataMgt Process
ECMEngineering
ChangeMgt Process
PCMShop Process
ChangeMgt Process
NPDNew ProductDevelopment
Process
AOPAnnual
Oper PlanProcess
BPMBusiness
Process MgtProcesses
StrategicProcess
GovernanceProcesses
CoreProcesses
EnablingProcesses
(many more)
Sloan Enterprise Process Model
2007 2008
2004 2003
2005
WIPWIP
2009 2009 2006 20072008
2004
WIP

Pillars of Strategic Focus – Core
FocusCustomer
Main ProcessesDemand Generation
Order AcquisitionCustomer Support
Main SystemCRM, SD
Functional DeptBusiness
Development
KPI’sRevenue
Market ShareDGP/OAP/CSP Cycle TimeCustomer Response Index
CSP Call Abandon RateSales Forecast Accuracy
DSO (with CFO)
FocusSupply Chain
Main ProcessOrder-to-CashSource-to-Pay
Main SystemSCM, MM, PP
Functional DeptSupply ChainOperations
KPI’sPerfect Order Perf.
Cost of QualitySigma PerformanceInventory TurnoverCost of Goods Sold
OTC/STP cycle timesDPO (w/CFO)
FocusProducts
Main ProcessesNew Product Dev
Engineering Change MgtMaster Data Mgt
Main SystemPLM, BOM, CAD
Functional DeptResearch &
Development
KPI’sTime-to-Market
Project Delivery PerfProject Budget Perf
New Product Gap (w/BD)Innovation Rate (w/BD

Pillars of Strategic Focus – Enabling
FocusBusiness Technology
Main ProcessesBPM, BPR, CIIT Dev/Ops
Main SystemBPM, NetWeaver
Functional DeptBusiness Technology (IT)
KPI’sProject On-time PerfProject Budget Perf
IT budget as % SalesCustomer Response Index
SLA ComplianceProcess KPI Achievement
FocusHuman Capital
Main ProcessPerformance Mgt
Change Mgt
Main SystemHCM
Functional DeptHR
KPI’sRevenue Per EmployeeJob Satisfaction IndexTraining $ Vs BudgetEmployee Turnover
Recruitment Cycle TimeRecruitment CostsEPM Compliance
FocusFinancial Capital
Main ProcessesBusiness Planning
Risk Mgt
Main SystemSEM, FI, CO
Functional DeptFinance
KPI’sDSO (w/BD)
DPO (w/SCO)Cash Mgt Vs Revenue
What else?

49
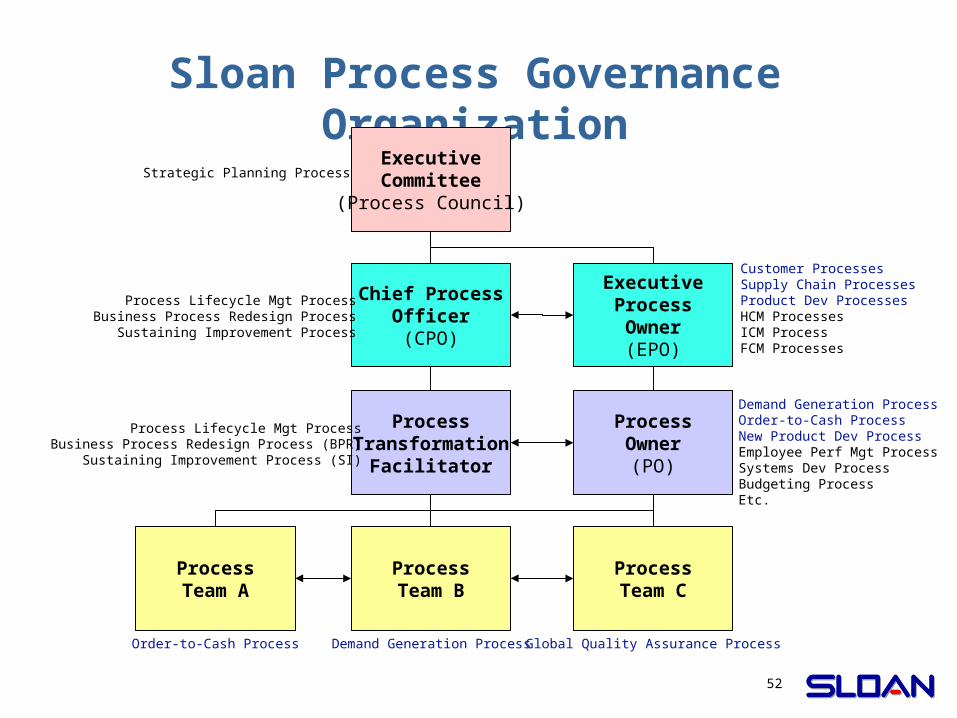
Sloan Process Governance Organization
ProcessTransformation
Facilitator
Chief ProcessOfficer(CPO)
ExecutiveCommittee
(Process Council)
ProcessTeam A
ProcessTeam B
ProcessTeam C
ExecutiveProcessOwner(EPO)
ProcessOwner
(PO)
Customer ProcessesSupply Chain ProcessesProduct Dev ProcessesHCM ProcessesICM ProcessFCM Processes
Demand Generation ProcessOrder-to-Cash ProcessNew Product Dev ProcessEmployee Perf Mgt ProcessSystems Dev ProcessBudgeting ProcessEtc.
Process Lifecycle Mgt ProcessBusiness Process Redesign Process
Sustaining Improvement Process
Process Lifecycle Mgt ProcessBusiness Process Redesign Process (BPR)
Sustaining Improvement Process (SI)
Strategic Planning Process
Order-to-Cash Process Demand Generation Process Global Quality Assurance Process

50
Sloan Process Governance Organization
ProcessTransformation
Facilitator
Chief ProcessOfficer(CPO)
ExecutiveCommittee
(Process Council)
ProcessTeam A
ProcessTeam B
ProcessTeam C
ExecutiveProcessOwner(EPO)
ProcessOwner
(PO)
Customer ProcessesSupply Chain ProcessesProduct Dev ProcessesHCM ProcessesICM ProcessFCM Processes
Demand Generation ProcessOrder-to-Cash ProcessNew Product Dev ProcessEmployee Perf Mgt ProcessSystems Dev ProcessBudgeting ProcessEtc.
Process Lifecycle Mgt ProcessBusiness Process Redesign Process
Sustaining Improvement Process
Process Lifecycle Mgt ProcessBusiness Process Redesign Process (BPR)
Sustaining Improvement Process (SI)
Strategic Planning Process
Order-to-Cash Process Demand Generation Process Global Quality Assurance Process

51
Sloan Process Governance Organization
ProcessTransformation
Facilitator
Chief ProcessOfficer(CPO)
ExecutiveCommittee
(Process Council)
ProcessTeam A
ProcessTeam B
ProcessTeam C
ExecutiveProcessOwner(EPO)
ProcessOwner
(PO)
Customer ProcessesSupply Chain ProcessesProduct Dev ProcessesHCM ProcessesICM ProcessFCM Processes
Demand Generation ProcessOrder-to-Cash ProcessNew Product Dev ProcessEmployee Perf Mgt ProcessSystems Dev ProcessBudgeting ProcessEtc.
Process Lifecycle Mgt ProcessBusiness Process Redesign Process
Sustaining Improvement Process
Process Lifecycle Mgt ProcessBusiness Process Redesign Process (BPR)
Sustaining Improvement Process (SI)
Strategic Planning Process
Order-to-Cash Process Demand Generation Process Global Quality Assurance Process
52
Sloan Process Governance Organization
ProcessTransformation
Facilitator
Chief ProcessOfficer(CPO)
ExecutiveCommittee
(Process Council)
ProcessTeam A
ProcessTeam B
ProcessTeam C
ExecutiveProcessOwner(EPO)
ProcessOwner
(PO)
Customer ProcessesSupply Chain ProcessesProduct Dev ProcessesHCM ProcessesICM ProcessFCM Processes
Demand Generation ProcessOrder-to-Cash ProcessNew Product Dev ProcessEmployee Perf Mgt ProcessSystems Dev ProcessBudgeting ProcessEtc.
Process Lifecycle Mgt ProcessBusiness Process Redesign Process
Sustaining Improvement Process
Process Lifecycle Mgt ProcessBusiness Process Redesign Process (BPR)
Sustaining Improvement Process (SI)
Strategic Planning Process
Order-to-Cash Process Demand Generation Process Global Quality Assurance Process

53
The Proliferation of Change Initiatives and Programs
M&A
BSC
Reengineering
SoPK
54
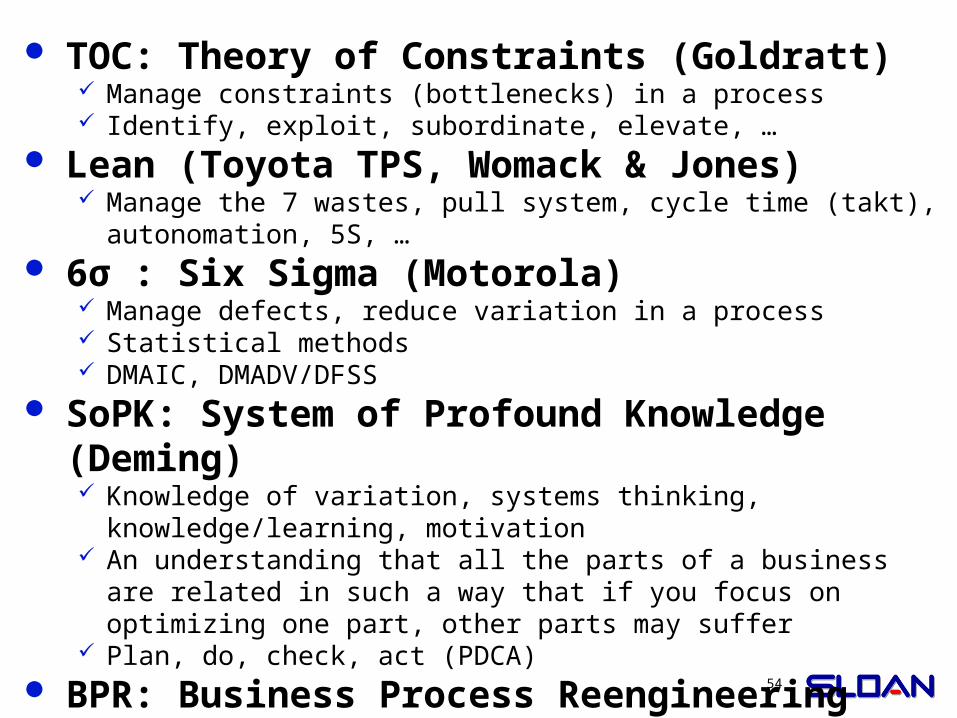
TOC: Theory of Constraints (Goldratt) Manage constraints (bottlenecks) in a process Identify, exploit, subordinate, elevate, …
Lean (Toyota TPS, Womack & Jones) Manage the 7 wastes, pull system, cycle time (takt),
autonomation, 5S, … 6σ : Six Sigma (Motorola)
Manage defects, reduce variation in a process Statistical methods DMAIC, DMADV/DFSS
SoPK: System of Profound Knowledge (Deming) Knowledge of variation, systems thinking,
knowledge/learning, motivation An understanding that all the parts of a business are related
in such a way that if you focus on optimizing one part, other parts may suffer
Plan, do, check, act (PDCA) BPR: Business Process Reengineering
(Hammer) Fundamental rethinking & radical redesign of business
processes to achieve dramatic improvements in critical, contemporary measures of performance such as cost, quality, speed, & service
Design/re-design methodology

55
Process Design
Process Im
plementation
Proc
ess
Impro
vem
ent
BPM
Business Process Management(Process Lifecycle Mgt)
Monitor & M
easure
Mon
itor &
Mea
sure
Monitor &
Measure
Mon
itor &
Mea
sure

56
1 2 3 4 5 6 7 8 9 0 11 12 13 14 15 16 17 18 19 20 21 22 23 24
Business Process Lifecycle
Sustaining Improvement
ProcessRedesign
TIME
IMPR
OV
EM
EN
T
COMPETITIV
E ADVANTA
GE
A. Tenner & I. DeToro
Sustaining Improvement
Sustaining ImprovementProcess
Redesign
New Design

57
Business Process Management (BPM)
ProcessGovernance
Process
BusinessProcess
RedesignProcess
SustainingImprovement
Processes
Similar Names:Kaikaku
Business Process ReengineeringReengineering
Radical ImprovementDMADV: Define, Measure, Analyze, Design, Verify (DFSS)
Similar Names:Kaizen
Continuous Improvement (CI)Incremental Improvement (II)Plan, Do, Check, Act (PDCA)
DMAIC: Define, Measure, Analyze, Improve, Control
ProcessRedesign
ProcessImprovement

58
Performand Improvethe Process
1 Measure Performance
and Understand
Needs
2
DoesProcess
Meet StrategicNeeds?
3
Yes
Set Performance ImprovementTargets,
Understand Nature of Performance Gap,
Develop Intervention Plan
4
No DecideImprovement
Approach
6
ImproveProcess
7
TransformProcess
8
Improve
Design
Sloan Process Lifecycle Mgt Process
StrategicPlanningProcess
LEVEL 0DIAGRAMVERSION

59
Continuous Improvement Process
(Incremental and Sustaining Improvement)
DefineProblem
MeasureProblem
AnalyzeProblem Improve Control
LEVEL 1DIAGRAMVERSION
FromBPM
Process
D M A I C(also TOC, Lean, …)
Ad hocImprove-
ment

60
Sloan Lesson
OutboundLogisticsSub-process
Order-to-Cash
Order Acquisition
New Product Dev
Customer Support
DemandGeneration
Strategic Planning
EngineeringChg Mgt
Master DataMgt
Plant Maintenance
EmployeePerf Mgt
Procure-to-PaySourcing
Business ProcessMgt

61
Sloan Lesson
OutboundLogisticsSub-process
Order-to-Cash
Order Acquisition
New Product Dev
Customer Support
DemandGeneration
Strategic Planning
EngineeringChg Mgt
Master DataMgt
Plant Maintenance
EmployeePerf Mgt
Procure-to-PaySourcing
Business ProcessMgt
12 Processes 6 Sub-processes each (avg.) 72 sub-processes------------------------------------------------- 5 months dev each (avg.)-------------------------------------------------360 month effort (1 team) 30 years of work (1 team)

62
Performand Improvethe Process
1 Measure Performance
and Understand
Needs
2
DoesProcess
Meet StrategicNeeds?
3
Yes
Set Performance ImprovementTargets,
Understand Nature of Performance Gap,
Develop Intervention Plan
4
No DecideImprovement
Approach
6
ImproveProcess
7
TransformProcess
8
Improve
Design
Sloan Process Lifecycle Mgt Process
StrategicPlanningProcess
LEVEL 0DIAGRAMVERSION
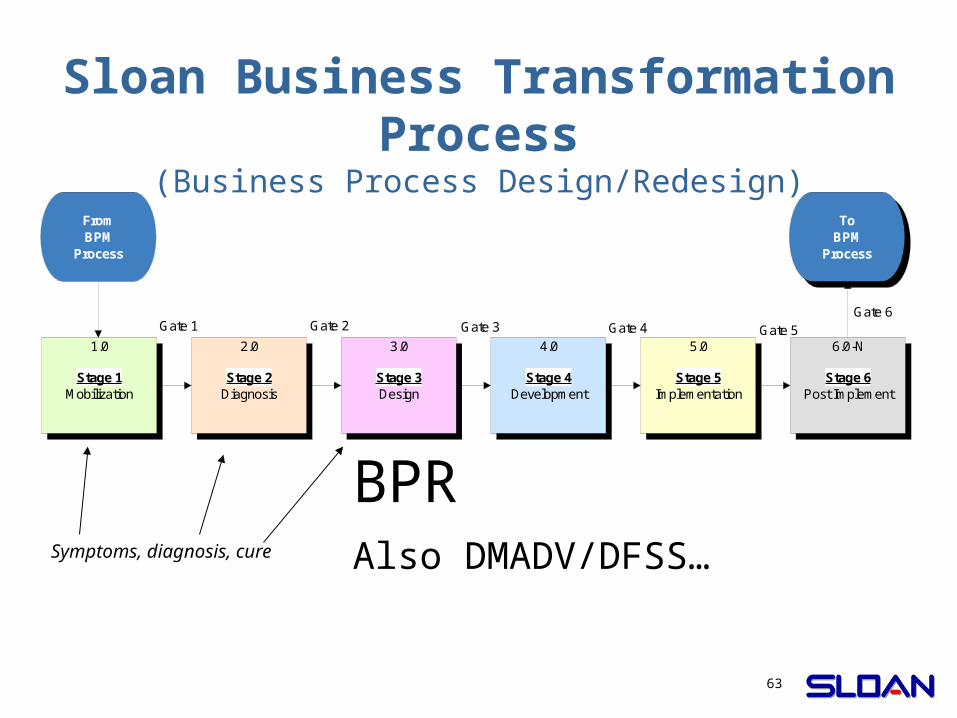
63
Sloan Business Transformation Process
(Business Process Design/Redesign)
Stage 1Mobilization
1.0
Stage 2Diagnosis
2.0
Stage 3Design
3.0
Stage 4Development
4.0
Stage 5Implementation
5.0
Stage 6Post Implement
6.0-N
FromBPM
Process
Gate 1 Gate 2 Gate 3 Gate 4 Gate 5Gate 6
ToBPM
Process
BPRAlso DMADV/DFSS…Symptoms, diagnosis, cure

64
Sloan Levers of Transformation Integrated with Sloan’s Strategic Plan Process Redesign as well as
Improvement Policies, Rules, Procedures Computing & Technology Organization Structure Change Management Roles & Job Changes Paradigm Shifts Communications Knowledge Facilities

Results
66
Distribution CenterCycle
Counting
Distribution CenterCycle
Counting
FK
P F
PI S
to
ckro
om
FK
P F
PI S
to
ckro
om
FK
P S
hip
pin
g
FK
P S
hip
pin
g
FK
P W
IP
FK
P W
IP
Start when doing pure
cycle counting
Identify ABC Criteria & Indicator
-N Run SAP report every two weeks
defining items to count
Count selected items
Staff research discrepancies
D/C Mgrposts physical
counts
Run SAP report showing
accuracy of inventory
-N
Stop
Start when part not found
during order
Count selected items
Research discrepancies
Post physical counts
Stop
If bad shipment is identified
Contact Customer Service
FK Cust Serv issues RMA to
return equipment
Issue correct equipment
RMANeeded?
Yes
Adjust billing to customer for
shipment
No
Sales Order
Entered
Start when doing pure
cycle counting
Run SAP report to
generate ABC Listings
-NManually determine
which items to count
-N
Count ItemsWithin
tolerance?
-N
Manually Track accuracy
Yes
Dep-endant
demand?
No
Contact matls mgr
YesGo to WIP
cycle counting process
Research discrepancies
No
Contact Customer Service
FK Cust Serv issues RMA to
return equipment
RMAProcess
RMANeeded?
Yes
Adjust billing to customer for
shipment
No
Sales Order
Entered
Shippingerror?
Yes
<$2000?
No
Post countYesMatl mgr
posts
No
Data integrity auditor verifies(one time only)
SameResults?
Yes
No
Generateweekly cycle count report
-N
Stop
Start when part not found
during order
Start when part not found
during order
Count selected items
Research discrepancies
Post physical counts
Stop
Contact Customer Service
RMANeeded?
Adjust billingto customer for
shipment
No
Sales Order
Entered
Shipping error?
No
Yes
<$2000Yes
Matl mgrposts
No
To RMA process
Yes
Start when customer
shortage claim
Count selected items
Research discrepancies
Contact Customer Service
RMAProcess
Inventory accurate?
No
Contact customer service
Yes
Stop
P2P Process
P2P Process
Start when doing pure
cycle counting
Run SAP report to
generate ABC Listings
-NManually determine
which items to count
-N
Count Items and retrieve count sheets
-NManual schedule sent out weekly on items to count
Inventory is reconciled & adjusted if
needed
-N
Inventory results memo
published
Unfreeze inventory
before or by 8:00 AM
Inventory posted?
Yes
Schedule recount
No
Receive backflush
discrepancy
Start when having
inventory discrepancy
Change inventory using
various methods
-N
Initiate cycle count
-N
Count items
Inventory is reconciled & adjusted if
needed
Stop
Stop
Start when having
subcontractedvendor
inventory
Run vendor inventory report at beginning of
year
We publish a yearly schedule
by month for vendor
-N Each month we supply
purchasing sheets per
vendor
Vendor countsPurchasing
gives matls the results
Reconcile & adjust
inventoryStop
Me
xico
Op
era
tion
Me
xico
Op
era
tion
Start for sales orders
Receive PO from customer
at the office
Enter sales order into SAP
Auto credit check in SAP
CreditOK?
Is Matl Avail?
-NYes
Create SAP delivery
Yes
Pick matl for shipping
Pick verify
Picklist delivered & packing slip
created
Sales performs post goods issue (PGI)
Manually invoice
customer
-N
Invoice delivered to
shipping clerk
Tracking No. and ship prep
Load truck & ship
Collect proof of delivery
Send statement to
customer
Receive payment in SDM bank
DepositClears?
Payment is applied in SAP
Yes New statement sent to
customer
Partialpayment?
NoStop
Contact customer for balance due,
partial payment, or promissary
note
-N
Paymentreceived & cleared?
Yes
Order remains on hold
No
No
Contact Supplier for an
expected delivery date
No
DateAcceptable?
Yes
Contact customer with
ETA
NoCancel
No
Notify customer that deposit did
not clear
No
Payment requested & return check bill generated
Yes
Paid in full?
Yes
No
If necessary, pick, assemble,
backflush material
Start for forecasted
material
Procure-to-pay
processStock material
SV
WT
(C
hina
)
Start(From
Domestic cust)
-N
Receive PO from FKP
-NStart
(From FKP or WDC)
Establish cust contract
Wait for money
-NMoney
received & deposited
Desire expressed
Have matl?
Yes
No
Contractaccepted?
Yes
Check with suppliers
Stop
No
Stdorder?
Yes
Eng reviewof customer
requirements
No
Mfgreview & estab
lead-time
Matlreview &
establish lead-time
Release Mfg Order (MO)
Makeproduct
Ship product& generate
invoice
Component inventory relieved
Record revenue& Stop
New part needed?
Create test procedure or
BOM as needed
NoDesign new
part
-N Yes
Manual matls planning process
-N
Enter order into Fourth-Shift
Establish a 3 mo. shipping
sched
Enter schedule into fourth-shift
& run MRP
Generate component
reqmts
Componets Avail?
Issue Mfg Order (MO)
Yes
Procure-to-pay
process
No
Pickmatl
Purch item?
Yes
No
Produceitem
-N
Prepare items for shipment
Store items for later shipment
-NPrepare
documents for shipment
-N
Schedule Load & ship
Receive shipment
-N
StopPayment made
to SVWTDrop ship to cust?
No
Yes
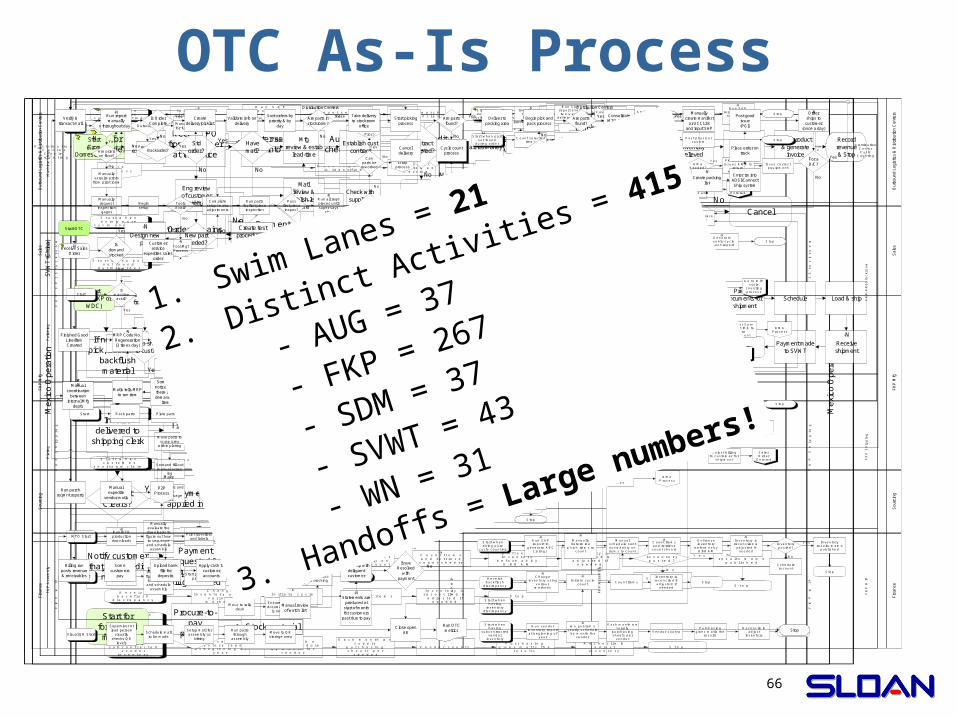
OTC As-Is ProcessM
achin
e S
hop
Machin
e S
hop
Tool R
oom
Tool R
oom
Polis
hin
g
Polis
hin
g
Pla
ting
Pla
ting
FK
P A
ssem
bly
FK
P A
ssem
bly
StartIs
machineavail?
Outsource?No Manual sched
for future prod
No
Are prints on floor?
Yes
Manually acquire prints
from print room
No
Manually request
inspection gages
Yes
Beginsetup
ToolsAvail?
Completesetup/ make adjustments
Yes Run partsfor first piece
inspection
Run all reqdpieces until super says
stop
-N
Passfirst pieceinspec?
Yes
No
Trx to nextdept/operation
Is itemcomplete?
Yes
No
Move to next depart or to
stock
Areparts
good?
Yes
Can parts be reworked
No
Performnecessary
rework(RMR Proc)
Yes
Toscrap
process
No
No
Procure toPay
Yes
Tool MgtProcess
-N
StartIs
machine avail?
Outsource?No Manual sched
for future prod
No
Procure toPay
Yes
Beginsetup
Yes
FixturesAvail?
No
Completesetup
Yes
Run partsfor first piece
inspection
Passfirst pieceinspec?
Run all reqdpieces until super says
stop
-N
Yes
No
Trxto next dept
Arepartsgood?
Yes
Can parts be reworked
No
Performnecessary
rework(RMR Proc)
Yes
No Toscrap
process
Start Rack parts Plate partsPartsgood?
Move to tally desk
YesUnrackParts
ForStores?
Make out manual move ticket & move
to proper stores
Yes
Trxmatl
No
TrxProcessed?
Move matl to next dept
Yes
Notify supervisor
No
Supervisor corrects?
Yes
Notifymatls dept
No Cycle countingprocess
Notifysupervisor &
QC
No
Canparts bereworked
Yes
Move parts to scrap area
within plating
RMR (rework) process
-N
No
Sort and fill out manual scrap
log
Move parts and log to
scrap/salvage area
To Scrap Process
-N
TrxProcessed?
Move matl to next dept
Yes
Notify supervisor
No
Supervisor corrects?
Yes
Notifymatls dept
No Cycle countingprocess
Yes
Move to tally desk
For stores?
Fill out manual move ticket &
move matl
Yes
No
Trxprocessed?
Yes
Notifymatls
No
Cycle counting process
MTO StartRun MTO production downloads
-N
Manually evaluate the downloads to figure out how to sequence and schedule
assembly
Print travellers and labels
Allocate workforce to
support assembly
Prepare area with parts and
build
Move tofront of grid
Complete
MTS StartRun MTS product
downloads
-N
Manually evaluate the downloads to figure out how to sequence and schedule
assembly
-N
Start packaging process
From small parts area?
Print traveller or manual
move ticket
Yes Move to staging areafor stocking
Complete
Move to tally desk
No
Ensure proper documentation
is on matl
Visual QR Start
Supervisor or lead person
visually checks QR
levels
Schedule matl to be made
Setup matl for assembly or
kitting
Run parts through
assembly
Move to QR storage area
Distribution CenterCycle
Counting
Distribution CenterCycle
Counting
FK
P F
PI S
tockro
om
FK
P F
PI S
tockro
om
FK
P S
hip
pin
g
FK
P S
hip
pin
g
FK
P W
IP
FK
P W
IP
Start when doing pure
cycle counting
Identify ABC Criteria & Indicator
-N Run SAP report every two weeks
defining items to count
Count selected items
Staff research discrepancies
D/C Mgrposts physical
counts
Run SAP report showing
accuracy of inventory
-N
Stop
Start when part not found
during order
Count selected items
Research discrepancies
Post physical counts
Stop
If bad shipment is identified
Contact Customer Service
FK Cust Serv issues RMA to
return equipment
Issue correct equipment
RMANeeded?
Yes
Adjust billing to customer for
shipment
No
Sales Order
Entered
Start when doing pure
cycle counting
Run SAP report to
generate ABC Listings
-NManually determine
which items to count
-N
Count ItemsWithin
tolerance?
-N
Manually Track accuracy
Yes
Dep-endant
demand?
No
Contact matls mgr
YesGo to WIP
cycle counting process
Research discrepancies
No
Contact Customer Service
FK Cust Serv issues RMA to
return equipment
RMAProcess
RMANeeded?
Yes
Adjust billing to customer for
shipment
No
Sales Order
Entered
Shippingerror?
Yes
<$2000?
No
Post countYesMatl mgr
posts
No
Data integrity auditor verifies(one time only)
SameResults?
Yes
No
Generateweekly cycle count report
-N
Stop
Start when part not found
during order
Start when part not found
during order
Count selected items
Research discrepancies
Post physical counts
Stop
Contact Customer Service
RMANeeded?
Adjust billingto customer for
shipment
No
Sales Order
Entered
Shipping error?
No
Yes
<$2000Yes
Matl mgrposts
No
To RMA process
Yes
Start when customer
shortage claim
Count selected items
Research discrepancies
Contact Customer Service
RMAProcess
Inventory accurate?
No
Contact customer service
Yes
Stop
P2P Process
P2P Process
Start when doing pure
cycle counting
Run SAP report to
generate ABC Listings
-NManually determine
which items to count
-N
Count Items and retrieve count sheets
-NManual schedule sent out weekly on items to count
Inventory is reconciled & adjusted if
needed
-N
Inventory results memo
published
Unfreeze inventory
before or by 8:00 AM
Inventory posted?
Yes
Schedule recount
No
Receive backflush
discrepancy
Start when having
inventory discrepancy
Change inventory using
various methods
-N
Initiate cycle count
-N
Count items
Inventory is reconciled & adjusted if
needed
Stop
Stop
Start when having
subcontractedvendor
inventory
Run vendor inventory report at beginning of
year
We publish a yearly schedule
by month for vendor
-N Each month we supply
purchasing sheets per
vendor
Vendor countsPurchasing
gives matls the results
Reconcile & adjust
inventoryStop
Out
bo
und L
og
istic
s &
Dis
trib
utio
n C
ente
rs
Out
bo
und L
og
istic
s &
Dis
trib
utio
n C
ente
rs
Sa
les
Sa
les
FK
P M
fg
FK
P M
fg
So
urc
ing
So
urc
ing
Fin
ance
Fin
ance
Receive Sales Order
-N
Finished Good Line/Item Created
MRP Code No. Regeneration(3 times day)
-NAre all reqmnt regen?
Someone notices that there is no demand for
item
No
Matls tells MRP to run item
MRP generates all components
reqmnts
Yes Shop runs shop reqmnts
reports
-N
Is matl avail?
Run purch reqmnt reports
Put material on manual hot list
No
Manual coordination
between internal Mfg
depts
-N
Manual expedite
vendor matls
P2PProcess
Make
Produceitem
Is demand stocked
No
Is Order Complete
Is needed materialFound?
Notify Matls of matl
discrepancyNo
Cycle Count Process
Yes
Yes
Is Matl ready for External
cust?
Trx & move to next dept for
more processing
No
Move to shipping location
Yes
Trx matl
SAP trx processed?
Yes
No
SAP trx processed?
No
Yes
Run report manually
throughout day
-N
Yes
Create delivery/picklist
Yes
Backorder?No Yes
No
Sort orders by priority & by
day
Customerservice
expedites sales order
Validate info on delivery
Are parts in stockroom?
Begin pick and pack process
No
Take delivery to stockroom
office
Yes Start picking process
Are parts found?
Cycle count process
No
Deliver to packing area
Yes
Canceldelivery
Consolidate MTO & MTS
Matl as needed
MTOonly
Yes
No
ManifestNeeded?
Are parts found?
Yes
No
Manually create manifest
or UCC128and input SAP
Yes
Small parcels?
No
Send through small parcel
area
Yes
Send to LTL area
No
Create packing list
-N
Place order on truck
Enter trx into ADSI/ConnectShip system
Post good issue(PGI)
Orderships to
customer(once a day)
-N
Billing run at 7:00 PM
Hardcopied invoices are folded and
mailed
EDI invoices transmitted
Customer receives invoice or
credit memos
Billing run posts revenue & receivables
Manual review of watch list
Statements are produced at
start of month for customers
past due to pay
-N
Follow-up with deliquent customer
Paid in full?
Close openAR
Yes
Some customers
pay
Upload bank file for
deposits
Apply cash to customer accounts
Is there a debit
memo?
-N
No No
Run OTC metrics Stop
Investigatecust debit memo or concern
Yes
Is debit memo valid or
needed?
Issue credit cust credit
Yes
IssueResolved
with payment
Yes
No
Sales takes position on
issue
No
Verify & transact matl
Distribution Centers Distribution Centers
For a D/C?
No
Yes
Non-SalesorderDemand
-N
Start OTC
1. Swim Lanes = 21
2. Distinct Activities = 415
- AUG = 37
- FKP = 267
- SDM = 37
- SVWT = 43
- WN = 31
3. Handoffs = Large numbers!

67
OTC To-Be Main ProcessS
upp
ly C
hai
n T
eam
OAPprocess
1Collections
ManagementProcess
8Outbound logisticsProcess
6
ProductionProcess
4
STP
3
S&OP
2
CycleCountingProcess
5
Order Scheduling
Process
10
Customer
7
Cas
h
TPO: Third-Party Shipment
Trigger to collect for TPO (only)
MTS & BTS
MTOor ATO
NPDI
11
Planning& MTSproductionorders
BTS
OTC KPIReporting
9
Process Cntrl Metric
Reporting
12
From OTC subprocesses
13

68
. Terms today do not facilitate the timely receipt of cash / - ( . ., 1 ) - . Credit policy consumes significant available OAP OTC lead time e g day OAP
- . Possible lack of correlation between orders on credit hold and invoice collections which affects total customer lead time ( ?). Mexico has different terms and they are informal with respect for handling China
There is a disconnect between commission payouts and cash receipts ( ) Scrap process informal without ownership reporting issue - ( . ., ) Union contract a problem for perceived to be vision for OTC e g Midwest DC @ FKP Orders that have shipped and even delivered are not deemed to be closed today and may be modified ( ) -- - Mixing of standard product and special orders special finish lead time issue
Customers return products without an RMA number Existence of obsolete or seldom used parts
Wrong people making decisions affecting orders , , , . Invoicing problems associated with pricing quality quantity expedited shipments . Inventory is not accurate
- . Weak handling of the returns sub process of OTC ( ) Reject Matl for Rework RMR is not followed
( ) Inaccurate bill of materials BOM ( . ., , ) Discipline is not uniformly applied e g union contract other Customer shipping errors unacceptable
.No perfect order performance tracking and metric - / ( . ., , - , .).Lack of comprehensive under standing about profits benefits versus what it cost in OTC to do it e g old low volume product etc
No global common metrics for OTC No global common reporting tool for OTC metrics Lack of variance analysis
( . ., - )We have very limited automation for information processing e g bar codes ( . ., ) . China is not on SAP e g China resulting in lack of information and synchronization
, - Due to WIP processing methods scrap material cannot be processed in real time . A need for automated SAP processing for foundry scrap
( )Manually updating prices in Augusta every Monday morning time consuming No visibility of overseas items coming in or promise dates
Manifests are manually intensive 9 Manifests are sending only tracking numbers back to SAP
( , .)No integration between tracking numbers and handling units weights etc - ( - : )Delivery processing is not real time post goods issue PGI
Customers are requiring detailing packing for advanced notification Innovation ( . ., , ). Communications problems within sites e g quality problems production schedules ( . ., , ). Communications problems with other Sloan sites e g quality problems production schedules
. Inventories build at times when large volume deliveries occur from China versus JiT , , Substandard collaboration between Operations Quality and Customer Service -- ( ) Engineering changes lack of communication lines with all parties affected including customers
Lack of communications with Credit on order handling plans Lack of understanding of who is responsible and accountable for information and resolution - ( / - )Each location's prod schedule is not synchronized for published lead times especially slow moving non stock and old parts , -When demand exceeds supply we keep promising the customer the same lead time- Lead times are too long
Accuracy of promise dates- Lead times are misrepresented to customers
’ We don t ask customers what delivery dates they would like to have Lack of a quick change set up program to support OTC objectives Lack of product knowledge on the floor Lack of work instructions and training TQM principals are not being used in the process . Need for continuing education and training to support continuous improvement
. No corporate sales and operations planning for new and existing products - ( ) Lack of rough cut capacity planning resource requirements planning
-- - No forecasting must anticipate long lead items Not doing real forecasting to include integration with promos and supply chain ( ) No total productive maintenance system TPM ( ) . Lack of statistical process controls SPC knowledge and controls - .New product lead times are such that orders go past due and are sold before OTC can fulfill Lack of coordination of new products into OAP and OTC
- We take orders with standard lead times for new products not available ’ ; .We don t know the customers requested delivery date we may not deliver products timely to their need
.Frequent problems having clean orders in OTC ’ ; . OTC doesn t always know what the customer wants it appears that the customer does not know what they want & . PTP is not controlling purchase at the raw materials and S OP level causing surplus inventory ( . ., ) No vendor mgt program e g receive product from vendors with wrong counts but not caught until too late
, Vendors deliver materials late creates shortages ( / )Raw material availability is a problem for certain commodities AMI substitutes
Purchase material shortages 2 ( ). We cannot take a clean order and deliver it in four days ATO and days MTS on average or whatever the customer and competitive situations dictates - . All product are promised to customers with the same lead time
/ / ( . ., , . ). Collections DSO AR is not collecting ASAP e g disputes terms vs actual . Sloan does not have one face to the customer / . Lack of order coordination driven into assembly fulfillment ( )Lack of capacity planning CRP
/ & Kanban QR levels not dynamically set based on S OP plans and OTC constraints/ - Kanban QR use needs to be re reviewed to meet strategic plan
. Expedited customer orders adversely affect other previously promised orders -- Multiple shipping locations customer gets multiple shipments Customer returns material and we lose it
Too many materials shortages Finished good inventory strategies lacking that prevent complete shipments
; Inaccurate promise dates cause us to spend a lot of money on expedited shipments no way of calculating accurate promise delivery dates The returns goods process at all locations is inadequate Lack of supply management MTS items intended for DC are sent to regular customers instead Too much rework No way to verify customer claims about order inaccuracies - ( ) We take orders with standard lead times for products under revision ECM not available
( , , )Length of time for documentation to get through the system MDM cost of products BOM's Process Change Mgt in shop not engaged
( , - - , ).Lack of product lifecycle mgt discontinuations end of life product rationalization ( )Tool Mgt System is not used as part of a solution
Tactical Order-to-Cash
Problems List
69
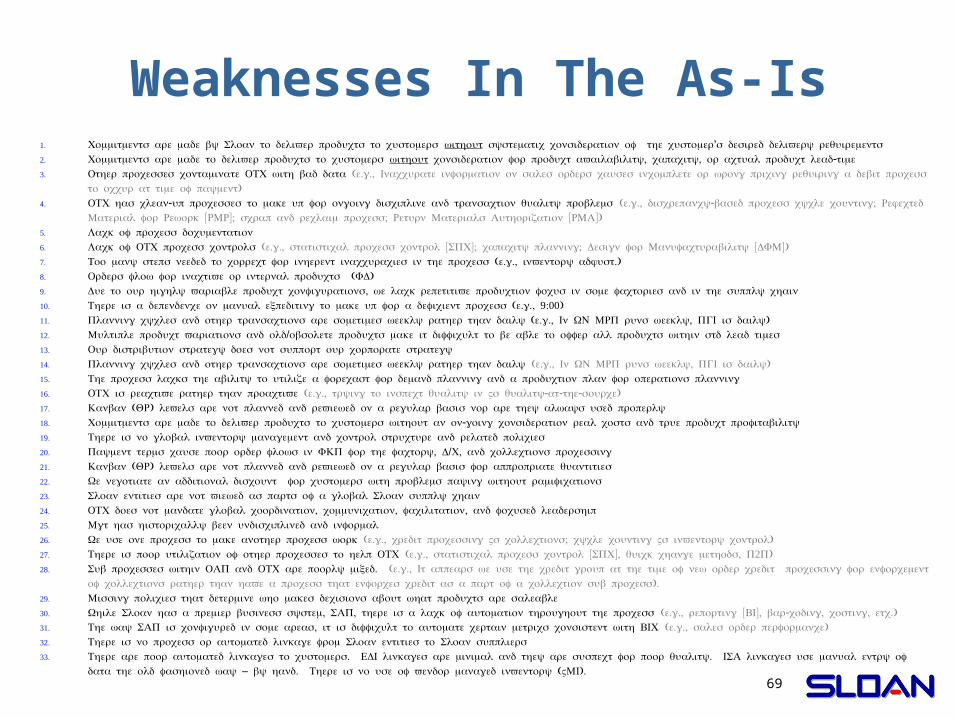
Weaknesses In The As-Is1. Commitments are made by Sloan to deliver products to customers without ’ systematic consideration of the customer s desired delivery requirements2. Commitments are made to deliver products to customers without , , -consideration for product availability capacity or actual product lead time3. Other processes contaminate OTC with bad data ( . ., e g Inaccurate information on sales orders causes incomplete or wrong pricing requiring a debit
)process to occur at time of payment4. - OTC has clean up processes to make up for ongoing discipline and transaction quality problems ( . ., - ; e g discrepancy based process cycle counting
[ ]; ; [ ])Rejected Material for Rework RMR scrap and reclaim process Return Materials Authorization RMA5. Lack of process documentation6. Lack of OTC process controls ( . ., [ ]; ; [ ])e g statistical process control SPC capacity planning Design for Manufacturability DFM7. ( . ., .)Too many steps needed to correct for inherent inaccuracies in the process e g inventory adjust8. ( )Orders flow for inactive or internal products FD9. , Due to our highly variable product configurations we lack repetitive production focus in some factories and in the supply chain10. ( . ., 9:00)There is a dependence on manual expediting to make up for a deficient process e g11. ( . ., , )Planning cycles and other transactions are sometimes weekly rather than daily e g In WN MRP runs weekly PGI is daily12. / Multiple product variations and old obsolete products make it difficult to be able to offer all products within std lead times13. Our distribution strategy does not support our corporate strategy14. Planning cycles and other transactions are sometimes weekly rather than daily ( . ., , )e g In WN MRP runs weekly PGI is daily15. The process lacks the ability to utilize a forecast for demand planning and a production plan for operations planning16. OTC is reactive rather than proactive ( . ., - - - )e g trying to inspect quality in Vs quality at the source17. ( ) Kanban QR levels are not planned and reviewed on a regular basis nor are they always used properly18. - Commitments are made to deliver products to customers without an on going consideration real costs and true product profitability19. There is no global inventory management and control structure and related policies20. , / , Payment terms cause poor order flows in FKP for the factory D C and collections processing21. ( ) Kanban QR levels are not planned and reviewed on a regular basis for appropriate quantities22. We negotiate an additional discount for customers with problems paying without ramifications23. Sloan entities are not viewed as parts of a global Sloan supply chain24. , , , OTC does not mandate global coordination communication facilitation and focused leadership25. Mgt has historically been undisciplined and informal26. We use one process to make another process work ( . ., ; )e g credit processing Vs collections cycle counting Vs inventory control27. There is poor utilization of other processes to help OTC ( . ., [ ], , 2 )e g statistical process control SPC quick change methods P P28. . Sub processes within OAP and OTC are poorly mixed ( . ., e g It appears we use the credit group at the time of new order credit processing for
).enforcement of collections rather than have a process that enforces credit as a part of a collection sub process29. Missing policies that determine who makes decisions about what products are saleable30. , , While Sloan has a premier business system SAP there is a lack of automation throughout the process ( . ., [ ], - , , .)e g reporting BI bar coding costing etc31. , The way SAP is configured in some areas it is difficult to automate certain metrics consistent with BIC ( . ., )e g sales order performance32. There is no process or automated linkage from Sloan entities to Sloan suppliers33. . . There are poor automated linkages to customers EDI linkages are minimal and they are suspect for poor quality ISA linkages use manual entry of
– . ( ).data the old fashioned way by hand There is no use of vendor managed inventory VMI

70
Unknown customer
request dates
Widespread shortages
(make & buy)
Bad promise dates to
customers
Past duesales orders
Truecapacityunclear
Inventoryis not
accurate
Lack of viable"schedules"
(make & buy)
Poor process controls
(SPC, InvAcc, Sched)
Time to deliver many products
too long
Large amount of manual expediting
Implementpull system
No activesales forecast or production
plan
No effective final assy schedule
Poor disciplines
Turn onATP then gATPfor sales order
scheduling
Implement best practice cycle
counting
ImplementbasicS&OP
Implement a final assembly
schedule
Hold people accountable for KPI's & PCM's
Implement STP supplier
scheduling
Poorquality
Lack of direct& indirect
productivity
Ineffective cycle counting
Constraints are not known &
exploitedImplement
basic TOC to prioritize all CI
activities
People not heldaccountable(answerable)
-N
Monitor & react to KPI & PCM
charts
Symptoms
Lack of leadership
Causes Root Cause Actions Actions
High overhead & variances
Implement KPI/PCM
process control charts
No effective shop pull system
Reactiveexpediting& reactivemind sets
Expeditingrules
Poorly executed
quality program
Put KPI & PCM charts at each
work center
Herosyndrome
Create & enforce BIC
policies
Eliminate need for heroes
Develop accountabilities
-N
Culture & Change Mgt Provide
leadership

71
Unknown customer
request dates
Widespread shortages
(make & buy)
Bad promise dates to
customers
Past duesales orders
Truecapacityunclear
Inventoryis not
accurate
Lack of viable"schedules"
(make & buy)
Poor process controls
(SPC, InvAcc, Sched)
Time to deliver many products
too long
Large amount of manual expediting
Implementpull system
No activesales forecast or production
plan
No effective final assy schedule
Poor disciplines
Turn onATP then gATPfor sales order
scheduling
Implement best practice cycle
counting
ImplementbasicS&OP
Implement a final assembly
schedule
Hold people accountable for KPI's & PCM's
Implement STP supplier
scheduling
Poorquality
Lack of direct& indirect
productivity
Ineffective cycle counting
Constraints are not known &
exploitedImplement
basic TOC to prioritize all CI
activities
People not heldaccountable(answerable)
-N
Monitor & react to KPI & PCM
charts
Symptoms
Lack of leadership
Causes Root Cause Actions Actions
High overhead & variances
Implement KPI/PCM
process control charts
No effective shop pull system
Reactiveexpediting& reactivemind sets
Expeditingrules
Poorly executed
quality program
Put KPI & PCM charts at each
work center
Herosyndrome
Create & enforce BIC
policies
Eliminate need for heroes
Develop accountabilities
-N
Culture & Change Mgt Provide
leadership

72
Unknown customer
request dates
Widespread shortages
(make & buy)
Bad promise dates to
customers
Past duesales orders
Truecapacityunclear
Inventoryis not
accurate
Lack of viable"schedules"
(make & buy)
Poor process controls
(SPC, InvAcc, Sched)
Time to deliver many products
too long
Large amount of manual expediting
Implementpull system
No activesales forecast or production
plan
No effective final assy schedule
Poor disciplines
Turn onATP then gATPfor sales order
scheduling
Implement best practice cycle
counting
ImplementbasicS&OP
Implement a final assembly
schedule
Hold people accountable for KPI's & PCM's
Implement STP supplier
scheduling
Poorquality
Lack of direct& indirect
productivity
Ineffective cycle counting
Constraints are not known &
exploitedImplement
basic TOC to prioritize all CI
activities
People not heldaccountable(answerable)
-N
Monitor & react to KPI & PCM
charts
Symptoms
Lack of leadership
Causes Root Cause Actions Actions
High overhead & variances
Implement KPI/PCM
process control charts
No effective shop pull system
Reactiveexpediting& reactivemind sets
Expeditingrules
Poorly executed
quality program
Put KPI & PCM charts at each
work center
Herosyndrome
Create & enforce BIC
policies
Eliminate need for heroes
Develop accountabilities
-N
Culture & Change Mgt Provide
leadership

73
Unknown customer
request dates
Widespread shortages
(make & buy)
Bad promise dates to
customers
Past duesales orders
Truecapacityunclear
Inventoryis not
accurate
Lack of viable"schedules"
(make & buy)
Poor process controls
(SPC, InvAcc, Sched)
Time to deliver many products
too long
Large amount of manual expediting
Implementpull system
No activesales forecast or production
plan
No effective final assy schedule
Poor disciplines
Turn onATP then gATPfor sales order
scheduling
Implement best practice cycle
counting
ImplementbasicS&OP
Implement FAS/MPS &
shop schedules
Hold people accountable for KPI's & PCM's
Implement STP supplier
scheduling
Poorquality
Lack of direct& indirect
productivity
Ineffective cycle counting
Constraints are not known &
exploitedImplement
basic TOC to prioritize all CI
activities
People not heldaccountable(answerable)
-N
Monitor & react to KPI & PCM
charts
Symptoms
Lack of leadership
Causes Root Cause Actions Actions
High overhead & variances
Implement KPI/PCM
process control charts
No effective shop pull system
Reactiveexpediting& reactivemind sets
Expeditingrules
Poorly executed
quality program
Put KPI & PCM charts at each
work center
Herosyndrome
Create & enforce BIC
policies
Eliminate need for heroes
Develop accountabilities
-N
Culture & Change Mgt Provide
leadership

74
Unknown customer
request dates
Widespread shortages
(make & buy)
Bad promise dates to
customers
Past duesales orders
Truecapacityunclear
Inventoryis not
accurate
Lack of viable"schedules"
(make & buy)
Poor process controls
(SPC, InvAcc, Sched)
Time to deliver many products
too long
Large amount of manual expediting
Implementpull system
No activesales forecast or production
plan
No effective final assy schedule
Poor disciplines
Turn onATP then gATPfor sales order
scheduling
Implement best practice cycle
counting
ImplementbasicS&OP
Implement FAS/MPS &
shop schedules
Hold people accountable for KPI's & PCM's
Implement STP supplier
scheduling
Poorquality
Lack of direct& indirect
productivity
Ineffective cycle counting
Constraints are not known &
exploitedImplement
basic TOC to prioritize all CI
activities
People not heldaccountable(answerable)
-N
Monitor & react to KPI & PCM
charts
Symptoms
Lack of leadership
Causes Root Cause Actions Actions
High overhead & variances
Implement KPI/PCM
process control charts
No effective shop pull system
Reactiveexpediting& reactivemind sets
Expeditingrules
Poorly executed
quality program
Put KPI & PCM charts at each
work center
Herosyndrome
Create & enforce BIC
policies
Eliminate need for heroes
Develop accountabilities
-N
Culture & Change Mgt Provide
leadership

75
Sample Sloan Process Results Strategic Planning Process (SPP)
Product strategy to a full mgt process with the BSC Employee Performance Mgt (EPM)
SPP driven goals & appraisal throughout the company Customer Support Process (CSP)
XX% call abandon rate reduced to X% New Product Development (NPD)
Silos to breakthrough “tiger team” development with gates; ideation
Order Acquisition Process (OAP) Automate pricing/approvals; reworked credit process; to be
reorg. Quality Assurance Process (QAP)
ID sigma/COQ levels; formal methods/processes (e.g., DMAIC) Master Data Mgt (MDM)
3.7 day SAP MDM loads to <3 hour MDM loads Engineering Change Mgt (ECM)
Everything goes mentality to ECO business case analysis

76
How Does Process Transformation Change the
Business?1. Focus is on strategic differentiation not just oper. excellence
2. The strategy process drives structure3. Strategy and structure drive process, resources, &
metrics4. Methods are clear: Zoom in to improve / zoom out to
design5. Design work is end-to-end work6. Cross-functional “process” teams are the best teams7. For transformation, engage all the levers of holistic
change8. The role of top management shifts to EPO
responsibilities9. The role of middle management shifts to coaching10.BPM engages learning & growth during process
design11.IT, HR, and Finance become enabling groups for core
areas12.Process design sets the stage for business model
innovation13.You don’t implement systems; you implement
processes

Thank you!