The Prism of Brain Mapping Techniques and the Need for ...
86
Copyright © 2021 Tehran University of Medical Sciences. This work is licensed under a Creative Commons Attribution-NonCommercial 4.0 International license ( https://creativecommons.org/licenses/by-nc/4.0/ ). Noncommercial uses of the work are permitted, provided the original work is properly cited. Frontiers in Biomedical Technologies Vol. 8, No. Supple 1 (2021) 1-3 The Prism of Brain Mapping Techniques and the Need for their Translational Researches and Clinical Applications Gholam-Ali Hossein-Zadeh * School of Electrical and Computer Engineering, College of Engineering, University of Tehran, Tehran, Iran. *Corresponding Authors: Gholam-Ali Hossein-Zadeh Email: [email protected] Abstract After few decades of research on versatile neuroimaging techniques, their clinical or daily-life applications are highly expected. There are some major limiting factors in this regard including: the lack of replicability and reliability, confounding factors of main neurophysiological effects, lack of standard methodology, and patient related factors. Whereas meta-analyses and machine learning approaches are likely to reveal the latent fact behind versatile neuroimaging experimental results, standard methodological issues, and clear clinical routines are expected to come from well-defined globally-guided translational neuroscience studies. Keywords: Brain Mapping; Clinical Application; Translational Neuroscience.
Transcript of The Prism of Brain Mapping Techniques and the Need for ...

Copyright © 2021 Tehran University of Medical Sciences. This work is licensed under a Creative Commons Attribution-NonCommercial 4.0 International license (https://creativecommons.org/licenses/by-nc/4.0/). Noncommercial uses of the work are permitted, provided the original work is properly cited.
Frontiers in Biomedical Technologies Vol. 8, No. Supple 1 (2021) 1-3
The Prism of Brain Mapping Techniques and the Need for their
Translational Researches and Clinical Applications
Gholam-Ali Hossein-Zadeh *
School of Electrical and Computer Engineering, College of Engineering, University of Tehran, Tehran, Iran.
*Corresponding Authors: Gholam-Ali Hossein-Zadeh Email: [email protected]
Abstract
After few decades of research on versatile neuroimaging techniques, their clinical or daily-life applications are
highly expected. There are some major limiting factors in this regard including: the lack of replicability and
reliability, confounding factors of main neurophysiological effects, lack of standard methodology, and patient
related factors. Whereas meta-analyses and machine learning approaches are likely to reveal the latent fact behind
versatile neuroimaging experimental results, standard methodological issues, and clear clinical routines are
expected to come from well-defined globally-guided translational neuroscience studies.
Keywords: Brain Mapping; Clinical Application; Translational Neuroscience.

Clinical Brain Mapping
2 FBT, Vol. 8, No.Supple 1 (2021) 1-3
1. Introduction
As a hot research field, cognitive sciences and brain
mapping attracted great human and budget resources.
Based on the emerging techniques, including fMRI,
M/EEG, fNIRS, PET, brain stimulation, etc,
researchers conducted thousands of academic research
in this area. Many papers published, or presented in
scientific gatherings. Thus their clinical applications
are highly expected. On the other hand many brain
related disorders like schizophrenia, Alzheimer,
Multiple Sclerosis, ADHD, MDD, were being studied
in clinical researches through above techniques.
Clinical application of fMRI is now limited to
presurgical mapping, and is not used for diagnosis
purpose in these disorders [1]. I try to summarize some
main challenges against applicability of brain
mapping techniques, and then give some basic
possible directions.
2. The Applicability Challenge of Brain
Mapping
Several major issues ban the regulation of the
outcome of basic and clinical researches for clinical
practice. A main concern in this regard is the lack of
replicability and reliability and confounding factors of
BOLD effect in fMRI. The replicability is a series
concern such that human brain mapping organization
put it in their agenda through data sharing initiative
and replication award [2]. Whereas almost all fMRI
studies report some significant finding in population
level, a critical ban for clinical use is the lack of
significant effect size in subject level. Thus finding
biomarkers for a particular set of symptoms in subject
level for psychiatric disorders was not successful yet
[1].
Another issue for clinical applicability of
neuroimaging is the lack of standard methodology [2].
This points to versatile methods of: image acquisition,
experiment (task) design, data analysis, and
interpretation used in neuroimaging studies performed
even on one common subject/question. Although
some initiatives (for example COBIDAS) targeted the
issue [2], but conclusive and practical guidelines must
be available in these aspects for a clinical use. It is
noteworthy that for a clinical use minimum set of
hardware and accessories must be defined.
Patient related factors are among the most
challenging factors that make changes in the
neuroimaging signal. Some important factors are:
heterogeneity in patient population (due to the
spectrum of some disorders), level of attention to the
task, mood, sleep duration, age, duration and type of
medications, training the task to the patient.
The existing and emerging computational power,
recent achievements in the field of deep learning,, and
open-access and large neuroimaging databases are
promising resources for conducting well-defined
meta-analyses in the field of neuroimaging. These
analyses are supposed to reveal the latent fact behind
the very versatile existing results in the field of
neuroimaging (even for a specific disorder and a
common task).
In order to connect neuroimaging and clinics for
diagnostics and treatments of psychiatric disorder,
translational neuroscience plays an effective role
through well-defined researches on specific disorder
with the aim of concluding the clinical procedures
even for a few application. These globally funded
projects must be defined and run in the light of
extracted facts from the previous studies extracted by
meta-analyses studies.
3. Conclusion
Several limiting factors prevented the clinical usage
of neuroimaging routines so far. Applied and Global
projects in the field of translational neuroscience are
highly expected to regulate and customize at least few
neuroimaging routines for clinical use by
standardizing the methodology, and providing clear
circumstances for patient handling, imaging,
diagnosis, etc. Toward this goal, meta-analyses and
machine learning approaches are promising tools for
extracting the latent fact from the existing longitudal
and versatile neuroimaging studies and databases in
the field.
Acknowledgment
I would like to acknowledge the Frontiers in
Biomedical Technologies journal for providing the

Gh.A Hossein-Zadeh
FBT, Vol. 8, No. Supple 1 (2021) 1-3 3
opportunity of publish for selected abstracts of ISBM
2021, which was organized by National Brain
Mapping Lab., NBML, Tehran, Iran.
References
1- Karsten Specht, “Current challenges in translational and
clinical fMRI and future directions”, Frontiers in
Psychiatry, vol. 10, Article 924, pp. 1, Jan. 2020.
2- Roland Beisteiner, Cyril Pernet, and Christoph Stippich,
“Can we standardize clinical functional neuroimaging
procedures?”, Frontiers in Neurology, vol. 9, Article
1153, pp. 1, Jan. 2019.

Copyright © 2021 Tehran University of Medical Sciences. This work is licensed under a Creative Commons Attribution-NonCommercial 4.0 International license (https://creativecommons.org/licenses/by-nc/4.0/). Noncommercial uses of the work are permitted, provided the original work is properly cited.
Frontiers in Biomedical Technologies Vol. 8, No. Supple 1 (2021) 4-6
Time-Frequency Analysis of Electroencephalogram Signals in a Perceptual
Decision-Making Task of Random Dot Kinematograms
Alireza Ettefagh, Farnaz Ghassemi * , Zahra Tabanfar
Department of Biomedical Engineering, Amirkabir University of Technology, Tehran, Iran
*Corresponding Authors: Farnaz Ghassemi Email: [email protected]
Abstract
There are many situations in which one must decide to choose between a number of possible choices using sensory
information. This type of decisions remarkably influences adaptive behaviour and is called “Perceptual Decision-
making”, which is the basis of this study. In this research, the underlying neural mechanism of these decisions is
investigated using a perceptual decision-making Electroencephalogram (EEG) dataset with a speeded perceptual
discrimination task. To this end, clean EEG signal was divided into 1.3-second segments (0.3 second before to 1
second after stimulus onset) and averaged for Event-Related Potential (ERP) and Event-Related Spectral
Perturbation (ERSP) calculations. According to the results, the amplitude of N200 component in O2 channel was
larger for correct choices than incorrect ones. Furthermore, it was observed that the beta band power in PO2
channel was higher for correct choices rather than incorrect ones.
Results suggest that these observations may show the role of attention in perceptual decisions.
Keywords: Perceptual Decision-Making; Electroencephalogram; Event-Related Potentials; Event-Related Spectral
Perturbation.
A. Ettefagh, et al.
FBT, Vol. 8, No. Supple 1 (2021) 4-6 5
1. Introduction
Perceptual decision-making is the act of choosing
one option from a set of alternatives based on available
sensory information for instance, deciding whether
crossing the street on a foggy morning, in poor visibility,
is safe [1]. The amount of information gathered from
the noisy environment and the individual’s attention
[2] are the main factors which affect the choice confidence
[1], and the outcome of a perceptual decision. The aim
of this study is to investigate the brain function in a
perceptual decision-making task.
2. Materials and Methods
Pre-processed EEG and behavioral data from [3]
were used in this study. Participants in [3] performed
a speeded perceptual discrimination task while their
EEG signal was getting recorded. They were asked to
judge the motion direction of random dot kinematograms
(left vs. right). This experiment consisted of 2 blocks,
each containing 160 trials. The clean EEG signal was
segmented into 1.3 seconds (-300, 1000 ms) intervals,
time-locked to stimulus onset and averaged for ERP
and ERSP calculations. The ERSP provides elements
of event-related brain dynamics that are not shown by
the ERP average of the same response epochs. The
ERSP quantifies the average dynamic alterations in
amplitude of the EEG frequency spectrum in time and
in relation to the task event.
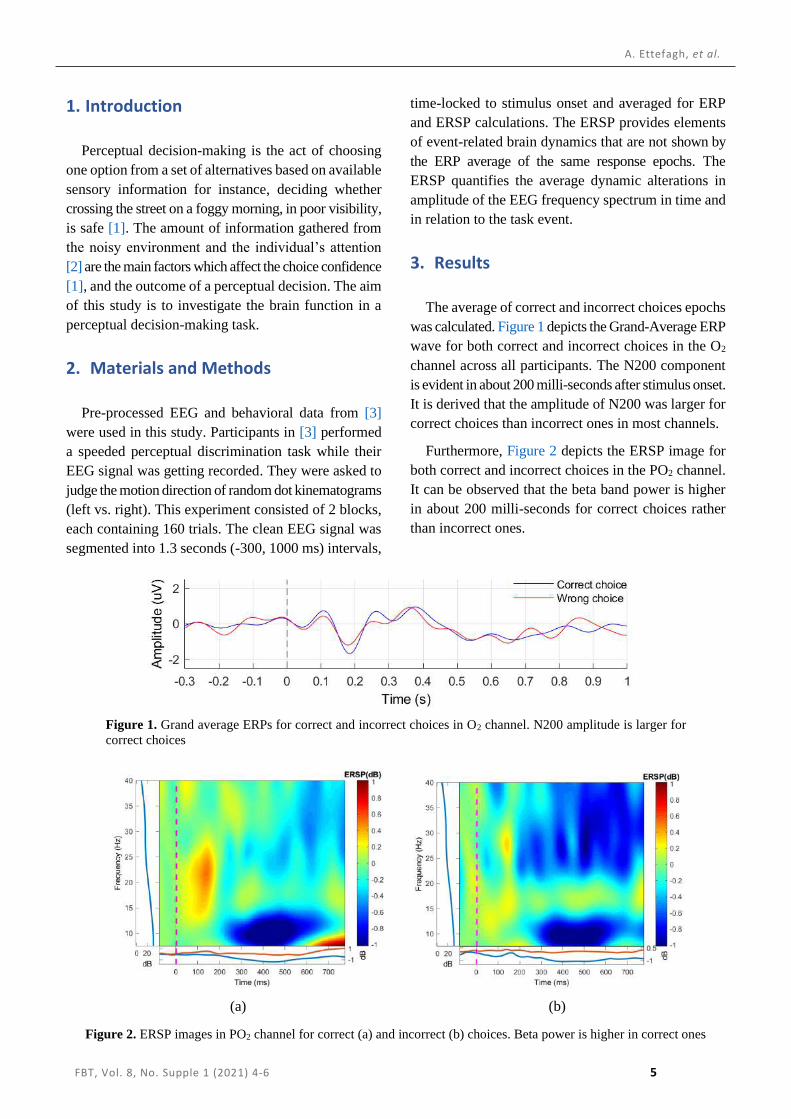
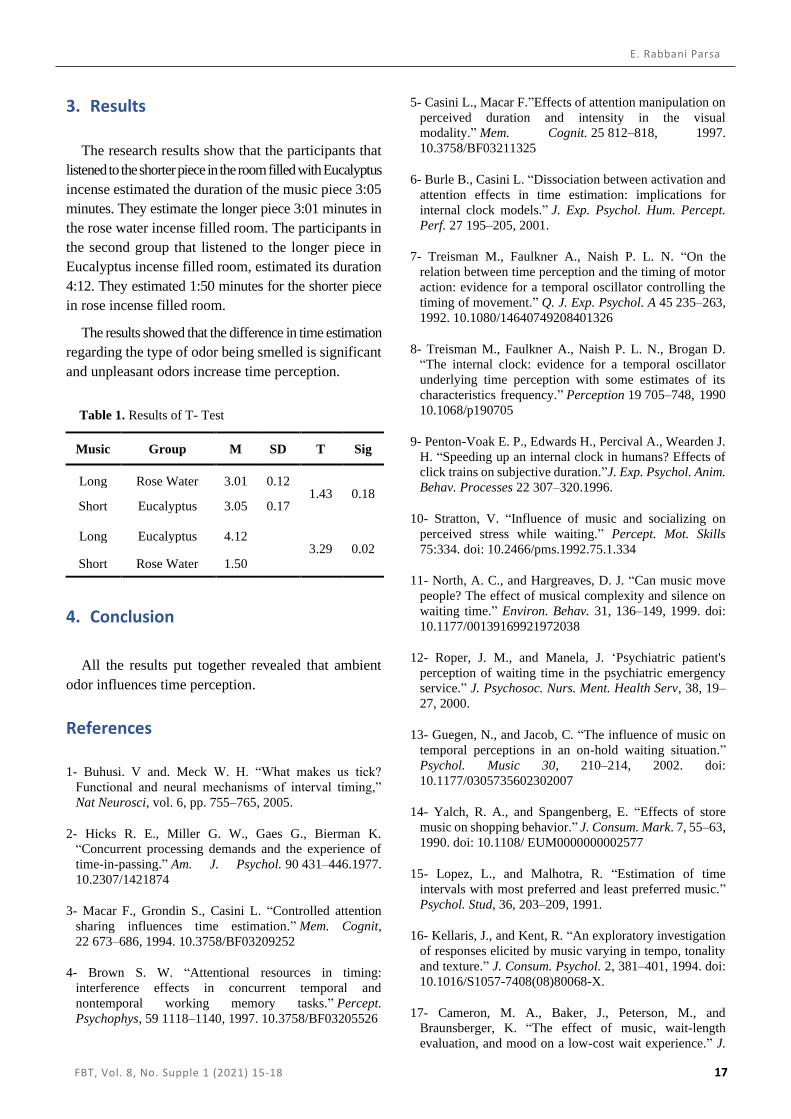
3. Results
The average of correct and incorrect choices epochs
was calculated. Figure 1 depicts the Grand-Average ERP
wave for both correct and incorrect choices in the O2
channel across all participants. The N200 component
is evident in about 200 milli-seconds after stimulus onset.
It is derived that the amplitude of N200 was larger for
correct choices than incorrect ones in most channels.
Furthermore, Figure 2 depicts the ERSP image for
both correct and incorrect choices in the PO2 channel.
It can be observed that the beta band power is higher
in about 200 milli-seconds for correct choices rather
than incorrect ones.
Figure 1. Grand average ERPs for correct and incorrect choices in O2 channel. N200 amplitude is larger for
correct choices
(a) (b)
Figure 2. ERSP images in PO2 channel for correct (a) and incorrect (b) choices. Beta power is higher in correct ones

EEG Time-Frequency Analysis in Perceptual Decision-Making
6 FBT, Vol. 8, No. Supple 1 (2021) 4-6
4. Conclusion
The present study investigates the ERP and ERSP
components of correct and incorrect choices in a random
dot kinematogram task. The larger N200 amplitude and
the higher beta power for correct choices may be due
to more attention on the stimuli.
References
1- Gherman, S. and Philiastides, M. G. “Human VMPFC
encodes early signatures of confidence in perceptual
decisions.” eLife 7, 2018.
2- Nunez, M. D., Vandekerckhove, J., and Srinivasan, R.
“How attention influences perceptual decision making:
Single-trial EEG correlates of drift-diffusion model
parameters.” Journal of mathematical psychology 76, Pt
B, 117–130, 2017.
3- Gherman, S. and Philiastides, M. G. “Simultaneous EEG-
fMRI.” Confidence in perceptual decisions, 2020.
DOI=10.18112/openneuro.ds002739.v1.0.0.

Copyright © 2021 Tehran University of Medical Sciences. This work is licensed under a Creative Commons Attribution-NonCommercial 4.0 International license (https://creativecommons.org/licenses/by-nc/4.0/). Noncommercial uses of the work are permitted, provided the original work is properly cited.
Frontiers in Biomedical Technologies Vol. 8, No. Supple 1 (2021) 7-9
Disruption of Resting-State Functional Brain Networks in Children with
Attention Deficit/Hyperactivity Disorder: A Resting State EEG Study
Maliheh Ahmadi 1, Kamran Kazemi 1, Katarzyna Kuc 2, Anita Cybulska-Klosowicz 3, Mohammad Sadegh Helfroush 1, Ardalan
Aarabi 4,5 *
1 Department of Electrical and Electronics Engineering, Shiraz University of Technology, Shiraz, Iran
2 SWPS University of Social Sciences and Humanities, Warsaw, Poland
3 Laboratory of Emotions Neurobiology, Nencki Institute of Experimental Biology, Polish Academy of Sciences, Warsaw, Poland
4 Laboratory of Functional Neuroscience and Pathologies, University Research Center, University Hospital, Amiens, France
5 Faculty of Medicine, University of Picardy Jules Verne, Amiens, France
*Corresponding Authors: Ardalan Aarabi Email: [email protected]
Abstract
Attention Deficit Hyperactivity Disorder (ADHD) is a pathological condition with symptoms of inattention and/or
impulsivity/hyperactivity. In this study, we evaluated alterations in resting-state Electroencephalography (EEG)
source activity and functional connectivity in children with Inattentive (ADHDI) and Combined (ADHDC) ADHD
compared to Healthy Controls (HC) using high-density EEG data. The exact Low Resolution Electromagnetic
Tomography (eLORETA) was first used to compute Current Source Density (CSD) in different frequency bands.
The lagged phase synchronization was then used to examine functional connectivity. Group differences in CSDs
and network topological properties were assessed between the ADHD and HC groups. Compared to HC, ADHDC
was characterized with a significant increase in Theta/Beta power Ratio (TBR) due to a global decrease in beta
CSD. ADHDI also exhibited increased TBR in all brain regions with a global increase in theta source power
except in posterior areas.
Functional brain networks of both ADHD groups displayed a small-world topology. Compared to HC, ADHDI
was characterized with a global decrease in Lagged Phase Synchronization (LPS) in the delta and beta bands.
ADHDI also showed a tendency for higher and lower network degrees in low and high frequency bands,
respectively. ADHDC displayed increases in LPS in the frontal, central, temporal and posterior areas. Our findings
suggest that EEG source analysis can better capture alterations in brain functional connectivity underlying the
pathophysiology of ADHD.
Keywords: Electroencephalography; Cortical Source Imaging; Exact Low Resolution Electromagnetic
Tomography; Lagged Phase Synchronization; Graph Analysis; Combined and Inattentive Attention Deficit
Hyperactivity Disorder.

Abnormal Functional Connectivity in ADHD Children
8 FBT, Vol. 8, No.Supple 1 (2021) 7-9
1. Introduction
ADHD is one of the most common
neurodevelopmental disorders in children. ADHD
children suffer from inattention, impulsivity, and/or
hyperactivity. Growing evidence from neuroimaging
studies indicates that alterations in brain functional
connectivity may play critical roles in the
pathophysiology of ADHD. Graph theory analysis has
been used in many studies to characterize brain network
properties during resting state using network metrics
such as clustering and degree describing how efficiently
information is exchanged between brain regions [1, 2].
Other metrics like small-worldness can be used to examine
the functional balance between network segregation and
integration [3]. The main goal of this study is to investigate
alterations in resting-state EEG source activity and
functional connectivity in children with ADHDI and
ADHDC ADHD compared to Healthy Controls (HC)
using high-density EEG data.
2. Materials and Methods
41 HC and 40 (10 inattentive and 30 combined) ADHD
children were included in our study. The ADHD children
were diagnosed based on the diagnostic criteria of the
DSM-IV TR (4th edition, American Psychiatric Association,
2000) at Public Pediatric Teaching Hospital in Warsaw,
Poland [4]. Five-minute resting-state EEG data were
recorded from each child using an Electrical
Geodesics Incorporated (EGI) 64-channel recoding
system (Eugen, OR, United States) with a sampling
frequency of 250 Hz and a referential montage
referenced to Cz. The EEG source analysis was
performed by exact low resolution electromagnetic
tomography (eLORETA) on twenty five-second EEG
epochs from each subject in four frequency bands, delta
(0.5-4 Hz), theta (4.25–8 Hz), alpha (8.25–13 Hz) and beta
(13.25–30 Hz). We then explored functional connectivity
between 80 AAL regions using the LPS [5] to
investigate group differences in functional network
topological properties between the ADHD and HC groups
using using permutation testing (p< 0.05, corrected for
multiple comparison).
3. Results
The statistical analysis showed significant differences
in CSD between the ADHD subtypes and HC in different
frequency bands. Our results revealed a significant diffuse
decrease in beta source power, resulting in a global increase
in TBR in ADHDC relative to HC. ADHDC also exhibited
a significant increase in theta CSD in the central, parietal
and occipital regions. In this subtype, a significant decrease
in delta CSD was found in right frontal areas. In
ADHDI, increases and decreases in CSDs were
observed in the fronto-central regions in low (delta-
theta) and high frequency bands (alpha-beta),
respectively. ADHDI also exhibited an increase in
TBR in all brain regions with the exception of the
posterior areas. Regardless of the frequency band, all
three groups showed a small-world topology. Compared
to HC, ADHDI was characterized with a global decrease
in LPS in the delta and beta bands. ADHDI also showed
a tendency for higher and lower network degrees in low
and high frequency bands, respectively. ADHDC displayed
increases in LPS in the frontal, central, temporal and
posterior areas. ADHDC was further characterized by
declined clustering coefficients in theta and higher
global efficiency in delta relative to HC.
4. Conclusion
We assessed differences in EEG cortical source
densities and functional connectivity between ADHD
and HC children in four frequency bands. Our results
revealed altered cortical source densities and functional
connectivity in different frequency bands in ADHD
children compared to HC. Our findings showed that
resting-state functional source connectivity analysis
provides an efficient way to identify disruptions in
functional brain networks in ADHD children.
Acknowledgement
This research was supported by the National Science
Centre Poland Grants: 2011/01/D/NZ4/04958 for A.C.-
K. and 2015/17/N/HS6/03020 for K.K. It was also
partially supported by the Iran National Science Foundation
(INSF) and Cognitive Sciences and Technologies Council
(CSTC) under the grant numbers 97008049 and 6672.

M. Ahmadi, et al.
FBT, Vol. 8, No. Supple 1 (2021) 7-9 9
References
1- S. Furlong, "Resting-State EEG Connectivity in Young
Children With ADHD: A Potential Neural Marker.",
2018 .
2- C. S. Monk et al., "Abnormalities of intrinsic functional
connectivity in autism spectrum disorders." Neuroimage,
vol. 47, no. 2, pp. 764-77, 2009.
3- A. H. Ghaderi, M. A. Nazari, H. Shahrokhi, and A. H.
Darooneh, "Functional brain connectivity differences
between different ADHD presentations: impaired
functional segregation in ADHD-combined presentation
but not in ADHD-inattentive presentation." Basic and
Clinical Neuroscience, vol. 8, no. 4, p. 267, 2017 .
4- K. Giertuga, M. Z. Zakrzewska, M. Bielecki, E. Racicka-
Pawlukiewicz, M. Kossut, and A. Cybulska-Klosowicz,
"Age-related changes in resting-state EEG activity in
attention deficit/hyperactivity disorder: a cross-sectional
study." Frontiers in human neuroscience, vol. 11, p. 285,
2017 .
5- J. Rizkallah, H. Amoud, M. Fraschini, F. Wendling, and
M. Hassan, "Exploring the correlation between M/EEG
source–space and fMRI networks at rest.” Brain
topography, vol. 33, no. 2, pp. 151-160, 2020 .

Copyright © 2021 Tehran University of Medical Sciences. This work is licensed under a Creative Commons Attribution-NonCommercial 4.0 International license (https://creativecommons.org/licenses/by-nc/4.0/). Noncommercial uses of the work are permitted, provided the original work is properly cited.
Frontiers in Biomedical Technologies Vol. 8, No. Supple 1 (2021) 10-14
EEG Spectral and Complexity Indices Change during Islamic Praying
Gholam Hossein Meftahi 1, Zahra Rezvani 2, Gila Pirzad Jahromi 1, Hedayat Sahraei 1, Boshra Hatef 1 *
1 Neuroscience Research Center, Baqiyatallah University of Medical Sciences, Tehran, Iran
2 School of Computer Science, Institute for Research in Fundamental Sciences, Tehran, Iran
*Corresponding Authors: Boshra Hatef
Email: [email protected]
Abstract
There is little information about the effects of Islamic praying (Namaz) on the brain. This study aimed to
investigate the change of frequency bands and complexity of the brain signal during and after a four-cycle (rak'at)
of Namaz. 80 healthy and Muslim adult participated in this study. Electroencephalography (EEG) recording was
taken before, after and during performing a four cycle of the real Namaz. The relative power of frequency bands
and nonlinear indices of EEG signals were measured.
The significance level was validated by the False Discovery Rate (FDR) correction. Only an increase in
approximate entropy, spectral entropy, and Katz indices were seen in the left hemisphere after Namaz, especially
in women and in the eye open state. During the Namaz, in most of the brain regions, the relative power of alpha
and beta one bands increased in prostration and decreased in bowing, and the relative power of the other bands
consisted of theta, beta 2 and 3, gamma 1 and 2 bands and nonlinear indices in bowing increased and decreased
in prostration.
Thus, the brain frequencies and complexity in different positions of Namaz, especially prostration and bowing,
undergo specific changes that often return to the pre-Namaz.
Keywords: Electroencephalography; Islam; Praying; Complexity.

Gh.H. Meftahi, et al.
FBT, Vol. 8, No. Supple 1 (2021) 10-14 11
1. Introduction
Some studies have been demonstrated the positive effect
of Namaz on cases such as immune system disorders,
sleep, memory, irregular blood pressure, gastrointestinal
infections, and skin diseases [1, 2]. Ms. Rana'i and her
colleagues showed that depression was significantly lower
students who have a positive attitude toward Namaz [3].
another study showed that the more conscientious group
to Namaz had more mental health and were less depressed
[4]. Part of these positive effects may be the effect of
Namaz on the brain. Unfortunately, there are very few
studies in this regard. The research group studies showed
that the relationship between the relative power of alpha
waves in temporal and occipital channels was significant
with an increase in parasympathetic tone during Namaz
especially in prostration position [5, 6]. In comparison
between actual Namaz and mimic Namaz (i.e., only
performing Namaz movements), it was seen that the relative
strength of the gamma band in prostration and most areas of
the brain, especially the prefrontal and central, and in the
bowing state in the prefrontal and frontal regions in real
Namaz was more than mimic Namaz [7]. The main error
of these limited studies regarding to Namaz, which makes
their results unreliable, was not considering of interaction
effect of channels that should be removed in statistics. Then
a significant level calculated based on FDR correction
was used in the current study to remove the interaction
effect of channels to each other. In addition, those
studies have been limited to the study of alpha and
gamma bands. This study aimed to investigate all
frequency spectrum of EEG and nonlinear indices
before, during, and after a four cycle Namaz.
Nonlinear indices are a more accurate interpretation of
biological signals [8].
2. Materials and Methods
45 men and 35 women who had inclusion criteria were
asked to have a good sleep the night before the test.
Do not have severe stress on test day. They were tested
between 10 and 14 o'clock. Perform Wudu before the test.
The code of ethical research approved by Baqiyatallah
University of Medical Sciences is IR.BMSU.REC.1397.190.
The EEG recording was taken while sitting on a chair
with the eyes open and the eyes closed, 1 minute for
each one. Afterward, they were asked to face the Qibla
and perform four cycle (rak'ats) of the actual Namaz,
at which time the noon. EEG recording was also taken
during Namaz. After the Namaz, they returned to sitting
on a chair, and again 1 minute of open eyes and one minute
of closed eyes were recorded.
To record the EEG signal, a 16-channel EEG device
model Liv intelligent technology made in Iran with
Resolution: 24 bit. registered channels included: Fp1,
Fp2, F3, F4, F7, F8, C3, C4, T5, T6, P3, P4, O1, O2,
and the reference electrode was placed on Cz, and the
common electrode was placed on Fz. In order to
analysis during Namaz, the four segments from each
cycle of Namaz were selected for analysis that were
standing, bowing, prostration and sitting position and
the EEG data for transit situation did not consider. The
sampling frequency was 256 samples per second.
Preprocessing included signal filtering between the 0.2-
48 Hz band, visual inspection of the signal, and removal
of motion artifacts, Electromyography (EMG), and
flashing removing using the Independent Component
Analysis (ICA) algorithm. Spectral indices were:
Theta: 4-8 Hz, Alpha 1: 8-10 Hz, Alpha 2: 10-12 Hz,
Beta 1: 12-16 Hz, Beta 2: 16-20 Hz, Beta 3: 20-30 Hz,
gamma 1: 30-35 Hz and gamma 2: 35-40 Hz [9, 10].
The nonlinear indices were approximate entropy [11]
in the time domain (AppEn), spectral entropy of Welch
[12] in the frequency domain (SpEn), the fractal
dimension of Petrosian, and Katz [10], Hurt Exponent
and Alpha Detrended Fluctuation Analysis (DFA)
[13]. In order to remove the interaction effect of
channels to each other, the significance level obtained
in the analysis for each index in all channels was
placed separately in the FDR correction formula.
3. Results
A significant increase was seen in the AppEnt and
Katz, after FDR correction in women in T5, C3, T6,
P4, F8, and O1 channels in the open eye after Namaz.
A significant difference was seen in fewer channels in
the close eye situation. SpecEnt significantly increased
after Namaz in women in the open eyes only in the O1
and T5 channels (Figure 1).
During the Namaz, there was no difference in changes
between the two sexes. The relative power of the alpha
1, 2 (Figure 2), and beta 1 bands was significantly
increased after FDR correction in the prostration position
and decreased in the bowing position. At the same time,
the relative power of the theta and beta 3 and gamma

EEG Spectral and Complexity Indices Change during Islamic Praying
12 FBT, Vol. 8, No. Supple 1 (2021) 10-14
1 and 2 bands and complexity indices (Figure 3) was
significantly increased after FDR correction in the bowing
position and decreased in the prostration position. There
was no difference between sitting and standing in any
of the indicators. Some areas, such as the occipital area,
showed the most differences and the prefrontal area
the least.
4. Conclusion
The findings showed that the nonlinear indices of EEG
were more sensitive to changes after and during Namaz
than spectral indices and the rhythmical changes of
complexity was similar high band frequency of EEG.
Changes in frequency bands of brain signal and its
complexity indices between different position of Namaz,
especially in bowing and prostration compared to standing
and sitting positions, were quite clear and significant.
The low and high frequencies of the brain, except theta
band, behaved in the reversed pattern. The bowing position
increased the high band frequency (16-40 Hz) due to
involvement of more postural stability strategies and
motor activity [14]. But the prostration increased the
low band frequency (7-16 Hz) due to stimulation of
baroreceptors and parasympathetic tone [15, 16], that
increases attention and relaxation. Then several factors
such as posture and working memory during Namaz
changed the brain activity. But several interacted factors
should be evaluated in the future studies.
Figure 2. Mean value and 95% CI of the relative power of alpha 2 (10-12 Hz) in 4 positions of standing, bowing, prostration,
and sitting in 4 rak'at of Namaz is on the left, and their comparison table with FDR correction p-value between different
positions is on the right side of the figure. The significant comparison is shown as the gray color cell
Figure 1. Mean value and 95 CI% of AppEnt (a) and Katz (b) in the open eyes before and after Namaz in
women and men. *: Significant difference after FDR correction less than 0.05 between before and after Namaz
(a)
(b)

Gh.H. Meftahi, et al.
FBT, Vol. 8, No. Supple 1 (2021) 10-14 13
References
1- Ahmad Ameri, Amir Mahdi Taleb, Teymourlouee SAA.
“Prayer: Love viewpoint and Mainline of Health and
Welfare.” Teb AND Tazkiyeh, (76):39-45, 2010.
2- Imanzadeh A, Hamrahzdeh M. “Identification of
Facilitators and Deterrents of the Quality of Life in
Elderly Women and Men: A Phenomenological
Research.” Salmand: Iranian Journal of
Ageing;12(4):430-45, 2018.
3- Fariba R, Farasat A, Farzaneh Z. “Survey of relationship
between attitude and practice toward prayer and
depression in students of Kurdistan University of Medical
Sciences.” Teb va Tazkiyeh;19(4):75, 2012.
4- AGHAYANI CA, Talebian D, Tarkhourani H, SEDGHI
JH, Azarmi S, FATHI AA. “The relationship between
prayers and religious orientation with mental health.”
149-56, 2008
5- Doufesh H, Faisal T, Lim KS, Ibrahim F. “EEG spectral
analysis on Muslim prayers.” Appl Psychophysiol
Biofeedback; 37(1):11-8, 2012.
6- Doufesh H, Ibrahim F, Ismail NA, Wan Ahmad WA.
“Effect of Muslim prayer (Salat) on alpha
electroencephalography and its relationship with
autonomic nervous system activity.” J Altern Complement
Med; 20(7):558-62, 2014.
7- Doufesh H, Ibrahim F, Safari M. “Effects of Muslims
praying (Salat) on EEG gamma activity.” Complement
Ther Clin Pract; 24:6-10, 2016.
8- Kaniusas E, editor “Nonlinear Behaviour of Vital
Physiological Systems.” International Conference on
Theory and Application in Nonlinear Dynamics (ICAND
2012); Springer, 2014.
9- Natarajan K, Acharya U R, Alias F, Tiboleng T,
Puthusserypady S. “Nonlinear analysis of EEG signals at
different mental states.” BioMedical Engineering OnLine;
3(1):7, 2004.
10- Subha DP, Joseph P, Acharya U R, Lim C. “EEG Signal
Analysis: A Survey.” Journal of Medical Systems;
34(2):195-212, 2010.
11- Pincus S, Gladstone I, Ehrenkranz R. “A regularity
statistic for medical data analysis.” Journal of Clinical
Monitoring; 7(4):335-45, 1991.
Figure 3. Mean value and 95% CI of approximate entropy index (a) and Katz index (b) in 4 standing, bowing, prostration
and sitting positions in 4 rak'at of Namaz is on the left and the results comparison table with FDR p-value between positions
is on the right side of figure. Significant amount is shown as gray-colored cell in the recorded channels
(a)
(b)

EEG Spectral and Complexity Indices Change during Islamic Praying
14 FBT, Vol. 8, No. Supple 1 (2021) 10-14
12- Inouye T, Shinosaki K, Sakamoto H, Toi S, Ukai S,
Iyama A, et al. “Quantification of EEG irregularity by use
of the entropy of the power spectrum.”
Electroencephalography and Clinical
Neurophysiology;79(3):204-10, 1991.
13- Perfetto JC, Ruiz A, Attellis CD, editors. “Detrended
Fluctuation Analysis (DFA) and R-R Interval variability:
A new linear segmentation algorithm.” Computers in
Cardiology; 2006.
14- Slobounov S, Hallett M, Stanhope S, Shibasaki H.
“Role of cerebral cortex in human postural control: an
EEG study.” Clin Neurophysiol;116(2):315-23, 2005.
15- Shaverdi Y, Manshadi EM, Jahromi GP, Sharif MS,
Hatef B. “Assessment of heart rate variation in different
positions of Muslim prayers.” International
Cardiovascular Research Journal; In Review, 2021.
16- Rabinovitch A, Friedman M, Braunstein D, Biton Y,
Aviram I. “The Baroreflex Mechanism Revisited.” Bull
Math Biol;77(8):1521-38, 2015.

Copyright © 2021 Tehran University of Medical Sciences. This work is licensed under a Creative Commons Attribution-NonCommercial 4.0 International license (https://creativecommons.org/licenses/by-nc/4.0/). Noncommercial uses of the work are permitted, provided the original work is properly cited.
Frontiers in Biomedical Technologies Vol. 8, No. Supple 1 (2021) 15-18
The Influence of Odors on Time Perception
Elham Rabbani Parsa *
Department of Psychology, Faculty Psychology & Educational Sciences, Semnan University, Semnan, Iran
*Corresponding Authors: Elham Rabbani Parsa Email: [email protected]
Abstract
In this paper, we focus on time perception in odor types and music as a perception of duration. Time perception
is closely tied to our experience of the world, but specifically relevant in experiences that we enjoy. This study
aims at the effect of odor types on time perception. 10 BA students participated in the study. The results show
that there is a significant relationship between the pleasant and unpleasant odor and time perception.
Keywords: Odors; Time Perception; Music.

The Influence of Odors on Time Perception
16 FBT, Vol. 8, No. Supple 1 (2021) 15-18
1. Introduction
Events and actions constitute an important fact of
human behavior that come into existence in time and space.
For event sequencing and rate estimation, amount and
pace of an object, time plays a significant role. Therefore,
time is a primary element of intelligent behavior. Time
perception or the experience of temporal intervals has
received prevalent focus from varied points of view [1].
Time estimation is regarded as the concrete form of time
perception and it plays an important role in everyday
activities.
This subjective perception of time can be somehow
different from the actual duration. The effect of different
elements on this internal clock has been comprehensively
researched. The two effects that have absorbed a lot of
attention are that subjective duration is dependent upon
attention dedicated to time (for reviews: [2, 3, 4, 5, 6],
and arousal level [6, 7, 8, 9]). It has been suggested that
arousal level would have an effect on the pacemaker rate.
A rising level of arousal would expedite the pacemaker rate
making for a larger quantity of accumulated pulses and,
as a result, in overestimated durations. On the other hand,
attention has an effect on the accumulation of pulses.
Each time attentional resources are diverged from the time
parameters, pulses are lost, resulting in a reduction of
the number of pulses piled up, and causing shorter estimated
durations. However, if the duration is paid more attention,
more pulses will be piled up and duration will be estimated
as longer.
A number of studies show that a duration of waiting
is estimated shorter when there is concomitant music
than when there is no music (e.g. [10, 11, 12, 13]) and
that this subjective shortening of time appears to be
larger when the subjects listen and enjoy this concomitant
music [14, 15, 16, 17].
The creativity and originality of the current study is
to use an olfactory stimulus as an external factor and
to research how it affects time perception of neutral
stimuli (i.e., music). Odors can already have an impact
on emotional states in different contexts with little
cognitive mediations ([18, 19]; for reviews). Indeed,
hedonic valence seems to be the most immediate and
significant known feature of any olfactory stimulation
[20, 21, 22]. As it appears from literature review, there
is only one study done previously on time perception
using odors as an external factor. Schreuder [23] utilized
environmental odors to measure the arousal conditions
of the subjects. Participants had to produce three time
intervals (1.33, 1.58, and 2.17 min) when they felt either
an arousing odor (rosemary), a relaxing odor (peppermint)
or no odor (control condition). When participants sensed
rosemary odor, they produced importantly shorter intervals
than in the no odor condition. Consequently, this effect
could not be gleaned by an increase of arousal but rather
by other effects due to exposure to odors. We could note
that the odors used in this study were both regarded as
pleasant by the participants.
2. Materials and Methods
The research participants were 10 B.A. students
between 20 to 30 years old with the average of 24/8
years old. All the participant were psychologically and
physiologically normal and were not afflicted by
Coronavirus disease (COVID 19) and had normal olfactory
sense. All the 10 subjects had been trained for time
perception in two intervals of 2:30 minutes and 1 minute
and 50 seconds. The training consisted of every individual
listening three times to a pieces of music with a duration
of 1 minute and 50 seconds and three times to another
piece with the duration of 2 minutes and 30 seconds in order
to become familiar with rhythm and time measurement.
The pieces from both intervals were vocal pop songs.
The participants were placed in a room with no windows
and clocks without any possibility for them to tell the
time. The room was filled with Eucalyptus incense. The
participants were required to have a seat and listen to
the instrumental music being played at the time and finally
estimate its duration. After a day, the participants were
again seated in a room filled with rose water incense.
5 of the participants were in the exact opposite situation.
The music in the experiment consisted of two instrumental
pieces with monotonous rhythm and their duration was
2:20 minutes and 3:05 minutes respectively. For five
of the participants the shorter piece was played in a room
filled with Eucalyptus incense and the longer piece was
played in a room filled with rose water incense. The situation
was exactly vice versa for the other five participants.
The participants were awarded 250,000 Rails per
day (totally 500,000 Rails awarded to each individual)
and they were asked to sign a consent form (In the
consent form, we mentioned that the results would be
used in research studies without the mentioning of
individual names).
E. Rabbani Parsa
FBT, Vol. 8, No. Supple 1 (2021) 15-18 17
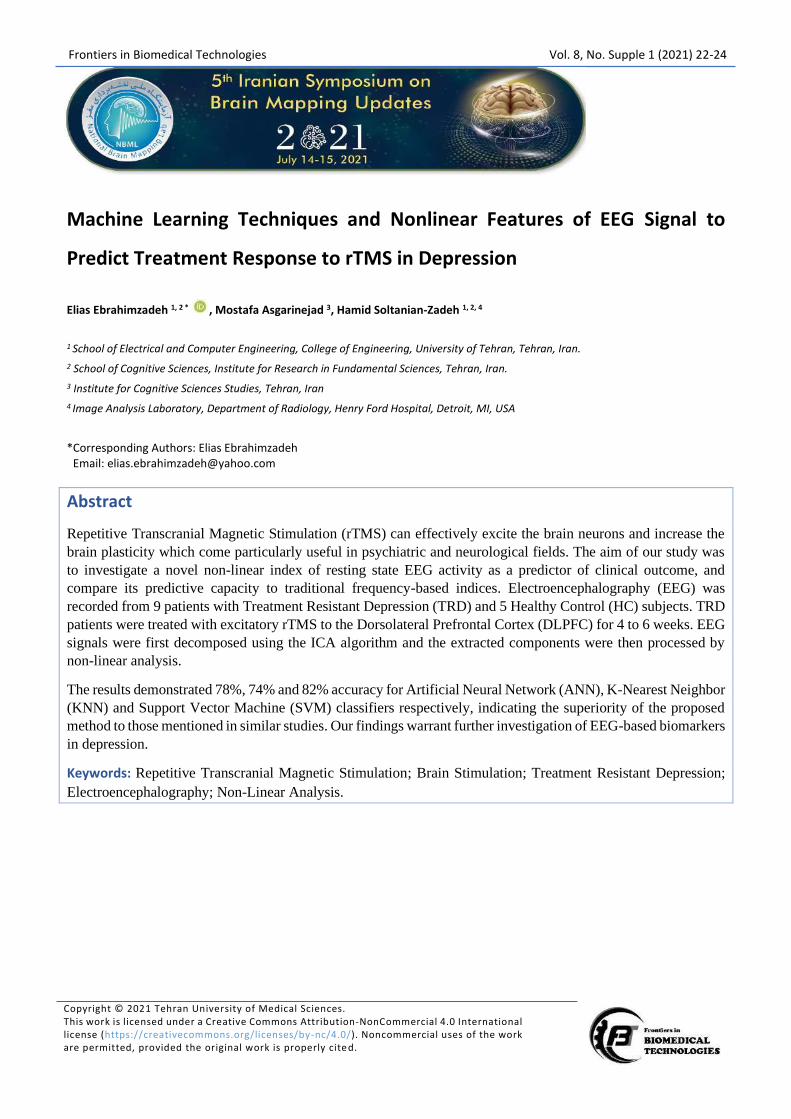
3. Results
The research results show that the participants that
listened to the shorter piece in the room filled with Eucalyptus
incense estimated the duration of the music piece 3:05
minutes. They estimate the longer piece 3:01 minutes in
the rose water incense filled room. The participants in
the second group that listened to the longer piece in
Eucalyptus incense filled room, estimated its duration
4:12. They estimated 1:50 minutes for the shorter piece
in rose incense filled room.
The results showed that the difference in time estimation
regarding the type of odor being smelled is significant
and unpleasant odors increase time perception.
4. Conclusion
All the results put together revealed that ambient
odor influences time perception.
References
1- Buhusi. V and. Meck W. H. “What makes us tick?
Functional and neural mechanisms of interval timing,”
Nat Neurosci, vol. 6, pp. 755–765, 2005.
2- Hicks R. E., Miller G. W., Gaes G., Bierman K.
“Concurrent processing demands and the experience of
time-in-passing.” Am. J. Psychol. 90 431–446.1977.
10.2307/1421874
3- Macar F., Grondin S., Casini L. “Controlled attention
sharing influences time estimation.” Mem. Cognit,
22 673–686, 1994. 10.3758/BF03209252
4- Brown S. W. “Attentional resources in timing:
interference effects in concurrent temporal and
nontemporal working memory tasks.” Percept.
Psychophys, 59 1118–1140, 1997. 10.3758/BF03205526
5- Casini L., Macar F.”Effects of attention manipulation on
perceived duration and intensity in the visual
modality.” Mem. Cognit. 25 812–818, 1997.
10.3758/BF03211325
6- Burle B., Casini L. “Dissociation between activation and
attention effects in time estimation: implications for
internal clock models.” J. Exp. Psychol. Hum. Percept.
Perf. 27 195–205, 2001.
7- Treisman M., Faulkner A., Naish P. L. N. “On the
relation between time perception and the timing of motor
action: evidence for a temporal oscillator controlling the
timing of movement.” Q. J. Exp. Psychol. A 45 235–263,
1992. 10.1080/14640749208401326
8- Treisman M., Faulkner A., Naish P. L. N., Brogan D.
“The internal clock: evidence for a temporal oscillator
underlying time perception with some estimates of its
characteristics frequency.” Perception 19 705–748, 1990
10.1068/p190705
9- Penton-Voak E. P., Edwards H., Percival A., Wearden J.
H. “Speeding up an internal clock in humans? Effects of
click trains on subjective duration.”J. Exp. Psychol. Anim.
Behav. Processes 22 307–320.1996.
10- Stratton, V. “Influence of music and socializing on
perceived stress while waiting.” Percept. Mot. Skills
75:334. doi: 10.2466/pms.1992.75.1.334
11- North, A. C., and Hargreaves, D. J. “Can music move
people? The effect of musical complexity and silence on
waiting time.” Environ. Behav. 31, 136–149, 1999. doi:
10.1177/00139169921972038
12- Roper, J. M., and Manela, J. ‘Psychiatric patient's
perception of waiting time in the psychiatric emergency
service.” J. Psychosoc. Nurs. Ment. Health Serv, 38, 19–
27, 2000.
13- Guegen, N., and Jacob, C. “The influence of music on
temporal perceptions in an on-hold waiting situation.”
Psychol. Music 30, 210–214, 2002. doi:
10.1177/0305735602302007
14- Yalch, R. A., and Spangenberg, E. “Effects of store
music on shopping behavior.” J. Consum. Mark. 7, 55–63,
1990. doi: 10.1108/ EUM0000000002577
15- Lopez, L., and Malhotra, R. “Estimation of time
intervals with most preferred and least preferred music.”
Psychol. Stud, 36, 203–209, 1991.
16- Kellaris, J., and Kent, R. “An exploratory investigation
of responses elicited by music varying in tempo, tonality
and texture.” J. Consum. Psychol. 2, 381–401, 1994. doi:
10.1016/S1057-7408(08)80068-X.
17- Cameron, M. A., Baker, J., Peterson, M., and
Braunsberger, K. “The effect of music, wait-length
evaluation, and mood on a low-cost wait experience.” J.
Table 1. Results of T- Test
Sig T SD M Group Music
0.18 1.43 0.12 3.01 Rose Water Long
0.17 3.05 Eucalyptus Short
0.02 3.29
4.12 Eucalyptus Long
1.50 Rose Water Short

The Influence of Odors on Time Perception
18 FBT, Vol. 8, No. Supple 1 (2021) 15-18
Bus. Res. 56, 421–430, 2003. doi: 10.1016/S0148-
2963(01)00244-2
18- Rouby C., Bensafi M. “Is there a hedonic dimension of
odors?,” in Olfaction, Taste and Cognition eds Rouby C.,
Schaal B., Dubois D., Gervais R., Holley A. (Cambridge:
Cambridge University Press; ), 140–159, 2002.
19- Millot J. L. “Effets des odeurs sur les comportements
chez l’homme,” in Ethologie Appliquée eds Boissy A.,
Baudoin C., Pham-Delegue M. (Paris: Ed. QUAE,
collection Synthèse; ) 201–208, 2009.
20- Alaoui-Ismaïli O., Vernet-Maury E., Dittmar A.,
Delhomme G., Chanel J.” Odor hedonics: connection with
emotional response estimated by autonomic
parameters.” Chem. Senses, 22 237–248, 1997.
21- Millot J. L., Brand G. “Effects of pleasant and
unpleasant ambient odors on human voice
pitch.” Neurosci. Lett. 297 1–63, 2001.
22- Bensafi M., Rouby C., Farget B., Bertrand B.,
Vigouroux M., Holley A. “Psychophysiological
correlates of affects in human olfaction.” Clin.
Neurophysiol. 32 326–332, 2002.
23- Schreuder E., Hoeksma M. R., Smeets M. A., Semin G.
R. “The effects of odor and body posture on perceived
duration.”, Front.Neurorobot, 2014.

Copyright © 2021 Tehran University of Medical Sciences. This work is licensed under a Creative Commons Attribution-NonCommercial 4.0 International license (https://creativecommons.org/licenses/by-nc/4.0/). Noncommercial uses of the work are permitted, provided the original work is properly cited.
Frontiers in Biomedical Technologies Vol. 8, No. Supple 1 (2021) 19-21
Improving the Classification of Real-World SSVEP Data in Brain-Computer
Interface Speller Systems Using Deep Convolutional Neural Networks
Elham Rostami, Farnaz Ghassemi * , Zahra Tabanfar
Department of Biomedical Engineering, Amirkabir University of Technology, Tehran, Iran
*Corresponding Authors: Farnaz Ghassemi Email: [email protected]
Abstract
Noise and artifacts in Electroencephalogram (EEG) data are one of the most important issues for target detection
in Brain Computer Interface (BCI) systems. It is critical to provide procedures that operate well in the presence
of noises. In this study, an attempt has been made to improve the classification performance of Deep Convolution
Neural Network (DCNN) by training on a subset of data and retraining on single-subject data from the BETA
SSVEP database, which is recorded outside the electromagnetic shielding room.
The results showed that after retraining, accuracy and Information Transfer Rate (ITR) increased (p-value<0.05)
for all selected participants with low performance (based on the accuracy of Canonical Correlation Analysis
(CCA) approach). The improved accuracy and ITR averages are 25.72% and 43.10 bits per minute, respectively.
Keywords: Brain Computer Interface Speller; Steady State Visual Evoked Potentials; Deep Convolutional Neural
Network; Electroencephalogram.

Improving the Classification of SSVEP
20 FBT, Vol. 8, No. Supple 1 (2021) 19-21
1. Introduction
BCI Speller systems based on Steady-State Visual
Evoked Potentials (SSVEP) are used to rehabilitate
and assist people with mobility impairments. In this
system, as the user stares at targets that flicker at a
specific frequency, an activity with the stimulation
frequency and its harmonics is evoked in his\her brain.
By identifying the stimulus frequency in the user`s
brain signal, his\her command can be determined [1].
One of the main challenges in processing EEG signals
is to reduce the destructive effect of noise and artifacts.
There are several reasons for the appearance of noise
and artifacts in EEG signals (e.g., participants'
movement, electrode displacement, poor electrode
connection, blinking, eye movement, ECG and EMG
effect). In addition, signal recording environments are
often contaminated by the effects of high-current
cables, Wi-Fi, wireless signals, and other electrical
equipments [2]. Therefore, there is a need for methods
that provide good results in the mentioned
environments.
2. Materials and Methods
In this study, the BETA database containing EEG
signals from 70 participants (42 males, age: 9 to 64
years) was used [3]. This database is collected outside
the laboratory and without any electromagnetic shield.
The BETA database contains real-world data
properties due to its out-of-laboratory recording.
There are 40 stimulus frequencies in this database, set
from 8 Hz to 15.8 Hz with a distance of 0.2 Hz. The
task is designed in 4 blocks with 40 trials
corresponding to 40 targets in each block. The
stimulation period is 2 seconds for the first to the
fifteenth participant and 3 seconds for the other
participants. To equalize trial length, the 3-second
epochs were shortened to 2 seconds. At this step, 9
low-quality participants were identified from the other
70 participants in the BETA database. Low-quality
participants were chosen based on the results of the
CCA approach, which performs poorly against noise
(participants with accuracy below 15% were selected)
[4].
PODNet is a Deep Convolution Neural Network
processing approach that was utilized to identify the
targets. Joshua et al. were the first to propose this
network [5]. Due to the length of the trials (2 seconds),
this network was created in 4 separate PODs (with a
few modifications) using the Keras library
(Tensorflow Backend). Each POD includes
Convolutional, Drop-out (50%), Batch Normalization,
Rectified Linear Unit (RELU) and MaxPooling layers.
In addition, following the last POD, there is a dense
layer that is eventually transferred to the softmax
operation. The design details of this network are
shown in Figure 1.
3. Results
The PODNet was trained on 61 participants (except
nine low-quality participants). Out of 61 participants,
43 participants were randomly selected for training, 9
participants for validation and 9 participants for
testing. The accuracy and ITR acquired from this
training are 72.29% and 90.17 bits per minute for
validation data, and 73.19% and 91.89 bits per minute
Figure 1. The details of the PODNet network structure

E. Rostami, et al.
FBT, Vol. 8, No. Supple 1 (2021) 19-21 21
for test data, respectively. This model is then used
separately in two different conditions for each of the 9
participants (with low quality). The first condition is
without model retraining (only in the test block) and
the second condition is with model retraining. In each
participant, two blocks were selected for training, one
block for validation and one block for testing. The test
block is the same between the two conditions. The
results demonstrated that after retraining the PODNet,
the accuracy and ITR on low-quality participants
improved (Wilcoxon rank sum test, p value<0.05).
The results are shown in Figure 2. According to the
findings, the network appears to be capable of
performing efficiently in real-world data by learning
the specific features of the data in its deep layers.
4. Conclusion
According to the findings, PODNet seems to learn
specific data attributes in its layers after being trained
in two training blocks. As it learns proprietary
features, the network's ability to classify stimulus
frequencies in low-quality data increases. In other
words, by retraining the network on a subset of the
data (training blocks), the noise effect for other subsets
of the same data can be reduced (validation and test
blocks).
References
1- Rezeika, A., et al., “Brain–Computer Interface Spellers:
A Review.”, Brain Sciences, 8(4), 2018.
2- Hanada, E. and T. Kudou, “Electromagnetic noise in the
clinical environment.” Peoceedings of ISMICT2009,
2009.
3- Liu, B., et al., “BETA: A Large Benchmark Database
Toward SSVEP-BCI Application.”, 2020.
4- Lin, Z., et al., “Frequency Recognition Based on
Canonical Correlation Analysis for SSVEP-Based BCIs.”
IEEE transactions on bio-medical engineering, 54: p.
1172-6, 2007.
5- Podmore, J.J., et al., “On the Relative Contribution of
Deep Convolutional Neural Networks for SSVEP-Based
Bio-Signal Decoding in BCI Speller Applications.” IEEE
Transactions on Neural Systems and Rehabilitation
Engineering, 27(4): p. 611-618, 2019.
Figure 2. Accuracy (in percentage) in low-quality
participants for both cases with and without PODNet
retraining
Copyright © 2021 Tehran University of Medical Sciences. This work is licensed under a Creative Commons Attribution-NonCommercial 4.0 International license (https://creativecommons.org/licenses/by-nc/4.0/). Noncommercial uses of the work are permitted, provided the original work is properly cite d.
Frontiers in Biomedical Technologies Vol. 8, No. Supple 1 (2021) 22-24
Machine Learning Techniques and Nonlinear Features of EEG Signal to
Predict Treatment Response to rTMS in Depression
Elias Ebrahimzadeh 1, 2 * , Mostafa Asgarinejad 3, Hamid Soltanian-Zadeh 1, 2, 4
1 School of Electrical and Computer Engineering, College of Engineering, University of Tehran, Tehran, Iran.
2 School of Cognitive Sciences, Institute for Research in Fundamental Sciences, Tehran, Iran.
3 Institute for Cognitive Sciences Studies, Tehran, Iran
4 Image Analysis Laboratory, Department of Radiology, Henry Ford Hospital, Detroit, MI, USA
*Corresponding Authors: Elias Ebrahimzadeh Email: [email protected]
Abstract
Repetitive Transcranial Magnetic Stimulation (rTMS) can effectively excite the brain neurons and increase the
brain plasticity which come particularly useful in psychiatric and neurological fields. The aim of our study was
to investigate a novel non-linear index of resting state EEG activity as a predictor of clinical outcome, and
compare its predictive capacity to traditional frequency-based indices. Electroencephalography (EEG) was
recorded from 9 patients with Treatment Resistant Depression (TRD) and 5 Healthy Control (HC) subjects. TRD
patients were treated with excitatory rTMS to the Dorsolateral Prefrontal Cortex (DLPFC) for 4 to 6 weeks. EEG
signals were first decomposed using the ICA algorithm and the extracted components were then processed by
non-linear analysis.
The results demonstrated 78%, 74% and 82% accuracy for Artificial Neural Network (ANN), K-Nearest Neighbor
(KNN) and Support Vector Machine (SVM) classifiers respectively, indicating the superiority of the proposed
method to those mentioned in similar studies. Our findings warrant further investigation of EEG-based biomarkers
in depression.
Keywords: Repetitive Transcranial Magnetic Stimulation; Brain Stimulation; Treatment Resistant Depression;
Electroencephalography; Non-Linear Analysis.

E. Ebrahimzadeh, et al.
FBT, Vol. 8, No. Supple 1 (2021) 22-24 23
1. Introduction
rTMS is a safe and effective treatment for TRD with
50–55% response and 30–35% remission rates [1], and
rTMS is considered a first-line treatment option for
TRD [2]. The prescription of rTMS, similar to
antidepressant medication prescription, is currently
based on clinical assessment and a process of trial and
error. Identification of effective biomarkers that can
inform clinical decisions is lacking, and this absence
may contribute to higher health-care costs [3].
Developing reliable biomarkers may have profound
implications for clinical practice as it would shift the
prescription process to a more precise and
personalized approach that would further improve
clinical outcomes and efficiency during treatment
initiation [4]. The purpose of this study is to examine
EEG features as predictors of treatment response in the
TRD patients receiving excitatory rTMS to the Left
Dorsolateral Prefrontal Cortex (L-DLPFC). We
hypothesized that EEG-decomposed components will
hold different energies for different patients and that
these would differentiate responders (RP) from Non-
Responders (NR). Furthermore, we hypothesized that
non-linear methods would be more efficient predictors
of rTMS treatment response compared to traditional
linear frequency-band metrics.
2. Materials and Methods
The neurophysiology dataset was part of two
randomized, single blinded trials in which patients
with TRD were assigned to receive either intermittent
Theta Burst Stimulation (iTBS) or High Frequency
Left (HFL) rTMS protocols to the left DLPFC.
Patients received a 4–6 weeks course of rTMS. A
dataset with a total of 14 participants was used in this
study, including 9 TRD patients and 5 HC. The
patients were referred to the Neuraly Clinical
Neuroscience Centre, Tehran, Iran, and depression
diagnosis for them was made by a psychiatrist based
on Diagnostic and Statistical Manual-IV (DSM-IV)
criteria. Participants were also assessed by Hamilton
Rating Scale for Depression (HRSD), and Beck
Depression Inventory (BDI II) and all had the HRSD
score ≥12 and BDI-II score≥15.
2.1. Stimulation Technique and Clinical
Measures
A MagPro X100 stimulator with a Cool- B70 fluid-
cooled coil was used to deliver rTMS for all patients
(Magventure, Farum, Denmark). Resting motor
threshold was determined by visual inspection of right
interpolicis brevis muscle contraction with the aid of
the TMS motor threshold assessment tool. All
treatments were delivered at 110% resting motor
threshold. Primary clinical outcome was measured
using HDRS. For each patient, HDRS scores were
collected at baseline and at the end of the rTMS
course. Interviewers were blinded to patient treatment
allocation. Responders were defined as those having a
50% or greater reduction in HDRS scores between
baseline and end of treatment. Out of the 9 patients
included in the analysis, there were 6 responders and
3 non-responders to rTMS treatment.
2.2. Pre-Treatment EEG
A 19-channel eWave32 amplifier was used for EEG
signal recording which followed the 10-20 convention
of electrode placement on the scalp. The amplifier,
produced by ScienceBeam
(http://www.sciencebeam.com/), provided a sampling
rate of 1K samples. The digitalized data were down-
sampled to 250 Hz and band-pass filtered with two-
way least-squares FIR filtering using: low-pass
filtering with cut-off frequency at 60 Hz and high-pass
filtering with cut-off frequency at 1 Hz.
2.3. Feature Extraction and Classification
After EEG data preparation, the next step in the
prediction of treatment response to rTMS is extracting
features. In this paper, we studied a total of 21 features
categorized into four groups including nonlinear,
spectral, bispectral, and cordance measures. These
measures are extracted from the baseline EEG of both
groups of RP and NR, and each feature (except
cordance measures) was computed for all EEG
channels. For each measure, this yields a feature set of
19 features corresponding to the 19 EEG channels. We
used three classifiers, KNN, SVM, and MLP to
differentiate between EEG of RP and NR before and
after treatment. To evaluate the performance of the

Predicting Treatment Response to rTMS in Depression
24 FBT, Vol. 8, No. Supple 1 (2021) 22-24
classifiers, a leave-one-out cross-validation method
was applied on account of the input data limitation.
3. Results
The results denote noticeable capacity of the
proposed methods in classifying the two classes using
the mentioned features and classifiers. To optimize
learning cost and prediction performance, the SVM
classifier parameters and kernel width must be chosen
with caution. The proposed methodology based on
SVM classifier presents better results than the other
existing approaches. The obtained accuracy,
sensitivity, specificity, and precision of the proposed
methods are shown in Table 1.
References
1- Galletly C, Gill S, Clarke P, Burton C, Fitzgerald PB, “A
randomized trial comparing repetitive transcranial
magnetic stimulation given 3 days/week and 5 days/week
for the treatment of major depression: is efficacy related
to the duration of treatment or the number of treatments?”,
Psychol. Med, 13:1, 2011.
2- Milev RV, Giacobbe P, Kennedy SH, Blumberger DM,
Daskalakis ZJ, Downar J, et al, “Canadian Network for
Mood and Anxiety Treatments (CANMAT) 2016 Clinical
guidelines for the management of adults with major
depressive disorder: section 4. neurostimulation
treatments.” Can J Psychiatry, 61:561, 2016.
3- Silverstein WK, Noda Y, Barr MS, Vila-Rodriguez F,
Rajji TK, Fitzgerald PB, et al, “Neurobiological
predictors of response to dorsolateral prefrontal cortex
repetitive transcranial magnetic stimulation in depression:
a systematic review.” Depression and Anxiety, 32:871,
2015.
4- Dobek CE, Dipinto AA, Kuan AJ, Lam RW, Blumberger
DM, Downar J, et al, “Sinus tachycardia induced by
methocarbamol and repetitive transcranial magnetic
stimulation (rTMS).” Brain Stimul, 9:156, 2016.
4. Conclusion
In this study, we proposed a method for prediction
of rTMS treatment outcome by applying KNN, SVM,
and MLP classifiers to several measures of
pretreatment EEG including non-linear features. The
results of the proposed classification suggest the
potential of applying this method in clinical
applications. Our results suggest that the rTMS of the
left DLPFC increased the activity in the left DLPFC
and other regions functionally connected to this region
of the brain.
Table 1. Results of the classifier performance in percentage, for leave-one-out cross
validation
Classifier Accuracy Sensitivity Specificity Precision
SVM 81.43 85.00 74.00 87.75
KNN 73.32 77.24 65.67 79.59
MLP 77.37 81.38 71.83 83.67

Copyright © 2021 Tehran University of Medical Sciences. This work is licensed under a Creative Commons Attribution -NonCommercial 4.0 International license (https://creativecommons.org/licenses/by-nc/4.0/). Noncommercial uses of the work are permitted, provided the original work is properly cited.
Frontiers in Biomedical Technologies Vol. 8, No. Supple 1 (2021) 25-29
The Effectiveness of rTMS and TBS on Cognitive Functions in Suicide
Peyman Abharian 1, Mohammad Reza Zarindast 1, Mohammad Nasehi 1, Mahdi Talebi 2, Mahjobe Rahimi 1*
1 Department of Cognitive Neuroscience, Institute for Cognitive Science Studies, Tehran, Iran
2 Department of Psychiatry, School of Medicine, Mashhad University of Medical Sciences, Mashhad, Iran
*Corresponding Authors: Mahjobe Rahimi Email: [email protected]
Abstract
Cognitive dysfunction is common in individuals with depression and these cognitive deficits may be associated
with a risk of suicide. Therefore, the identification of the cognitive functions of depressed patients and the
introduction of effective interventions on these factors are highly important. This study aimed to compare the
effectiveness of repetitive Transcranial Magnetic Stimulation (rTMS) and Theta Burst Stimulation (TBS) to
improve on selective attention, working memory and response time of depressed individuals with and without a
history of suicide.
This applied quasi-experimental was conducted based on a pretest-posttest design. The population included 40
depressed patients referring to the clinics of Mashhad, Iran, in 2020. The samples were divided into four groups,
namely individuals with a history of suicide subjected to treatment with rTMS, without a history of suicide
receiving treatment with rTMS, with a history of suicide undergoing treatment with TBS, and without a history
of suicide administered with TBS (n=10 each). Data were collected using the Stroop Color and Word Test, Corsi
block test, and reaction time tests and statistically analyzed using multivariate analysis of covariance.
The results confirmed the effectiveness of the intervention on the congruent reaction time, incongruent reaction
time, working memory, simple reaction time, and selective reaction time in all four study groups (P<0.05). The
results of multivariate analysis of covariance showed that the group had a significant effect on the variables of
congruent reaction time, simple reaction time, and selective reaction time (P<0.05); however, it had no significant
effect on the variables of incongruent reaction time and working memory (P>0.05).
Compared to the rTMS method, the TBS had a greater effect on the variables of congruent reaction time, simple
reaction time, and selective reaction time.
Keywords: Transcranial Magnetic Stimulation; Theta Burst Stimulation; Cognitive Function; Suicide.

The Effectiveness of rTMS and TBS on Cognitive Functions in Suicide
26 FBT, Vol. 8, No. Supple 1 (2021) 25-29
1. Introduction
Suicide, which is often associated with mental
disorders, is one of the major concerns of mental
health professionals [1]. One of the areas directly
related to suicide attempt is depression [2]. About two-
thirds of depressed patients think about suicide, and 10
to 15 percent of them end their lives this way.
Therefore, identifying effective treatments to reduce
depression is very important [3]. Studies that have
examined the relationship between depression and
executive functions have shown that depression is
associated with deficits in executive functions such as
attention, processing speed, and impaired working
memory [4]. About 35 to 40 percent of depressed
people do not respond to antidepressants. rTMS is
used as a relatively new technique in the treatment of
drug-resistant depression [5]. It is a safe and non-
invasive method that improves brain function by
altering glucose levels and the activity of
neurotransmitters. However, this treatment can be
associated with side effects such as headache, fatigue,
and pain / discomfort at the site of stimulation. Also,
the effects of this treatment are usually short-lived [6].
Therefore, the need for a more effective paradigm
design than rTMS seems to be essential in the
treatment of depression. TBS therapy is a new therapy
that is able to focus energy and power waves three
times normal, which creates strong and stable changes
compared to traditional rTMS and causes long-term
excitatory and inhibitory changes in It becomes the
cerebral cortex. the brain. Another advantage of TBS
over rTMS is its shorter time [7]. Considering the
increasing growth of depression and suicide attempts,
as well as the adverse psychological, social and
physical effects of this disease, identifying the factors
affecting the mental state of patients with depression
and providing remedial interventions on these factors
is of great importance. Therefore, the aim of this study
was to compare the effectiveness of repeated
transcranial magnetic stimulation and tetanus
magnetic stimulation on improving the selective
attention, working memory and response time of
depressed individuals with and without a history of
suicide.
2. Materials and Methods
The present study was a quasi-experimental applied
research (pre-test, post-test) which was performed on
18-50 year olds referring to clinics in Mashhad in
2020. Inclusion criteria were definitive diagnosis of
depressive disorder according to Beck Depression
Scale, age range between 18 and 50 years and history
of suicide attempt. History of seizures, history of head
surgery, presence of any implants in the head, neck
and upper body, having or having a heart pacemaker,
history of drug use and addiction to alcohol and
smoking or any other type of drug, pregnancy, lack of
normal vision (Colour blindness or other eye
diseases), schizophrenia, schizoaffective disorder,
schizophrenic form disorder, hallucination disorder or
psychotic symptoms were the exclusion criteria.
2.1. Research Tools
Stroop test: This test was used to measure the need
for selection and cognitive flexibility. In this test, 48
matching colour words and 48 inconsistent colour
words with red, blue, yellow and green colours were
displayed [9].
Corsi block test: This test is designed to evaluate
and measure the capacity of short-term spatial
memory and spatial working memory, which can be
measured in both age groups of children and adults
and the time required to perform it is between 10 to 15
minutes [10].
Reaction time test: In this test, reaction times with
light and sound stimuli are determined by choosing
red, yellow or white [11].
In this study, sampling was done in a targeted and
accessible way; As a result, 40 people were selected
from the volunteers. Twenty of these individuals had
a history of suicide who were randomly divided into
two experimental groups (treated with theta burst) and
(treated with rTMS). Also, 20 people without a history
of suicide were selected as the control group, who
were treated with theta burst and rTMS in two groups.
The Beck Depression Inventory was used to assess
depression. Subjects were assessed for cognitive
function before performing rTMS and TBS. In the
method of repeated transcranial magnetic stimulation,
a Magestim device was used, which creates excitations
in the desired position of the brain by creating

P. Abharian, et al.
FBT, Vol. 8, No. Supple 1 (2021) 25-29 27
magnetic fields. In this study, the frequency of
stimulation was 10 Hz, with intensity 120% Resting
Motor Threshold (RMT) This mechanism was
performed on the left Dorsolateral Prefrontal Cortex
(DLPFC) for 4 weeks and three sessions of 38 minutes
each week. In the TBS method, participants received
frequencies of 50 and 5 Hz with coils of 8 Magestim
device for 12 sessions (3 sessions per week for 4
weeks) in the LDLPFC area. The stimulation intensity
was 80% of the patient's motor threshold. The duration
of each session was 3.3 minutes One week after the
end of the intervention period, the Tower of London
tests, corsi block and reaction time were performed
and scored in two groups. Finally, the post-test and
pre-test data were compared. Prior to the study, the
conditions were fully explained to the patients and
they were assured that their information would remain
confidential.
Data were entered into SPSS software version 19
and then statistically analyzed. Descriptive data were
explained using mean and frequency. The normality of
the data was assessed using Kolmogorov-Smirnov.
Finally, the data were analysed using chi-square,
paired t-test and multivariate analysis of covariance.
The confidence level was considered less than 0.05.
3. Results
Based on the findings obtained from the frequency
of demographic variables, there was no significant
difference between the four groups in terms of any of
the demographic variables including age, education,
gender and marriage (P> 0.05). The results of
correlated t-test to evaluate the effectiveness of
intervention methods on each of the cognitive function
variables of depressed people showed that the effects
of consonant reaction time, maladaptive reaction time,
working memory, simple reaction time and selective
reaction time on depression in all four groups (P
<0.05).The results of univariate analysis of covariance
in the context of multivariate analysis of covariance to
determine the effectiveness of intervention methods
on each of the dependent variables showed that the
group had a significant effect on consistent variables.
Reaction time and simple reaction time and selective
reaction time (P <0.05), but had no significant effect
on the variables of maladaptive reaction time and
working memory (P <0.05).
The results of Bonferroni experiment to compare
the effectiveness of intervention methods on
consonant reaction time, simple reaction time and
selective reaction time showed that consonant reaction
time and simple reaction time were reduced in non-
suicidal individuals. TBS group compared to TBS
group Suicide and reduction of consonant reaction
time and simple reaction time in TBS group Suicide
compared to non-suicidal rTMS groups and rTMS
suicide group. Also, the data showed the effectiveness
of non-suicidal rTMS group in reducing consonant
reaction time and simple reaction time compared to
suicidal rTMS group (P <0.05). In reducing the
selective reaction time, the effectiveness of the non-
suicidal TBS group was lower than the suicidal TBS
and suicidal rTMS groups. Also, the effectiveness of
the non-suicidal rTMS group in reducing the selective
reaction time was less than the suicidal rTMS group (P
<0.05).
4. Discussion
According to the findings, in all groups, the
intervention reduced the fixed reaction time, simple
reaction time and selective reaction time in depressed
individuals. However, no significant effect was
observed on the variables of maladaptive reaction time
and working memory. To reduce consonant reaction
time, simple reaction time and selective reaction time,
TBS intervention was more effective than rTMS in
both groups with and without a history of suicide.
Also, TBS resulted in a greater reduction in matching
time and simple reaction time in people without a
history of suicide than in those with a history of
suicide treated with rTMS. In both TBS and rTMS,
concurrent response time, reduced simple reaction
time, and selective response time were lower in those
without a history of suicide than in those with a history
of suicide. To increase cognitive activity in depressed
patients, various therapies such as medication, electric
shock and intracranial magnetic stimulation are used.
Some findings have shown that cranial magnetic
stimulation in the cortex has the same effect as
antidepressants [12]. Our study showed that frequent
magnetic stimulation of the skull is effective in
improving the cognitive functions of depressed people
who attempt suicide and do not. The use of this
method led to a reduction in consonant reaction time,
maladaptive reaction time, simple reaction time and

The Effectiveness of rTMS and TBS on Cognitive Functions in Suicide
28 FBT, Vol. 8, No. Supple 1 (2021) 25-29
selective reaction time, and increased working
memory in depressed individuals with and without a
history of suicide. The effectiveness of rTMS on
reducing reaction time is consistent with the results of
other studies [13, 14]. Also, the effectiveness of
transcranial magnetic stimulation on reducing simple
and selective reaction time as well as working memory
has been confirmed by other similar studies [18-14].
In this regard, a study was conducted by Kazemi et al.
In Iran, the effectiveness of bilateral cranial magnetic
stimulation on cognitive function in patients with
bipolar depression showed that the results show
improved executive function and verbal memory.
While no change in selective and verbal attention was
observed [19]. In explaining this issue, we can point to
the differences of the research community. This study
focused on patients with bipolar depression, while the
present study was performed on patients with major
depression or unipolar depression. It is possible that
this method will be more effective as the number of
repetitive sessions of bipolar magnetic stimulation
increases in people with bipolar disorder, which
requires further research.
Other results of this study indicate the usefulness of
theta stimulation in improving cognitive functions of
consonant reaction time, maladaptive reaction time,
working memory, simple reaction time, and selective
reaction time of depressed individuals with and
without a history of suicide. The results of other
similar studies in the field of theta explosion
stimulation during reaction, matching, and working
memory confirm the findings of the present study [25].
In general, both theta stimulation and transcranial
magnetic stimulation are safe and non-invasive
methods that have been confirmed in various studies.
However, the theta stimulation method is shorter and
more effective in improving cognitive function than
repetitive cranial magnetic stimulation. To date, no
study has compared the effects of these two methods
on improving cognitive function. However, two
studies were conducted by Mendelitz et al. And Bolto
et al. Confirm the effectiveness of these two methods
in reducing depression [26]. Due to the lower cost and
time required in the theta stimulation method, it seems
to be more cost-effective than recurrent transcranial
magnetic stimulation.
5. Conclusion
In summary, both methods, repeated transcranial
magnetic stimulation and theta stimulation in both
depressed groups with and without suicidal history,
improved cognitive functions of consonant reaction
time, inconsistent reaction time, simple reaction time,
and selective reaction time and working memory.
Compared with the repeated transcranial magnetic
stimulation method, the theta-burst stimulation
method had a greater effect on the variables of
consonant reaction time, simple reaction time and
selective reaction time. But in terms of inconsistent
reaction time and working memory variables, no
difference was observed between the two methods.
Acknowledgement
The authors of this article thank the officials of
Mashhad clinics for their cooperation with the
researcher and the participants for their active
participation in the research
References
1- Steele IH, Thrower N, Noroian P, Saleh FM.
"Understanding suicide across the lifespan: a United
States perspective of suicide risk factors, assessment &
management." Journal of forensic sciences;63(1):162-71,
2018.
2- Reddy M. "Depression: the disorder and the burden."
SAGE Publications Sage India: New Delhi, India; 2010.
3- Conejero I, Olié E, Calati R, Ducasse D, Courtet P.
"Psychological pain, depression, and suicide: recent
evidences and future directions." Current psychiatry
reports;20(5):1-9, 2018.
4- Takeuchi H, Kawashima R. "Effects of processing speed
training on cognitive functions and neural systems."
Reviews in the Neurosciences;23(3):289-301, 2012.
5- Ishikawa S, Matsunaga K, Nakanishi R, Kawahira K,
Murayama N, Tsuji S, et al. "Effect of theta burst
stimulation over the human sensorimotor cortex on motor
and somatosensory evoked potentials." Clinical
Neurophysiology;118(5):1033-43, 2007.
6- Humaira A, Downar J, Blumberger D, Green K,
McLellan E, Ainsworth N, et al. "Repetitive transcranial
magnetic stimulation (rTMS) side effect characterization
for treatment resistant depression: Non-inferiority rTMS

P. Abharian, et al.
FBT, Vol. 8, No. Supple 1 (2021) 25-29 29
trial." Brain Stimulation: Basic, Translational, and
Clinical Research in Neuromodulation;10(2):521, 2017.
7- Morgan D. "Mindfulness-Based Cognitive Therapy for
Depression: A New Approach to Preventing Relapse."
Psychotherapy Research;13(1):123-5, 2003.
8- Malek A, Hekmati I, Amiri S, Pirzadeh J, Gholizadeh H.
"The standardization of Victoria Stroop color-word test
among Iranian bilingual adolescents." Archives of Iranian
medicine;16(7), 2013.
9- de Paula JJ, Malloy-Diniz LF, Romano-Silva MA.
"Reliability of working memory assessment in
neurocognitive disorders: a study of the Digit Span and
Corsi Block-Tapping tasks." Brazilian Journal of
Psychiatry; 38:262-3, 2016.
10- Wells AJ, Hoffman JR, Beyer KS, Jajtner AR, Gonzalez
AM, Townsend JR, et al. "Reliability of the dynavision™
d2 for assessing reaction time performance." Journal of
sports science & medicine;13(1):145, 2014.
11- Filipović SR, Rothwell JC, Bhatia K. "Low-frequency
repetitive transcranial magnetic stimulation and off-phase
motor symptoms in Parkinson's disease." Journal of the
neurological sciences;291(1-2):1-4, 2010.
12- Guan HY, Zhao JM, Wang KQ, Su XR, Pan YF, Guo
JM, et al. "High-frequency neuronavigated rTMS effect
on clinical symptoms and cognitive dysfunction: a pilot
double-blind, randomized controlled study in Veterans
with schizophrenia." Translational psychiatry;10(1):1-9,
2020.
13- Corlier J, Burnette E, Wilson AC, Lou JJ, Landeros A,
Minzenberg MJ, et al. "Effect of repetitive transcranial
magnetic stimulation (rTMS) treatment of major
depressive disorder (MDD) on cognitive control." Journal
of affective disorders;265:272-7, 2020.
14- Elkin-Frankston S, Rushmore RJ, Valero-Cabré A.
"Low frequency transcranial magnetic stimulation of right
posterior parietal cortex reduces reaction time to
perithreshold low spatial frequency visual stimuli."
Scientific reports;10(1):1-9, 2020.
15- Guo Z, Jiang Z, Jiang B, McClure MA, Mu Q. "High-
frequency repetitive transcranial magnetic stimulation
could improve impaired working memory induced by
sleep deprivation." Neural plasticity 2019;2019.
16- Preston G, Anderson E, Silva C, Goldberg T,
Wassermann EM. "Effects of 10 Hz rTMS on the neural
efficiency of working memory." Journal of cognitive
neuroscience;22(3):447-56, 2010.
17- Jiang Y, Guo Z, Xing G, He L, Peng H, Du F, et al.
"Effects of high-frequency transcranial magnetic
stimulation for cognitive deficit in schizophrenia: a meta-
analysis." Frontiers in psychiatry; 10:135, 2019.
18- Kazemi R, Ghadampoor E, Rostami R, Khomami S,
Rezae M. "The Effectiveness of Bilateral rTMS on
cognitive function in Patients with Bipolar Depression."
Journal of Cognitive Psychology;5(3), 2017.
19- Desmyter S, Duprat R, Baeken C, Van Autreve S,
Audenaert K, van Heeringen K. "Accelerated intermittent
theta burst stimulation for suicide risk in therapy-resistant
depressed patients: a randomized, sham-controlled trial."
Frontiers in human neuroscience;10:480, 2016.
20- Viejo-Sobera R, Redolar-Ripoll D, Boixadós M, Palaus
M, Valero-Cabré A, Marron EM. "Impact of prefrontal
theta burst stimulation on clinical neuropsychological
tasks." Frontiers in neuroscience; 11:462, 2017.
21- Pinto N, Duarte M, Gonçalves H, Silva R, Gama J, Pato
MV. "Bilateral theta-burst magnetic stimulation influence
on event-related brain potentials." PloS
one;13(1):e0190693, 2018.
22- Chung SW, Rogasch NC, Hoy KE, Fitzgerald PB. "The
effect of single and repeated prefrontal intermittent theta
burst stimulation on cortical reactivity and working
memory." Brain stimulation;11(3):566-74, 2018.
23- Vékony T, Németh VL, Holczer A, Kocsis K, Kincses
ZT, Vécsei L, et al. "Continuous theta-burst stimulation
over the dorsolateral prefrontal cortex inhibits
improvement on a working memory task." Scientific
reports;8(1):1-9, 2018.
24- Hill AT, McModie S, Fung W, Hoy KE, Chung S-W,
Bertram KL. "Impact of prefrontal intermittent theta-burst
stimulation on working memory and executive function in
Parkinson’s disease: a double-blind sham-controlled pilot
study." Brain research;1726:146506, 2020.
25- Mendlowitz AB, Shanbour A, Downar J, Vila-
Rodriguez F, Daskalakis ZJ, Isaranuwatchai W, et al.
"Implementation of intermittent theta burst stimulation
compared to conventional repetitive transcranial magnetic
stimulation in patients with treatment resistant depression:
a cost analysis." Plos one;14(9):e0222546, 2019.
26- Bulteau S, Sébille V, Fayet G, Thomas-Ollivier V,
Deschamps T, Bonnin-Rivalland A, et al. "Efficacy of
intermittent Theta Burst Stimulation (iTBS) and 10-Hz
high-frequency repetitive transcranial magnetic
stimulation (rTMS) in treatment-resistant unipolar
depression: study protocol for a randomised controlled
trial." Trials;18(1):1-10, 2017.
Copyright © 2021 Tehran University of Medical Sciences. This work is licensed under a Creative Commons Attribution-NonCommercial 4.0 International license (https://creativecommons.org/licenses/by-nc/4.0/). Noncommercial uses of the work are permitted, provided the original work is properly cite d.
Frontiers in Biomedical Technologies Vol. 8, No. Supple 1 (2021) 30-33
The Relationship Between Brain Wave Quantitative Patterns with the Dimensions
of Posttraumatic Growth in Persons with a History of Hospitalization Because of
COVID-19
Mahnoosh Kamranvand 1 * , Fateme Dehghani-Arani 1, Reza Rostami 1, Khosro Sadeghniat 2, Hojjatollah Farahani 3
1 Department of Psychology, University of Tehran, Tehran, Iran
2 Department of Occupational Medicine, School of Medicine, Occupational Sleep Research Center, Tehran University of Medical Sciences, Tehran, Iran
3 Department of Psychology, Tarbiat Modares University, Tehran, Iran
*Corresponding Authors: Mahnoosh Kamranvand Email: [email protected]
Abstract
The aim of the present study was to investigate the quantitative pattern of brain waves with post-traumatic growth
dimensions in patients admitted due to Coronavirus disease (COVID-19) disease. Post-traumatic growth is the
mental experience of positive psychological changes caused by the individual as a result of coping with
challenging situations. In this study, 66 individuals with COVID-19 who were admitted to Baharloo Hospital in
Tehran as a stressful event were selected by convenience sampling and completed a post-traumatic growth
inventory and their brain waves were in rest was recorded. The results showed that brain components are a good
predictor of post-traumatic growth components. According to the results, it can be said that more objective
instruments such as Electroencephalography (EEG) have good predictive power in complex psychological and
multidimensional cases such as post-traumatic growth.
Keywords: Electroencephalography; Posttraumatic Growth; Trauma; Coronavirus Disease.

M. Kamranvand, et al.
FBT, Vol. 8, No. Supple 1 (2021) 30-33 31
1. Introduction
Trauma exposure can have pathological effects
such as post-traumatic stress disorder and behavioral
problems such as suicide [1]. It is time to understand
the Coronavirus disease (COVID-19) pandemic crisis as
a new type of trauma. Although the majority of people
are not affected by disease, media coverage and possibility
of infection cause a lot of stress [2]. Some people go a
step further psychologically after experiencing a traumatic
event and report symptoms that are now known as post-
traumatic growth [3] which is the experience of positive
personal change as a result of coping with trauma, which
does not neutralize the psychological experience of the
traumatic but allows the individual to find new meaning
in life, despite the traumatic experiences of the event.
Find and achieve positive personal change in areas such
as improving self-concept, interpersonal relationships
and philosophy of life [4]. Post-traumatic growth occurs
in five areas; Identifying new competencies (finding
opportunities to do things I could not do), improving
relationships with others (understanding how people
might be useful), Increased personal strength (I can
handle big problems), value of life (I enjoy each day
more than the day before), and spiritual change (I have
increased my belief in God) [5].
Despite evidence of brain function patterns and cognitive
impairments following stress and post-traumatic stress
disorder, these dimensions of post-traumatic growth have
not yet been studied in detail. Accordingly, the present
study intends to use Electroencephalography (EEG)
instruments to assess whether individuals' brain function
is related to growth components? Answering the above
questions in conjunction with studies of the effectiveness
of neurofeedback protocols or psychotherapy and counseling
interventions, can provide good guidelines for the effectiveness
of increasing people's awareness of stress on changing
and modifying the function of their brain waves; Finally,
on the other hand, considering the shortcomings in the
tools of the special questionnaire for measuring growth
after traumatic [6] to propose the EEG as a tool in this field.
2. Materials and Methods
The present study is fundamental and in terms of
method of initial quantitative studies and a correlation
study with the aim of prediction. This study includes
people aged 25 to 75 years with a history of hospitalization
due to COVID-19 during the last 3 months as an experience
of stressful events. 66 people were selected by available
method and after completing the post-traumatic growth
inventory, EEG recording was taken at rest. This research
with the code of ethics IR.UT.PSYEDU.REC.1399.019
was approved by the ethics committee.
The Post-Traumatic Growth Inventory (PTGI) consists
of 21 Likert-scale expressions ranging from zero to
five. This inventory has 5 subscales: new ways, in relation
to others, personal strength, life value and spiritual change.
The translation and evaluation of the validity and reliability
of this tool in Iran has been examined [7].
EEG, standard 10-20, was used. The device used in the
present study was "NrSign3840" (NrSign Inc., Vancouver,
Canada) which had 19 channels, database-2 assembly
type, notch filter 45-55, 50Hz highpass filter and 0.3Hz
lowpass filter and rate Sampling was 500 Hz. For EEG
analysis, the relative power of theta, alpha and SMR
bands and asymmetry on the F3, F4, Fz, Cz and Pz were
compared. EEG data were processed using MATLAB
software. Then descriptive calculations and ridge regression
analysis were performed using R statistical software,
LISREL 10 version 8.8 and SPSS version 20.
3. Results
In this study, 29 females (46.8%) and 33 males
(53.2%) with a mean age of about 50 years, right-
handed (90.3%) and left-handed (9.7%), with a history
of disease Mental (17.7%) and without a history of
mental illness (82.3%), with a history of substance use
(22.6%) and without a history of substance use (77.4%),
without any previous history of head injury that Their
recovery from Covid-19 disease was an average of 4
weeks. Due to the data conditions such as limited sample
size and many predictor variables, ridge regression method
was used to analyze the data. Alpha-parietal components,
F3-SMR and asymmetry predicted new possibilities
component, alpha-F3 and asymmetry predicted relating to
others component, F4-SMR predicted spiritual change
component and asymmetry significantly predicted the
total post-traumatic growth score. Also, Quantitative
Electroencephalogram (QEEG) components did not
significantly predict the value of life and personal
strength component.

Predicting PTG with EEG in Covid-19 Patients
32 FBT, Vol. 8, No. Supple 1 (2021) 30-33
4. Conclusion
The increased power of beta 1 (SMR) waves under
stress is observed in patients with post-traumatic stress
disorder, especially in the forehead areas in the F3
channel [8, 9]. In this regard, in the present study,
SMR-F3 predicted the component of new possibilities
and SMR-F4 predicted the component of spiritual
change. Also, under stressful conditions, the power of
alpha waves decreases, which indicates a change in
response to stressful conditions, and the results of the
present study showed that the alpha-parietal component
for new possibilities and the alpha-F3 component for
the relating with others are predicted. Forehead asymmetry,
an EEG biomarker, has long been considered a promising
indicator of psychological resilience. Post-traumatic
growth represents an element of psychological well-
being [10]. In the present study, it was also observed
that the relative asymmetry of the brain predicts well
the components of the new possibilities, relating with
others, and the overall post-traumatic growth score.
This may enhance the mental recognition of the positive
changes experienced in the aftermath of traumatic
events such as severe COVID-19 disease. The results
of this study confirm the hypothesis that post-traumatic
growth may reflect a process of active struggle to achieve
new goals and perspectives. In contrast, the dimension
of life values and personal strength components were
not predicted by brain components; these two components
were slightly more abstract than the others and may
lead to more or less neural network activity, which is
more detectable in functional Magnetic Resonance
Imaging (fMRI) and may Is to control a higher cognitive
structure than growth after trauma or to deliver it to a
higher power. EEG is limited to recording activity in
areas involved in emotion regulation and Post-Traumatic
Stress Disorder (PTSD), such as the amygdala,
hippocampus, and frontal cortex. Studies using better
spatial resolution neural imaging techniques are needed to
better understand the brain structures involved in
Posttraumatic Growth (PTG). This was the first study to
measure brain function in relation to post-traumatic
growth in Iran and patients with COVID-19. Relative
activation of the left frontal cortex with higher growth
rates after trauma was shown to occur in a sample of
COVID-19 recoveries. We hypothesize that the left
hemisphere's self-regulatory system, which mediates
the approach and positive effect, facilitates growth. The
results showed that alpha EEG asymmetry may be
useful in differentiating different dimensions of post-
traumatic growth. This study has some limitations,
including the fact that according to studies of the effect
of COVID-19 disease on the nervous system,
especially the brain in a percentage of people, it was
useful to use structural tests of the brain, including
Computed Tomography (CT) scan along with this
functional EEG test to evaluate brain effects of this
disease was used.
Acknowledgement
The researcher would like to express her gratitude
to Tehran University of Medical Sciences, Baharloo
Health Center, the participants and all those who
helped in conducting this research.
References
1- Felten-Biermann C. “Gender and natural disaster:
sexualized violence and the tsunami.” Development;
49(3):82-6, 2006.
2- Correia AO, Feitosa PW, de Sousa Moreira JL, Nogueira
SÁ, Fonseca RB, Nobre ME. “Neurological
manifestations of COVID-19 and other coronaviruses: a
systematic review.” Neurology, Psychiatry and Brain
Research, 2020.
3- Nolen-Hoeksema S, Davis CG. Theoretical and
methodological issues in the assessment and
interpretation of posttraumatic growth. Psychological
Inquiry;15(1):60-4, 2004.
4- Tedeschi RG, Calhoun LG. " Posttraumatic growth:
Conceptual foundations and empirical evidence".
Psychological inquiry;15(1):1-8, 2004.
5- Calhoun LG, Tedeschi RG. “Trauma and transformation:
Growing in the aftermath of suffering.”
6- Smith SG, Cook SL. “Are reports of posttraumatic
growth positively biased?” Journal of Traumatic Stress:
Official Publication of The International Society for
Traumatic Stress Studies;17(4):353-8, 2004.
7- Rahimi R, Heidarzadeh M, Hassanzadeh R. “Post-
traumatic growth among patients with myocardial
infarction.” Iranian Journal of Cardiovascular Nursing;
4(2):44-52, 2015.
8- Kropotov JD. “Functional neuromarkers for psychiatry:
Applications for diagnosis and treatment.” Academic
Press; 2016.

M. Kamranvand, et al.
FBT, Vol. 8, No. Supple 1 (2021) 30-33 33
9- Jokić-Begić N, Begić D. “Quantitative electroencephalogram
(qEEG) in combat veterans with post-traumatic stress disorder
(PTSD).” Nordic Journal of Psychiatry; 57(5):351-5, 2003.
10- Joseph S, Linley PA. “Positive adjustment to
threatening events: An organismic valuing theory of
growth through adversity.” Review of general psychology,
9(3):262-80, 2005.

Copyright © 2021 Tehran University of Medical Sciences. This work is licensed under a Creative Commons Attribution-NonCommercial 4.0 International license (https://creativecommons.org/licenses/by-nc/4.0/). Noncommercial uses of the work are permitted, provided the original work is properly cited.
Frontiers in Biomedical Technologies Vol. 8, No. Supple 1 (2021) 34-37
Functional Connectivity Analysis in EEG Source Space during Deception
Somayeh Mashatan * , Farnaz Ghassemi
Department of Biomedical Engineering, Amirkabir University of Technology, Tehran, Iran
*Corresponding Authors: Somayeh Mashatan Email: [email protected]
Abstract
Deception is described as a conscious, intentional attempt to mislead others. In this research, to investigate the
cognitive processes associated with deception, Electroencephalography (EEG) data was collected from 17
participants during a deception task in which they had to classify the target stimuli deceptively while responding
truthfully to other stimuli (non-targets). In order to survey functional connectivity in source space, EEG source
localization and EEG connectivity analysis were employed. The results revealed that deception was associated
with significantly greater connectivity between distant regions including frontal- occipital and frontal- parietal
connectivity. In addition, Anterior Cingulate Cortex (ACC) demonstrated greater significant connectivity with
regions of the frontal and occipital lobes. Besides, deception was accompanied by high number of strong
connectivity between the left parietal and frontal lobes.
Keywords: Deception; Electroencephalography; Source Localization; Low Resolution Brain Electromagnetic
Tomography; Functional Connectivity.
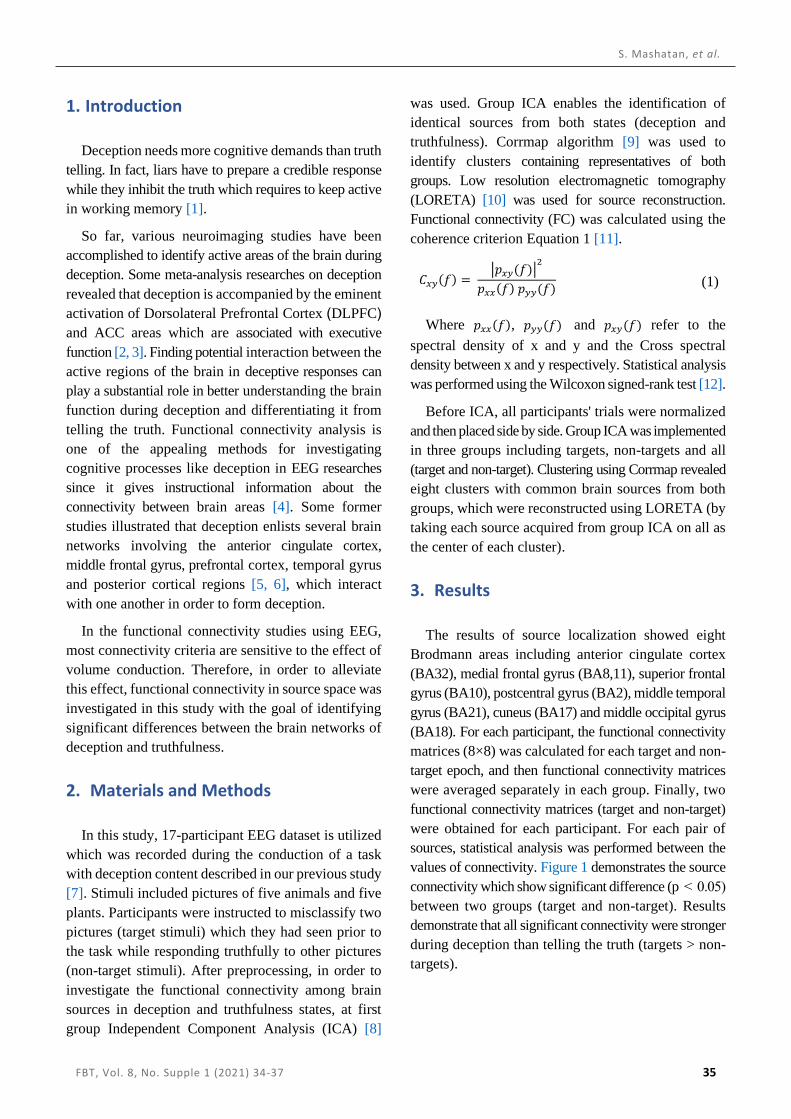
S. Mashatan, et al.
FBT, Vol. 8, No. Supple 1 (2021) 34-37 35
1. Introduction
Deception needs more cognitive demands than truth
telling. In fact, liars have to prepare a credible response
while they inhibit the truth which requires to keep active
in working memory [1].
So far, various neuroimaging studies have been
accomplished to identify active areas of the brain during
deception. Some meta-analysis researches on deception
revealed that deception is accompanied by the eminent
activation of Dorsolateral Prefrontal Cortex )DLPFC (
and ACC areas which are associated with executive
function [2, 3]. Finding potential interaction between the
active regions of the brain in deceptive responses can
play a substantial role in better understanding the brain
function during deception and differentiating it from
telling the truth. Functional connectivity analysis is
one of the appealing methods for investigating
cognitive processes like deception in EEG researches
since it gives instructional information about the
connectivity between brain areas [4]. Some former
studies illustrated that deception enlists several brain
networks involving the anterior cingulate cortex,
middle frontal gyrus, prefrontal cortex, temporal gyrus
and posterior cortical regions [5, 6], which interact
with one another in order to form deception.
In the functional connectivity studies using EEG,
most connectivity criteria are sensitive to the effect of
volume conduction. Therefore, in order to alleviate
this effect, functional connectivity in source space was
investigated in this study with the goal of identifying
significant differences between the brain networks of
deception and truthfulness.
2. Materials and Methods
In this study, 17-participant EEG dataset is utilized
which was recorded during the conduction of a task
with deception content described in our previous study
[7]. Stimuli included pictures of five animals and five
plants. Participants were instructed to misclassify two
pictures (target stimuli) which they had seen prior to
the task while responding truthfully to other pictures
(non-target stimuli). After preprocessing, in order to
investigate the functional connectivity among brain
sources in deception and truthfulness states, at first
group Independent Component Analysis (ICA) [8]
was used. Group ICA enables the identification of
identical sources from both states (deception and
truthfulness). Corrmap algorithm [9] was used to
identify clusters containing representatives of both
groups. Low resolution electromagnetic tomography
(LORETA) [10] was used for source reconstruction.
Functional connectivity (FC) was calculated using the
coherence criterion Equation 1 [11].
𝐶𝑥𝑦(𝑓) = |𝑝𝑥𝑦(𝑓)|
2
𝑝𝑥𝑥(𝑓) 𝑝𝑦𝑦(𝑓) (1)
Where 𝑝𝑥𝑥(𝑓), 𝑝𝑦𝑦(𝑓) and 𝑝𝑥𝑦(𝑓) refer to the
spectral density of x and y and the Cross spectral
density between x and y respectively. Statistical analysis
was performed using the Wilcoxon signed-rank test [12].
Before ICA, all participants' trials were normalized
and then placed side by side. Group ICA was implemented
in three groups including targets, non-targets and all
(target and non-target). Clustering using Corrmap revealed
eight clusters with common brain sources from both
groups, which were reconstructed using LORETA (by
taking each source acquired from group ICA on all as
the center of each cluster).
3. Results
The results of source localization showed eight
Brodmann areas including anterior cingulate cortex
(BA32), medial frontal gyrus (BA8,11), superior frontal
gyrus (BA10), postcentral gyrus (BA2), middle temporal
gyrus (BA21), cuneus (BA17) and middle occipital gyrus
(BA18). For each participant, the functional connectivity
matrices (8×8) was calculated for each target and non-
target epoch, and then functional connectivity matrices
were averaged separately in each group. Finally, two
functional connectivity matrices (target and non-target)
were obtained for each participant. For each pair of
sources, statistical analysis was performed between the
values of connectivity. Figure 1 demonstrates the source
connectivity which show significant difference (p < 0.05)
between two groups (target and non-target). Results
demonstrate that all significant connectivity were stronger
during deception than telling the truth (targets > non-
targets).
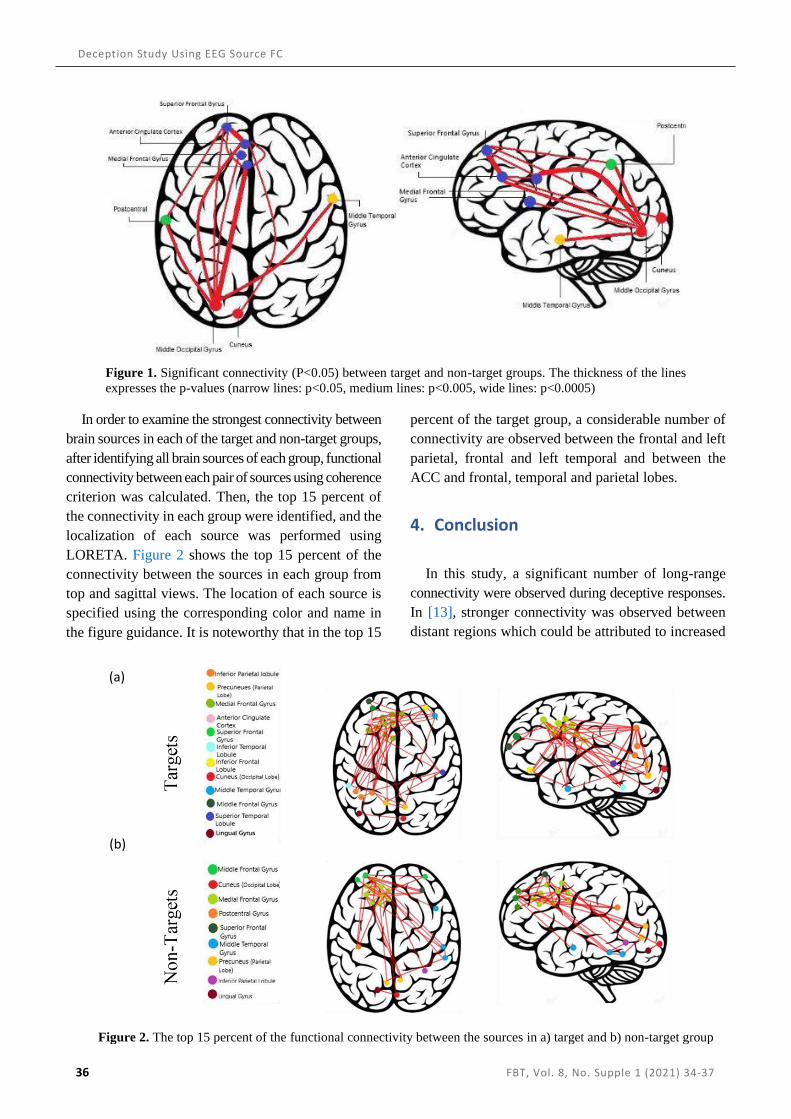
Deception Study Using EEG Source FC
36 FBT, Vol. 8, No. Supple 1 (2021) 34-37
In order to examine the strongest connectivity between
brain sources in each of the target and non-target groups,
after identifying all brain sources of each group, functional
connectivity between each pair of sources using coherence
criterion was calculated. Then, the top 15 percent of
the connectivity in each group were identified, and the
localization of each source was performed using
LORETA. Figure 2 shows the top 15 percent of the
connectivity between the sources in each group from
top and sagittal views. The location of each source is
specified using the corresponding color and name in
the figure guidance. It is noteworthy that in the top 15
percent of the target group, a considerable number of
connectivity are observed between the frontal and left
parietal, frontal and left temporal and between the
ACC and frontal, temporal and parietal lobes.
4. Conclusion
In this study, a significant number of long-range
connectivity were observed during deceptive responses.
In [13], stronger connectivity was observed between
distant regions which could be attributed to increased
Figure 1. Significant connectivity (P<0.05) between target and non-target groups. The thickness of the lines
expresses the p-values (narrow lines: p<0.05, medium lines: p<0.005, wide lines: p<0.0005)
Figure 2. The top 15 percent of the functional connectivity between the sources in a) target and b) non-target group
(a)
(b)

S. Mashatan, et al.
FBT, Vol. 8, No. Supple 1 (2021) 34-37 37
cognition. Strong connectivity were also observed
between ACC and areas of the frontal and occipital
lobes, which is in line with [13] indicating that greater
connectivity between ACC and occipital lobe could be
related to the functions that are most important in
performing deception. The results of the strongest
connectivity between brain sources in target group
showed that deception is associated with high number
of strong connectivity between the left parietal and the
frontal lobe, which corresponds to [14] demonstrating
that left parietal has a key role in the scheming of
skillful behaviors.
Acknowledgement
We would like to sincerely appreciate National
Brain Mapping Laboratory of Iran for providing us
with its standard EEG recording system
References
1- K. Suchotzki, G. Crombez, F. T. Y. Smulders, E. Meijer,
and B. Verschuere, “The cognitive mechanisms
underlying deception: An event-related potential study,”
Int. J. Psychophysiol., vol. 95, no. 3, pp. 395–405, 2015,
doi: 10.1016/j.ijpsycho.2015.01.010.
2- J. Yu, Q. Tao, R. Zhang, C. C. H. Chan, and T. M. C.
Lee, “Can fMRI discriminate between deception and false
memory? A meta-analytic comparison between deception
and false memory studies,” Neurosci. Biobehav. Rev., vol.
104, pp. 43–55, 2019.
3- F. Mameli et al., “The guilty brain: The utility of
neuroimaging and neurostimulation studies in forensic
field,” Rev. Neurosci., vol. 28, no. 2, pp. 161–172, 2017,
doi: 10.1515/revneuro-2016-0048.
4- S. P. Pantazatos, A. Talati, P. Pavlidis, and J. Hirsch,
“Cortical functional connectivity decodes subconscious,
task-irrelevant threat-related emotion processing,”
Neuroimage, vol. 61, no. 4, pp. 1355–1363, 2012, doi:
10.1016/j.neuroimage.2012.03.051.
5- N. Lisofsky, P. Kazzer, H. R. Heekeren, and K. Prehn,
“Investigating socio-cognitive processes in deception: A
quantitative meta-analysis of neuroimaging studies,”
Neuropsychologia, vol. 61, no. 1, pp. 113–122, 2014, doi:
10.1016/j.neuropsychologia.2014.06.001.
6- L. Yin and B. Weber, “I lie, why don’t you: Neural
mechanisms of individual differences in self-serving
lying,” Hum. Brain Mapp., vol. 40, no. 4, pp. 1101–1113,
2019, doi: 10.1002/hbm.24432.
7- S. Mashatan and F. Ghassemi, “ERP Components During
Instructed Deception: A Case Study.” 6th Iranian Human
Brain Mapping Congress 2019, 2019.
8- P. Comon, “Independent Component Analysis, a new
concept? SIGNAL PROCESSING Independent
component analysis, A new concept?*,” 1994, doi:
10.1016/0165-1684(94)90029-9ï.
9- “www.debener.de/corrmap/corrmapplugin1.html.”.
10- “www.uzh.ch/keyinst/NewLORETA/Software/Software.
htm.”.
11- R. Mohanty, W. A. Sethares, V. A. Nair, and V.
Prabhakaran, “Rethinking Measures of Functional
Connectivity via Feature Extraction,” Sci. Rep., vol. 10,
no. 1, p. 10, 2020, doi: 10.1038/s41598-020-57915-w.
12- S. Mashatan and F. Ghassemi, “Brain Functional
Connectivity in SSVEP BasedBCI Speller,” in 2019 26th
National and 4th International Iranian Conference on
Biomedical Engineering, ICBME 2019, pp. 100–105,
2019, doi: 10.1109/ICBME49163.2019.9030400.
13- W. Jiang et al., “Decoding the processing of lying using
functional connectivity MRI,” Behav. Brain Funct., vol.
11, no. 1, pp. 1–11, Jan. 2015.
14- S. H. Johnson-Frey, R. Newman-Norlund, and S. T.
Grafton, “A distributed left hemisphere network active
during planning of everyday tool use skills,” Cereb.
Cortex, vol. 15, no. 6, pp. 681–695, 2005, doi:
10.1093/cercor/bhh169.
Copyright © 2021 Tehran University of Medical Sciences. This work is licensed under a Creative Commons Attribution-NonCommercial 4.0 International license (https://creativecommons.org/licenses/by-nc/4.0/). Noncommercial uses of the work are permitted, provided the original work is properly cited.
Frontiers in Biomedical Technologies Vol. 8, No. Supple 1 (2021) 38-40
Diagnosis of Major Depression Disorder Using 3D Convolutional Neural
Networks
Milad Mashhady Alipoury 1 * , Hosna Tavakoli 2, Saeed Masoudnia 3, Ali Ameri 3, Mohammad Reza Nazem Zadeh 3
1 Department of Biomedical Engineering and Medical Physics, School of Medicine, Shahid Beheshti University of Medical Sciences, Tehran, Iran
2 Institute for Cognitive Science Studies, Tehran, Iran
3 Research Center for Molecular and Cellular Imaging, Tehran University of Medical Sciences, Tehran, Iran
*Corresponding Authors: Milad Mashhady Alipoury Email: [email protected]
Abstract
Major Depressive Disorder (MDD) is a significant cause of morbidity and unproductivity worldwide. Due to
heterogeneity of MDD characteristics, diagnosis based on clinical questionnaires would not be adequate. Previous
Magnetic Resonance Imaging (MRI) studies have reported that MDD would be accompanied with changes in
cortical and subcortical Gray Matter (GM) structures including the hippocampus, amygdala, anterior cingulate
cortex, caudate nucleus, and dorsolateral prefrontal cortex. Hand-crafted Morphological attributes can be
identified by Voxel-Based Morphometry (VBM) method. Convolutional Neural Network (CNN) can facilitate
the identification of morphological changes in structural MRI for clinical practice. We propose a combination of
classic feature extraction and three-Dimensional (3D) CNN model that can extract deep-learned features
automatically from cortical hand-crafted VBM attributes. This combination is done by giving the VBM gray
matter features as input to model which is able to extract heterogeneous changes. By overcoming the underlining
heterogeneity and effectively detecting the abnormalities of GM, accuracy of 86% and specificity of 83% and
sensitivity of 89% was achieved for the evaluating of classification between the MDD vs the Healthy Control
(HC) using REST-meta-MDD Data Sharing Consortium. Our algorithms have the potential to provide an
unbiased, and non-invasive assessment of MDD that may allow more efficient treatments.
Keywords: Psychoradiology; Computer Assisted Diagnosis; Gray Matter Volume; Convolutional Neural
Networks; Magnetic Resonance Imaging; Major Depression.

M. Mashhady Alipoury, et al.
FBT, Vol. 8, No. Supple 1 (2021) 38-40 39
1. Introduction
MDD is a serious mental disability with high
prevalence, recurrence rates, and chronic condition.
Thus, efficient diagnosis is critical. Advances in
neuroimaging especially MRI have provided progress
for characterizing measurable indicators of the brain
processes associated with MDD. Fusion of structural
MRI and VBM methods have been growingly used to
determine neurobiological mechanisms underlying
MDD. VBM is a method that enables a voxel-wise
estimation of the amount of a specific volume. Most
commonly, VBM is used at studying gray matter. A
recent analysis of gray matter structural networks
discovered existence of global abnormalities that are
related with diagnosis of depression. While it is
obvious that volumetric GM regional loss appears in
MDD, the precise pattern of this loss has not been
clearly defined. Existing studies in patients with MDD
have manifested loss of GM volume in cortical brain
regions, including the medial prefrontal regions of the
anterior cingulate cortex and Orbitofrontal Cortex
(OFC), the lateral prefrontal cortex, the temporal
cortex [1-3], and the pre- and post-central gyri [4-6].
A noticeable point is that these structural biomarkers
of pathobiology may be practical as a complementary
method of diagnosis in suspected MDD patients. The
proposed algorithm in this paper is a novel CAD
system based on the recent trend in 3D CNNs [7] to
keep the continuity of slices and their joint relations.
We proposed an adapted architecture of a 3D CNN for
classification of 3D volumes of gray matter of MDD
vs HC and combine VBM as classic feature extractor
and convolutional layers as automatic feature
extractor and provide a fusion of the obtained features
as the input to a classifier for diagnosis of subjects.
The proposed model was verified on the data from the
REST-meta-MDD Data Sharing Consortium for
discrimination between MDD and HC. Data was
launched in 2019 as a public partnership, led by YAN
Chao-Gan in rsfmri.org [8].
2. Materials and Methods
The DICOM images were first converted to 3D
NIFTI format by using MRIcron(www.mricro.com),
and were preprocessed using VBM8 toolbox
(dbm.neuro.uni-jena.de/vbm) in
SPM8(www.fil.ion.ucl.ac.uk/spm).The images were
then transferred to Montreal Neurological Institute
(MNI) stereotactic space. Subsequently, the
normalized images were segmented into GM, White
Matter (WM), and Cerebrospinal Fluid (CSF). Then, a
nonlinear deformation was applied to the segmented
GM images. Finally, the GM images were smoothed
with a Gaussian kernel and prepared using resizing
procedures with Nibable(nipy.org/nibabel/). We
proposed a novel CAD system that uses a 3D CNN
that is fed by hand crafted features for detecting
biomarkers of MDD structural MRI features.
Extracted 3D GM volumes of each subject were used
as the inputs to the CAD system which classifies the
subject as healthy or MDD. To avoid data leakage in
training, the data was split into three non-overlapping
parts including training, test, and validation data. In
this work,900 subjects are selected from the data and
we allocate the 600 subjects to train set and 200
subjects for validation set and 100 for test set. Also
both of the healthy and MDD subjects are equal and
dataset is balanced. The architecture of the proposed
model is shown in Figure 1 [9].
The simulation as performed on the keras (keras.io).
Figure 1. Architecture of the proposed model. At the 3D CNN structure, we use 4 blocks of convolutional layer with
different filter size and a average pooling block. Gray matter attributes are given to 3d CNN and finally a fully connected
classifies the automatically extracted feature maps. Due to two states of the dataset a nonlinearity block of sigmoid is used

3dCNN Based Diagnosis of MDD in MRI Data
40 FBT, Vol. 8, No. Supple 1 (2021) 38-40
3. Results
The classifier achieved a classification accuracy of
86% with a specificity of 83% and sensitivity of 89%
in classifying MDD versus HC. The features that
contributed to the classification were gray matter
volume and deep-learned results of convolution
layers. Figure 2 illustrates the confusion matrix for the
classification. The achieved classification accuracy is
above the reported accuracy rates by literature
focusing on MRI based diagnosis of MDD [10]. Also,
code is available in
https://github.com/miladalipour99.
4. Conclusion
Using a 3D CNN applied on 3D gray matter
volumes and fusing different features, we achieved an
accuracy of 86%. The promising results indicates that
3D CNN - based classification can be used for real-
world CAD systems in large cohort screening.
Acknowledgement
This work was supported by Iran’s National Elites
Foundation and Ahmadi Roshan project.
References
1- Grieve, S. M., et al. "Widespread reductions in gray
matter volume in depression." NeuroImage: Clinical 3:
332-339, 2013.
2- Organization, W. H. “Depression and other common
mental disorders: global health estimates. “, World Health
Organization, 2017.
3- Ballmaier, M., et al. "Comparing gray matter loss profiles
between dementia with Lewy bodies and Alzheimer's
disease using cortical pattern matching: diagnosis and
gender effects." Neuroimage, 23(1): 325-335, 2004.
4- Taki, Y., et al. "Male elderly subthreshold depression
patients have smaller volume of medial part of prefrontal
cortex and precentral gyrus compared with age-matched
normal subjects: A voxel-based morphometry." Journal of
Affective Disorders, 88(3): 313-320, 2005.
5- Kim, M. J., et al. "Reduced caudate gray matter volume
in women with major depressive disorder." Psychiatry
Research: Neuroimaging, 164(2): 114-122, 2008.
6- Huang, Y., et al. "Diagnosis of Alzheimer’s Disease via
Multi-Modality 3D Convolutional Neural Network."
Frontiers in Neuroscience, 13(509), 2019.
7- Zunair, H., et al. “Uniformizing Techniques to Process
CT scans with 3D CNNs for Tuberculosis Prediction.”
International Workshop on Predictive Intelligence in
Medicine, Springer, 2020.
8- Yan, C.-G., et al. "Reduced default mode network
functional connectivity in patients with recurrent major
depressive disorder." Proceedings of the National Academy
of Sciences, 116(18): 9078-9083, 2019.
9- Hellewell, S. C., et al. "Profound and reproducible
patterns of reduced regional gray matter characterize major
depressive disorder." Translational psychiatry, 9(1): 1-8,
2019.
10- Ramasubbu, R., et al. "Automatic classification of
major depression disorder using arterial spin labeling MRI
perfusion measurements." Psychiatry and clinical
neurosciences, 73(8): 486-493, 2019.
Figure 2. confusion matrix of classification

Copyright © 2021 Tehran University of Medical Sciences. This work is licensed under a Creative Commons Attribution-NonCommercial 4.0 International license (https://creativecommons.org/licenses/by-nc/4.0/). Noncommercial uses of the work are permitted, provided the original work is properly cited.
Frontiers in Biomedical Technologies Vol. 8, No. Supple 1 (2021) 41-45
A Meta Analysis of the Effects of Repetitive Transcranial Magnetic Stimulation on
Aphasia Rehabilitation in Stroke Patients
Mehrnaz Gholami 1, 2, 3, 4, 5 , Nooshin Pourbaghi 1, 6, Samaneh Taghvatalab 1
1 Institute for Cognitive Science Studies, Tehran, Iran
2 Neural Simulation Language Brain, Cognition and Behavior Unit, Department of Neuroscience, School of Advanced Medical Sciences and Technologies, Shiraz University of Medical Sciences, Shiraz, Iran
3 Department of Cognitive Science (Brain, Mind and Education), College of Education and Psychology, Shahid Chamran University of Ahvaz, Ahvaz, Iran
4 The Iranian Neuroscience Society, Tehran, Iran
5 School of Management and Medical Information Sciences, Shiraz University of Medical Sciences, Shiraz, Iran
6 Board Member, Head of Scientific and Research Committee, Iranian Medical Device Society, Tehran, Iran
*Corresponding Authors: Mehrnaz Gholami Email: [email protected]
Abstract
Aphasia is a complex language and communication disorder that can occur after a stroke as a result of damage to
the language centres of the brain. Evidence suggests repetitive Transcranial Magnetic Stimulation (rTMS) can
significantly improve language outcomes in patients with aphasia. In this study, we conducted a systematic review
and meta-analyses of rTMS treatment studies in patients with aphasia. Eight electronic databases (PubMed,
Medline, Embase, Scopus, ScienceDirect, Cochrane Central Register of Controlled Trials, Journals@Ovid, and
clinicaltrials.gov) were searched for articles. Relevant studies were further evaluated and studies met inclusion
criteria were reviewed. We included studies if were: randomized controlled blinded clinical trials, meta-analyses
or crossover designs of rTMS alone or with speech therapy or any other therapy tested with rTMS. Standard mean
difference for changes in picture naming accuracy was estimated. Literature search yielded 423 studies. Fifty
articles were further evaluated to be included. Eleven met all inclusion criteria and were chosen for review. Eleven
eligible studies involving 242 stroke patients were identified in this meta-analysis. Further analyses demonstrated
prominent effects for the naming subtest (SMD = 1.26, 95% CI = 0.80 to 1.71, P=0.01), with heterogeneity (I2 =
69.101%). The meta-analysis continued to show that there was a statistically significant effect of rTMS compared
with sham rTMS on the severity of aphasia. None of the patients from the 11 included articles reported adverse
effects from rTMS.
There are some strong studies evaluating the efficacy of rTMS in stroke patients but further research is required
to fully establish the usefulness of this treatment. This meta-analysis indicates a clinically positive effect of rTMS
with or without speech and language therapy for patients with aphasia following stroke in overall language
function. Moreover, the treatment of low-frequency (1 Hz) rTMS for patients with aphasia after stroke was safe.
Keywords: repetitive Transcranial Magnetic Stimulation; Neurorehabilitation; Stroke; Aphasia; Language
Recovery.

Evaluation of rTMS in Poststroke Aphasia
42 FBT, Vol. 8, No. Supple 1 (2021) 41-45
1. Introduction
In recent years, advances in cognitive neuroscience,
neurorehabilitation research, and neuroimaging have
led to dramatic advances in our understanding of how
the brain reorganizes in the setting of stroke and other
forms of focal brain injury. These discoveries have, in
turn, paved the way for the use of noninvasive
neuromodulation technologies, such as Transcranial
Magnetic Stimulation (TMS), which can potentially
be employed to create focal, persistent neuroplastic
changes in brain activity. Stroke-related aphasia is one
of the most common consequences of cerebrovascular
diseases and occurs in one-third of acute or subacute
stroke patients [1]. Aphasia can incapacitate all modes
of human communication, including language
production, language comprehension, reading, and
writing. Aphasia is a frequent sequel of stroke with
serious effects on the patient’s autonomy and quality
of life and requires speech and language therapy by
which significant improvements of language and
communication deficits can be achieved if
administered intensively and for prolonged periods
[2,3].
Studies in patients with aphasia involving TMS
have reported improvement in a variety of language
functions, ranging from better accuracy in picture
naming [4-8] to self-perceived improvement among
patients in the ability to communicate after TMS
[9,10]. This article presents an overview of repetitive
transcranial magnetic stimulation (rTMS) where this
new technology is explained in relationship to
treatment of aphasia. The present systematic review
and meta-analysis study aimed to investigate the
efficacy of rTMS on aphasia rehabilitation in aphasic
patients with stroke.
2. Materials and Methods
One reviewer (MGH) carried out independent
literature searches to identify potential treatment
studies of rTMS in post-stroke aphasia. The following
databases were used to conduct electronic searches to
identify relevant studies: PubMed, Medline, Embase,
Scopus, ScienceDirect, Cochrane Central Register of
Controlled Trials, Journals@Ovid, and
clinicaltrials.gov. The search terms were “aphasia OR
language disorders OR anomia OR linguistic disorders
AND stroke AND transcranial magnetic stimulation”.
The searches were limited to human studies written in
English and published between January 1960 and
January 2020.
We included all studies that carried out treatment
using rTMS in stroke patients with aphasia, regardless
of the trial (or experimental) design of the study.
Studies that implemented between-subject or
Randomized Controlled (RCT) design, cross-over
trials, and within-subject or pre-post trials were all
included. Since picture naming is one of the most
frequently used batteries for assessing improvement in
language abilities after treatment with rTMS [11], we
included studies that reported raw scores or changes in
picture naming accuracy. Picture naming accuracy
reflects the number of correctly articulated names of
objects, displayed to patients as line drawings [12]. In
cross-over trials, the same subjects undergo both the
sham and the real treatment and changes in accuracy
relative to baseline are compared between conditions.
In incomplete crossover studies, a subset of subjects
receives only real stimulation, while a subset receives
sham stimulation first followed with real stimulation.
The comparison is within-subject in the former subset
(i.e., assessing post-stimulation performance relative
to subject’s baseline performance). The comparison in
the latter subset is also within-subject but it is relative
to subject’s performance after the sham stimulation.
Comprehensive MetaAnalysis (CMA) Software
version 3 (Biostat Inc., USA) was used to conduct this
meta-analysis.
3. Results
3.1. Characteristics of the Included Studies
We identified 423 unique records from the database
searches. After screening the titles and abstracts, we
excluded records and obtained the full texts of the
remaining 29 articles. After further assessment, 11
studies [4,8,13-21] fulfilled the inclusion criteria
(Figure 1). Some studies have been completed but
have not been published, and some of them are
ongoing, but we have been unable to obtain
unpublished data. Eleven studies involving a total of
301 participants were included. All studies
investigated the effect of rTMS versus sham rTMS.
Six trials explored the effect of rTMS combined with

M. Gholami, et al.
FBT, Vol. 8, No. Supple 1 (2021) 41-45 43
speech and language therapy. A total of 301
participants were randomized across eleven
randomized comparisons that contrasted real rTMS
with sham rTMS. The mean patient age reported in the
eleven trials was 63.13 years. All participants suffered
from ischemic infarct within the left or right middle
cerebral artery territory. Some of patients were right-
handed and some of them were left-handed.
Using the 6-point Aphasia Severity Rating Scale
(ASRS), the severity of aphasia was reported by 3
trials. The therapeutic procedures used in five trials
consisted of rTMS sessions and specific language
training. In these trials, immediately after finishing the
rTMS treatment, both the experimental and control
participants underwent speech and language therapy
sessions for 45 minutes. The patients of the other study
were only treated with real rTMS or sham rTMS
sessions. In all trials, rTMS was performed with a
Magstim Rapid stimulator (Magstim Company,
Whitland, UK) equipped with an air-cooled figure-of-
eight coil (each loop measured 70 mm in diameter).
All trials used 1 Hz rTMS with an intensity equaling
90% of the daily defined individual resting motor
threshold.
The treatment and sham stimulation sessions of
eleven trials were conducted 20 min per day, for 10
days a 2-week period, whereas those of two trials were
performed for a 3-week period. All included trials
targeted the triangular part of the right Inferior Frontal
Gyrus (IFG). The sham stimulation condition of three
studies was performed with an air-cooled sham coil
that looks and sounds similar to the discharge of real
TMS coil. The sham coil was placed at the same site
on the scalp and with the same stimulation parameters
used for the real rTMS procedure. The other eight
studies used the same coil used the real rTMS placed
over the vertex. All trials measured language
Trials indicated the length of time elapsed since the
participants had experienced the onset of their aphasia;
the widest time range post-onset was 24 to 72 months
[22]. The shortest mean length of time since the onset
of the participants’ aphasia was 28 days.
outcomes. In those cases in which the data for this
comparison were available, they are presented below
in relation to the expressive language.
3.2. Primary Outcomes Severity of Aphasia
Impairment
All trials compared the active rTMS group with a
group that received sham rTMS by measuring the
severity of each participant’s aphasia impairment. The
language assessment batteries included the Aachen
Aphasia Test (AAT) global scores and the Boston
Diagnostic Aphasia Examination (BDAE). We
obtained statistical summary data suitable for
inclusion within a metaanalysis from these eleven
trials.
The Standardized Mean Difference (SMD) measure
of effect is used when studies report efficacy in terms
of a continuous measurement, such as a score on a
pain-intensity rating scale. The SMD is also known as
Cohen’s d. The SMD is sometimes used
interchangeably with the term “effect size.” Generally,
the comparator is a placebo, but a similar calculation
can be used if the comparator is an alternative active
treatment.
Pooling the available data using SMDs, we
observed heterogeneity (I 2= 69.101 %, P= 0.001).
The data were pooled using a fixed and random -
effects model. There was a significant difference
between the real rTMS groups and sham rTMS groups
Figure 1. Meta-analysis of the eleven articles

Evaluation of rTMS in Poststroke Aphasia
44 FBT, Vol. 8, No. Supple 1 (2021) 41-45
(SMD = 1.26, 95% CI = 0.80 to 1.71, P=0.01).
Sensitivity analyses were conducted after omitting
Heiss WD’s study, which has an unclear risk of
allocation concealment bias and a high risk of
incomplete outcome bias (SMD = 1.04, 95% CI = 0.52
to 1.56, P=0.01). The meta-analysis continued to show
that there was a statistically significant effect of rTMS
compared with sham rTMS on the severity of aphasia.
3.3. Secondary Outcomes
Adverse effects: None of the eleven trials reported
any adverse effects.
4. Conclusion
This meta-analysis indicates a clinically positive
effect of rTMS with or without Speech and Language
Therapy (SLT) for patients with aphasia following
stroke in overall language function and expressive
language, including naming, repetition, writing, and
comprehension. Low-frequency (1 Hz) rTMS over the
unaffected hemisphere is effective and compatible
with the concept of interhemispheric inhibition.
Moreover, the treatment of 1 Hz rTMS for patients
with aphasia after stroke was safe. No adverse effects
were observed in patients in all eleven trials. However,
further well-designed studies are necessary to
determine the effect duration and long-term impact.
Acknowledgement
The authors would like to that Dr. Meisam Sadeghi
from the Institute for Cognitive Science Studies in
Tehran for his kind assistance.
References
1- Pedersen PM, Jّrgensen HS, Nakayama H, et al. "Aphasia
in acute stroke: incidence, determinants, and recovery."
Ann Neurol;38(4):659-66, 1995.
2- Basso A. "How intensive/prolonged should an
intensive/prolonged treatment be?" Aphasiology;19:975-
84, 2005.
3- Bhogal SK, Teasell R, Speechley M. "Intensity of
aphasia therapy, impact on recovery." Stroke;34:987-93,
2003.
4- Barwood CHS, Murdoch BE, Riek S, et al. "Long term
language recovery subsequent to low frequency rTMS in
chronic non-fluent aphasia."
NeuroRehabilitation;32(4):915-928, 2013.
5- Medina J, Norise C, Faseyitan O, Coslett HB, Turkeltaub
PE, Hamilton RH. "Finding the right words: Transcranial
magnetic stimulation improves discourse productivity in
non-fluent aphasia after stroke." Aphasiology;
26(9):1153-68, 2012.
6- Baker JM, Rorden C, Fridriksson, J. "Using transcranial
direct-current stimulation to treat stroke patients with
aphasia." Stroke;41(6):1229-36, 2010.
7- Naeser M, Martin PI, Nicholas M, et al. "Improved
picture naming in chronic aphasia after TMS to part of
right Broca’s area: An open-protocol study." Brain Lang;
93(1):95-105, 2005.
8- Thiel A, Hartmann A, Rubi-Fessen I, et al. "Effects of
noninvasive brain stimulation on language networks and
recovery in early poststroke aphasia." Stroke;44(8):2240-
6, 2013.
9- Rubi-Fessen I, Hartmann A, Huber W, et al. "Add-on
effects of rTMS on subacute aphasia therapy: Enhanced
improvement of functional communication and basic
linguistic skills. A randomized controlled study." Arch
Phys Med Rehabil; 96(11):1935-44.e2, 2015.
10- Szaflarski JP, Allendorfer JB, Banks C, Vannest J,
Holland SK. "Recovered vs. not-recovered from
poststroke aphasia: The contributions from the dominant
and non-dominant hemispheres." Restor Neurol Neurosci;
31(4): 347-60, 2013.
11- Shah PP, Szaflarski JP, Allendorfer J, Hamilton RH.
"Induction of neuroplasticity and recovery in poststroke
aphasia by non-invasive brain stimulation." Front Hum
Neurosci; 7:888, 2013.
12- DeLeon J, Gottesman RF, Kleinman JT, et al. "Neural
regions essential for distinct cognitive processes
underlying picture naming." Brain; 130(Pt 5):1408-22,
2007.
13- Barwood CH, Murdoch BE, Whelan BM, et al.
"Improved language performance subsequent to low-
frequency rTMS in patients with chronic non-fluent
aphasia post-stroke." Eur J Neurol;8(7):935-43, 2011.
14- Barwood CH, Murdoch BE, Whelan BM, et al. "The
effects of low frequency Repetitive Transcranial
Magnetic Stimulation (rTMS) and sham condition rTMS
on behavioural language in chronic non-fluent aphasia:
Short term outcomes." NeuroRehabilitation;28(2):113-
28, 2011.
15- Seniow J, Waldowski K, Lesniak M, et al. "Transcranial
magnetic stimulation combined with speech and language
training in early aphasia rehabilitation: a randomized

M. Gholami, et al.
FBT, Vol. 8, No. Supple 1 (2021) 41-45 45
double-blind controlled pilot study." Top Stroke Rehabil;
20:250-61, 2013.
16- Heiss WD, Hartmann A, Rubi-Fessen I, et al.
"Noninvasive brain stimulation for treatment of right- and
left-handed poststroke aphasics." Cerebrovasc Dis;
36:363-72, 2013.
17- Hartmann A, Rubi-Fessen I, Heiss WD. "rTMS in the
treatment of poststroke aphasia." Neurophysiologie
Clinique/Clinical Neurophysiology; 43:70-1, 2013.
18- Waldowski K, Seniow J, Lesniak M, Iwanski S,
Czlonkowska A. "Effect of low frequency repetitive
transcranial magnetic stimulation on naming abilities in
early-stroke aphasic patients: a prospective, randomized,
double-blind sham controlled study."
ScientificWorldJournal:518568, 2012.
19- Heikkinen PH, Pulvermüller F, Mäkelä JP, et al.
"Combining rTMS With Intensive Language-Action
Therapy in Chronic Aphasia: A Randomized Controlled
Trial." Front Neurosci;12:1036, 2019.
20- Ren C, Zhang G, Xu X, et al. "The Effect of rTMS over
the Different Targets on Language Recovery in Stroke
Patients with Global Aphasia: A Randomized Sham-
Controlled Study." Biomed Res Int;2019:4589056, 2019.
21- Ren CL, Zhang GF, Xia N, et al. "Effect of low-
frequency rTMS on aphasia in stroke patients: a meta-
analysis of randomized controlled trials." PLoS
One;9(7):e102557, 2014.
22- Maeda F, Keenan JP, Tormos JM, Topka H, Pascual-
Leone A. "Modulation of corticospinal excitability by
repetitive transcranial magnetic stimulation." Clin
Neurophysiol;111:800-5, 2000.

Copyright © 2021 Tehran University of Medical Sciences. This work is licensed under a Creative Commons Attribution -NonCommercial 4.0 International license (https://creativecommons.org/licenses/by-nc/4.0/). Noncommercial uses of the work are permitted, provided the original work is properly cited.
Frontiers in Biomedical Technologies Vol. 8, No. Supple 1 (2021) 46-51
fNIRS Signals Classification with Ensemble Learning Classifiers
Mohammad Moein Esfahani * , Hossein Sadati
Department of Mechanical Engineering, K.N Toosi University of Technology, Tehran, Iran
*Corresponding Authors: Mohammad Moein Esfahani Email: [email protected]
Abstract
Brain-Computer-Interface (BCIs) is designed to interpret brain signals from the brain and communicate between
a physical device and the human brain, much like assisting patients with motor disabilities. In this study, fNIRS,
a new brain imaging technique based on measuring brain hemodynamic response on the cortical surface used in
various neuroscience and neuro-engineering studies, has been used to classify 30 subjects' unilateral finger and
foot-tapping in the three classes of left- and right-hand movement and foot tapping. The objective is the
classification of the three-class functional Near-Infrared Spectroscopy (fNIRS) signals. We have used the
classification methods for each of the three classes one at a time, followed by the voting method as an ensemble
learning approach.
The results given in the form of an average for all subjects with no ensemble learning reached 64.9±16.2%,
whereas that with the ensemble learning reached 69±15.5%. These results show not only an improvement in the
accuracy, but also it shows a decrease in the standard deviation, suggesting that the classification model gets
optimal by decreasing the variance of the predictions.
Keywords: Brain-Computer-Interface; Brain-Computer-Interface; Ensemble Learning; Classification functional
Near-Infrared Spectroscopy Signal; Support Vector Machine; k Nearest Neighbor; Naïve Bays.

M M. Esfahani, et al.
FBT, Vol. 8, No. Supple 1 (2021) 46-51 47
1. Introduction
BCIs are designed to link and communicate
between a physical device and the human brain by
acquisition and interpret brain signals from the brain
in other words like a bypassing and converting system
from peripheral nerves and muscles to control
commands, for example, BCIs can provide assistance
system for patients with motor disabilities [1].
One neuroimaging system's goals are to monitor
brain activity achieved by fNIRS, a new brain imaging
technique based on measuring brain hemodynamic
response on the cortical surface and used in various
neuroscience and neuro-engineering studies. It is
increasingly being used to measure variations of
oxygenated (Hbo) non-invasively and deoxygenates
hemoglobin (HbR) changes by optical absorption
devices based on modified Beer-Lambert law [2, 3].
Advanced neuroimaging techniques, including
EEG and fNIRS, are the most portable, low cost,
silent, easy to handle, and compared to fMRI, has
higher temporal sampling rate and also spatial
resolution [1]. One of the most important advantages
compared with other methods like
Electroencephalogram (EEG) is that fNIRS has better
tolerance to motion artifacts that is less sensitive to
head movement and experimental flexibility thus,
based on advantages and fewer limitations on subjects,
especially allowing variance in motion artifacts it has
wide usages in patients' groups like infants and
neurological patients unlike inconvenient methods
like functional Magnetic Resonance Imaging (fMRI).
fNIRS also has several limitations like depth
sensitivity (approximately 1.5cm) and coverage area,
and this technology is not suitable for detecting deeper
brain structures and cortical neuronal systems and also
challenging to determine the cortical region of signal
source a coupled or hybrid EEG/fNIRS modalities
benefit both systems like higher temporal resolution
because of EEG consequently better results in
classification and then control commands in BCIs.
1.1. Noises in fNIRS
fNIRS signals contain various types of noise,
including instrumental noise due to interfaces in a
surrounding environment like external light and
devices, experimental noise, motion artifacts, and
contact pressure between scalp and optode that would
change due to movement and physiological noise [4].
This paper aims to classify fNIRS signals concerning
ensemble methods that combine classification models
like Support Vector Machines (SVM), Linear
Discriminant Analysis (LDA), and k Nearest
Neighbor (kNN).
The paper has organized as follow the data
collection, preprocessing, classification, and
validation procedure.
2. Materials and Methods
The objective of this study is the classification of
the three-class fNIRS signals. We proposed a method,
as depicted in the flowchart of Figure 1. The proposed
Feature Selection
Use MRMR algorithm to select
best features
Preprocessing
Baseline Correction
Butterworth Filter [0.01-1]hz
Time Domain Extraction
Bandpass Filtering
Feature Extraction7 Features Extracted in
Time domains
ClassificationVoting
SVM - polynomial
SVM - Linear
Ensemble Learning Adaboost – LDA
Ensemble Learning RUSBoost – LDA
Ensemble Learning Bag – LDA
Naïve Bays
Figure 1. flowchart of proposed method

fNIRS Signals Classification with Ensemble Learning Classifiers
48 FBT, Vol. 8, No. Supple 1 (2021) 46-51
method consists of preprocessing, feature selection,
and classification that uses an ensemble method.
2.1. fNIRS Dataset
A freely available dataset consisting of 30
volunteers (29 right-handed, 17 males in the 23.4±2.5
years old range) participated in this study [5]. No
volunteer reported psychiatric or neurological
disorders that could affect the experiment [5]. The
fNIRS data were recorded by a three-wavelength
continuous-time multi-channel fNIRS system
consisting of eight light sources (Tx) and eight
detectors (Rx). Each of the four Tx and Rx electrodes
was placed around the C3 on the left hemisphere, and
similarly, the same number of electrodes were placed
around the C4 on the right hemisphere. The
experiment included three separate sessions with 25
trials for each task, and a trial includes an introduction
period (2 sec), a task period (10 sec), and an inter-trial
break (17-19 sec). Every trial is related to the Right-
Hand filter Tapping (RHT), Left-Hand filter Tapping
(LHT), and Foot-Tapping (FT) [5].
2.2. Preprocessing
The fNIRS signal is based on Beer-Lambert law [2]
which concerns optical attenuation of biological
materials. It consists of oxygenated as well as
deoxygenated hemoglobin wavelengths (∆Hbo and
∆HbR, respectively), and to analyze these signals and
classification tasks by segmentation thereof, the task
is done 1sec before the onset to 4 sec after, and a 3D
matrix with time, channels, and trials are obtained [6].
2.3. Signal Filtering
The fNIRS signal consists of both ∆HbO and ∆HbR
regarding artifacts and heartbeat and even respiration
in trials. For the purpose of signal analysis, a bandpass
Butterworth filter with degree 3 and frequency domain
[0.01,0.2] has been designed, with every trial filtered
with zero phase delay (Figure 2).
2.4. Baseline Correction
An essential part of preprocessing fNIRS signals
that must be performed is the baseline correction. If
this part is disregarded, a decrease in accuracy in the
baseline analysis may result. This preprocessing is
performed by contracting the average of the start point
of the trial to the onset point, which is applied to every
trial after filtering [7].
2.5. Feature Extraction
To extract the signal features, various means of
representations exist, such as those of the temporal
(time), frequency, and time-frequency, but in the
fNIRS signals analysis, only temporal features have
been extracted for every trial [8]. Regardless of which
class each belongs to, the set of the features extracted
are slope, mean, max, kurtosis, and power [9].
2.6. Feature Selection
As extracted Features set is a high dimensional
matrix that causes complexity in classification and
aims to reach the best subset of features that help better
understanding data and effect of the curse of
dimensionality [10] should implement a feature
selection algorithm.
There are two main feature selection methods,
wrapper, and filter method [11], which researches
frequently profited by one of these algorithms.
Wrapper method analysis is a subset feature
combination and is time computation consuming but
filter methods, analysis every feature independently,
then fast and lower computation consuming as
advantages.
Introduction Task Reset
0 10 12 27-29-2
-1 27Features Domain
Figure 2. Structure of a single trial

M M. Esfahani, et al.
FBT, Vol. 8, No. Supple 1 (2021) 46-51 49
In this study, Minimum Redundancy Maximum
Relevance (MRMR) has been implemented to
discriminate if a feature in the “feature set” is
significant or needs to reject the null hypothesis [12].
2.7. Classification
In this study, voting methods have been
implemented, with each trained classifier predicting
results, and in the second layer, the most dominant
predicts are taken as the final predict win. It is noted
that the result from each classifier is based on the
overall performance.
In other words, each classifier may have a different
weight. The classifier consists of two main layers: the
first layer is made up of eight strong learner classifiers,
and the second layer possesses a simple, preferably
linear classifier such as the logistic regression or
single-layer perceptron through a stacking and voting
algorithm which selects dominant votes, as a result,
also known as the meta classifier [13].
It consists of two main layers: the first layer consists
of more than one complex or simple in this study eight
classifiers, strong learner, and the second layer a
simple, preferably a linear classifier like logistic
regression or single-layer perceptron in stacking and
in voting an algorithm which selects dominant votes
as a result, also called meta classifier.
The first layer employs five classifiers as follows:
1) KNN with k=15, where this classifier itself is
trained using Adaboost ensemble classification with
190 models, 2) SVM with the linear and polynomial
kernel, 3) LDA with the diagonal kernel trained with
AdaBoost, robust boost, and bagging ensemble
learning method, 4) naïve Bayes classifier, and 5)
decision tree with lp boost. For each of these
classifiers, as many as 190 models were used. The
results of the two layers have been taken in a voting
manner, and the final results were reported as follows.
finally, results have been voted, and final results have
reported.
3. Results
In classification problems, accuracy as a statistical
measurement for classification performance has been
proposed, and results in Figure 3 demonstrate that we
can achieve higher accuracy within voting ensemble
learning.
The average accuracy for the 30 subjects is 64.94 ±
16.2% and 69 ± 15.5% without and with ensemble
learning, respectively. This result was evaluated in
three classes with 10-fold cross-validation, and the
accuracy of each class is higher than the nominal
chance-based 33.33%. Moreover, we conclude that
classification becomes optimal by a decrease in the
standard deviation, especially in BCI systems, leading
to much better results.
Figure 3. Butterworth designed filter domain: (0.02 0.1) hz, sampling rate: 13.33hz

fNIRS Signals Classification with Ensemble Learning Classifiers
50 FBT, Vol. 8, No. Supple 1 (2021) 46-51
4. Conclusion
In this study, to analyze and as a consequence,
classification of fNIRS signals a frontier method
implements aim to achieve higher classification
performance and optimize variance of classification or
model robustness and also computation speed which
is challenging in real-time BCIs.
Better results in both train and test data that
demonstrate the performance of BCI systems,
including control of healthy and patient peoples with
fNIRS signal, became more effectively stable in both
online and offline BCI systems.
Also, as a future study, the hybrid system of EEG
and fNIRS system yields higher temporal and spatial
resolution and compensates each one's weakness then
possibly used in clinical research can detect with better
performance in BCIs.
References
1- Huo et al., “A review on functional near-infrared
spectroscopy and application in stroke rehabilitation,”
Med. Nov. Technol. Devices, p. 100064, 2021, doi:
10.1016/j.medntd.2021.100064.
2- J. Shin, A. von Lühmann, D.-W. Kim, J. Mehnert, H.-J.
Hwang, and K.-R. Müller, “Simultaneous acquisition of
EEG and NIRS during cognitive tasks for an open access
dataset,” Sci. Data, vol. 5, no. 1, p. 180003, Dec. 2018,
doi: 10.1038/sdata.2018.3.
3- S. Mandal, B. K. Singh, and K. Thakur, “Classification
of working memory loads using hybrid EEG and fNIRS
in machine learning paradigm,” Electron. Lett., vol. 56,
no. 25, pp. 1386–1389, 2020, doi: 10.1049/el.2020.2710.
4- O. Attallah, J. Abougharbia, M. Tamazin, and A. A.
Nasser, “A bci system based on motor imagery for
assisting people with motor deficiencies in the limbs,”
Brain Sci., vol. 10, no. 11, pp. 1–25, 2020, doi:
10.3390/brainsci10110864.
5- S. J. Bak, J. Park, J. Shin, and J. Jeong, “Open-access
fNIRS dataset for classification of unilateral finger- and
foot-tapping,” Electron., vol. 8, no. 12, 2019, doi:
10.3390/electronics8121486.
6- F. Shamsi, A. Haddad, and L. Najafizadeh, “Early
classification of motor tasks using dynamic functional
connectivity graphs from EEG,” J. Neural Eng., 2020,
doi: 10.1088/1741-2552/abce70.
7- F. Shamsi and L. Najafizadeh, “Multi-class
Classification of Motor Execution Tasks using fNIRS,”
2019 IEEE Signal Process. Med. Biol. Symp. SPMB 2019
- Proc., 2019, doi: 10.1109/SPMB47826.2019.9037856.
8- N. H. Berivanlou, S. K. Setarehdan, and H. A. Noubari,
“Quantifying mental workload of operators performing n-
back working memory task: Toward fNIRS based passive
BCI system,” 2016 23rd Iran. Conf. Biomed. Eng. 2016
1st Int. Iran. Conf. Biomed. Eng. ICBME 2016, no.
November, pp. 140–145, 2017, doi:
10.1109/ICBME.2016.7890945.
9- K.-S. Hong, M. J. Khan, and M. J. Hong, “Feature
Extraction and Classification Methods for Hybrid fNIRS-
Figure 4. Classification accuracy with or without implementing ensemble learning
M M. Esfahani, et al.
FBT, Vol. 8, No. Supple 1 (2021) 46-51 51
EEG Brain-Computer Interfaces,” Front. Hum. Neurosci.,
vol. 12, Jun. 2018, doi: 10.3389/fnhum.2018.00246.
10- E. A. Aydin, “Subject-Specific feature selection for near
infrared spectroscopy based brain-computer interfaces,”
Comput. Methods Programs Biomed., vol. 195, p.
105535, 2020, doi: 10.1016/j.cmpb.2020.105535.
11- F. M. Noori, N. Naseer, N. K. Qureshi, H. Nazeer, and
R. A. Khan, “Optimal feature selection from fNIRS
signals using genetic algorithms for BCI,” Neurosci. Lett.,
vol. 647, pp. 61–66, 2017, doi:
10.1016/j.neulet.2017.03.013.
12- Y. Guo, Y. Zhang, Z. Chen, Y. Liu, and W. Chen, “EEG
classification by filter band component regularized
common spatial pattern for motor imagery,” Biomed.
Signal Process. Control, vol. 59, p. 101917, 2020, doi:
10.1016/j.bspc.2020.101917.
13- Q. Ai, Q. Liu, W. Meng, and S. Q. Xie, “Brain Signal
Acquisition and Preprocessing,” Adv. Rehabil. Technol.,
pp. 105–133, 2018, doi: 10.1016/b978-0-12-814597-
5.00005-9.

Copyright © 2021 Tehran University of Medical Sciences. This work is licensed under a Creative Commons Attribution -NonCommercial 4.0 International license (https://creativecommons.org/licenses/by-nc/4.0/). Noncommercial uses of the work are permitted, provided the original work is properly cited.
Frontiers in Biomedical Technologies Vol. 8, No. Supple 1 (2021) 52-54
Detecting ADHD Children Based on Brain Functional Connectivity Using MEG
Signals
Nastaran Hamedi, Ali Khadem * , Mehdi Delrobaei
Department of Biomedical Engineering, Faculty of Electrical Engineering, K. N. Toosi University of Technology, Tehran, Iran
*Corresponding Authors: Ali Khadem Email: [email protected]
Abstract
Attention Deficit Hyperactivity Disorder (ADHD) is the most common neurological disorder in childhood. The
apparent symptoms of this disorder include a significant lack of attention, impulsivity, and hyperactivity. As this
disorder causes social incompatibility, accurate and early diagnosis can help to control the problems.
Magnetoencephalogram (MEG) signals may be an efficient technique for diagnosing ADHD due to being non-
invasive and having a high temporal and spatial resolution.
In this paper, we proposed a method to detect ADHD MEG signals recorded in open eyes resting-state condition.
Our method measured the Coherence (COH) values between MEG sensors in conventional MEG frequency bands
as features. Afterward, the most discriminative features selected by the Neighborhood Component Analysis
(NCA) were fed to the Support Vector Machine (SVM) with Radial-Based Function (RBF) as a classifier. Using
Leave-One-Subject-Out Cross-Validation (LOSO-CV), The best results using single-band COH values reached
the highest accuracy of 91.1% and belonged to delta-band couplings. However, when we used the fusion of COH
values of all frequency bands, we got a slight improvement in detection accuracy to 92.7%. The proposed method
led to promising performance criteria compared with previous studies on ADHD diagnosis using resting-state
MEG data.
Keywords: Computer-Aided Diagnosis System; Attention Deficit Hyperactivity Disorder; Magnetoencephalogram;
Resting-State; Coherence.

N. Hamedi, et al.
FBT, Vol. 8, No. Supple 1 (2021) 52-54 53
1. Introduction
ADHD is the most prevalent neurobehavioral disorder
in school-age children [1]. The prevalence of ADHD
worldwide in children is estimated at 4% [2]. Impulsivity,
inattentiveness, and hyperactivity are the most important
symptoms of ADHD. There is no effective biomarker yet
to diagnose ADHD accurately. So, the diagnosis is
entirely dependent on clinical tests.
Nowadays, using MEG techniques is shown to be
beneficial in diagnosing ADHD. The MEG is an efficient
functional neuroimaging modality due to being non-
invasive and having a high temporal and spatial
resolution. MEG records the magnetic fields mainly
generated by the cortical activity of the brain. It is
worth mentioning that limited research has been done
using the MEG signals to detect ADHD, and beyond
them, COH has not yet been used for the diagnosis of
ADHD using MEG signals.
The objective of the proposed study is to detect
ADHD using the straightforward, functional connectivity
measure of COH. For this purpose, COH was calculated
in conventional MEG frequency bands. We wanted to
test whether the COH values of sensor-space MEG
signals between two different groups show diagnostic
ADHD-related patterns. We did this by feeding the most
discriminative coherence values to a classifier.
Recognizing the difference between normal and
abnormal brain functional connectivity measured by
COH would lead to the identification of ADHD. Our
ultimate goal in this paper is to propose a Computer-
Aided Diagnosis System (CADS) to detect ADHD.
2. Materials and Methods
2.1. Data Set
In this study, we used the Open MEG Archive
(OMEGA), a free MEG dataset provided by the
McConnell Brain Imaging Centre of the Montreal
Neurological Institute and the Université de Montréal
[3]. The data consist of the resting-state MEG signals
of 25 healthy participants (age: 20.6 ± 2.35 years;
mean ± standard deviation) and 25 patients with
ADHD (age: 20.6 ± 3.04 years; mean ± standard
deviation), acquired for about 5 minutes at a sampling
frequency of 2400 Hz for each subject.
2.2. Proposed Method
At first, for preprocessing the data, a 60 Hz notch filter
was applied to eliminate powerline signal contamination.
Then physiological artifacts were removed using both
visual inspection and Signal-Space Projectors (SSP) [3].
After all, signals were divided into artifact-free epochs
of 5s duration (12000 time samples), and an average
of 7 epochs was extracted from the MEG signals of each
subject. Moreover, COH was used to extract features.
It provides information about the degree of coupling
between two signals in a specific frequency band [4].
Then Neighborhood Component Analysis (NCA) was
used as a nonparametric and supervised feature selection
algorithm [5]. After all, to detect ADHD from healthy
subjects, the SVM with RBF was used. Furthermore,
we used LOSO-CV to evaluate our results which
investigate the subject-to-subject variation and eliminate the
effect of autocorrelation in time-series data of a single
subject. The average performance of all subjects would
be reported as the final performance of the proposed
method.
3. Results
The proposed method was evaluated on a binary dataset
using LOSO-CV. In this paper, we used the COH of
269 MEG channels in conventional MEG frequency
bands. First, the COH values of each frequency band were
extracted as feature vectors separately. Once more, the
fusion of these five feature sets was used in order to achieve
probably better performance. In all cases, the most
discriminative features were selected using the NCA
algorithm. Afterward, the selected features were fed to
SVM. In order to evaluate the performance of the
classification algorithm, accuracy, sensitivity, and
specificity were computed and provided in Table 1.
As seen, we reached the best detection accuracy
using the delta band among the other frequency bands
in the single-band experiments. It means that ADHD
disorganized linear functional couplings in the delta
frequency band at a higher level. While concatenating
all five feature sets belonging to five different frequency
bands, the average accuracy of the algorithm improved

Detecting ADHD Children Based on Brain Functional Connectivity Using MEG Signals
54 FBT, Vol. 8, No. Supple 1 (2021) 52-54
from 91.1% to 92.7%. The best results reached 92.7%
accuracy, 93.6% sensitivity, and 91.9%, which is so
better compared to what had been done before. Thus
our proposed algorithm may be considered more reliable
than the previous methods and seems to be a promising
step toward designing an accurate CADS for ADHD.
4. Conclusion
In this paper, the detection of ADHD using MEG
signals was performed by computing the Coherence
value in sensor space in different frequency bands.
The obtained results showed significant discrimination
between ADHD patients and controls, which led to the
high accuracy of the detection algorithm. It is noteworthy
that fine-tuning in the proposed algorithm may provide
us with better results in predicting ADHD. Moreover,
different classifiers, feature extraction, and selection
methods can be studied to obtain better results.
References
1- J. Biederman and S. V. Faraone, “Attention-deficit
hyperactivity disorder.” Lancet., vol. 366, pp. 237-248,
2006.
2- R. Thomas, S. Sanders, J. Doust, E. Beller, and P. Glasziou,
"Prevalence of Attention- Deficit/Hyperactivity Disorder: A
Systematic Review and Meta-analysis." Pediatrics, vol. 135,
pp. e994- e1001, 2015.
3- R. A. Barkley, M. Fischer, L. Smallish, and K. Fletcher,
“Young adult outcome of hyperactive children: Adaptive
functioning in major life activities,” J. Am. Acad. Child
Adolesc. Psychiatry, vol. 45, no. 2, pp. 192–202, 2006.
4- P. L.Nunez, R. Srinivasan, A. F.Westdorp et al., “EEG
coherency I: statistics, reference electrode, volume
conduction, Laplacians, cortical imaging, and interpretation
at multiple scales.” Electroencephalography and Clinical
Neurophysiology, vol. 103, no. 5, pp. 499–515, 1997.
5- W. Yang, K. Wang, and W. Zuo, “Neighborhood
Component Feature Selection for High-Dimensional
Data.” JCP, vol. 7, no. 1, pp. 161– 168, 2012.
Table 1. Classification performance criteria obtained
SVM (kernel function: RBF) as the classifier (mean%
± std%)
Bands (Hz) Accuracy Sensitivity Specificity
𝛿 (0.3-4) 91.1 ± 1.4 94.4 ± 1.1 87.8 ± 1.6
𝜃 (4-8) 78.8 ± 2.1 85.5 ± 1.9 72.4 ± 2
𝛼 (8-12) 74.6 ± 2.5 73.9 ± 2 75.2 ± 2.8
𝛽 (12-30) 81.7 ± 2.4 79.1 ± 2.6 84.1 ± 2.2
𝛾 (30-50) 86.1 ± 2 89.3 ± 1.7 82.9 ± 2.3
All bands 92.7 ± 1.6 93.6 ± 1.3 91.9 ± 1.9

Copyright © 2021 Tehran University of Medical Sciences. This work is licensed under a Creative Commons Attribution -NonCommercial 4.0 International license (https://creativecommons.org/licenses/by-nc/4.0/). Noncommercial uses of the work are permitted, provided the original work is properly cited.
Frontiers in Biomedical Technologies Vol. 8, No. Supple 1 (2021) 55-58
Dynamic Functional Connectivity in Major Depressive Disorder with Suicidal
Thoughts: An fMRI Study
Morteza Fattahi 1, Gholam Ali Hossein Zadeh 1 * , Ali Reza Akhondi Asl 1, Reza Rostami 2
1 School of Electrical and Computer Engineering, University of Tehran, Tehran, Iran
2 School of Psychology and Educational Sciences, University of Tehran, Tehran, Iran
*Corresponding Authors: Gholam Ali Hossein Zadeh Email: [email protected]
Abstract
Precise characterization of psychiatric disorders is a major stream in applied neuroscience. Major Depressive
Disorder (MDD) is one of these disorders that may lead to suicide ideation and ends to individual’s death. We
used functional Magnetic Resonance Imaging (fMRI) in order to study the impairments in the brain functional
connectivity of 14 MDD patients with suicide thoughts. Spatial Independent Component Analysis (ICA) (COMBI
algorithm) was used to extract independent components and brain networks of resting state fMRI data from these
patients. As a measure of functional network connectivity, mutual information was calculated between each pair
of resulted spatial maps. Then Independent Vector Analysis (IVA-GL algorithm was applied to the windowed
time series and Mountain Standard Time (MST) used as stability measurement. Significant between network
connectivity observed in Executive Control Network (ECN), Default Mode Network (DMN), Salience Network
(SN), Basal Ganglia and visuospatial networks.
Results are consistent with previous studies about activated networks in MDDs with suicidal thoughts.
Keywords: Functional Connectivity; Independent Vector Analysis; Major Depressive Disorder; Suicidal
Thought.

Dynamic Functional Connectivity in Major Depressive Disorder with Suicidal Thoughts: An fMRI Study
56 FBT, Vol. 8, No. Supple 1 (2021) 55-58
1. Introduction
Major depressive disorder induces dysfunctioning
in mood, recognition, psychomotor activity and
neurovegetative functions [1]. Suicide ideation among
MDD patients leads to suicide attempting with an
occurrence rate of 16.6 percent. Single men, students and
married women are more vulnerable to such attempts
[2]. Resting state functional Magnetic Resonance
Imaging (rsfMRI) is a popular approach to study the brain
functional organization. Applying ICA analysis on
rsfMRI data can separate the brain networks as the
sources of Blood Oxygenation Level Dependent
(BOLD) signal from noise fluctuations [3]. Despite ICA,
IVA can effectively address the permutation problem in
group level fMRI analysis [4]. Connectivity calculation
with different approaches after applying ICA is common.
In connectivity analysis, Dynamic Functional
Connectivity (DFC) is better than static functional
connectivity to study the brain function. It is illustrated
that DFC can demonstrate alterations in macroscopic
neural activity that reveals some important aspects of
behavior and cognition [5]. DFC was able to
distinguish between normal control and patients with
schizophrenia [6]. As having knowledge about the
recent studies, we decided to find all the independent
resting state networks in MDDs with Suicide Ideation
(SI) and strength of negative or positive connectivity
between them.
2. Materials and Methods
2.1. Participants
Participants had major depressive disorder with suicide
ideation. 14 females aged between 20 to 50 (30.31 ±
2.42; years old) were referred to this study by Atie
Derakhshan Zehn clinic Tehran (https://atiehclinic.com/).
In a separate validation the scale for suicide ideation
(SSI) and Hamilton were evaluated for these individuals.
All participants have the minimum criteria (SSI > 6
and Hamilton > 14).
2.2. Data Acquisition
fMRI data of all subjects were acquired at National
Brain Mapping Lab (NMBL) Tehran, Iran. Almost 8
minutes of resting state fMRI data were acquired for
each participants using an Echo Planar Imaging (EPI)
pulse sequence with TR = 2000ms, TE=30 ms, flip
angle= 80 deg, voxel size =3×3×4 mm3 and Field Of
View (FOV) = 240 × 240 mm2. A set of anatomical T1
weighted images were also acquired for each individual
using the Magnetization-Prepared Rapid Acquisition
with Gradient Echo (MPRAGE) pulse sequence, with
TR = 1810ms, TE = 3.45 ms, TI = 1100 ms, flip angle
=7 deg, voxel size = 1×1×1 mm3 and FOV =264 ×264
mm2.
2.3. Data Analysis
The Preprocessing pipeline was implemented by
DPARSF toolbox [7] (http://rfmri.org/dpabi). We followed
the DPARSF usual procedure, although we avoid of
filtering and smoothing, in order to get a better ICA analysis
at the next stage. After pre-processing the data, we used
a powerful toolbox for group ICA and IVA analysis
named Group ICA\IVA fMRI Toolbox (GIFT)
(https://trendscenter.org/software/gift/) [8]. In this software
package the Combi algorithm as a promising method
for ICA was employed to separate components efficiently
[9]. It is a combination between weights-adjusted
second-order blind identification and efficient Fast-
ICA. Independent Vector Analysis was applied to time
series data after dividing the time series into smaller
parts. Then IVA maps from individual subjects were
back-reconstructed from the aggregate mixing matrix.
At the last stage, mutual information between all possible
pairs of spatial components calculated.
3. Results
After applying ICA to the data, 22 of 30 components
that extracted form data was chosen by visual inspection
the location of component in the brain, power spectrum
and fractional Amplitude of Low-Frequency
Fluctuations (fALFF) values. Spatial dynamic
Functional Network Connectivity (dFNC) hierarchy
calculated by information extracted from normal Spatial
dFNC and ICA parameters information at the first step.
Connectivity between components was meaningfully
overlayed with previous studies. The connectivity maps
have illustrated in Figure 1. These maps include: Anterior
cranial base (S-N), auditory and basal ganglia, in the top
row, Dorsal default-Mode Network (DMN), Language
and Left Executive Control Network (ECN), in the
second row, precuneus, primary visual and right ECN, in

M. Fattahi, et al.
FBT, Vol. 8, No. Supple 1 (2021) 55-58 57
the third row, also sensorimotor, ventral DMN and
visuospatial I the bottom raw of Figure 1. These
networks are consistent with previous studies on MDD
patients with suicide thoughts [10, 11, 12]. Although
Right ECN identified as an important network that has
significant information flow to other recognized
networks, but hasn’t mentioned as crucial area in the
brain that has information transition, in previous
studies. In another study we compared some
connectivity measures and results showed connection
between right ECN and some networks that is
mentioned below.
References
1- A. B. Negrão and P. W. Gold, “Major Depressive Disorder,”
Encycl. Stress, vol. 28, pp. 640–645, 2007, doi:
10.1016/B978-012373947-6.00245-2.
2- A. S. Srivastava and R. Kumar, “Suicidal ideation and attempts
in patients with major depression: Sociodemographic and
clinical variables.,” Indian J. Psychiatry, vol. 47, no. 4, pp.
225–228, Oct. 2005, doi: 10.4103/0019-5545.43059.
3- M. J. Mckeown and T. J. Sejnowski, “Independent
Component Analysis of fMRI Data : Examining the
Assumptions,” vol. 372, pp. 368–372, 1998.
4- J. H. Lee, T. W. Lee, F. A. Jolesz, and S. S. Yoo, “Independent
vector analysis (IVA): Multivariate approach for fMRI group
Figure 1. Spatial dynamic connectivity maps for 12 important brain networks that extracted form fMRI data

Dynamic Functional Connectivity in Major Depressive Disorder with Suicidal Thoughts: An fMRI Study
58 FBT, Vol. 8, No. Supple 1 (2021) 55-58
study,” Neuroimage, vol. 40, no. 1, pp. 86–109, 2008, doi:
10.1016/j.neuroimage.2007.11.019.
5- R. M. Hutchison et al., “Dynamic functional connectivity:
Promise, issues, and interpretations,” Neuroimage, vol. 80,
pp. 360–378, 2013, doi: 10.1016/j.neuroimage.2013.05.079.
6- S. Bhinge, Q. Long, V. D. Calhoun, and T. Adali, “Spatial
Dynamic Functional Connectivity Analysis Identifies
Distinctive Biomarkers in Schizophrenia,” Front. Neurosci.,
vol. 13, no. September, 2019, doi: 10.3389/fnins.2019.01006.
7- Y. Chao-Gan and Z. Yu-Feng, “DPARSF: A MATLAB
toolbox for ‘pipeline’ data analysis of resting-state
fMRI,” Front. Syst. Neurosci., vol. 4, no. May 2010,
2010, doi: 10.3389/fnsys.2010.00013.
8- T. Gift and D. Team, “Group ICA/IVA Of fMRI Toolbox
(GIFT) Manual - The GIFT Documentation Team,” pp.
1–121, 2017.
9- Y. K. Sariya and R. S. Anand, “Comparison of separation
performance of independent component analysis
algorithms for fMRI data,” J. Integr. Neurosci., vol. 16,
no. 2, pp. 157–175, 2017, doi: 10.3233/JIN-170006.
10- L. Du et al., “Fronto-limbic disconnection in depressed
patients with suicidal ideation: A resting-state functional
connectivity study,” J. Affect. Disord., vol. 215, pp. 213–
217, 2017, doi: 10.1016/j.jad.2017.02.027.
11- H. W. Chase et al., “Alterations of functional
connectivity and intrinsic activity within the cingulate
cortex of suicidal ideators,” J. Affect. Disord., vol. 212,
pp. 78–85, 2017, doi: 10.1016/j.jad.2017.01.013.
12- S. J. Ordaz, M. S. Goyer, T. C. Ho, M. K. Singh, and I. H.
Gotlib, “Network basis of suicidal ideation in depressed
adolescents,” J. Affect. Disord., vol. 226, no. July 2017, pp.
92–99, 2018, doi: 10.1016/j.jad.2017.09.021.

Copyright © 2021 Tehran University of Medical Sciences. This work is licensed under a Creative Commons Attribution -NonCommercial 4.0 International license (https://creativecommons.org/licenses/by-nc/4.0/). Noncommercial uses of the work are permitted, provided the original work is properly cited.
Frontiers in Biomedical Technologies Vol. 8, No. Supple 1 (2021) 59-63
Toward Applicable EEG-Based Drowsiness Detection Systems
Nasrin Sheibani Asl 1, 2* , Golnaz Baghdadi 1, Sahar Javaher Haghighi 1
1 Freqqquency Company, Tehran, Iran
2 Department of Electrical Engineering, Sharif University of Technology, Tehran, Iran
*Corresponding Authors: Nasrin Sheibani Asl Email: [email protected]
Abstract
Drowsy driving is a serious issue which accounts for a great portion of accidents and has attracted substantial
research attention in recent years. Among different measures for Drowsiness Detection (DD), Electroencephalography
(EEG) signals are shown to be a reliable measure for human awareness and allow early detection of drowsiness.
Unfortunately, there is no comprehensive study showing the applicability of DD systems in real-life scenarios.
Therefore, we aimed to investigate the applicability of EEG-based DD systems through the following criteria:
being less intrusive, accuracy of detection, and algorithms used for practical implementation.
In this regard, we included 35 documented studies which utilized consumer-grade EEG headsets, namely, Muse,
Neurosky, and Emotive, for drowsiness detection. The highest detection accuracy, 99.1%, was achieved by Muse
headset, among the studies which reported a detection accuracy. Spectral features were widely used while being
relatively simpler than chaotic features for real-time calculations and more informative in comparison to statistical
features. This study sheds light on the current status of DD systems and paves the way for future designs of DD
systems functional in industry.
Keywords: Drowsiness Detection; Electroencephalography Signals; Consumer-Grade Headsets; Device Intrusiveness.

Toward Applicable EEG-Based Drowsiness Detection Systems
60 FBT, Vol. 8, No. Supple 1 (2021) 59-63
1. Introduction
Drowsiness is a transition from alertness towards
sleep, causing degradation in performance. Approximately
20 to 40% of total annual accidents in Iran are due to
drowsiness, and there are records of up to 60% of accidents
being related to drowsiness in one holiday season. Therefore,
a drowsiness detection device is vital for safe driving.
Based on Iran’s five-year development plan, improving
the quality of vehicle safety is a necessity. Researchers
have attempted to determine driver drowsiness using the
following measures: (1) vehicle-based measures (e. g.
steering-wheel sensors); (2) behavioral measures (e. g. eye
/head-movement patterns) and (3) physiological measures
(e. g. brain/heart/skin electrical responses). Among all
measures of drowsiness detections, EEG shows the strongest
relation with drowsiness and is capable of predicting
drowsiness in a timely manner with higher accuracy [1,
2]. Hence, EEG is widely considered as a reliable
measure for drowsiness, fatigue, and performance
evaluation [1-4]. However, to reduce the
cumbersomeness of EEG-based methods for practical
usage, a number of solutions, such as taking advantages
of EEG headsets, reducing the number of electrodes, and
using hybrid methods (i.e., combining EEG with other
easily accessible physiological signals), have been
suggested in previous studies. Recently, LaRocco et
al. [5] conducted a systematic review on low-cost EEG
headsets to show the reliability of these headsets in
drowsiness detection. However, they integrated the results
of studies from other categories (e.g., stress, excitement,
meditation, physical fatigue, and distraction detection) with
drowsiness detection studies in their assessment.
In this research, we intend to investigate EEG-based
drowsiness detection methods and provide some insights
on developing a drowsiness detection system applicable
for real-life scenarios.
2. Materials and Methods
In this research, we targeted the studies under the
category of drowsiness detection which adopted an
EEG-based approach and were published from 2010
onwards. We investigated the applicability through the
following criteria: being less intrusive, accuracy of detection,
and algorithms used for practical implementation. In
this regard, we focused on studies which utilized consumer-
grade EEG headsets, namely, Muse, Neurosky, and
Emotive, for drowsiness detection. Figure 1 shows the
common methodology used in EEG-based DD studies.
Due to the risks of drowsy driving in real conditions,
data acquisition is usually conducted in driving simulators.
Drowsiness detection studies have used a variety of
measures to induce drowsiness. Inadequate sleep during
the night before the test, data recording at times when
people normally feel drowsy (after lunch, midnight,
and dawn), avoidance of anti-fatigue drinks, etc., are
among the most commonly used strategies. EEG signals
recorded during driving can be severely affected by
different types of artifacts. Therefore, preprocessing is
an inseparable part of the detection algorithms. After
removing the artifacts, spectral, temporal, or chaotic
features are extracted to be fed to a classifier. However,
some of the classifiers, such as convolutional neural
networks, do not need predefined features and have the
ability to extract features from training data. Based on
the discriminative features, classifiers decide whether
a period of the signal is recorded under alert or drowsy
state, and an alarm system warns the driver if necessary.
3. Results
Considering the search methodology, 35 studies [6–
40] which utilized consumer-grade EEG headsets were
compared in terms of accuracy of detection, features,
and classifiers’ type (Figure 2). As shown in this figure,
the highest detection accuracy, 99.1%, was achieved
by Muse headset, and the second-highest accuracy was
gained with Neurosky headset. The figure also demonstrates
that most of the surveyed studies used spectral features
and shallow classifiers (e.g., Support Vector Machine
(SVM) and K-Nearest Neighbor (KNN)) to
discriminate alert/drowsy states. It is repeatedly reported
Figure 1. EEG-based drowsiness detection system
Data
Acquisition
Pre-
processingFeature
extractionClassification
Alarm
Alert/
Drowsy?
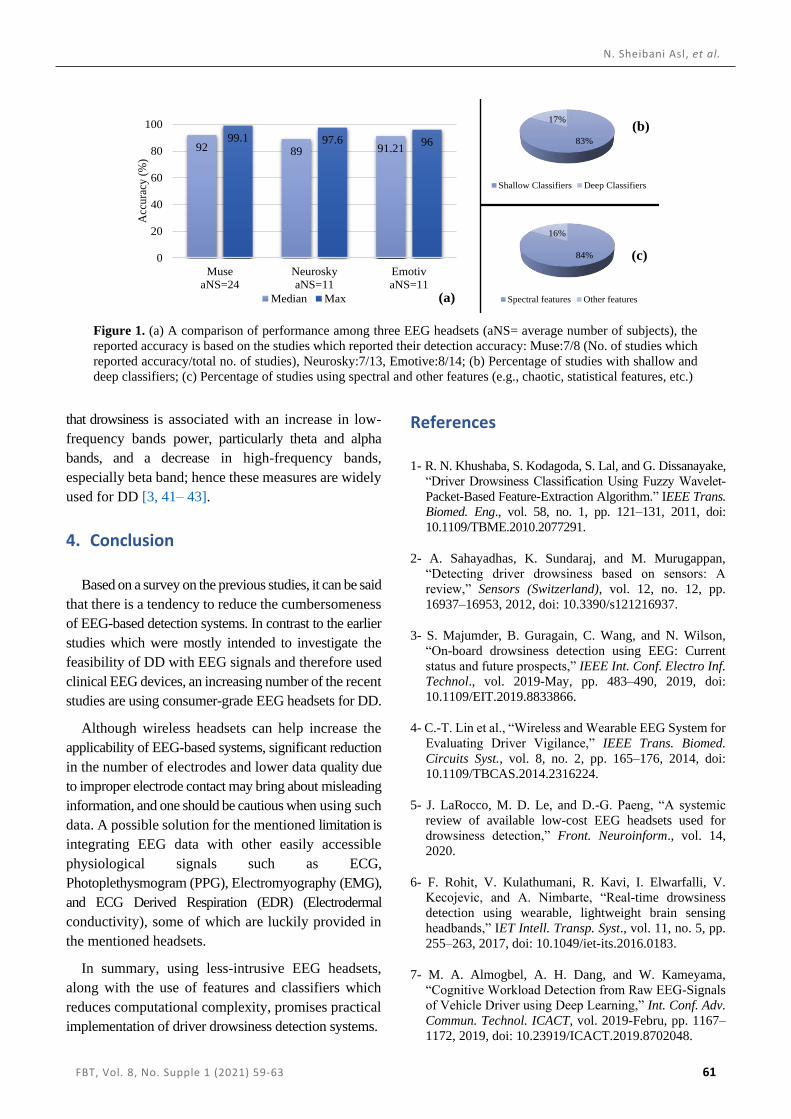
N. Sheibani Asl, et al.
FBT, Vol. 8, No. Supple 1 (2021) 59-63 61
that drowsiness is associated with an increase in low-
frequency bands power, particularly theta and alpha
bands, and a decrease in high-frequency bands,
especially beta band; hence these measures are widely
used for DD [3, 41– 43].
4. Conclusion
Based on a survey on the previous studies, it can be said
that there is a tendency to reduce the cumbersomeness
of EEG-based detection systems. In contrast to the earlier
studies which were mostly intended to investigate the
feasibility of DD with EEG signals and therefore used
clinical EEG devices, an increasing number of the recent
studies are using consumer-grade EEG headsets for DD.
Although wireless headsets can help increase the
applicability of EEG-based systems, significant reduction
in the number of electrodes and lower data quality due
to improper electrode contact may bring about misleading
information, and one should be cautious when using such
data. A possible solution for the mentioned limitation is
integrating EEG data with other easily accessible
physiological signals such as ECG,
Photoplethysmogram (PPG), Electromyography (EMG),
and ECG Derived Respiration (EDR) (Electrodermal
conductivity), some of which are luckily provided in
the mentioned headsets.
In summary, using less-intrusive EEG headsets,
along with the use of features and classifiers which
reduces computational complexity, promises practical
implementation of driver drowsiness detection systems.
References
1- R. N. Khushaba, S. Kodagoda, S. Lal, and G. Dissanayake,
“Driver Drowsiness Classification Using Fuzzy Wavelet-
Packet-Based Feature-Extraction Algorithm.” IEEE Trans.
Biomed. Eng., vol. 58, no. 1, pp. 121–131, 2011, doi:
10.1109/TBME.2010.2077291.
2- A. Sahayadhas, K. Sundaraj, and M. Murugappan,
“Detecting driver drowsiness based on sensors: A
review,” Sensors (Switzerland), vol. 12, no. 12, pp.
16937–16953, 2012, doi: 10.3390/s121216937.
3- S. Majumder, B. Guragain, C. Wang, and N. Wilson,
“On-board drowsiness detection using EEG: Current
status and future prospects,” IEEE Int. Conf. Electro Inf.
Technol., vol. 2019-May, pp. 483–490, 2019, doi:
10.1109/EIT.2019.8833866.
4- C.-T. Lin et al., “Wireless and Wearable EEG System for
Evaluating Driver Vigilance,” IEEE Trans. Biomed.
Circuits Syst., vol. 8, no. 2, pp. 165–176, 2014, doi:
10.1109/TBCAS.2014.2316224.
5- J. LaRocco, M. D. Le, and D.-G. Paeng, “A systemic
review of available low-cost EEG headsets used for
drowsiness detection,” Front. Neuroinform., vol. 14,
2020.
6- F. Rohit, V. Kulathumani, R. Kavi, I. Elwarfalli, V.
Kecojevic, and A. Nimbarte, “Real-time drowsiness
detection using wearable, lightweight brain sensing
headbands,” IET Intell. Transp. Syst., vol. 11, no. 5, pp.
255–263, 2017, doi: 10.1049/iet-its.2016.0183.
7- M. A. Almogbel, A. H. Dang, and W. Kameyama,
“Cognitive Workload Detection from Raw EEG-Signals
of Vehicle Driver using Deep Learning,” Int. Conf. Adv.
Commun. Technol. ICACT, vol. 2019-Febru, pp. 1167–
1172, 2019, doi: 10.23919/ICACT.2019.8702048.
Figure 1. (a) A comparison of performance among three EEG headsets (aNS= average number of subjects), the
reported accuracy is based on the studies which reported their detection accuracy: Muse:7/8 (No. of studies which
reported accuracy/total no. of studies), Neurosky:7/13, Emotive:8/14; (b) Percentage of studies with shallow and
deep classifiers; (c) Percentage of studies using spectral and other features (e.g., chaotic, statistical features, etc.)
(a)
(b)
(c)
92 89 91.2199.1 97.6 96
0
20
40
60
80
100
Muse
aNS=24
Neurosky
aNS=11
Emotiv
aNS=11
Acc
ura
cy (
%)
Median Max
83%
17%
Shallow Classifiers Deep Classifiers
84%
16%
Spectral features Other features

Toward Applicable EEG-Based Drowsiness Detection Systems
62 FBT, Vol. 8, No. Supple 1 (2021) 59-63
8- T. Suprihadi and K. Karyono, “DROWTION: Driver
drowsiness detection software using MINDWAVE,” in
2014 International Conference on Industrial
Automation, Information and Communications
Technology, 2014, pp. 141–144.
9- A. S. Abdel-Rahman, A. F. Seddik, and D. M. Shawky, “An
affordable approach for detecting drivers’ drowsiness using
EEG signal analysis,” 2015 Int. Conf. Adv. Comput.
Commun. Informatics, ICACCI 2015, pp. 1326–1332,
2015, doi: 10.1109/ICACCI.2015.7275796.
10- B. Van Hal, S. Rhodes, B. Dunne, and R. Bossemeyer,
“Low-cost EEG-based sleep detection.” in 2014 36th
Annual International Conference of the IEEE Engineering
in Medicine and Biology Society, pp. 4571–4574, 2014.
11- C.-J. Lin, C.-H. Ding, C.-C. Liu, and Y.-L. Liu,
“Development of a real-time drowsiness warning system
based on an embedded system,” in 2015 International
Conference on Advanced Robotics and Intelligent Systems
(ARIS), pp. 1–4, 2015. doi: 10.1109/ARIS.2015.7158365.
12- A. E. Putra, C. Atmaji, and T. G. Utami, “EEG-based
microsleep detector using microcontroller.” in 2016 8th
International Conference on Information Technology
and Electrical Engineering (ICITEE), 2016, pp. 1–4, doi:
10.1109/ICITEED.2016.7863296.
13- K. Sadeghi, A. Banerjee, J. Sohankar, and S. K. S. Gupta,
“SafeDrive: An autonomous driver safety application in
aware cities.” 2016 IEEE Int. Conf. Pervasive Comput.
Commun. Work. PerCom Work, 2016, doi:
10.1109/PERCOMW.2016.7457095.
14- K. Aboalayon and M. Faezipour, “Single Channel EEG
for Near Real-Time Sleep Stage Detection.” in 2019
International Conference on Computational Science and
Computational Intelligence (CSCI), pp. 641–645, 2019.
15- P. C. Nissimagoudar and A. V Nandi, “Precision
enhancement of driver assistant system using eeg based
driver consciousness analysis & classification.” in
Computational Network Application Tools for Performance
Management, Springer, pp. 247–257, 2020.
16- A. Pomer-Escher, R. Tello, J. Castillo, and T. Bastos-
Filho, “Analysis of mental fatigue in motor imagery and
emotional stimulation based on EEG,” 2014.
17- M. Ben Dkhil, A. Wali, and A. M. Alimi, “Drowsy
driver detection by EEG analysis using Fast Fourier
Transform.” in 2015 15th International Conference on
Intelligent Systems Design and Applications (ISDA),
2015, pp. 313–318.
18- V. Bakshi, “Towards Practical Driver Cognitive
Workload Monitoring via Electroencephalography.”
University of Toronto, 2018.
19- M. Ben Dkhil, N. Chawech, A. Wali, and A. M. Alimi,
“Towards an automatic drowsiness detection system by
evaluating the alpha band of EEG signals.” SAMI 2017 -
IEEE 15th Int. Symp. Appl. Mach. Intell. Informatics, Proc.,
pp. 371–376, 2017, doi: 10.1109/SAMI.2017.7880336.
20- F. Wang, J. Lin, W. Wang, and H. Wang, “EEG-based
mental fatigue assessment during driving by using sample
entropy and rhythm energy,” 2015 IEEE Int. Conf. Cyber
Technol. Autom. Control Intell. Syst. IEEE-CYBER 2015, pp.
1906–1911, 2015, doi: 10.1109/CYBER.2015.7288238.
21- E. Chen, D. Durairaj, B. Hew, M. Hoppel, and P. Huang,
“Quantitative and Qualitative Trade-Off Analysis of Drowsy
Driver Detection Methods: Single Electrode Wearable EEG
Device, Multi-Electrode Wearable EEG Device.” 2016, [Online].
Available: https://drum.lib.umd.edu/handle/1903/18079.
22- J. Chen, H. Wang, Q. Wang, and C. Hua, “Exploring the
fatigue affecting electroencephalography based functional
brain networks during real driving in young males.”
Neuropsychologia, vol. 129, no. September 2018, pp. 200–
211, 2019, doi: 10.1016/j.neuropsychologia.2019.04.004.
23- B. T. Nugraha, R. Sarno, D. A. Asfani, T. Igasaki, and
M. Nadzeri Munawar, “Classification of driver fatigue
state based on EEG using Emotiv EPOC+,” J. Theor.
Appl. Inf. Technol., vol. 86, no. 3, pp. 347–359, 2016.
24- D. Sawicki, A. Wolska, P. Rosłon, and S. Ordysiński,
“New EEG measure of the alertness analyzed by Emotiv
EPOC in a real working environment.” NEUROTECHNIX
2016 - Proc. 4th Int. Congr. Neurotechnology, Electron.
Informatics, no. Neurotechnix, pp. 35–42, 2016, doi:
10.5220/0006041200350042.
25- T. T. A. Pham, T. D. H. Nguyen, Q. K. Le, and Q. L.
Huynh, “Application of portable EEG device in detection
and classification drowsiness by support vector machine.”
in International Conference on the Development of
Biomedical Engineering in Vietnam, pp. 521–526, 2018.
26- S. S. Poorna, V. V Arsha, P. T. A. Aparna, P. Gopal,
and G. J. Nair, “Drowsiness detection for safe driving
using PCA EEG signals,” in Progress in computing,
analytics and networking, Springer, 2018, pp. 419–428.
27- O. N. Rahma and A. Rahmatillah, “Drowsiness analysis
using common spatial pattern and extreme learning
machine based on electroencephalogram signal.” J. Med.
Signals Sens., vol. 9, no. 2, p. 130, 2019.
28- T. Saichoo and P. Boonbrahm, “Brain Computer
Interface for Real-Time Driver Drowsiness Detection.”
Thai J. Phys., vol. 36, no. 1, pp. 1–8, 2019.
29- B. C. R. M. Araújo, “Drowsiness Detection Using a
Headband and Artificial Neural Networks.”
Universidade de Coimbra, 2019.
30- H. Li, D. Wang, J. Chen, X. Luo, J. Li, and X. Xing,
“Pre-service fatigue screening for construction workers
through wearable EEG-based signal spectral analysis.”
Autom. Constr., vol. 106, p. 102851, 2019.
N. Sheibani Asl, et al.
FBT, Vol. 8, No. Supple 1 (2021) 59-63 63
31- A. Javed, M. U. Arshad, E. Saeed, and N. Naseer, “Real-
time Drowsiness Detection and Emergency Parking
using EEG.” 2021.
32- M. Azam, D. Jacoby, and Y. Coady, “Classification of
Fatigue in Consumer-grade EEG Using Entropies as
Features.” pp. 13–26, 2020, doi: 10.5121/csit.2020.100902.
33- S. Chaabene, B. Bouaziz, A. Boudaya, A. Hökelmann, A.
Ammar, and L. Chaari, “Convolutional neural network for
drowsiness detection using eeg signals.” Sensors, vol. 21,
no. 5, pp. 1–19, 2021, doi: 10.3390/s21051734.
34- J. Dunbar, J. E. Gilbert, and B. Lewis, “Exploring
differences between self-report and electrophysiological
indices of drowsy driving: A usability examination of a
personal brain-computer interface device.” J. Safety Res.,
vol. 74, pp. 27–34, 2020.
35- R. Foong, K. K. Ang, Z. Zhang, and C. Quek, “An
iterative cross-subject negative-unlabeled learning
algorithm for quantifying passive fatigue.” J. Neural
Eng., vol. 16, no. 5, p. 56013, 2019.
36- A. Mehreen, S. M. Anwar, M. Haseeb, M. Majid, and
M. O. Ullah, “A hybrid scheme for drowsiness detection
using wearable sensors.” IEEE Sens. J., vol. 19, no. 13,
pp. 5119–5126, 2019.
37- A. Jones and G. Schwartz, “Using brain-computer
interfaces to analyze EEG data for safety improvement.”
Team Res. Ubiquitous Secur. Technol., 2010.
38- H. S. Alzu’Bi, W. Al-Nuaimy, and N. S. Al-Zubi,
“EEG-based driver fatigue detection.” Proc. - 2013 6th
Int. Conf. Dev. eSystems Eng. DeSE 2013, pp. 111–114,
2013, doi: 10.1109/DeSE.2013.28.
39- I. Shin, B. Setiawan, F. Samopa, H. Suryotrisongko, F.
J. Atletiko, and R. P. Wibowo, “Development of
drowsiness detection system with analyzing attention
and meditation wave using support vector machine
method,” ISICO 2013, vol. 2013, 2013.
40- C.-K. A. Lim, W. C. Chia, and S. W. Chin, “A mobile
driver safety system: Analysis of single-channel EEG on
drowsiness detection.” in 2014 International Conference
on Computational Science and Technology (ICCST),
2014, pp. 1–5, doi: 10.1109/ICCST.2014.7045175.
41- T. Nguyen, S. Ahn, H. Jang, S. C. Jun, and J. G. Kim,
“Utilization of a combined EEG/NIRS system to predict
driver drowsiness.” Sci. Rep., vol. 7, no. March, pp. 1–
10, 2017, doi: 10.1038/srep43933.
42- N. Pham et al., “WAKE: A behind-the-ear wearable
system for microsleep detection.” MobiSys 2020 - Proc.
18th Int. Conf. Mob. Syst. Appl. Serv., pp. 404–418,
2020, doi: 10.1145/3386901.3389032.
43- M. Jagannath and V. Balasubramanian, “Assessment of early
onset of driver fatigue using multimodal fatigue measures in a
static simulator.” Appl. Ergon., vol. 45, no. 4, pp. 1140–1147,
2014, doi: https://doi.org/10.1016/j.apergo.2014.02.001.
Copyright © 2021 Tehran University of Medical Sciences. This work is licensed under a Creative Commons Attribution-NonCommercial 4.0 International license (https://creativecommons.org/licenses/by-nc/4.0/). Noncommercial uses of the work are permitted, provided the original work is properly cite d.
Frontiers in Biomedical Technologies Vol. 8, No. Supple 1 (2021) 64-66
Investigating the Effect of Stimulus Type on Electroencephalogram Signal in
a Brain-Computer Interface System with Interaction Error
Sara Sepehri Shakib, Farnaz Ghassemi *
Department of Biomedical Engineering, Amirkabir University of Technology, Tehran, Iran
*Corresponding Authors: Farnaz Ghassemi Email: [email protected]
Abstract
Brain-Computer Interface (BCI) systems can provide a new channel of communication between human thoughts
and machines. Although BCI systems exhibit several advantages, they yet have a long road ahead to reach the
flawless state. For example, error occurrence is one of the problems in these systems, leading to error-related
potentials in the brain signal. In this study, Electroencephalogram (EEG) signals in the condition of system error
occurrence are investigated. Since local information of the EEG signal channels alone cannot reveal the secrets
of the brain, brain functional connectivity was used as a feature in this research. The findings of this study showed
that using brain functional connectivity features along with local features can improve the performance of BCI
systems.
Keywords: Electroencephalogram; Brain-Computer Interface; Error-Related Potentials; Brain Functional
Connectivity; Statistical Analysis.
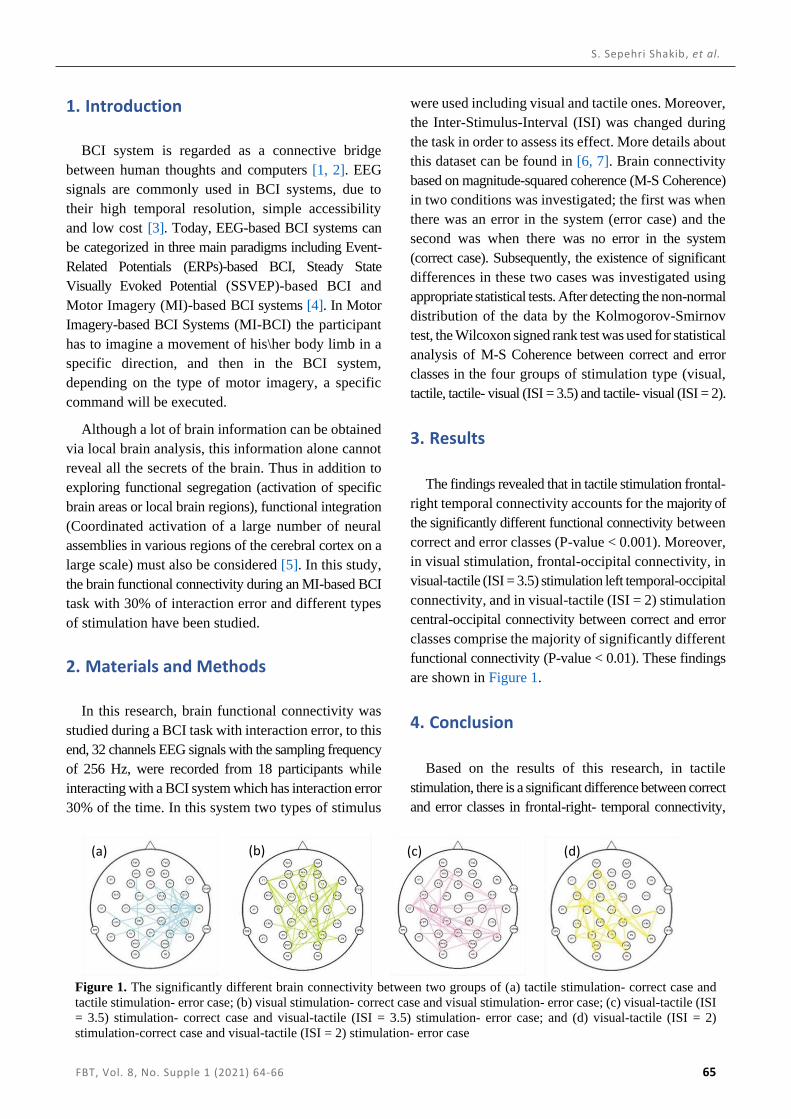
S. Sepehri Shakib, et al.
FBT, Vol. 8, No. Supple 1 (2021) 64-66 65
1. Introduction
BCI system is regarded as a connective bridge
between human thoughts and computers [1, 2]. EEG
signals are commonly used in BCI systems, due to
their high temporal resolution, simple accessibility
and low cost [3]. Today, EEG-based BCI systems can
be categorized in three main paradigms including Event-
Related Potentials (ERPs)-based BCI, Steady State
Visually Evoked Potential (SSVEP)-based BCI and
Motor Imagery (MI)-based BCI systems [4]. In Motor
Imagery-based BCI Systems (MI-BCI) the participant
has to imagine a movement of his\her body limb in a
specific direction, and then in the BCI system,
depending on the type of motor imagery, a specific
command will be executed.
Although a lot of brain information can be obtained
via local brain analysis, this information alone cannot
reveal all the secrets of the brain. Thus in addition to
exploring functional segregation (activation of specific
brain areas or local brain regions), functional integration
(Coordinated activation of a large number of neural
assemblies in various regions of the cerebral cortex on a
large scale) must also be considered [5]. In this study,
the brain functional connectivity during an MI-based BCI
task with 30% of interaction error and different types
of stimulation have been studied.
2. Materials and Methods
In this research, brain functional connectivity was
studied during a BCI task with interaction error, to this
end, 32 channels EEG signals with the sampling frequency
of 256 Hz, were recorded from 18 participants while
interacting with a BCI system which has interaction error
30% of the time. In this system two types of stimulus
were used including visual and tactile ones. Moreover,
the Inter-Stimulus-Interval (ISI) was changed during
the task in order to assess its effect. More details about
this dataset can be found in [6, 7]. Brain connectivity
based on magnitude-squared coherence (M-S Coherence)
in two conditions was investigated; the first was when
there was an error in the system (error case) and the
second was when there was no error in the system
(correct case). Subsequently, the existence of significant
differences in these two cases was investigated using
appropriate statistical tests. After detecting the non-normal
distribution of the data by the Kolmogorov-Smirnov
test, the Wilcoxon signed rank test was used for statistical
analysis of M-S Coherence between correct and error
classes in the four groups of stimulation type (visual,
tactile, tactile- visual (ISI = 3.5) and tactile- visual (ISI = 2).
3. Results
The findings revealed that in tactile stimulation frontal-
right temporal connectivity accounts for the majority of
the significantly different functional connectivity between
correct and error classes (P-value < 0.001). Moreover,
in visual stimulation, frontal-occipital connectivity, in
visual-tactile (ISI = 3.5) stimulation left temporal-occipital
connectivity, and in visual-tactile (ISI = 2) stimulation
central-occipital connectivity between correct and error
classes comprise the majority of significantly different
functional connectivity (P-value < 0.01). These findings
are shown in Figure 1.
4. Conclusion
Based on the results of this research, in tactile
stimulation, there is a significant difference between correct
and error classes in frontal-right- temporal connectivity,
Figure 1. The significantly different brain connectivity between two groups of (a) tactile stimulation- correct case and
tactile stimulation- error case; (b) visual stimulation- correct case and visual stimulation- error case; (c) visual-tactile (ISI
= 3.5) stimulation- correct case and visual-tactile (ISI = 3.5) stimulation- error case; and (d) visual-tactile (ISI = 2)
stimulation-correct case and visual-tactile (ISI = 2) stimulation- error case
(a) (b) (c) (d)

Studying BCI Systems with Interaction Error
66 FBT, Vol. 8, No. Supple 1 (2021) 64-66
and also in visual- tactile (ISI = 3.5) stimulation, there
is significant difference between left- temporal with
occipital regions and it is in line with the previous
study because of involving the temporal lobe [8-10].
Previous studies have shown that visual cortex is
located in occipital regions and these part of the brain
is mostly activated in response to a visual stimulus [11].
In the visual stimulation of the current research, most
significant differences was seen in frontal-occipital
connectivity, and also in visual- tactile (ISI = 2) stimulation,
there is significant difference between correct and
error classes in central-occipital connectivity which is
in line with the effect of visual stimulation [8-11]. This
study showed that examining functional integration, in
addition to examining functional segregation, could
help improve brain-computer interface systems performance.
References
1- E. Shamsi et al., "Classification of the EEG Evoked by
Auditory with a Periodic Carrier frequency Coding in
order to be Used in Systems.",Frontiers in Biomedical
Technologies, 2016.
2- J. R. Wolpaw, N. Birbaumer, D. J. McFarland, G.
Pfurtscheller, i T. M. Vaughan, "Brain-computer interfaces
for communication and control.", Clinical Neurophysiology,
vol. 113, núm. 6. Elsevier, p. 767-791, 01-juny-2002.
3- A. Buttfield, P. W. Ferrez, i J. D. R. Millán, «Towards a
robust BCI: Error potentials and online learning», en
IEEE Transactions on Neural Systems and
Rehabilitation Engineering, vol. 14, núm. 2, p. 164-168,
2006.
4- A. Nouri i K. Azizi, "Introducing a Convolutional Neural
Network and Visualization of its Filters for Classification of
EEG Signal for SSVEP Task.", Front. Biomed. Technol.,
vol. 7, núm. 3, p. 151-159, nov. 2020.
5- K. J. Friston, "Modalities, modes, and models in
functional neuroimaging.", American Association for the
Advancement of Science, p. 399-403, 16-oct-2009.
6- B. Ahkami, "Investigation of the effect of stimulus
presentation interval on the error-related potential in
electroencephalogram signal.",
Amirkabir(Polytechnique Tehran), 1397.
7- Bahareh Ahkami, Farnaz Ghassemi, "Adding Tactile
Feedback and Changing ISI to Improve BCI Systems’
Robustness: An Error-Related Potential Study."
accepted in the journal of Brain Topography subjected
to publication.
8- P. Luu, P. Collins, i D. M. Tucker, "Mood, personality,
and self-monitoring: Negative affect and emotionality in
relation to frontal lobe mechanisms of error
monitoring.", J. Exp. Psychol. Gen., vol. 129, núm. 1, p.
43-60, 2000.
9- M. Brázdil, R. Roman, M. Falkenstein, P. Daniel, P.
Jurák, i I. Rektor, "Error processing - Evidence from
intracerebral ERP recordings.", Exp. Brain Res., vol.
146, núm. 4, p. 460-466, set. 2002.
10- C. B. Holroyd i M. G. H. Coles, "The neural basis of
human error processing: Reinforcement learning,
dopamine, and the error-related negativity.", Psychol.
Rev., vol. 109, núm. 4, p. 679-709, 2002.
11- Y. L. Yang, H. X. Deng, G. Y. Xing, X. L. Xia, i H. F.
Li, "Brain functional network connectivity based on a
visual task: Visual information processing-related brain
regions are significantly activated in the task state.",
Neural Regen. Res., vol. 10, núm. 2, p. 298-307, 2015.

Copyright © 2021 Tehran University of Medical Sciences. This work is licensed under a Creative Commons Attribution-NonCommercial 4.0 International license (https://creativecommons.org/licenses/by-nc/4.0/). Noncommercial uses of the work are permitted, provided the original work is properly cited.
Frontiers in Biomedical Technologies Vol. 8, No. Supple 1 (2021) 67-77
Brain Stimulation and Prism in Dysgraphia
Shole Vatanparasti 1* , Anoshirvan Kazemnejad 2, Ali Yoonessi 3, Shahram Oveisgharan 4
1 Department of Cognitive Science, Institute for Cognitive Science Studies, Tehran, Iran
2 Department of Biostatistics, Faculty of Medical Sciences, Tarbiat Modares University, Tehran, Iran
3 Department of Neuroscience, School of Advanced Technologies in Medicine, Tehran University of Medical Sciences, Tehran, Iran
4 Rush Alzheimer's Disease Center, Rush University Medical Center, Chicago, IL, United States
*Corresponding Authors: Shole Vatanparasti Email: [email protected]
Abstract
Objectives: This study aimed to investigate influence of neglect and the effect of Prism Adaptation (PA)
combined with continuous Transcranial magnetic Theta Burst Stimulation (cTBS) on the dysgraphia
rehabilitation of Persian stroke patients with neglect. Ten patients with neglect and dysgraphia secondary to stroke
were randomly assigned to the intervention group and received PA combined with cTBS over the left parietal
cortex; the control group received PA combined with sham cTBS for 2 weeks in 10 daily sessions. Patients were
assessed for dysgraphia in a spontaneous writing task before and after intervention. Dysgraphia was classified
into omission, destruction, tilting, poor handwriting, distance, perseveration, and size errors. Neglect was
evaluated using the Star Cancellation Test (SCT) and the Line Bisection task (LBT). Activities of Daily Living
disability (ADL) were evaluated using the Catherine Bergego Scale (CBS). All patients showed significant
improvement in dysgraphia (measured using a spontaneous writing test), neglect (measured using SCT and LBT),
and ADL disability (measured using CBS) (p < 0.025). The PA+cTBS user group showed greater improvement
in ADL disability compared with the PA+sham cTBS group. Destruction and omission errors were the most
frequent errors in dysgraphia. Neglect and rehabilitation influences the writing system in stroke patients. PA
combined with cTBS had more beneficial effects on ADL in stroke patients with neglect in compared to the PA.
Both approaches improved dysgraphia, ADL disability and neglect symptoms.
Keywords: Rehabilitation; Neglect; Agraphia; Writing; Prism Adaption; Continuous Transcranial Magnetic
Theta-Burst Stimulation.

Brain Stimulation and Prism in Dysgraphia
68 FBT, Vol. 8, No. Supple 1 (2021) 67-77
1. Introduction
Agraphia caused by acute right parietal infarction
and lesion in the right hemisphere of the brain is often
the cause of a non-aphasic disorder of agraphia and
writing known as spatial agraphia or dysgraphia
(constructive errors in writing) [1-6]. Dysgraphia is
defined by inscribing errors which commonly contain
missing elements, destruction mistakes, omissions,
tilting, and addition errors. These errors have been
observed in patients of different languages, such as
Spanish [4], Japanese [3]), French [7], English [8], and
Korean, with stroke in the right-brain area [9-11].
Dysgraphia due to stroke in the right-brain area has
various forms related with the specific writing system
of a given language. For instance, Japanese stroke
patients demonstrated the disorder associated with
ideograms in kanji writing but not with phonograms in
kana [3]. However, these language-specific
constructive errors of writing are not quite accepted;
they may be modified by graphemic systems that need
visuospatial processing, have a convened array of
letters of the alphabet, and require a rehabilitation
strategy of the letters of the alphabet [3, 9, 10, 12-15].
Visuospatial neglect and rehabilitation have been
shown to influence dysgraphia [7]. PA as a single
nonpharmacological therapeutic approach has been
shown to be effective on dysgraphia [7], neglect, and
disability in daily activities following stroke [16, 17].
Stroke studies in cognitive neuroscience with
transcranial magnetic stimulation have been shown to
treat neurological dysfunction and neglect [18]. Prism
adaptation is possible to improve rehabilitative effects
when combined with brain stimulation. However, the
combination of PA with transcranial magnetic
stimulation has not been evaluated for dysgraphia,
neglect, and disability in daily activities. To examine
the effectiveness of transcranial magnetic stimulation
combined with prism adaptation in the rehabilitation
of dysgraphia, a pilot, randomized, sham-controlled
clinical trial of patients with dysgraphia due to stroke-
induced neglect was designed and conducted.
Accordingly, patterns in constructive errors of writing
were detected to improve dysgraphia. The Persian
(Farsi) alphabet includes 32 letters and words are
located from right to left for spatial structure.
Nevertheless, no study to date has examined the
relation between dysgraphia and neglect in patients
before and after rehabilitation. In this study, it was
hypothesized that cTBS would boost prism adaption
effects on improving dysgraphia, neglect, and ADL
disability test scores.
2. Materials and Methods
This pilot, interventional, sham-controlled, single-
blinded, randomized clinical trial was conducted in the
Stroke Unit of Tehran Medical Department of
Neurology, Shariati Hospital, Iran, from August 2017
to September 2018.
2.1. Subjects
Fifteen individuals enrolled in the study for cTBS
rehabilitation on visual neglect. Stroke patients with
visuospatial neglect, verified by MRI and clinical
examination, were enrolled and provided informed
consent for participation. Ten subjects had more than
5 years of grade school education. For this study, a
total of 10 patients were assigned using the block
randomization method into two groups of 5
participants. All 10 participants were right-handed.
The 8 (80%) men and 2 (20%) women were aged
between 46 and 77 years, and all had a grade school
education between 5 and 16 years. They were tested
for dysgraphia (constructive errors of writing) using
spontaneous writing. They were also asked to attend
10 sessions over a 2-week period of interventional
rehabilitation with prism adaption combined with
cTBS or sham cTBS. The assessments were done
before and after intervention. No follow-up was
performed. The inclusion criteria consisted of neglect
due to stroke, dysgraphia (constructive errors of
writing), and completion of more than 5 years of grade
school education, being right-handed, and having
suffered a right-brain stroke. The exclusion criteria
were having a previous history of a writing deficit,
cerebral edema, epilepsy, brain trauma, implanted
heart pacemaker, or pain, and the patients were aged
less than 18 and more than 80 years old. In terms of
stroke type, 6 (60%) participants had ischemic
compared to hemorrhagic cerebral infarction, and
stroke onset date was within the 6 months prior to
randomization in 4 (40%) patients. There was no
difference in age, gender, education level, sex,
chronic, acute, stroke type, and health status between
both groups (Table 1).

Sh. Vatanparasti, et al.
FBT, Vol. 8, No. Supple 1 (2021) 67-77 69
2.2. Assessment of Writing, Neglect, ADL
Disability and Measurement Technique
All participants were evaluated for dysgraphia
using spontaneous writing [10]. The Star Cancellation
Test (SCT) [19], the Line Bisection task [20, 21] for
neglect symptoms, and the Catherine Bergego Scale
(CBS) [22-24] for ADL disability were utilized.
Writing, neglect, and ADL were evaluated before and
after treatment. The experimental intervention group
underwent PA + cTBS. The control group underwent
PA + sham cTBS therapy.
In the writing task, patients were asked to
spontaneously write their name, address, and an
autobiographical memory including where, what, and
when on an A4-sized plain piece of paper before and
after the rehabilitation. Only constructive writing
errors were assessed as dysgraphia, and semantic
linguistic errors were not evaluated. Each error was
scored as one.
Previous studies have shown the classification of
dysgraphia into tilting and visuospatial omission in
accordance with the criteria determined by Yoon et al.
[10]. In this study, a new suggestion was made for the
detection of classification of dysgraphia in the writing
system. Dysgraphia patterns were detected and scored,
including increased distance between writing lines,
increased size writing, omission (meaning that the
writer ignores more than 50% of the left side of each
writing line and deletes one part of the grapheme),
destruction (errors were the creation of a nonexistent
form), tilting (meaning that the lines of writing are not
straight), poor handwriting style, and perseveration
(repetitions and additions in the writing).
The SCT is scored by counting the number of small
stars marked by the patients (a total of 100 small and
large stars; 50 small stars) on an A4 sheet of paper.
The number of stars marked was calculated on the left
side of the page. A score between 0 and 46% illustrates
unilateral visuospatial neglect.
In the Line Bisection task, patients were asked to
complete midpoint straight lines on an A4 sheet of
paper, bisect 12 lines on the left side of the page and
18 lines on the middle side of the page, and bisect 10
lines on the right side of the page. Scores range from
a deviation of severe neglect (32.10±21.70) to normal
range (0.61±0.12).
The CBS test was divided into two sections, an
attention item and a motor-exploratory item consisting
of real-life conditions such as dressing, mouth
cleaning, moving, finding personal belongings, eating,
gaze orientation, knowledge of left limbs, grooming,
auditory attention, and spatial orientation. The items
were scored from 0 to 3, and a total score of 30 was
possible for dependency regarding the activities of
daily living and neglect [22].
2.3. TMS Intervention
A MagPro X100 machine (Magventure Company,
Farum, Denmark) equipped with a commercially
available figure 8-coil was used for TMS. Motor
Evoked Potentials (MEP) were measured by attaching
active electrodes to the Abductor Pollicis Brevis
(APB) muscle on the right hand and reference
electrodes to the tendon on the right hand. Once the
largest motor evoked potentials at the lowest intensity
was implicated, it was stimulated ten times, and the
minimal intensity of stimulation showing a peak-to-
peak amplitude of 50 μV or above at least five times
was set as the Resting Motor Threshold (RMT). The
intervention group received continuous theta-burst
stimulation cTBS. Inhibitory protocol was 801 pulses
in 3 bursts at 30 Hz repeated every 100 ms (5 Hz, θ
rhythm) with 80% of RMT, and over P3 on the intact
parietal cortex, left-side based on the EG 10/20 system
in 10 sessions over a 2-week period [25]. Then, prism
glasses with a 10º right shift adaption mirror were
given to the patients for 20 minutes. The mirror box
(35*35*30 cm) was placed vertically. Patients
observed the reflection of the movement of the right
hand in the mirror. The control group underwent sham
magnetic stimulation by tilting the coil vertically (90º)
in 10 sessions over 2 weeks. Participants were blind to
the type of therapy they received. Stroke patients with
neglect tolerated the inhibitory cTBS treatment using
8-coil without any side effects.
2.4. Statistical Analysis
The student’s t-test and Fisher exact test were
employed to compare the groups (cTBS + PA vs. sham
cTBS+ PA) in continuous and dichotomous variables,
respectively. Then, repeated ANOVA model was used
to compare the pre-rehabilitation and post-
rehabilitation status of the groups by time factor and

Brain Stimulation and Prism in Dysgraphia
70 FBT, Vol. 8, No. Supple 1 (2021) 67-77
differences between the groups using the group ×
time factor of the repeated ANOVA model. For all
statistical analyses, a p-value less than 0.025 (0.05/2)
to reject null hypotheses was considered significant
after Bonferroni correction was applied [26].
Table 1. Patient’s characteristics†
N/Intervention
Ag
e (y
r.)
Sex
(M
/ F
)
Gra
de
sch
oo
l
edu
cati
on
Reg
ion
o
f st
rok
e:
P,
T,
F,
O,
IN,
TH
Tim
e si
nce
th
e st
rok
e
on
set:
th
e ch
ron
ic /
sub
-acu
te
Ty
pe
of
the
stro
ke:
I/H
wri
tin
g e
rro
rs
1) PA
46 F 16 RTH, S-A H Omission
2) PA 63 M 9 RO, RP S-A I Omission, destruction, size,
distance, tilting, poor handwriting
3) PA
70 M 16 RT, RF C I Tilting
4) PA 65 M 12 RT C I Omission, destruction, size,
distance, tilting
5) PA 67 M 16 RT, RF,
RP,TH
C H Destruction, perseveration, size.
tilting, poor handwriting
1) PA+TMS 62 M 12 RF, RT, RP S-A H Omission, destruction, size,
distance, tilting, perseveration, poor
handwriting
2) PA+TMS 77 M 5 IN S-A I Omission, destruction, size,
distance, tilting, poor handwriting
3) PA+TMS 53 M 12 RP C I Destruction, distance, size, tilting
4) PA+TMS 67 F 12 RT, RF, RP C I Omission, destruction, tilting,
perseveration, poor handwriting
5) PA+TMS 70 M 16 RT, RF, RP C H Omission, size, tilting, poor
handwriting
PA mean (SD)
PA+ cTBS mean
(SD)
P value†
60(10)
67(4.5)
p=0.09
p=0.7
7
14.2(
2.48)
10.80
(4.08)
p=0.4
2
F: p=0.50
P: p=0.73
T: p=0.73
TH: p=0.7
O: p=0.50
IN: p=0.50
p=0.73
p=0.2
6
6.80(4.43)
11.60(2.88)
p=0.66
†Dichotomous variables are compared with Fisher exact test and quantitative variables with t-test.
Abbreviations: P, Cortex parietal; T, Cortex temporal; F, Cortex Frontal; R, right; IN, internal capsule; TH, thalamus; O,
occipital; H, Intracranial hemorrhage; I, Intracranial ischemic; S-A, sub-acute; C, chronic; cTBS, continuous theta-burst
transcranial magnetic stimulation; PA, prism adaptation.
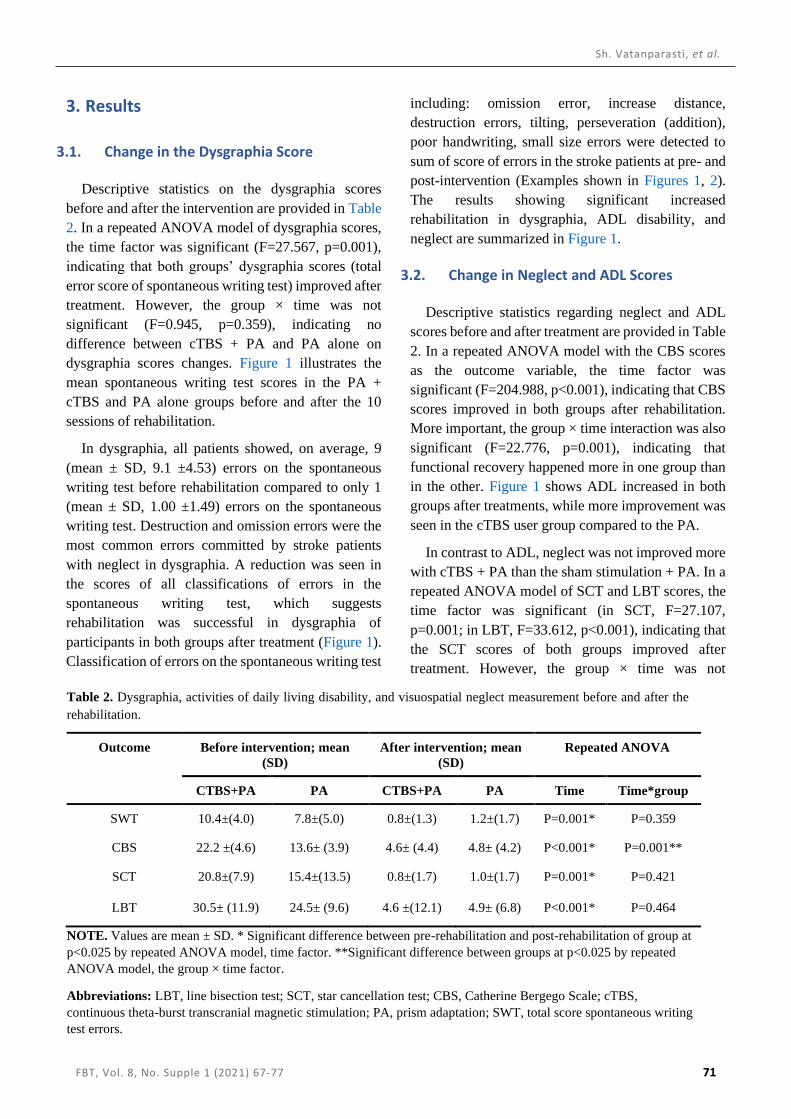
Sh. Vatanparasti, et al.
FBT, Vol. 8, No. Supple 1 (2021) 67-77 71
3. Results
3.1. Change in the Dysgraphia Score
Descriptive statistics on the dysgraphia scores
before and after the intervention are provided in Table
2. In a repeated ANOVA model of dysgraphia scores,
the time factor was significant (F=27.567, p=0.001),
indicating that both groups’ dysgraphia scores (total
error score of spontaneous writing test) improved after
treatment. However, the group × time was not
significant (F=0.945, p=0.359), indicating no
difference between cTBS + PA and PA alone on
dysgraphia scores changes. Figure 1 illustrates the
mean spontaneous writing test scores in the PA +
cTBS and PA alone groups before and after the 10
sessions of rehabilitation.
In dysgraphia, all patients showed, on average, 9
(mean ± SD, 9.1 ±4.53) errors on the spontaneous
writing test before rehabilitation compared to only 1
(mean ± SD, 1.00 ±1.49) errors on the spontaneous
writing test. Destruction and omission errors were the
most common errors committed by stroke patients
with neglect in dysgraphia. A reduction was seen in
the scores of all classifications of errors in the
spontaneous writing test, which suggests
rehabilitation was successful in dysgraphia of
participants in both groups after treatment (Figure 1).
Classification of errors on the spontaneous writing test
including: omission error, increase distance,
destruction errors, tilting, perseveration (addition),
poor handwriting, small size errors were detected to
sum of score of errors in the stroke patients at pre- and
post-intervention (Examples shown in Figures 1, 2).
The results showing significant increased
rehabilitation in dysgraphia, ADL disability, and
neglect are summarized in Figure 1.
3.2. Change in Neglect and ADL Scores
Descriptive statistics regarding neglect and ADL
scores before and after treatment are provided in Table
2. In a repeated ANOVA model with the CBS scores
as the outcome variable, the time factor was
significant (F=204.988, p<0.001), indicating that CBS
scores improved in both groups after rehabilitation.
More important, the group × time interaction was also
significant (F=22.776, p=0.001), indicating that
functional recovery happened more in one group than
in the other. Figure 1 shows ADL increased in both
groups after treatments, while more improvement was
seen in the cTBS user group compared to the PA.
In contrast to ADL, neglect was not improved more
with cTBS + PA than the sham stimulation + PA. In a
repeated ANOVA model of SCT and LBT scores, the
time factor was significant (in SCT, F=27.107,
p=0.001; in LBT, F=33.612, p<0.001), indicating that
the SCT scores of both groups improved after
treatment. However, the group × time was not
Table 2. Dysgraphia, activities of daily living disability, and visuospatial neglect measurement before and after the
rehabilitation.
Outcome Before intervention; mean
(SD)
After intervention; mean
(SD)
Repeated ANOVA
CTBS+PA PA CTBS+PA PA Time Time*group
SWT 10.4±(4.0) 7.8±(5.0) 0.8±(1.3) 1.2±(1.7) P=0.001* P=0.359
CBS 22.2 ±(4.6) 13.6± (3.9) 4.6± (4.4) 4.8± (4.2) P<0.001* P=0.001**
SCT 20.8±(7.9) 15.4±(13.5) 0.8±(1.7) 1.0±(1.7) P=0.001* P=0.421
LBT 30.5± (11.9) 24.5± (9.6) 4.6 ±(12.1) 4.9± (6.8) P<0.001* P=0.464
NOTE. Values are mean ± SD. * Significant difference between pre-rehabilitation and post-rehabilitation of group at
p<0.025 by repeated ANOVA model, time factor. **Significant difference between groups at p<0.025 by repeated
ANOVA model, the group × time factor.
Abbreviations: LBT, line bisection test; SCT, star cancellation test; CBS, Catherine Bergego Scale; cTBS,
continuous theta-burst transcranial magnetic stimulation; PA, prism adaptation; SWT, total score spontaneous writing
test errors.

Brain Stimulation and Prism in Dysgraphia
72 FBT, Vol. 8, No. Supple 1 (2021) 67-77
significant (in SCT, F=0.718, p=0.421; in LBT,
F=0.651, p=0.464), indicating no difference between
4. Discussion
The current pilot clinical trial showed that, in all
stroke patients with dysgraphia, visuospatial neglect
and disability in activities of daily living were
improved after 10 sessions of rehabilitation with PA +
cTBS and with PA + sham cTBS. The PA combined
with cTBS group showed a significantly greater
true and sham cTBS stimulation on changes to SCT
and LBT scores (Figure 1).
improvement in ADL compared with the group
receiving PA alone.
Dysgraphia was assessed in Persian stroke patients
with neglect. Dysgraphia was classified into omission,
destruction, tilting, poor handwriting style, distance,
perseveration, and size errors. The most frequent
errors were destruction and omission errors.
There is limited research into rehabilitation
approaches for adults with dysgraphia acquired after
Figure 1. Figure on the left side shows patients with classification of dysgraphia in the spontaneous writing test of
rehabilitation without writing practice before and after 10 sessions. Figure on the right side shows stroke patients’
scores in LBT, SCT, CBS and Spontaneous writing test (total errore) of rehabilitation without writing practice before
and after 10 sessions. All patients show to rehabilitation significantly in dysgraphia (measured using total errors of
spontaneous writing test), neglect (measured using LBT and SCT) and disability in activities of daily living (measured
using CBS). The PA+ cTBS group shows to significant greater improve in the activities of daily living measured by
CBS compared to the PA. Asterisks indicate results that were significant using repeated ANOVA model, time factor:
*P<0.025, the group × time factor: **P<0.025
Abbreviations: O-B, omission errors before rehabilitation; O-A, omission errors after rehabilitation; D-B, destruction
errors before rehabilitation; D-A, destruction errors after rehabilitation; S-B, size errors before rehabilitation; S-A, size
errors after rehabilitation; DIS-B,distance errors before rehabilitation; DIS-A,distance errors after rehabilitation; T-B,
tilting errors before rehabilitation; T-A, tilting errors after rehabilitation; P.H-B, poor handwriting style before
rehabilitation; P.H-A, poor handwriting style after rehabilitation; P-B, perseveration errors before rehabilitation; P-A,
perseveration errors after rehabilitation; total SWT-B, total score spontaneous writing test errors before rehabilitation;
total SWT-A, total score spontaneous writing test errors after rehabilitation; cTBS, continuous Theta-Burst
Transcranial Magnetic Stimulation; PA, prism adaptation; LBT, the Line Bisection Test; SCT, Star Cancellation Test;
CBS, the Catherine Bergego Scale; ADL, activity of daily living.
0
2
4
6
8
10
12
14
O-B
O-A
D-B
D-A S-
BS-
AD
IS-B
DIS
-A T-B
T-A
P.H
-BP
.H-A P-B
P-A
to
tal S
WT-
B t
ota
l SW
T- A
Mea
ns
of
Erro
rs
Classification of Dysgraphia Measurement
PA+ cTBS PA
-5
0
5
10
15
20
25
30
35
40
LBT.
b
LBT.
a
SCT.
b
SCT.
a
CB
S.b
CB
S.a
tota
l.b
tota
l.a
Neglect Neglect ADL Dysgraphia
Mea
n o
f n
egle
ct ,
AD
L an
d d
ysgr
aph
ia
Dysgraphia ,Neglect and Activity of daily livingRehabilitation
PA+ cTBS PA

Sh. Vatanparasti, et al.
FBT, Vol. 8, No. Supple 1 (2021) 67-77 73
Figure 2. The classification of dysgraphia used in this study. Figure on the left side of columns shows examples
of the response of the neglect patients with dysgraphia at before intervention. Those on the right side of columns
examples of the response of the neglect patients with dysgraphia of rehabilitation after 10 sessions without writing
practice

Brain Stimulation and Prism in Dysgraphia
74 FBT, Vol. 8, No. Supple 1 (2021) 67-77
stroke. Non-pharmacological approaches like PA
and cTBS were useful for dysgraphia in few clinical
trials [7, 27]. PA and cTBS have been shown to
rehabilitate visuospatial unilateral neglect and ADL
disabilities in some clinical trials [18, 28].
PA in the single case has been designed to improve
stroke-related neglect, and the result of rehabilitation
was improvement in dysgraphia and neglect
symptoms [7]. Improved neglect symptoms as a result
of rehabilitation may translate to improved
dysgraphia. Some trials used PA therapy for
visuospatial neglect and disabilities in the activities of
daily living with variable success rates. It was useful
for unilateral neglect and motor function disability in
some clinical trials [16, 17], yet PA therapy was not
useful in some other clinical trials [29, 30].
Differences in the trials include different designs of
lenses creating an optical right shift of 6º prism
compared to the 10º prism in the current study, and the
characteristics of the recruited stroke patients with
neglect can explain this disparity. No additional
improvement in dysgraphia and neglect-associated
test scores was found by coupling cTBS with our
rehabilitation techniques. One possible explanation is
the near complete rehabilitation effect of the
dysgraphia and neglect tests in both groups. All
patients showed, on average, 9 errors in dysgraphia
before rehabilitation compared to only 1 error in
dysgraphia after rehabilitation. Another explanation is
the fact that in the present study, the sham control
group and the experimental group at base received PA
treatment.
In contrast to PA, cTBS over intact parietal cortex
was found to be an effective non-pharmacologic
therapeutic approach in the treatment of unilateral
neglect [31-36]. Rehabilitation in disabilities in
activities of daily living and visuospatial unilateral
neglect is a result that was not generally found in
previous studies on neglect treatment with continuous
theta-burst stimulation. However, no functional
disability assessment was reported in some clinical
trials of neglect therapy [32, 37], and some trials
showed rehabilitation in disabilities in activities of
daily living with targeted treatment of unilateral
neglect [38-42]. In a randomized trial with three
groups of conventional rehabilitation, repetitive TMS
alone, and rTMS + sensory cueing, stroke patients
who received TMS therapy were better at neglect
during therapy compared with the conventional
rehabilitation group. Recovery from ADL was seen in
all patients across the three groups [38]. More
improvement in disabilities in activities of daily living
was seen in the present study compared with Yang et
al. (2017). This result is possibly due to differences in
the combination of treatments (cTBS + PA compared
to rTMS + sensory cueing), the trials’ designs due to
usage of the cTBS protocol instead of repetitive TMS,
and differences in the employed assessment measures
of the recruited patients. The combination of rTMS
and intensive speech therapy in four stroke patients
has been explored for aphasia with the aim of
improving speech deficit. The result of rehabilitation
was improvement in the degrees of aphasia and
dysgraphia with writing exercises [27]. The near
complete rehabilitation of dysgraphia in the current
study compared to Kakuda et al. (2011) is possibly due
to usage of the cTBS protocol over the parietal cortex
instead of rTMS over the frontal cortex, a more precise
test, difference in the employed evaluation measures,
and the combination of PA and cTBS instead of rTMS
and speech therapy.
In this study, it was hypothesized that the
rehabilitation combination stimulated and employed
more networks of the brain, which might improve
dysgraphia, neglect, and neurological function
disability in stroke patients. More studies are needed
with functional neuroimaging to verify this
hypothesis. In fact, previous studies have shown the
correlation between changes in functional
connectivity in the dorsal attention network,
recalibration of target position of eye and hand, spatial
realignment of various sensory-motor in PA [43, 44],
promotion of the front-parietal attention network, and
reduction in pathological hyperexcitability to have
pivotal roles in the visuospatial neglect in cTBS [32,
36, 45]. Changes in functional connectivity in the
brain network and the new mechanism of combined
rehabilitation may explain the implicit recovery effect
seen in stroke-induced dysgraphia, neglect, and the
greater improvement in ADL in the current study. In
contrast with the implicit recovery (without practice)
in dysgraphia, previous studies have been based on
writing, copying, spelling, and relearning with
practices in writing for errors in writing [12, 15].
Findings regarding the classification of constructive
errors in writing showed that destruction and omission

Sh. Vatanparasti, et al.
FBT, Vol. 8, No. Supple 1 (2021) 67-77 75
errors were the most common in Persian stroke
patients, and the result regarding omission errors was
consistent with a study of Korean patients [9, 10].
Likewise, constructive errors, such as left space
omission, in writing have been reported in people of
various languages, including Japanese [3], French [7],
Korean [10], and Spanish [4]. In contrast, right
omission was reported in left-handed patients with
neglect due to stroke involving damage to the left
parietal cortex instead of right-brain damage as in the
current study [8]. Previous studies, including that of
Dae-Hyun Jang et al., have reported right space
omission [9] (in the Persian graphic system it is
written from right to left and in Korean it begins with
a consonant on the left side), and the patients have
been educated to keep the strictly defined position for
the graphic system. This pattern of right space
omission could be specific to the Korean language.
The results regarding destruction error were consistent
with studies on Japanese in ideogram kanji writing [3],
Spanish [4], and Korean patients [1, 9, 10].
Duplication (perseveration) results were consistent
with studies on Spanish in Roman alphabetic systems,
Japanese in Kanji, Chinese characters in Kana, and
Korean Han-geul letters. Frontal-brain stroke patients
showed mostly perseveration (adding) errors [3, 4, 9,
10]. The brain processing of neglect patients has been
disturbed in estimating distance as a result of neglect-
related cognitive impairment, which may translate to
disturbance in distance, size, poor handwriting, and
tilting errors [1, 10, 46].
The present pilot study had a relatively small
sample size in only a single center with no follow up.
Although small sample size has been shown in all
previous study on dysgraphia [7, 12, 15, 27].
Characters of dictation and copy were not used for the
writing tests. Moreover, 40% of patients with neglect
in the current study were sub-acute after stroke. There
was no statistically significant difference between the
2 groups (PA + cTBS and PA) in baselines of time
since onset of chronic and acute phases after stroke
(Table 1). Likewise, TMS was used for sub-acute
stroke patients [36, 38-40]. The absence of a group of
patients undergoing continuous theta-burst
stimulation alone for comparison was one limitation
of the present study, although cTBS alone has been
done in a previous study on neglect and ADL
disability [41]. More research is needed to replicate
the current findings in a larger sampling size of stroke
patients with dysgraphia, neglect, and ADL.
The current study was the first clinical trial of PA
combined with cTBS therapy for dysgraphia, neglect,
and ADL.
In future, studies with larger sampling sizes and
embedded functional neuroimaging will help verify
more explicitly the results of the current study.
5. Conclusion
An influence was found between dysgraphia and
unilateral neglect in stroke patients. Dysgraphia
patterns were determined to improve increased
distance, increased size, omission, destruction, tilting,
poor handwriting style, and perseveration (addition).
The current results showed that dysgraphia and
neglect may be affected by rehabilitation and
educational strategies. In addition, neglect appears to
specifically affect the writing systems of stroke
patients. The novel c TBS+PA method and PA alone
could be potentially useful tools for rehabilitating
patients with stroke-induced dysgraphia, unilateral
neglect, and disabilities in performing activities of
daily living. The cTBS + PA users showed greater
improvement in ADL disability compared with
patients receiving PA alone. The cTBS enhances the
effect of PA for ADL in stroke patients.
Acknowledgments
The present study was approved by the Ethics
Committee of Iran University of Medical Sciences.
Written informed consent forms were obtained from
all eligible stroke patients with neglect
[IR.IUMS.REC.1396.93012334]. This study was
registered at the Iranian Registry of Clinical Trials [
IRCT20170423033606N3]. This work was supported
by the Iran Cognitive Sciences and Technologies
Council (Grant no.1446508).
The authors would like to thank the National Brain
Mapping Lab (NBML).
References
1- M. Lee, M. K. Suh, M. H. Lee, J. S. Lee, and S. Y. Moon,
"Agraphia caused by acute right parietal infarction,"

Brain Stimulation and Prism in Dysgraphia
76 FBT, Vol. 8, No. Supple 1 (2021) 67-77
Journal of Clinical Neuroscience, vol. 22, no. 4, pp. 758-
760, 2015.
2- G. Berlucchi and G. Vallar, "The history of the
neurophysiology and neurology of the parietal lobe,"
Handbook of clinical neurology, vol. 151, pp. 3-30, 2018.
3- K. Seki et al., "Effects of unilateral spatial neglect on
spatial agraphia of kana and kanji letters," Brain and
language, vol. 63, no. 2, pp. 256-275, 1998.
4- A. Ardila and M. RossELLI, "Spatial agraphia," Brain
and cognition, vol. 22, no. 2, pp. 137-147, 1993.
5- N. Cals, G. Devuyst, N. Afsar, T. Karapanayiotides, and
J. Bogousslavsky, "Pure superficial posterior cerebral
artery territory infarction in The Lausanne Stroke
Registry," Journal of neurology, vol. 249, no. 7, pp. 855-
861, 2002.
6- G. Berlucchi and G. Vallar, "The history of the
neurophysiology and neurology of the parietal lobe," in
Handbook of clinical neurology, vol. 151: Elsevier, 2018,
pp. 3-30.
7- G. Rode, L. Pisella, L. Marsal, S. Mercier, Y. Rossetti,
and D. Boisson, "Prism adaptation improves spatial
dysgraphia following right brain damage,"
Neuropsychologia, vol. 44, no. 12, pp. 2487-2493, 2006.
8- A. Caramazza and A. E. Hillis, "Spatial representation of
words in the brain implied by studies of a unilateral
neglect patient," Nature, vol. 346, no. 6281, p. 267, 1990.
9- D.-H. Jang, M.-W. Kim, K. H. Park, and J. W. Lee,
"Language-specific Dysgraphia in Korean Patients with
Right Brain Stroke: Influence of Unilateral Spatial
Neglect," Journal of Korean medical science, vol. 30, no.
3, pp. 323-327, 2015.
10- J. H. Yoon, M. K. Suh, and H. Kim, "Language-specific
dysgraphia in Korean stroke patients," Cognitive and
Behavioral Neurology, vol. 23, no. 4, pp. 247-255, 2010.
11- R. Cubelli, "A selective deficit for writing vowels in
acquired dysgraphia," Nature, vol. 353, no. 6341, p. 258,
1991.
12- L. Thiel and P. Conroy, "A comparison of errorless and
errorful therapies for dysgraphia after stroke,"
Neuropsychological rehabilitation, vol. 24, no. 2, pp. 172-
201, 2014.
13- L. Thiel, K. Sage, and P. Conroy, "Comparing uni-
modal and multi-modal therapies for improving writing in
acquired dysgraphia after stroke," Neuropsychological
rehabilitation, vol. 26, no. 3, pp. 345-373, 2016.
14- J. Marshall et al., "Technology‐enhanced writing
therapy for people with aphasia: results of a quasi‐
randomized waitlist controlled study," International
journal of language & communication disorders, 2018.
15- L. Thiel, K. Sage, and P. Conroy, "The role of learning
in improving functional writing in stroke aphasia,"
Disability and rehabilitation, vol. 38, no. 21, pp. 2122-
2134, 2016.
16- K. Mizuno, T. Tsuji, T. Takebayashi, T. Fujiwara, K.
Hase, and M. Liu, "Prism adaptation therapy enhances
rehabilitation of stroke patients with unilateral spatial
neglect: a randomized, controlled trial,"
Neurorehabilitation and neural repair, vol. 25, no. 8, pp.
711-20, Oct 2011, doi: 10.1177/1545968311407516.
17- N. Vaes et al., "Rehabilitation of visuospatial neglect by
prism adaptation: effects of a mild treatment regime. A
randomised controlled trial," Neuropsychological
rehabilitation, vol. 28, no. 6, pp. 899-918, Sep 2018, doi:
10.1080/09602011.2016.1208617.
18- F. T. Kashiwagi et al., "Noninvasive brain stimulations
for unilateral spatial neglect after stroke: A systematic
review and meta-analysis of randomized and
nonrandomized controlled trials," Neural plasticity, vol.
2018, 2018.
19- P. Halligan, J. Marshall, and D. Wade, "Visuospatial
neglect: underlying factors and test sensitivity," The
Lancet, vol. 334, no. 8668, pp. 908-911, 1989.
20- P. Guariglia, A. Matano, and L. Piccardi, "Bisecting or
not bisecting: this is the neglect question. Line bisection
performance in the diagnosis of neglect in right brain-
damaged patients," PloS one, vol. 9, no. 6, p. e99700,
2014.
21- M. Bonato, K. Priftis, R. Marenzi, and M. Zorzi,
"Modulation of hemispatial neglect by directional and
numerical cues in the line bisection task,"
Neuropsychologia, vol. 46, no. 2, pp. 426-433, 2008.
22- K. M. Goedert, P. Chen, A. Botticello, J. R. Masmela,
U. Adler, and A. M. Barrett, "Psychometric evaluation of
neglect assessment reveals motor-exploratory predictor of
functional disability in acute-stage spatial neglect,"
Archives of Physical medicine and Rehabilitation, vol. 93,
no. 1, pp. 137-142, 2012.
23- P. Azouvi, S. Olivier, G. De Montety, C. Samuel, A.
Louis-Dreyfus, and L. Tesio, "Behavioral assessment of
unilateral neglect: study of the psychometric properties of
the Catherine Bergego Scale," Archives of physical
medicine and rehabilitation, vol. 84, no. 1, pp. 51-57,
2003.
24- P. Azouvi, S. Jacquin-Courtois, and J. Luaute,
"Rehabilitation of unilateral neglect: Evidence-based
medicine," Annals of physical and rehabilitation
medicine, vol. 60, no. 3, pp. 191-197, 2017.
25- W. Yang et al., "Comparison of different stimulation
parameters of repetitive transcranial magnetic stimulation
for unilateral spatial neglect in stroke patients," Journal of

Sh. Vatanparasti, et al.
FBT, Vol. 8, No. Supple 1 (2021) 67-77 77
the neurological sciences, vol. 359, no. 1-2, pp. 219-225,
2015.
26- A. Dmitrienko and R. B. D’Agostino Sr, "Multiplicity
considerations in clinical trials," New England Journal of
Medicine, vol. 378, no. 22, pp. 2115-2122, 2018.
27- W. Kakuda, M. Abo, R. Momosaki, and A. Morooka,
"Therapeutic application of 6-Hz-primed low-frequency
rTMS combined with intensive speech therapy for post-
stroke aphasia," Brain injury, vol. 25, no. 12, pp. 1242-
1248, 2011.
28- S. Jacquin-Courtois et al., "Rehabilitation of spatial
neglect by prism adaptation: a peculiar expansion of
sensorimotor after-effects to spatial cognition,"
Neuroscience & Biobehavioral Reviews, vol. 37, no. 4,
pp. 594-609, 2013.
29- A. F. Ten Brink, J. M. Visser-Meily, M. J. Schut, M.
Kouwenhoven, A. L. Eijsackers, and T. C. Nijboer,
"Prism adaptation in rehabilitation? No additional effects
of prism adaptation on neglect recovery in the subacute
phase poststroke: A randomized controlled trial,"
Neurorehabilitation and neural repair, vol. 31, no. 12, pp.
1017-1028, 2017.
30- A. J. Turton, K. O'Leary, J. Gabb, R. Woodward, and I.
D. Gilchrist, "A single blinded randomised controlled
pilot trial of prism adaptation for improving self-care in
stroke patients with neglect," Neuropsychological
Rehabilitation, vol. 20, no. 2, pp. 180-196, 2010.
31- T. Nyffeler, D. Cazzoli, C. W. Hess, and R. M. Müri,
"One session of repeated parietal theta burst stimulation
trains induces long-lasting improvement of visual
neglect," Stroke, vol. 40, no. 8, pp. 2791-2796, 2009.
32- G. Koch et al., "Theta-burst stimulation of the left
hemisphere accelerates recovery of hemispatial neglect,"
Neurology, vol. 78, no. 1, pp. 24-30, 2012.
33- W. Fu et al., "Long-term effects of continuous theta-
burst stimulation in visuospatial neglect," Journal of
International Medical Research, vol. 43, no. 2, pp. 196-
203, 2015.
34- W. Yang et al., "Comparison of different stimulation
parameters of repetitive transcranial magnetic stimulation
for unilateral spatial neglect in stroke patients," Journal of
the neurological sciences, vol. 359, no. 1, pp. 219-225,
2015.
35- S. Hopfner et al., "Enhancing treatment effects by
combining continuous theta burst stimulation with smooth
pursuit training," Neuropsychologia, vol. 74, pp. 145-151,
2015.
36- W. Fu et al., "Continuous theta-burst stimulation may
improve visuospatial neglect via modulating the attention
network: a randomized controlled study," Topics in
sTroke rehabiliTaTion, vol. 24, no. 4, pp. 236-241, 2017.
37- W. Yang et al., "Comparison of different stimulation
parameters of repetitive transcranial magnetic stimulation
for unilateral spatial neglect in stroke patients," Journal of
the neurological sciences, vol. 359, no. 1-2, pp. 219-25,
Dec 15 2015, doi: 10.1016/j.jns.2015.08.1541.
38- N. Y. Yang, K. N. Fong, C. W. Li-Tsang, and D. Zhou,
"Effects of repetitive transcranial magnetic stimulation
combined with sensory cueing on unilateral neglect in
subacute patients with right hemispheric stroke: a
randomized controlled study," Clinical rehabilitation,
vol. 31, no. 9, pp. 1154-1163, 2017.
39- H. G. Cha and M. K. Kim, "Effects of repetitive
transcranial magnetic stimulation on arm function and
decreasing unilateral spatial neglect in subacute stroke: a
randomized controlled trial," Clinical rehabilitation, vol.
30, no. 7, pp. 649-656, 2016.
40- B. R. Kim, M. H. Chun, D.-Y. Kim, and S. J. Lee,
"Effect of high-and low-frequency repetitive transcranial
magnetic stimulation on visuospatial neglect in patients
with acute stroke: a double-blind, sham-controlled trial,"
Archives of physical medicine and rehabilitation, vol. 94,
no. 5, pp. 803-807, 2013.
41- D. Cazzoli et al., "Theta burst stimulation reduces
disability during the activities of daily living in spatial
neglect," Brain, vol. 135, no. 11, pp. 3426-3439, 2012.
42- T. Nyffeler et al., "Theta burst stimulation in neglect
after stroke: functional outcome and response variability
origins," Brain, vol. 142, no. 4, pp. 992-1008, 2019.
43- G. M. Redding, Y. Rossetti, and B. Wallace,
"Applications of prism adaptation: a tutorial in theory and
method," Neuroscience & Biobehavioral Reviews, vol.
29, no. 3, pp. 431-444, 2005.
44- K. Tsujimoto et al., "Correlation between changes in
functional connectivity in the dorsal attention network and
the after-effects induced by prism adaptation in healthy
humans: A dataset of resting-state fMRI and pointing after
prism adaptation," Data in brief, vol. 22, pp. 583-589,
2019.
45- M. Corbetta and G. L. Shulman, "Spatial neglect and
attention networks," Annual review of neuroscience, vol.
34, pp. 569-599, 2011.
46- G. Rode, C. Pagliari, L. Huchon, Y. Rossetti, and L.
Pisella, "Semiology of neglect: an update," Annals of
physical and rehabilitation medicine, vol. 60, no. 3, pp.
177-185, 2017.

Copyright © 2021 Tehran University of Medical Sciences. This work is licensed under a Creative Commons Attribution -NonCommercial 4.0 International license (https://creativecommons.org/licenses/by-nc/4.0/). Noncommercial uses of the work are permitted, provided the original work is properly cited.
Frontiers in Biomedical Technologies Vol. 8, No. Supple 1 (2021) 78-80
Evaluating the Effect of Increasing Working Memory Load on EEG-Based
Functional Brain Networks
Susan Samiei, Mehdi Delrobaei, Ali Khadem *
Department of Biomedical Engineering, Faculty of Electrical Engineering, K. N. Toosi University of Technology, Tehran, Iran
*Corresponding Authors: Ali Khadem Email: [email protected]
Abstract
Working Memory (WM) plays a crucial role in many cognitive functions of the human brain. Examining how the
characteristics of functional brain networks modulate with increasing WM load can help us have a more precise
understanding of the WM. To investigate the effect of increasing WM load on the functional network
characteristics, we used Electroencephalogram (EEG) data recorded from 21 healthy participants during a WM
task with three load levels (0-back, 2-back, and 3-back). The networks were constructed based on the weighted
Phase Lag Index (wPLI) in theta, alpha, and beta frequency bands. After identifying the significant wPLI values,
graph-theory metrics consisting of mean clustering coefficient, characteristic path length, and node strength were
analyzed by statistical tests. We revealed that in the 2-back and 3-back compared with 0-back, the alpha-band
functional integration and segregation were reduced. Moreover, node strength of channels located in the frontal,
parietal and occipital regions were decreased in the alpha-band.
These results indicate that analysis of topological properties of the alpha-band network can be an appropriate way
to explore task difficulty-related changes in the cortical regions of the human brain.
Keywords: Electroencephalogram; Working Memory; Functional Connectivity; Weighted Phase Lag Index;
Graph Theory.

S. Samiei, et al.
FBT, Vol. 8, No. Supple 1 (2021) 78-80 79
1. Introduction
WM refers to a short-term memory system that
enables temporary storage, retrieval, and manipulation
of information. WM plays a vital role in the complex
cognitive functions of the human brain, such as
reasoning, language comprehension, and learning [1].
Increasing the difficulty level of WM-related tasks can
increase the amount of load imposed on the WM
system. Most previous studies on WM have focused
on the effects of the presence of or change in WM load
on the activation of brain regions using various
imaging modalities and have identified specific
regions of the prefrontal and parietal cortices that are
activated during WM tasks [2]. Although brain
activation-based analysis provides valuable
information, a more precise comprehension of the
WM system would not be attainable without brain
connectivity analysis. Functional connectivity is
generally defined as the temporal dependency of
signals from different anatomical regions [3]. The
tools provided by graph theory can be used to describe
the properties of the reconstructed functional networks
[4].
In this study, we use EEG, phase-based
connectivity analysis, and graph theoretical measures
to investigate the effect of increasing WM load on the
characteristics of functional cortical networks during
a WM task with three load levels.
2. Materials and Methods
EEG data were collected by Shin et al. [5]. A total
of 28 electrodes were placed on the entire scalp
according to the 5–10 system with a sampling rate of
1000 Hz for 21 healthy participants during three n-
back task conditions (0-back, 2-back, and 3-back). The
preprocessing of the EEG data was done using
EEGLAB toolbox.
The wPLI between every pair of channels was
computed in theta (4-8 Hz), alpha (9-14 Hz), and beta
(15-30 Hz) frequency bands. To identify statistically
significant wPLI values, we applied non-parametric
permutation testing with 500 iterations. Therefore,
weighted undirected networks were constructed by
significant wPLI values and non-significant values
were set to zero. After network construction,
characteristic path length and mean clustering
coefficient were estimated to reflect global integration
and segregation of functional networks. In addition,
we calculated the local nodal connection strength,
which is the sum of weights of links connected to the
node. Then, the effect of task difficulty on network
measures was assessed using Friedman’s non-
parametric test (p < 0.05). Paired Wilcoxon signed-
rank tests were used for post hoc pairwise comparisons
with Bonferroni correction (p < 0.05) for global
measures and False Discovery Rate (FDR) adjustment
(q < 0.01) for the local measure of networks.
Figure 1. Significant task difficulty-related alterations in global network metrics
Figure 2. Significant task difficulty-related changes in node strength

Evaluating the Effect of Increasing Working Memory Load on EEG -Based Functional Brain Networks
80 FBT, Vol. 8, No. Supple 1 (2021) 78-80
3. Results
Significant task difficulty-related alterations in
global network metrics are shown in Figure 1. In the
alpha-band network, in the 2- and 3-back tasks
compared with the 0-back task, the mean clustering
coefficient, which is a measure of functional
segregation, decreased significantly (Figure 1A),
while the characteristic path length, which is a
measure that is inversely related to functional
integration., exhibited a statistically significant
increase (Figure 1B). In the beta-band network, the
mean clustering coefficient decreased significantly in
the 3-back task compared with the 0-back task (Figure
1C), while the characteristic path length exhibited a
significant increase (Figure 1D).
Significant task difficulty-related changes in node
strength are shown in Figure 2. In the alpha-band,
node strength decreased during increased mental
workload in most of the channels. However, these
differences were significant only in the 0-back vs. 2-
back and 0-back vs. 3-back for channels specified in
Figure 2.
These results indicate that analysis of topological
characteristics of alpha-band network based on graph
theory seems to be an appropriate way to explore task
difficulty-related changes in the cortical regions of the
human brain. Also, an effective combination of these
global and local metrics (particularly in the frontal
cortex) in the alpha-band network can be explored as
novel features for future BCI studies on improving
working memory capacity.
4. Conclusion
In this study, we constructed theta, alpha, and beta-
band wPLI networks and applied a graph-theoretical
approach to investigate the topological alterations of
the brain network during a WM task with three load
levels. Statistical analysis revealed that in the 2-back
and 3-back tasks compared with the 0-back task, the
alpha-band functional integration and segregation
were decreased, and the node strength of different
channels located in the frontal, parietal and occipital
regions were reduced in the alpha-band. These
findings demonstrate that alpha-band wPLI network
metrics have the potential of providing a more precise
understanding of the WM system.
References
1- A. Baddeley, “Working memory,” Curr. Biol., vol. 20,
no. 4, pp. R136–R140, 2010.
2- A. M. Owen, K. M. McMillan, A. R. Laird, and E.
Bullmore, “N‐back working memory paradigm: A meta‐
analysis of normative functional neuroimaging studies,”
Hum. Brain Mapp., vol. 25, no. 1, pp. 46–59, 2005.
3- M. P. Van Den Heuvel and H. E. H. Pol, “Exploring the
brain network: a review on resting-state fMRI functional
connectivity,” Eur. Neuropsychopharmacol., vol. 20, no.
8, pp. 519–534, 2010.
4- M. Rubinov and O. Sporns, “Complex network measures
of brain connectivity: uses and interpretations,”
Neuroimage, vol. 52, no. 3, pp. 1059–1069, 2010.
5- J. Shin, A. Von Lühmann, D.-W. Kim, J. Mehnert, H.-J.
Hwang, and K.-R. Müller, “Simultaneous acquisition of
EEG and NIRS during cognitive tasks for an open access
dataset,” Sci. data, vol. 5, p. 180003, 2018.

Copyright © 2021 Tehran University of Medical Sciences. This work is licensed under a Creative Commons Attribution -NonCommercial 4.0 International license (https://creativecommons.org/licenses/by-nc/4.0/). Noncommercial uses of the work are permitted, provided the original work is properly cited.
Frontiers in Biomedical Technologies Vol. 8, No. Supple 1 (2021) 81-86
Predicting Mini-Mental State Examination Scores Using EEG Signal Features
Vahid Asayesh 1, 2 * , Mahdi Dehghani 2, Majid Torabi 1, 2, Sepideh Akhtari Khosroshahi 1, Shahriar Gharibzadeh 1, 3
1 Asab Pajouhane Farda Research Company, Tehran, Iran
2 Asayesh Rehabilitation Clinic, Tabriz, Iran
3 Institute for Cognitive and Brain Sciences, Shahid Beheshti University, Tehran, Iran
*Corresponding Authors: Vahid Asayesh Email: [email protected]
Abstract
The purpose of this study is to use linear and non-linear features extracted from Electroencephalography (EEG)
signal to predict the Mini-Mental State Examination (MMSE) test score by machine learning algorithms. First,
the MMSE test was taken from 20 subjects that were referred with the initial diagnosis of dementia. Then the
brain activity of subjects was recorded via EEG signal. After preprocessing this signal, various linear and non-
linear features are extracted from it that are used as input to machine learning algorithms to predict MMSE test
scores in three levels. Based on the experiments, the best classification result is related to the Long Short-Term
Memory (LSTM) network with 68% accuracy. Findings show that by using machine learning algorithms and
features extracted from EEG signal the MMSE scores is predicted in three levels. Although deep neural networks
require a lot of data for training, the LSTM network has been able to achieve the best performance. By increasing
the number of subjects, it is expected that the classification results will also be increased.
Keywords: Mini-Mental State Examination; Electroencephalography Signal; Electroencephalography Feature
Extraction; Machine Learning Algorithms.

Prediction of MMSE Based on EEG Signal
82 FBT, Vol. 8, No. Supple 1 (2021) 81-86
1. Introduction
Cognitive impairment is a spectrum that ranges from
subjective cognitive decline to dementia [1]. Dementia
is a clinical syndrome that includes a group of disorders
related to cognitive decline that influence language,
presentation, memory, social abilities, etc. [2]. In 2013,
the World Health Organization (WHO) study [3]
estimated the top 20 leading causes of death in 2030
showing that non-communicable diseases such as
dementia will become the major threats to human lives.
Diagnosing dementia involves cognitive assessment
of brain functions, such as attention, memory,
problem-solving, thinking, and many other mental
abilities [4]. Cognitive assessments are usually
performed using veiled clinical tests [5]. One of these
tests is the MMSE test [6], which is widely used in
clinical and research studies to measure the severity and
progression of cognitive disorders. Although this test
can be used to follow the cognitive changes over time,
so it is an effective way to document the response to
treatment. This test consists of questions in five
different areas including orientation, memory, attention,
naming, follow verbal and written commands, write a
sentence spontaneously, and copy a complex polygon [6],
the answer to which leads to a score between 0
(greatest cognitive decline) to 30 (no cognitive
decline). The MMSE is the most widely used
screening tool for cognitive health but the manual
operation of this test restricts its screening within
primary care facilities [7]. This test is considered to be
too complicated, time-consuming, relatively costly for
certain clinical settings, and often requiring a trained
neuropsychologist or physician to administer the test in a
clinical setting [8]. Also, it can overestimate impairments
in those older than the age of 60 years and in with fewer
education subjects [9]. To overcome the above limitations,
automated methods can be used to predict the MMSE
score.
Recently, machine learning has been used to produce
an automatic prediction model. These algorithms have
been used to model information based on causal and/or
statistical data, explore hidden dependencies between
factors and diseases in a big data environment, and
detect various diseases such as liver malfunction, coronary
artery disease, and select genes for cancer detection.
Recently, machine learning techniques have been studied
for diagnosing dementia. For this aim, the algorithm is
trained using various cognitive impairment biomarkers
to learn the relationship between the input data and the
corresponding output variable (clinical diagnosis). Once
the learning process is completed, the algorithm can
yield predictions or classifications or with new data.
Farzana et al. [5] employ a set of automatically-extracted
psycholinguistic, discourse-based, lexicosyntactic, and
acoustic features for predicting clinical MMSE scores
using several machine learning techniques. Yancheva
et al. [8] use a set of semantic, lexical, syntactic, and
acoustic features extracted from speech samples to
predict MMSE scores by a bivariate dynamic Bayes
net. Youn et al. [9] were developed a machine learning
algorithm for the detection of cognitive impairment
based on the MMSE and Korean Dementia Screening
Questionnaire (KDSQ). They trained a logistic regression
using 24 variables including education duration, sex,
diabetes mellitus, age, etc. based on the training dataset
and then calculated its accuracy using the test dataset.
The author in [10] proposes a method for diagnosis
dementia by predicting MMSE scores using finger-tapping
measurement and a machine learning pipeline. This method
first selects finger-tapping attributes such as the number
of taps and standard deviation of the inter-tapping interval
with copula entropy and then predicts MMSE scores
from the selected attributes by predictive models. Authors
in [11] build a machine learning-based model for
predicting cognitive impairment among elderly people
using MMSE score. In this research, several machine
learning algorithms including random forest, naive Bayes,
logistic regression, and XGBoost were used to assess
the 3-year risk of developing cognitive impairment.
EEG is a neurodynamic time-sensitive biomarker
that helps in detecting cortical abnormalities associated
with cognitive decline and shows good performance in
diagnosing dementia [12-14]. EEG is also widely
available and faster to use than other imaging devices.
According to this, the purpose of this study is to use
linear and nonlinear features extracted from EEG
signals to predict the MMSE score by various machine
learning algorithms.
The rest of the paper is organized as follows: In section
2, steps of recording and preprocessing of EEG data,
feature extraction from them, and machine learning
algorithms are explained. In section 3, the results of the
classification using various algorithms are described. And
in section 4, the conclusion is presented.

V. Asayesh, et al.
FBT, Vol. 8, No. Supple 1 (2021) 81-86 83
2. Materials and Methods
2.1. Data Collection and Preprocessing
To predict the MMSE scores, first, the MMSE test
was taken from 20 subjects that referred with the initial
diagnosis of dementia. Based on the results of this test the
subjects were classified as T3 (MMSE: 28-30), T2
(MMSE: 24-27) or T1 (MMSE < 24) groups [15]. Then,
the brain activity of subjects was recorded via EEG according
to the international 10-20 system using Mitsar 19 channel
system. All the EEG electrode contact impedances were
maintained below 5 kΩ. To remove interferences from
EEG signals, a high-pass filter with a cut-off frequency
of 0.1 Hz, a low-pass filter with a cut-off frequency of
50 Hz, and a Notch filter with cut-off frequencies of
45 and 55 Hz were used. Independent Component
Analysis (ICA) algorithm has also been used to remove
blinking, eye movements and muscles artifacts.
2.2. Feature Extraction
After pre-processing the EEG signals, various linear
and non-linear features including kurtosis, skewness,
Interquartile Range (IQR), median, range, covariance,
entropy, coherence, and image coherence in the delta,
theta, alpha, beta, and gamma frequency bands, delta/theta,
delta/alpha, delta/beta, delta/gamma, theta/alpha, theta/beta,
theta/gamma, alpha/beta, alpha/gamma, and beta/gamma
power ratios, theta, alpha, beta, gamma, Alpha rhythm
Frequency (AF), and broadband central frequencies,
absolute and relative powers, alpha and alpha AF spectral
peaks, Individual Alpha spectral Frequency (IAF) are
extracted from them. A summary of the features extracted
from the EEG signal are shown in Table 1. In addition
to the features extracted from the EEG signal, due to the
relationship between cognitive decline and age, the age
of the subjects is also used as a feature. The combination
of features described above is used as input to the machine
learning algorithms. In order to create a hybrid feature,
each feature is placed in a row of the matrix as shown
in Figure 1.
2.3. Machine Learning Algorithms
Machine learning algorithms are trained using the
extracted features for the training dataset to detect the
MMSE scores of the test dataset. These algorithms include
Support Vector Machine (SVM), multi-layer perceptron
(MLP), Convolutional Neural Network (CNN), Long
Short-Term Memory (LSTM), and logistic regression
which are discussed below.
2.3.1. SVM
SVM is one of the supervised learning methods. In
the simplest type of this classifier, the training data set
can be categorized linearly with at least one hyper-plane.
Linear classifiers are inefficient for real problems that
have a nonlinear structure. One of the abilities of SVM
is to be converted to a non-linear learner, which is
done by mapping the features to a higher-dimensional
space [16]. The SVM used in this research is nonlinear
with a cubic kernel.
2.3.2. MLP
An artificial neural network is a mathematical
computational model that models the operation of
biological neural systems. In 1958, Rosenblatt [17]
Table 1. Features extracted from the EEG signal
• Kurtosis, Skewness, IQR, median, range,
covariance, entropy, coherence, and image
coherence in the delta, theta, alpha, beta, and
gamma frequency bands.
• Delta / theta, delta / alpha, delta / beta, delta /
gamma, theta / alpha, theta / beta, theta / gamma,
alpha / beta, alpha / gamma and beta / gamma
power ratios.
• Theta, alpha, AF, beta, gamma and broadband
central frequencies.
• Theta, alpha, alpha AF, beta, gamma and
broadband absolute powers.
• Theta, alpha, alpha AF, beta, gamma and
broadband relative powers.
• Alpha and alpha AF spectral peaks.
• IAF
[ Kurtosis in delta frequency bandKurtosis in theta frequency band ⋮Skewness in delta frequency bandSkewness in theta ferequency band ⋮Individual alpha frequency bandSubjects age ]
Figure 1. The procedure of the combine different
features to obtain a hybrid feature matrix

Prediction of MMSE Based on EEG Signal
84 FBT, Vol. 8, No. Supple 1 (2021) 81-86
introduced the first neural network called perceptron.
Perceptron is the basic unit of the concept of deep learning
and an artificial neuron that, when combined with other
components, is able to solve complex problems in
accordance with human function. Perceptron can be
considered as a binary classification algorithm that can
be used to divide a set of input signals into two categories,
0 and 1. Unlike other common classification algorithms,
this algorithm is inspired by the basic processing unit
of the human brain (neuron) and has the ability to learn
and solve complex problems. When several perceptrons
combine in layers, an artificial neural network called the
MLP is created. The MLP network that used in this
research consists of a hidden layer with 60 neurons.
2.3.3. LSTM
LSTM is an artificial recurrent neural network that
used in the field of deep learning. This network has
feedback connection thus it can process not only single
data points, but also entire sequences of data [18]. In
the LSTM network used in this research, after the
input layer, there are a dropout layer with a probability
of 0.3, LSTM layer with 70 neurons, a dropout layer
with a probability of 0.2, and fully connected, softmax,
and classification layers.
2.3.4. CNN
CNN is a class of artificial neural networks that is
designed to adaptively learn spatial hierarchies of features
through backpropagation by using multiple blocks, such
as convolution, pooling, and fully connected layers [19].
In the CNN used in this work, after the input layer,
there are convolutional layer with filter size 5, batch
normalization, max pooling, dropout with a probability
of 0.5, fully connected, softmax, and classification layers.
2.3.5. Logistic Regression
Regression methods describe the relationship between
a response variable and one or more explanatory variables.
The logistic regression model is the most frequently used
regression model for the analysis of data. The goal of an
analysis using this model is to find the best fitting to
describe the relationship between a dependent or response
variable and a set of independent or predictor variables
[20].
3. Results
Machine learning algorithms are trained using hybrid
features extracted from the EEG signals of 15 subjects
(training phase) to recognize the MMSE scores of 5 other
subjects (testing phase) using 5-fold validation method.
Criteria for evaluating classification results are accuracy,
sensitivity, and specificity. The accuracy of a machine
learning classification algorithm is one way to measure
how the algorithm classifies a data point correctly.
According to Equation 1, accuracy is the number of
correctly predicted data points out of all the data points.
𝐴𝐶𝐶 = 𝑇𝑃 + 𝑇𝑁
𝑇𝑃 + 𝑇𝑁 + 𝐹𝑃 + 𝐹𝑁 (1)
In this Equation, TP, TN, FP, and FN are respectively
show true positive, true negative, false positive and
false negative values.
According to Equation 2, sensitivity is the metric
that evaluates a model’s ability to predict the true
positives of each available category.
𝑇𝑃𝑅 = 𝑇𝑃
𝑇𝑃 + 𝐹𝑁 (2)
Based on Equation 3, specificity is the metric that
evaluates a model’s ability to predict the true negatives
of each available category.
𝑇𝑁𝑅 = 𝑇𝑁
𝑇𝑁 + 𝐹𝑃 (3)
The classification accuracy, specificity, and sensitivity
using different classifiers are shown in Figure 2. Based
on this figure, the best classification result is related to
the LSTM network with 68% accuracy. Sensitivity
and specificity are also in acceptable range in all
classifiers.
4. Conclusion
In this research, by training and testing different
machine learning algorithms using linear and
nonlinear features extracted from EEG signals and a

V. Asayesh, et al.
FBT, Vol. 8, No. Supple 1 (2021) 81-86 85
combination of them with subject’s age, the MMSE
score is predicted in three levels. Although deep neural
networks require a lot of data for training, in this work, the
LSTM neural network, which is suitable for processing
time series with a limited amount of data, has been able
to achieve the best performance with 68% accuracy. By
increasing the number of subjects, it is expected that
the classification results will also increase.
References
1- M. J. Kang et al., "Prediction of cognitive impairment via
deep learning trained with multi-center neuropsychological
test data," BMC medical informatics and decision making,
vol. 19, no. 1, pp. 1-9, 2019.
2- D. N. T. Doan et al., "Predicting Dementia With
Prefrontal Electroencephalography and Event-Related
Potential," Frontiers in Aging Neuroscience, vol. 13, p.
180, 2021.
3- W. H. Organization, Global tuberculosis report 2013.
World Health Organization, 2013.
4- R. C. Petersen, J. C. Stevens, M. Ganguli, E. G. Tangalos, J.
L. Cummings, and S. T. DeKosky, "Practice parameter: early
detection of dementia: mild cognitive impairment (an
evidence-based review): report of the Quality Standards
Subcommittee of the American Academy of Neurology,"
Neurology, vol. 56, no. 9, pp. 1133-1142, 2001.
5- S. Farzana and N. Parde, "Exploring MMSE Score
Prediction Using Verbal and Non-Verbal Cues," in
INTERSPEECH, 2020, pp. 2207-2211.
6- M. F. Folstein, S. E. Folstein, and P. R. McHugh, "“Mini-
mental state”: a practical method for grading the cognitive
state of patients for the clinician," Journal of psychiatric
research, vol. 12, no. 3, pp. 189-198, 1975.
7- Z. Fu, F. Haider, and S. Luz, "Predicting mini-mental status
examination scores through paralinguistic acoustic features
of spontaneous speech," in 2020 42nd Annual International
Conference of the IEEE Engineering in Medicine & Biology
Society (EMBC), pp. 5548-5552: IEEE, 2020.
8- M. Yancheva, K. C. Fraser, and F. Rudzicz, "Using
linguistic features longitudinally to predict clinical scores
for Alzheimer’s disease and related dementias," in
Proceedings of SLPAT 2015: 6th Workshop on Speech
and Language Processing for Assistive Technologies,
2015, pp. 134-139.
9- Y. C. Youn et al., "Detection of cognitive impairment
using a machine-learning algorithm," Neuropsychiatric
disease and treatment, vol. 14, p. 2939, 2018.
10- M. Jian, "Predicting MMSE Score from Finger-Tapping
Measurement," bioRxiv, p. 817338, 2019.
11- M. Hu, X. Shu, G. Yu, X. Wu, M. Välimäki, and H. Feng,
"A Risk Prediction Model Based on Machine Learning for
Cognitive Impairment Among Chinese Community-
Dwelling Elderly People With Normal Cognition:
Development and Validation Study," Journal of medical
Internet research, vol. 23, no. 2, p. e20298, 2021.
12- N. K. Al-Qazzaz, S. H. B. Ali, S. A. Ahmad, K.
Chellappan, M. Islam, and J. Escudero, "Role of EEG as
biomarker in the early detection and classification of
dementia," The Scientific World Journal, vol. 2014, 2014.
13- S. Sridhar and V. Manian, "EEG and Deep Learning Based
Brain Cognitive Function Classification," Computers, vol. 9,
no. 4, p. 104, 2020.
14- G. Anuradha and D. N. Jamal, "Classification of
Dementia in EEG with a Two-Layered Feed Forward
Artificial Neural Network," Engineering, Technology &
Applied Science Research, vol. 11, no. 3, pp. 7135-7139,
2021.
Figure 2. MMSE scores classification results using different machine learning algorithms
64 % 64 %
56 % 56 %
68 %
53.3 %48.8 %
40 %44.4 %
64.4 %
53.3 % 53.2 %
40 %45 %
62.4 %
0
10
20
30
40
50
60
70
80
SVM Logistic regression MLP CNN LSTM
Classification results
Accuracy Sensitivity Specificity

Prediction of MMSE Based on EEG Signal
86 FBT, Vol. 8, No. Supple 1 (2021) 81-86
15- J. Choi et al., "Resting-state prefrontal EEG biomarkers
in correlation with MMSE scores in elderly individuals,"
Scientific reports, vol. 9, no. 1, pp. 1-15, 2019.
16- W. S. Noble, "What is a support vector machine?," Nature
biotechnology, vol. 24, no. 12, pp. 1565-1567, 2006.
17- F. Rosenblatt, "The perceptron: a probabilistic model
for information storage and organization in the brain,"
Psychological review, vol. 65, no. 6, p. 386, 1958.
18- S. Hochreiter, "JA1 4 rgen Schmidhuber “Long Short-
Term Memory”, Neural Computation, vol. 9, no. 8, 1997.
19- R. Yamashita, M. Nishio, R. K. G. Do, and K. Togashi,
"Convolutional neural networks: an overview and
application in radiology," Insights into imaging, vol. 9, no.
4, pp. 611-629, 2018.
20- D. W. Hosmer Jr, S. Lemeshow, and R. X. Sturdivant,
"Applied logistic regression." John Wiley & Sons, 2013.