The Price of Sin 11 05 - Yale University
46
The Price of Sin: The Effects of Social Norms on Markets Harrison Hong Princeton University Marcin Kacperczyk University of British Columbia First Draft: June 2005 This Draft: November 2005 Abstract: We provide evidence for the effects of social norms on markets by studying “sin” stocks---publicly-traded companies involved in producing alcohol, tobacco, and gaming. We hypothesize that there is a societal norm to not fund operations that promote vice and that some investors, particularly institutions subject to norms, pay a financial cost in abstaining from these stocks. Consistent with this hypothesis, sin stocks are less held by certain institutions, such as pension plans (but not by mutual funds who are natural arbitrageurs), and less followed by analysts than other stocks. Consistent with them facing greater litigation risk and/or being neglected because of social norms, they outperform the market even after accounting for well- known return predictors. Corporate financing decisions and time-variation in norms for tobacco also indicate that norms affect stock prices. Finally, we gauge the relative importance of litigation risk versus neglect for returns. Sin stock returns are not systematically related to various proxies for litigation risk, but are weakly correlated with the demand for socially responsible investing, consistent with them being neglected. _____________________ We thank Douglas Diamond, Lorenzo Garlappi, Robert Heinkel, Narasimhan Jegadeesh, Lisa Kramer, Alan Kraus, Arvind Krishnamurthy, Jeffrey Kubik, Kai Li, Jose Scheinkman, Jeremy Stein, Rossen Valkanov, Jialin Yu, and seminar participants at Emory, McGill, Rutgers, Simon Fraser, the Pacific Northwest Finance Conference, the UBC Summer Conference for a number of helpful comments. Kacperczyk acknowledges research support from the Social Sciences and Humanities Research Council of Canada. Please address inquiries to [email protected] and [email protected] .
Transcript of The Price of Sin 11 05 - Yale University
The Price of Sin: The Effects of Social Norms on Markets
Harrison Hong Princeton University
Marcin Kacperczyk
University of British Columbia
First Draft: June 2005 This Draft: November 2005
Abstract: We provide evidence for the effects of social norms on markets by studying “sin” stocks---publicly-traded companies involved in producing alcohol, tobacco, and gaming. We hypothesize that there is a societal norm to not fund operations that promote vice and that some investors, particularly institutions subject to norms, pay a financial cost in abstaining from these stocks. Consistent with this hypothesis, sin stocks are less held by certain institutions, such as pension plans (but not by mutual funds who are natural arbitrageurs), and less followed by analysts than other stocks. Consistent with them facing greater litigation risk and/or being neglected because of social norms, they outperform the market even after accounting for well-known return predictors. Corporate financing decisions and time-variation in norms for tobacco also indicate that norms affect stock prices. Finally, we gauge the relative importance of litigation risk versus neglect for returns. Sin stock returns are not systematically related to various proxies for litigation risk, but are weakly correlated with the demand for socially responsible investing, consistent with them being neglected. _____________________ We thank Douglas Diamond, Lorenzo Garlappi, Robert Heinkel, Narasimhan Jegadeesh, Lisa Kramer, Alan Kraus, Arvind Krishnamurthy, Jeffrey Kubik, Kai Li, Jose Scheinkman, Jeremy Stein, Rossen Valkanov, Jialin Yu, and seminar participants at Emory, McGill, Rutgers, Simon Fraser, the Pacific Northwest Finance Conference, the UBC Summer Conference for a number of helpful comments. Kacperczyk acknowledges research support from the Social Sciences and Humanities Research Council of Canada. Please address inquiries to [email protected] and [email protected].

1
I. Introduction
Many social scientists believe that social norms are important in shaping economic
behavior and market outcomes, overriding at times even the profit motive.1 An early articulation
of this issue in economics is Becker (1957)’s model of discrimination. In his model, agents (e.g.,
employers) with discriminatory tastes (likely norms enforced by their community) pay for those
tastes in that they are willing to pay a financial cost to not interact with a particular class of
people. Arrow (1972) points out that a complete theory must also explain why entrepreneurs
without those discriminatory tastes and who could make profits by hiring labor cheaply from the
discriminated-against group fail to do so. Subsequent theories of social norms (e.g., Akerlof
(1980), Romer (1984)) provide sufficient conditions under which social customs that are
disadvantageous to the individual may nevertheless persist if individuals are sanctioned by loss of
reputation for disobedience of the custom.2
Empirical work in economics on the effects of social norms on markets centers on
measuring the extent of discrimination in the labor market. However, measuring discrimination
is difficult for a variety of reasons such as biases in self-reported data. More generally, empirical
tests have a difficult time distinguishing between taste- or norm-based versus information-based
models of discrimination, where economic actors have no animus, but discriminatory outcomes
arise nonetheless because of incomplete information and signaling. There is a large literature on
this issue with many papers developing clever techniques to identify the extent of racial
discrimination. The evidence supporting taste-based discrimination is mixed.3
In this paper, we provide new evidence on the effects of social norms by looking at an
unlikely place, the stock market. More specifically, we study the investing environment of “sin”
stocks---publicly-traded companies involved in the production of alcohol, tobacco, and gaming.
1 There are various definitions of social norm or custom. Following Akerlof (1980), a social norm or custom is an act whose utility to the agent performing depends in some way on the beliefs or actions of other members of the community. 2 See Elster (1989) for a review of social norms and economic theory. 3 For a survey, see Altonji and Blank (1999) and for a recent summary of this work, see Levitt (2003).

2
This is an ideal setting to study the effects of social norms on markets for several reasons. First,
there is clearly a societal norm to not fund operations that promote human vice and many
investors may not want or may not want others to support these companies by investing in their
stocks. Recent anecdotal evidence in support of this premise is the rise of socially responsible
investment as a mutual fund asset class in which managers screen their investments to rule out
sinful stocks such as alcohol, tobacco, and gaming.4 Second, we are able to access a rich set of
data on investor behavior, stock pricing, and firm behavior, which allows us to more finely
discriminate among alternative hypotheses than do existing empirical studies of social norms.
Third, following such a norm for an individual can be financially costly, i.e. investors pay
for their discriminatory tastes à la Becker. To begin with, there is the cost of being unable to
diversify into publicly traded sin companies, though this cost is small since there are few of these
firms relative to the universe of stocks. Moreover, these sin stocks, as we show below, tend to
behave like value stocks (stocks with low price-to-book or price-to-earnings ratios) and have
historically outperformed the market. Finally, Geczy, Stambaugh, and Levin (2003) find that
from the perspective of an investor who seeks to create an optimal portfolio from mutual funds,
limiting oneself to funds that include social objectives in their investment policies can be very
costly. For instance, an investor who believes that returns are generated by a multifactor pricing
model can incur a certainty-equivalent cost of 30 basis points per month, whereas an investor who
believes in managerial skill can incur a cost of more than 100 basis points per month.
Importantly, these calculations take as given that there are few publicly traded sin stocks in the
first place, though this number is likely to be endogenous, depending on the degree to which
investors shun them because of social norms.
We test the following predictions. First, the shares of sin stocks should be less held by
institutions subject to social norms. These are institutions whose positions in stocks are public
4 Estimates by the Social Investment Forum reports that this asset class totals about $2.34 trillion dollars in 2001 or roughly 12% of the total assets under management (see Geczy, Stambaugh, and Levin (2003)).

3
information, have to cater to diverse constituents, and are subject to scrutiny (i.e., picketing by an
unhappy minority). Examples include pension funds, universities, religious organizations, banks,
and insurance companies. In contrast, individual investors’ stock positions are unknown and out
of sight of the enforcers of societal norms. A similar logic suggests that sin stocks should be less
followed by sell-side analysts who produce financial reports and analyses on companies and who
tend to cater to institutional investors. Second, mutual funds or hedge funds are natural
arbitrageurs among these institutions. While even they may be subject to these constraints as
witnessed by the growth of the socially responsible investment class, we expect some of them to
flout social conventions and buy these stocks if they are ignored and priced cheaply.5
Third, sin stocks should behave like value stocks and outperform the market even after
accounting for well-known predictors of stock returns. There are two potential reasons for this.
The first is litigation risk since sin companies may face more lawsuits because of social norms.
Indeed, tobacco companies faced substantial litigation risk until their settlement with state
governments in 1997. The second is a pure neglect effect. The neglect of sin stocks by an
important set of investors such as institutions means, according to the logic in Merton (1987), a
lower stock price relative to its fundamental value because of limited risk-sharing. Indeed, many
practitioners believe that sin stocks are under-priced. For instance, David Berman (2002) writes
on why sin is good, “…sin stocks come with other advantages besides stability. Most of these
stocks have lower valuations than the overall market. Some of them also offer excellent
dividends. […] Finally, sin stocks tend to benefit from very conservative accounting because their
industries fall under considerable scrutiny from regulators.”6 Implicit in the neglect effect is that
5 An example of such a fund is the VICE fund which openly promotes holding vice stocks---however, these examples are rare and these funds are typically small. There are now even socially responsible hedge funds. Recently, the Bass brothers started one such fund. 6 See http://www.moneysense.ca/shared/print.jsp?content=20021127_154845_3424 to retrieve the article.

4
there is limited arbitrage, i.e. not enough arbitrage capital is brought to bear on sin stocks because
of a set of constraints and risks articulated by Shleifer and Vishny (1997) and others.7
Fourth, sin companies should finance their operations using relatively more debt than
equity if their stock prices are depressed. Moreover, debt markets tend to be less transparent than
equity markets, a desirable feature so as to avoid the eyes of social norms. Fifth, time-variation in
social norms should lead to changes in ownership structure and stock prices. And finally, in the
last part of our paper, we gauge the relative importance of litigation risk versus neglect for returns
by using various proxies for litigation risk and the demand for socially responsible investing.
The main part of our study focuses on the investing environment of sin stocks during the
period of 1962-2003. As we detail in Section II below, whereas alcohol and gaming have always
been considered sinful, tobacco does not become as such until the early- to mid-sixties with
publications of the link between smoking and cancer. We find evidence in support of all of our
predictions. To begin with, there are very few sin stocks---only 63 in the last year of our sample
and a total of 184 distinct companies from 1962-2003---compared to the universe of thousands of
stocks.8 They have less institutional ownership than other stocks (during the period of 1980-2003
when data is available) after controlling for a host of other firm characteristics, including those
that previous studies had found to explain the cross-sectional variation in this variable. These
characteristics are dummies for comparable industries (e.g., food, soda, meals, entertainment, and
hotels), firm size, firm beta, share price, past returns, and exchange listing. The typical firm in
our sample has about 24 percent of its shares held by institutions. Sin stocks have about a 13
percent lower institutional ownership ratio than other firms. In addition, sin stocks also have less
analyst coverage (during the period of 1976-2003 when data is available) after controlling for a
7 In other words, Arrow (1972) is right in pointing to entrepreneurial investors exploiting the discriminatory tastes of other investors, but there are not enough of them and so such tastes have an impact on stock prices. 8 If social norms impact sin companies, then there should not be many publicly-traded sin companies. However, it is hard to make the case that this is due to social norms, as opposed to any number of other technological or competitive factors.

5
host of firm characteristics. The typical firm in our sample has about 2.5 analysts covering it.
Sin stocks have 2.1 analysts, a 16 percent decline in coverage relative to the mean.
An alternative explanation for these findings is that institutions and analysts are rationally
ignoring these stocks because they do not consider it profitable to hold them or to cover them.
The analog to this alternative explanation in the discrimination literature is that employers are not
racist but are rationally not hiring certain groups for informational reasons. Importantly, when we
break down this analysis by types of institutions (banks, insurance companies, mutual funds,
independent investment advisors, and others, such as pension plans and universities), we find that
the shares of sin stocks are indeed not less held by mutual funds and independent investment
advisors, who are the natural arbitrageurs among these institutions.9 The alternative in which
institutions are smarter than individuals cannot reconcile why sin stocks are not less held by
mutual funds or hedge funds, who we think are likely to be the active and smart investors among
these institutions.
Given that arbitrageurs are not avoiding these stocks relative to others, do these social
norms have any effect on stock prices? The answer is yes. Sin stocks behave like value stocks
(stocks with low price-to-book or price-to-earnings ratios), which have historically tended to
outperform the market. Importantly, we find that even after accounting the loadings of the sin
portfolio on well-known determinants of expected returns such as the market, size, past return,
and market-to-book, a value-weighted portfolio of sin stocks significantly outperforms the market
by approximately 76 basis points per month and the alpha is statistically significant at the 1%
level of significance. The corresponding number for an equal weighted portfolio is 27 basis
points per month and is significant at the 10% level of significance. Using cross-sectional
regressions to measure returns yield similar results to these time-series regressions.
9 Independent investment advisor is a hodge-podge of different institutions that includes hedge funds. As such, it makes sense to include them with mutual funds as natural arbitrageurs.

6
If sin companies’ stocks are under-priced for social norm reasons (either litigation risk or
the neglect effect) as we argue, then we should find these companies financing their operations
using relatively more debt than equity. In addition, the same outcome should follow since debt
markets tend to be less transparent than equity markets.10 Using data from 1962-2003, we find
that sin companies have significantly higher leverage even accounting for the usual predictors of
capital structure. The typical firm in our sample has a market leverage of 28 percent. The market
leverage of sin companies is 13.9 percent higher than the mean.
We further validate our hypothesis by taking advantage of time-variation in social norms.
Unlike alcohol, tobacco was not considered a sin until the sixties. As such, we expect tobacco
stocks to look less like value stocks and to not outperform the market before the sixties and more
like value stocks and to outperform the market after the sixties---this is indeed what we find.
Finally, we find that the neglect effect is relatively more important than litigation risk in
explaining returns. First, the returns of tobacco stocks (subject to higher litigation risk) are not
significantly higher than the returns of other sin stocks such as alcohol and gaming (with little
litigation risk) during the period of 1965-2004. Second, tobacco stock performance after 1998 (a
period of substantially reduced litigation risk) was not different from earlier periods. Third,
tobacco stock returns are not significantly related to various proxies for litigation risk, such as the
fraction of income generated in foreign markets. The idea is that companies with more foreign
operations are less hit by lawsuits. However, we do find that sin stock returns have increased
over time as the demand for socially responsible investing has risen, consistent with them being
neglected (though this effect is not statistically significant).
These findings indicate that social norms can have important consequences for markets.
Our findings are likely to be lower bounds on the effects of social norms since many companies
operating in these industries may not become public precisely because they are shunned by many
10 We provide evidence below on the differences in transparency between debt and equity markets. This auxiliary prediction also cuts against alternative hypothesis related to peso-type arguments, in which institutions expected (with small probability) bad outcomes for sin stocks that never materialized.

7
investors. Our paper also offers a new context with which to study the effects of social norms on
markets. Our paper is related to Teoh, Welch, and Wazzan (1999), who look at the effect of the
boycott of South Africa’s apartheid regime. They find that for all the visibility associated with
the boycotts, there was little discernible effect either on the valuation of banks and corporations
with South African operations or on the South African financial markets. They do find some
weak evidence that institutional shareholdings increased when corporations divested.11 Our paper
is also related to an interesting paper by Heinkel, Kraus, and Zechner (2001) who develop a
model to consider the price implications of ethical investing that excludes companies that pollute.
Their price implications are similar to the ones tested here.
Our paper proceeds as follows. In Section II, we provide a history of sin stocks and
describe how we categorize these stocks. In Section III, we describe our data more generally. In
Section IV, we present the empirical results. Robustness checks and extensions are in Section V.
We conclude in Section VI.
II. Background on and Profile of Sin Stocks
While alcohol has always been considered sinful for religious reasons (in the United
States and many other countries), the smoking of tobacco, introduced to Europe in the mid-16th
century, has not.12 Indeed, most early European physicians subscribed to the Native American
belief that tobacco might be an effective medicine. It is only in the early 20th century, with the
growth of cigarette smoking, that articles addressing the adverse health effects of smoking began
to appear in scientific and medical journals. Studies beginning in 1930 led the American Cancer
Society to warn by 1944 about the ill effects of smoking, though most of the public was still
unaware of the statistical correlation between smoking and cancer. This changed, however, in
11 A related paper by Morse and Shive (2004) looks at the effect of loyalty or patriotism on portfolio choice across different states in the U.S. and across different countries using aggregate data. 12 The following material on tobacco is from a CNN website profiling the tobacco industry, http://edition.cnn.com/US/9705/tobacco/history. See Guiso, Sapienza, and Zingales (2003) for a more in depth analysis of religion and economic attitudes.

8
1952 when Reader’s Digest published an article, “Cancer by the Carton”, detailing the dangers of
smoking.
Despite the fact that the tobacco industry responded with marketing and studies of their
own, and hence holding off public opinion for another decade, this battle came to an end in the
early 1960’s with the formation of the Surgeon General’s Advisory Committee on Smoking and
Health. Convened in response to political pressures and a growing body of scientific evidence,
the committee released a 387-page report in 1964 unequivocally concluding that cigarette
smoking is causally related to lung cancer. In 1965, Congress passed the Federal Cigarette
Labeling and Advertising Act requiring surgeon general’s warnings on all packages and in 1971,
all broadcast advertising was banned.
Like alcohol, gambling has long been considered a vice and a sinful activity which
corrupts society. In most societies, gambling is heavily regulated because of concerns about
criminal involvement. Recently, beginning in the mid-to-late nineties, the deregulation of casino
gaming became a trend across the United States as a number of states, due to both political
referendums and budget concerns, allowed commercial gaming (in addition to Native American
casinos). According to the official report from the National Gambling Commission, twenty-six
states have joined Nevada and Atlantic City (New Jersey) in legalized casino style gaming by
1999.13 Hence, one could argue that by the late nineties gaming may be more socially acceptable,
though many surveys of individuals across many states indicate that public opinion still regards
gambling as sinful and inappropriate.14
We select sin stocks in the following manner. We start with the Fama and French (1997)
classification of stocks (by their SIC codes) into 48 industries. Stocks in Fama and French
industry group 4 (beer or alcohol) and industry group 5 (smoke or tobacco) are considered sin
13 For more information regarding this report and discussion of legislative changes in gaming, see Chen and Bin (2001). 14 See for instance surveys reported in congressional report on gaming found on http://www.library.ca.gov/CRB/97/03/.

9
stocks. Stocks with SIC codes 2100-2199 are in the beer group and those with SIC codes of
2080-2085 are in the smoke group. Unfortunately, their classification does not separate gaming
stocks from hotel stocks or other entertainment stocks. To this end, we need to use the NAICS
classification, which does explicitly label stocks as gaming. These are stocks with NAICS codes
of 7132, 71312, 713210, 71329, 713290, 72112, and 721120. In sum, sin stocks are the union of
the Fama and French (1997) industry groups 4 and 5 along with the NAICS group for gaming.
We will work with this expanded 49-industry group.
We then augment this list in the following manner. We download the COMPUSTAT
Segments Data, available from 1985-2003, which has information on the SIC and NAICS codes
of the different segments of a company. A stock is also considered a sin stock if any of its
segments has a SIC code in either the beer or the smoke group or an NAICS code in the gaming
group, as defined above. So, our final list of sin stocks is the union of two screening procedures--
-one from the Fama and French (1997) and NAICS classifications and the other from
COMPUSTAT segments data. The latter screen on company segment information allows us to
obtain a more accurate list of sin stocks since many companies such as Philip Morris, now known
as Altria, have diversified operations. We are unable to implement this augmentation for stocks
no longer in existence by 1985 since the segments data is available only after 1985. For stocks
listed before 1985 and still in existence after 1985, we back-fill this augmentation procedure---
i.e., a stock identified as sinful using the segments data will also be considered sinful throughout
its history.
A list of sin stocks (Center for Research in Security Prices (CRSP) permno, company
name, the first year in our data, and the last year in our data) can be obtained from the authors’
web-sites. There are many well-known names on this list such as Altria, Anheuser Busch Co.,
Bacardi, Ballys, Caesars, Loews, Mandalay, and Trump Hotels. We also performed some cross-
checks of this list with searches of popular books on sin investing (see, Ahrens (2004) and
Waxler (2004)) and on the internet to confirm the accuracy of this list. By and large, it looks like

10
our screening procedure yields an accurate and comprehensive list of stocks in the alcohol,
tobacco, and gaming industries.
Table 1 provides a more systematic year-by-year look at the number of our sin stocks
beginning in 1962 and ending in 2003. There are a total of 184 distinct names, with 27 distinct
tobacco companies, 62 alcohol companies, and 95 distinct gaming companies. Consistent with
our hypothesis, the first interesting thing to note is that there are not a lot of sin stocks (only 65
even in 2003) relative to the thousands of stocks in the universe. This is what one would expect
to see if investors shun them because of social norms, i.e. most sin companies are likely privately
held. While the numbers of tobacco and alcohol stocks have stayed relatively constant through
the years, the number of gaming stocks increased significantly in the nineties with the ongoing
deregulation of the gaming industry. This suggests that gambling may not be considered so sinful
as before -- i.e., there may be a slight change in social acceptability for gaming recently. Of
course, there can be a number of other reasons for these patterns.
To get a better feel for these sin stocks, in Panel B of Table 1, we calculate the market
beta for the period of 1962-2003 of the different industry portfolios using data from Fama and
French (1997). The market betas are calculated using the time-series of monthly returns on the
49 (value-weighted) industry portfolios (the original 48 Fama and French (1997) industries plus
gaming).15 The three portfolios of interest (beer, smoke, and gaming) have betas of 0.76, 0.74,
and 1.15, respectively. It looks like beer and smoke have somewhat lower betas during the period
of 1962-2003, as suggested by practitioners (the only industries with comparably small numbers
are utilities, food, gold, and oil), whereas gaming stocks have betas comparable to those of many
other industries.
While we focus on what is called the Triumvariate of Sin (alcohol, tobacco, and gaming),
two other classes of stocks are sometimes thought of as sinful. The first is the sex industry.
15 Note that in calculating these betas, we have not excluded the gaming stocks from the Fama and French portfolios. This is unlikely to bias the estimates of beta for the different industries much since there are so few gaming stocks.

11
However, there are very few publicly traded companies with heavy operations in sex.16 So
omitting these companies will not affect our results. The second is the defense industry. We
decided to leave out defense from the main analysis because it is not clear that defense is
considered a sin by many Americans. At the end of the paper, as a robustness exercise, we
broaden our definition of sin stocks by including stocks in Fama and French (1997) industry
grouping 26 (guns).
III. Data
With this list of sin stocks in hand, we then obtain information about them and other
stocks. Our data on U.S. firms come from the Center for Research in Security Prices (CRSP) and
COMPUSTAT. From CRSP, we obtain daily closing stock prices, daily shares outstanding, and
daily dollar trading volume for NYSE, AMEX and NASDAQ stocks for the period of 1962-2003.
From COMPUSTAT, we obtain annual information on a variety of accounting variables during
the same period. To be included in our sample, a firm must first have the requisite financial data
on CRSP and COMPUSTAT. We follow other studies in focusing on companies with CRSP
share codes of 10 or 11 and exclude firms with one-digit SIC codes of 6, which are in the
financial-services industry.17
Our data on the ownership structure comes from the CDA Spectrum Database of 13-F
filings by institutions (defined as those with greater than $100 million dollars in assets). This
data reports the holdings in terms of shares held by various classes of institutions of a company.
The five institution types are banks, insurance companies, mutual funds, independent investment
advisors (which includes hedge funds), and others (universities, pension plans, employee-
ownership plans). This 13-F filing is available quarterly, though most companies only file timely
16 Two big ones according to practitioners are Playboy Enterprises and the Barcelona-based Private Media Group. However, many big entertainment conglomerates profit off sex on cable through holdings in various subsidiaries that are difficult to track down. 17 Another sometimes used screen is to drop firms with book values less than 10 million dollars. We have also replicated our analyses below using this additional screen and found similar results.

12
reports on a semi-annual basis (at the end of June and end of December). Our analysis will focus
on the end of the year filings. Our data on analyst coverage comes from Institutional Brokers
Estimates System (IBES) database, which reports the number of analyst estimates of earnings
issued on a stock at various points in time (typically quarterly).
A. Variables for Ownership Regressions
Institutional ownership (IOit) is the fraction of the shares of a company held by
institutions (from the CDA Spectrum Database of 13-F filings). IO is calculated by aggregating
the shares held by all five types of institutions at the end of the year and then dividing this by
shares outstanding (Item 25 in COMPUSTAT) at the end of the year. LOGSIZEit is the log of
firm i’s market capitalization (price times shares outstanding) at the end of year t. LOGMBit is
the log of firm i’s market cap at the end of year t divided by its book value at the end of year t.
VARit is variance of daily (simple, raw) returns during year t. BETAit is the beta of the firm’s
industry (one of the 49 industry betas listed in Table 1). PRINVit is the inverse of the share price
at the end of the year. RETit is the average monthly return on stock i, also measured over the 12-
month period.
The summary statistics for these variables are in Panel A of Table 2. The time-series
average of the cross-sectional means of IO is 0.24 and the time-series average of the cross-
sectional standard deviations of IO is 0.22. In other words, in a typical year, a typical firm has
about 24% of its shares held by institutions and the standard deviation in a typical cross-section is
22%. The other variables are standard and do not merit discussion, except that their summary
statistics are similar to earlier studies.
B. Variables for Analyst Coverage Regressions
Our measure of analyst coverage is LOGCOVit, which is the log of one plus the number
of analysts covering firm i at the end of the year. Following earlier studies, stocks that do not

13
appear in IBES are assumed to have no analyst estimates.18 The other variables used in these
regressions are constructed in the same way as those for the ownership regressions. The
summary statistics for the period of 1976-2003 are reported in Panel B of Table 2. Note that the
time-series average of the cross-sectional means of LOGCOV is 0.91 and the time-series average
of the cross-sectional standard deviations is 0.99. So, in a typical year, a typical firm has about
2.5 analysts with a standard deviation of about 2.7 analysts. The summary statistics for the other
variables in Panel B differ slightly from those in Panel A because of different sample periods.
C. Variables for Cross-Sectional Return Regressions
EXMRETit is the monthly return of an individual stock net of the risk-free rate.
LOGSIZEit is defined as in Panel A, except that we calculate LOGSIZEit each month, as opposed
to just at the end of the year. The reason is that we will be running monthly cross-sectional
regressions of individual monthly stock returns on a host of lagged firm characteristics. BETAit
is simply the time-varying beta of the industry that the firm belongs to, calculated using the past
three years of monthly data. TURNit is the average daily share turnover in stock i -- defined as
shares traded divided by shares outstanding—during the month t. LOGMBit is the end of the
month log of the market-to-book ratio of stock i. And RETit is the average of the past twelve
month returns of stock i in month t (including the return in month t). The summary statistics are
reported in Panel C of Table 2.
18 If a stock does not have an analyst estimate at the end of the year, we look back through the year until it does and use this as the measure of analyst coverage for the firm during the year. Alternatively, we have also experimented with using October as a cut-off. In other words, if a stock does not have any analyst estimates in the last quarter, then it gets an entry as having zero analyst estimates.

14
D. Variables for Time-Series Return Regressions
EXSINPt is the monthly return net of the risk-free rate for an equal weighted portfolio of
sin stocks. MKTPREMt is the monthly return of the CRSP value-weighted portfolio net of the
risk-free rate. SMBt, HMLt, and MOMt are well-known portfolio returns downloaded from Ken
French’s web-site. SMB is the monthly return of a portfolio that is long small stocks and short
large stocks. HML is the monthly return of a portfolio that is long high book-to-market stocks
and short low book-to-market stocks. MOM is the return of a portfolio long past one-year return
winners and short past one-year return losers. The summary statistics for the various portfolio
returns are presented in Panel D of Table 2.
E. Variables for Corporate Financing Decision Regressions
Book leverage, denoted by BLEVit, is total debt divided by the sum of total debt and
book equity ((Item 9+Item 34)/(Item 9+Item 34+Item 216))---this is measured at fiscal year-end.
We also use market leverage, denoted by MLEVit, which is the same as BLEV except that we
replace Item 216 with a firm’s market capitalization (which is the average of the market
capitalization for that calendar year). CASH is cash balances (Item 1) over start-of-the-year book
assets (Item 6). PAYOUT is simply COMPUSTAT Item 115 minus preferred stock reduction
plus Item 21 all divided by net income (Item 172), where the preferred stock reduction is the
maximum between zero and the difference between previous year Item 10 and the current year
Item 10. We break down this payout variable into its constituent parts. DIVPAY is a firm’s
dividend payout ratio, which is Item 21 divided by Item 172. REP is a firm’s repurchases divided
by net income (Item 115 minus preferred stock reduction all divided by Item 172).
Tobin’s Q, TOBQ, is the market value of equity (price times shares outstanding from
CRSP) plus assets minus the book value of equity (Item 60+Item 74) all over assets. Asset

15
tangibility, TANG, is defined as net plant, property, and equipment (Item 8) divided by total
assets (Item 6) and expressed in percentage terms. Profitability, PROFIT, is defined as earnings
before interest, taxes, and depreciation (Item 13) divided by total assets and expressed in
percentage terms. LOGSALES is the log of net sales (Item 12).
IV. Results
A. Institutional Ownership
In this section, we test whether the shares of sin stocks are less held by certain institutions
(such as pension funds, universities, religious organizations, banks, insurance companies),
controlling for a host of other firm characteristics such as firm size and stock beta. Reasons for
why these institutions are less exposed to these stocks include their positions in stocks being
public information, them having to cater to diverse constituents, and them being subject to
scrutiny (i.e., picketing by an unhappy minority). In contrast, individual stock positions are
unknown and out of sight of the enforcers of societal norms.
Our objective is to see whether sin stocks have a different institutional investor following
than other stocks. Our task is complicated by the fact that sin stocks will differ from other stocks
in a number of other dimensions such as firm size or firm beta. Indeed, earlier research
uncovered a couple of firm characteristics such as firm size that are correlated with institutional
ownership.20 One reason for why firm size is correlated with ownership by institutions is that
institutions tend to avoid small stocks because of liquidity issues. In this paper, we are agnostic
about why certain firm characteristics tend to be correlated with ownership by institutions. We
only want to soak up as much of the cross-sectional variation as possible so that we can better
identify the differential effect of sin stocks compared to non-sin stocks.
To this end, we estimate the following cross-sectional regression specification:
20 For evidence related to predictors of institutional ownership, see Del Guercio (1996), Gompers and Metrick (2001).

16
IOit = a0 + a1 SINDUMit + a2 Xit + εit i=1,…,N (1)
where SINDUM equals one if the stock is a sin stock and zero otherwise; Xit is a vector of firm
characteristics and εit is measurement error. Xit includes various permutations of the following
variables, including LOGSIZE, BETA, LOGMB, PRINV, VAR, and RET defined as above.
Also included is NASD, a dummy that equals one if the stock is listed on NASDAQ and zero
otherwise, and SP500, a dummy variable that equals one if the stock is part of the S&P 500 index
and zero otherwise.
We worry about the critique that our SINDUM may simply be picking up an effect about
the type of industries they are in -- i.e., our sin stocks tend to be consumer goods and maybe
consumer goods differ from other industries in terms of attracting institutional ownership. To this
end, we create two new variables. The first and most straightforward one is ONEDIGDUM,
which equals one if a stock is in the same one-digit SIC code industry as the sin stocks and zero
otherwise. So our SINDUM effect would not be due to institutions favoring certain 1-digit SIC
code industries over others.
A more subtle but potentially more conservative way to deal with this concern is to find
comparables for our sin stocks. Fortunately, the following Fama and French (1997) industry
groups, 2 (food), 3 (soda), 7 (fun), and 43 (meals and hotels), provide natural comparables to our
sin stocks. Indeed, in some classifications, beer and soda are often lumped together as is tobacco
or smoke with food. And the gaming stocks are typically interspersed in fun and meals. So, we
create GDUM, which equals one if a stock has any of the following Fama and French (1997)
industry classifications 2 (food), 3 (soda), 4 (beer), 5 (smoke), 7 (fun), 43 (meals), and our 49th
industry (gaming) and zero otherwise. With GDUM as a control variable, our sin stock effect is
then not due to institutions favoring other industries over these consumer industries.
The coefficient of interest is a1, which measures whether sin stocks have a different
ownership structure than other stocks controlling for a host of different firm characteristics. The

17
null-hypothesis is that it is zero, whereas our prediction is that it will be significantly less than
zero. a2 is the vector of loadings on the control variables. We then take the estimates from these
annual regressions and follow Fama and MacBeth (1973) in taking their time-series means and
standard deviations (using Newey and West (1987) standard errors) to form our overall estimates.
The results of this estimation are reported in Panel A of Table 3. In column (1), we have
as independent variables SINDUM, ONEDIGDUM, LOGSIZE, BETA, NASD, and SP500. We
find that the coefficient in front of SINDUM is -0.0505 and is statistically significant at the 1%
level of significance. The mean institutional ownership in our sample is 24%. Sin stocks on
average have about 19% of its shares held by institutions, which is about a 21% shortfall relative
to the mean. The coefficient in front of ONEDIGDUM is positive but statistically insignificant.
Both LOGSIZE and BETA attract positive and statistically significant coefficients---i.e.,
institutions seem to favor big firms and firms from industries with high market betas. NASDAQ
stocks have less institutional ownership and the coefficient in front of SP500 is statistically
insignificant.21
In column (2), we replace ONEDIGDUM with GDUM. GDUM comes in with a
negative sign and is statistically significant, so institutions tend to shy away from consumer goods
relative to other industries. Including GDUM rather than ONEDIGDUM reduces the economic
effect of our SINDUM. The coefficient in front of SINDUM is now -0.0353 but it is still
statistically significant at the 1% level of significance. The economic effect is still sizeable as sin
stocks have about 20% of its shares held by institutions, which is a 15% shortfall relative to the
mean.
In columns (3)-(6), we successively experiment with different permutations of control
variables to illustrate the robustness of our finding. In column (3), we toss in LOGMB as an
additional control and in column (4), we use PRICEINV instead of LOGMB since these two
variables are highly correlated because both are scaled by price. PRICEINV seems to cut down 21 Falkentstein (1996) documents similar relations for a sample of mutual funds.

18
on our sin stock effect more than LOGMB, so we will use it instead of LOGMB in the remaining
specifications. In column (5), we add in VAR and find that it attracts a negative coefficient and is
statistically significant --- i.e., institutions tend to favor low variance stocks. And finally in
column (6), we add in the average monthly return over the past twelve months (RET). RET
attracts a negative coefficient and is also statistically significant. In each of these columns, the
coefficient in front of SINDUM is still statistically significant at the 1% level of significance.
And the economic effects are similar to that of column (2). For instance, in column (6), sin
stocks have a 13.4% lower institutional ownership ratio than the mean.22
Rather than using the Fama and MacBeth (1973) methodology with Newey and West
(1987) standard errors, we use an ultra-conservative method of running a pooled (panel)
regression and calculating standard errors by clustering at the industry level (using our 49
industry groupings). The worry is that the errors, conditional on the independent variables, are
correlated within industry groupings (e.g., Moulton (1986)). One reason why this may occur is
that if an institution decides to invest in a stock in a particular industry, it will also invest in
comparables in the same industry for reasons of liquidity or diversification. The Fama and
MacBeth (1973) methodology with Newey and West (1987) standard errors deal with this issue
somewhat since the standard errors come from the time-series and not the cross-section. But one
could always argue that the Newey and West (1987) standard errors make certain assumptions
about how the errors are correlated across time, whereas clustering makes less assumptions and
will likely end up giving us more conservative standard errors.23
The results are presented in Panel B. Notice that the coefficient estimates are similar in
magnitude to those in Panel A. So the economic effect of our SINDUM is similar to that of Panel
22 The cross-sectional relationship between ownership and these variables is very stable across years. (A table that reports this cross-sectional regression month by month is available on request.) The second thing to note is that the coefficient in front of SINDUM appears to get a little weaker later in our sample. We have a bit more to say about this below. 23 Where appropriate, we have additionally performed tobit regressions. The results of the tests remain qualitatively similar.

19
A. However, the ultra-conservative method of calculating standard errors does knock down the
significance of our estimates in front of SINDUM. Nonetheless, all of our specifications are
significant at the 10% level of significance. The only other noticeable difference is that the
coefficients in front of SP500 are now significant, whereas they were not in Panel A.
In Panel C, we rerun the ownership regression by different classes of institutions. Note
that for these regressions the data runs only from 1980 to 1997.24 Recall that the data breaks
down ownership information by five types of institutions: type 1 is banks, type 2 is insurance
companies, type 3 is mutual funds, type 4 is independent investment advisors, and type 5 is
others, which include universities, employee-stock ownership plans, etc. We expect type 3 and
type 4 institutions to be less constrained by social norms than the other three types of institutions
given that they are the natural arbitrageurs in the market. So we rerun specification (6) of Panel
A by two sub-groups: type 1, type 2, and type 5 in one group and type 3 and type 4 in another
group. That is, we create two new dependent variables: the first is the fraction of shares of a
company held by type 3 and 4 institutions; the second is the fraction of shares held by type 1, 2,
and 5 institutions. And we rerun specification (6) for these two new dependent variables.
Indeed, for the type 1, 2, and 5 institutions, the coefficient in front of SINDUM is
negative (-0.0236) and statistically significant. But the coefficient in front of SINDUM for the
type 3 and 4 institutions, while negative (-0.0077), is smaller in absolute magnitude and
statistically insignificant. Indeed, a t-test of the difference in the magnitudes between these two
coefficients (-0.0159) is statistically significant. In other words, sin stocks are not less held by
mutual funds and independent investment advisors. This fits with our hypothesis that mutual
funds and hedge funds are the most likely among institutions to play the role of arbitrageurs and
buy sin stocks if they are ignored and priced cheaply.
24 The reason we use this truncated sample is that the data breaking down ownership by types have problems after 1997 because of compatibility issues between the vendor Thomson Financial and the Wharton Research Database System, which distributes this data and many of the other data sets used in this paper. Many of the institutions erroneously get labeled as type 5 institutions after 1997. We have also run a pooled regression that includes data after 1997 and found similar results.

20
B. Analyst Coverage
A similar logic suggests that sin stocks should be less followed by sell-side analysts who
produce financial reports and analyses on companies. To test this prediction, we utilize the same
methodology as developed for institutional ownership. Indeed, this methodology is an extension
of that used by earlier studies on the determinants of analyst coverage, such as Hong, Lim, and
Stein (2000). To this end, we estimate the following cross-sectional regression specification
LOGCOVit = b0 + b1 SINDUMit + b2 Xit + εit i=1,…,N (2)
where SINDUM equals one if the stock is a sin stock and zero otherwise; Xit is a vector of firm
characteristics and εit is measurement error. Xit and the estimation methodology are the same as
described for regression specification (1).
The results are presented in Table 4 and the structure of the table is similar to Table 3,
except that we have analyst following on the left-hand side instead of ownership. As such, we
will quickly describe the results. In Panel A, notice that the coefficient in front of SINDUM is
negative and statistically significant across all six columns or specifications. In column (6), again
our most conservative specification, the coefficient in front of SINDUM is -0.1634 and is
statistically significant at the 1% level of significance. In terms of the raw number of analysts,
the typical firm has about 2.57 analysts covering it, whereas a sin stock has about 2.1 (about one-
half fewer analysts or a 16% decline relative to the mean). As for the other variables, they attract
coefficients that are similar to what has already been documented in Hong, Lim, and Stein (2000).
In Panel B, rather than using the Fama and MacBeth (1973) methodology with Newey
and West (1987) standard errors, we use the ultra-conservative method of running a pooled
(panel) regression and calculating standard errors by clustering at the industry level (using our 49
industry groupings). The economic effect of our SINDUM is similar to that of Panel A.
However, the ultra-conservative method of calculating standard errors does knock down the

21
significance of our estimates in front of SINDUM. Nonetheless, all of our specifications remain
significant at the 10% level of significance.
In sum, we have compelling evidence that sin stocks are less held or followed by certain
institutions and analysts who discriminate against sin stocks for social norm rationales and
arbitrageurs in the form of mutual funds and hedge funds (and individuals) buying these stocks in
their absence. These findings support Becker’s theory of racial discrimination by employers and
Arrow’s subsequent remark on other employers flouting social convention to take advantage of
unemployed, talented labor. The question that remains is whether social norms affect the prices
of sin stocks, i.e. is there enough arbitrage capital to completely eliminate any social norm
induced price effects?
C. Implications for Stock Prices
To address this question, we look at the return performance of sin stocks. If sin stocks
are neglected, as we claim, and there are limits to arbitrage, then we ought to find that sin stocks
outperform the market. But we have to keep in mind that this is not the only mechanism by
which sin stocks can out-perform the market. The other mechanism is that sin companies may
face more lawsuits because of social norms (e.g., tobacco companies) and have higher returns
because of litigation risk. We will attempt to gauge the relative importance of these two sources
of price effects in sub-section E below. In the interim, when we speak of social norm induced
price effects or expected returns, we lump together litigation risk and the neglect effect.
We employ two standard methodologies to study performance. The first and more
conventional methodology is using the time-series of the returns of a sin stock portfolio and
seeing how it fares after adjusting for various well-known predictors of stock returns such as the
market portfolio. The first model we estimate is the CAPM:
Rit = αi + βi VWRFt + εit t=1,…,T (4)

22
where Rit is the return net of the risk-free of various portfolios (EXSINP, a portfolio long sin
stocks), αi is the excess return of that portfolio, βi is the loading on the market portfolio, and εit
stands for a generic error term that is uncorrelated with all other independent variables. We also
consider three additional performance models by adding in SMB, HML, and MOM to
specification (4) as independent variables. Our most conservative specification is given by the
four-factor model:
Rit = αi + βi1 VWRFt + βi2 SMBt + βi3 HMLt + βi4 MOMt + ε it t=1,…,T (5)
where Rit is again the excess return of various portfolios , αi is the excess return, βi’s are loadings
on the various portfolios, and εit stands for a generic error term that is uncorrelated with all other
independent variables.
The results are presented in Panels A and B of Table 5. Panel A shows the results for a
value-weighted portfolio of sin stocks. For the market model, the beta is 0.7998 and the alpha is
0.0088 (or 88 basis points per month). Both are statistically significant. For the two-factor
model, the alpha is unchanged at 90 basis points a month. We then toss in MOM in the next row
and find that the alpha has increased to 95 basis points per month because the value-weighted
portfolio loads negatively on the momentum portfolio (though the loading is not statistically
significant). Finally, we add in HML and find that the sin portfolio loads heavily on HML (i.e., it
behaves like value stocks). As a result, the alpha is cut down to 76 basis points per month and is
significant at the 1% level of significance. If sin stocks are value stocks because of the social
norm effect, then the final specification including HML gives us the lower bound on the effect of
norms on prices.
Panel B presents the results for an equal-weighted portfolio of sin stocks. They are
somewhat weaker than the ones for the value-weighted sin portfolio and are nonetheless
economically and statistically significant. For the market model, the beta is 0.9211 and the alpha
is 0.0054 (or 54 basis points per month). Both are statistically significant. For the two-factor

23
model, the alpha is slightly reduced to 43 basis points a month as the equal-weighted portfolio
loads positively on SMB. We then toss in MOM in the next row and find that the alpha has
increased to 59 basis points per month because the equal-weighted portfolio loads negatively on
the momentum portfolio. Finally, we add in HML and find that the equal-weighted sin portfolio
again loads heavily on HML. As a result, the alpha is cut down to 27 basis points per month but
is still significant at the 10% level of significance.
For a robustness check, we employ a second methodology that uses the cross-sectional
variation to decompose return performance. We estimate the following return forecasting
specification:
EXMRETit = c0 + c1 SINDUMit-1 + c2 Xit-1 + εit i=1,…,N (3)
where EXMRET is the return net of the risk-free rate of stock i, SINDUM equals one if the stock
is a sin stock and zero otherwise; Xit is a vector of firm characteristics and εit is measurement
error. Xit includes various permutations of the following variables, including LOGSIZE, RET,
and LOGMB, as defined above. Because we are running forecasting regressions, BETA is now
the time-varying industry beta estimated using the past three years of monthly returns. As such,
the sample for our estimation starts in 1965.
The coefficient of interest is c1, which measures whether sin stocks have an abnormal
return performance controlling for a host of firm characteristics. The null-hypothesis is that it is
zero, whereas our prediction is that it will be significantly greater than zero. c2 is the vector of
loadings on the control variables. We then take the estimates from these monthly regressions
(weighted by market capitalizations) and follow Fama and MacBeth (1973) in taking their time-
series means and standard deviations (using Newey and West (1987) standard errors) to form our
overall estimates of the effects of being a sin stock on performance.
The results are presented in Panel C of Table 5. We present various permutations of the
regression specification (3) but the main one to focus on is the results in column (5) in which we

24
include beta, size, past returns, past turnover and market-to-book as controls. The coefficient in
front of SINDUM is 0.0033 and is statistically significant at the 5% level of significance. In
other words, sin stocks outperform by about 33 basis points per month or about 4 percent a year.
As is found in earlier papers, BETA is statistically insignificant in cross-sectional regressions.
LOGSIZE is negative (bigger stocks under-perform small stocks), past returns positively predict
future returns (i.e., there is momentum at short horizons but not at long horizons), turnover
negatively forecasts returns and market-to-book negatively forecasts returns. These results
confirm those obtained using the time-series of the sin portfolio in Panels A and B.
D. Response of Sin Companies in Corporate Financing Decisions and Time Varying
Norms
If in fact, as we claim, the equity of sin stocks is under-valued and hence it is expensive
for them to finance operations using equity, then we should expect them to use private debt to
finance their operations. An additional relation follows to the extent that debt markets are less
transparent than equity markets. Indeed, there is ample evidence to suggest that debt markets are
less transparent. To begin with, whereas mutual funds or institutions have to disclose their
positions in equities on a semi-annual basis, no such requirements exist for investments in
corporate bonds. As such, it is difficult to figure out for a given company who its financiers are
on the debt side. While one can track down some big bond public issuances, large amounts of
bank debt are difficult to trace. Most poignantly, Arthur Levitt, then chairman of the SEC,
pushed an initiative to improve transparency in the bond market. He noted in a speech on
September 8, 1998 in New York City, “The sad truth is that investors in the corporate bond
market do not enjoy the same access to information as a car buyer or a home buyer or dare I say,
a fruit buyer. And that’s unacceptable.”25
25 His speech can be downloaded from http://www.sec.gov/news/speech/speecharchive/1998/spch218.htm.

25
To see if sin companies indeed use the debt market more than the equity market, we
implement a standard cross-sectional regression specification used in the corporate finance
literature to explain capital structure (i.e., leverage) (see, Baker and Wurgler (2002)). We
estimate the following cross-sectional regression specification:
FinancingDecisionit = d0 + d1 SINDUMit + d2 Xit + εit i=1,…,N (6)
where SINDUM equals one if the stock is a sin stock and zero otherwise; Xit is a vector of firm
characteristics and εit is measurement error. Xit includes the following variables GDUM, TOBQ,
TANG, PROFIT, and LOGSALES. The coefficient of interest is d1, which measures whether sin
firms have a different capital structure than other companies. The null-hypothesis is that it is
zero, whereas our prediction is that it will be significantly greater than zero. d2 is the vector of
loadings on the control variables. We then take the estimates from these monthly regressions and
follow Fama and MacBeth (1973) in taking their time-series means and standard deviations
(using Newey and West (1987) standard errors) to form our overall estimates of the effects of
being a sin stock on corporate financing decisions.
The results are presented in Panel A of Table 6. In column (1), the dependent variable is
market leverage, MLEV. The coefficient in front of SINDUM is positive (0.0390) and
statistically significant at the 1% level of significance. The typical company has a market
leverage of 0.28, so a sin company has a 13.9% higher leverage ratio than the typical company.
GDUM is basically zero. The coefficients in front of the other variables are significant, as found
in earlier work.
In column (2), the dependent variable is book leverage. Here, the results are slightly
weaker as the coefficient in front of BLEV is significant only at the 10% level of significance.
Moreover, the typical firm has a book leverage of 0.35, so a sin stock has only a 10% higher
leverage ratio in book terms than other stocks. In column (3), we look at financing measure

26
related to leverage, which is cash balance. Firms with higher leverage should have less cash
balances, and that is what we find.
In columns (4)-(6), we look to see whether the fact that sin stocks rely more on debt
means that they pay out less dividends or do fewer repurchases. The answer is no. In column (4),
the dependent variable is PAYOUT. The coefficient in front of SINDUM is basically zero. So it
appears that sin stocks do not pay out any less than other stocks. In columns (5)-(6), we
decompose PAYOUT into dividends (DIVPAY) and repurchases (REP). We find in column (5)
that sin stocks actually pay out more dividends than other stocks. In column (6), this positive
coefficient in front of dividends is offset by the slight negative coefficient on REP but is not
statistically significant. This finding may be consistent with these companies trying to cater to
institutional investors that are attracted to stocks that pay dividends. We know from anecdotal
evidence that sin companies have aggressive investor relations policies geared toward attracting
investors more generally.
In Panel B, we present the results using pooled regressions with clustered standard errors.
The coefficients remain similar except that the statistical significance is greatly reduced. The
coefficient in front of market leverage is still significant. So in sum, it appears that sin companies
rely more on the debt market for financing than other firms, consistent with the hypothesis that
they face a disadvantage in the equity market.26
We next take advantage of time-variation in social norms to test our hypothesis. The
main change in norms is obviously with tobacco. As we mentioned in Section II, tobacco was not
considered sinful until the mid-sixties. As such, our hypothesis suggests that they ought to have
been held by institutions and covered by analysts before the mid-sixties. Moreover, they should
not have earned an excess return, controlling for the four-factor model. Finally, the tobacco
companies ought not to have relied more on the debt market. Unfortunately, due to data
26 We omit the detailed year-by-year regressions for brevity. Like earlier results, the coefficients are fairly stable from year-to-year. These results can be obtained from the authors.

27
limitations, we can only test the implications regarding returns since this data goes back to the
twenties; whereas data on ownership and coverage only start in the eighties and the corporate
financing variables are also only available starting in the mid-sixties.
In Panel C of Table 6, we perform the same analysis on tobacco stocks as we did for the
sin stocks as a group in Table 5. In the first row, we look at the performance of a value-weighted
portfolio of tobacco stocks during the period of 1926-1964---a period in which tobacco was not
considered sinful. In the second row, we look at the performance of the same portfolio but during
the period of 1965-2004---a period in which tobacco was considered sinful. As such, we expect
this portfolio to do much better during the 1965-2004 period than during the 1926-1964 period.
This is in fact what we find. Notice that the return of this portfolio in the latter period has a
monthly alpha of 0.0062, while this figure is 0.0021 during the earlier period. This difference is
significant at the 10% level of significance and is economically sizeable. In addition, tobacco
stocks have become more value stocks, which is supported by the significant loading on the value
factor in the post 1965 period. As such, we conclude that the behavior of tobacco stocks is
consistent with that of a regime change in social norms towards these companies.
E. Gauging the Relative Importance of Litigation Risk versus the Neglect Effect for Sin
Stock Performance
Finally, we attempt to gauge the relative importance of litigation risk versus the neglect
effect in determining the expected returns of sin stocks. The results are presented in Table 7. In
Panel A, we examine the performance of the sin portfolio excluding sin stocks. The idea is that
while tobacco stocks faced litigation risk, the other stocks in the sin portfolio including alcohol
and gaming faced very little. As a result, if litigation risk is driving the abnormal performance,
then we ought to see little to none excess return for the sin portfolio excluding tobacco stocks. To
see if this is the case, we replicate the regressions in Panel A of Table 5 except that we exclude
tobacco stocks from the sin portfolio. Notice that the alphas for the various specifications are

28
only slightly smaller in magnitude to those in Panel A of Table 5. In other words, all sin stocks
not just tobacco have had abnormal performance during this sample period.
In Panel B, we focus on whether litigation risk is driving the excess returns of tobacco
stocks. While tobacco stocks undoubtedly face such risk, it is less clear that this is responsible
for the excess returns given that we are controlling for the price-to-book ratio of these companies
in calculating their excess returns. In other words, tobacco stocks are value stocks during this
period probably because of litigation risk, but the excess returns we are measuring may indeed be
due to a distinct neglect effect. To see if this is indeed the case, we look at the performance of
tobacco stocks during the period 1998-2004, a period in which litigation risk dropped
substantially for tobacco companies because of their monumental settlement with the states on
June 20, 1997. In the tobacco deal, tobacco companies agreed to cigarette tax increases in
exchange for states from ever being able to sue them again (see Bulow and Klemperer (1998) for
a review of this deal). Most analysts agreed that tobacco companies got off easily and that their
litigation risk dropped substantially after 1997. As such, we expect the returns of tobacco
companies to be substantially lower during the latter period of 1998-2004 if litigation risk were
driving the excess returns. Interestingly, we find in Panel B that the excess returns of tobacco
stocks are still quite high during this period.
In Panel C, we take a closer look at the litigation risk hypothesis by separating tobacco
stocks into those with foreign operations and those without The idea is that companies with
foreign operations face lower litigation risk (because their liability is likely to be proportional to
the extent of their domestic operations) and hence ought to have lower expected returns. We are
able to obtain the fraction of income a company generates in foreign markets each year from
COMPUSTAT. But this data is only available starting in 1984. To this end, we replicate the
time-series regression of Panel B, except that we divide tobacco stocks into two groups: those
with foreign income (FOR) and those without foreign income (DOM). Notice that the difference

29
between these two portfolios is small and not statistically significant. This suggests that litigation
risk, at least measured by foreign operations, is not driving the returns for tobacco stocks.
We also consider another variation to get at the litigation risk hypothesis by comparing
the top 5 tobacco stocks in terms of market share (Philip Morris, RJR, Brown and Williamson,
Lorillard, and Liggett) compared to the rest of the tobacco market. These five companies
dominated US market sales and presumably faced the bulk of the litigation risk and should have
earned higher returns. The results are similar to the sort by foreign income and are omitted for
brevity. These findings lead us to deduce that the neglect effect is the more likely culprit for the
excess returns of the sin stocks.
In Panel D, we attempt to provide affirmative evidence for this deduction using the
observation that the demand for socially responsible investing has increased over the period of
1965-2003. As we mentioned in the introduction, socially responsible investment as a category
for money management has increased significantly over time. Note that this increase in demand
is distinct from the litigation risk to tobacco stocks which if anything has decreased recently.
Hence, if the excess returns to sin stocks are due to the neglect effect, then we expect the excess
returns of these stocks to have gotten larger over time. To see if this is the case, we take
coefficients in front of SINDUM from Panel C of Table 5, which measure the excess returns of
sin stocks, for the various specifications (1)-(5) and regress these monthly coefficients on a time
trend. We find that this coefficient has gotten larger over time consistent with the neglect effect
-- this time-trend regression is significant for specifications (1)-(5). While it is not significant, the
economic magnitude is interesting, leading us to conclude that the neglect effect is a more likely
culprit behind the observed superior performance of sin stocks than litigation risk.
V. Robustness Checks and Extensions
In addition to these findings, we have also done a number of robustness checks and
extensions. We describe these findings in this section but omit the tables for brevity. As we

30
alluded to in Section II, defense stocks are considered by some to be sinful. We have redone all
of our analyses by including defense in the sin category. The upshot is that our results are
qualitatively similar, but slightly weaker (both economically and statistically), as defense stocks
seem to be adding measurement error to our sin stock categorization. So, we confirm our prior to
focus on the triumvirate of sin (alcohol, tobacco, and gaming) since there is much stronger
consensus on the status of these companies.
We also tried to test indirect implications of our hypothesis. Since sin stocks are not
followed by analysts and institutions, they may have higher illiquidity or bid-ask spreads.
However, we find only negligible differences in bid-ask spreads between sin stocks and other
stocks. There are a few reasons for this. First, most sin companies are highly regulated and have
much better disclosure than other companies. As such, there may be less information asymmetry
for these stocks, leading to potentially lower spreads. Second, the lack of institutional ownership
actually has an ambiguous effect on spreads depending on assumptions about the trading process.
As such, indirect implications regarding liquidity or other market micro-structure aspects of these
companies are difficult to measure unless we have more direct measures of the informational
environment of companies.
VI. Conclusion
In this paper, we provide evidence for the effects of social norms on markets by studying
the investing environment of “sin” stocks -- publicly-traded companies involved in the production
of alcohol, tobacco, and gambling. Our main hypothesis is that there is a societal norm to not
fund operations that promote human vice and that some investors, particularly institutions subject
to public scrutiny and social norms, pay a financial cost in not holding these stocks.
We provide a number of findings in support of this hypothesis. Sin stocks have less
institutional ownership and less analyst coverage than other stocks. But mutual fund companies
and hedge funds play the role of the arbitrageur to some degree in that sin stocks are not less held

31
by them. Importantly, these social norms have price effects as sin stocks behave like value stocks
and outperform the market even after controlling for well-known return predictors. Moreover, sin
companies rely more on the debt market, which is less transparent than the equity market, to
finance operations. Tobacco stocks did not behave like value stocks and did not earn excess
returns during the period 1926-1964, a period when they were not considered sin stocks, whereas
they do during the period of 1965-2003. Finally, we gauge the relative importance of litigation
risk versus neglect for returns. Sin stock returns are not related to various proxies for litigation
risk such as the fraction of income generated in foreign markets, but have increased over time as
the demand for socially responsible investing has risen, consistent with them being neglected. In
sum, our findings indicate that social norms can have important consequences for markets.
Our paper contributes to several literatures. The first is the literature on social norms and
markets. There is little evidence on the effects and our paper provides a rich context and data
with which to measure these effects. The second is the literature on institutional ownership and
what drives institutional holdings. We know relatively little about what drives institutional
ownership beyond simple correlations and this paper provides one motivation. The third is the
literature on the value-glamour effect. Our paper provides an example of a set of value stocks,
the source of whose value comes from them being neglected for social norm reasons. Much more
work remains to be done on the empirics of social norms.

32
References
Ahrens, Dan, 2004, Investing in Vice, New York: St. Martin’s Press. Akerlof, George A., 1980, A theory of social custom, of which unemployment may be
one consequence, Quarterly Journal of Economics 94, 749-775. Altonji, Joseph and Rebecca Blank, 1999, “Race and Gender in the Labor Market,” in:
Handbook of Labor Economics, Vol. 3c, edited by David Card and Orley Ashenfelter.
Arrow, Kenneth J., 1972, Models of job discrimination, in: A.H. Pascal, ed., Racial Discrimination in Economic Life, Lexington, Mass: D.C. Heath, 83-102. Baker, Malcolm and Jeffrey Wurgler, 2002, Market timing and capital structure, Journal of Finance 57, 1-32.
Becker, Gary, 1957, The Economics of Discrimination, Chicago: University of Chicago Press.
Bulow, Jeremy and Paul Klemperer, 1998, The tobacco deal, Brookings Papers on
Economic Activity, 323-394.
Chen, Dar-Hsin and Feng-Shun Bin, 2001, Effects of legislation events on US gaming stock returns and market turnings, Tourism Management 22, 539-549.
Chen, Joseph, Harrison Hong, and Jeremy C. Stein, 2002, Breadth of ownership and stock returns, Journal of Financial Economics 66, 171-205.
Del Guercio, Diane, 1996, The Distorting Effect of the Prudent Man Law on Institutional
Equity Investments, Journal of Financial Economics 40, 31-62.
Elster, Jon, 1989, Social norms and economic theory, Journal of Economic Perspectives 3, 99-117.
Falkentstein, Eric G., 1996, Preferences for stock characteristics as revealed by mutual
fund portfolio holdings, Journal of Finance 51, 111-135. Fama, Eugene F. and James D. MacBeth, 1973, Risk, return, and equilibrium: empirical
test, Journal of Political Economy 81, 607-636. Fama, Eugene F. and Kenneth R. French, 1992, The cross section of expected stock
returns, Journal of Finance 47, 427-465. Fama, Eugene and Kenneth R. French, 1997, Industry costs of equity, Journal of
Financial Economics 43, 153-193.
Geczy, Christopher C., Robert F. Stambaugh, and David Levin, 2003, Investing in socially responsible mutual funds, unpublished working paper.
Greene, W.H., 2000, Econometric Analysis, Macmillan, New York.

33
Gompers Paul and Andrew Metrick, 2001, Institutional investors and equity prices, The Quarterly Journal of Economics 116, 229-259.
Guiso, Luigi, Paola Sapienza, and Luigi Zingales, 2003, People’s opium? Religion and
economic attitudes, Journal of Monetary Economics 50, 225-282. Heinkel, Robert, Alan Kraus, and Josef Zechner, 2001, The effect of green investment on
corporate behavior, Journal of Financial and Quantitative Analysis 35, 431-449. Hong Harrison, Terrence Lim, and Jeremy C. Stein, 2000, Bad news travels slowly: size, analyst coverage and the profitability of momentum strategies, Journal of Finance 55, 265-295.
Levitt, Steven, 2003, Testing theories of discrimination: Evidence from weakest link, NBER Working Paper No. 9449.
Merton, Robert C., 1987, A simple model of capital market equilibrium with incomplete
information, Journal of Finance 42, 483-510. Morse, Adair and Sophie Shive, 2004, Patriotism in your portfolio, unpublished working
paper. Moulton, Brent, 1986, Random group effects and the precision of regression estimates, Journal of Econometrics 32, 385-397.
Newey, Whitney K. and Kenneth D. West, 1987, A simple positive-definite heteroskedasticity and autocorrelation consistent covariance matrix, Econometrica 55, 703-708.
Romer, David, 1984, The theory of social custom: A modification and some extensions, Quarterly Journal of Economics 99, 717-727.
Shleifer, Andrei and Robert W. Vishny, 1997, The limits of arbitrage, Journal of Finance
52, 35-55.
Teoh Siew Hong, Ivo Welch, and Paul C. Wazzan, 1999, The effect of socially activist investment policies on the financial markets: Evidence from the South African Boycott, Journal of Business 72, 35-89.
Waxler, Caroline, 2004, Stocking Up on Sin, New Jersey: John Wiley & Sons, Inc.

34
Table 1: Profile of Sin Stocks
This table reports summary statistics about the sin stocks. In Panel A, we report year-by-year the number of sin stocks that fall into the three sub-groups of tobacco, alcohol, and gaming. In Panel B, we report market betas calculated using value-weighted monthly returns on 48 Fama and French (1997) industry portfolios along with our 49th gaming portfolio. The data span the period of 1962-2003. Panel A: Distribution by Year
Year All Tobacco Alcohol Gaming 1962 23 10 12 1 1963 25 10 13 2 1964 26 11 13 2 1965 26 11 13 2 1966 26 11 13 2 1967 27 11 14 2 1968 27 11 14 2 1969 30 11 16 3 1970 32 12 16 4 1971 32 12 16 4 1972 38 12 20 6 1973 41 12 22 7 1974 41 12 22 7 1975 42 12 23 7 1976 42 12 23 7 1977 42 12 23 7 1978 45 12 23 10 1979 48 12 23 13 1980 50 12 24 14 1981 55 12 24 19 1982 56 12 25 19 1983 58 11 26 21 1984 62 12 27 23 1985 62 11 27 24 1986 60 9 26 25 1987 59 9 24 26 1988 60 9 24 27 1989 61 9 25 27 1990 64 9 23 32 1991 67 10 23 34 1992 70 11 21 38 1993 90 11 23 56 1994 98 11 22 65 1995 106 13 25 68 1996 110 15 30 65 1997 116 16 32 68 1998 107 13 31 63 1999 98 13 32 53 2000 82 11 29 42 2001 73 9 26 38 2002 69 7 25 37 2003 65 7 23 35 Total 184 27 62 95

35
Panel B: Industry Market Betas
Industry Beta Industry Beta Agriculture 0.97 Guns 0.92 Food 0.73 Gold 0.74 Soda 0.82 Mines 1.00 Beer 0.76 Coal 1.00 Smoke 0.74 Oil 0.78 Toys 1.45 Utilities 0.55 Fun 1.28 Telecommunication 0.80 Books 1.06 Personal Services 1.18 Household 0.95 Business Services 1.36 Clothes 1.11 Computers 1.18 Healthcare 1.28 Chips 1.44 Medical Equipment 0.90 Laboratory Equipment 1.43 Drugs 0.87 Paper 1.00 Chemicals 0.98 Boxes 0.87 Rubber 1.11 Transport 1.10 Textiles 0.98 Wholesalers 1.12 Building Materials 1.09 Retailers 1.04 Construction 1.30 Meals 1.16 Steel 1.12 Banks 1.03 Fabricated Products 1.04 Insurance 0.90 Machinery 1.17 Real Estate 1.13 Electrical Equipment 1.23 Financials 1.06 Autos 1.00 Other 1.15 Aero 1.12 Gaming 1.15 Ships 0.97
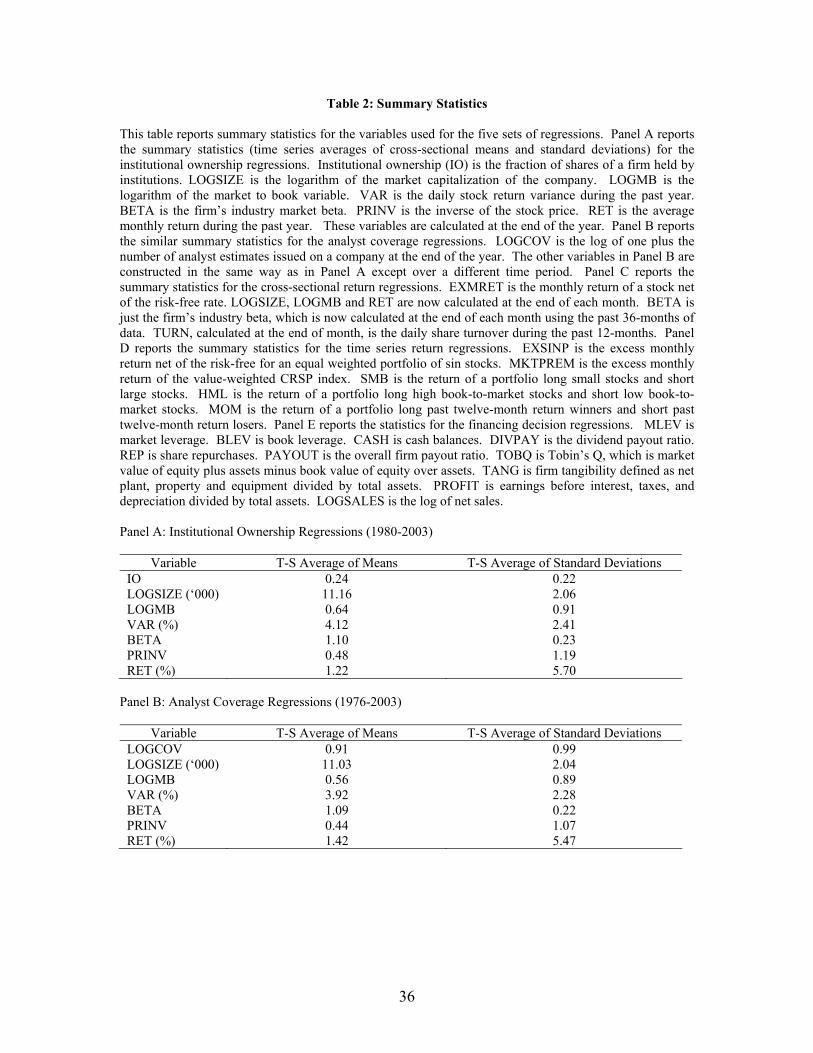
36
Table 2: Summary Statistics
This table reports summary statistics for the variables used for the five sets of regressions. Panel A reports the summary statistics (time series averages of cross-sectional means and standard deviations) for the institutional ownership regressions. Institutional ownership (IO) is the fraction of shares of a firm held by institutions. LOGSIZE is the logarithm of the market capitalization of the company. LOGMB is the logarithm of the market to book variable. VAR is the daily stock return variance during the past year. BETA is the firm’s industry market beta. PRINV is the inverse of the stock price. RET is the average monthly return during the past year. These variables are calculated at the end of the year. Panel B reports the similar summary statistics for the analyst coverage regressions. LOGCOV is the log of one plus the number of analyst estimates issued on a company at the end of the year. The other variables in Panel B are constructed in the same way as in Panel A except over a different time period. Panel C reports the summary statistics for the cross-sectional return regressions. EXMRET is the monthly return of a stock net of the risk-free rate. LOGSIZE, LOGMB and RET are now calculated at the end of each month. BETA is just the firm’s industry beta, which is now calculated at the end of each month using the past 36-months of data. TURN, calculated at the end of month, is the daily share turnover during the past 12-months. Panel D reports the summary statistics for the time series return regressions. EXSINP is the excess monthly return net of the risk-free for an equal weighted portfolio of sin stocks. MKTPREM is the excess monthly return of the value-weighted CRSP index. SMB is the return of a portfolio long small stocks and short large stocks. HML is the return of a portfolio long high book-to-market stocks and short low book-to-market stocks. MOM is the return of a portfolio long past twelve-month return winners and short past twelve-month return losers. Panel E reports the statistics for the financing decision regressions. MLEV is market leverage. BLEV is book leverage. CASH is cash balances. DIVPAY is the dividend payout ratio. REP is share repurchases. PAYOUT is the overall firm payout ratio. TOBQ is Tobin’s Q, which is market value of equity plus assets minus book value of equity over assets. TANG is firm tangibility defined as net plant, property and equipment divided by total assets. PROFIT is earnings before interest, taxes, and depreciation divided by total assets. LOGSALES is the log of net sales. Panel A: Institutional Ownership Regressions (1980-2003)
Variable T-S Average of Means T-S Average of Standard Deviations IO 0.24 0.22 LOGSIZE (‘000) 11.16 2.06 LOGMB 0.64 0.91 VAR (%) 4.12 2.41 BETA 1.10 0.23 PRINV 0.48 1.19 RET (%) 1.22 5.70
Panel B: Analyst Coverage Regressions (1976-2003)
Variable T-S Average of Means T-S Average of Standard Deviations LOGCOV 0.91 0.99 LOGSIZE (‘000) 11.03 2.04 LOGMB 0.56 0.89 VAR (%) 3.92 2.28 BETA 1.09 0.22 PRINV 0.44 1.07 RET (%) 1.42 5.47

37
Panel C: Cross-sectional Return Regressions (1965-2003)
Variable T-S Average of Means T-S Average of Standard Deviations EXMRET (%) 0.83 16.45 LOGSIZE (‘000) 10.90 1.92 BETA 1.11 0.30 TURN (%) 0.33 0.62 LOGMB 0.49 0.83 RET (%) 1.30 4.35
Panel D: Time-series Return Regressions (1965-2004)
Variable T-S Average of Means T-S Average of Standard Deviations EXSINP (%) 0.96 5.70 MKTPREM (%) 0.45 4.52 SMB (%) 0.27 3.31 HML (%) 0.44 3.00 MOM (%) 0.85 4.14
Panel E: Corporate Financing Decisions Regressions (1962-2003)
Variable T-S Average of Means T-S Average of Standard Deviations BLEV 0.35 0.27 MLEV 0.28 0.23 CASH 0.15 0.20 PAYOUT 0.27 1.08 DIVPAY 0.20 0.40 REP 0.10 0.71 TOBQ 1.78 1.63 TANG 0.34 0.23 PROFIT 0.09 0.19 LOGSALES -0.00 0.87

38
Table 3: Institutional Ownership of Sin Stocks The dependent variable is institutional ownership (IO), which is calculated at the end of each year. SINDUM equals one if a stock is a sin stock and zero otherwise. ONEDIGDUM equals one if a stock has a 1-digit SIC code that is the same as any of the sin stocks and zero otherwise. GDUM equals one if a stock is a sin stock or comes from the Fama and French (1997) industry groupings: 2 (food), 3 (soda), 7 (fun), and 43 (meals) and zero otherwise. LOGSIZE is the logarithm of the market capitalization of the company. LOGMB is the logarithm of the market-to-book variable. VAR is the daily stock return variance during the past year. BETA is the firm’s industry market beta. PRINV is the inverse of the stock price. RET is the average monthly return during the past year. NASD equals one if the stock is listed on NASDAQ and zero otherwise. SP500 equals one if the stock is in the S&P 500 index and zero otherwise. These variables are calculated at the end of the year. Panel A reports the results for Fama and MacBeth (1973) regressions during the period of 1980-2003, with Newey and West (1987) standard errors. Panel B reports the results of a pooled regression with Moulton (1986) standard errors clustered at the 49 industry groupings. Panel C reports the results in which the dependent variable is ownership by two sub-groups. In the first column, dependent variable is fraction of shares held by type 1 (banks), type 2 (insurance companies), and type 5 (others including pension plans, endowments and employee-ownership plans) institutions. In the second column, the dependent variable is shared held by type 3 (mutual funds) and type 4 (independent investment advisors) institutions. T-test of the difference of the coefficients in front of SINDUM across these two regressions is provided (Greene (2000)). The data for Panel C runs only from 1980-1997. *** 1% significance; ** 5% significance; * 10% significance. Panel A: Cross-sectional Regressions
Variable (1) (2) (3) (4) (5) (6) SINDUM -0.0505***
(0.0083) -0.0353***
(0.0099) -0.0372***
(0.0096) -0.0358***
(0.0099) -0.0322***
(0.0094) -0.0321***
(0.0097) ONEDIGDUM 0.0016
(0.0034)
GDUM -0.0153*** (0.0045)
-0.0165*** (0.0046)
-0.0152*** (0.0047)
-0.0197*** (0.0050)
-0.0200*** (0.0051)
LOGSIZE 0.0773*** (0.0049)
0.0772*** (0.0049)
0.0851*** (0.0059)
0.0767*** (0.0041)
0.0715*** (0.0038)
0.0726*** (0.0038)
BETA 0.1160*** (0.0076)
0.1149*** (0.0076)
0.1274*** (0.0073)
0.1168*** (0.0080)
0.1290*** (0.0049)
0.1306*** (0.0045)
LOGMB -0.0371*** (0.0033)
PRICEINV -0.0053 (0.0058)
0.0145*** (0.0045)
0.0123** (0.0051)
VAR -1.5034*** (0.2041)
-1.4406*** (0.1996)
RET -0.1544*** (0.0462)
NASD -0.0283*** (0.0039)
-0.0285*** (0.0040)
-0.0094*** (0.0032)
-0.0294*** (0.0040)
-0.0168*** (0.0049)
-0.0151*** (0.0045)
SP500 -0.0226 (0.0204)
-0.0223 (0.0205)
-0.0298 (0.0218)
-0.0211 (0.0189)
-0.0172 (0.0183)
-0.0191 (0.0189)

39
Panel B: Pooled Regressions
Variable (1) (2) (3) (4) (5) (6) SINDUM -0.0519***
(0.0094) -0.0355* (0.0197)
-0.0378** (0.0179)
-0.0356* (0.0201)
-0.0337* (0.0192)
-0.0333* (0.0191)
ONEDIGDUM 0.0016 (0.0113)
GDUM -0.0167 (0.0209)
-0.0180 (0.0197)
-0.0167 (0.0211)
-0.0184 (0.0205)
-0.0192 (0.0205)
LOGSIZE 0.0828*** (0.0023)
0.0828*** (0.0023)
0.0912*** (0.0032)
0.0845*** (0.0024)
0.0825*** (0.0023)
0.0841*** (0.0024)
BETA 0.1286*** (0.0386)
0.1275*** (0.0401)
0.1407*** (0.0436)
0.1295*** (0.0398)
0.1379*** (0.0394)
0.1390*** (0.0396)
LOGMB -0.0373*** (0.0040)
PRICEINV 0.0072*** (0.0013)
0.0123*** (0.0015)
0.0102*** (0.0014)
VAR -0.6794*** (0.1680)
-0.6175*** (0.1674)
RET -0.2230*** (0.0173)
NASD -0.0122** (0.0048)
-0.0120** (0.0051)
0.0094* (0.0052)
-0.0120** (0.0051)
-0.0043 (0.0043)
-0.0021 (0.0043)
SP500 -0.0292*** (0.0099)
-0.0291*** (0.0097)
-0.0367*** (0.0095)
-0.0328*** (0.0097)
-0.0324*** (0.0093)
-0.0359*** (0.0093)
Panel C: Pooled Regressions by Different Types of Institutions
Variable (Type 1+2+5) (Type 3+4) SINDUM -0.0236**
(0.0122) -0.0077 (0.0124)
GDUM -0.0088 (0.0112)
-0.0127 (0.0129)
LOGSIZE 0.0590*** (0.0020)
0.0211*** (0.0015)
BETA 0.0674*** (0.0185)
0.0781*** (0.0239)
PRICEINV 0.0078*** (0.0012)
0.0029** (0.0011)
VAR 0.6038*** (0.0884)
-1.4163*** (0.1447)
RET -0.2118*** (0.0166)
0.0234** (0.0119)
NASD -0.0040 (0.0038)
0.0056** (0.0024)
SP500 -0.0119* (0.0066)
-0.0183** (0.0077)
t-test of difference of coefficients in front of SINDUM
-0.0159*** (0.0064)

40
Table 4: Analysts Coverage of Sin Stocks The dependent variable is log of one plus the number of analyst estimates issued on a stock at the end of the year (LOGCOV). SINDUM equals one if a stock is a sin stock and zero otherwise. ONEDIGDUM equals one if a stock has a 1-digit SIC code that is the same as any of the sin stocks and zero otherwise. GDUM equals one if a stock is a sin stock or comes from the Fama and French (1997) industry groupings: 2 (food), 3 (soda), 7 (fun), and 43 (meals) and zero otherwise. LOGSIZE is the logarithm of the market capitalization of the company. LOGMB is the logarithm of the market-to-book variable. VAR is the daily stock return variance during the past year. BETA is the firm’s industry market beta. PRINV is the inverse of the stock price. RET is the average monthly return during the past year. NASD equals one if the stock is listed on NASDAQ and zero otherwise. SP500 equals one if the stock is in the S&P 500 index and zero otherwise. These variables are calculated at the end of the year. Panel A reports the results for Fama and MacBeth (1973) regressions during the period of 1976-2003, with Newey and West (1987) standard errors. Panel B reports the results of a pooled regression with Moulton (1986) standard errors clustered at the 49 industry groupings. *** 1% significance; ** 5% significance; * 10% significance. Panel A: Cross-sectional Regressions
Variable (1) (2) (3) (4) (5) (6) SINDUM -0.1872***
(0.0384) -0.1682***
(0.0389) -0.1898***
(0.0399) -0.1710***
(0.0411) -0.1655***
(0.0400) -0.1634***
(0.0419) ONEDIGDUM 0.0116
(0.0122)
GDUM -0.0143* (0.0074)
-0.0172*** (0.0052)
-0.0131 (0.0086)
-0.0123 (0.0085)
-0.0144 (0.0101)
LOGSIZE 0.3561*** (0.0118)
0.3554*** (0.0121)
0.3968*** (0.0137)
0.3805*** (0.0116)
0.3804*** (0.0135)
0.3972*** (0.0149)
BETA 0.0861** (0.0368)
0.0824** (0.0363)
0.1330*** (0.0326)
0.1137*** (0.0370)
0.1167*** (0.0370)
0.1269*** (0.0337)
LOGMB -0.1342*** (.0105)
PRICEINV 0.1217*** (0.0310)
0.1339*** (0.0397)
0.0919** (0.0342)
VAR -0.7493 (1.0620)
0.6348 (0.9986)
RET -2.1626*** (0.0994)
NASD -0.0926** (0.0427)
-0.0931** (0.0431)
0.0134 (0.0344)
-0.0893* (0.0463)
-0.0961** (0.0437)
-0.0756* (0.0393)
SP500 0.3784*** (0.0428)
0.3805*** (0.0436)
0.3132*** (0.0461)
0.3290*** (0.0463)
0.3202*** (0.0469)
0.2858*** (0.0537)

41
Panel B: Pooled Regressions
Variable (1) (2) (3) (4) (5) (6) SINDUM -0.1702**
(0.0762) -0.1477* (0.0872)
-0.1704 (0.1155)
-0.1507* (0.0816)
-0.1504* (0.0820)
-0.1477* (0.0807)
ONEDIGDUM 0.0076 (0.0234)
GDUM -0.0203 (0.0485)
-0.0221 (0.0447)
-0.0201 (0.0488)
-0.0203 (0.0488)
-0.0261 (0.0466)
LOGSIZE 0.3516*** (0.0073)
0.3516*** (0.0071)
0.3933*** (0.0072)
0.3700*** (0.0075)
0.3696*** (0.0073)
0.3825*** (0.0072)
BETA 0.0788 (0.0646)
0.0776 (0.0641)
0.1245** (0.0491)
0.1044 (0.0691)
0.1068 (0.0687)
0.1174* (0.0668)
LOGMB -0.1385*** (0.0109)
PRICEINV 0.0709*** (0.0048)
0.0721*** (0.0052)
0.0527*** (0.0038)
VAR -0.1999 (0.2629)
0.2748 (0.2439)
RET -2.1788*** (0.0540)
NASD -0.0777*** (0.0270)
-0.0773*** (0.0272)
0.0309 (0.0266)
-0.0831*** (0.0275)
-0.0808*** (0.0279)
-0.0623** (0.0276)
SP500 0.3796*** (0.0325)
0.3800*** (0.0326)
0.3179*** (0.0315)
0.3382*** (0.0315)
0.3376*** (0.0316)
0.3055*** (0.0309)
*** 1% significance; ** 5% significance; * 10% significance

42
Table 5: Return Performance of Sin Stocks
Panel A reports the results for the time series regressions of EXSINP (the excess monthly return net of the risk-free for a value-weighted portfolio of sin stocks) on a host of well known factors for the period of 1965-2004. MKTPREM is the excess monthly return of the value-weighted CRSP index. SMB is the return of a portfolio long small stocks and short large stocks. HML is the return of a portfolio long high book-to-market stocks and short low book-to-market stocks. MOM is the return of a portfolio long past twelve-month return winners and short past twelve-month return losers. Panel B reports the results for the same regressions except that the sin portfolio is equal-weighted. Panel C reports the results of Fama and MacBeth (1973) cross-sectional regressions (weighted by firm market capitalization) for the period of 1965-2003 of EXMRET, the monthly return of a stock net of the risk-free rate on the lagged (previous month) values of a set of well-known predictors of stock returns. SINDUM equals one if a stock is a sin stock and zero otherwise. LOGSIZE, LOGMB, and RET are now calculated at the end of each month. BETA is just the firm’s industry beta, which is now calculated at the end of each month using the past 36-months of data. TURN, calculated at the end of month, is the daily share turnover during the past 12-months. EXMRET at month t is regressed on the previous month values of LOGSIZE, LOGMB, RET, BETA, TURN, which are denoted by LOGSIZE1, LOGMB1, RET1, BETA1, TURN1. *** 1% significance; ** 5% significance; * 10% significance. Panel A: Times-series Regressions (value-weighted portfolio and value-weighted market): 1965-2004
Variable ALPHA MKTPREM SMB MOM HML EXSINP 0.0088***
(0.0020) 0.7998*** (0.0561)
EXSINP 0.0090*** (0.0021)
0.8237*** (0.0551)
-0.1100 (0.0780)
EXSINP 0.0095*** (0.0020)
0.8196*** (0.0554)
-0.1070 (0.0719)
-0.0569 (0.0833)
EXSINP 0.0076*** (0.0019)
0.8910*** (0.0437)
-0.0653 (0.0650)
-0.0290 (0.0722)
0.2790** (0.1160)
Panel B: Times-series Regressions (equal-weighted portfolio and value-weighted market): 1965-2004
Variable ALPHA MKTPREM SMB MOM HML EXSINP 0.0054**
(0.0022) 0.9211*** (0.0500)
EXSINP 0.0043** (0.0018)
0.7834*** (0.0398)
0.6340*** (0.1462)
EXSINP 0.0059*** (0.0019)
0.7706*** (0.0393)
0.6431*** (0.1208)
-0.1770** (0.0772)
EXSINP 0.0027* (0.0016)
0.8898*** (0.0380)
0.7128*** (0.0848)
-0.1304** (0.0529)
0.4659*** (0.0732)
Panel C: Cross-section Regressions: 1965-2003
Variable (1) (2) (3) (4) (5) SINDUM 0.0022
(0.0017) 0.0017
(0.0017) 0.0027* (0.0017)
0.0027* (0.0016)
0.0033** (0.0016)
BETA1 0.0076** (0.0033)
0.0049 (0.0033)
0.0018 (0.0026)
0.0009 (0.0023)
0.0028 (0.0023)
LOGSIZE1 -0.0028*** (0.0004)
-0.0025*** (0.0004)
-0.0024*** (0.0004)
-0.0018*** (0.0004)
RET1 0.1105*** (0.0322)
0.1031*** (0.0310)
0.1196*** (0.0298)
TURN1 0.1923 (0.2374)
0.2517 (0.2337)
LOGMB1 -0.0031*** (0.0009)
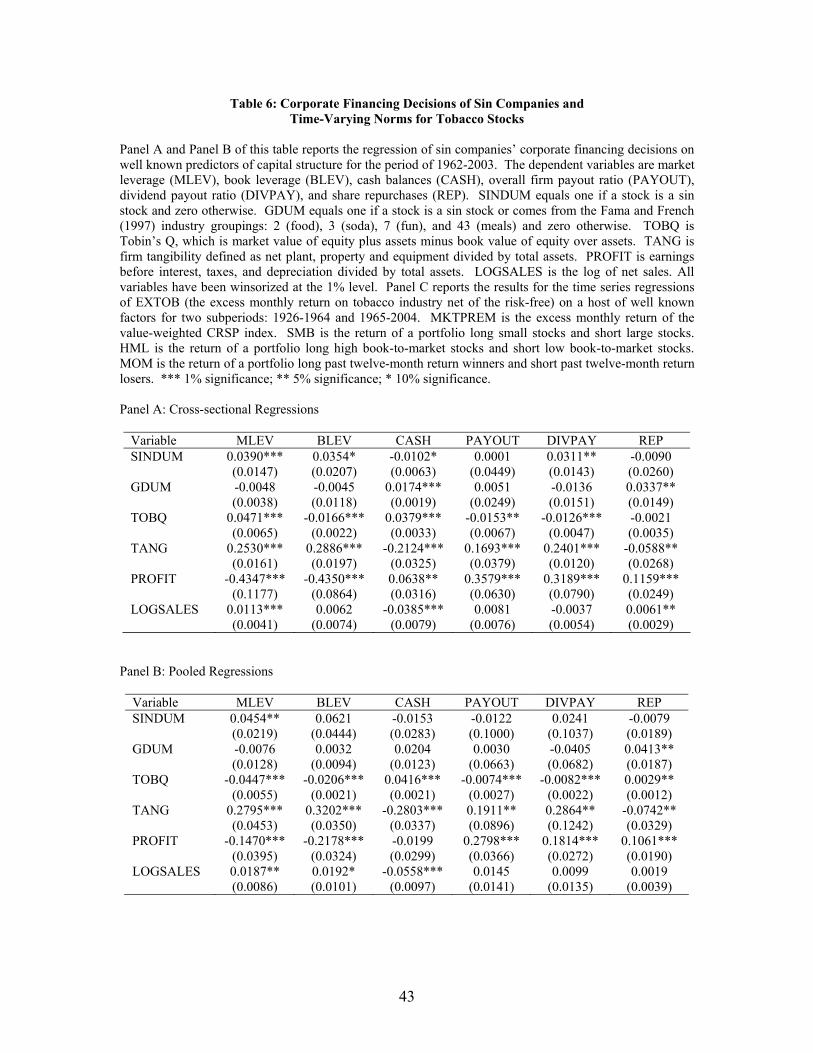
43
Table 6: Corporate Financing Decisions of Sin Companies and Time-Varying Norms for Tobacco Stocks
Panel A and Panel B of this table reports the regression of sin companies’ corporate financing decisions on well known predictors of capital structure for the period of 1962-2003. The dependent variables are market leverage (MLEV), book leverage (BLEV), cash balances (CASH), overall firm payout ratio (PAYOUT), dividend payout ratio (DIVPAY), and share repurchases (REP). SINDUM equals one if a stock is a sin stock and zero otherwise. GDUM equals one if a stock is a sin stock or comes from the Fama and French (1997) industry groupings: 2 (food), 3 (soda), 7 (fun), and 43 (meals) and zero otherwise. TOBQ is Tobin’s Q, which is market value of equity plus assets minus book value of equity over assets. TANG is firm tangibility defined as net plant, property and equipment divided by total assets. PROFIT is earnings before interest, taxes, and depreciation divided by total assets. LOGSALES is the log of net sales. All variables have been winsorized at the 1% level. Panel C reports the results for the time series regressions of EXTOB (the excess monthly return on tobacco industry net of the risk-free) on a host of well known factors for two subperiods: 1926-1964 and 1965-2004. MKTPREM is the excess monthly return of the value-weighted CRSP index. SMB is the return of a portfolio long small stocks and short large stocks. HML is the return of a portfolio long high book-to-market stocks and short low book-to-market stocks. MOM is the return of a portfolio long past twelve-month return winners and short past twelve-month return losers. *** 1% significance; ** 5% significance; * 10% significance. Panel A: Cross-sectional Regressions
Variable MLEV BLEV CASH PAYOUT DIVPAY REP SINDUM 0.0390***
(0.0147) 0.0354* (0.0207)
-0.0102* (0.0063)
0.0001 (0.0449)
0.0311** (0.0143)
-0.0090 (0.0260)
GDUM -0.0048 (0.0038)
-0.0045 (0.0118)
0.0174*** (0.0019)
0.0051 (0.0249)
-0.0136 (0.0151)
0.0337** (0.0149)
TOBQ 0.0471*** (0.0065)
-0.0166*** (0.0022)
0.0379*** (0.0033)
-0.0153** (0.0067)
-0.0126*** (0.0047)
-0.0021 (0.0035)
TANG 0.2530*** (0.0161)
0.2886*** (0.0197)
-0.2124*** (0.0325)
0.1693*** (0.0379)
0.2401*** (0.0120)
-0.0588** (0.0268)
PROFIT -0.4347*** (0.1177)
-0.4350*** (0.0864)
0.0638** (0.0316)
0.3579*** (0.0630)
0.3189*** (0.0790)
0.1159*** (0.0249)
LOGSALES 0.0113*** (0.0041)
0.0062 (0.0074)
-0.0385*** (0.0079)
0.0081 (0.0076)
-0.0037 (0.0054)
0.0061** (0.0029)
Panel B: Pooled Regressions
Variable MLEV BLEV CASH PAYOUT DIVPAY REP SINDUM
0.0454** (0.0219)
0.0621 (0.0444)
-0.0153 (0.0283)
-0.0122 (0.1000)
0.0241 (0.1037)
-0.0079 (0.0189)
GDUM
-0.0076 (0.0128)
0.0032 (0.0094)
0.0204 (0.0123)
0.0030 (0.0663)
-0.0405 (0.0682)
0.0413** (0.0187)
TOBQ -0.0447*** (0.0055)
-0.0206*** (0.0021)
0.0416*** (0.0021)
-0.0074*** (0.0027)
-0.0082*** (0.0022)
0.0029** (0.0012)
TANG 0.2795*** (0.0453)
0.3202*** (0.0350)
-0.2803*** (0.0337)
0.1911** (0.0896)
0.2864** (0.1242)
-0.0742** (0.0329)
PROFIT -0.1470*** (0.0395)
-0.2178*** (0.0324)
-0.0199 (0.0299)
0.2798*** (0.0366)
0.1814*** (0.0272)
0.1061*** (0.0190)
LOGSALES 0.0187** (0.0086)
0.0192* (0.0101)
-0.0558*** (0.0097)
0.0145 (0.0141)
0.0099 (0.0135)
0.0019 (0.0039)

44
Panel C: Performance of value-weighted portfolio of tobacco stocks
Variable ALPHA MKTPREM SMB MOM HML EXTOB 1926-1964 0.0021
(0.0020) 0.6247*** (0.0477)
-0.1030* (0.0589)
-0.0202 (0.0488)
0.0117 (0.0877)
1965-2004 0.0062** (0.0027)
0.8513*** (0.0666)
-0.2131** (0.0931)
-0.0484 (0.0904)
0.3060** (0.1393)
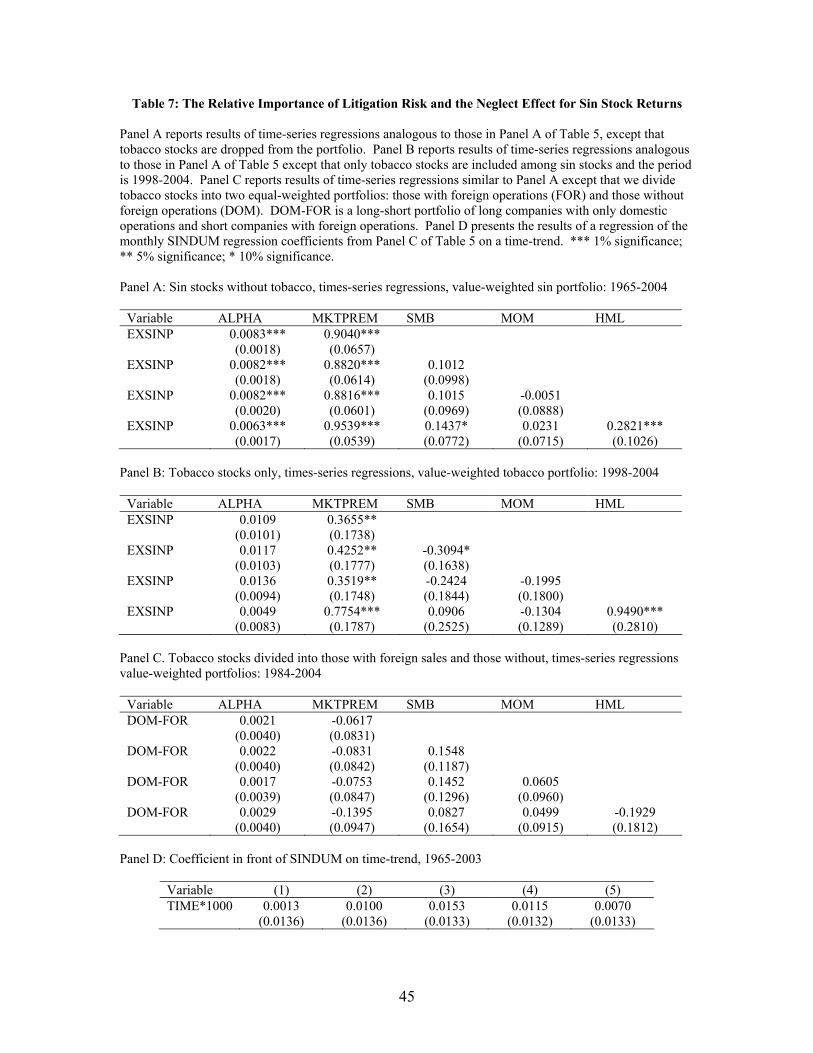
45
Table 7: The Relative Importance of Litigation Risk and the Neglect Effect for Sin Stock Returns Panel A reports results of time-series regressions analogous to those in Panel A of Table 5, except that tobacco stocks are dropped from the portfolio. Panel B reports results of time-series regressions analogous to those in Panel A of Table 5 except that only tobacco stocks are included among sin stocks and the period is 1998-2004. Panel C reports results of time-series regressions similar to Panel A except that we divide tobacco stocks into two equal-weighted portfolios: those with foreign operations (FOR) and those without foreign operations (DOM). DOM-FOR is a long-short portfolio of long companies with only domestic operations and short companies with foreign operations. Panel D presents the results of a regression of the monthly SINDUM regression coefficients from Panel C of Table 5 on a time-trend. *** 1% significance; ** 5% significance; * 10% significance. Panel A: Sin stocks without tobacco, times-series regressions, value-weighted sin portfolio: 1965-2004
Variable ALPHA MKTPREM SMB MOM HML EXSINP 0.0083***
(0.0018) 0.9040*** (0.0657)
EXSINP 0.0082*** (0.0018)
0.8820*** (0.0614)
0.1012 (0.0998)
EXSINP 0.0082*** (0.0020)
0.8816*** (0.0601)
0.1015 (0.0969)
-0.0051 (0.0888)
EXSINP 0.0063*** (0.0017)
0.9539*** (0.0539)
0.1437* (0.0772)
0.0231 (0.0715)
0.2821*** (0.1026)
Panel B: Tobacco stocks only, times-series regressions, value-weighted tobacco portfolio: 1998-2004
Variable ALPHA MKTPREM SMB MOM HML EXSINP 0.0109
(0.0101) 0.3655** (0.1738)
EXSINP 0.0117 (0.0103)
0.4252** (0.1777)
-0.3094* (0.1638)
EXSINP 0.0136 (0.0094)
0.3519** (0.1748)
-0.2424 (0.1844)
-0.1995 (0.1800)
EXSINP 0.0049 (0.0083)
0.7754*** (0.1787)
0.0906 (0.2525)
-0.1304 (0.1289)
0.9490*** (0.2810)
Panel C. Tobacco stocks divided into those with foreign sales and those without, times-series regressions value-weighted portfolios: 1984-2004
Variable ALPHA MKTPREM SMB MOM HML DOM-FOR 0.0021
(0.0040) -0.0617 (0.0831)
DOM-FOR 0.0022 (0.0040)
-0.0831 (0.0842)
0.1548 (0.1187)
DOM-FOR 0.0017 (0.0039)
-0.0753 (0.0847)
0.1452 (0.1296)
0.0605 (0.0960)
DOM-FOR 0.0029 (0.0040)
-0.1395 (0.0947)
0.0827 (0.1654)
0.0499 (0.0915)
-0.1929 (0.1812)
Panel D: Coefficient in front of SINDUM on time-trend, 1965-2003
Variable (1) (2) (3) (4) (5) TIME*1000 0.0013
(0.0136) 0.0100
(0.0136) 0.0153
(0.0133) 0.0115
(0.0132) 0.0070
(0.0133)