The prevalence of precipitation from polar supercooled clouds
23
Atmos. Chem. Phys., 21, 3949–3971, 2021 https://doi.org/10.5194/acp-21-3949-2021 © Author(s) 2021. This work is distributed under the Creative Commons Attribution 4.0 License. The prevalence of precipitation from polar supercooled clouds Israel Silber 1 , Ann M. Fridlind 2 , Johannes Verlinde 1 , Andrew S. Ackerman 2 , Grégory V. Cesana 2,3 , and Daniel A. Knopf 4 1 Department of Meteorology and Atmospheric Science, Pennsylvania State University, University Park, PA, USA 2 NASA Goddard Institute for Space Studies, New York, NY, USA 3 Center for Climate Systems Research, Earth Institute, Columbia University, New York, NY, USA 4 School of Marine and Atmospheric Sciences, Stony Brook University, Stony Brook, NY, USA Correspondence: Israel Silber ([email protected]) Received: 23 September 2020 – Discussion started: 12 October 2020 Revised: 10 February 2021 – Accepted: 12 February 2021 – Published: 17 March 2021 Abstract. Supercooled clouds substantially impact polar sur- face energy budgets, but large-scale models often under- estimate their occurrence, which motivates accurately es- tablishing metrics of basic processes. An analysis of long- term measurements at Utqia ˙ gvik, Alaska, and McMurdo Sta- tion, Antarctica, combines lidar-validated use of soundings to identify supercooled cloud layers and colocated ground- based profiling radar measurements to quantify cloud base precipitation. We find that more than 85 % (75 %) of sampled supercooled layers are precipitating over the Arctic (Antarc- tic) site, with more than 75 % (50 %) precipitating continu- ously to the surface. Such high frequencies can be reconciled with substantially lesser spaceborne estimates by consider- ing differences in radar hydrometeor detection sensitivity. While ice precipitation into supercooled clouds from aloft is common, we also find that the great majority of supercooled cloud layers without ice falling into them are themselves continuously generating precipitation. Such sustained pri- mary ice formation is consistent with continuous activation of immersion-mode ice-nucleating particles (INPs), suggest- ing that supercooled cloud formation is a principal gateway to ice formation at temperatures greater than ∼-38 ◦ C over polar regions. The prevalence of weak precipitation fluxes is also consistent with supercooled cloud longevity and with well-observed and widely simulated case studies. An anal- ysis of colocated microwave radiometer retrievals suggests that weak precipitation fluxes can be nonetheless consequen- tial to moisture budgets for supercooled clouds owing to small liquid water paths. The results here also demonstrate that the observed abundance of mixed-phase clouds can vary substantially with instrument sensitivity and methodology. Finally, we suggest that these ground-based precipitation rate statistics offer valuable guidance for improving the represen- tation of polar cloud processes in large-scale models. 1 Introduction Supercooled clouds exert substantial radiative impacts on the surface energy budget over polar regions (e.g., Dong et al., 2010; Miller et al., 2015; Shupe and Intrieri, 2004; Silber et al., 2019b), and play an important role in Arctic amplification and solar absorption over the Southern Ocean (e.g., Cronin and Tziperman, 2015; McCoy et al., 2014, 2015; Pithan et al., 2018; Tan and Storelvmo, 2019). However, major uncertain- ties in their representation in climate models (e.g., Cesana et al., 2015; Tsushima et al., 2006) ensue from knowledge gaps concerning the active processes affecting cloud life cycles (e.g., Tan et al., 2016; Kay et al., 2018). Both ice and liquid precipitation can form in super- cooled clouds. At temperatures greater than the homoge- neous freezing of water (∼-38 ◦ C), ice initiation typically requires ice-nucleating particles (INPs; e.g., Hegg and Baker, 2009; Vali et al., 2015), and it may be enhanced by sec- ondary processes such as rime splintering or droplet shat- tering (e.g., Hallett and Mossop, 1974; Korolev et al., 2020). Once formed, ice hydrometeors grow rapidly by depositional growth both within supercooled cloud and in underlying ice- supersaturated layers (e.g., Pinsky et al., 2015) and by colli- sions with droplets (riming) and other ice hydrometeors (ag- gregation) (e.g., Fridlind and Ackerman, 2018). Less com- monly formed supercooled drizzle drops grow only within Published by Copernicus Publications on behalf of the European Geosciences Union.
Transcript of The prevalence of precipitation from polar supercooled clouds
Atmos. Chem. Phys., 21, 3949–3971, 2021https://doi.org/10.5194/acp-21-3949-2021© Author(s) 2021. This work is distributed underthe Creative Commons Attribution 4.0 License.
The prevalence of precipitation from polar supercooled cloudsIsrael Silber1, Ann M. Fridlind2, Johannes Verlinde1, Andrew S. Ackerman2, Grégory V. Cesana2,3, andDaniel A. Knopf4
1Department of Meteorology and Atmospheric Science, Pennsylvania State University, University Park, PA, USA2NASA Goddard Institute for Space Studies, New York, NY, USA3Center for Climate Systems Research, Earth Institute, Columbia University, New York, NY, USA4School of Marine and Atmospheric Sciences, Stony Brook University, Stony Brook, NY, USA
Correspondence: Israel Silber ([email protected])
Received: 23 September 2020 – Discussion started: 12 October 2020Revised: 10 February 2021 – Accepted: 12 February 2021 – Published: 17 March 2021
Abstract. Supercooled clouds substantially impact polar sur-face energy budgets, but large-scale models often under-estimate their occurrence, which motivates accurately es-tablishing metrics of basic processes. An analysis of long-term measurements at Utqiagvik, Alaska, and McMurdo Sta-tion, Antarctica, combines lidar-validated use of soundingsto identify supercooled cloud layers and colocated ground-based profiling radar measurements to quantify cloud baseprecipitation. We find that more than 85 % (75 %) of sampledsupercooled layers are precipitating over the Arctic (Antarc-tic) site, with more than 75 % (50 %) precipitating continu-ously to the surface. Such high frequencies can be reconciledwith substantially lesser spaceborne estimates by consider-ing differences in radar hydrometeor detection sensitivity.While ice precipitation into supercooled clouds from aloft iscommon, we also find that the great majority of supercooledcloud layers without ice falling into them are themselvescontinuously generating precipitation. Such sustained pri-mary ice formation is consistent with continuous activationof immersion-mode ice-nucleating particles (INPs), suggest-ing that supercooled cloud formation is a principal gatewayto ice formation at temperatures greater than ∼−38 ◦C overpolar regions. The prevalence of weak precipitation fluxesis also consistent with supercooled cloud longevity and withwell-observed and widely simulated case studies. An anal-ysis of colocated microwave radiometer retrievals suggeststhat weak precipitation fluxes can be nonetheless consequen-tial to moisture budgets for supercooled clouds owing tosmall liquid water paths. The results here also demonstratethat the observed abundance of mixed-phase clouds can varysubstantially with instrument sensitivity and methodology.
Finally, we suggest that these ground-based precipitation ratestatistics offer valuable guidance for improving the represen-tation of polar cloud processes in large-scale models.
1 Introduction
Supercooled clouds exert substantial radiative impacts on thesurface energy budget over polar regions (e.g., Dong et al.,2010; Miller et al., 2015; Shupe and Intrieri, 2004; Silber etal., 2019b), and play an important role in Arctic amplificationand solar absorption over the Southern Ocean (e.g., Croninand Tziperman, 2015; McCoy et al., 2014, 2015; Pithan et al.,2018; Tan and Storelvmo, 2019). However, major uncertain-ties in their representation in climate models (e.g., Cesana etal., 2015; Tsushima et al., 2006) ensue from knowledge gapsconcerning the active processes affecting cloud life cycles(e.g., Tan et al., 2016; Kay et al., 2018).
Both ice and liquid precipitation can form in super-cooled clouds. At temperatures greater than the homoge-neous freezing of water (∼−38 ◦C), ice initiation typicallyrequires ice-nucleating particles (INPs; e.g., Hegg and Baker,2009; Vali et al., 2015), and it may be enhanced by sec-ondary processes such as rime splintering or droplet shat-tering (e.g., Hallett and Mossop, 1974; Korolev et al., 2020).Once formed, ice hydrometeors grow rapidly by depositionalgrowth both within supercooled cloud and in underlying ice-supersaturated layers (e.g., Pinsky et al., 2015) and by colli-sions with droplets (riming) and other ice hydrometeors (ag-gregation) (e.g., Fridlind and Ackerman, 2018). Less com-monly formed supercooled drizzle drops grow only within
Published by Copernicus Publications on behalf of the European Geosciences Union.

3950 I. Silber et al.: The prevalence of precipitation from polar supercooled clouds
supercooled cloud primarily by accretion of cloud droplets(e.g., Rangno and Hobbs, 2001).
Precipitation impacts the life cycle of supercooled cloudseven if the cloud base flux is weak or if it evaporates orsublimates before reaching the surface (e.g., Silber et al.,2019a; Solomon et al., 2011). However, few studies havequantified precipitation occurrence from polar supercooledclouds. McIlhattan et al. (2017) reported that∼ 10 % of shal-low supercooled clouds are precipitating to the surface, basedon Arctic-wide retrievals from the Cloud Profiling Radar(CPR; Tanelli et al., 2008) onboard CloudSat (Stephens et al.,2002). Edel et al. (2020) reported a greater value (∼ 20 %)by including a lower likelihood of CPR surface precipita-tion (see Wood, 2011). Also based on CPR measurements,Zhang et al. (2010) found that ∼ 60 % of polar mid-level su-percooled clouds are precipitating at or below cloud base. Bycontrast, ground-based remote-sensing measurements overthe Arctic commonly show essentially continuous precipita-tion from supercooled cloud decks (e.g., Fridlind and Acker-man, 2018, Fig. 3; Shupe, 2011; Shupe et al., 2006), gener-ally commencing shortly after supercooled cloud formation(e.g., de Boer et al., 2011).
Here we attempt to reconcile a general impression fromground-based measurements that polar supercooled cloudsare nearly universally precipitating with a quite wide rangeof satellite-based estimates. Using multiple years of sound-ing data and closely colocated ground-based radar observa-tions from Arctic and Antarctic sites, we first evaluate theoccurrence of cloud base and surface precipitation from alldetected supercooled cloud layers. We then examine the im-pact of radar sensitivity on precipitation detectability and de-rive estimates of cloud base precipitation flux. Finally, forsingle-layer clouds, we provide a rough measure of precipi-tation impact on cloud lifetime by comparing the estimatedcloud base precipitation rates with simultaneous microwaveradiometer retrievals of liquid water path.
2 Methodology
To detect supercooled cloud layers, we use 6 or 12 hourlysoundings acquired at Utqiagvik (formerly Barrow), NorthSlope of Alaska (NSA; Verlinde et al., 2016), from Novem-ber 2011 to April 2019 and 12 hourly soundings acquired atMcMurdo Station, Antarctica, between December 2015 andJanuary 2017 (Lubin et al., 2020). After linearly interpolatingonto a 15 m grid, supercooled layers are identified where at-mospheric temperature is between 0 and−40 ◦C and relativehumidity (RH) exceeds 95 % over at least two adjacent gridcells, consistent with an RH uncertainty of 5 % (Holdridgeet al., 2011). This method shows good agreement (in morethan 90 % of cases) with independent retrievals from lidarmeasurements (see Silber et al., 2020a, Fig. S1) and permitslayer identification over the full column, which is not limitedby lidar extinction. While some liquid-bearing air volumes
may be missed where the reported in-cloud RH is below the95 % threshold, these uncommon occurrences have little in-fluence on the results statistically.
To detect precipitation, we use colocated Ka-band zenith-pointing radar (KAZR; Widener et al., 2012) measurementsacquired above 300 m (hmin). After interpolating onto thesame 15 m grid, hydrometeor-containing range gates aretaken as those where radar echoes exceed the noise floor (seeSilber et al., 2018a) in at least 50 % of profiles within 15 minafter the radiosonde release. We estimate likely biases result-ing from the binary averaging (e.g., Smalley et al., 2014) onthis occurrence percentage threshold to be below 10 % (notshown). In using a 15 min window we account for shearedfall streak structures, while the short duration mitigates bi-ases during rapid changes in liquid layer height (e.g., Ver-linde et al., 2013, Fig. 3). We omit supercooled layers belowhmin and above 4.3 km, which is the average altitude reachedwithin 15 min of radiosonde release.
KAZR equivalent reflectivity factor (Ze) and meanDoppler velocity (VD) profiles are arithmetically (linearly)averaged over hydrometeor-containing volumes within each15 min window. While the sounding-based supercooledcloud detection method is powerful for establishing cloudboundaries, it unfortunately does not allow us to establishthe cloud occurrence fraction profile over the 15 min window.The averaging period selected for Ze and VD could result in apotential bias of VD and either bias or overestimation of Ze,depending on whether the full window or the hydrometeor-containing range gate occurrence fraction is used, respec-tively. Here we omit hydrometeor-free samples from thesecalculations, resulting in a potential overestimation that isless than 0.5 (0.6) dBZ in more than 90 % of the casesover the NSA (McMurdo) based on hydrometeor-containingrange gate occurrence fraction statistics (not shown). Ourstatistics and conclusions are therefore not sensitive to thischoice.
To define precipitation occurrence we require that meanZe over a fixed depth below liquid cloud base (dmin) ex-ceed a fixed threshold (Zemin ). In support of that, negative VDvalues (towards the surface) just below cloud base in morethan 95 % of the hydrometeor containing range gates in bothdatasets indicate the presence of precipitating hydrometeors.By varying dmin and Zemin we emulate different range resolu-tions and instrument or algorithm sensitivity thresholds. Thesmallest Zemin (−50 dBZ) corresponds to the KAZR sensi-tivity at ∼ 1 km (see Appendix A), with an effective uncer-tainty of several dBZ (e.g., Kollias et al., 2019). The smallestdmin (60 m) corresponds to two KAZR range gates. Super-cooled cloud layers extending below hmin+dmin are omittedbecause the cloud base is not discernable by KAZR (belowhmin) or an emulation with coarsened vertical resolution (be-low hmin+dmin). The resulting McMurdo dataset constitutes236 (dmin = 600 m) to 262 (dmin = 60 m) profiles with atleast one supercooled layer (corresponding to a supercooledcloud occurrence frequency of 29 % to 32 %, respectively),
Atmos. Chem. Phys., 21, 3949–3971, 2021 https://doi.org/10.5194/acp-21-3949-2021

I. Silber et al.: The prevalence of precipitation from polar supercooled clouds 3951
whereas the NSA dataset constitutes 3139 to 4544 profiles(frequency of 38 % to 55 %, respectively), the larger rangeof which reflects a higher occurrence of supercooled cloudsbelow∼ 1 km over the NSA (e.g., Lubin et al., 2020, Fig. 7).
To evaluate surface precipitation occurrence, we comparelinearly averaged Ze at hmin to Zemin in profiles with atleast one supercooled cloud layer. The impact of ground-based versus spaceborne effective hmin (typically ∼ 0.3 and∼ 1.2 km, respectively) on surface precipitation occurrencewas estimated at both sites to be roughly ±10 percentagepoints, suggesting hydrometeor nucleation, growth, evapora-tion, or sublimation within this “blind zone” (cf. Bennartzet al., 2019; Castellani et al., 2015; Maahn et al., 2014). Wenote that the impact of the blind zone between the surface andground-based hmin on precipitation occurrence using highradar sensitivities, similar to those used here, is absent fromthe literature to our knowledge and merits a dedicated study.
To estimate precipitation rate (R) immediately belowcloud base (RCB), following Bühl et al. (2016) and becausea reliable retrieval of mass-weighted fall speed is not avail-able, we simply multiply VD magnitudes (when VD is point-ing towards the surface) by retrieved ice water content (IWC)following Hogan et al. (2006). Using this method, we donot apply any ice habit property constraints on the observa-tions, which span the full heterogeneous freezing tempera-ture range, but do find some overlap with various Ze–R re-lationship parameterizations (see Appendix B). We roughlyestimate the IWC uncertainty as −90 % to +300 % basedon the range of retrieval errors deduced by Heymsfield etal. (2008), by which we implicitly consider potentially differ-ent prevailing ice properties from the measurements used intheir study. We neglect VD uncertainty (∼ 0.1 m/s; Wideneret al., 2012) since it is comparatively negligible, e.g., ±10 %when considering the distribution of VD values over the NSA(see Silber et al., 2020b). Similarly, we neglect the impact ofshort-term air-motion variability over VD because it is largelycanceled by the VD averaging over the 15 min window, basedon a comparison with averaging calculations using 1 h win-dows. This comparison resulted in similar 15 min and 1 haveraged VD distributions with a mean difference of 1.3 %and 4.5 % at the NSA and McMurdo Station sites, respec-tively (not shown; see Sedlar and Shupe, 2014; Shupe et al.,2008a, b).
We use microwave radiometer (MWR: Morris, 2006) re-trievals of liquid water path (LWP; Cadeddu et al., 2007;Turner et al., 2007) for single-layer profiles (53 % and 60 %of all cloud-containing profiles over NSA and McMurdo Sta-tion, respectively). We do not limit LWP to values greaterthan the widely used uncertainty of 25 g/m2 (e.g., Turner etal., 2007; Westwater et al., 2001) because doing so would ex-clude frequently occurring tenuous supercooled clouds (e.g.,Sedlar, 2014; Silber et al., 2020a), which account for 32 %(73 %) of the NSA (McMurdo) single-layer profiles (shownbelow). We note that the MWR LWP retrievals predomi-nantly exhibit significantly smaller errors, averaging around
0 g/m2 in bulk statistics (no retrieval bias; see Cadeddu et al.,2009, 2013).
3 Precipitation statistics
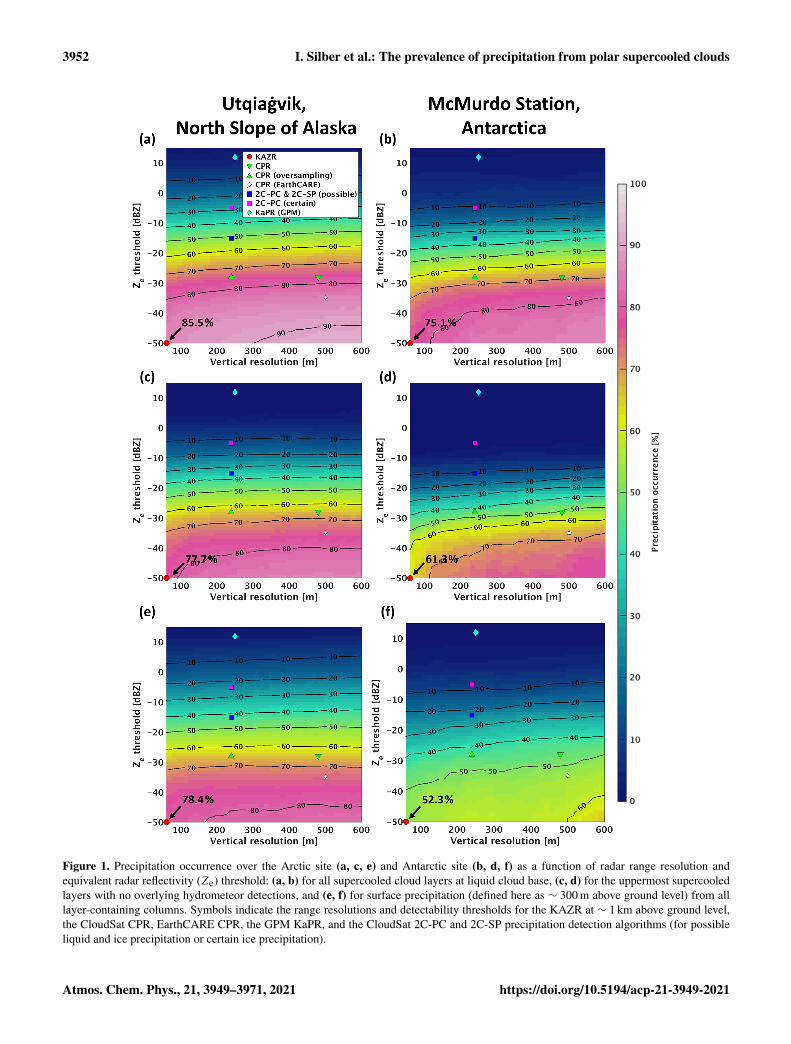
Based on KAZR measurement capabilities (minimum clouddepth and Ze thresholds of 60 m and−50 dBZ, respectively),we find that more than 85 % (75 %) of all sampled super-cooled cloud layers over the NSA (McMurdo) precipitatefrom liquid cloud base (Fig. 1a, b). Here each supercooledlayer is counted separately over columns that contain bothsingle- and multi-layer cases. We interpret these percentagesas lower limits on precipitation occurrence. In some cases,KAZR sensitivity appears to be a limiting factor or precip-itating ice does not grow large enough to be detected bythe KAZR immediately below cloud base (see Appendix C).Such cases may explain the distribution of non-precipitatingcloud top temperatures over the NSA reaching a minimum,corresponding to a maximum likelihood of precipitation de-tection, at −15 ◦C and (to a lesser extent) −5 ◦C (Fig. 2a),where vapor growth rate peaks (e.g., Fukuta and Takahashi,1999). Similarly, shallow clouds (Fig. 2c) or clouds at the lowend of LWP (Fig. 2d), the cases of which frequently overlap(not shown), may hamper ice growth to detectable sizes bylimiting the time ice particles can grow via vapor depositionor riming during sedimentation from the (coldest) cloud topregions where INP activation is expected to be strongest.
Over the NSA, where statistics are most robust, cloud baseprecipitation fraction remains 0.8 or higher throughout theheterogeneous freezing regime (Fig. 2a). Such high frac-tions are in part influenced by the commonality of seedingfrom overlying precipitation falling into supercooled cloudtops (primarily ice-phase precipitation, as discussed below),which occurs in 47 % (45 %) of sampled supercooled layersover the NSA (McMurdo) (not shown; cf. Vassel et al., 2019).However, when only the topmost supercooled layers with nooverlying precipitation are considered, the percentages arereduced by only roughly 10 % (Fig. 1c, d), suggesting thatsupercooled clouds are usually generating precipitation.
Surface precipitation occurrence in supercooled cloud-containing profiles is greater than 75 % (50 %) over theNSA (McMurdo) (Fig. 1e, f). Here each column is countedas a single case, regardless of whether it contains one ormore supercooled layers, in order to remain comparable withspaceborne statistics that use lidar measurements to detectat least one supercooled layer in a column and radar mea-surements to detect underlying surface precipitation. Thelower percentage over McMurdo Station may be influencedby intense near-surface sublimation augmented by katabaticwinds (e.g., Grazioli et al., 2017). The precipitation detectedwith KAZR may be liquid or ice phase. However, since inthese datasets Ze usually increases from cloud base to somedistance below (see Appendix D), indicating continued icegrowth during sedimentation rather than drizzle or rain evap-
https://doi.org/10.5194/acp-21-3949-2021 Atmos. Chem. Phys., 21, 3949–3971, 2021
3952 I. Silber et al.: The prevalence of precipitation from polar supercooled clouds
Figure 1. Precipitation occurrence over the Arctic site (a, c, e) and Antarctic site (b, d, f) as a function of radar range resolution andequivalent radar reflectivity (Ze) threshold: (a, b) for all supercooled cloud layers at liquid cloud base, (c, d) for the uppermost supercooledlayers with no overlying hydrometeor detections, and (e, f) for surface precipitation (defined here as ∼ 300 m above ground level) from alllayer-containing columns. Symbols indicate the range resolutions and detectability thresholds for the KAZR at ∼ 1 km above ground level,the CloudSat CPR, EarthCARE CPR, the GPM KaPR, and the CloudSat 2C-PC and 2C-SP precipitation detection algorithms (for possibleliquid and ice precipitation or certain ice precipitation).
Atmos. Chem. Phys., 21, 3949–3971, 2021 https://doi.org/10.5194/acp-21-3949-2021

I. Silber et al.: The prevalence of precipitation from polar supercooled clouds 3953
Figure 2. (a) Cloud top temperature (TCT; obtained from sounding measurements), (b) month, (c) cloud depth, and (d) liquid water pathoccurrence frequency histograms for supercooled cloud layers over the NSA (tan) and the non-precipitating subset (green). The histogramsin panels (c) and (d) are based on single-layer cases. Precipitating fractions as a function of TCT are shown in panel (a) (black line; note thatvalues for temperatures below −34 ◦C have fewer than 10 samples each, and hence these results are likely not representative).
oration, we infer that ice is the dominant precipitation form(e.g., Edel et al., 2020; Rangno and Hobbs, 2001; Shupe,2011).
Continuous precipitation of ice from non-seeded super-cooled cloud layers suggests continuous in-cloud activationof INP (e.g., de Boer et al., 2011; Westbrook and Illingworth,2013). Because INP availability generally increases expo-nentially with decreasing temperature (e.g., DeMott et al.,2010), we posit that longwave radiative cooling is the pri-mary driver of continuous activation of INP initially presentin a cloud layer. We note that over such high-latitude re-gions the cloud top longwave radiative cooling typically re-mains significantly greater than shortwave radiative heatingthroughout sunlit periods (e.g., Turner et al., 2018). In theroughly three-quarters of cases where cloud layers are tur-bulent (Silber et al., 2020a), additional INP may be continu-ously entrained at cloud top (e.g., Fridlind et al., 2012) andpotentially at cloud base via deepening of a decoupled layer(e.g., Avramov et al., 2011) or INP recycling (e.g., Solomonet al., 2015). In non-turbulent layers, progressive saturationof an increasing cloud depth (e.g., Silber et al., 2020a) couldalso effectively increase the in-cloud INP pool. The overalldifferences in detected Arctic versus Antarctic precipitationfrequency (Fig. 1) are likely influenced by geographical INP
variability associated with both long-range transport and lo-cal source regions (e.g., Vergara-Temprado et al., 2018), aswell as differing cloud temperatures (e.g., Lubin et al., 2020;Scott and Lubin, 2016), which impact INP activation (e.g.,Kanji et al., 2017; Knopf et al., 2018).
Profiles of INP or aerosol properties (e.g., Creamean etal., 2018, 2021) are unfortunately not retrievable from theavailable McMurdo Station and NSA measurements, but wecan establish the degree to which non-precipitating casesmay exhibit conditions that would likely be associated witha scarcity of activatable INP relative to all clouds for the7-year NSA dataset. For instance, non-precipitating cloudsare more common at temperatures closer to 0 ◦C, where ac-tivation of INP is known to be extremely scarce (bars inFig. 2a; see Rangno and Hobbs, 2001; see also Appendix C).Non-precipitating clouds also occur mostly during summer(Fig. 2b), when INP and aerosol particle concentrations arelowest (e.g., Fountain and Ohtake, 1985; Quinn et al., 2002,2009). Third, non-precipitating clouds tend to be thinner andlower in LWP (Fig. 2c, d), consistent with slower entrain-ment. Reduced INP entrainment is also suggested by a statis-tically significant higher occurrence of non-turbulent cloudsbeing non-precipitating (36 %) relative to the full dataset(27 %; not shown). Finally, radiative cooling and entrainment
https://doi.org/10.5194/acp-21-3949-2021 Atmos. Chem. Phys., 21, 3949–3971, 2021

3954 I. Silber et al.: The prevalence of precipitation from polar supercooled clouds
of INP may also be suppressed by radiative shielding, consis-tent with 17 % (43 %) greater non-precipitating cloud occur-rence when adjoining layers are vertically separated by lessthan 500 m (100 m) (not shown; cf. Sedlar and Shupe, 2014).We found indications of similar non-precipitating case char-acteristics over McMurdo Station, but the smaller dataset in-hibited a statistically robust analysis.
4 Reconciling apparent precipitation occurrence
The detectability of precipitating hydrometeors is a functionof the radar characteristics such as operating wavelength, re-ceiver sensitivity, and pulse width, as well as the spatial char-acteristics of the precipitation (e.g., Lamer et al., 2019). Herewe examine the impact of radar range resolution and Zemin onthe reported precipitation percentage by varying these thresh-olds to emulate these parameters in other radar systems. Re-sults indicate that reducing the radar range resolution cancounterintuitively increase the precipitating cloud percentageowing to the higher probability of detecting larger hydrom-eteors in a larger volume, but higher Zemin can more signifi-cantly reduce the cloud and surface precipitation percentages(Fig. 1). For example, emulation of the highest-sensitivityCloudSat CPR Zemin corresponds to surface precipitationpercentages that are lower than KAZR by 5–10 percentagepoints (Fig. 1e, f), in agreement with Zhang et al. (2010, theirFigs. 6 and 7), who used temperature-dependent Ze thresh-olds. Emulation of the Zemin corresponding to the “precipi-tation possible” flag of the CloudSat 2C-PRECIP-COLUMN(2C-PC; Haynes et al., 2009) and 2C-SNOW-PROFILE (2C-SP; Wood, 2011, chapter 7; Wood et al., 2014) precipitationdetection algorithms yields surface and cloud base precipi-tation occurrences lower than KAZR by more than 30 (25)points over the NSA (McMurdo) (Fig. 1a, b, e, f). Both pre-cipitation occurrences are lower by 15–20 points more whenthe Zemin corresponding to 2C-PC “solid precipitation cer-tain” flag (−5 dBZ) is emulated (Fig. 1a, b, e, f). These satel-lite measurement and retrieval sensitivity limitations are ac-centuated when the Ka-band precipitation radar (KaPR) on-board the Global Precipitation Measurement (GPM) satellite(Hou et al., 2013) sensitivity is adopted for precipitation de-tection (Fig. 1; estimated detection of 1 in 10 precipitationevents; cf. Skofronick-Jackson et al., 2019). This result isconsistent with known limitations of the KaPR capability todetect light precipitation (e.g., Hamada and Takayabu, 2016).Aside from this, we note that the GPM inclination angle of65◦ excludes most polar regions, including the NSA and Mc-Murdo Station, but is high enough to observe some relevanthigh-latitude regions such as the Southern Ocean.
When applying the 2C-PC Zemin for “certain” and “possi-ble” precipitation (accounting for radar sensitivity and rangeresolution), our NSA surface precipitation occurrences arestill 5–10 points greater than the higher range of central-Arctic values (∼ 20 %–40 %) estimated by McIlhattan et
al. (2017) and Edel et al. (2020), respectively. These remain-ing differences are likely attributable to hmin differences (seeSect. 2) and the spatial distribution of Arctic precipitation(relatively higher over the NSA; cf. Edel et al., 2020, Fig. 3;McIlhattan et al., 2017, Fig. 7). Altogether, this radar sen-sitivity analysis can generally reconcile expected high pre-cipitation occurrence from ground-based measurements withvariously lower values derived from satellite data. By em-ulating the Zemin and vertical resolution of the future Earth-CARE mission’s CPR (see Illingworth et al., 2015; Kollias etal., 2014), we find that it may detect precipitation percentagessimilar to those of KAZR (Fig. 1), thereby better establishingpolar precipitation processes.
Finally, we find that the cloud base precipitation occur-rence, which is most relevant to cloud lifetimes but currentlymore challenging to establish well from space, is consistentlygreater than the surface occurrence. Stratocumulus studieshave long focused on both cloud base and surface precipi-tation owing in part to the effects of drizzle evaporation onboundary layer stability (e.g., Wood, 2012). It is also mostnatural to assess a process occurrence based on whether thatprocess is active in the clouds at hand, and an active pre-cipitation process in supercooled clouds will be best estab-lished from cloud base occurrence. On the one hand, the dif-ference between cloud base and surface precipitation fromsupercooled clouds is expected to be smaller than for ice-freestratocumulus because ice is expected to be growing duringsedimentation at least immediately below liquid cloud base(in contrast to drizzle), owing to the fact that supercooled wa-ter implies a supersaturation with respect to ice that increaseswith decreasing temperature. On the other hand, supercooledpolar clouds can also occur at substantially higher altitudesthan subtropical stratocumulus, for instance, correspondingto greater potential for sublimation before reaching the sur-face.
5 Guidance for large-scale models
We suggest that these long-term ground-based statistics of-fer unique guidance for evaluating and improving the rep-resentation of supercooled cloud processes in large-scalemodels, especially when paired with additional colocatedmeasurements. For instance, the probability density function(PDF) of cloud base precipitation rate (RCB) from single-layer clouds over the NSA is similar to that from all lay-ers (Fig. 3a; PDF data are provided in Table B1). Moreover,the PDF shape is largely insensitive to the cutoff altitude(hmin) up to 3 km (see Appendix B). This weak dependenceof the RCB PDF on the cloud base height range presents anotable contrast to the strong height dependence of satelliteprecipitation rate statistics, which do not offer the contextof a known liquid cloud base height (e.g., Lemonnier et al.,2020; Pettersen et al., 2018). This is likely because the under-lying atmosphere’s thermodynamic state has no direct influ-
Atmos. Chem. Phys., 21, 3949–3971, 2021 https://doi.org/10.5194/acp-21-3949-2021
I. Silber et al.: The prevalence of precipitation from polar supercooled clouds 3955
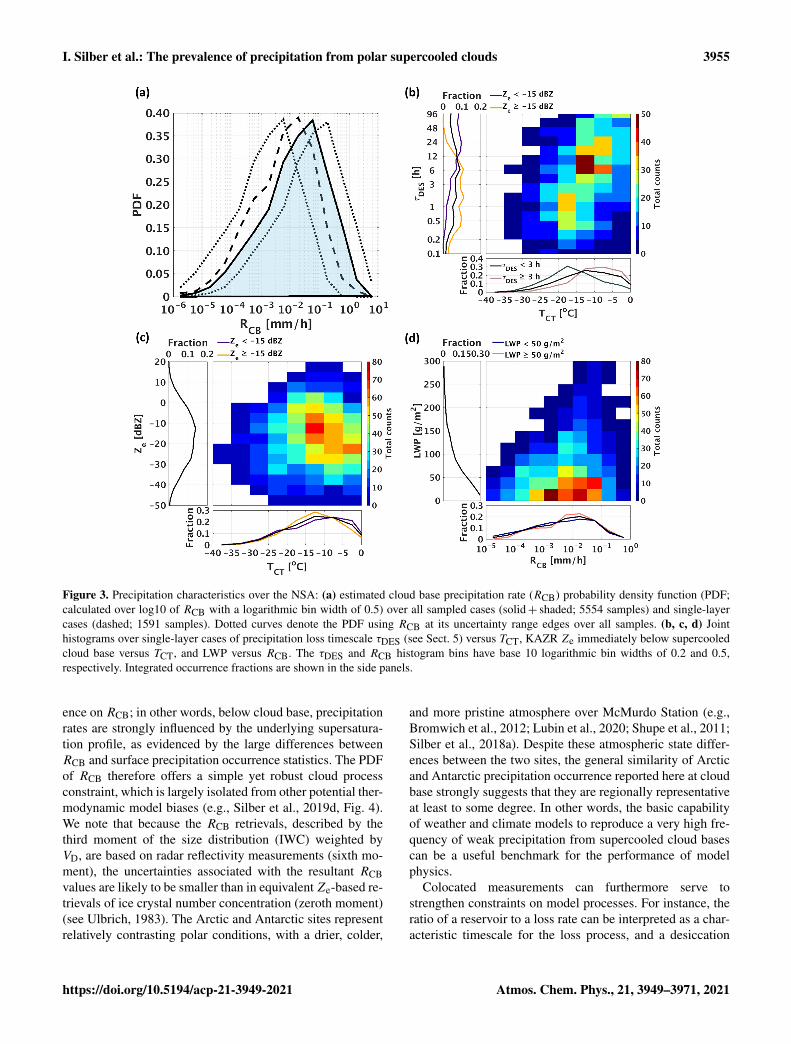
Figure 3. Precipitation characteristics over the NSA: (a) estimated cloud base precipitation rate (RCB) probability density function (PDF;calculated over log10 of RCB with a logarithmic bin width of 0.5) over all sampled cases (solid+ shaded; 5554 samples) and single-layercases (dashed; 1591 samples). Dotted curves denote the PDF using RCB at its uncertainty range edges over all samples. (b, c, d) Jointhistograms over single-layer cases of precipitation loss timescale τDES (see Sect. 5) versus TCT, KAZR Ze immediately below supercooledcloud base versus TCT, and LWP versus RCB. The τDES and RCB histogram bins have base 10 logarithmic bin widths of 0.2 and 0.5,respectively. Integrated occurrence fractions are shown in the side panels.
ence on RCB; in other words, below cloud base, precipitationrates are strongly influenced by the underlying supersatura-tion profile, as evidenced by the large differences betweenRCB and surface precipitation occurrence statistics. The PDFof RCB therefore offers a simple yet robust cloud processconstraint, which is largely isolated from other potential ther-modynamic model biases (e.g., Silber et al., 2019d, Fig. 4).We note that because the RCB retrievals, described by thethird moment of the size distribution (IWC) weighted byVD, are based on radar reflectivity measurements (sixth mo-ment), the uncertainties associated with the resultant RCBvalues are likely to be smaller than in equivalent Ze-based re-trievals of ice crystal number concentration (zeroth moment)(see Ulbrich, 1983). The Arctic and Antarctic sites representrelatively contrasting polar conditions, with a drier, colder,
and more pristine atmosphere over McMurdo Station (e.g.,Bromwich et al., 2012; Lubin et al., 2020; Shupe et al., 2011;Silber et al., 2018a). Despite these atmospheric state differ-ences between the two sites, the general similarity of Arcticand Antarctic precipitation occurrence reported here at cloudbase strongly suggests that they are regionally representativeat least to some degree. In other words, the basic capabilityof weather and climate models to reproduce a very high fre-quency of weak precipitation from supercooled cloud basescan be a useful benchmark for the performance of modelphysics.
Colocated measurements can furthermore serve tostrengthen constraints on model processes. For instance, theratio of a reservoir to a loss rate can be interpreted as a char-acteristic timescale for the loss process, and a desiccation
https://doi.org/10.5194/acp-21-3949-2021 Atmos. Chem. Phys., 21, 3949–3971, 2021
3956 I. Silber et al.: The prevalence of precipitation from polar supercooled clouds
timescale from precipitation can therefore be calculated asτDES = LWP/RCB (see Bühl et al., 2016). We find that thejoint histogram of τDES and cloud top temperature for single-layer NSA cases (where LWP can be reliably attributed)peaks around 6 to 9 h and −10 to −15 ◦C (Fig. 3b). Super-cooled cloud occurrence is substantial in this cloud top tem-perature range at various levels of Ze (Fig. 3c), such as bothabove and below−15 dBZ (a common spaceborne threshold;see Figs. 1 and 3c). τDES values shorter than the median Eu-lerian supercooled cloud persistence of 3 h reported over theNSA (Shupe, 2011) are more common at temperatures below−15 ◦C (Fig. 3b), reflecting the fact that lower RCB valuescommonly accompany lower LWP clouds (Fig. 3d). Basedon these statistics, we conclude that the prevalent weak RCB(Fig. 3a) can be important cloud moisture sinks especially forlow temperature and low LWP regimes that are common overpolar regions (e.g., Nomokonova et al., 2019; Shupe, 2011;Silber et al., 2018a; Zhang et al., 2010). We postulate thatsuch fluxes are also important to below-cloud moisture bud-gets owing in part to the likely commonality of continuedgrowth of ice precipitation in sub-cloud ice supersaturatedconditions, which will serve to enhance moisture transporteven in cases of low cloud base Ze (e.g., just above Zemin ;see Appendix D).
6 Discussion
To our knowledge, this is the first study to report supercooledcloud base precipitation rates from an extensive sample of at-mospheric profiles, including tenuous, opaque, seeded, non-seeded, single, and multi-layer clouds. Similar to Bühl etal. (2016), who studied mid-latitude geometrically thin su-percooled clouds, we also evaluate the impact of cloud baseice precipitation rates on cloud life cycle, using ancillarymeasurements. We find substantially greater surface precipi-tation occurrence frequencies than previously reported basedon lower-sensitivity spaceborne radar measurements. Weposit that such persistent ice precipitation from supercooledclouds is likely primarily supported by sustained nucleationand growth of ice crystals resulting from continuous INPactivation, consistent with non-precipitating cases occurringpreferentially under conditions that would generally hamperINP supply or activation rate. Persistently weak cloud baseprecipitation rates and precipitation loss timescales (usu-ally > 1–10 h) further indicate the commonality of an INP-limited regime. Morrison et al. (2011) demonstrate that ifsufficiently high ice concentrations are maintained in large-eddy simulations of a well-mixed cloud-topped boundarylayer, for instance, then surface precipitation may desic-cate a low-LWP cloud layer within ∼ 1 h. By contrast, aweakly precipitating, INP-limited regime is consistent withwell-observed and widely simulated supercooled cloud casestudies derived independently from several Arctic field cam-paigns (e.g., Fridlind and Ackerman, 2018).
The long-known commonality of ice precipitation fromsupercooled polar stratus and stratocumulus (e.g., Rangnoand Hobbs, 2001), confirmed by these long-term measure-ments, suggests a role for liquid saturation as a principalgateway to polar ice formation at temperatures between 0and ∼−38 ◦C (see also de Boer et al., 2011). If INP activa-tion is the main pathway for primary ice formation, activationof immersion-mode INP is likely dominant owing to slowcontact rates between droplets and interstitial aerosol parti-cles despite cloud top phoretic enhancements (cf. Fridlindet al., 2012). Such a scenario deprecates INP activation inthe deposition mode, consistent with evidence that rates aregenerally at least an order of magnitude weaker (e.g., Alpertet al., 2011). Supercooled stratus and stratocumulus cloudstructures are generally well reproduced by large-eddy simu-lations when in-cloud ice concentrations similar to those ob-served are matched (e.g., Ovchinnikov et al., 2014). How-ever, field observational constraints on both INP and iceproperties have been generally insufficient to reliably predictand evaluate primary ice formation processes, and various icemultiplication processes remain highly uncertain, preventingrobust conclusions from a closure approach to source attri-bution (Fridlind and Ackerman, 2018; Korolev et al., 2020;Lauber et al., 2018; Zipori et al., 2018).
Since temperature-dependent INP measurements over theArctic, Antarctic, and Southern Ocean regions show largeoverlap with INP measurements over the NSA (Belosi etal., 2014; DeMott, 2019; Villanueva et al., 2020; Wex et al.,2019), we postulate that unremitting precipitation is likely aprevalent feature of high-latitude supercooled clouds. Precip-itation loss timescales over the NSA suggest that a prevalenceof weakly precipitating supercooled clouds is important forin-cloud moisture budget.
A definitional overlap exists between precipitating su-percooled clouds as defined in this study and mixed-phaseclouds as defined in other studies; namely, supercooledclouds that are precipitating ice are also mixed-phase clouds.Microphysically, this overlap hinges on the rapid equilibra-tion of supercooled cloud water with ambient vapor pressurecombined with the rapid growth of ice crystals at liquid satu-ration. However, Fig. 1 shows that the diagnosed occurrencefrequency of precipitating supercooled clouds, and by exten-sion mixed-phase clouds, can depend strongly on instrumentsensitivity. The probability of observing ice hydrometeorsalso increases with a longer duration of measurement averag-ing window (e.g., Fig. C1). Thus, our analysis demonstratesthat the observed abundance of mixed-phase clouds can varysubstantially with methodology.
Our findings underscore the importance of a “definition-aware” approach (Kay et al., 2018) to enable valid com-parisons between datasets obtained with differently capa-ble instruments or between measurements and model outputwhile considering instrument limitations. Despite the gener-ally high sensitivity of ground-based radar to ice precipita-tion, we have noted evidence that sensitivity still presents
Atmos. Chem. Phys., 21, 3949–3971, 2021 https://doi.org/10.5194/acp-21-3949-2021

I. Silber et al.: The prevalence of precipitation from polar supercooled clouds 3957
limitations to the detection of precipitation in some cases.While differing approaches to defining precipitation occur-rence could have been taken in this study, we conjecture thatmost would result in comparatively high occurrences rela-tive to satellite remote-sensing capabilities, as also found forwarm marine clouds (Lamer et al., 2020). Given that the greatmajority of clouds over both Arctic and Antarctic sites is usu-ally precipitating, global model biases in precipitation ratecould be a greater cause of error than biases in occurrencefrequency (cf. Kay et al., 2018), underscoring the differencebetween precipitating frequently and precipitating heavily.
7 Conclusions
We use long-term sounding and ground-based radar mea-surements to characterize the properties of precipitation fromsupercooled clouds over North Slope of Alaska (NSA) andAntarctic (McMurdo) sites and examine the influence ofradar sensitivity on apparent precipitation occurrence. Quan-titative analyses support the following conclusions.
– More than 85 % (75 %) of the detected supercooledcloud layers over the NSA (McMurdo) precipitate fromthe liquid cloud base, largely in the form of ice, and pre-cipitation is detected close to the surface in more than75 % (50 %) of supercooled cloud-containing profiles.
– Such greater prevalence of surface precipitation can bereconciled with spaceborne estimates, some of whichare lesser by more than half, by considering the lowersensitivity of spaceborne radars and related precipita-tion detection algorithms.
– By extension, insofar as mixed-phase clouds are definedas supercooled clouds that are precipitating ice, the in-ferred abundance of mixed-phase clouds can vary sub-stantially with instrument sensitivity and methodology.
– Although roughly half of the detected supercooledcloud layers are seeded by ice precipitation from aloft,precipitation occurrence is only roughly 10 % lowerfrom unseeded relative to all detected supercooled lay-ers, indicating that supercooled clouds are commonly asource of ice in polar regions.
– Non-precipitating supercooled clouds are preferentiallyassociated with higher temperatures, smaller LWPs, ra-diative shielding by overlying cloud layers, lack of in-cloud turbulence, and relatively pristine conditions.
– An analysis of desiccation timescales based on colo-cated retrievals of LWP for single-layer cases overNSA indicates that the effect of persistent weak pre-cipitation fluxes on in-cloud moisture budgets can benon-negligible owing to the commonality of low cloudLWPs.
The prevalence of precipitating polar supercooled clouds,commensurate with their frequently observed persistence,implies that large-scale models should reflect similar char-acteristics in order to better represent both the polar atmo-spheric state (e.g., phase partitioning and radiative fluxes)and cloud processes (e.g., prevalent ice nucleation, growth,and precipitation) (e.g. Mülmenstädt et al., 2020). We sug-gest that supercooled cloud base precipitation rate statistics,which to our knowledge have not been a focus of modelevaluation efforts to date, will be particularly valuable forevaluating and improving the representation of these super-cooled cloud processes in large-scale models. In contrast toevaluating precipitation rate statistics at all levels without re-gard for supercooled cloud boundaries, the precipitation atthe cloud base level is detected in observations and evalu-ated based on model output before extensive growth and/orsublimation throughout the underlying atmosphere, thus im-proving the robustness of the observational statistics and theisolation of model output from indirect biases associatedwith the representation of the atmospheric thermodynamicprofile. Whereas current spaceborne measurements providegreater coverage, ground-based measurements can overcomesome spaceborne observability limitations and provide valu-able colocated observations for more detailed model processevaluation.
https://doi.org/10.5194/acp-21-3949-2021 Atmos. Chem. Phys., 21, 3949–3971, 2021
3958 I. Silber et al.: The prevalence of precipitation from polar supercooled clouds
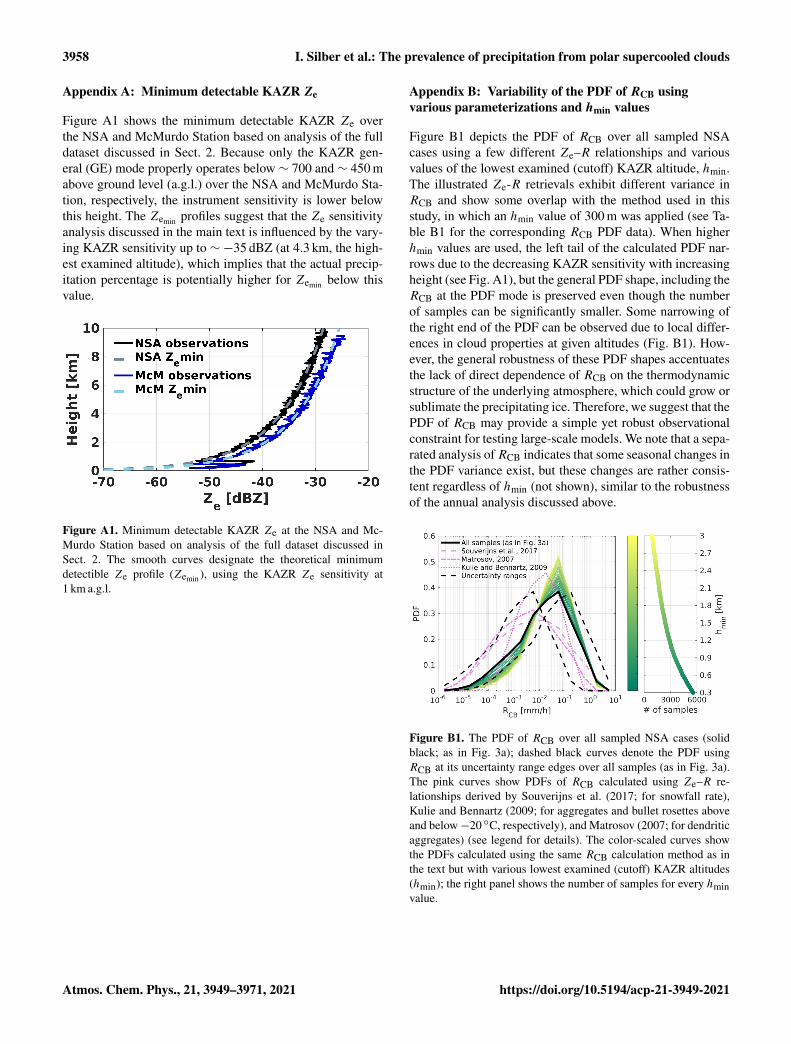
Appendix A: Minimum detectable KAZR Ze
Figure A1 shows the minimum detectable KAZR Ze overthe NSA and McMurdo Station based on analysis of the fulldataset discussed in Sect. 2. Because only the KAZR gen-eral (GE) mode properly operates below ∼ 700 and ∼ 450 mabove ground level (a.g.l.) over the NSA and McMurdo Sta-tion, respectively, the instrument sensitivity is lower belowthis height. The Zemin profiles suggest that the Ze sensitivityanalysis discussed in the main text is influenced by the vary-ing KAZR sensitivity up to ∼−35 dBZ (at 4.3 km, the high-est examined altitude), which implies that the actual precip-itation percentage is potentially higher for Zemin below thisvalue.
Figure A1. Minimum detectable KAZR Ze at the NSA and Mc-Murdo Station based on analysis of the full dataset discussed inSect. 2. The smooth curves designate the theoretical minimumdetectible Ze profile (Zemin ), using the KAZR Ze sensitivity at1 km a.g.l.
Appendix B: Variability of the PDF of RCB usingvarious parameterizations and hmin values
Figure B1 depicts the PDF of RCB over all sampled NSAcases using a few different Ze–R relationships and variousvalues of the lowest examined (cutoff) KAZR altitude, hmin.The illustrated Ze-R retrievals exhibit different variance inRCB and show some overlap with the method used in thisstudy, in which an hmin value of 300 m was applied (see Ta-ble B1 for the corresponding RCB PDF data). When higherhmin values are used, the left tail of the calculated PDF nar-rows due to the decreasing KAZR sensitivity with increasingheight (see Fig. A1), but the general PDF shape, including theRCB at the PDF mode is preserved even though the numberof samples can be significantly smaller. Some narrowing ofthe right end of the PDF can be observed due to local differ-ences in cloud properties at given altitudes (Fig. B1). How-ever, the general robustness of these PDF shapes accentuatesthe lack of direct dependence of RCB on the thermodynamicstructure of the underlying atmosphere, which could grow orsublimate the precipitating ice. Therefore, we suggest that thePDF of RCB may provide a simple yet robust observationalconstraint for testing large-scale models. We note that a sepa-rated analysis ofRCB indicates that some seasonal changes inthe PDF variance exist, but these changes are rather consis-tent regardless of hmin (not shown), similar to the robustnessof the annual analysis discussed above.
Figure B1. The PDF of RCB over all sampled NSA cases (solidblack; as in Fig. 3a); dashed black curves denote the PDF usingRCB at its uncertainty range edges over all samples (as in Fig. 3a).The pink curves show PDFs of RCB calculated using Ze–R re-lationships derived by Souverijns et al. (2017; for snowfall rate),Kulie and Bennartz (2009; for aggregates and bullet rosettes aboveand below−20 ◦C, respectively), and Matrosov (2007; for dendriticaggregates) (see legend for details). The color-scaled curves showthe PDFs calculated using the same RCB calculation method as inthe text but with various lowest examined (cutoff) KAZR altitudes(hmin); the right panel shows the number of samples for every hminvalue.
Atmos. Chem. Phys., 21, 3949–3971, 2021 https://doi.org/10.5194/acp-21-3949-2021

I. Silber et al.: The prevalence of precipitation from polar supercooled clouds 3959
Table B1. PDF data illustrated in Fig. 3a.
Bin range [log10(mm/h)] Logarithmicbin middleRCB valueconverted tolinear units[mm/h]
PDF (calculated over log10RCB) [− log10(mm/h)]
Full dataset Full dataset usingRCB at its leftmostuncertainty edge
Full dataset usingRCB at its right-most uncertaintyedge
Single-layer subset
−6.00 to −5.50 0.000002 0.003 0.021 0.000 0.008−5.50 to −5.00 0.000006 0.008 0.053 0.003 0.011−5.00 to −4.50 0.000018 0.021 0.097 0.008 0.034−4.50 to −4.00 0.000056 0.052 0.142 0.021 0.072−4.00 to −3.50 0.000178 0.096 0.191 0.054 0.147−3.50 to −3.00 0.000562 0.141 0.295 0.100 0.213−3.00 to −2.50 0.001778 0.190 0.351 0.143 0.244−2.50 to −2.00 0.005623 0.293 0.386 0.193 0.358−2.00 to −1.50 0.017783 0.349 0.269 0.294 0.390−1.50 to −1.00 0.056234 0.384 0.158 0.355 0.322−1.00 to −0.50 0.177828 0.268 0.037 0.380 0.148−0.50 to 0.00 0.562341 0.157 0.001 0.263 0.0400.00 to 0.50 1.778279 0.037 0.000 0.153 0.0130.50 to 1.00 5.623413 0.001 0.000 0.032 0.000
https://doi.org/10.5194/acp-21-3949-2021 Atmos. Chem. Phys., 21, 3949–3971, 2021

3960 I. Silber et al.: The prevalence of precipitation from polar supercooled clouds
Appendix C: KAZR sensitivity limitations andassociated examples of apparently non-precipitatingcases
Figures C1 and C2 provide a few examples of supercooledcloud layers detected over the NSA, in which there aresome periods where the clouds apparently do not precipitate,whereas Fig. C3 illustrates the impact of different Zemin val-ues on the NSA RCB PDF shape.
Figure C1 portrays an hour of remote-sensing mea-surements from 1 September 2015, during which a non-precipitating supercooled layer is observed between 11:00and 11:15 UTC. The cloud top temperature is ∼−5 ◦C dur-ing this event based on sounding measurements from thesame hour. Before 11:15 UTC, there is little apparent pre-cipitation, while in other regions and periods it appears thatthe KAZR GE mode is not sensitive enough to detect pre-cipitation (note the difference between the detected hydrom-eteor signal above and below the dashed lines during 11:30–11:40 UTC).
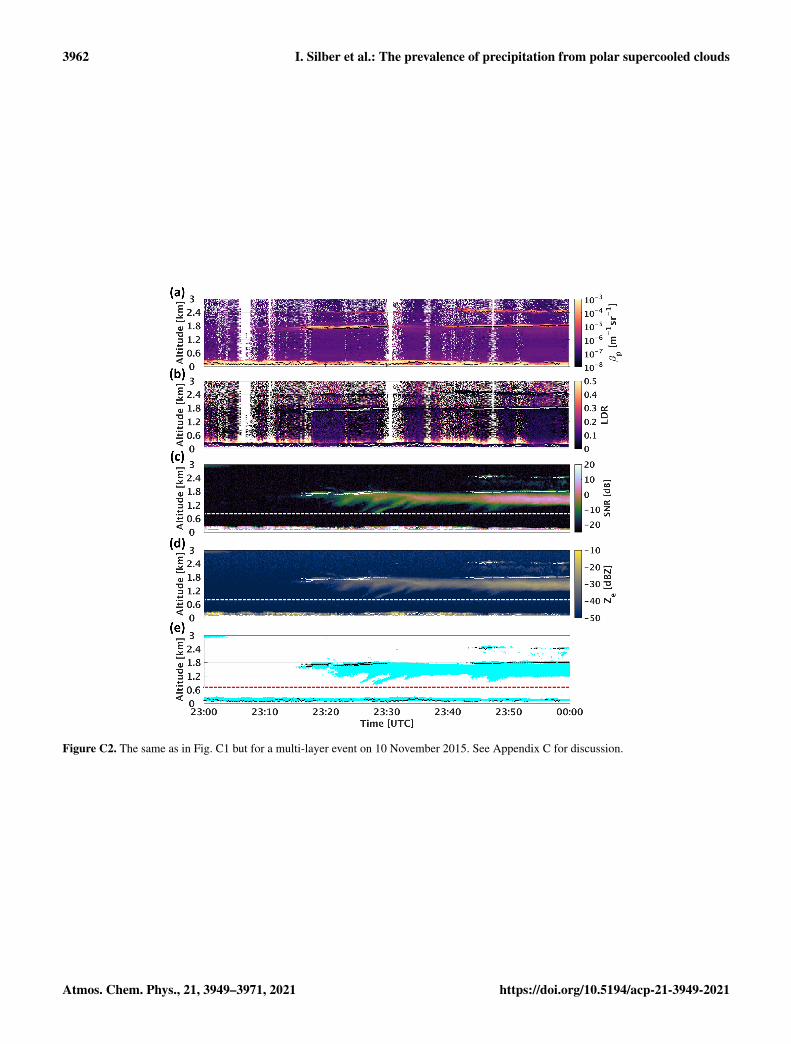
Figure C2 shows a different example of a non-precipitatingcloud layer observed on 10 November 2015. The topmost su-percooled cloud layer (cloud top temperature of ∼−20 ◦C)detected between 23:40–00:00 UTC appears as not precipi-tating because there are no detectible KAZR echoes attachedto the cloud base. However, precipitating ice is detected byKAZR ∼ 150 m below the cloud base. Because the relativehumidity with respect to ice is above 100 % between cloudbase and the precipitating hydrometeors (not shown), we de-duce that the cloud is actually precipitating but the backscat-tered KAZR moderate sensitivity (MD) mode signal is notstrong enough to allow detection of these hydrometeors.
Figure C3 depicts the RCB PDF using different Zemin
values ranging from −50 dBZ (NSA KAZR sensitivity) to−15 dBZ. When the Zemin value is reduced, the PDF peakremains constant at 0.05 mm/h, whereas the left PDF tailapproaches saturation. These results indicate that there arelikely some undetectable weakly precipitating cases owingto radar sensitivity limitations (as exemplified in Figs. C1and C2). However, the consistency of these patterns and theapparent left PDF tail saturation suggest that (1) there is anupper limit to additional information about existing hydrom-eteors that radars with higher sensitivities than KAZR mayadd, and (2) at least in the case of supercooled clouds overthe NSA, the KAZR results presented here do approach thatlimit.
Atmos. Chem. Phys., 21, 3949–3971, 2021 https://doi.org/10.5194/acp-21-3949-2021

I. Silber et al.: The prevalence of precipitation from polar supercooled clouds 3961
Figure C1. Hour containing a non-precipitating supercooled layer between 11:00 and 11:15 UTC on 1 September 2015 over the NSA.(a) High spectral resolution lidar (HSRL; Eloranta, 2005) particulate backscatter cross section, (b) HSRL linear depolarization ratio,(c) KAZR signal-to-noise ratio (SNR), (d) KAZR Ze, and (e) KAZR cloud mask using an SNR threshold of −16 dB (see Silber et al.,2018a). Dashed horizontal white and red lines designate the height below (above) which the KAZR GE (MD) mode is used. Black or whitedots designate the HSRL liquid cloud base height data product (see Silber et al., 2018c, for the algorithm description; Silber et al., 2018b,2019c, for the data product). See Appendix C for discussion.
https://doi.org/10.5194/acp-21-3949-2021 Atmos. Chem. Phys., 21, 3949–3971, 2021
3962 I. Silber et al.: The prevalence of precipitation from polar supercooled clouds
Figure C2. The same as in Fig. C1 but for a multi-layer event on 10 November 2015. See Appendix C for discussion.
Atmos. Chem. Phys., 21, 3949–3971, 2021 https://doi.org/10.5194/acp-21-3949-2021

I. Silber et al.: The prevalence of precipitation from polar supercooled clouds 3963
Figure C3. The PDF of RCB over the NSA using different valuesof Zemin at 1 km (color scale). See Appendix C for discussion.
https://doi.org/10.5194/acp-21-3949-2021 Atmos. Chem. Phys., 21, 3949–3971, 2021
3964 I. Silber et al.: The prevalence of precipitation from polar supercooled clouds
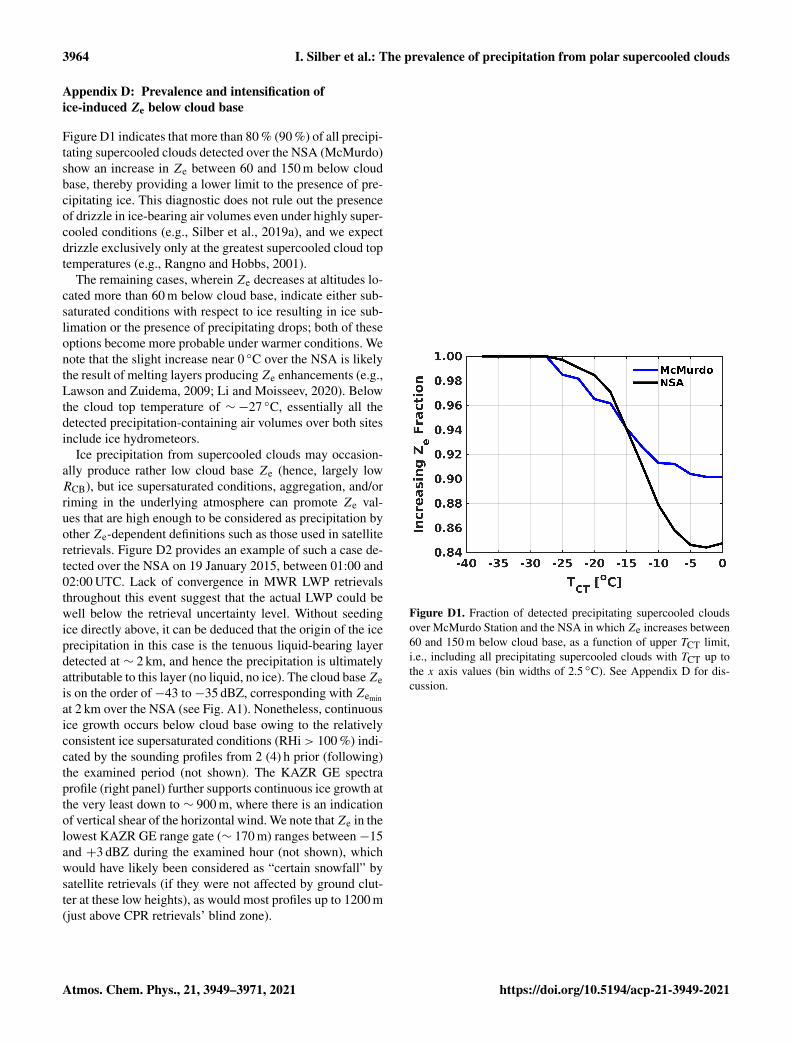
Appendix D: Prevalence and intensification ofice-induced Ze below cloud base
Figure D1 indicates that more than 80 % (90 %) of all precipi-tating supercooled clouds detected over the NSA (McMurdo)show an increase in Ze between 60 and 150 m below cloudbase, thereby providing a lower limit to the presence of pre-cipitating ice. This diagnostic does not rule out the presenceof drizzle in ice-bearing air volumes even under highly super-cooled conditions (e.g., Silber et al., 2019a), and we expectdrizzle exclusively only at the greatest supercooled cloud toptemperatures (e.g., Rangno and Hobbs, 2001).
The remaining cases, wherein Ze decreases at altitudes lo-cated more than 60 m below cloud base, indicate either sub-saturated conditions with respect to ice resulting in ice sub-limation or the presence of precipitating drops; both of theseoptions become more probable under warmer conditions. Wenote that the slight increase near 0 ◦C over the NSA is likelythe result of melting layers producingZe enhancements (e.g.,Lawson and Zuidema, 2009; Li and Moisseev, 2020). Belowthe cloud top temperature of ∼−27 ◦C, essentially all thedetected precipitation-containing air volumes over both sitesinclude ice hydrometeors.
Ice precipitation from supercooled clouds may occasion-ally produce rather low cloud base Ze (hence, largely lowRCB), but ice supersaturated conditions, aggregation, and/orriming in the underlying atmosphere can promote Ze val-ues that are high enough to be considered as precipitation byother Ze-dependent definitions such as those used in satelliteretrievals. Figure D2 provides an example of such a case de-tected over the NSA on 19 January 2015, between 01:00 and02:00 UTC. Lack of convergence in MWR LWP retrievalsthroughout this event suggest that the actual LWP could bewell below the retrieval uncertainty level. Without seedingice directly above, it can be deduced that the origin of the iceprecipitation in this case is the tenuous liquid-bearing layerdetected at ∼ 2 km, and hence the precipitation is ultimatelyattributable to this layer (no liquid, no ice). The cloud baseZeis on the order of−43 to−35 dBZ, corresponding with Zemin
at 2 km over the NSA (see Fig. A1). Nonetheless, continuousice growth occurs below cloud base owing to the relativelyconsistent ice supersaturated conditions (RHi> 100 %) indi-cated by the sounding profiles from 2 (4) h prior (following)the examined period (not shown). The KAZR GE spectraprofile (right panel) further supports continuous ice growth atthe very least down to ∼ 900 m, where there is an indicationof vertical shear of the horizontal wind. We note thatZe in thelowest KAZR GE range gate (∼ 170 m) ranges between−15and +3 dBZ during the examined hour (not shown), whichwould have likely been considered as “certain snowfall” bysatellite retrievals (if they were not affected by ground clut-ter at these low heights), as would most profiles up to 1200 m(just above CPR retrievals’ blind zone).
Figure D1. Fraction of detected precipitating supercooled cloudsover McMurdo Station and the NSA in which Ze increases between60 and 150 m below cloud base, as a function of upper TCT limit,i.e., including all precipitating supercooled clouds with TCT up tothe x axis values (bin widths of 2.5 ◦C). See Appendix D for dis-cussion.
Atmos. Chem. Phys., 21, 3949–3971, 2021 https://doi.org/10.5194/acp-21-3949-2021

I. Silber et al.: The prevalence of precipitation from polar supercooled clouds 3965
Figure D2. (a) KAZR MD mode Ze over the NSA on 19 January 2015 between 01:00 and 02:00 UTC. Black dots designate the HSRL liquidcloud base height data product. (b) KAZR GE spectra profile at 01:39:02 UTC (designated by the dashed white line in the left panel). SeeAppendix D for discussion.
https://doi.org/10.5194/acp-21-3949-2021 Atmos. Chem. Phys., 21, 3949–3971, 2021
3966 I. Silber et al.: The prevalence of precipitation from polar supercooled clouds
Data availability. MWR retrievals (ARM user facility, 2011a,2016), KAZR raw spectra and moment data (ARM user facility,2011b, c, d, 2014a, b, 2015a, b), sounding measurements (ARMuser facility, 2002, 2015c), and the HSRL liquid cloud base heightdata product present in Appendix C (Silber et al., 2018b, 2019c),are available in the ARM data archive (http://www.archive.arm.gov,last access: 21 October 2019).
Author contributions. IS conceptualized the study, developed themethodology, performed the formal analysis, and prepared themanuscript. AMF contributed to study conceptualization andmanuscript preparation. JV contributed to study conceptualizationand development of the methodology and reviewed and edited themanuscript. ASA, GVC, and DAK critically reviewed and editedthe manuscript.
Competing interests. Daniel A. Knopf is on the editorial board ofAtmospheric Chemistry and Physics.
Acknowledgements. We thank Tristan L’Ecuyer andMaria Cadeddu for helpful discussions. Israel Silber and Jo-hannes Verlinde are supported by the DOE grant DE-SC0017981.Israel Silber is also supported by DOE grant DE-SC0018046.Daniel A. Knopf acknowledges support by the DOE grants DE-SC0020006 and DE-SC0021034 and NASA award NNX17AJ12G.Ann M. Fridlind and Andrew S. Ackerman are supported by theNASA Radiation Science and Modeling, Analysis and Predictionprograms. Grégory V. Cesana is supported by a CloudSat-CALIPSO RTOP at the NASA Goddard Institute for SpaceStudies.
Financial support. This research has been supported by the U.S.Department of Energy (grant nos. DE-SC0017981, DE-SC0018046,DE-SC0020006, and DE-SC0021034) and the National Aeronau-tics and Space Administration (grant no. NNX17AJ12G).
Review statement. This paper was edited by Corinna Hoose and re-viewed by two anonymous referees.
References
Alpert, P. A., Aller, J. Y., and Knopf, D. A.: Initiation of the icephase by marine biogenic surfaces in supersaturated gas andsupercooled aqueous phases, Phys. Chem. Chem. Phys., 13,19882–19894, https://doi.org/10.1039/C1CP21844A, 2011.
Atmospheric Radiation Measurement (ARM) user facility: Balloon-Borne Sounding System (SONDEWNPN). 2011-11-01 to 2019-04-30, North Slope Alaska (NSA) Central Facility, Bar-row AK (C1), compiled by: Keeler, E., Ritsche, M., Coul-ter, R., Kyrouac, J., and Holdridge, D., ARM Data Center,https://doi.org/10.5439/1021460, 2002.
Atmospheric Radiation Measurement (ARM) user facility: MWRRetrievals (MWRRET1LILJCLOU). 2011-11-01 to 2019-04-30,North Slope Alaska (NSA) Central Facility, Barrow AK (C1),compiled by: Gaustad, K., Riihimaki, L., and Zhang, D., ARMData Center, https://doi.org/10.5439/1285691, 2011a.
Atmospheric Radiation Measurement (ARM) user facility: KAZRCorrected Data (KAZRCORGE). 2011-11-11 to 2014-02-07,North Slope Alaska (NSA) Central Facility, Barrow AK (C1),compiled by: Johnson, K., Toto, T., and Jensen, M., ARM DataCenter, https://doi.org/10.5439/1228770, 2011b.
Atmospheric Radiation Measurement (ARM) user facility: KAZRCorrected Data (KAZRCORMD). 2011-11-11 to 2014-02-07, North Slope Alaska (NSA) Central Facility, BarrowAK (C1), compiled by: Giangrande, S., ARM Data Center,https://doi.org/10.5439/1350634, 2011c.
Atmospheric Radiation Measurement (ARM) user facility: KaARM Zenith Radar (KAZRSPECCMASKGECOPOL). 2015-01-19 to 2015-01-20, North Slope Alaska (NSA) Central Fa-cility, Barrow AK (C1), compiled by: Lindenmaier, I., Bharad-waj, N., Johnson, K., Nelson, D., Isom, B., Hardin, J.,Matthews, A., Wendler, T., and Castro, V., ARM Data Center,https://doi.org/10.5439/1025218, 2011d.
Atmospheric Radiation Measurement (ARM) user facility: KAZRCorrected Data (KAZRCORGE). 2014-02-08 to 2019-04-30,North Slope Alaska (NSA) Central Facility, Barrow AK (C1),compiled by: Johnson, K., Toto, T., and Giangrande, S., ARMData Center, https://doi.org/10.5439/1389054, 2014a.
Atmospheric Radiation Measurement (ARM) user facility: KAZRCorrected Data (KAZRCORMD). 2014-02-08 to 2019-04-30,North Slope Alaska (NSA) Central Facility, Barrow AK (C1),compiled by: Fairless, T., Giangrande, S., and Johnson, K., ARMData Center, https://doi.org/10.5439/1350634, 2014b.
Atmospheric Radiation Measurement (ARM) user facility: KAZRCorrected Data (KAZRCORGE). 2015-11-18 to 2017-01-02, ARM Mobile Facility (AWR) McMurdo Station RossIce Shelf, Antarctica; AMF2 (M1), compiled by: John-son, K., Toto, T., and Giangrande, S., ARM Data Center,https://doi.org/10.5439/1389054, 2015a.
Atmospheric Radiation Measurement (ARM) user facility: KAZRCorrected Data (KAZRCORMD). 2015-11-17 to 2017-01-02,ARM Mobile Facility (AWR) McMurdo Station Ross Ice Shelf,Antarctica; AMF2 (M1), compiled by: Giangrande, S., ARMData Center, https://doi.org/10.5439/1350634, 2015b.
Atmospheric Radiation Measurement (ARM) user facility: Balloon-Borne Sounding System (SONDEWNPN). 2015-11-30 to2017-01-03, ARM Mobile Facility (AWR) McMurdo Sta-tion Ross Ice Shelf, Antarctica; AMF2 (M1), compiled by:Keeler, E., Coulter, R., and Kyrouac, J., ARM Data Center,https://doi.org/10.5439/1021460, 2015c.
Atmospheric Radiation Measurement (ARM) user facility: MWRRetrievals (MWRRET1LILJCLOU). 2016-01-30 to 2017-01-01,ARM Mobile Facility (AWR) McMurdo Station Ross Ice Shelf,Antarctica; AMF2 (M1), compiled by: Zhang, D., ARM DataCenter, https://doi.org/10.5439/1027369, 2016.
Avramov, A., Ackerman, A. S., Fridlind, A. M., van Diedenhoven,B., Botta, G., Aydin, K., Verlinde, J., Korolev, A. V, Strapp, J.W., McFarquhar, G. M., Jackson, R., Brooks, S. D., Glen, A., andWolde, M.: Toward ice formation closure in Arctic mixed-phase
Atmos. Chem. Phys., 21, 3949–3971, 2021 https://doi.org/10.5194/acp-21-3949-2021
I. Silber et al.: The prevalence of precipitation from polar supercooled clouds 3967
boundary layer clouds during ISDAC, J. Geophys. Res.-Atmos.,116, D00T08, https://doi.org/10.1029/2011JD015910, 2011.
Belosi, F., Santachiara, G., and Prodi, F.: Ice-forming nuclei inAntarctica: New and past measurements, Atmos. Res., 145–146,105–111, https://doi.org/10.1016/j.atmosres.2014.03.030, 2014.
Bennartz, R., Fell, F., Pettersen, C., Shupe, M. D., and Schuet-temeyer, D.: Spatial and temporal variability of snowfall overGreenland from CloudSat observations, Atmos. Chem. Phys., 19,8101–8121, https://doi.org/10.5194/acp-19-8101-2019, 2019.
Bromwich, D. H., Nicolas, J. P., Hines, K. M., Kay, J. E., Key, E. L.,Lazzara, M. A., Lubin, D., McFarquhar, G. M., Gorodetskaya, I.V., Grosvenor, D. P., Lachlan-Cope, T., and van Lipzig, N. P. M.:Tropospheric clouds in Antarctica, Rev. Geophys., 50, RG1004,https://doi.org/10.1029/2011RG000363, 2012.
Bühl, J., Seifert, P., Myagkov, A., and Ansmann, A.: Measuringice- and liquid-water properties in mixed-phase cloud layers atthe Leipzig Cloudnet station, Atmos. Chem. Phys., 16, 10609–10620, https://doi.org/10.5194/acp-16-10609-2016, 2016.
Cadeddu, M. P., Payne, V. H., Clough, S. A., Cady-Pereira, K., andLiljegren, J. C.: Effect of the Oxygen Line-Parameter Modelingon Temperature and Humidity Retrievals From Ground-BasedMicrowave Radiometers, IEEE T. Geosci. Remote, 45, 2216–2223, https://doi.org/10.1109/TGRS.2007.894063, 2007.
Cadeddu, M. P., Turner, D. D., and Liljegren, J. C.: ANeural Network for Real-Time Retrievals of PWV andLWP From Arctic Millimeter-Wave Ground-Based Ob-servations, IEEE T. Geosci. Remote, 47, 1887–1900,https://doi.org/10.1109/TGRS.2009.2013205, 2009.
Cadeddu, M. P., Liljegren, J. C., and Turner, D. D.: The Atmo-spheric radiation measurement (ARM) program network of mi-crowave radiometers: instrumentation, data, and retrievals, At-mos. Meas. Tech., 6, 2359–2372, https://doi.org/10.5194/amt-6-2359-2013, 2013.
Castellani, B. B., Shupe, M. D., Hudak, D. R., and Shep-pard, B. E.: The annual cycle of snowfall at Summit,Greenland, J. Geophys. Res.-Atmos., 120, 6654–6668,https://doi.org/10.1002/2015JD023072, 2015.
Cesana, G., Waliser, D. E., Jiang, X., and Li, J.-L. F.: Multi-model evaluation of cloud phase transition using satellite andreanalysis data, J. Geophys. Res.-Atmos., 120, 7871–7892,https://doi.org/10.1002/2014JD022932, 2015.
Creamean, J. M., Primm, K. M., Tolbert, M. A., Hall, E. G.,Wendell, J., Jordan, A., Sheridan, P. J., Smith, J., and Schnell,R. C.: HOVERCAT: a novel aerial system for evaluation ofaerosol–cloud interactions, Atmos. Meas. Tech., 11, 3969–3985,https://doi.org/10.5194/amt-11-3969-2018, 2018.
Creamean, J. M., de Boer, G., Telg, H., Mei, F., Dexheimer,D., Shupe, M. D., Solomon, A., and McComiskey, A.: As-sessing the vertical structure of Arctic aerosols using balloon-borne measurements, Atmos. Chem. Phys., 21, 1737–1757,https://doi.org/10.5194/acp-21-1737-2021, 2021.
Cronin, T. W. and Tziperman, E.: Low clouds suppress Arc-tic air formation and amplify high-latitude continental win-ter warming, P. Natl. Acad. Sci. USA, 112, 11490–11495,https://doi.org/10.1073/pnas.1510937112, 2015.
de Boer, G., Morrison, H., Shupe, M. D., and Hildner, R.: Evi-dence of liquid dependent ice nucleation in high-latitude strat-iform clouds from surface remote sensors, Geophys. Res. Lett.,38, L01803, https://doi.org/10.1029/2010GL046016, 2011.
DeMott, P. J.: Measurements and analysis of ice nuclei relevant towest coast U.S. precipitation, DOE-CSU-14354, Department ofEnergy, United States, 2019.
DeMott, P. J., Prenni, A. J., Liu, X., Kreidenweis, S. M., Petters, M.D., Twohy, C. H., Richardson, M. S., Eidhammer, T., and Rogers,D. C.: Predicting global atmospheric ice nuclei distributions andtheir impacts on climate, P. Natl. Acad. Sci. USA, 107, 11217–11222, https://doi.org/10.1073/pnas.0910818107, 2010.
Dong, X., Xi, B., Crosby, K., Long, C. N., Stone, R. S., and Shupe,M. D.: A 10 year climatology of Arctic cloud fraction and ra-diative forcing at Barrow, Alaska, J. Geophys. Res.-Atmos., 115,D17212, https://doi.org/10.1029/2009JD013489, 2010.
Edel, L., Claud, C., Genthon, C., Palerme, C., Wood, N.,L’Ecuyer, T., and Bromwich, D.: Arctic Snowfall from Cloud-Sat Observations and Reanalyses, J. Climate, 33, 2093–2109,https://doi.org/10.1175/JCLI-D-19-0105.1, 2020.
Eloranta, E. W.: High spectral resolution lidar, in: Lidar: Range-Resolved Optical Remote Sensing of the Atmosphere, SpringerNew York, New York, NY, 143–163, 2005.
Fountain, A. G. and Ohtake, T.: Concentrations and SourceAreas of Ice Nuclei in the Alaskan Atmosphere, J. Clim.Appl. Meteorol., 24, 377–382, https://doi.org/10.1175/1520-0450(1985)024<0377:CASAOI>2.0.CO;2, 1985.
Fridlind, A. M. and Ackerman, A. S.: Simulations of Arctic Mixed-Phase Boundary Layer Clouds: Advances in Understanding andOutstanding Questions, in Mixed-Phase Clouds Observationsand Modeling, edited by: Andronache, C., Elsevier, Amsterdam,the Netherlands, 153–183, 2018.
Fridlind, A. M., van Diedenhoven, B., Ackerman, A. S., Avramov,A., Mrowiec, A., Morrison, H., Zuidema, P., and Shupe, M. D.: AFIRE-ACE/SHEBA Case Study of Mixed-Phase Arctic Bound-ary Layer Clouds: Entrainment Rate Limitations on Rapid Pri-mary Ice Nucleation Processes, J. Atmos. Sci., 69, 365–389,https://doi.org/10.1175/JAS-D-11-052.1, 2012.
Fukuta, N. and Takahashi, T.: The Growth of Atmo-spheric Ice Crystals: A Summary of Findings in Ver-tical Supercooled Cloud Tunnel Studies, J. Atmos.Sci., 56, 1963–1979, https://doi.org/10.1175/1520-0469(1999)056<1963:TGOAIC>2.0.CO;2, 1999.
Grazioli, J., Madeleine, J.-B., Gallée, H., Forbes, R. M., Gen-thon, C., Krinner, G., and Berne, A.: Katabatic winds di-minish precipitation contribution to the Antarctic ice massbalance, P. Natl. Acad. Sci. USA, 114, 10858–10863,https://doi.org/10.1073/pnas.1707633114, 2017.
Hallett, J. and Mossop, S. C.: Production of secondary iceparticles during the riming process, Nature, 249, 26–28,https://doi.org/10.1038/249026a0, 1974.
Hamada, A. and Takayabu, Y. N.: Improvements in Detection ofLight Precipitation with the Global Precipitation MeasurementDual-Frequency Precipitation Radar (GPM DPR), J. Atmos.Ocean. Tech., 33, 653–667, https://doi.org/10.1175/JTECH-D-15-0097.1, 2016.
Haynes, J. M., L’Ecuyer, T. S., Stephens, G. L., Miller, S. D.,Mitrescu, C., Wood, N. B., and Tanelli, S.: Rainfall retrievalover the ocean with spaceborne W-band radar, J. Geophys. Res.-Atmos., 114, D00A22, https://doi.org/10.1029/2008JD009973,2009.
https://doi.org/10.5194/acp-21-3949-2021 Atmos. Chem. Phys., 21, 3949–3971, 2021
3968 I. Silber et al.: The prevalence of precipitation from polar supercooled clouds
Hegg, D. A. and Baker, M. B.: Nucleation in the atmosphere,Rep. Prog. Phys., 72, 56801, https://doi.org/10.1088/0034-4885/72/5/056801, 2009.
Heymsfield, A. J., Protat, A., Bouniol, D., Austin, R. T., Hogan,R. J., Delanoë, J., Okamoto, H., Sato, K., van Zadelhoff,G.-J., Donovan, D. P., and Wang, Z.: Testing IWC Re-trieval Methods Using Radar and Ancillary Measurementswith In Situ Data, J. Appl. Meteorol. Climatol., 47, 135–163,https://doi.org/10.1175/2007JAMC1606.1, 2008.
Hogan, R. J., Mittermaier, M. P., and Illingworth, A. J.:The Retrieval of Ice Water Content from Radar Reflectiv-ity Factor and Temperature and Its Use in Evaluating aMesoscale Model, J. Appl. Meteorol. Climatol., 45, 301–317,https://doi.org/10.1175/JAM2340.1, 2006.
Holdridge, D., Ritsche, M., Prell, J., and Coulter, R.: Balloon-BorneSounding System (SONDE) Handbook, ARM-TR-029, DOE Of-fice of Science, Office of Biological and Environmental Re-search, United States, 2011.
Hou, A. Y., Kakar, R. K., Neeck, S., Azarbarzin, A. A., Kum-merow, C. D., Kojima, M., Oki, R., Nakamura, K., and Iguchi,T.: The Global Precipitation Measurement Mission, B. Am. Me-teorol. Soc., 95, 701–722, https://doi.org/10.1175/BAMS-D-13-00164.1, 2013.
Illingworth, A. J., Barker, H. W., Beljaars, A., Ceccaldi, M.,Chepfer, H., Clerbaux, N., Cole, J., Delanoë, J., Domenech,C., Donovan, D. P., Fukuda, S., Hirakata, M., Hogan, R. J.,Huenerbein, A., Kollias, P., Kubota, T., Nakajima, T., Naka-jima, T. Y., Nishizawa, T., Ohno, Y., Okamoto, H., Oki, R.,Sato, K., Satoh, M., Shephard, M. W., Velázquez-Blázquez, A.,Wandinger, U., Wehr, T., and van Zadelhoff, G.-J.: The Earth-CARE Satellite: The Next Step Forward in Global Measurementsof Clouds, Aerosols, Precipitation, and Radiation, B. Am. Mete-orol. Soc., 96, 1311–1332, https://doi.org/10.1175/BAMS-D-12-00227.1, 2015.
Kanji, Z. A., Ladino, L. A., Wex, H., Boose, Y., Burkert-Kohn, M., Cziczo, D. J., and Krämer, M.: Overview ofIce Nucleating Particles, Meteorol. Monogr., 58, 1.1–1.33,https://doi.org/10.1175/AMSMONOGRAPHS-D-16-0006.1,2017.
Kay, J. E., L’Ecuyer, T., Pendergrass, A., Chepfer, H., Guzman,R., and Yettella, V.: Scale-Aware and Definition-Aware Evalu-ation of Modeled Near-Surface Precipitation Frequency UsingCloudSat Observations, J. Geophys. Res.-Atmos., 123, 4294–4309, https://doi.org/10.1002/2017JD028213, 2018.
Knopf, D. A., Alpert, P. A., and Wang, B.: The Roleof Organic Aerosol in Atmospheric Ice Nucleation:A Review, ACS Earth Space Chem., 2, 168–202,https://doi.org/10.1021/acsearthspacechem.7b00120, 2018.
Kollias, P., Tanelli, S., Battaglia, A., and Tatarevic, A.: Evalu-ation of EarthCARE Cloud Profiling Radar Doppler VelocityMeasurements in Particle Sedimentation Regimes, J. Atmos.Ocean. Tech., 31, 366–386, https://doi.org/10.1175/JTECH-D-11-00202.1, 2014.
Kollias, P., Puigdomènech Treserras, B., and Protat, A.: Calibra-tion of the 2007–2017 record of Atmospheric Radiation Mea-surements cloud radar observations using CloudSat, Atmos.Meas. Tech., 12, 4949–4964, https://doi.org/10.5194/amt-12-4949-2019, 2019.
Korolev, A., Heckman, I., Wolde, M., Ackerman, A. S., Fridlind, A.M., Ladino, L. A., Lawson, R. P., Milbrandt, J., and Williams,E.: A new look at the environmental conditions favorable tosecondary ice production, Atmos. Chem. Phys., 20, 1391–1429,https://doi.org/10.5194/acp-20-1391-2020, 2020.
Kulie, M. S. and Bennartz, R.: Utilizing Spaceborne Radars to Re-trieve Dry Snowfall, J. Appl. Meteorol. Climatol., 48, 2564–2580, https://doi.org/10.1175/2009JAMC2193.1, 2009.
Lamer, K., Puigdomènech Treserras, B., Zhu, Z., Isom, B.,Bharadwaj, N., and Kollias, P.: Characterization of shallowoceanic precipitation using profiling and scanning radar obser-vations at the Eastern North Atlantic ARM observatory, At-mos. Meas. Tech., 12, 4931–4947, https://doi.org/10.5194/amt-12-4931-2019, 2019.
Lamer, K., Kollias, P., Battaglia, A., and Preval, S.: Mind thegap – Part 1: Accurately locating warm marine boundarylayer clouds and precipitation using spaceborne radars, At-mos. Meas. Tech., 13, 2363–2379, https://doi.org/10.5194/amt-13-2363-2020, 2020.
Lauber, A., Kiselev, A., Pander, T., Handmann, P., and Leisner, T.:Secondary Ice Formation during Freezing of Levitated Droplets,J. Atmos. Sci., 75, 2815–2826, https://doi.org/10.1175/JAS-D-18-0052.1, 2018.
Lawson, R. P. and Zuidema, P.: Aircraft Microphysicaland Surface-Based Radar Observations of Summer-time Arctic Clouds, J. Atmos. Sci., 66, 3505–3529,https://doi.org/10.1175/2009JAS3177.1, 2009.
Lemonnier, F., Madeleine, J.-B., Claud, C., Palerme, C.,Genthon, C., L’Ecuyer, T., and Wood, N. B.: CloudSat-Inferred Vertical Structure of Snowfall Over the AntarcticContinent, J. Geophys. Res.-Atmos., 125, e2019JD031399,https://doi.org/10.1029/2019JD031399, 2020.
Li, H. and Moisseev, D.: Two Layers of Melting Ice Par-ticles Within a Single Radar Bright Band: Interpretationand Implications, Geophys. Res. Lett., 47, e2020GL087499,https://doi.org/10.1029/2020GL087499, 2020.
Lubin, D., Zhang, D., Silber, I., Scott, R. C., Kalogeras, P.,Battaglia, A., Bromwich, D. H., Cadeddu, M., Eloranta, E.,Fridlind, A., Frossard, A., Hines, K. M., Kneifel, S., Leaitch,W. R., Lin, W., Nicolas, J., Powers, H., Quinn, P. K., Rowe,P., Russell, L. M., Sharma, S., Verlinde, J., and Vogelmann,A. M.: AWARE: The Atmospheric Radiation Measurement(ARM) West Antarctic Radiation Experiment, B. Am. Meteorol.Soc., 101, E1069–E1091, https://doi.org/10.1175/BAMS-D-18-0278.1, 2020.
Maahn, M., Burgard, C., Crewell, S., Gorodetskaya, I. V, Kneifel,S., Lhermitte, S., Van Tricht, K., and van Lipzig, N. P. M.: Howdoes the spaceborne radar blind zone affect derived surfacesnowfall statistics in polar regions?, J. Geophys. Res.-Atmos.,119, 13604–13620, https://doi.org/10.1002/2014JD022079,2014.
Matrosov, S. Y.: Modeling Backscatter Properties of Snowfallat Millimeter Wavelengths, J. Atmos. Sci., 64, 1727–1736,https://doi.org/10.1175/JAS3904.1, 2007.
McCoy, D. T., Hartmann, D. L., and Grosvenor, D. P.: ObservedSouthern Ocean Cloud Properties and Shortwave Reflection. PartII: Phase Changes and Low Cloud Feedback, J. Climate, 27,8858–8868, https://doi.org/10.1175/JCLI-D-14-00288.1, 2014.
Atmos. Chem. Phys., 21, 3949–3971, 2021 https://doi.org/10.5194/acp-21-3949-2021
I. Silber et al.: The prevalence of precipitation from polar supercooled clouds 3969
McCoy, D. T., Hartmann, D. L., Zelinka, M. D.,Ceppi, P., and Grosvenor, D. P.: Mixed-phase cloudphysics and Southern Ocean cloud feedback in cli-mate models, J. Geophys. Res.-Atmos., 120, 9539–9554,https://doi.org/10.1002/2015JD023603, 2015.
McIlhattan, E. A., L’Ecuyer, T. S., and Miller, N. B.: Observa-tional Evidence Linking Arctic Supercooled Liquid Cloud Bi-ases in CESM to Snowfall Processes, J. Climate, 30, 4477–4495,https://doi.org/10.1175/JCLI-D-16-0666.1, 2017.
Miller, N. B., Shupe, M. D., Cox, C. J., Walden, V. P., Turner, D. D.,and Steffen, K.: Cloud Radiative Forcing at Summit, Greenland,J. Climate, 28, 6267–6280, https://doi.org/10.1175/JCLI-D-15-0076.1, 2015.
Morris, V. R.: Microwave radiometer (MWR) handbook, ARM-TR-016, DOE Office of Science, Office of Biological and Environ-mental Research, United States Department of Energy, UnitedStates, 2006.
Morrison, H., Zuidema, P., Ackerman, A. S., Avramov, A., de Boer,G., Fan, J., Fridlind, A. M., Hashino, T., Harrington, J. Y., Luo,Y., Ovchinnikov, M., and Shipway, B.: Intercomparison of cloudmodel simulations of Arctic mixed-phase boundary layer cloudsobserved during SHEBA/FIRE-ACE, J. Adv. Model. Earth Sy.,3, M05001, https://doi.org/10.1029/2011MS000066, 2011.
Mülmenstädt, J., Nam, C., Salzmann, M., Kretzschmar, J.,L’Ecuyer, T. S., Lohmann, U., Ma, P.-L., Myhre, G., Neubauer,D., Stier, P., Suzuki, K., Wang, M., and Quaas, J.: Reduc-ing the aerosol forcing uncertainty using observational con-straints on warm rain processes, Sci. Adv., 6, eaaz6433,https://doi.org/10.1126/sciadv.aaz6433, 2020.
Nomokonova, T., Ebell, K., Löhnert, U., Maturilli, M., Ritter,C., and O’Connor, E.: Statistics on clouds and their relationto thermodynamic conditions at Ny-Ålesund using ground-based sensor synergy, Atmos. Chem. Phys., 19, 4105–4126,https://doi.org/10.5194/acp-19-4105-2019, 2019.
Ovchinnikov, M., Ackerman, A. S., Avramov, A., Cheng, A.,Fan, J., Fridlind, A. M., Ghan, S., Harrington, J., Hoose,C., Korolev, A., McFarquhar, G. M., Morrison, H., Pauk-ert, M., Savre, J., Shipway, B. J., Shupe, M. D., Solomon,A., and Sulia, K.: Intercomparison of large-eddy simulationsof Arctic mixed-phase clouds: Importance of ice size distri-bution assumptions, J. Adv. Model. Earth Sy., 6, 223–248,https://doi.org/10.1002/2013MS000282, 2014.
Pettersen, C., Bennartz, R., Merrelli, A. J., Shupe, M. D., Turner,D. D., and Walden, V. P.: Precipitation regimes over centralGreenland inferred from 5 years of ICECAPS observations, At-mos. Chem. Phys., 18, 4715–4735, https://doi.org/10.5194/acp-18-4715-2018, 2018.
Pinsky, M., Khain, A., and Korolev, A.: Phase transfor-mations in an ascending adiabatic mixed-phase cloudvolume, J. Geophys. Res.-Atmos., 120, 3329–3353,https://doi.org/10.1002/2015JD023094, 2015.
Pithan, F., Svensson, G., Caballero, R., Chechin, D., Cronin, T.W., Ekman, A. M. L., Neggers, R., Shupe, M. D., Solomon, A.,Tjernström, M., and Wendisch, M.: Role of air-mass transfor-mations in exchange between the Arctic and mid-latitudes, Nat.Geosci., 11, 805–812, https://doi.org/10.1038/s41561-018-0234-1, 2018.
Quinn, P. K., Miller, T. L., Bates, T. S., Ogren, J. A., An-drews, E., and Shaw, G. E.: A 3-year record of simultaneously
measured aerosol chemical and optical properties at Barrow,Alaska, J. Geophys. Res.-Atmos., 107, AAC 8-1–AAC 8-15,https://doi.org/10.1029/2001JD001248, 2002.
Quinn, P. K., Bates, T. S., Schulz, K., and Shaw, G. E.:Decadal trends in aerosol chemical composition at Barrow,Alaska: 1976–2008, Atmos. Chem. Phys., 9, 8883–8888,https://doi.org/10.5194/acp-9-8883-2009, 2009.
Rangno, A. L. and Hobbs, P. V: Ice particles in stratiform clouds inthe Arctic and possible mechanisms for the production of highice concentrations, J. Geophys. Res.-Atmos., 106, 15065–15075,https://doi.org/10.1029/2000JD900286, 2001.
Scott, R. C. and Lubin, D.: Unique manifestations of mixed-phase cloud microphysics over Ross Island and the RossIce Shelf, Antarctica, Geophys. Res. Lett., 43, 2936–2945,https://doi.org/10.1002/2015GL067246, 2016.
Sedlar, J.: Implications of Limited Liquid Water Path on StaticMixing within Arctic Low-Level Clouds, J. Appl. Meteorol.Climatol., 53, 2775–2789, https://doi.org/10.1175/JAMC-D-14-0065.1, 2014.
Sedlar, J. and Shupe, M. D.: Characteristic nature of vertical mo-tions observed in Arctic mixed-phase stratocumulus, Atmos.Chem. Phys., 14, 3461–3478, https://doi.org/10.5194/acp-14-3461-2014, 2014.
Shupe, M. D.: Clouds at Arctic Atmospheric Observatories. Part II:Thermodynamic Phase Characteristics, J. Appl. Meteorol. Cli-matol., 50, 645–661, https://doi.org/10.1175/2010JAMC2468.1,2011.
Shupe, M. D. and Intrieri, J. M.: Cloud Radiative Forc-ing of the Arctic Surface: The Influence of CloudProperties, Surface Albedo, and Solar Zenith Angle,J. Climate, 17, 616–628, https://doi.org/10.1175/1520-0442(2004)017<0616:CRFOTA>2.0.CO;2, 2004.
Shupe, M. D., Matrosov, S. Y., and Uttal, T.: Arctic mixed-phasecloud properties derived from surface-based sensors at SHEBA,J. Atmos. Sci., 63, 697–711, 2006.
Shupe, M. D., Kollias, P., Persson, P. O. G., and Mc-Farquhar, G. M.: Vertical Motions in Arctic Mixed-Phase Stratiform Clouds, J. Atmos. Sci., 65, 1304–1322,https://doi.org/10.1175/2007JAS2479.1, 2008a.
Shupe, M. D., Kollias, P., Poellot, M., and Eloranta, E.:On Deriving Vertical Air Motions from Cloud RadarDoppler Spectra, J. Atmos. Ocean. Tech., 25, 547–557,https://doi.org/10.1175/2007JTECHA1007.1, 2008b.
Shupe, M. D., Walden, V. P., Eloranta, E., Uttal, T., Campbell,J. R., Starkweather, S. M., and Shiobara, M.: Clouds at Arc-tic Atmospheric Observatories. Part I: Occurrence and Macro-physical Properties, J. Appl. Meteorol. Climatol., 50, 626–644,https://doi.org/10.1175/2010JAMC2467.1, 2011.
Silber, I., Verlinde, J., Eloranta, E. W., and Cadeddu, M.: Antarc-tic cloud macrophysical, thermodynamic phase, and atmosphericinversion coupling properties at McMurdo Station. Part I: Prin-cipal data processing and climatology, J. Geophys. Res.-Atmos.,123, 6099–6121, https://doi.org/10.1029/2018JD028279, 2018a.
Silber, I., Verlinde, J., Eloranta, E. W., Flynn, C. J., andFlynn, D. M.: HSRL Liquid cloud base height / MPLLiquid cloud base height, DOE ARM Data Archive,https://doi.org/10.5439/1438194, 2018b.
Silber, I., Verlinde, J., Eloranta, E. W., Flynn, C. J., and Flynn, D.M.: Polar liquid cloud base detection algorithms for high spec-
https://doi.org/10.5194/acp-21-3949-2021 Atmos. Chem. Phys., 21, 3949–3971, 2021
3970 I. Silber et al.: The prevalence of precipitation from polar supercooled clouds
tral resolution or micropulse lidar data, J. Geophys. Res.-Atmos.,123, 4310–4322, https://doi.org/10.1029/2017JD027840, 2018c.
Silber, I., Fridlind, A. M., Verlinde, J., Ackerman, A. S.,Chen, Y.-S., Bromwich, D. H., Wang, S.-H., Cadeddu,M., and Eloranta, E. W.: Persistent Supercooled Drizzleat Temperatures below −25 ◦C Observed at McMurdo Sta-tion, Antarctica, J. Geophys. Res.-Atmos., 124, 10878–10895,https://doi.org/10.1029/2019JD030882, 2019a.
Silber, I., Verlinde, J., Cadeddu, M., Flynn, C. J., Vogelmann, A.M., and Eloranta, E. W.: Antarctic cloud macrophysical, ther-modynamic phase, and atmospheric inversion coupling proper-ties at McMurdo Station. Part II: Radiative impact during differ-ent synoptic regimes, J. Geophys. Res.-Atmos., 124, 1697–1719,https://doi.org/10.1029/2018JD029471, 2019b.
Silber, I., Verlinde, J., and Eloranta, E. W.: HSRL Liq-uid cloud base height (nsaC1), DOE ARM Data Archive,https://doi.org/10.5439/1532341, 2019c.
Silber, I., Verlinde, J., Wang, S.-H., Bromwich, D. H., Fridlind,A. M., Cadeddu, M., and Eloranta, E. W.: Cloud Influenceon ERA5 and AMPS Surface Downwelling Longwave Radi-ation Biases in West Antarctica, J. Climate, 32, 7935–7949,https://doi.org/10.1175/JCLI-D-19-0149.1, 2019d.
Silber, I., Fridlind, A. M., Verlinde, J., Russell, L. M., andAckerman, A. S.: Nonturbulent Liquid-Bearing Polar Clouds:Observed Frequency of Occurrence and Simulated Sensitivityto Gravity Waves, Geophys. Res. Lett., 47, e2020GL087099,https://doi.org/10.1029/2020GL087099, 2020b.
Silber, I., Verlinde, J., Wen, G., and Eloranta, E. W.: CanEmbedded Liquid Cloud Layer Volumes Be Classi-fied in Polar Clouds Using a Single-Frequency Zenith-Pointing Radar?, IEEE Geosci. Remote S., 17, 222–226,https://doi.org/10.1109/LGRS.2019.2918727, 2020a.
Skofronick-Jackson, G., Kulie, M., Milani, L., Munchak, S. J.,Wood, N. B., and Levizzani, V.: Satellite Estimation of FallingSnow: A Global Precipitation Measurement (GPM) Core Obser-vatory Perspective, J. Appl. Meteorol. Climatol., 58, 1429–1448,https://doi.org/10.1175/JAMC-D-18-0124.1, 2019.
Smalley, M., L’Ecuyer, T., Lebsock, M., and Haynes, J.: A Compar-ison of Precipitation Occurrence from the NCEP Stage IV QPEProduct and the CloudSat Cloud Profiling Radar, J. Hydrome-teorol., 15, 444–458, https://doi.org/10.1175/JHM-D-13-048.1,2014.
Solomon, A., Shupe, M. D., Persson, P. O. G., and Morrison,H.: Moisture and dynamical interactions maintaining decou-pled Arctic mixed-phase stratocumulus in the presence of ahumidity inversion, Atmos. Chem. Phys., 11, 10127–10148,https://doi.org/10.5194/acp-11-10127-2011, 2011.
Solomon, A., Feingold, G., and Shupe, M. D.: The role of ice nu-clei recycling in the maintenance of cloud ice in Arctic mixed-phase stratocumulus, Atmos. Chem. Phys., 15, 10631–10643,https://doi.org/10.5194/acp-15-10631-2015, 2015.
Souverijns, N., Gossart, A., Lhermitte, S., Gorodetskaya, I. V,Kneifel, S., Maahn, M., Bliven, F. L., and van Lipzig, N.P. M.: Estimating radar reflectivity - Snowfall rate relation-ships and their uncertainties over Antarctica by combining dis-drometer and radar observations, Atmos. Res., 196, 211–223,https://doi.org/10.1016/j.atmosres.2017.06.001, 2017.
Stephens, G. L., Vane, D. G., Boain, R. J., Mace, G. G., Sassen,K., Wang, Z., Illingworth, A. J., O’Connor, E. J., Rossow, W.
B., Durden, S. L., Miller, S. D., Austin, R. T., Benedetti, A.,Mitrescu, C., and CloudSat Science Team, T.: The Cloudsat Mis-sion and the A-Train, B. Am. Meteorol. Soc., 83, 1771–1790,https://doi.org/10.1175/BAMS-83-12-1771, 2002.
Tan, I. and Storelvmo, T.: Evidence of Strong Contributions FromMixed-Phase Clouds to Arctic Climate Change, Geophys. Res.Lett., 46, 2894–2902, https://doi.org/10.1029/2018GL081871,2019.
Tan, I., Storelvmo, T., and Zelinka, M. D.: Observational constraintson mixed-phase clouds imply higher climate sensitivity, Science,352, 224–227, https://doi.org/10.1126/science.aad5300, 2016.
Tanelli, S., Durden, S. L., Im, E., Pak, K. S., Reinke, D. G., Par-tain, P., Haynes, J. M., and Marchand, R. T.: CloudSat’s CloudProfiling Radar After Two Years in Orbit: Performance, Calibra-tion, and Processing, IEEE T. Geosci. Remote, 46, 3560–3573,https://doi.org/10.1109/TGRS.2008.2002030, 2008.
Tsushima, Y., Emori, S., Ogura, T., Kimoto, M., Webb, M. J.,Williams, K. D., Ringer, M. A., Soden, B. J., Li, B., and An-dronova, N.: Importance of the mixed-phase cloud distribution inthe control climate for assessing the response of clouds to carbondioxide increase: a multi-model study, Clim. Dyn., 27, 113–126,https://doi.org/10.1007/s00382-006-0127-7, 2006.
Turner, D. D., Clough, S. A., Liljegren, J. C., Clothiaux,E. E., Cady-Pereira, K. E., and Gaustad, K. L.: Retriev-ing Liquid Water Path and Precipitable Water Vapor Fromthe Atmospheric Radiation Measurement (ARM) MicrowaveRadiometers, IEEE T. Geosci. Remote, 45, 3680–3690,https://doi.org/10.1109/TGRS.2007.903703, 2007.
Turner, D. D., Shupe, M. D.,and Zwink, A. B.: Characteristic At-mospheric Radiative Heating Rate Profiles in Arctic Clouds asObserved at Barrow, Alaska, J. Appl. Meteorol. Climatol., 57,953–968, https://doi.org/10.1175/JAMC-D-17-0252.1, 2018.
Ulbrich, C. W.: Natural Variations in the Analytical Formof the Raindrop Size Distribution, J. Appl. Meteorol.Climatol., 22, 1764–1775, https://doi.org/10.1175/1520-0450(1983)022<1764:NVITAF>2.0.CO;2, 1983.
Vali, G., DeMott, P. J., Möhler, O., and Whale, T. F.: TechnicalNote: A proposal for ice nucleation terminology, Atmos. Chem.Phys., 15, 10263–10270, https://doi.org/10.5194/acp-15-10263-2015, 2015.
Vassel, M., Ickes, L., Maturilli, M., and Hoose, C.: Classi-fication of Arctic multilayer clouds using radiosonde andradar data in Svalbard, Atmos. Chem. Phys., 19, 5111–5126,https://doi.org/10.5194/acp-19-5111-2019, 2019.
Vergara-Temprado, J., Miltenberger, A. K., Furtado, K.,Grosvenor, D. P., Shipway, B. J., Hill, A. A., Wilkinson,J. M., Field, P. R., Murray, B. J., and Carslaw, K. S.:Strong control of Southern Ocean cloud reflectivity by ice-nucleating particles, P. Natl. Acad. Sci. USA, 115, 2687–2692,https://doi.org/10.1073/pnas.1721627115, 2018.
Verlinde, J., Rambukkange, M. P., Clothiaux, E. E., McFar-quhar, G. M., and Eloranta, E. W.: Arctic multilayered, mixed-phase cloud processes revealed in millimeter-wave cloud radarDoppler spectra, J. Geophys. Res.-Atmos., 118, 13199–13213,https://doi.org/10.1002/2013JD020183, 2013.
Atmos. Chem. Phys., 21, 3949–3971, 2021 https://doi.org/10.5194/acp-21-3949-2021

I. Silber et al.: The prevalence of precipitation from polar supercooled clouds 3971
Verlinde, J., Zak, B. D., Shupe, M. D., Ivey, M. D.,and Stamnes, K.: The ARM North Slope of Alaska(NSA) Sites, Meteorol. Monogr., 57, 8.1–8.13,https://doi.org/10.1175/AMSMONOGRAPHS-D-15-0023.1,2016.
Villanueva, D., Heinold, B., Seifert, P., Deneke, H., Radenz, M., andTegen, I.: The day-to-day co-variability between mineral dustand cloud glaciation: a proxy for heterogeneous freezing, At-mos. Chem. Phys., 20, 2177–2199, https://doi.org/10.5194/acp-20-2177-2020, 2020.
Westbrook, C. D. and Illingworth, A. J.: The formation of ice ina long-lived supercooled layer cloud, Q. J. Roy. Meteorol. Soc.,139, 2209–2221, https://doi.org/10.1002/qj.2096, 2013.
Westwater, E. R., Han, Y., Shupe, M. D., and Matrosov, S. Y.:Analysis of integrated cloud liquid and precipitable water vaporretrievals from microwave radiometers during the Surface HeatBudget of the Arctic Ocean project, J. Geophys. Res.-Atmos.,106, 32019–32030, https://doi.org/10.1029/2000JD000055,2001.
Wex, H., Huang, L., Zhang, W., Hung, H., Traversi, R., Becagli,S., Sheesley, R. J., Moffett, C. E., Barrett, T. E., Bossi,R., Skov, H., Hünerbein, A., Lubitz, J., Löffler, M., Linke,O., Hartmann, M., Herenz, P., and Stratmann, F.: Annualvariability of ice-nucleating particle concentrations at differ-ent Arctic locations, Atmos. Chem. Phys., 19, 5293–5311,https://doi.org/10.5194/acp-19-5293-2019, 2019.
Widener, K. B., Bharadwaj, N., and Johnson, K.: Ka-Band ARMZenith Radar (KAZR) Instrument Handbook, ARM-TR-106,DOE Office of Science, Office of Biological and Environmen-tal Research, United States, 2012.
Wood, N. B.: Estimation of snow microphysical properties with ap-plication to millimeter-wavelength radar retrievals for snowfallrate, Colorado State University, 2011.
Wood, N. B., L’Ecuyer, T. S., Heymsfield, A. J., Stephens,G. L., Hudak, D. R., and Rodriguez, P.: Estimating snowmicrophysical properties using collocated multisensorobservations, J. Geophys. Res.-Atmos., 119, 8941–8961,https://doi.org/10.1002/2013JD021303, 2014.
Wood, R.: Stratocumulus Clouds, Mon. Weather Rev., 140, 2373–2423, https://doi.org/10.1175/MWR-D-11-00121.1, 2012.
Zhang, D., Wang, Z., and Liu, D.: A global view of midlevel liquid-layer topped stratiform cloud distribution and phase partitionfrom CALIPSO and CloudSat measurements, J. Geophys. Res.,115, D00H13, https://doi.org/10.1029/2009JD012143, 2010.
Zipori, A., Reicher, N., Erel, Y., Rosenfeld, D., Sandler, A., Knopf,D. A., and Rudich, Y.: The Role of Secondary Ice Processes inMidlatitude Continental Clouds, J. Geophys. Res.-Atmos., 123,12712–62777, https://doi.org/10.1029/2018JD029146, 2018.
https://doi.org/10.5194/acp-21-3949-2021 Atmos. Chem. Phys., 21, 3949–3971, 2021