THE PRESIDENT OF THE ISLAMIC REPUBLIC OF PAKISTAN FOR …
77
THE PRESIDENT OF THE ISLAMIC REPUBLIC OF PAKISTAN FOR AND ON BEHALF OF THE ISLAMIC REPUBLIC OF PAKISTAN Global Medium Term Note Programme This offering circular supplement (the Offering Circular Supplement) has been prepared in order to reflect certain recent developments to the information contained in the Offering Circular (as defined below). This Offering Circular Supplement has been prepared in connection with the Global Medium Term Note Programme (the Programme) of The President of the Islamic Republic of Pakistan for and on behalf of the Islamic Republic of Pakistan (the Issuer). This Offering Circular Supplement is supplemental to, and forms part of and should be read and construed in conjunction with the Offering Circular dated 29 March 2021 (the Offering Circular) and any other supplements to the Offering Circular issued by the Issuer. Capitalised terms used but not otherwise defined in this Offering Circular Supplement shall have the meanings ascribed thereto in the Offering Circular. This Offering Circular Supplement does not constitute a prospectus or supplement for the purposes of a listing or an admission to trading on any market in the United Kingdom (UK) which has been designated as a regulated market for the purposes of Regulation (EU) No 600/2014 on markets in financial instruments as it forms part of domestic law by virtue of the European Union (Withdrawal) Act 2018, and has not been approved by the Financial Conduct Authority as competent authority in the UK pursuant to the Official Listing of Securities, Prospectus and Transparency (Amendment etc.) (EU Exit) Regulations 2019. This Offering Circular Supplement does not constitute a prospectus or supplement for the purposes of a listing or an admission to trading on any market in the European Economic Area (the EEA) which has been designated as a regulated market for the purposes of the Markets in Financial Instruments Directive (Directive 2014/65/EU, as amended), and has not been approved by the competent authority in any member state of the EEA pursuant to Regulation (EU) 2017/1129. The Issuer accepts responsibility for the information contained in this Offering Circular Supplement and the applicable Pricing Supplement for each Tranche of Notes issued under the Programme. To the best of the knowledge of the Issuer (which has taken all reasonable care to ensure that such is the case), the information contained in this Offering Circular Supplement is in accordance with the facts, not misleading and contains no omission likely to affect the import of such information. The purpose of this Offering Circular Supplement is: (a) to update the sections in the Offering Circular entitled “Summary”, “Risk Factors”, “The Islamic Republic of Pakistan”, “Overview of Pakistan’s Economy”, “Balance of Payments and Foreign Trade”, “Public Finance and Taxation”, “Public Debt” and “General Information – Litigation”; and (b) to update the “Significant Change” statement set out in the section of the Offering Circular entitled “General Information”. With effect from the date of this Supplemental Offering Circular the information appearing in the Offering Circular shall be amended and supplemented by the inclusion of the information set out herein. The date of this Offering Circular Supplement is 6 July 2021.
Transcript of THE PRESIDENT OF THE ISLAMIC REPUBLIC OF PAKISTAN FOR …

THE PRESIDENT OF THE ISLAMIC REPUBLIC OF PAKISTAN
FOR AND ON BEHALF OF
THE ISLAMIC REPUBLIC OF PAKISTAN
Global Medium Term Note Programme
This offering circular supplement (the Offering Circular Supplement) has been prepared in order to reflect certain recent developments to the information contained in the Offering Circular (as defined below).
This Offering Circular Supplement has been prepared in connection with the Global Medium Term Note Programme (the Programme) of The President of the Islamic Republic of Pakistan for and on behalf of the Islamic Republic of Pakistan (the Issuer). This Offering Circular Supplement is supplemental to, and forms part of and should be read and construed in conjunction with the Offering Circular dated 29 March 2021 (the Offering Circular) and any other supplements to the Offering Circular issued by the Issuer. Capitalised terms used but not otherwise defined in this Offering Circular Supplement shall have the meanings ascribed thereto in the Offering Circular.
This Offering Circular Supplement does not constitute a prospectus or supplement for the purposes of a listing or an admission to trading on any market in the United Kingdom (UK) which has been designated as a regulated market for the purposes of Regulation (EU) No 600/2014 on markets in financial instruments as it forms part of domestic law by virtue of the European Union (Withdrawal) Act 2018, and has not been approved by the Financial Conduct Authority as competent authority in the UK pursuant to the Official Listing of Securities, Prospectus and Transparency (Amendment etc.) (EU Exit) Regulations 2019.
This Offering Circular Supplement does not constitute a prospectus or supplement for the purposes of a listing or an admission to trading on any market in the European Economic Area (the EEA) which has been designated as a regulated market for the purposes of the Markets in Financial Instruments Directive (Directive 2014/65/EU, as amended), and has not been approved by the competent authority in any member state of the EEA pursuant to Regulation (EU) 2017/1129.
The Issuer accepts responsibility for the information contained in this Offering Circular Supplement and the applicable Pricing Supplement for each Tranche of Notes issued under the Programme. To the best of the knowledge of the Issuer (which has taken all reasonable care to ensure that such is the case), the information contained in this Offering Circular Supplement is in accordance with the facts, not misleading and contains no omission likely to affect the import of such information.
The purpose of this Offering Circular Supplement is: (a) to update the sections in the Offering Circular entitled “Summary”, “Risk Factors”, “The Islamic Republic of Pakistan”, “Overview of Pakistan’s Economy”, “Balance of Payments and Foreign Trade”, “Public Finance and Taxation”, “Public Debt” and “General Information – Litigation”; and (b) to update the “Significant Change” statement set out in the section of the Offering Circular entitled “General Information”.
With effect from the date of this Supplemental Offering Circular the information appearing in the Offering Circular shall be amended and supplemented by the inclusion of the information set out herein.
The date of this Offering Circular Supplement is 6 July 2021.

2
To the extent that there is any inconsistency between (a) any statement in this Offering Circular Supplement or any statement incorporated by reference into the Offering Circular by this Offering Circular Supplement and (b) any other statement in or incorporated by reference in the Offering Circular, the statements in (a) above will prevail.
Save as disclosed in this Offering Circular Supplement, there has been no other significant new factor, material mistake or material inaccuracy relating to information included in the Offering Circular since the publication of the Offering Circular.
SUMMARY
General (replacing the first sentence set out under caption “Summary – General” on page 1 of the Offering
Circular)
Pakistan is a federal republic located in south-central Asia between India, China, Afghanistan, Iran and the
Arabian Sea. Pakistan's current population estimate for 2020-21 is 211.9 million according to the Pakistan
Bureau of Statistics.
Recent Macroeconomic and Fiscal Performance (replacing the first paragraph, the table after the first
paragraph and the second paragraph set out under caption “Summary – Recent Macroeconomic and Fiscal
Performance” on pages 1 and 2 of the Offering Circular)
The following table sets out major economic indicators for the past five years:
2016-17 2017-18 2018-19 2019-20 2020-21
Nominal GDP at market prices
(Rupees million) 31,922,303 34,616,302 38,086,232(1) 41,556,326(2) 47,709,325(3)
GNI at current market prices
(Rupees million) 33,665,946 36,462,453 40,636,257(1) 44,799,050(2) 52,222,614(3)
GDP at constant basic prices of
2005-2006 (Rupees million) 11,696,934 12,344,266 12,600,651(1) 12,541,834(2) 13,036,381(3)
GDP growth at constant basic
prices of 2005-2006 (%) 5.2 5.5 2.1(1) (0.5)(2) 3.9(3)
Per capita income at factor cost
market prices (Rupees) 170,672 181,441 198,565(1) 215,060(2) 246,414(3)
Per capita GNI (U.S.$) 1,630 1,652 1,459(1) 1,361(2) 1,543(3)
Exports (U.S.$ million) (BoP) 22,003 24,768 24,257 22,536(2) 23,126(3)(4)
Imports (U.S.$ million) (BoP) 48,001 55,671 51,869 43,645(2) 47,262(3)(4)
Balance of trade (U.S.$ million) (25,998) (30,903) (27,612) (21,109)(2) (24,136) (3)(4)
Workers' remittances
(U.S.$ million) 19,351 19,914 21,740 23,132 26,737(4)
Current account balance
(U.S.$ million) (12,270) (19,195) (13,434) (4,449)(2) 153(3)(4)
Current account balance
(as % of GDP) (4.0) (6.1) (4.8)(1) (1.7)(2) 0.1(3)(4)
Overall fiscal deficit
(as % of GDP) (5.8) (6.5) (9.0)(1) (8.1)(2) (3.5) (3)(5)
Average inflation (%) 4.8(6) 4.7(6) 6.8(6) 10.7(6) 8.9(6)
Total investment at current
market prices (as % of GDP) 16.2 17.3 15.6(1) 15.3(2) 15.2(3)
Household final consumption
expenditure at current prices
(Rupees million) 26,148,647 28,400,347 31,547,687(1) 32,949,371(2) 38,501,127(3)
National savings (as % of GDP) 12.0 11.3 10.8(1) 13.6(2) 15.3(3)(5)

3
(1) Revised.
(2) Final.
(3) Provisional.
(4) For the July 2020 to May 2021 period.
(5) For the July 2020 to March 2021 period.
(6) Average inflation for 2016-17, 2017-18, 2018-19, 2019-20 and 2020-21 is calculated on new base (2015-16).
Sources: The State Bank of Pakistan; Pakistan Economic Survey 2019-20; Pakistan Bureau of Statistics.
The last five fiscal years have seen average GDP growth of 3.3 per cent; GDP growth stood at 3.9 per cent in
2020-21, negative 0.5 per cent in 2019-20, 2.1 per cent in 2018-19, 5.5 per cent in 2017-18 and 5.2 per cent in
2016-17. The provisional GDP growth rate for fiscal year 2020-21 is estimated at 3.9 per cent, with the highest
growth of 4.4 per cent for services followed by industrial sector (3.6 per cent) and agricultural sector (2.8 per
cent).
(replacing the ninth (last) paragraph set out under caption “Summary – Recent Macroeconomic and Fiscal
Performance” on page 3 of the Offering Circular)
In the fiscal year 2020-21, key domestic demand indicators showed significant improvements, particularly
with respect to the domestic sale of petroleum products, automobiles and cement, all of which reached or
surpassed the pre-COVID-19 levels. Domestic sales of cement reached the highest ever level in October 2020.
The sale of automobiles, which were significantly down for a period of 20 months, witnessed a broad-based
recovery on a year-on-year basis since July 2020. Electricity sales have also recovered since June 2020 after
witnessing a decline during the March to May 2020 period. With respect to the supply-side indicators, the
performance of the manufacturing and agriculture sectors also indicated a revival of economic activity. During
the July 2020 to April 2021 period, large-scale manufacturing (LSM) grew by 12.8 per cent, in large part due
to various measures taken by the Government to support the industrial sector. This improvement was due to
better performance of some of the key sectors of LSM, such as automobiles; non-metallic mineral products;
chemicals; coke and petroleum products; iron and steel products; pharmaceuticals and food, beverages and
tobacco. Ten out of 15 LSM industries recorded positive growth during the July 2020 to April 2021 period as
compared to the July 2019 to April 2020 period. In addition, major kharif crops, except cotton, demonstrated
encouraging performance. The increase in agricultural output is expected to further strengthen the overall
economic outlook in fiscal year 2021-22 because of the linkages of this sector with agriculture-based and
export-oriented businesses.
The Outbreak of the COVID-19 Pandemic (replacing the text set out under caption “Summary – Recent
Developments – The Outbreak of the COVID-19 Pandemic” on page 4 of the Offering Circular)
The first case of COVID-19 in Pakistan was reported on 26 February 2020, with an initial lockdown extending
from the second half of March 2020 until May 2020. By 2 June 2020, 76,398 cases with 1,621 deaths were
reported in Pakistan. In the middle of the first wave of the COVID-19 outbreak in Pakistan, the Sub-committee
of the National Coordination Committee for COVID-19 prepared an impact assessment of COVID-19 on the
real sector of the economy, which, according to this assessment, was expected to contract by 0.4 per cent in
fiscal year 2019-20 as compared to an earlier projection of 3.3 per cent growth. In April 2020, exports and
imports decreased (year-on-year) by almost 54 per cent and 32 per cent, respectively. While the decline in
exports largely reflected lower external demand as well as low production activity domestically, the decline in
imports most likely reflected low retail and wholesale trade. Similarly, sharp declines in tax collections and
sales of automobiles, cement and petroleum products also indicated an across-the-board economic slowdown.
In terms of the sectoral breakdown of GDP, the industrial and services sectors were particularly hard hit. In
the first wave of COVID-19 (March-July 2020), approximately 37 per cent of the working population of
Pakistan, or 20.6 million people, either lost their jobs or could not work due to the lockdown and another 12
per cent of the working population, or 6.7 million people, experienced a decrease in their incomes. Sindh was
the most affected province, in which the working population was reduced to 23 per cent during the April to
July 2020 period, as compared to 38 per cent before the outbreak of COVID-19, followed by Punjab with a 14
per cent decrease in the working population.

4
The first wave of COVID-19 reached its peak in June 2020, after which the number of reported cases began
to decrease. The second wave of COVID-19 commenced in late October 2020 followed by the third wave that
commenced in April 2021. By 5 July 2021, the number of confirmed cases of COVID-19 in Pakistan reached
963,660 (with 907,934 recoveries and 22,427 reported deaths from COVID-19).
Emergency Actions to Mitigate the Impact of the COVID-19 Pandemic (replacing the third paragraph set out
under caption “Summary – Recent Developments – Emergency Actions to Mitigate the Impact of the COVID-
19 Pandemic” on page 4 of the Offering Circular)
At the same time, the SBP arranged multiple emergency meetings of the Monetary Policy Committee (MPC)
to take frequent stock of the fast evolving situation and make decisions accordingly. The MPC cut the policy
rate by 625 basis points from 17 March 2020 to 25 June 2020, which not only favourably repriced most of the
existing loans by the private sector, but also made borrowing viable for firms that would otherwise have been
priced out due to high interest rates and weakened profitability. The SBP also rolled out multiple new schemes,
including the deferment of principal repayments, subsidised financing for firms to pay salaries to their
employees, relaxations in operational criteria for export-related refinance schemes and concessionary
refinance facilities for investment projects and hospitals. Businesses have shown a keen interest in these
financing schemes and actively used them to plug their cash flow gaps. Put together, the estimated liquidity
impact of the SBP's relief measures commenced in March 2020 was equivalent to 5.0 per cent of GDP as at
28 June 2021.
Status of the action plan with the FATF (replacing the text set out under caption “Summary – Recent
Developments – Status of the action plan with the FATF” on page 5 of the Offering Circular)
Owing to shortcomings in effectively addressing terrorist financing risks, Pakistan was placed in the FATF
"Grey List" in June 2018. Since inclusion in the "Grey List", Pakistan has undertaken considerable actions to
address the problems identified by the FATF, while undergoing periodic reviews by the FATF. As at June
2021, Pakistan has been rated "largely addressed" on 26 of 27 action items, including all action items relating
to its financial sector. At its last plenary meeting in June 2021, the FATF encouraged Pakistan to continue to
make progress to address as soon as possible the one remaining counter-terrorist financing-related item by
demonstrating that terrorist financing investigations and prosecutions target senior leaders and commanders
of UN designated terrorist groups.
Developments Related to Current Account Balance (replacing the text set out under caption “Summary –
Recent Developments – Developments Related to Current Account Balance” on pages 5 and 6 of the Offering
Circular)
Pakistan's current account deficit decreased to 4.8 per cent of GDP in 2018-19 and then further decreased to
1.7 per cent of GDP in 2019-20. Lower imports of goods and higher remittances contributed to the narrower
deficit. Imports of goods decreased by 6.8 per cent in 2018-19 as compared to 2017-18 to U.S.$51.9 billion,
largely due to the impact of policy measures ranging from exchange rate depreciation and policy rate hikes to
higher import duties on non-essential items, while workers' remittances increased by 9.2 per cent to U.S.$21.7
billion. In 2019-20, imports declined by a further 15.9 per cent to U.S.$43.6 billion as a result of the
continuation of stabilisation measures and COVID-19-related reduction in demand, while workers' remittances
increased by 6.4 per cent to U.S.$23.1 billion. The largely positive dynamics in the current account was not
supported by higher exports of goods, the value of which decreased by 2.1 per cent in 2018-19 as compared
to 2017-18. Exports of goods declined by a further 7.1 per cent in 2019-20 as compared to 2018-19.
During the July 2020 to May 2021 period, the current account posted a surplus of U.S.$153 million (0.1 per
cent of GDP) against a deficit of U.S.$ 4,328 million in the same period of the previous fiscal year (1.8 per
cent of GDP). The main driver of the improvement in the current account balance was the robust growth in
remittances. Even during the global economic crisis due to the COVID-19 pandemic, inflows accelerated
posting a year-on-year growth of 29.4 per cent during the July 2020 to May 2021 period as compared to the
same period in the previous fiscal year. Concurrently, primary income account also provided a cushion to
improve the current account balance. The lower interest payments and deferment of debt repayment (both
interest and principal) under the G-20 Debt Service Suspension Initiative (DSSI) also contributed to improve

5
the balance of primary income as the deficit declined from U.S.$4.8 billion in the July 2019 to May 2020
period to U.S.$4.3 billion during the July 2020 to May 2021 period. The services trade deficit shrank by 50.6
per cent mainly because of strong demand of telecommunications services amidst lockdown and air travel
restrictions. On the contrary, the trade deficit in goods widened owing to the increased imports of capital goods
and industrial raw materials, as the economy recovered from the effects of the coronavirus lockdown and a
rise in international commodity prices. Meanwhile, import of agricultural commodities like sugar, wheat and
cotton, due to shortage in production, is another major contributor in widening of the trade deficit from
U.S.$19.1 billion in the July 2019 to May 2020 period to U.S.$24.1 billion in the July 2020 to May 2021
period, which increased the deficit by 26.2 per cent. See "Risk Factors – The current account deficit may
negatively affect Pakistan’s ability to meet its external obligations" and "Balance of Payments and Foreign
Trade".
Developments Related to Foreign Exchange Reserves (replacing the text set out under caption “Summary –
Recent Developments – Developments Related to Foreign Exchange Reserves” on page 6 of the Offering
Circular)
The SBP's net liquid foreign exchange reserves were adversely affected by significant current account deficits
in recent years and declined to U.S.$7.3 billion as at 30 June 2019 (equating to 1.6 months' worth of imports
of goods and services) from U.S.$9.8 billion as at 30 June 2018 and U.S.$16.1 billion as at 30 June 2017.
Moreover, the SBP's forward-swap short position also increased to U.S.$8.0 billion as at 30 June 2019 from
U.S.$7.0 billion as at 30 June 2018. In May 2019, the SBP implemented a flexible market-determined
exchange rate system. The SBP now only intervenes in the foreign exchange market to prevent disorderly
market conditions, while at the same time not suppressing an underlying trend and in a manner consistent with
rebuilding reserves. The implementation of a flexible market-determined exchange rate system along with
other policy measures helped to initially reduce the current account deficit and then turn it into a current
account surplus in the first eight months of the fiscal year 2020-21. This has enabled the SBP to build its
foreign exchange reserves. The SBP's net foreign exchange reserves increased to U.S.$12.1 billion as at 30
June 2020 and to U.S.$16.1 billion as at 18 June 2021, while total liquid foreign exchange reserves increased
to U.S.$18.9 billion as at 30 June 2020 and to U.S.$23.3 billion as at 18 June 2021. The SBP's forward-swap
short position decreased from U.S.$8.0 billion as at 30 June 2019 to U.S.$5.8 billion as at 30 June 2020 and
further decreased to U.S.$4.7 billion as at 31 May 2021. Nevertheless, foreign exchange reserves remain at a
low level against large external debt repayments.
Developments Related to Fiscal Deficit (replacing the text set out under caption “Summary – Recent
Developments – Developments Related to Fiscal Deficit” on pages 6 and 7 of the Offering Circular)
Pakistan's fiscal deficit in 2018-19, which amounted to 9.0 per cent of GDP, was higher than its fiscal deficit
in both 2017-18 (6.5 per cent of GDP) and 2016-17 (5.8 per cent of GDP). It was also higher than the revised
target of 7.2 per cent of GDP (published in April 2019), which resulted in exceeding the targeted deficit by
Rupees 686 billion. The single biggest reason for the increase in fiscal deficit was the shortfall in Federal
Board of Revenue (FBR) tax revenues in the amount of Rupees 321 billion in 2018-19.
The fiscal consolidation efforts to reduce the deficit during the first quarters of 2019-20 largely paid off as,
despite the COVID-19 shock, the budget deficit declined from 9.0 per cent of GDP in 2018-2019 to 8.1 per
cent in 2019-20. This performance is owed to multiple policy measures to enhance the FBR's tax collection,
along with one-off gains from non-tax revenues and prudent management of expenditures in the first eight
months of 2019-20. In effect, the primary surpluses accumulated during this period largely compensated for
the adverse impact of COVID-19-related additional expenditure on health and cash transfers and resulted in
relatively better fiscal outcomes than in the fiscal year 2018-19. The Government rolled out a number of tax
and administrative measures in the budget for 2019-20 to enhance revenue mobilisation. These included the
reversal of earlier tax exemptions to certain sectors, increasing income tax rates and an upward revision in
sales tax and federal excise duty rates on selected items. On the administrative front, e-filing and refund
systems were improved to facilitate businesses and other taxpayers and promote the filing culture. The
Government also took measures to enhance documentation in the economy and reduce informality. On the
expenditure side, sizable efforts were taken to control the growth in current spending. Development
expenditures also remained subdued as the relevant government departments – that were delegated the

6
responsibility to execute the Public Sector Development Programme (PSDP) spending as part of the public
financial management reforms – could not initiate the committed projects in the earlier part of 2019-20. Later
on, when COVID-19 hit, these projects were delayed further. As a result, the Government was able to record
a cumulative primary surplus of Rupees 193.5 billion in the first three quarters of 2019-20. Although the third
quarter witnessed a slight primary deficit, the fiscal and revenue deficits remained largely within the contours
of the IMF programme. The FBR's tax collection weakened from March 2020 onwards, with all the major
revenue categories reporting year-on-year declines during the period from March to June 2020. As the bulk of
revenue collection typically occurs at quarter-ends, even the third quarter of 2019-20 witnessed a substantial
fall in revenue growth, whereas the revenue growth in the fourth quarter plummeted into negative territory. In
overall terms, COVID-19 resulted in an estimated loss of approximately one trillion Rupees in tax revenue, as
the full-year collection stood at Rupees 3,997.9 billion. The expenditure side also took a similar hit, as the
Government spent heavily on health and cash transfers in the fourth quarter of 2019-20 to control the disease
spread and alleviate unfavourable social outcomes. Current expenditures in the fourth quarter of 2019-20 were
approximately one trillion Rupees higher than the average spending in the first three quarters.
During the July 2020 to March 2021 period, the fiscal deficit was contained at 3.5 per cent of GDP as compared
to 4.1 per cent of GDP in the comparable period of 2019-20. During the July 2020 to March 2021 period, total
revenue grew by 6.5 per cent against the growth of 30.9 per cent in the same period of the previous fiscal year.
In absolute terms, total revenue increased to Rupees 4,992.6 billion during the July 2020 to March 2021 period
from Rupees 4,689.9 billion in the same period of 2019-20 principally due to double-digit growth in tax
revenue, which was partially offset by the decrease in non-tax revenues. Total tax revenue (federal and
provincial) grew by 11.9 per cent during the July 2020 to March 2021 period and amounted to Rupees 3,765.0
billion against Rupees 3,365.5 billion in the comparable period of 2019-20. Within the total, federal tax
collection witnessed a significant increase as it grew by 11.5 per cent to reach Rupees 3,394.9 billion during
the July 2020 to March 2021 period against Rupees 3,044.3 billion in the same period of 2019-20.The revenue
performance is not only a reflection of growing economic activities even in the wake of the third wave of
COVID-19, but it also suggests that the efforts to improve tax collection through various policy and
administrative reforms have been successful. During the July 2020 to March 2021 period, total expenditure
grew by 4.2 per cent as compared to a 15.8 per cent growth observed during the same period in the previous
fiscal year. The efficient expenditure management helped in curtailing the overall expenditure during 2020-
21. In absolute terms, the expenditures stood at Rupees 6,644.6 billion (13.9 per cent of GDP) during the July
2020 to March 2021 period against Rupees 6,376.0 billion (15.3 per cent of GDP) in the comparable period of
the previous fiscal year. The current expenditure grew at 8.4 per cent during the July 2020 to March 2021
period against 16.9 per cent growth recorded in the same period of the previous fiscal year. In absolute terms,
it stood at Rupees 6,085.4 billion in the July 2020 to March 2021 period against Rupees 5,611.6 billion in the
same period of 2019-20. Although higher mark-up payments, increase in subsidies and grants to others
contributed significantly to the current fiscal year’s growth in current expenditure, the decrease in other
expenditures like defence, pensions and running of civil government slowed the pace of growth. The total
development expenditure (excluding net lending) amounted to Rupees 668.0 billion during the July 2020 to
March 2021 period as compared to Rupees 751.7 billion in the same period of 2019-20, showing a decrease
of 11.1 per cent.
Developments Related to Public Debt (replacing the text set out under caption “Summary – Recent
Developments – Developments Related to Public Debt” on page 7 of the Offering Circular)
Pakistan's gross public debt as at 30 June 2020 was Rupees 36,399 billion (87.6 per cent of GDP) as compared
to Rupees 32,708 billion as at 30 June 2019 (85.9 per cent of GDP). As at 30 June 2020, government domestic
public debt was Rupees 23,283 billion (56.0 per cent of GDP), while government external debt and debt from
the IMF amounted to U.S.$13,116 billion (31.6 per cent of GDP). The increase in public debt during 2019-20
was less than half the increase recorded during 2018-19. Lower revaluation losses on the existing outstanding
stock of public debt and the utilisation of accumulated government deposits to finance a similar level of fiscal
deficit in Rupee terms as last year contained the overall rise in public debt during 2019-20. In terms of GDP,
the gross public debt rose by 1.7 percentage points to 87.6 per cent of GDP by 30 June 2020. A decline in
economic activity and a rising fiscal deficit, particularly in the later part of the fiscal year 2019-20 amid the
COVID-19 outbreak, led to an increase in this ratio.

7
Pakistan's gross public debt as at 30 March 2021 was Rupees 38,006 billion (79.7 per cent of GDP), registering
an increase of Rupees 1,607 billion in the first three quarters of 2020-21. The increase in total public debt
during the first three quarters of 2020-21 was less than federal government borrowing of Rupees 2,065 billion.
The differential is primarily attributable to appreciation of the Rupee against the U.S. dollar by around 9 per
cent, which led to a decrease in the value of external public debt when converted into Rupees.

8
RISK FACTORS
The COVID-19 pandemic depressed economic growth and put significant pressure on public finances
(replacing the second paragraph set out under caption “Risk Factors – Factors that May Affect the Issuer’s
Ability to Fulfil its Obligations under Notes Issued under the Programme – Risk factors relating to the
Government – The COVID-19 pandemic depressed economic growth and put significant pressure on public
finances” on pages 15 and 16 of the Offering Circular)
The first case of COVID-19 in Pakistan was reported in February 2020. The countrywide lockdown was
imposed by the Government in the second half of March 2020 and remained in place until May 2020. The first
wave of COVID-19 reached its peak in June 2020, after which the number of reported cases began to decrease.
The second wave of COVID-19 commenced in late October 2020 followed by the third wave that commenced
in April 2021. By 5 July 2021, the number of confirmed cases of COVID-19 in Pakistan reached 963,660 (with
22,427 reported deaths from COVID-19). The number of COVID-19 cases and deaths might be significantly
underreported. In June 2020, Atta ur Rahman, the chairman of Prime Minister Imran Khan's task force on
science and technology, said in an interview to Bloomberg that the actual numbers could be two to three times
higher than what the Government was reporting at the time. A large number of cases were not reported because
of low testing and deaths due to reasons other than respiratory failure were not being counted in deaths from
COVID-19.
Low level of foreign exchange reserves may negatively affect Pakistan's ability to maintain liquidity and
meet its external obligations (replacing the third paragraph set out under caption “Risk Factors – Factors
that May Affect the Issuer’s Ability to Fulfil its Obligations under Notes Issued under the Programme – Risk
factors relating to the Government – Low level of foreign exchange reserves may negatively affect Pakistan's
ability to maintain liquidity and meet its external obligations” on page 19 of the Offering Circular)
The SBP's net foreign exchange reserves increased to U.S.$12.1 billion as at 30 June 2020 and to U.S.$16.1
billion as at 18 June 2021, while total liquid foreign exchange reserves increased to U.S.$18.9 billion as at 30
June 2020 and to U.S.$23.3 billion as at 18 June 2021. The SBP's forward / swap short position decreased
from U.S.$8.0 billion as at 30 June 2019 to U.S.$5.8 billion as at 30 June 2020 and further decreased to
U.S.$4.7 billion as at 31 May 2021. Nevertheless, foreign exchange reserves remain at a low level against
large external debt repayments.
The current account deficit may negatively affect Pakistan's ability to meet its external obligations
(replacing the second and third paragraphs set out under caption “Risk Factors – Factors that May Affect the
Issuer’s Ability to Fulfil its Obligations under Notes Issued under the Programme – Risk factors relating to
the Government – The current account deficit may negatively affect Pakistan's ability to meet its external
obligations” on pages 19 and 20 of the Offering Circular)
The Government has taken various corrective measures including moving to a market-determined flexible
exchange rate system since May 2019, monetary tightening, fiscal consolidation and imposition of regulatory
duties to contain the current account deficit. To support its home-grown stabilisation measures, Pakistan also
entered into the IMF EFF programme on 3 July 2019. Under this programme, the IMF is expected to extend
approximately U.S.$6.0 billion over a period of 39 months from July 2019. As a result of stabilisation
measures, Pakistan's current account deficit decreased to 4.8 per cent of GDP in 2018-19 and then further
decreased to 1.7 per cent of GDP in 2019-20. Lower imports of goods and higher remittances contributed to
the narrower deficit. Imports of goods decreased by 6.8 per cent in 2018-19 as compared to 2017-18 to
U.S.$51.9 billion and then further decreased by 15.9 per cent in 2019-20 to U.S.$43.6 billion. This was largely
due to the impact of policy measures ranging from exchange rate depreciation and policy rate hikes (prior to
the outbreak of the COVID-19 pandemic) to higher import duties on non-essential items, a benign import
prices environment and COVID-19-related demand compression. Workers' remittances increased by 9.2 per
cent to U.S.$21.7 billion in 2018-19 and then further increased by 6.4 per cent to U.S.$23.1 billion in 2019-
20. However, the largely positive dynamics in the current account has not been supported by higher exports,
the value of which decreased by 2.1 per cent in 2018-19 as compared to 2017-18 and then further decreased
by 7.1 per cent in 2019-20.
9
The current account deficit has narrowed significantly in 2019-20 and turned into a surplus in the first eleven
months of the fiscal year 2020-21. However, the pick-up in the domestic economic activity and a recovery in
the global economy resulting in higher commodity prices may put significant pressure on the current account
balance. For instance, trade deficit in goods widened significantly in the July 2020 to May 2021 period as
compared to the same period in the previous fiscal year owing to escalating imports of capital goods and
industrial raw materials, as the economy is reviving from deadly implication of coronavirus lockdown and a
rise in international commodity prices. Meanwhile, import of agricultural commodities like sugar, wheat and
cotton, due to shortage in production, is another major contributor in widening of the trade deficit from
U.S.$19.1 billion in the July 2019 to May 2020 period to U.S.$24.1 billion in the July 2020 to May 2021
period. The increasing trade deficit may increase external financing needs for Pakistan and may further
increase external indebtedness, putting additional pressure on Pakistan's ability to service its external debts,
including its payment obligations under the Notes.
Pakistan's fiscal deficit and debt levels could negatively impact Pakistan's credit rating and could have a
material adverse effect on the economy, the Government's finances and its ability to service its debt,
including the Notes (replacing the first, second and third paragraphs set out under caption “Risk Factors –
Factors that May Affect the Issuer’s Ability to Fulfil its Obligations under Notes Issued under the Programme
– Risk factors relating to the Government – Pakistan's fiscal deficit and debt levels could negatively impact
Pakistan's credit rating and could have a material adverse effect on the economy, the Government's finances
and its ability to service its debt, including the Notes” on page 20 of the Offering Circular)
Pakistan's fiscal deficits have led to increased levels of Government borrowing, which have, in turn, increased
Pakistan's gross public debt. Although Pakistan's overall fiscal deficit decreased from 9.0 per cent of GDP in
2018-19 to 8.1 per cent of GDP in 2019-20, the overall fiscal deficit remains high. If Pakistan is unable to
continue to reduce its overall fiscal deficit and the resulting effect on the public debt, it could raise Pakistan's
cost of funding its debt, negatively affect the economy, strain the general resources of the Government and the
Government's finances, increase its vulnerability to external events, hinder the Government's structural reform
efforts and materially impair Pakistan's capacity to service its debt (including the Notes).
Over the past five fiscal years, gross public debt, as a percentage of GDP, has remained relatively high. As at
30 June 2020, total gross public debt represented 87.6 per cent of GDP, as compared to 85.9 per cent of GDP
as at 30 June 2019, 72.1 per cent of GDP as at 30 June 2018, 67.1 per cent of GDP as at 30 June 2017 and 67.7
per cent of GDP as at 30 June 2016. Total external debt and liabilities have also increased since 2015-2016,
from 26.5 per cent of GDP as at 30 June 2016 to 27.4 per cent of GDP as at 30 June 2017, 30.2 per cent of
GDP as at 30 June 2018, 38.1 per cent of GDP as at 30 June 2019 and 42.8 per cent of GDP as at 30 June
2020. Similarly, public external debt have also increased since 2016-2017, from 20.5 per cent of GDP as at 30
June 2017 to 22.3 per cent of GDP as at 30 June 2018, 26.3 per cent of GDP as at 30 June 2019 and 29.6 per
cent of GDP as at 30 June 2020. As at 30 June 2020, 31.2 per cent of Pakistan's public external debt was
derived from bilateral loans. The availability of bilateral loans may be tied to, or influenced by, geopolitical
interests and developments.
Political instability and low level of Government effectiveness may negatively affect economic conditions in
Pakistan (replacing the fourth paragraph set out under caption “Risk Factors – Factors that May Affect the
Issuer’s Ability to Fulfil its Obligations under Notes Issued under the Programme – Risk factors relating to
the Government – Political instability and low level of Government effectiveness may negatively affect
economic conditions in Pakistan” on pages 21 and 22 of the Offering Circular)
In September 2020, Pakistan's opposition parties announced the formation of the Pakistan Democratic
Movement (PDM) alliance. The PDM is led by the two largest opposition parties in the National Assembly,
the PML-N and the PPP. These two opposition parties share a common objective, the end of the PTI-led
Government or, at the very least, the resignation of the Prime Minister, Imran Khan. To this end, the PDM at
one point threatened that its legislators would tender resignations to their respective party chiefs in an effort
to topple the Government. They also organised and held large rallies in all four provinces.
Failure to adequately address actual and perceived risks of corruption, money laundering and terrorist
financing may negatively affect Pakistan's economy and ability to attract foreign direct investment

10
(replacing the third paragraph set out under caption “Risk Factors – Factors that May Affect the Issuer’s
Ability to Fulfil its Obligations under Notes Issued under the Programme – Failure to adequately address
actual and perceived risks of corruption, money laundering and terrorist financing may negatively affect
Pakistan's economy and ability to attract foreign direct investment” on pages 23 and 24 of the Offering
Circular)
In addition, owing to shortcomings in effectively addressing terrorist financing risks, Pakistan was placed in
the FATF "Grey List" in June 2018. As at June 2021, following a number of remedial actions, Pakistan has
been rated "largely addressed" on 26 of 27 action items. Following its June 2021 plenary meeting, the FATF
encouraged Pakistan to continue to make progress to address as soon as possible the one remaining counter-
terrorist financing-related item by demonstrating that terrorist financing investigations and prosecutions target
senior leaders and commanders of UN designated terrorist groups. If Pakistan were to ever be placed in the
FATF "Black List", this may materially impact the economy and the value of the Rupee and, as a result, the
Government's ability to meet its obligations.
The impact of climate change, including the occurrence of floods, droughts and severe heat waves, has
negatively affected Pakistan in the past and may negatively affect it in the future (replacing the text set out
under caption “Risk Factors – Factors that May Affect the Issuer’s Ability to Fulfil its Obligations under Notes
Issued under the Programme – Risk factors relating to the Government – Natural calamities could have a
negative impact on the Pakistani economy” on pages 24 of the Offering Circular)
Climate change is a threat to Pakistan’s economy and its future growth prospects. A global increase in the
mean temperature is likely to lead to changed precipitation patterns, sea level rises and more frequent extreme
weather events, such as prolonged droughts and flooding. Pakistan’s economy is dependent on climate
sensitive sectors, particularly agriculture. A change in climate may have adverse consequences for agriculture
productivity.
Pakistan has historically been affected by floods and droughts, including severe flooding along the Indus River
in 2010 and 2011 and extensive flooding in 2014 and 2015. Such developments can have a particularly
negative impact on Pakistan's economy given its significant dependence on the agricultural sector and
infrastructure constraints. The floods resulted from unusually heavy monsoon rains in various areas of Pakistan
and affected about 20 million people. The affected regions suffered extensive damage to economic assets and
infrastructure, and millions of people were displaced, resulting in an interruption to social services delivery,
commerce and communications. Floods in 2015 resulted in the deaths of around 238 people whilst nearly
10,700 homes were damaged in 411 villages, and some 1,572,191 people were displaced, according to the
National Disaster Management Authority. The 2015 floods also significantly affected Pakistan's agricultural
sector (particularly the cotton industry) that had been predicted to grow by 3.9 per cent in 2015-16 but,
principally as a result of floods and a pest attack, grew by only 0.27 per cent.
Any natural disasters or other effects associated with climate change, or other natural disasters such as
earthquakes or landslides, could have a material adverse effect on Pakistan’s economy and its future growth
prospects. Moreover, efforts to mitigate extreme climatic conditions, such as floods, would require very
significant funding, which could have a negative impact on Pakistan's fiscal situation.

11
THE ISLAMIC REPUBLIC OF PAKISTAN
Population, Religion and Language (replacing the first sentence set out under caption “The Islamic Republic
of Pakistan – Population, Religion and Language” on page 88 of the Offering Circular)
Pakistan's current population estimate for 2020-21 is 211.9 million, according to the Pakistan Bureau of
Statistics.
Executive (replacing the second paragraph and the table after the second paragraph set out under caption
“The Islamic Republic of Pakistan – Government and Politics – Form of Government – Executive” on pages
89 to 91 of the Offering Circular)
The following table sets out the members of the federal cabinet in addition to the current Prime Minister, Imran
Khan, along with advisers to the Prime Minister and special assistants to the Prime Minister.
FEDERAL MINISTERS
Name Portfolio
Mr. Ghulam Sarwar Khan Aviation Division
Mr. Murad Saeed Communications
Mr. Pervez Khattak Defence
Ms. Zubaida Jalal Defence Production
Mr. Omar Ayub Khan Economic Affairs
Mr. Muhammad Hammad Azhar Energy
Mr. Shaukat Fayyaz Ahmed Tarin Finance and Revenue
Mr. Shafqat Mahmood Federal Education, Professional Training, National
Heritage and Culture
Makhdoom Shah Mahmood Hussain Qureshi Foreign Affairs
Chaudhary Tariq Bashir Cheema Housing and Works
Dr. Shireen M. Mazari Human Rights
Makhdoom Khusro Bukhtiar Industries and Production
Mr. Fawad Ahmed Information and Broadcasting
Syed Amin Ul Haque Information Technology and Telecommunication
Sheikh Rashid Ahmed Interior
Dr. Fehmida Mirza Inter-Provincial Coordination
Mr. Ali Amin Khan Gandapur Kashmir Affairs and Gilgit-Baltistan
Dr. Muhammad Farogh Naseem Law and Justice
Syed Ali Haider Zaidi Maritime Affairs
Mr. Ijaz Ahmad Shah Narcotics Control
Syed Fakhar Imam National Food Security and Research
Mr. Asad Umar Planning, Development and Special Initiatives
Mr. Muhammad Mian Soomro Privatisation
Mr. Muhammad Azam Khan Swati Railways
Mr. Noor-UL-Haq Qadri Religious Affairs and Inter-faith Harmony
Syed Shibli Faraz Science and Technology
Sahibzada Muhammad Mehboob Sultan States and Frontier Regions
MINISTERS OF STATE
Name Portfolio

12
Ms. Zartaj Gul Climate Change
Mr. Muhammad Shabbir Ali Housing and Works
Mr. Farrukh Habib Information and Broadcasting
Mr. Ali Muhammad Khan Parliamentary Affairs
ADVISERS TO THE PRIME MINISTER
Name Portfolio
Mirza Shahzad Akbar Adviser on Accountability and Interior with the
status of Federal Minister
Mr. Abdul Razak Dawood Adviser on Commerce and Investment with the status
of Federal Minister
Dr. Ishrat Hussain Adviser on Institutional Reforms and Austerity with
the status of Federal Minister
Mr. Zaheer-ud-din Babar Awan Adviser on Parliamentary Affairs with the status of
Federal Minister
SPECIAL ASSISTANTS TO THE PRIME MINISTER
Name Portfolio
Dr. Sania Nishtar Special Assistant to the Prime Minister on Social
Protection and Poverty Alleviation with the status of
Federal Minister
Mr. Mohammad Shehzad Arbab Special Assistant to the Prime Minister on
Establishment with the status of Federal Minister
Malik Amin Aslam Khan Special Assistant to the Prime Minister on Climate
Change with the status of Federal Minister
Dr. Faisal Sultan Special Assistant to the Prime Minister on National
Health Services, Regulations and Coordination with
the status of Federal Minister
Mr. Ali Nawaz Awan Special Assistant to the Prime Minister on Capital
Development Authority Affairs
Sardar Yar Muhammad Rind Special Assistant to the Prime Minister on activities
pertaining to Ministries of Water Resources, Power
and Petroleum in Balochistan
Dr. Moeed W. Yusuf Special Assistant to the Prime Minister on National
Security and Strategic Policy Planning with the status
of Federal Minister
Dr. Shahbaz Gill Special Assistant to the Prime Minister on Political
Communication in honorary capacity
Mr. Tabish Gauhar Special Assistant to the Prime Minister on Power and
Petroleum in honorary capacity
Dr. Waqar Masood Khan Special Assistant to the Prime Minister on Finance
and Revenue with the status of Minister of State
Mr. Raoof Hasan Special Assistant to the Prime Minister on
Information in honorary capacity
Malik Muhammad Amir Dogar Special Assistant to the Prime Minister on Political
Affairs with the status of Minister of State
Mr. Muhammad Usman Dar Special Assistant to the Prime Minister on Youth
Affairs in honorary capacity

13
Mr. Jamshad Iqbal Cheema Special Assistant to the Prime Minister on Food
Security
Mr. Mahmood Baqi Moulvi Special Assistant to the Prime Minister on Maritime
Affairs in honorary capacity
Legislature (replacing the third paragraph set out under caption “The Islamic Republic of Pakistan –
Government and Politics – Form of Government – Legislature” on page 91 of the Offering Circular)
The term of the Senate's members is six years. However, one-half of its members retire after every three years.
On 3 March 2021, polling for 37 seats in the Senate took place with 11 senators already elected unopposed
from Punjab due to withdrawals from opposing candidates. According to preliminary results, PTI won 18
seats. PPP managed to win eight seats against the same number of its senators who retired. PML-N won only
five new seats against 17 of its senators who retired. Another party that managed to gain ground was the
Balochistan Awami Party, an ally of the ruling PTI, which secured six new seats against three of its senators
who retired. PTI is now expected to become the single largest party in the Senate with 26 seats, followed by
PPP with 20 seats, PML-N with 18 seats, and Balochistan Awami Party with 12 seats, with the other parties
accounting for the remaining 24 seats. One setback for the Government was that PTI's candidate for the
Islamabad seat and the then Federal Minister for Finance and Revenue Hafeez Shaikh lost to Yousaf Raza
Gillani, the former prime minister and the joint candidate of opposition parties. On 29 March 2021, Dr. Hafeez
Shaikh was removed from the post of the Federal Minister for Finance and Revenue.
International Organisations (replacing the fourth paragraph set out under caption “The Islamic Republic of
Pakistan – International Relations – International Organisations” on page 93 of the Offering Circular)
Pakistan is also a member of the Developing-8 (D8), comprising Bangladesh, Egypt, Iran, Indonesia, Malaysia,
Nigeria, Pakistan and Turkey. The D8 countries signed a preferential trade agreement on 14 May 2006. The
9th D8 Summit was held in Istanbul on 20 October 2017 during which Pakistan handed over its chairmanship
of the organisation to Turkey. Bangladesh has become the chair of D8 until 2022 after it hosted the 10th D8
Summit on 8 April 2021. Prime Minister Imran Khan led Pakistan’s delegation to the 10th D8 Summit.
(replacing the seventh paragraph set out under caption “The Islamic Republic of Pakistan – International
Relations – International Organisations” on page 93 of the Offering Circular)
Given Pakistan's growing prominent role in the region, the Shanghai Cooperation Organisation (the SCO)
extended observer status to Pakistan in July 2005. Pakistan's application for full membership with the SCO
was granted on 9 June 2017 at the SCO's session in Astana (now Nur-Sultan), Kazakhstan. In addition to its
six original members (China, Russia, Kazakhstan, Kyrgyzstan, Tajikistan and Uzbekistan), the SCO currently
includes India and Pakistan as member states and also has four observer states (Afghanistan, Belarus, Iran and
Mongolia). Pakistan has been playing an active and dynamic role to advance the objectives and goals of the
SCO.
(replacing the ninth paragraph set out under caption “The Islamic Republic of Pakistan – International
Relations – International Organisations” on page 93 of the Offering Circular)
Pakistan believes is compliant with all applicable U.N. sanctions regimes. On a number of occasions, Pakistan
assumed the leadership of key UN positions.
Peace Keeping (replacing the text set out under caption “The Islamic Republic of Pakistan – International
Relations – Peace Keeping” on page 93 of the Offering Circular)
Pakistan's strong commitment to peace keeping is rooted in its foreign policy and belief that every nation
should contribute to the maintenance of international peace and security. Pakistan has maintained high levels
of participation in U.N. peace keeping forces, being one of the largest troop-contributing countries with 4,400
Pakistani troops, military experts and police deployed around the world in U.N. peace keeping missions as of
April 2021.

14
Relations with the United States (U.S.)
(replacing the fourth paragraph set out under caption “The Islamic Republic of Pakistan – International
Relations – Relations with Select Countries – Relations with the United States (U.S)” on page 94 of the
Offering Circular)
The U.S. is Pakistan's second largest export market, after the EU, accounting for 17.3 per cent of total exports
in 2019-20. In 2019-20, the total trade between Pakistan and the U.S. amounted to U.S.$6,161 million. Pakistan
enjoyed a trade surplus with the U.S. during this period. Pakistan's exports amounted to U.S.$3,898 million
while imports from the U.S. stood at U.S.$2,264 million. The visit of U.S. Secretary of Commerce Wilbur
Ross in February 2020 was useful in exploring ways and means to implement the vision of the leadership for
enhancing bilateral trade and investment between the two countries. In addition, a video conference was held
between Advisor to the Prime Minister on Commerce and Trade Abdul Razzak Dawood and United States
Trade Representative Catherin C. Tai in May 2021 to further explore the avenues of bilateral cooperation in
trade. High level visits and trade delegations are expected during 2021 to explore tangible actions for
expanding economic cooperation and business-to-business ties.
(replacing the sixth paragraph set out under caption “The Islamic Republic of Pakistan – International
Relations – Relations with Select Countries – Relations with the United States (U.S)” on page 94 of the
Offering Circular)
It should be noted, however, that net foreign private investment from the U.S. was negative in the July 2020
to May 2021 period (net outflow of U.S.$75.4 million), with net FDI inflow of U.S.$105.7 million and net
foreign portfolio investment outflow of U.S.$181.0 million. It was also negative in 2019-20 (net outflow of
U.S.$42.5 million), with net FDI inflow of U.S.$99.2 million and net foreign portfolio investment outflow of
U.S.$141.8 million.
(replacing the tenth paragraph set out under caption “The Islamic Republic of Pakistan – International
Relations – Relations with Select Countries – Relations with the United States (U.S)” on page 94 of the
Offering Circular)
Pakistan and the United States have also been closely cooperating in wake of the COVID-19 pandemic. There
have been regular telephonic exchanges between the two sides aimed at enhancing cooperation to mitigate
impact of the COVID-19 pandemic on health and economy. The U.S. has also extended COVID-19-related
assistance to Pakistan since the outbreak of the pandemic. Provision of essential supplies from the U.S.
government in 2021 included personal protection equipment, diagnostic kits and oximeters along with
accessories. In 2020, the U.S. Government earmarked U.S.$40 million as COVID-19 response assistance to
Pakistan, which also included a donation of ventilators for COVID-19 patients.
Relations with China (replacing the text set out under caption “The Islamic Republic of Pakistan –
International Relations – Relations with Select Countries – Relations with China” on pages 95 and 96 of the
Offering Circular)
Pakistan and China are joined together in a broad-based and long-term “All-Weather Strategic Cooperative
Partnership”. The two countries have a multi-faceted bilateral cooperation in diverse fields such as economic,
political, strategic, defence and cultural areas. Pakistan and China support each other on the issues of core
national interests and major concerns.
High-level visits and exchanges are the hallmark of Pakistan-China relations. President Dr. Arif Alvi visited
China on 16 and 17 March 2020. Prime Minister Imran Khan visited China three times: on 7 to 9 October
2019, on 25 to 28 April 2019 and on 2 to 5 November 2018. Chinese Vice President Wang Qishan visited
Pakistan on 26 to 28 May 2019 and Chinese Defence Minister Wei Fenghe visited Pakistan on 29 November
to 1 December 2020. Foreign Minister Shah Mahmood Qureshi visited China on 21 and 22 August 2020. The
Foreign Minister also participated in the Asia and the Pacific high-level conference on Belt and Road
Cooperation on 23 June 2021, the six-country foreign ministers video conference on joint response to COVID-

15
19 on 27 April 2021 and the high-level video conference on Belt and Road International Cooperation:
Combating COVID-19 with Solidarity in May 2020.
This year marks the 70th anniversary of the establishment of diplomatic relations between Pakistan and China.
Both countries are celebrating the 70th anniversary in a befitting manner.
China is Pakistan’s largest trading and investment partner. Bilateral trade, which stood at U.S.$1.3 billion in
2002, crossed U.S.$13.6 billion in 2019-20. The second phase of the China Pakistan Free Trade Agreement
(CPFTA-II) was signed during the Prime Minister’s visit to China in April 2019 and became effective on 1
January 2020. CPFTA-II has the potential to enhance Pakistan’s exports to China. After the launch of CPFTA-
II, Pakistan’s exports to China have seen an 88 per cent growth on a year-on-year basis. Net foreign direct
investments inflows in Pakistan increased by 88 per cent to U.S.$2.6 billion in 2019-20 as compared to
U.S.$1.4 billion received in 2018-19. More than 40 per cent of these net foreign direct investments inflows
were sourced from China including Hong Kong, and a significant part of these inflows were for CPEC-related
power projects.
With the official launch of China-Pakistan Economic Corridor (CPEC), the bilateral relationship has been
elevated to new heights. CPEC is a flagship project of the Belt and Road Initiative aimed at greater connectivity
and trade linkages between Pakistan and China through a network of road, rail, fibre optic cable, energy
pipelines and power generation projects. Many of the projects are in implementation phase, while extensive
planning is also under way on all others. These projects are divided into short-term (to be completed by 2020),
medium-term (to be completed by 2025) and long-term (to be completed by 2030) categories. The combined
cost of the entire portfolio of these projects has risen from U.S.$46.6 to U.S.$62 billion.
CPEC is a transformational initiative and it has the potential to act as the pivot of regional peace and
connectivity. In a short span of time, Pakistan has completed nineteen projects. Twenty-eight projects are
under construction, while forty-one are in the pipeline. Pakistan is upgrading its infrastructure and modernising
its transport network. In the first phase of CPEC, over 1,544 km of roads had been constructed. Another 1,456
km are under construction. Over the past seven years, CPEC projects have created 26,795 power sector jobs
and have boosted local power industry. CPEC motorway projects have created 50,000 jobs. Most recently,
agreements on Kohala and Azad Pattan power projects have been signed, which involve an investment of
U.S.$4 billion and are expected to create approximately 3,000 new jobs in Pakistan.
The second phase of CPEC aims at promoting agriculture cooperation, industrialisation, job creation and socio-
economic development. Out of the nine special economic zones (SEZs) three (Rashakai in KP, Dhabeji in
Sindh and Allama Iqbal in Punjab) have been fast-tracked under CPEC. These SEZs are expected to host
industries producing, among others, textile products, home building materials, electronic and electrical
appliances, pharmaceuticals, automobiles, mechanical equipment and packaging. The ground-breaking
ceremony for the Rashakai SEZ was held in May 2021.
There are ten areas of cooperation under CPEC: (i) energy, (ii) transport infrastructure, (iii) Gwadar, (iv)
industrial cooperation, (v) CPEC security, (vi) policy coordination/planning, (vii) socioeconomic
development, (viii) international cooperation and coordination, (ix) agriculture and (x) science and technology.
Gwadar port is being developed under CPEC as energy, trade and logistical hub, which is expected deepen
regional connectivity. The establishment of Gwadar Free Zone has presented Gwadar as a tax-haven for
investors and has already attracted multiple investors. The businesses that are registered in the Free Zone will
enjoy tax benefits for 20 years.
After the outbreak of COVID-19, Pakistan and China provided support to each other. China provided 60
planeloads of medical relief goods. A team of Chinese medical experts also visited Pakistan to provide
assistance in containing the pandemic. The National Institute of Health in Islamabad has started local
production of PakVac vaccine in Pakistan with the help of China. Pakistan has approved emergency use
authorisation of Sinopharm, CanSino and SinoVac vaccines in Pakistan and provided millions of doses of
COVID-19 vaccines to Pakistan as a gift. Pakistan is also procuring Chinese vaccines on a commercial basis.

16
One of the most significant and promising aspects of Pakistan-China bilateral relations is the increasing people-
to-people contacts. Currently, there are more than 28,000 Pakistani students studying in China. China and
Pakistan have established fourteen sister-city and seven sister-province relationships to further enhance
bilateral ties between the two countries. Pakistan has also established eleven Urdu language departments and
seven Pakistan study centres in various Chinese universities.
Relations with India (replacing the seventh paragraph set out under caption “The Islamic Republic of
Pakistan – International Relations – Relations with Select Countries – Relations with India” on page 97 of the
Offering Circular)
Pakistan has strongly and publicly condemned the actions of the Indian government and the Indian armed
forces in Jammu and Kashmir, including with respect to use of force, which, since 5 August 2019, has resulted
in over 368 civilian deaths and 3,734 injuries.
(adding a new paragraph after the eighth paragraph set out under caption “The Islamic Republic of Pakistan
– International Relations – Relations with Select Countries – Relations with India” on page 97 of the Offering
Circular)
Pakistan’s Economic Coordination Council, in its meeting on 31 March 2021, decided to recommend import
of cotton, cotton yarn and sugar from India. However, the federal cabinet, in its meeting on 1 April 2021,
deferred the decision of the Economic Coordination Council.
Relations with the United Kingdom (adding a new paragraph after the first paragraph set out under caption
“The Islamic Republic of Pakistan – International Relations – Relations with Select Countries – Relations
with the United Kingdom” on page 97 of the Offering Circular)
Post-Brexit UK continues to provide to Pakistan the same concessions that are available to Pakistan under the
GSP Plus scheme of the European Union.
(replacing the sixth paragraph set out under caption “The Islamic Republic of Pakistan – International
Relations – Relations with Select Countries – Relations with the United Kingdom” on page 98 of the Offering
Circular)
With over 110 British companies operating in Pakistan, the UK was the largest source of net FDI in Pakistan
in the world in 2018-19 (U.S.$185.2 million). However, the UK's net FDI in Pakistan decreased to U.S.$119.1
million in 2019-20 and to U.S.$112.9 million in the July 2020 to May 2021 period.
Relations with Afghanistan (replacing the first paragraph set out under caption “The Islamic Republic of
Pakistan – International Relations – Relations with Select Countries – Relations with Afghanistan” on page
98 of the Offering Circular)
Relations with Afghanistan are inextricably tied to efforts to resolve conflict in Afghanistan through peace
talks. In its efforts to facilitate the Afghan peace process, and with the conviction that there was no military
solution to the conflict in Afghanistan, Pakistan facilitated the direct talks between the U.S. and Taliban and
also provided assistance in the intra-Afghan negotiations. There have been multiple attempts since 2009 to
resolve the conflict between the Afghan government forces and the Taliban through negotiations.
(replacing the fourth paragraph set out under caption “The Islamic Republic of Pakistan – International
Relations – Relations with Select Countries – Relations with Afghanistan” on page 98 of the Offering Circular)
Recently, the two countries have witnessed a positive trajectory in bilateral relations with significant progress
on important bilateral matters including the revision of the Afghanistan Pakistan Transit Trade Agreement and
the commencement of negotiations on the Preferential Trade Agreement. High-level leadership contacts and
bilateral visits, including that of the Prime Minister of Pakistan in November 2020, are a manifestation of the
further strengthening of Pakistan-Afghanistan relations. Pakistan has also recently opened additional border
crossing points with a view to deepen economic and trade relations with Afghanistan, with the Torkham border

17
crossing being operational 24 hours a day and seven days a week. Gwadar port is now being used for Afghan
transit trade. Visa policy for Afghans has also been revised for their ease of movement and stay in Pakistan.
These measures have further strengthened the bilateral relations and widened the economic engagement
between the two countries.
Relations with Turkey (replacing the second paragraph set out under caption “The Islamic Republic of
Pakistan – International Relations – Relations with Select Countries – Relations with Turkey” on page 99 of
the Offering Circular)
In 2019-20, bilateral trade between Pakistan and Turkey amounted to U.S.$891 million with Pakistani exports
of U.S.$283 million and imports of U.S.$608 million. Turkey's net foreign direct investment into Pakistan was
U.S.$73.8 million in 2018-2019, but then decreased significantly to U.S.$26.1 million in 2019-20 and
U.S.$14.4 million in the July 2020 to May 2021 period.
Relations with Saudi Arabia and other GCC members (replacing the second paragraph set out under caption
“The Islamic Republic of Pakistan – International Relations – Relations with Select Countries – Relations
with Saudi Arabia and other GCC members” on page 99 of the Offering Circular)
Pakistan and Saudi Arabia enjoy special relations, grounded in common faith and history. There are regular
exchanges at senior government levels. Prime Minister Imran Khan has already visited Saudi Arabia several
times during his term in office (in September 2018, October 2018, May-June 2019, September 2019, October
2019, December 2019 and May 2021).
On 8 to 10 May 2021, the Prime Minister, Imran Khan, made an official visit to Saudi Arabia, where he held
discussions with the Saudi crown prince, Mohammed bin Salman al-Saud. During this visit, the two sides
agreed to form a “Supreme Co-ordination Council” and signed five memorandums of understanding on co-
operation in various sectors: trade, energy, investment, the environment and strategic partnership.
(replacing the fifth and sixth paragraphs set out under caption “The Islamic Republic of Pakistan –
International Relations – Relations with Select Countries – Relations with Saudi Arabia and other GCC
members” on page 99 of the Offering Circular)
Pakistan and Saudi Arabia have excellent relations in the area of defence and security. The two sides regularly
hold meetings of joint military cooperation committee and a military cooperation committee.
Saudi Arabia is home to over two million Pakistani expatriates, the largest number of Pakistani expatriates in
the world. Saudi-based Pakistanis are a substantial source of foreign remittances, accounting for U.S.$6.6
billion, being 28.6 per cent of the total received by Pakistan in 2019-20.
Relations with Russia (replacing the second paragraph set out under caption “The Islamic Republic of
Pakistan – International Relations – Relations with Select Countries – Relations with Russia” on page 99 of
the Offering Circular)
Pakistan's relations with Russia are on an upward trajectory. Both countries have been able to develop mutual
understanding on important political and security issues, paving the way for increased cooperation in diverse
areas. One of the most important areas of cooperation is the energy sector. Both countries agree that there is
considerable scope for cooperation in this area since Pakistan has a very large-scale programme to address its
energy requirements and Russian companies are keen to participate. Russia is investing in Pakistan and the
two countries concluded an agreement in 2015 in relation to the financing and construction of a north-south
LNG-import pipeline from Karachi to Lahore. An inter-governmental agreement on the supply of LNG from
Russia to Pakistan was signed on 13 October 2017. The two countries signed an amended Protocol to the inter-
governmental agreement on Pakistan Stream Gas pipeline on 28 May 2021.
Nuclear Programme (replacing the text set out under caption “The Islamic Republic of Pakistan – Nuclear
Programme” on page 100 of the Offering Circular)

18
Pakistan’s nuclear programme commenced in 1956 with the establishment of the Pakistan Atomic Energy
Commission with the aim of applying nuclear science and technology for the benefit of socio-economic
development. Pakistan is benefitting from nuclear applications in various areas such as power generation,
health, agriculture, industry, environmental protection and basic sciences. Nuclear science and technology are
being employed in Pakistan in relation to eleven of the UN Sustainable Development Goals.
Currently, five nuclear power plants are in operation in Pakistan, while two 1,100 MW power plants are
nearing completion. Pakistan’s pursuit of nuclear power generation and expansion of its share in the national
energy mix is driven by the fact that nuclear energy provides a cheaper and cleaner alternative to fossil fuels-
based power generation as well as the need to strengthen energy security and to deal with the challenge of
climate change.
Pakistan has maintained nuclear deterrent for self-defence based on the concept of credible minimum
deterrence and guided by the policy of restraint and responsibility. In pursuit of its commitment to the global
non-proliferation objectives, Pakistan supports the International Atomic Energy Agency (the IAEA)
safeguards system and has placed all of its civil nuclear facilities and power plants under the IAEA safeguards.
Pakistan attaches great importance to nuclear safety, security and export controls. It continues to maintain and
regularly update robust export controls consistent with the scope of controls maintained by the international
export control regimes including that of the Nuclear Suppliers Group and the Australia Group as well as the
Missile Technology Control Regime. In 2016, Pakistan announced its adherence to the guidelines of the
Nuclear Suppliers Group.
The National Command Authority of Pakistan, which was established under the National Command Authority
Act 2010 and chaired by the Prime Minister of Pakistan, exercises command and control over research,
development, production and use of nuclear energy and related programmes.
Pakistan Nuclear Regulatory Authority regulates the safety and security of civilian nuclear materials and
facilities. It works closely with the IAEA and benefits from its regulations and guidance.
Pakistan is a party to the Convention on Nuclear Safety, the Convention on Early Notification of a Nuclear
Accident, the Convention on Assistance in Case of a Nuclear Accident of Radiological Emergency and the
Convention on the Physical Protection of Nuclear Material (including its 2005 amendment). It is also
implementing non-legally binding codes of conduct, including the IAEA Code of Conduct on the Safety and
Security of Radioactive Sources, together with its two Supplementary Guidance documents, and the Code of
Conduct on the Safety of Research Reactors. A Nuclear Emergency Management System has been established
at the national level to handle nuclear or radiological emergencies. National Radiation Emergency
Coordination Centre and Nuclear Security Emergency Coordination Centre have been established at the
Pakistan Nuclear Regulatory Authority as the contact point with the international community and the IAEA.
Fight Against Extremism (adding three additional sentences to the eighth paragraph set out under caption
“The Islamic Republic of Pakistan – Fight Against Extremism” on pages 101 and 102 of the Offering Circular)
In April 2021, a powerful explosion ripped through the parking lot of Serena Hotel in Quetta, the capital of
Baluchistan province, killing five people and injuring at least 13 others, some of them critically. The bomber
apparently targeted visiting Chinese diplomats and detonated the vehicle-born explosives just
before China’s ambassador to Pakistan was due to arrive back at the hotel. Pakistani Taliban claimed
responsibility for this bombing.
National Security Reform (replacing the fourth paragraph and the table after the fourth paragraph set out
under caption “The Islamic Republic of Pakistan – Fight Against Extremism – National Security Reform” on
pages 103 and 104 of the Offering Circular)
As a result of the implementation of NISP 2014, NISP 2018, NAP and the military operations of Zarb-e-Azab
and Radd-ul-Fasad, there has been a significant reduction in the number of terrorist incidents reported in the
country, as the following table from the National Counter Terrorism Authority of Pakistan demonstrates:

19
TERRORIST INCIDENTS
Year or Period No. of incidents
2013 1,571
2014 1,816
2015 1,139
2016 785
2017 741
2018 584
2019 482
Nine months ended 30 September 2020 259
Significant Litigation (replacing the sixth paragraph set out under caption “The Islamic Republic of Pakistan
– Significant Litigation” on pages 104 and 105 of the Offering Circular)
On 10 March 2021, Pakistan made an application to the ICSID for the revision of the ICSID Award on the
grounds of certain new facts which, if known at the time of the original proceedings, would have had a material
bearing on the findings of the ICSID tribunal. On 16 March 2021, the ICSID Secretary-General registered an
application for revision of the ICSID Award filed by Pakistan and notified the parties of the provisional stay
of enforcement of 50 per cent of the ICSID Award (described in the previous paragraph).
Upon registration of the application for revision of the ICSID Award on 16 March 2021, enforcement
proceedings in the U.S. and Australia against Pakistan were stayed.
However, in the British Virgin Islands (BVI) High Court proceedings, the enforcement action was not stayed
pursuant to the ICSID Secretariat order for provisional stay of the ICSID Award.
A four day hearing took place in the BVI from 26 April 2021 to 29 April 2021 to finalise the receivership and
injunction orders against Pakistan International Airlines Investment Limited (PIA), a company incorporated
in the BVI, and its subsidiaries. Despite the fact that PIA did not have any liability to TCC, TCC contended
that PIA was effectively an organ of the State of Pakistan and asked the BVI High Court to ignore the separate
corporate personality of PIA and to render the assets of its subsidiaries amenable to the execution of the ICSID
Award. The Government of Pakistan was also a respondent in this proceeding.
On 25 May 2021, the BVI High Court delivered its judgment and set aside all ex-parte orders on receivership
and injunction against PIA and its subsidiaries. The court also upheld the Government of Pakistan’s argument
on state immunity and service and dismissed all claims against the State of Pakistan.
TCC filed a stay application seeking to suspend the BVI High Court Order. The Court of Appeal dismissed
the stay application, but not the appeal itself, which is scheduled to be heard in the week commencing 4
October 2021.
A hearing before the ICSID Tribunal on the provisional stay of the ICSID Award is expected in due course.
20
OVERVIEW OF PAKISTAN'S ECONOMY
Overview (replacing the first sentence of the fourth paragraph set out under caption “Overview of
Pakistan’s Economy – Overview” on page 106 of the Offering Circular)
The first case of COVID-19 in Pakistan was reported on 26 February 2020.
(replacing the fifth paragraph set out under caption “Overview of Pakistan’s Economy – Overview” on page
106 of the Offering Circular)
The first wave of COVID-19 reached its peak in June 2020, after which the number of reported cases began
to decrease. The second wave of COVID-19 commenced in late October 2020 followed by the third wave that
commenced in April 2021. By 5 July 2021, the number of confirmed cases of COVID-19 in Pakistan reached
963,660 (with 907,934 recoveries and 22,427 reported deaths from COVID-19).
(replacing the seventh paragraph set out under caption “Overview of Pakistan’s Economy – Overview” on
page 107 of the Offering Circular)
Pakistan's economy has three principal sectors: services (61.7 per cent of GDP according to provisional data
for 2020-21), industrial (19.1 per cent of GDP according to provisional data for 2020-21) and agricultural
(19.2 per cent of GDP according to provisional data for 2020-21).
(replacing the ninth paragraph set out under caption “Overview of Pakistan’s Economy – Overview” on page
107 of the Offering Circular)
The last five fiscal years have seen an average GDP growth of 3.2 per cent; GDP growth stood at 3.9 per cent
in 2020-21, negative 0.5 per cent in 2019-20, 1.9 per cent in 2018-19, 5.5 per cent in 2017-18 and 5.2 per cent
in 2016-17. The provisional GDP growth rate for fiscal year 2020-21 is estimated at 3.9 per cent, with the
highest growth of 4.4 per cent for services followed by industrial sector (3.6 per cent) and agricultural sector
(2.8 per cent).
(replacing the fourteenth (last) paragraph set out under caption “Overview of Pakistan’s Economy –
Overview” on pages 107 and 108 of the Offering Circular)
In the fiscal year 2020-21, key domestic demand indicators are showing significant improvements, particularly
with respect to the domestic sale of petroleum products, automobiles and cement, all of which have reached
or surpassed the pre-COVID-19 levels. Domestic sales of cement have reached the highest ever level in
October 2020. The sale of automobiles, which were significantly down for a period of 20 months, have
witnessed a broad-based recovery on a year-on-year basis since July 2020. The electricity sales have also
recovered since June 2020 after witnessing a decline during the March to May 2020 period. With respect to
the supply-side indicators, the performance of the manufacturing and agriculture sectors also indicates a revival
of economic activity. During the July 2020 to April 2021 period, large-scale manufacturing (LSM) grew by
12.8 per cent, in large part due to various measures taken by the Government to support the industrial sector.
This improvement was due to better performance of some of the key sectors of LSM, such as automobiles;
non-metallic mineral products; chemicals; coke and petroleum products; iron and steel products;
pharmaceuticals and food, beverages and tobacco. Ten out of 15 LSM industries recorded positive growth
during the July 2020 to April 2021 period as compared to the July 2019 to April 2020 period. In addition,
major kharif crops, except cotton, demonstrated encouraging performance. The increase in agricultural output
is expected to further strengthen the overall economic outlook because of the linkages of this sector with
agriculture-based and export-oriented businesses.
Major Economic Indicators (replacing the first paragraph and the table after the first paragraph set out
under caption “Overview of Pakistan’s Economy – Major Economic Indicators” on page 108 of the Offering
Circular)
The following table sets out major economic indicators for the past five years:

21
2016-17 2017-18 2018-19 2019-20 2020-21
Nominal GDP at market prices
(Rupees million) 31,922,303 34,616,302 38,086,232(1) 41,556,326(2) 47,709,325(3)
GNI at current market prices
(Rupees million) 33,665,946 36,462,453 40,636,257(1) 44,799,050(2) 52,222,614(3)
GDP at constant basic prices of
2005-2006 (Rupees million) 11,696,934 12,344,266 12,600,651(1) 12,541,834(2) 13,036,381(3)
GDP growth at constant basic
prices of 2005-2006 (%) 5.2 5.5 2.1(1) (0.5)(2) 3.9(3)
Per capita income at factor cost
market prices (Rupees) 170,672 181,441 198,565(1) 215,060(2) 246,414(3)
Per capita GNI (U.S.$) 1,630 1,652 1,459(1) 1,361(2) 1,543(3)
Exports (U.S.$ million) (BoP) 22,003 24,768 24,257 22,536(2) 23,126(4)
Imports (U.S.$ million) (BoP) 48,001 55,671 51,869 43,645(2) 47,262(4)
Balance of trade (U.S.$ million) (25,998) (30,903) (27,612) (21,109)(2) (24,136)(4)
Workers' remittances
(U.S.$ million) 19,351 19,914 21,740 23,132 26,737(4)
Current account balance
(U.S.$ million) (12,270) (19,195) (13,434) (4,449)(2) 153(3)
Current account balance
(as % of GDP) (4.0) (6.1) (4.8)(1) (1.7)(2) 0.1(3)
Overall fiscal deficit
(as % of GDP) (5.8) (6.5) (9.0)(1) (8.1)(2) (3.5)(5)
Average inflation (%) 4.8(6) 4.7(6) 6.8(6) 10.7(6) 8.9(6)
Total investment at current
market prices (as % of GDP) 16.2 17.3 15.6(1) 15.3(2) 15.2(3)
Household final consumption
expenditure at current prices
(Rupees million) 26,148,647 28,400,347 31,547,687(1) 32,949,371(2) 38,501,127(3)
National savings (as % of GDP) 12.0 11.3 10.8(1) 13.6(2) 15.3(3)(5)
(1) Revised.
(2) Final.
(3) Provisional.
(4) For the July 2020 to May 2021 period.
(5) For the July 2020 to March 2021 period.
(6) Average inflation for 2016-17, 2017-18, 2018-19, 2019-20 and 2020-21 is calculated on new base (2015-16).
Sources: The State Bank of Pakistan; Pakistan Economic Survey 2019-20; Pakistan Bureau of Statistics.
Emergency Actions to Mitigate the Impact of the COVID-19 Pandemic (replacing the last sentence of the
third paragraph set out under caption “Overview of Pakistan’s Economy – Economic Reform Programme and
Key Policy Objectives – Emergency Actions to Mitigate the Impact of COVID-19 Pandemic” on page 109 of
the Offering Circular)
Put together, the estimated liquidity impact of the SBP's relief measures commenced in March 2020 was
equivalent to 5.0 per cent of GDP as at 28 June 2021.
Key Policies for the Post-COVID Period (replacing the fourth paragraph set out under caption “Overview of
Pakistan’s Economy – Economic Reform Programme and Key Policy Objectives – Key Policies for the Post-
COVID Period” on page 110 of the Offering Circular)
Third, Pakistan's progress on the Financial Action Task Force (FATF) front is expected to be crucial from the
foreign investors' confidence perspective. Several capacity development providers have been engaged to

22
enhance the country's capacity with respect to anti-money laundering and terrorism financing. As noted in the
FATF's June 2021 plenary session, Pakistan has largely addressed 26 of 27 action items. The adoption of the
required anti-money laundering and countering financing of terrorism (AML/CFT)-related amendments in
Pakistan's legal framework – especially the Anti-Money Laundering Act and the Anti-Terrorism Act – by
Parliament has been a major step forward for the country. Accordingly, various regulators, including the SBP,
SECP and self-regulatory bodies have issued their updated AML/CFT regulations. See "– Principal Sectors of
the Economy – Services Sector – Financial Services – Anti-Corruption and Anti-Money Laundering”.
Fiscal Policy (replacing the text set out under caption “Overview of Pakistan’s Economy – Economic Reform
Programme and Key Policy Objectives – Fiscal Policy” on pages 110 to 112 of the Offering Circular)
The Government’s fiscal policies remain centred on an ambitious revenue mobilisation strategy to ensure debt
sustainability while creating space for social and development spending. As the Government overcomes the
severe setback from the COVID-19 pandemic shock, it remains committed to broadening the tax base and
gradually increasing the tax-to-GDP ratio by more than three per cent of GDP through fiscal year 2022-23,
with a cumulative fiscal primary adjustment of 3.3 per cent of GDP. As these efforts are expected to bring
results over the medium term, the Government has also sought to create fiscal space in the near term for much-
needed priority spending on health, education, infrastructure and targeted programmes for social protection.
This includes taking action to reduce the debt service, including by requesting debt relief under the Debt
Service Suspension Initiative (DSSI), supported by the G20 and Paris Club.
The Government will seek to ensure the highest levels of quality and transparency in all COVID-19-related
spending and programmes in line with international best practices. The enacted emergency measures are
expected to remain targeted and temporary and not result in permanent distortions of the overall fiscal policy.
Regarding the temporary construction programme, which the Government recently extended until end-
December 2021, the Government will seek to ensure full compliance with FATF principles on voluntary tax
compliance schemes to mitigate potential money laundering and terrorist financing risks and monitor financial
institutions’ implementation of their AML/CFT obligations on financial transactions related to the investments
in the construction sector. In this context, the Government reaffirms its commitment to both not granting
further tax amnesties and avoiding the practice of issuing new preferential tax treatments or exemptions.
The general government account posted a primary deficit of 1.8 per cent of GDP, marking a 1.8 per cent of
GDP improvement compared to the fiscal year 2018-19. This reflected the Government’s fiscal consolidation
efforts undertaken during the first nine months of the fiscal year 2019-20, capacity to manage spending, over-
performance on sales tax and customs duties collection in June 2020, and higher dividend transfers by the
SBP. These efforts have had positive carryover effects in the first half of the fiscal year 2020-21, when the
general government registered a primary surplus of 0.7 per cent of GDP (including the provincial surplus of
0.6 per cent of GDP), about 0.8 per cent of GDP better than projected. Tax revenues, net of refunds grew by
12 per cent year-on-year, while primary spending was controlled, allowing the Government to contain the
overall fiscal deficit at 2.5 per cent of GDP.
The fiscal year 2020-21 budget strikes a careful balance between providing support to the economy and
remaining on the path of fiscal consolidation. The fiscal year 2020-21 budget, adopted by Parliament on 29
June 2020, targets a general government primary deficit of 0.5 per cent of GDP (excluding additional COVID-
19-related spending and payments related to the clearance of outstanding arrears to some independent power
projects), which the Government remains committed to achieving. Key elements include:
On the expenditure side. As the economy gradually recovers, the Government is unwinding the
COVID-19-related economic stimulus spending measures and freezing non-priority spending, while
preserving space for necessary health and social spending. Key expenditure rationalisation measures
include the nominal freeze of wages and pensions, decline in real military spending and streamlining
of subsidies. At the same time, the Government has budgeted for increased social spending under the
BISP programme to Rupees 200 billion (up by 77 per cent relative to the fiscal year 2019-20 actual
spending excluding COVID-19 one-off spending of Rupees 133 billion) and have almost doubled
health sector spending relative to the fiscal year 2019-20 budget allocation to address health sector
needs.

23
On the revenue side. While the Government’s budget assumed 26 per cent nominal growth of tax
revenue, the Government now recognises that this is not attainable, especially in the face of the
duration of the COVID-19 pandemic. Therefore, to achieve the Government’s primary deficit target,
it will rely on several one-off non-FBR tax measures and non-tax revenues. These include, among
others, increased environmental taxation by increasing petroleum levy on gasoline and diesel toward
Rupees 30 per litre and additional transfers of SBP dividends.
Agreement with provinces. As was done in the context of the fiscal year 2019-20 budget, the
Government has signed formal written agreements with the provinces on the fiscal strategy and the
required provincial fiscal efforts, including revenue and fiscal surplus targets by province for the fiscal
year 2020-21 and implications in case of missed targets. The Government has made this agreement
public to ensure accountability and measure progress and performance.
As the first step of the Government’s multi-year tax policy reform agenda, it has adopted a comprehensive
reform of the Government’s corporate income tax. The Government has substantially modernised its corporate
income tax and streamlined all tax incentives, in consultation with IMF staff, with a view to simplifying the
system and eliminating the existing distortionary measures. These include tax credits, accelerated deductions,
exempt income, reduced tax rates and tax liability reductions.
In the next step of the Government tax policy reform efforts and to further support the Government’s fiscal
objectives, it will introduce both a general sales tax (GST) and a personal income tax (PIT) reform with the
fiscal year 2021-22 budget, yielding an estimated 1.1 per cent of GDP of additional revenue. The Government
recognises that this is crucial for broadening the tax base, the Government’s key strategic fiscal objective,
reducing informality and simplifying and modernising the tax system. The reforms are expected to be
underpinned by high-quality tax measures in line with IMF staff recommendations:
Broaden and harmonise the GST base. The Government expects to introduce the reforms to its GST
system, underpinned by a unified tax base and within the confines of the current constitution. Notably,
the Government expects to: (i) eliminate all zero-rated goods, except on export and capital machinery
goods and move them to the standard sales tax rate; (ii) remove reduced rates for certain goods to
which such reduced rates apply and bring all those goods to the standard sales tax rate; (iii) eliminate
exemptions, with the exception of a small subset of goods (such as basic food, medicines, live animals
for human consumption, education and health-related goods) and bring all others to the standard rate;
and (iv) replace a specific tax rate for cell phones with the standard rate. These reforms are expected
to yield an estimated 0.7 per cent of GDP of additional revenue on an annualised basis. Moreover, the
Government is also in the process of harmonising the service sales tax across provincial jurisdictions,
with support from the World Bank.
Simplify and increase PIT progressivity. In line with IMF recommendations, the Government will seek
to: (i) change the existing tax rate structure by reducing the number of rates and income tax brackets
from eleven to five and decreasing the size of the income slabs, with a view to simplifying the system
and increasing progressivity; (ii) reduce tax credits and allowances by 50 per cent (except for Zakat
and those provided for disabled and senior citizens); (iii) introduce special tax procedures for very
small taxpayers aimed at preventing further tax base erosion and facilitating the formalisation of the
economy; and (iv) adopt a long-term strategy to reduce labour informality and to bring additional
taxpayers into the PIT net. This reform is expected to yield 0.4 per cent of GDP of additional revenue
on an annualised basis.
The Government is also accelerating the implementation of broad-based fiscal structural reforms. It is pressing
ahead with tax administration and public finance management (PFM) reforms to support the Government’s
public finances. More specifically:
PFM reforms. While the Government has already advanced on some elements of its PFM reform
strategy (including the establishment of a macro-fiscal unit in the Ministry of Finance for proper
identification and monitoring of macroeconomic and specific fiscal risks), more needs to be done. In
line with the Public Finance Management Act, the Government presented the mid-year budget review

24
to the National Assembly in February 2020 and February 2021. Going forward, the Government plans
to intensify its efforts to establish a treasury single account (TSA). In September 2020, the
Government prepared and shared the accounts level data with public sector entities for arranging
closure of the accounts and transfer of funds to TSA. This is expected to allow the Government to
establish the TSA and make it functional by the end of July 2021.
Tax administration. The Government recognises that for tax policy measures to be successful and to
generate the expected revenues, it needs to step up tax administration reforms and enforcement. To
this end, the Government expects to focus on: (i) introducing a centralised, risk-based compliance
function; (ii) modernising the IT system and further advancing automation; (iii) actively using third-
party data, strengthening data cross-checking and analysis; (iv) simplifying registration and filing
processes; (v) modernising audit practices and taking a more targeted audit approach; and (vi) further
strengthening the large taxpayer approach and expanding the activities of the Large Taxpayer Office.
In addition, the Government expects to continue the process of sales tax harmonisation and to
implement the single return and taxpayer portal. The procurement procedures related to the track-and-
trace licenses to address the smuggling of tobacco products have been declared invalid by the
Islamabad High Court and the roll-out of the track-and-trace system for tobacco products was
suspended. Nonetheless, and building on the lessons from this experience, the Government is seeking
to reintroduce and roll out the track-and-trace systems for tobacco products and will consider its
introduction for other items subject to high levels of smuggling, including sugar, drinks and cement.
To support GST harmonisation, the Government expects to establish the single filing portal by
September 2024.
The Government has taken a number of key steps to revamp its debt management framework and maintain
debt sustainability. Key measures include:
Securing debt relief under the DSSI through which the Government has reduced Pakistan’s external
debt service by an estimated U.S.$3.7 billion for the period from May 2020 to December 2021 over
and above the assurances currently in place under the EFF.
Lengthening the maturity profile of domestic debt. Since fiscal year 2018-19, the Government’s
domestic borrowing strategy has been tilted toward issuing medium- and long-term debt instruments,
thereby reducing the Government’s reliance on short-term debt issuance. As a result, the average time
to maturity of domestic debt held by the market (i.e., excluding the debt held by the central bank) has
increased from 2.0 years to 2.6 years over a period of 18 months (July 2019 – December 2020). The
Government intends to continue with its strategy subject to maintaining stability in the financial
markets and keeping its borrowing costs within reasonable limits.
Updating and implementing the Government’s Medium-Term Debt Strategy, which, among other
things, explicitly targets a gross financing needs figure lower than 24 per cent of GDP by fiscal year
2022-23, down from more than 30 per cent of GDP in fiscal year 2019-20. To effectively implement
this strategy, a number of steps have been taken including the: (i) reintroduction of 15-, 20-, and 30-
year fixed rate Pakistan Investment Bonds (PIBs); (ii) reintroduction of Shari’ah-compliant Sukuk of
longer tenors ( five years); introduction of new long-term instruments (including three- and five-year
floating rate PIBs); and (iv) imposition of a ban on institutional investments in National Savings
Schemes with effect from 1 July 2020 in order to enhance institutional participation in competitive
primary and secondary markets of long-term debt. This strategy is already producing favourable
results: between April and December 2020 more than Rupees 100 billion was raised through 15–20
year instruments and Rupees 562 billion was raised from Sukuk.
Establishing a debt management office (DMO) to strengthen the Government’s debt management
strategy. In line with World Bank and IMF recommendations, the Government has established the
proper rules of business, describing the activities and organisation of the DMO as part of the process
of amending the Fiscal Responsibility and Debt Limitation Act (2005). The draft bill for requisite
amendments was submitted to the Federal Cabinet Committee on Disposal of Legislative Cases in
February 2021 and was subsequently submitted to the National Assembly for its approval. The Fiscal

25
Responsibility and Debt Limitation Act amendment bill is currently expected to be approved by
Parliament in the first quarter of the fiscal year 2021-22. In the meantime, the Finance Division has
assigned additional functions to the existing Debt Policy and Coordination Office and the Government
approved the rules which will allow it to hire additional staff commensurate with the responsibilities.
The setup of the front office/middle office/back office of the new DMO has been accomplished
through a provisional notification. The Debt Office is currently executing most of the responsibilities
assigned to the front office/middle office/back office of the new DMO through this notification. This
arrangement is expected to be formalised after the approval of the Fiscal Responsibility and Debt
Limitation Act amendment bill expected in the first quarter of the fiscal year 2021-22. The
Government is committed to completing the recruitment of staff by the end of the first quarter of the
fiscal year 2021-22. Migration of relevant functions to DMO from other parts of government agencies
is expected to be completed by end-December 2021. Moreover, the Government is enhancing
cooperation with other government units, the Economic Affairs Division in particular, to ensure
accurate compilation and reporting of debt-related statistics, starting with the establishment of a new
Working Group in February 2021.
Monetary and Exchange Policies (replacing the text set out under caption “Overview of Pakistan’s Economy
– Economic Reform Programme and Key Policy Objectives – Monetary and Exchange Policies” on pages 112
and 113 of the Offering Circular)
The Government’s policies remain centred on entrenching monetary and financial stability by maintaining a
market-determined exchange rate, lowering inflation and building foreign exchange reserves. Specific actions
include:
Continued commitment to a market-determined exchange rate. The exchange rate has served as an
essential buffer protecting economic activity during a period of heightened external volatility. It
depreciated by around eight per cent against the U.S. dollar between early-March and end-June 2020
as the COVID-19-related crisis unfolded and appreciated by 9.5 per cent between 30 June 2020 and
30 April 2021 when the economy started to recover. In this context, the SBP’s interventions remain
guided by market conditions and the objective of rebuilding reserve buffers. Foreign exchange sales
are limited to preventing disorderly market conditions, while not suppressing an underlying trend. As
a result, the Government’s net international reserves buffers were rebuilt by U.S.$6 billion and the net
short swap/forward foreign exchange position was scaled back by more than U.S.$2 billion in the
fiscal year 2019-20. Moreover, this trend has continued, with the Government’s reserve buffers
increasing by U.S.$1.2 billion in the first half of the fiscal year 2020-21 and the net short swap/forward
foreign exchange position being further reduced by more than U.S.$1 billion.
Appropriate monetary policy stance. The SBP was proactive in responding to the initial COVID-19-
related shock, cutting the policy rate by 625 basis points cumulatively to seven per cent by end-June
2020 on the back of weakening domestic demand conditions and a quick deceleration of inflation. The
current monetary policy stance is accommodative to support the economic recovery as fiscal policy
has become more constrained. However, the Government remains vigilant to the impact that supply
side driven inflation from some products might have in inflation expectations. Monetary policy
decisions will continue to be guided by the primary goal of safeguarding price stability to ensure the
IMF EFF’s monetary targets are met and guide inflation to the Government’s medium-term objective.
To support the economic recovery and promote housing and construction sector, in July 2020, the Government
introduced mandatory targets on banks to support the sector. By December 2021, the SBP is expected to require
banks to provide five per cent of their domestic private sector lending for the financing of housing and
construction of buildings. To incentivise banks to meet the targets, the SBP has announced that banks
achieving their quarterly targets will be permitted to lower their cash reserve requirements in the subsequent
quarter. The Government sees this as a temporary measure supporting private sector lending, which is low
compared to peer countries and is hindering private sector growth, but recognise that further steps to improve
the housing and construction sector – including an improved bankruptcy regime and more comprehensive
property registry system – are necessary. In this context, the Supreme Court decision to vacate the stay order
against the foreclosure law, the automation of rural land records by the government of Punjab and the

26
constitution of a high-level inter-provincial committee to resolve issues related to housing and construction
are some positive developments the Government has achieved since November 2019.
The Government is committed to phasing out the temporary refinancing schemes introduced as part of the
emergency COVID-19 related response as the crisis abates. In the context of supporting financial markets and
businesses during the COVID-19-related crisis, the SBP has substantially expanded its refinancing schemes,
introducing three new facilities and expanding the coverage of one existing facility. Since their introduction
in March 2020, the SBP has allocated Rupees 707.9 billion to banks through end-November 2020, of which
Rupees 234.2 billion was disbursed by that date. In line with the SBP’s primary objective of price stability to
be enshrined in the SBP Act, the Government will seek to review the terms of the temporary facilities published
in the SBP circulars depending on the evolving COVID-19 situation.
The Government is making good progress toward strengthening the SBP’s autonomy, governance and
mandate. The Government has worked closely with IMF staff in the preparation of amendments to the SBP
Act to address existing gaps. The amendments aim to: (i) establish domestic price stability as the primary
objective, with financial stability and growth as secondary objectives; (ii) clearly define the SBP’s functions
to help achieve these objectives; (iii) strengthen the SBP’s financial autonomy, including through statutory
mechanisms for sufficient recapitalisation and profit retention; (iv) prohibit the extension of direct credits or
guarantees to the general government; (v) establish the statutory underpinnings for audits; (vi) secure stronger
protection of the personal autonomy of senior officials; (vii) further strengthen collegial decision making at
the executive management level; (viii) provide stronger oversight by the board of directors of the SBP; and
(ix) improve SBP’s accountability regarding the conduct of its monetary policy and the achievement of its
objectives. The Ministry of Finance submitted the amendments to Parliament in March 2021 and the
Government currently expects adoption by Parliament by end-September 2021.
The Government is closely monitoring the health of the financial sector to safeguard its resilience. The
Government will seek to ensure that the regulatory forbearance and relaxation of lending standards introduced
as part of the COVID-19-related response do not weaken the sector’s resilience as the Government also seeks
to return to the existing loan classification, provisioning rules and pre-COVID-19 lending standards once the
situation normalises. Further to these efforts, the Government remains engaged with two non-systemic private
sector banks and one public sector bank to ensure compliance with the minimum capital requirements.
However, due to technical difficulties during the crisis, the deadlines to ensure the compliance with the capital
requirements have been reset to end-September 2021. The public sector bank is undergoing a privatisation
process that is expected to be completed by end-September 2021. In case the privatisation is not successful,
the Government will consider other resolution options, including liquidation. The Government also recognises
the need to address gaps in its bank resolution and crisis management frameworks, including the deposit
insurance scheme, and with the support of IMF technical assistance the Government plans to strengthen and
modernize them by end-2021.
The Government is committed to the full completion of the AML/CFT Action Plan. To this end, the
Government has engaged several capacity development providers, including the IMF, and the Government has
made significant progress toward completion of its Action Plan. By June 2021, satisfactory progress has been
made across 26 of the 27 action items, which was appreciated during the FATF June 2021 plenary meeting. In
light of the efforts to build capacity and the challenges presented by the COVID-19 pandemic, the Government
needs additional time to demonstrate effectiveness of its AML/CFT regime toward a substantial level of
effectiveness in line with its AML/CFT Action Plan. In parallel, the Government continues to make efforts to
address the deficiencies identified by the 2019 Mutual Evaluation Report of the Asia Pacific Group on Money
laundering (APG) and implement its priority recommendations. The Government has enacted amendments in
14 laws to address the technical compliance requirements and align with the FATF standards. An internal
roadmap has been developed to implement the Mutual Evaluation Report recommended actions. Dedicated
teams have also been formed for implementing the recommended actions.
The Government is easing foreign exchange restrictions and administrative measures as conditions allow. The
Government has refrained from introducing or intensifying exchange restrictions, multiple currency practices
or import restrictions for balance of payment measures. Moreover, the Government remains committed to

27
phase out the existing measures as the balance of payments stabilises and to eliminate them by the end of the
IMF EFF programme. In this respect, the Government has taken additional steps to relax existing measures:
In January 2020, the Government relaxed existing measures permitting: (i) banks to make advance
payments up to U.S.$10,000 per invoice on behalf of manufacturing/industrial companies and
commercial importers (which was already allowed for manufacturing companies in November 2019)
for the import of raw materials, spare parts and machinery ultimately used by manufacturing and
industrial companies; and (ii) banks to make advance payment against irrevocable letter of credit up
to 100 per cent of the value of the letter of credit for the import of plants, machinery, spare parts and
raw materials on behalf of manufacturing companies for their own use.
In March 2020, banks were allowed to make advance payments up to U.S.$25,000 per invoice on
behalf of manufacturing, industrial companies and commercial importers for the import of raw
materials, spare parts and machinery for ultimate use by manufacturing and industrial companies.
In March 2020, in the context of combatting COVID-19, the Government allowed all federal and
provincial government departments, public and private sector hospitals, charitable organisations and
commercial importers to make import advance payment, without limit, for the import of medical
equipment, medicine and other ancillary items for the treatment of COVID-19.
In September 2020, the Government took an additional step to ease restrictions in the context of the
economic recovery post-COVID-19 crisis: the 100 per cent cash margin requirement on 106
harmonised system codes items relating to the import of certain raw materials to support
manufacturing and industrial sectors were removed.
Energy Sector Policies (replacing the text set out under caption “Overview of Pakistan’s Economy –
Economic Reform Programme and Key Policy Objectives – Energy Sector Policies” on pages 114 and 115 of
the Offering Circular)
The Government recognises that the power sector has reached a critical situation. During 2020, the
Government introduced policies aimed at providing relief to power sector consumers from the economic
slowdown, rising inflation and, more importantly, from the impact of the COVID-19-related shock. Among
these measures, the Government (i) paused the adjustments of tariffs for monthly fuel and quarterly capacity
payments since January 2020, including the second quarter of the fiscal year 2019-20 adjustment and (ii)
introduced payment deferrals beginning in March 2020 to provide relief to low-end consumers. These policies,
together with a significant decline in consumer demand from the COVID-19-related containment measures,
contributed to a significant accumulation of arrears, erasing the gains the Government had achieved in
improving sector performance through the implementation of the circular debt management plan (CDMP). As
a result, Rupees 538 billion of arrears were accumulated during the fiscal year 2019-20, significantly higher
than projected under the CDMP and bringing the total stock of arrears to Rupees 2,150 billion as at 30 June
2020. An additional Rupees 102 billion were accumulated during the first quarter of the fiscal year 2020-21,
Rupees 50 billion during the second quarter of the fiscal year 2020-21 and Rupees 71 billion during the third
quarter of the fiscal year 2020-21.
In response, the Government has reinforced its efforts to ensure power sector viability. The Government
already took some important initial steps to contain the accumulation of power sector arrears, also reflecting
the intense collaboration with the technical experts from the World Bank and Asian Development Bank:
NEPRA Act amendments. Adopted by Parliament in March 2021, these: (i) give the regulator the power
to determine and notify quarterly tariffs; (ii) help to ensure timely submissions of quarterly and annual
petitions by the distribution companies (DISCOs); (iii) eliminate the gap between the regular annual
tariff determination and notification by the Government; and (iv) reinstate the power of the
Government to levy surcharges over and above the system’s revenue requirements under the NEPRA
Act.
28
Power prices. The cabinet has approved a timetable for the determined, but not yet notified electricity
price adjustments. This timetable includes a two-staged implementation of the fiscal year 2020-21
annual rebasing, determined as a 3.34 Rupees/kWh increase in the base tariff. To mitigate the impact
on the consumer and economic recovery in the context of COVID-19, the Government has notified
the first increase of 1.95 Rupees/kWh in January 2021 and completed the notification of the fiscal year
2019-20 second quarter and third quarter quarterly tariff adjustments in December 2020, along with
accompanying measures aimed at attenuating the social and sectoral impacts and strengthening reform
traction. These included energy subsidy reform steps aimed at reducing the regressive structure of the
tariff structure, which include a more expanded definition of the lifeline tariff as a relief for the
vulnerable and the determination of the subsidised tariff slab based on households’ maximum usage
from the previous 12-months (rather than monthly) consumption. Furthermore, the Government
launched a public outreach campaign to explain the reform need and strategy to consumers. In June
2021, the Government decreased its Central Power Purchasing Agency Guarantee Limited payables
to independent power producers through a payment of Rupees 89.9 billion. The Government expects
to be able to pay another Rupees 134.8 billion in the second quarter of the fiscal year 2021-22.
Medium-term measures on the cost side. In mid-August 2020, the Government signed a memorandum
of understanding with a group of private independent power producers (IPPs) to lower, and convert
into domestic currency, the guaranteed return on equity as well as sharing excess returns on operational
and maintenance expenses from contractual efficiencies. However, before this memorandum of
understanding could be converted into binding contractual agreements, the Government first needed
to settle Rupees 403 billion in outstanding arrears to those IPPs. The Government is doing this in two
tranches, each one-third in cash and two-thirds in five to 10-year debt instruments. The first tranche
of Rupees 161 billion came due in March 2021 and the remainder will be due in August 2021.
However, to noticeably reduce agreed capacity payments and ultimately the need for power tariff
increases, the Government is working to negotiate similar terms with other groups of power producers
(including those owned by the Government).
Recalibrating the CDMP. Supported by the World Bank and Asian Development Bank, the federal
cabinet approved an updated CDMP in March 2021 that reflects in particular: (i) the impact of the
timetable for determined but not yet notified electricity price adjustments adopted by the federal
cabinet, implementation of the first-stage annual rebasing, notification of the fiscal year 2019-20
fourth quarter quarterly tariff adjustment by September 2021 and amendments to the NEPRA Act; (ii)
an alignment of the required subsidies in the fiscal year 2020-21 budget; and (iii) a decision on the
budgeted subsidies for the fiscal year 2021-22. The CDMP remains ambitious in the envisaged
measures to deliver a sustained decline in the accumulation of power sector arrears. Moreover, the
CDMP incorporates savings that are envisaged in the later part of the plan from measures to reduce
transmission and distribution losses and the cost of electricity generation (such as the coming-on-
stream of cheaper renewable energy production, impact of renegotiated power purchasing
arrangements and improvements in transmission and distribution losses).
Going forward, the Government is expected to take additional measures that are crucial for halting the
accumulation of arrears:
Updating power tariffs. While the enactment of the NEPRA Act amendments is expected to ensure
the automaticity of quarterly tariff adjustments (beyond the already automatic monthly fuel price
adjustments), the Government will seek to ensure that it follows through on time with the remaining
annual rebasing step-increase. The Government is also expected to finalise the cross-subsidy reform
in the fiscal year 2021-22. At the same time, the Government is expected to renew its public awareness
campaign.
Streamlining of tariff adjustments. Preserving the principle embedded in the CDMP of automaticity
of tariff adjustments and in line with the plan’s declining path of accumulation of new arrears, the
Government is streamlining the process of power tariff adjustments to increase its predictability. The
new tariff adjustment plan, designed in consultation with the Government’s international partners, is
expected to consolidate tariff adjustments to significantly reduce the number of end-consumer tariff
29
adjustments in the fiscal year 2021-22 while delivering the required revenue for the system. In
particular, the fuel price adjustment, the quarterly adjustment for capacity payments and the annual
rebasing of tariffs are expected to continue to take place, but their timing will be adjusted to alleviate
consumers from the impact of continued tariff adjustments. Crucially, the Government will seek to
ensure that the consolidation of tariff adjustments will not generate any new accumulation of power
sector arrears.
Improving the targeting of subsidies. The Government recognises that the existing system of subsidies,
covering 93 per cent of domestic users, represents a significant budgetary drain and, through cross-
subsidies, implies elevated tariffs for the narrow group of unsubsidised users. For the fiscal year 2021-
22 budget and based on the first steps to redesign the tariff structure in the fiscal year 2020-21, the
Government plans to finalise, with the support of the World Bank, a comprehensive subsidy reform
that covers a restructuring of the tariff and measures and improves targeting (including to households
and the agricultural sector), while protecting the most vulnerable.
Strengthening DISCOs governance. The Government has initiated the process of appointing board
members and CEOs in all DISCOs under competitive and transparent procedures. Moreover, the
Government is exploring options for their phased privatisation.
The Government is advancing its strategy to reduce the stock of power sector arrears. The stock of power
sector arrears held by the Power Holding Private Limited (PHPL) stood at over Rupees 1,000 billion (about
2.2 per cent of GDP) as of end-December 2020, representing a significant quasi-fiscal risk. The Government
continues to work with international partners on the design of a strategy to settle the stock of arrears in PHPL,
while limiting the impact on government finances and subject to adequate progress in implementing the
CDMP. In this context, the Economic Coordination Committee has issued a notification allowing for the
conversion of PHPL debt into public debt over a 10-year period. An initial Rupees 25.5 billion were converted
in December 2020 and another Rupees 47 billion were converted by the end of the fiscal year 2020-21, with
subsequent transfers continuing to take place under a semi-annual schedule and seeking to transfer the most
expensive debt first and subject to satisfactory implementation of the revised CDMP. As part of this strategy,
the Government also raised Rupees 200 billion through a Sukuk issued with government guarantee in May
2020 to transfer costly Central Power Purchase Agency payables to independent power producers into the
PHPL.
The Government is taking steps to advance reforms in the gas sector. In view of the sector’s high stock of
arrears (amounting to about Rupees 199 billion at the end of the fiscal year 2019-20, up from Rupees 144
billion at the end of the fiscal year 2018-19), the Government is taking crucial measures to improve the sector’s
performance:
Timely updates of tariffs. The Government has revised gas sales prices upwards by September 2020
to fully reflect the projected annual revenue requirement of both Sui companies for the fiscal year
2020-21 and a part of Sui Sothern arrears. The Government is expected to consider the Oil and Gas
Regulatory Authority (OGRA) determination on annual revenue requirement of both Sui companies
and further revise gas sale prices upwards in the second half of the fiscal year 2020-21.
Amending the OGRA Act. The Council of Common Interests has adopted amendments to the OGRA
Act aimed at ensuring that recovery requirements are met in a timely manner in December 2019. The
draft bill for requisite enactment has been submitted to the federal cabinet’s Committee on Disposal
of Legislative Cases in April 2020. The bill is being transferred to the Parliamentary Affairs Division
for submission to Parliament.
Reducing unaccounted for gas losses (UFG). The two gas companies are working to reduce UFG
losses based on the reduction plans approved by the federal cabinet. The Government published the
first annual monitoring report covering the fiscal year 2019-20 in January 2021 and the first quarterly
report covering the first quarter of the fiscal year 2020-21 in February 2021. The Government expects
to continue to publish the reports on a quarterly basis which, inter alia, include: (i) an assessment of
progress reducing UFGs against relevant benchmarks; (ii) a quantitative analysis of the impact of the

30
various initiatives and measures; and (iii) an assessment of contingency measures to address areas of
weakness.
Structural Policies and Investing in the Green Recovery (replacing the text set out under caption “Overview
of Pakistan’s Economy – Economic Reform Programme and Key Policy Objectives – Structural Policies” on
pages 115 to 118 of the Offering Circular)
Structural reforms are a key pillar of the Government’s economic programme. The Government is striving to
create an enabling environment for investment and job creation, strengthen the productivity of state-owned
enterprises (SOEs) and enhance trust in Government.
The Government is committed to improving SOEs’ governance, transparency and efficiency. Specific actions
to achieve these goals include:
Advancing privatisation. Against the backdrop of the COVID-19 pandemic and economic uncertainty,
the Government has not been able to finalise the privatisation of two LNG power plants by the end of
the fiscal year 2019-20 as previously planned. The Government now expects to complete the process
by the end of February 2022, with proceeds still to be channelled to debt reduction and poverty
programmes. In parallel, the Government is making progress with the privatisation of two small public
banks and currently expects to complete these privatisations by the end of December 2021. Finally,
the Government is also assessing options with respect to divesting Pakistan International Airlines’
(PIA) non-core assets (two hotel properties).
Increasing transparency. The Government has completed and published the audits of PIA and
Pakistan Steel Mills in January 2020 and July 2020, respectively. The Auditor General of Pakistan
completed a special audit of Pakistan Railroads in March 2020 based on the fiscal year 2018-19
financial statements. The Government also plans to conduct and publish an audit of the Utility Stores
Corporation based on its fiscal year 2019-20 financial statements, which is currently expected to be
completed by 31 July 2021.
Strengthening the monitoring of SOEs. The Government completed, with support from the World
Bank, and published a report with respect to plans for SOEs in March 2021. This stocktaking and
analysis of Pakistan’s SOE portfolio resulted in a division of SOEs into: (i) those to be maintained
under state management; (ii) those to be privatised; or (iii) those to be liquidated. The next step will
be the execution of the action plan included in the report.
Enhancing the SOE legal and regulatory framework. Building on IMF-provided technical assistance
and in cooperation with international partners, the Government prepared a new SOE law and submitted
it to Parliament in March 2021. The Government currently expects it to be adopted by the end of
December 2021. Once enacted, the new SOE law is expected to, inter alia, (i) define the rationale for
state ownership; (ii) ensure that SOE operations are grounded on commercial footing, including by
defining what constitutes a commercial SOE; and (iii) regulate oversight and ownership arrangements.
Thereafter, the Government expects to focus on: (i) the adoption by the federal cabinet of an SOE
ownership policy by the end of September 2021 to help to operationalise the principles of the SOE
law (once enacted) into a policy that clarifies ownership arrangements and the division of roles within
the federal government; (ii) the submission to Parliament of amendments to laws on four SOEs by the
end of August 2021, which were chosen in November 2020 based on their debt levels, to help to ensure
that the scope of the new SOE law brings governance changes to statutory enterprises; and (iii) the
operationalisation of a Central Monitoring Unit within the Ministry of Finance by the end of July 2021
to centralise SOE monitoring functions and provide better analysis at the aggregate level.
Other comprehensive structural reforms must be accelerated to improve competitiveness and business
environment. These reforms are crucial for raising medium-term growth and supporting job creation. Going
forward, the Government expects to:

31
Continue to implement the approved national tariff policy, based on time-bound strategic, newly-
established and greenfield industry protection. In line with its revenue mobilisation strategy, the
Government expects to rationalise tariffs to boost competitiveness for “Made in Pakistan” products,
including phasing out tariffs on capital goods, intermediate products and raw materials.
Take steps to improve business environment. In particular, the Government plans to: (i) simplify
procedures to start a business and eliminate unnecessary regulations, including the introduction of one
portal for all business registrations and integration of federal and provincial entities involved in
starting a business; (ii) streamline the approval process for foreign direct investment; (iii) improve
trading across borders by reducing customs-related processing time and reducing hours to prepare
import/export documentation; (iv) simplify and harmonise the process of paying taxes through the
introduction of a simple and fully automated regime for paying taxes, contributions and fees; and (v)
launch a communication drive to disseminate information regarding the reforms undertaken.
Step up implementation of the Government’s recently launched National Electric Vehicle Policy
(NEVP) (2020-2025). The main objectives of this policy are: (i) mitigating negative aspects of climate
change through the reduction in CO2 emissions; (ii) strengthening the Government’s external position
by reducing the oil import bill; and (iii) creating a pivot toward industrial growth and generating
employment through new investments and the introduction of new technologies. The NEVP targets
electric cars to reach 30 per cent of new sales by 2030 as well as two- and three-wheelers and electric
buses to reach 50 per cent of new sales. This policy provides the framework that is expected to bring
the necessary transformation in a planned and phased manner, while having a positive socio-economic
impact in terms of industrial growth, employment generation and improved environment for future
generations.
Measures to strengthen governance and the control of corruption remain key for the Government. The
Government’s priorities include:
Strengthening the effectiveness of anti-corruption institutions. The Government plans to establish a
robust asset declaration system with a focus on high-level public officials, which is comprehensive in
scope (e.g., covers assets that are owned beneficially or located abroad), filed with a central federal
agency, electronically available to the public and searchable and appropriately and effectively verified.
The Government is undertaking the second review cycle under the United Nations Convention against
Corruption (UNCAC) implementation mechanism and is expected to publish the full report, including
the findings, analysis and recommendations for improving the anti-corruption framework. A task force
with inputs from reputable international experts and civil society organisations is expected to complete
a review of the institutional framework of the Government’s anti-corruption institutions by the end of
December 2021 to enhance their independence and effectiveness in investigating and prosecuting
corruption cases, with proposals for legislative amendments as appropriate. With the assistance from
capacity development providers, the Government is also expected to continue to upgrade the capacities
of law enforcement agencies such as the Federal Investigation Agency, National Accountability
Bureau (the NAB) and provincial Counter Terrorism Departments for financial investigations through
training. The Mutual Legal Assistance Act of 2020 also designated the NAB as a recipient and
requesting authority for international cooperation in the field of anti-corruption. The NAB is engaging
with several foreign law enforcement authorities to secure memoranda of understanding for
information sharing. Efforts continue to be pursued in identifying and recovering stolen assets located
abroad.
Enhancing the use of anti-money laundering tools to support anti-corruption efforts. The Government
continues to support financial institutions and other reporting institutions in improving their capacities
to identify politically exposed persons and apply enhanced due diligence measures. The Government
is conducting further outreach and continues to enhance risk-based supervision of financial institutions
and other reporting institutions to improve the quality of suspicious transaction reporting, particularly
on corruption activities. The Government is committed to enhancing the effectiveness of the Financial
Monitoring Unit (Pakistan's financial intelligence unit) by ensuring its fiscal autonomy and providing

32
sufficient human and financial resources to improve the dissemination of financial intelligence to
support corruption investigations.
Poverty Reduction and Social Protection (replacing the text set out under caption “Overview of Pakistan’s
Economy – Economic Reform Programme and Key Policy Objectives – Poverty Reduction and Social
Protection” on page 118 of the Offering Circular)
The Government has swiftly provided significant emergency cash support to the most vulnerable in response
to the COVID-19-related shock. On 1 April 2020, the Prime Minister launched the Ehsaas Emergency Cash
(EEC) programme to provide immediate one-time cash assistance (Rupees 12,000 per beneficiary) to an
eligible 17 million families – covering about one-half of all families and the two lowest income quintiles –
identified jointly with the provinces and supported by a far-reaching communication campaign. By the end of
June 2020, the Government had reached over 12.5 million households and had disbursed Rupees 133 billion
coming from the fiscal stimulus package, while in the first quarter of the fiscal year 2020-21 the Government
reached an additional 2.3 million households. Upon successful completion of the EEC programme at the end
of September 2020, the Government reverted its post-crisis social support to regular BISP beneficiaries in
October 2020, while it seeks to permanently broaden the scope of coverage (see below).
Going forward, the Government is intensifying its efforts in expanding social safety nets and fostering human
development. Pakistan has fallen behind regional peers in the implementation of the Sustainable Development
Goals, especially in the areas of health, education and gender equality. The Government has already adopted
significant measures to correct these shortcomings, including by: (i) approving a significant increase in
budgetary allocations for social programmes; (ii) improving the Government’s educational cash transfers to
boost girls’ primary educational enrolment and narrow the gender gap and (iii) developing a nutrition
programme for mother and children to reduce stunting. This progress notwithstanding, the Government is
working on additional initiatives aimed at strengthening its social support, including:
Seeking to ensure timely disbursement of benefits and expanding the number of beneficiaries. The
Government met the end of June 2020 target on cash transfers by BISP thanks to the one-off
disbursement under the EEC programme amid its COVID-19 response efforts, after missing the end
of March 2020 target largely due to exceptional challenges on account of the removal of more than
800,000 individuals from the programme (as part of the update of the National Socio-Economic
Registry (NSER)) and the slower-than-expected enrolment in new bank accounts by beneficiaries.
Going forward, the removal of those obstacles is expected to allow the Government to meet
disbursement targets on time. The Government is also on track to expand the BISP cash transfers to
six million families during the fiscal year 2020-21 (up from approximately 4.3 million as at 30 June
2020) and to seven million families over the medium term.
Finalising the update of the NSER and using it to seek to ensure adequate targeting. As of the end of
December 2020, the Government completed 55 per cent of the update through a combination of a
door-to-door survey and a desk-based self-registration mechanism. In parallel, the Government is
proceeding with the re-certification of surveyed beneficiaries. However, all field activities have been
stopped as a result of the COVID-19-related lockdown measures. As the Government was already
facing increasing challenges deploying field workers (especially in remote areas with greater security
concerns), the Government completed the registry update with a one-year delay (by the end of June
2021). This is expected to help the Government to ensure adequate targeting of BISP cash transfers to
all beneficiaries and to introduce an adequate indexing scheme.
Expanding BISP benefits. The Government has already approved a 20 per cent increase, to Rupees
6,000 effective January 2020, in the cash stipends to BISP beneficiaries to be disbursed on a monthly
basis rather than quarterly. Moreover, the Government doubled stipends in the educational conditional
cash transfer programme to Rupees 1,500 for boys and Rupees 2,000 for girls in August 2020 and
expanded it in all 154 districts of the country. Going forward, the Government is also exploring options
to (i) further expand the amount of BISP cash benefits in the context of the fiscal year 2021-22 budget;
(ii) continue the roll out of the nutrition programme on the basis of the lessons drawn from the pilot

33
phase; (iii) allow “never married” women to become eligible for BISP benefits; and (iv) help
beneficiaries to open savings bank accounts to advance financial inclusion.
Recent Finance Programmes with the IMF (adding a new paragraph after the eighth (last) paragraph set
out under caption “Overview of Pakistan’s Economy – Economic Reform and Key Policy Objectives – Recent
Finance Programmes with the IMF” on page 119 of the Offering Circular)
As of 30 June 2021, disbursements in the total amount of SDR 1,394 million (or approximately U.S.$1.95
billion) were made to Pakistan under the current IMF EFF programme.
Transport Infrastructure (replacing the fourth, fifth, sixth, seventh, eighth and ninth bullet points set out under
caption “Overview of Pakistan’s Economy – China-Pakistan Economic Corridor (CPEC) – Transport
Infrastructure” on pages 122 and 123 of the Offering Circular)
The construction of the 297 km motorway from Hakla to D.I.Khan, with an estimated cost of U.S.$683
million. Work on this project commenced in 2017. Approximately 93 per cent of work on this project
has been completed and its commercial operation is expected to be achieved by September 2021. This
project is being funded under the Public Sector Development Programme (PSDP).
The construction of the 106 km two-lane highway from Basima to Khuzdar in the Khuzdar district of
Balochistan province, with an estimated cost of U.S.$118 million. Work on this project commenced
in 2018. Approximately 62 per cent of work on this project has been completed and its commercial
operation is expected to be achieved at the end of 2021. This project is being funded under the PSDP.
The upgrade of the 305 km Zhob – Quetta (N-50) road from two to four lanes, with an estimated cost
of U.S.$391 million. Ground-breaking ceremony for this project was held in March 2019. This project
is being funded under the PSDP.
The construction of the 146 km two-lane highway from Hoshab to Awaran in Balochistan province,
with an estimated cost of U.S.$240 million. Ground-breaking ceremony for this project was held in
November 2020. This project is being funded under the PSDP.
The upgrade of the 235 km D.I.Khan (Yarik) – Zhob (N-50 Phase-1) road from two to four lanes, with
an estimated cost of U.S.$472 million. Planning Commission PC-1 Form has been approved.
Negotiations with respect to concessional financing for this project between China and Pakistan are
ongoing.
The Public-Private Partnership Authority has approved the construction of Sukkur-Hyderabad
Motorway (M-6), a critical component of CPEC, on a build-operate-transfer basis. The estimated cost
of this 306 km motorway is U.S.$1,208 million.
(adding a new paragraph with three bullet points after the last bullet point set out under caption “Overview
of Pakistan’s Economy – China-Pakistan Economic Corridor (CPEC) – Transport Infrastructure” on page
123 of the Offering Circular)
Recently, the following new projects have been approved as part of the PSDP under CPEC portfolio:
Construction of the 168 km Awaran – Naal section of M-8 project with an estimated cost of Rupees
32 billion;
Upgrade of the 330 km Khuzdar – Kuchlak section of N-25 with an estimated cost of Rupees 81
billion; and

34
Upgrade of the 136 km Awaran – Jhal Jaho – Bela section with an estimated cost of Rupees 18 billion.
Gwadar port (replacing the second paragraph and the table after the second paragraph set out under caption
“Overview of Pakistan’s Economy – China-Pakistan Economic Corridor (CPEC) – Gwadar port” on pages
123 and 124 of the Offering Circular)
A number of major projects have been commenced or are to be commenced in Gwadar with Chinese assistance,
including:
Project
Estimated Cost
(U.S.$ million) Status
Gwadar East-Bay Expressway 179 Expected to be completed in April 2022
New Gwadar International Airport 230 Ground-breaking ceremony held in March 2019.
Approximately 13 per cent of work completed
Water supply project 130 Phase-I completed. Approximately 98 per cent of work
on Phase-II completed. Phase-III is expected to be
commenced in 2021
Gwadar 300 MW Power Project 542 See "– Energy" above
Technical and Vocational Institute 10 Ground-breaking ceremony held on 16 December
2019. Approximately 70 per cent of work completed
Pak China Friendship Hospital 100 Feasibility study completed to add 100 beds to the
existing 50 (subsequent extension to 300 beds
anticipated).
Ground-breaking ceremony held on 16 December
2019. Approximately 10 per cent of work completed
Establishment of Gwadar Free Zone 32 1st phase completed and inaugurated in January 2018.
Ground-breaking ceremony for the 2nd phase is
expected to be held in July 2021
Construction of port breakwaters 123 Planning Commission PC-1 Form has been prepared
and submitted for approval
Dredging of berthing areas and
channels
27 PC-1 for holding feasibility study has been approved
and allocation has been made in the PSDP 2021-22
Gwadar Smart Port City Master
Plan
4 Completed
Total 1,377
Source: CPEC Authority
(adding a new sub-section after the “Communications” sub-section set out under caption “Overview of
Pakistan’s Economy – China-Pakistan Economic Corridor (CPEC) – Communications” on page 124 of the
Offering Circular)
Special Economic Zones
Out of the nine special economic zones (SEZs) to be developed under CPEC framework, three (Rashakai in
KP, Dhabeji in Sindh and Allama Iqbal in Punjab) have been fast-tracked under CPEC. These SEZs are
expected to host industries producing, among others, textile products, home building materials, electronic and
electrical appliances, pharmaceuticals, automobiles, mechanical equipment and packaging. The ground-
breaking ceremony for the Allama Iqbal Industrial City was held in January 2020 and for the Rashakai
Economic Zone in May 2021.

35
Gross Domestic Product (replacing the text set out under caption “Overview of Pakistan’s Economy – Gross
Domestic Product” on pages 124 to 127 of the Offering Circular)
The composition of Pakistan's GDP has undergone considerable change over the last four decades as it
experienced growth away from the agricultural sector in favour of the services sector. While the share of the
industrial sector has remained relatively constant for some years, it has shown a slight decrease in 2020-21
principally due to negative growth in the mining and quarrying sector and in electricity generation and
distribution and gas distribution. It amounted to 19.12 per cent of GDP in 2020-19. The share of the agricultural
sector declined from its highest level of approximately 39 per cent of GDP in 1969-70 to 19.19 per cent of
GDP in 2020-21; during the same period, the share of the services sector increased from 45 per cent of GDP
in 1969-70 to 61.68 per cent of GDP in 2020-21.
The following table sets out Pakistan's GDP at constant basic prices of 2005-06, as well as the contribution of
various sectors of the economy to GDP in the period 2016-17 to 2020-21.
Sectors 2016-17 2017-18 2018-19(1) 2019-20(2) 2020-21(3)
2019-20/
2018-19
2020-21/
2019-20
Rupees (millions,
unless otherwise
stated)
(% change)
A. Services Sector 7,014,467 7,459,758 7,742,479 7,699,891 8,041,169 (0.6) 4.4
1. Wholesale and
retail trade
2,187,751 2,331,415 2,356,539 2,263,668 2,453,199 (3.9) 8.4
2. Transport,
storage and
communication
1,557,639 1,587,297 1,660,907 1,597,828 1,588,101 (3.8) (0.6)
3. Finance and
insurance
396,669 426,012 445,219 450,270 485,574 1.1 7.8
4. Housing
services
(ownership of
dwellings)
777,140 808,172 840,489 874,219 909,247 4.0 4.0
5. General
government
services
882,015 986,125 1,037,147 1,047,767 1,070,833 1.0 2.2
6. Other private
services
1,213,253 1,320,737 1,402,178 1,466,139 1,534,215 4.6 4.6
B. Agricultural
Sector
2,253,565 2,343,614 2,356,827 2,434,850 2,502,181 3.3 2.8
1. Crops 832,744 871,796 828,596 874,504 896,102 5.5 2.5
Important crops 534,659 553,693 511,129 537,929 562,964 5.2 4.7
Other crops 244,703 260,026 266,791 288,344 292,420 8.1 1.4
Cotton ginning 53,382 58,077 50,676 48,231 40,718 (4.6) (4.8)
2. Livestock 1,326,948 1,375,986 1,428,608 1,458,624 1,503,254 2.1 3.1
3. Forestry 45,505 46,679 50,076 51,880 52,617 3.6 1.4
4. Fisheries 48,368 49,153 49,547 49,842 50,280 0.6 0.9
C. Industrial Sector 2,428,902 2,540,894 2,501,345 2,407,093 2,493,031 (3.8) 3.6
1. Mining and
quarrying
331,121 356,949 361,221 331,309 309,823 (8.3) (6.5)

36
Sectors 2016-17 2017-18 2018-19(1) 2019-20(2) 2020-21(3)
2019-20/
2018-19
2020-21/
2019-20
Rupees (millions,
unless otherwise
stated)
(% change)
2. Manufacturing 1,581,680 1,667,524 1,656,069 1,533,747 1,667,362 (7.4) 8.7
Large scale 1,260,836 1,325,429 1,290,942 1,160,247 1,268,043 (10.1) 9.3
Small scale 214,839 232,383 251,532 255,303 276,530 1.5 8.3
Slaughtering 106,005 109,712 113,595 118,197 122,789 4.1 3.9
3. Electricity
generation and
distribution and
gas distribution
198,180 164,067 186,328 228,065 175,700 22.4 (23.0)
4. Construction 317,921 352,354 297,727 313,972 340,146 5.5 8.3
Commodity
Producing Sector
(B+C)
4,682,467 4,884,508 4,858,172 4,841,943 4,995,212 (0.3) 3.2
GDP (A+B+C) 11,696,934 12,344,266 12,600,651 12,541,834 13,036,381 (0.5) 3.9
Taxes 795,386 862,628 795,748 740,311 812,900 (7.0) 9.8
Subsidies 83,545 73,891 113,056 123,053 71,924 8.8 (41.6)
GDP + Taxes –
Subsidies
12,408,775 13,133,003 13,283,343 13,159,092 13,777,357 (0.9) 4.7
Net factor
income from
abroad
669,191 673,876 874,614 1,089,918 1,484,683 24.6 36.2
Gross national
income
13,077,966 13,806,879 14,157,957 14,249,010 15,262,040 0.6 7.1
Population
(million)
197.3 201.0 204.7 208.3 211.9 1.8 1.7
Per capita
income
66,300 68,705 69,181 68,403 72,015 (1.1) 5.3
(1) Final
(2) Revised
(3) Provisional.
Source: Pakistan Bureau of Statistics
The following table sets out Pakistan's GDP at current basic prices, as well as the contribution of various
sectors of the economy to GDP in the period from 2016-17 to 2020-21:
Sectors 2016-17 2017-18 2018-19(1) 2019-20(2) 2020-21(3)
2019-20/
2018-19
2020-21/
2019-20
Rupees (millions,
unless otherwise
stated)
(% change)
A. Services Sector 16,975,549 18,270,699 20,518,341 22,374,227 25,223,552 9.0 12.7
1. Wholesale and
retail trade
5,792,701 6,232,618 6,902,928 7,196,739 8,419,076 4.3 17.0

37
Sectors 2016-17 2017-18 2018-19(1) 2019-20(2) 2020-21(3)
2019-20/
2018-19
2020-21/
2019-20
Rupees (millions,
unless otherwise
stated)
(% change)
2. Transport,
storage and
communication
3,697,932 3,523,539 3,866,033 4,065,331 4,785,777 5.2 17.7
3. Finance and
insurance
594,362 684,623 908,121 1,106,187 916,265 21.8 (17.2)
4. Housing
services
(ownership of
dwellings)
1,668,521 1,848,594 2,059,629 2,275,293 2,485,965 10.5 9.3
5. General
government
services
2,263,393 2,629,924 2,968,885 3,332,876 3,670,326 12.3 10.1
6. Other private
services
2,958,640 3,351,401 3,812,745 4,397,801 4,946,143 15.3 12.5
B. Agricultural
Sector
7,318,465 7,911,779 8,368,631 9,612,331 11,542,998 14.9 20.1
1. Crops 2,826,463 2,964,894 2,888,671 3,702,887 4,642,762 28.2 25.4
Important crops 1,827,252 1,890,555 1,803,359 2,333,252 3,068,717 29.4 31.5
Other crops 811,971 874,378 909,337 1,170,812 1,376,753 28.8 17.6
Cotton ginning 187,240 199,961 175,975 198,822 197,293 13.0 (0.8)
2. Livestock 4,180,531 4,615,565 5,119,066 5,509,117 6,470,351 7.6 17.4
3. Forestry 172,578 183,199 202,162 220,332 244,184 9.0 10.8
4. Fisheries 138,893 148,121 158,732 179,995 185,701 13.4 3.2
C. Industrial Sector 5,683,545 6,220,543 7,010,231 7,364,291 8,128,397 5.1 10.4
1. Mining and
quarrying
644,686 755,778 1,004,203 1,095,298 976,819 9.1 (10.8)
2. Manufacturing 3,830,210 4,217,685 4,730,014 4,764,739 5,621,560 0.7 18.0
Large scale 3,044,603 3,331,305 3,722,568 3,646,994 4,282,289 (2.0) 17.4
Small scale 457,088 506,839 572,034 624,546 755,325 9.2 20.9
Slaughtering 328,520 379,542 435,412 493,199 583,946 13.3 18.4
3. Electricity
generation and
distribution and
gas distribution
529,040 435,889 530,908 717,505 611,169 35.1 (14.8)
4. Construction 679,609 791,191 745,106 786,749 918,849 5.6 16.8
Commodity
Producing Sector
(B+C)
13,002,010 14,112,322 15,378,862 16,976,622 19,671,395 10.4 15.9
GDP (A+B+C) 29,977,559 32,383,021 35,897,203 39,350,849 44,894,947 9.6 14.1
Taxes 2,170,448 2,435,629 2,515,836 2,599,306 3,065,120 3.3 17.9
Subsidies 225,704 202,348 326,807 393,829 250,742 20.5 (36.3)

38
Sectors 2016-17 2017-18 2018-19(1) 2019-20(2) 2020-21(3)
2019-20/
2018-19
2020-21/
2019-20
Rupees (millions,
unless otherwise
stated)
(% change)
GDP + Taxes –
Subsidies
31,922,303 34,616,302 38,086,232 41,556,326 47,709,325 9.1 14.8
Net factor income
from abroad
1,743,643 1,846,151 2,550,025 3,242,724 4,513,289 27.2 39.2
Gross national
income
33,665,946 36,462,453 40,636,257 44,799,050 52,222,614 10.2 16.6
Population
(million)
197.3 201.0 204.7 208.3 211.9 1.8 1.7
Per capita income 170,672 181,441 198,565 215,060 246,414 8.3 14.6
Per capita income
(U.S.$)
1,630 1,652 1,459 1,361 1,543 (6.7) 13.4
GDP deflator
index
256.29 262.33 284.88 313.76 344.38 10.1 9.8
GDP deflator
(% growth)
3.97 2.36 8.60 10.14 9.76 - -
(1) Final
(2) Revised
(3) Provisional.
Source: Pakistan Bureau of Statistics
Services Sector (replacing the text set out under caption “Overview of Pakistan’s Economy – Principal
Sectors of the Economy – Services Sector” on pages 127 and 128 of the Offering Circular)
The services sector in Pakistan consists of (i) wholesale and retail trade, (ii) transportation, storage and
communications, (iii) finance and insurance, (iv) housing services, (v) general government services and (vi)
other private services. The services sector has been an important contributor to Pakistan's economic growth
and it contributed 61.68 per cent of GDP in 2020-21, experiencing growth of 4.4 per cent in 2020-21, compared
to 61.4 per cent of GDP (and negative growth of 0.6 per cent) in 2019-20.
Transportation (replacing the second and third paragraphs set out under caption “Overview of Pakistan’s
Economy – Principal Sectors of the Economy – Services Sector – Transportation” on page 128 of the Offering
Circular)
The Government is providing Rupees 24.604 billion for construction of the infrastructure of a bus rapid transit
system (green line) in Karachi. The project envisages construction of a 27.45 kilometre long two lane dedicated
signal free bus rapid transit system connecting KESC Power House Chowrangi (Abdullah Chowk), Surjani
town to the central business district of Karachi. The first 21.7 kilometre section from Surjani town to Municipal
Park M.A Jinnah road has been completed and the remaining portion of the project is expected to commence
operations by mid-September 2021.
Another project funded by the federal government and started in 2016-17 is a 25.6 kilometre long metro-bus
system from Peshawar Moor to New Islamabad International Airport, which is estimated to cost Rupees 16.43
billion. This project was completed in June 2021.

39
Roads and Highways (replacing the fifth paragraph set out under caption “Overview of Pakistan’s Economy
– Principal Sectors of the Economy – Services Sector – Transportation – Roads and Highways” on page 129
of the Offering Circular)
The NHA's existing portfolio consists of 32 on-going projects with an allocation of Rupees 89.0 billion in the
Public Sector Development Programme 2020-21.
Railways (replacing the third paragraph set out under caption “Overview of Pakistan’s Economy – Principal
Sectors of the Economy – Services Sector – Transportation – Railways” on page 129 of the Offering Circular)
At the end of February 2021, Pakistan Railways had 466 locomotives for 7,791 kilometres of its railway routes.
During the July-February period of the fiscal year 2020-21, Pakistan Railways' gross earnings decreased by
16.1 per cent as compared to the same period of the previous year and amounted to Rupees 30,966 million.
During the same period, the number of passengers carried decreased by 54.0 per cent as compared to the same
period of the previous year and amounted to 18.1 million.
Civil Aviation (replacing the first paragraph set out under caption “Overview of Pakistan’s Economy –
Principal Sectors of the Economy – Services Sector – Transportation – Civil Aviation” on page 129 of the
Offering Circular)
In large part due to Pakistan's liberal open skies policy and tough competition resulting in price wars, the
financial state of the Pakistan International Airlines (PIA) is currently poor, although it has significantly
improved in comparison with the previous year. PIA follows the calendar year for financial and operational
matters. In 2020, its operating revenue was Rupees 94,683 million as compared to Rupees 146,097 million in
2019, while its operating expenses were Rupees 102,912 million in 2020 as compared to Rupees 160,037
million in 2019 (with both operating revenue and operating expenses based on provisional / estimated and
unaudited accounts).
Maritime Affairs – Ports (replacing the first and second paragraphs set out under caption “Overview of
Pakistan’s Economy – Principal Sectors of the Economy – Services Sector – Transportation – Civil Aviation”
on page 130 of the Offering Circular)
Karachi Port and Port Qasim, both located in Karachi, are the two major ports in Pakistan. Karachi Port Trust
was established in 1886. During the July 2020 to March 2021 period, Karachi Port Trust managed a total cargo
and container volume of 39.4 million tons. It experienced a 21 per cent increase in total cargo and container
handling over the July 2019 to March 2020 period. While export cargo and container volume grew by 3 per
cent in the July 2020 to March 2021 period as compared to the July 2019 to March 2020 period, imports
increased by 31 per cent over the same period.
Port Qasim handled a total cargo volume of 43.0 million tons during the July 2020 to March 2021 period, with
imports accounting for 37.3 million tons and exports accounting for 5.6 million tons. In the fiscal year 2020-
21, Port Qasim handled a total cargo volume of 51.0 million tons, with imports accounting for 43.5 million
tons and exports accounting for 7.5 million tons.
Postal Services (replacing the text set out under caption “Overview of Pakistan’s Economy – Principal Sectors
of the Economy – Services Sector – Communications – Postal Services” on page 130 of the Offering Circular)
Pakistan Post Office, with its over 10,103 post offices as of March 2021, is playing a vital role in the economic
and social development of Pakistan through postal services that can be broadly categorised as domestic and
international postal services, financial services, savings bank, postal life insurance and agency functions, such
as the collection of payments on utility bills, payment of military pensions, collection of provincial taxes, and
disbursement of funds under the BISP on behalf of federal and provincial government departments.

40
Telecommunications (replacing the text set out under caption “Overview of Pakistan’s Economy – Principal
Sectors of the Economy – Services Sector – Communications – Telecommunications” on pages 130 and 131
of the Offering Circular)
The telecommunications sector contributes significantly to Pakistan's economy. The Government has granted
high priority to developing Pakistan's telecommunications sector to facilitate sustainable growth in all sections
of the economy. Pakistan successfully deregulated its telecommunications sector in 2003-04, leading to
increased competition in the fixed line and mobile cellular segments of the telecommunications sector and
resulting in the expansion of telecommunication infrastructure, low tariffs, high revenues, increased tax
contributions and employment opportunities. The telecommunications sector experienced positive growth
during the first nine months of the fiscal year 2020-21. The total number of mobile subscriptions (number of
active SIMs) reached 181.7 million as at 31 March 2021, as compared to 167.3 million as at 30 June 2020.
Total teledensity reached 85.8 per cent as at 31 March 2021 registering growth of 7.3 per cent during the July
2020 to March 2021 period. The principal reason for this increase in teledensity is the growth in the number
of mobile subscribers. Based on figures updated in March 2021, cellular operators’ respective market shares
were PMCL (Jazz) 37.80 per cent, Telenor 26.71 per cent, PTML (Ufone) 12.81 per cent and CMPAK (Zong)
21.90 per cent.
Other segments of the telecommunications sector include fixed local loop, wireless local loop and long
distance international. The combined subscriber base of the fixed local loop and wireless local loop segments
increased to 2.46 million as of 31 March 2021 as compared to 2.42 million as of 30 June 2020.
Mobile and fixed broadband subscriber base experienced strong growth from July 2020 to March 2021. As of
31 March 2021, the number of broadband subscribers reached 99.6 million as compared to 83.2 million as of
30 June 2020.
The telecommunications sector is among the major foreign investment attracting sectors in Pakistan. From
July 2012 to February 2021, the telecommunications sector attracted over U.S.$3.9 billion in foreign direct
investment inflows, including U.S.$101.1 million during the July 2020 to February 2021 period. In addition,
telecommunications operators in Pakistan invested U.S.$363.9 million during the July 2020 to February 2021
period.
Various mobile operators (CMPak, Jazz, Telenor, Ufone and PTCL) have successfully carried out 5G trials in
Pakistan. A 5G Pakistan Plan Committee has been created by the Ministry of Information Technology and
Telecommunication, consisting of stakeholders from the public and private sectors. The 5G Pakistan Plan
Committee is developing a strategic plan and roadmap for 5G technology in Pakistan, covering spectrum
management, infrastructure development, review of telecommunications regulations and 5G applications.
Financial Services (replacing the second paragraph set out under caption “Overview of Pakistan’s Economy
– Principal Sectors of the Economy – Services Sector – Financial Services” on page 131 of the Offering
Circular)
As at 31 March 2021, the banking industry in Pakistan consisted of 32 commercial banks, nine DFIs and nine
nation-wide and two province-wide MFBs. The commercial banks comprise five public sector banks, and 20
private sector banks, including five Islamic commercial banks, four foreign banks (operating through
branches) and three specialised banks.
Commercial Banking Sector (replacing the first, second, third and fourth paragraphs set out under caption
“Overview of Pakistan’s Economy – Principal Sectors of the Economy – Services Sector – Financial Services
– Commercial Banking Sector” on pages 133 and 134 of the Offering Circular)
The overall performance of the banking sector, which dominates the financial services sector of Pakistan,
remained relatively strong over the last few years despite macroeconomic challenges, the ongoing COVID-19
pandemic and other structural issues. Its asset base stood at Rupees 25.8 trillion as at 31 March 2021. Asset
growth in the banking sector accelerated by 16.3 per cent (year-on-year) in the three months ended 31 March
2021 as compared to 19.2 per cent (year-on-year) in the three months ended 31 March 2020. This growth was

41
due to the strong increase in investments by 34.1 per cent on the year-on-year basis in the three months ended
31 March-2021. Advances grew by 2.2 per cent (year-on-year) in the three months ended 31 March 2021 as
compared to growth of 4.6 per cent (year-on-year) in the three months ended 31 March 2020. Deposits
experienced robust growth of 16.4 per cent (year-on-year) in the three months ended 31 March 2021 as
compared to 13.2 per cent in the same period of the previous fiscal year. While increases have been observed
in all categories of deposits, major increases took place in current accounts (non-remunerative) and savings
deposits.
Despite the impact of the COVID-19 pandemic, the credit risk indicators have remained contained and banks’
capital levels remained well above both minimum regulatory requirements and international standards. This
was helped by the SBP’s various policy measures, such as deferment of principal payments and
restructuring/rescheduling of loans. With the rise in advances and some increase in non-performing loans
(NPLs), the gross NPLs to loans ratio marginally increased to 9.3 per cent as at 31 March 2021 from 9.1 per
cent a year earlier. However, due to the prudent approach adopted by banks during the COVID-19 pandemic,
the banks enhanced the level of provisions (both specific provisions for classified assets and general provisions
to cover prospective losses), which led to an increase in the provisions coverage ratio (provisions to NPLs) to
87.6 per cent as at 31 March 2021 as compared to 81.9 per cent a year earlier. As a result, the level of net
non-performing loans (NNPLs) decreased to Rupees 105.7 billion as at 31 March 2021 from Rupees 146.1
billion as at 31 March 2020, while NNPLs to net loans ratio decreased to 1.3 per cent as at 31 March 2021
from 1.8 per cent a year earlier.
Prudent risk-based regulations have helped the banking sector to maintain a strong solvency profile. CAR
improved to 18.3 per cent as at 31 March 2021 from 17.2 per cent as at 31 March 2020.
The earnings of the banking sector experienced a large year-on-year increase of 21.9 per cent in the three
months ended 31 March 2021 as profit before tax amounted to Rupees 96.4 billion in the three months ended
31 March 2021 as compared to Rupees 79.1 billion in the three months ended 31 March 2020. The increase in
profitability was driven by higher net interest income as well as non-interest income. Accordingly, almost all
profitability indicators, such as return on assets and return on equity improved in the three months ended 31
March 2021 as compared to the three months ended 31 March 2020.
(replacing the sixth paragraph set out under caption “Overview of Pakistan’s Economy – Principal Sectors
of the Economy – Services Sector – Financial Services – Commercial Banking Sector” on page 134 of the
Offering Circular)
As at 31 March 2021, Pakistan's banks' liabilities consisted of (i) customer deposits and other accounts (77.4
per cent), (ii) borrowings from financial institutions (16.1 per cent), (iii) bills payable (1.3 per cent), (iv)
subordinated loans (0.5 per cent), (v) deferred tax liabilities (0.2 per cent), (vi) liabilities against assets subject
to finance lease (0.03 per cent) and (vii) other liabilities (4.6 per cent).
Microfinance (replacing the second paragraph set out under caption “Overview of Pakistan’s Economy –
Principal Sectors of the Economy – Services Sector – Financial Services – Microfinance” on page 134 of the
Offering Circular)
As at 31 March 2021, the microfinance sector collectively (11 MFBs, one Islamic banking institution (MCB
Islamic Bank) and 35 non-bank microfinance companies) served 7.59 million borrowers. This sector has
achieved 13.5 per cent growth in its aggregate loan portfolio, which grew by Rupees 40.5 billion to Rupees
340.5 billion during the July 2020 to the March 2021 period.
Islamic Banking (replacing the seventh bullet point after the second paragraph set out under caption
“Overview of Pakistan’s Economy – Principal Sectors of the Economy – Services Sector – Financial Services
– Islamic Banking” on page 135 of the Offering Circular)
issuing three five-year strategic plans for the Islamic banking industry; the first was issued in 2007
and the second in 2014; the third strategic plan for the period from 2021 to 2025;

42
(replacing the fifth (last) paragraph set out under caption “Overview of Pakistan’s Economy – Principal
Sectors of the Economy – Services Sector – Financial Services – Islamic Banking” on page 136 of the Offering
Circular)
The Islamic banking industry in Pakistan has grown significantly since its re-launch in 2002. The asset base
of the industry stood at Rupees 4,389 billion as at 31 March 2021 as compared to Rupees 3,360 billion as at
31 March 2020, representing growth of 30.6 per cent. Islamic banking deposits grew by 28.4 per cent to Rupees
3,457 billion as at 31 March 2021 as compared to Rupees 2,692 billion as at 31 March 2020. The industry's
asset base accounted for 17.0 per cent of the overall banking system in the country as at 31 March 2021, while
in terms of deposits its share in the country's banking system was 18.7 per cent as at the same date. As at 31
March 2021, 22 Islamic banking institutions; five full-fledged Islamic banks and 17 conventional banks having
standalone Islamic banking branches were providing Shari'ah-compliant products and services through their
network of 3,504 branches along with 1,595 windows (Islamic banking counters at conventional branches)
across the country.
Non-banking Financial Institutions (replacing the second paragraph and the table after the second
paragraph set out under caption “Overview of Pakistan’s Economy – Principal Sectors of the Economy –
Services Sector – Financial Services – Non-banking Financial Institutions” on pages 136 and 137 of the
Offering Circular)
The SECP regulates non-bank finance companies and the regulatory framework is transparent, robust and
based on the best international practices. The asset size of non-banking finance companies has increased at a
steady pace over the past few years. As at 31 March 2021, the asset size of non-banking finance companies
stood at Rupees 1,687.29 billion as compared to Rupees 1,412.42 billion as at 30 June 2020, representing an
overall increase of 19.46 per cent. Total assets of non-bank finance companies by sector as at 31 March 2021
were as follows:
Sector Number of entities Total assets
(Rupees billion)
As percentage of
total assets
Mutual funds/plans 279 1,005.04 59.57%
Asset management companies / investment
advisors 23 43.45 2.58%
Discretionary /non-discretionary portfolios - 291.18 17.26%
REIT management companies 7 6.02 0.36%
Real estate investment trust
(REIT scheme) 1 54.40 3.22%
Investment banks and micro finance institutions 38 183.57 10.88%
Leasing companies 6 5.79 0.34%
Modarabas 28 53.25 3.16%
Pension funds 19 36.60 2.17%
Private equity companies 4 0.11 0.01%
Private equity and venture capital funds 5 7.89 0.47%
Total 410 1,687.29 100%
Source: SECP
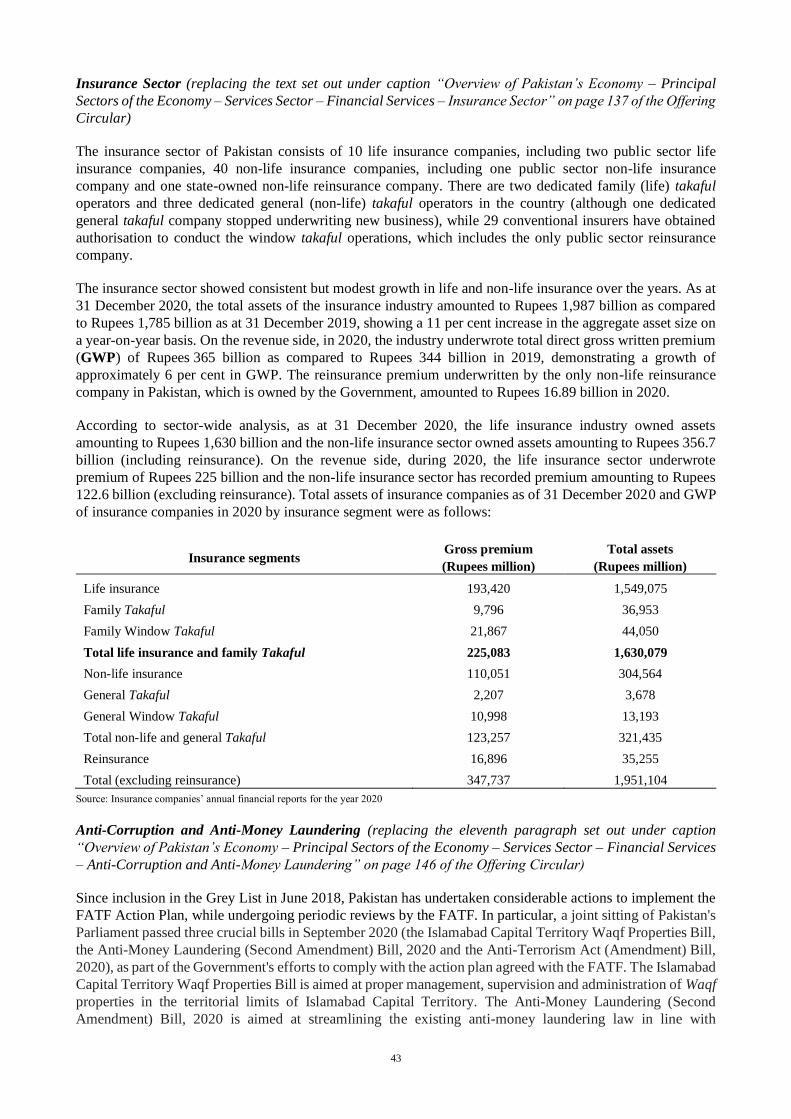
43
Insurance Sector (replacing the text set out under caption “Overview of Pakistan’s Economy – Principal
Sectors of the Economy – Services Sector – Financial Services – Insurance Sector” on page 137 of the Offering
Circular)
The insurance sector of Pakistan consists of 10 life insurance companies, including two public sector life
insurance companies, 40 non-life insurance companies, including one public sector non-life insurance
company and one state-owned non-life reinsurance company. There are two dedicated family (life) takaful
operators and three dedicated general (non-life) takaful operators in the country (although one dedicated
general takaful company stopped underwriting new business), while 29 conventional insurers have obtained
authorisation to conduct the window takaful operations, which includes the only public sector reinsurance
company.
The insurance sector showed consistent but modest growth in life and non-life insurance over the years. As at
31 December 2020, the total assets of the insurance industry amounted to Rupees 1,987 billion as compared
to Rupees 1,785 billion as at 31 December 2019, showing a 11 per cent increase in the aggregate asset size on
a year-on-year basis. On the revenue side, in 2020, the industry underwrote total direct gross written premium
(GWP) of Rupees 365 billion as compared to Rupees 344 billion in 2019, demonstrating a growth of
approximately 6 per cent in GWP. The reinsurance premium underwritten by the only non-life reinsurance
company in Pakistan, which is owned by the Government, amounted to Rupees 16.89 billion in 2020.
According to sector-wide analysis, as at 31 December 2020, the life insurance industry owned assets
amounting to Rupees 1,630 billion and the non-life insurance sector owned assets amounting to Rupees 356.7
billion (including reinsurance). On the revenue side, during 2020, the life insurance sector underwrote
premium of Rupees 225 billion and the non-life insurance sector has recorded premium amounting to Rupees
122.6 billion (excluding reinsurance). Total assets of insurance companies as of 31 December 2020 and GWP
of insurance companies in 2020 by insurance segment were as follows:
Insurance segments Gross premium
(Rupees million)
Total assets
(Rupees million)
Life insurance 193,420 1,549,075
Family Takaful 9,796 36,953
Family Window Takaful 21,867 44,050
Total life insurance and family Takaful 225,083 1,630,079
Non-life insurance 110,051 304,564
General Takaful 2,207 3,678
General Window Takaful 10,998 13,193
Total non-life and general Takaful 123,257 321,435
Reinsurance 16,896 35,255
Total (excluding reinsurance) 347,737 1,951,104
Source: Insurance companies’ annual financial reports for the year 2020
Anti-Corruption and Anti-Money Laundering (replacing the eleventh paragraph set out under caption
“Overview of Pakistan’s Economy – Principal Sectors of the Economy – Services Sector – Financial Services
– Anti-Corruption and Anti-Money Laundering” on page 146 of the Offering Circular)
Since inclusion in the Grey List in June 2018, Pakistan has undertaken considerable actions to implement the
FATF Action Plan, while undergoing periodic reviews by the FATF. In particular, a joint sitting of Pakistan's
Parliament passed three crucial bills in September 2020 (the Islamabad Capital Territory Waqf Properties Bill,
the Anti-Money Laundering (Second Amendment) Bill, 2020 and the Anti-Terrorism Act (Amendment) Bill,
2020), as part of the Government's efforts to comply with the action plan agreed with the FATF. The Islamabad
Capital Territory Waqf Properties Bill is aimed at proper management, supervision and administration of Waqf
properties in the territorial limits of Islamabad Capital Territory. The Anti-Money Laundering (Second
Amendment) Bill, 2020 is aimed at streamlining the existing anti-money laundering law in line with

44
international standards prescribed by the FATF. According to the Anti-Terrorism Act (Amendment) Bill, 2020,
the investigating officer, with the permission of the court, can conduct covert operations to detect terrorism
funding, track communications and access computer systems using the latest technologies for 60 days. The
court may extend the 60-days period for another 60 days. As at June 2021, Pakistan has been rated "largely
addressed" on 26 of 27 action items. At its last plenary meeting in June 2021, the FATF encouraged Pakistan
to continue to make progress to address as soon as possible the one remaining counter-terrorist financing-
related item by demonstrating that terrorist financing investigations and prosecutions target senior leaders and
commanders of UN designated terrorist groups.
Agricultural Sector (replacing the first paragraph set out under caption “Overview of Pakistan’s Economy
– Principal Sectors of the Economy – Agricultural Sector” on page 147 of the Offering Circular)
Agriculture is still the largest sector of the economy of Pakistan in terms of labour participation and, therefore,
the livelihood of the majority of the population directly or indirectly depends on it. During the last few decades,
its contribution to GDP has gradually decreased to 19.19 per cent in 2020-21. However, there is a lot of
potential in the sector to increase its share in GDP through the increased utilisation of the latest agricultural
technologies.
(replacing the fourth paragraph, the table after the fourth paragraph and the fifth paragraph set out under
caption “Overview of Pakistan’s Economy – Principal Sectors of the Economy – Agricultural Sector” on page
147 of the Offering Circular)
The following table sets out information on trends in agriculture growth rates from 2016-17 to 2020-21:
2016-17 2017-18 2018-19(1) 2019-20(2) 2020-21(3)
Agriculture 2.2 4.0 0.6 3.3 2.8
Crops 1.2 4.7 (5.0) 5.5 2.5
Important crops 2.6 3.6 (7.7) 5.2 4.7
Other crops (2.5) 6.3 2.6 8.1 1.4
Cotton ginning 5.6 8.8 (12.7) (4.8) (15.6)
Livestock 3.0 3.7 3.8 2.1 3.1
Forestry (2.3) 2.6 7.3 3.6 1.4
Fishing 1.2 1.6 0.8 0.6 0.7
(1) Final
(2) Revised
(3) Provisional
Source: Pakistan Economic Survey 2020-21
Over the years livestock has emerged as the largest sub-sector in agriculture. It contributed 60.1 per cent to the
agriculture value addition and 11.5 per cent to GDP during 2020-21. More than eight million rural families are
engaged in livestock production and derive more than 35-40 per cent of their income from this sector. The
Government is now focusing on this sector for economic growth, food security and poverty alleviation in the
country. Gross value addition of livestock increased from Rupees 1,461 billion in 2019-20 to Rupees 1,505
billion in 2020-21, an increase of 3.0 per cent.
(replacing the seventh paragraph, the table after the seventh paragraph and the eighth and ninth paragraphs
set out under caption “Overview of Pakistan’s Economy – Principal Sectors of the Economy – Agricultural
Sector” on page 148 of the Offering Circular)
The crops sub-sector includes important crops, other crops and cotton ginning. The following table sets out
information regarding the production volumes of Pakistan's important crops for the periods indicated:

45
2016-17 2017-18 2018-19 2019-20 2020-21(1)
2019-20 /
2018-19
2020-21(1) /
2019-20
(thousand tons, unless otherwise stated) (% change)
Cotton
(thousand bales)
10,671 11,946 9,861 9,148 7,064 (7.2) (22.8)
Sugarcane 75,482 83,333 67,174 66,380 81,009 (1.2) 22.0
Rice 6,849 7,450 7,202 7,414 8,419 2.9 13.6
Maize 6,134 5,902 6,826 7,883 8,465 15.5 7.4
Wheat 26,674 25,076 24,349 25,248 27,293 3.7 8.1
(1) Provisional
Source: Pakistan Economic Survey 2020-21
With respect to other crops, which accounted for an 11.7 per cent share in the agricultural sector, the production
of gram decreased by 47.6 per cent in 2020-21 as compared to 2019-20 on account of decline in area under
cultivation, yield and unfavourable weather conditions. The production of bajra and jowar also witnessed a
decrease of 30.7 per cent and 20.0 per cent, respectively, due to a decrease in area under cultivation. The
production of barley, rapeseed and mustard and tobacco remained at the last year’s production level.
During 2020-21, the performance of the agriculture sector improved as compared to 2019-20. However, the
challenges due to climate change, pest attacks and shortage of water kept agriculture production below its
potential. One key issue related to agriculture is that the farmers have limited direct access to the market, due
to which the role of middleman remains crucial. Farmers normally do not receive fair market price for their
produce. In terms of potential, the agriculture sector has the capacity to not only produce for the domestic
population, but to have surplus production for exports, which can ensure food security as well as contribute
towards foreign exchange earnings.
Industrial Sector (replacing the first and second paragraphs set out under caption “Overview of Pakistan’s
Economy – Principal Sectors of the Economy – Industrial Sector” on page 148 of the Offering Circular)
Pakistan's industrial sector accounted for 19.12 per cent of GDP in 2020-21. It is a major source of tax revenue
for the Government and contributes significantly to the provision of jobs in the labour force. It has four main
sub-components: (i) mining and quarrying, (ii) manufacturing, (iii) electricity generation and distribution and
gas distribution and (iv) construction.
LSM accounted for 9.7 per cent of the GDP and 50.9 per cent of the industrial sector in 2020-21. LSM
increased by 9.3 per cent in 2020-21 as compared to a decrease of 10.1 per cent in 2019-20.
(replacing the fourth and fifth paragraphs, the table after the fifth paragraph and the sixth paragraph set out
under caption “Overview of Pakistan’s Economy – Principal Sectors of the Economy – Industrial Sector” on
page 149 of the Offering Circular)
However, during the July 2020 to April 2021 period, LSM grew by 12.8 per cent as compared the July 2019
to March 2020 period, in large part due to various measures taken by the Government to support the industrial
sector. Such measures include the special package for the construction sector and subsidy for the Naya Pakistan
Housing Scheme, electricity tariff reduction for industrial customers, relaxation of excise duties on textile
items, additional support for exporters and investors announced by the SBP and certain exemptions from
custom duties.
The following table sets out the growth of major LSM sectors during the July 2020 to April 2021 period
compared to the July 2019 to April 2020 period.

46
Manufacturing Sector Weight July 2019 to April 2020 July 2020 to April 2021
(% growth)
Textiles 20.9 (8.7) 13.15
Food, beverages and tobacco 12.4 (3.42) 11.46
Coke and petroleum products 5.5 (21.17) 17.52
Pharmaceuticals 3.6 (5.29) 11.83
Chemicals 1.7 6.93 17.87
Non-metallic mineral products 5.4 (0.28) 24.60
Automobiles 4.6 (42.95) 37.89
Iron and steel products 5.4 (15.68) 12.16
Fertilisers 4.4 5.84 6.33
Electronics 2.0 (22.53) (12.90)
Leather products 0.9 (1.44) (33.33)
Paper and board 2.3 2.53 1.92
Engineering products 0.4 (13.45) (20.61)
Rubber products 0.3 4.39 (13.08)
Wood products 0.6 (31.12) (41.34)
Source: Pakistan Bureau of Statistics
The textiles sector is the most important manufacturing sector of Pakistan and has the longest production chain,
with inherent potential for value addition at each stage of processing. The sector contributes nearly one-fourth
of industrial value-added and provides employment to about 40 per cent of industrial labour force. Barring
seasonal and cyclical fluctuations, textiles products have maintained an average share of approximately 60 per
cent in national exports.
(replacing ninth paragraph set out under caption “Overview of Pakistan’s Economy – Principal Sectors of
the Economy – Industrial Sector” on page 150 of the Offering Circular)
Since 1 January 2014, all of the products of interest to Pakistan for export purposes have duty free access to
all member states of the EU. This duty free access for many products is available under the EU's "Special
Incentive Arrangement for Good Governance and Sustainable Development", which is also popularly known
as GSP+. Because of GSP+, Pakistan has access to the EU market which is similar to what Bangladesh,
Vietnam and Turkey have and is better than market access India and China have. Pakistan’s exports to EU
increased by 4 per cent to US$4,548.8 million during the July 2020 to February 2021 period.
(replacing twelfth paragraph set out under caption “Overview of Pakistan’s Economy – Principal Sectors of
the Economy – Industrial Sector” on page 150 of the Offering Circular)
In the July 2020 to April 2021 period, the output of the textile sector increased by 13.2 per cent as compared
to a decrease of 8.7 per cent in the same period of 2019-2020.
Energy in Pakistan (replacing the third paragraph and the table after the third paragraph and adding a new
paragraph after such table set out under caption “Overview of Pakistan’s Economy – Principal Sectors of the
Economy – Energy in Pakistan” on pages 150 and 151 of the Offering Circular)
The following table sets forth Pakistan's installed capacity, dependable capacity and peak supply of energy for
the years stated:

47
2016 2017 2018 2019 2020
(MW)
Installed capacity 22,480 29,714 33,836 36,066 36,116
Dependable capacity(1) 21,862 24,798 29,424 32,767 32,246
Peak supply 17,261 19,070 20,795 22,696 23,034
(1) Dependable capacity refers to Pakistan's energy system's ability to carry power for the time-intervals and periods required. Dependable capacity is
determined on the basis of capability, operating power and the portion of the load to be supplied, less normal energy station loads.
Source: National Power Construction Corporation, Ministry of Energy
As of 30 April 2021, Pakistan's installed capacity reached 37,261 MW.

48
BALANCE OF PAYMENTS AND FOREIGN TRADE
Balance of Payments (replacing the fifth paragraph with the following text set out under caption “Balance
of Payments and Foreign Trade – Balance of Payments” on pages 156 and 157 of the Offering Circular)
Pakistan's current account deficit decreased to 4.8 per cent of GDP in 2018-19 and further decreased to 1.7 per
cent in 2019-20. Lower imports of goods and higher remittances contributed to the narrower deficit. Imports
of goods decreased by 6.8 per cent in 2018-19 as compared to 2017-18 to U.S.$51.9 billion, largely due to the
impact of policy measures ranging from exchange rate depreciation and policy rate hikes to higher import
duties on non-essential items, while workers' remittances increased by 9.2 per cent to U.S.$21.7 billion. In
2019-20, imports declined by a further 15.9 per cent to U.S.$43.6 billion as a result of the continuation of
stabilisation measures and COVID-19-related reduction in demand, while workers' remittances increased by
6.4 per cent to U.S.$23.1 billion. The largely positive dynamics in the current account has not been supported
by higher exports of goods, the value of which decreased by 2.1 per cent in 2018-19 as compared to 2017-18.
Exports of goods declined by a further 7.1 per cent in 2019-20 as compared to 2018-19.
During the July 2020 to May 2021 period, the current account posted a surplus of U.S.$153 million (0.1 per
cent of GDP) against a deficit of U.S.$ 4,328 million in the same period of the previous fiscal year (1.8 per
cent of GDP). The main driver of improvement in the current account balance was the robust growth in
remittances. Even during the global economic crisis due to the COVID-19 pandemic, the inflows accelerated
posting a year-on-year growth of 29.4 per cent during the July 2020 to May 2021 period as compared to the
same period in the previous fiscal year.
Concurrently, the primary income account also provided a cushion to improve the current account balance.
The lower interest payments and deferment of debt repayment (both interest and principal) under G-20 Debt
Service Suspension Initiative (DSSI) have contributed to improve the balance of primary income as the deficit
declined from U.S.$4.8 billion in the July 2019 to May 2020 period to U.S.$4.3 billion during the July 2020
to May 2021 period.
The services trade deficit shrank by 50.6 per cent mainly because of strong demand of telecommunications
services amidst lockdown and air travel restrictions. On the contrary, trade deficit in goods widened owing to
escalating imports of capital goods and industrial raw materials, as the economy recovered from the effects of
coronavirus lockdown in the March to May 2020 period and a rise in international commodity prices.
Meanwhile, import of agricultural commodities like sugar, wheat and cotton, due to shortage in production, is
another major contributor in widening of the trade deficit from U.S.$19.1 billion in the July 2019 to May 2020
period to U.S.$24.1 billion in the July 2020 to May 2021 period, which increased the deficit by 26.2 per cent.
Pakistan's total liquid foreign exchange reserves were adversely affected by the significant current account
deficit in recent years and decreased to U.S.$14.5 billion (of which net reserves with the SBP accounted for
U.S.$7.3 billion) as at 30 June 2019. However, with the significant reduction in the current account deficit,
Pakistan's total liquid foreign exchange reserves increased to U.S.$18.9 billion (of which net reserves with the
SBP accounted for U.S.$12.1 billion) as at 30 June 2020 and U.S.$23.3 billion (of which net reserves with the
SBP accounted for U.S.$16.1 billion) as at 18 June 2021.
(replacing the sixth paragraph and the table after the sixth paragraph set out under caption “Balance of
Payments and Foreign Trade – Balance of Payments” on page 157 of the Offering Circular)
The following table sets out information in relation to Pakistan's balance of payments for the periods stated:
2015-16 2016-17 2017-18 2018-19 2019-20
July –
May
2019-20
July -
May
2020-21(1)
(U.S.$ million)
Balance on trade in goods (19,146) (25,998) (30,903) (27,612) (21,109) (19,122) (24,136)
Exports of goods 21,972 22,003 24,768 24,257 22,536 20,963 23,126

49
2015-16 2016-17 2017-18 2018-19 2019-20
July –
May
2019-20
July -
May
2020-21(1)
(U.S.$ million)
Imports of goods 41,118 48,001 55,671 51,869 43,645 40,085 47,262
Balance of trade in services (3,546) (4,661) (6,426) (4,970) (3,316) (3,049) (1,507)
Exports of services 5,456 5,915 5,851 5,966 5,437 5,060 5,385
Imports of services 9,002 10,576 12,277 10,936 8,753 8,109 6,892
Balance on primary income (5,345) (5,014) (5,437) (5,610) (5,459) (4,831) (4,349)
Balance secondary income 23,076 23,403 23,571 24,758 25,435 22,674 30,145
of which workers'
remittances 19,917 19,351 19,914 21,740 23,131 20,658 26,737
Current account balance (4,961) (12,270) (19,195) (13,434) (4,449) (4,328) 153
Capital account balance 273 375 376 229 285 256 213
Financial account (6,878) (9,855) (13,611) (11,759) (9,313) (6,884) (4,658)
Direct investment (net) (2,374) (2,320) (2,772) (1,436) (2,652) (2,481) (1,695)
Direct investment in
Pakistan 2,393 2,406 2,782 1,362 2,598 2,423 1,752
Portfolio investment (net) 429 250 (2,257) 1,274 409 414 (2,203)
Portfolio investment in
Pakistan (329) (251) 2,209 (1,418) (524) (529) 2,175
Net acquisition of financial
assets 96 1,180 273 (67) (127) 44 681
Net incurrence of liabilities 5,029 8,965 8,855 11,530 6,935 4,853 1,443
Net errors and omissions 462.2 94 (933) (58) 150 633 (1,089)
Reserves and related items 2,652 (1,946) (6,141) (1,504) 5,299 3,445 3,935
(1) Provisional
Source: State Bank of Pakistan
(replacing the seventh paragraph and the table after the seventh paragraph set out under caption “Balance of
Payments and Foreign Trade – Balance of Payments” on page 157 of the Offering Circular)
The following table sets out the components of balance of payments (as per cent of GDP) for the periods stated:
2015-16 2016-17 2017-18 2018-19(1)
2019-20(2) July - May
2020-21(3)
(% of GDP)
Exports 7.9 7.2 7.9 8.7 8.7 8.5
Imports 14.7 15.7 17.7 18.5 16.6 17.3
Trade balance (6.9) (8.5) (9.8) (9.9) (8.0) (8.9)
Worker's remittances 7.1 6.4 6.3 7.8 8.8 9.8
Current account balance (1.8) (4.0) (6.1) (4.8) (1.7) 0.1
(1) Final
(2) Revised
(3) Provisional
Sources: Pakistan Economic Survey 2020-21

50
Exports (replacing the first paragraph set out under caption “Balance of Payments and Foreign Trade –
Exports and Imports -- Exports” on page 159 of the Offering Circular)
Merchandise exports totalled U.S.$22.5 billion in 2019-20, which is a 7.1 per cent decrease from U.S.$24.3
billion in 2018-19. A slowdown in global economic growth due to COVID-19 as well as spill overs from U.S.-
China trade tensions were largely responsible for this decrease in exports. Merchandise exports increased
significantly by U.S.$2.2 billion (10.3 per cent) during the July 2020 to May 2021 period as compared to the
July 2019 to May 2020 period.
(replacing the third paragraph and the table after the third paragraph set out under caption “Balance of
Payments and Foreign Trade – Exports and Imports -- Exports” on page 159 of the Offering Circular)
The following table sets out details of the composition of Pakistan's exports for the periods stated. Total exports
in this table are based on data compiled by State Bank of Pakistan that differs from exports data compiled by
the Pakistan Bureau of Statistics using customs records.
2015-16 2016-17 2017-18 2018-19 2019-20
July-May
2019-20
July-May
2020-21(1)
%
Change
2019-20/
2018-19
Absolute
Change
2019-20/
2018-19
(U.S.$
million)
% Share
2019-20
%
Change
July-May
2020-21
over
July-May
2019-20
(U.S.$ million)
Food group 3,722 3,618 4,818 4,648 4,539 4,150 4,105 (2.3) (109) 18.3 (1.1)
Textile group 12,756 12,457 13,377 13,581 12,799 11,801 12,950 (5.8) (782) 57.3 9.7
Petroleum group 450 411 575 676 369 346 209 (45.4) (307) 1.0 (39.5)
Other manufactures 3,805 3,659 4,134 3,822 3,522 3,265 3,437 (7.8) (299) 15.4 6.4
All other items 1,084 1,219 1,392 1,304 1,312 1,205 1,815 1.3 8 7.9 50.6
Total 21,972 22,003 24,768 24,030 22,541 20,963 23,125 (6.2) (1,489) 100.0 10.3
(1) Provisional
Source: State Bank of Pakistan
(replacing the fourth paragraph and the table after the fourth paragraph set out under caption “Balance of
Payments and Foreign Trade – Exports and Imports -- Exports” on page 159 of the Offering Circular)
The following table sets out details of the principal destinations of Pakistan's exports for the periods stated:
Country 2015-16 2016-17 2017-18 2018-19 2019-20 July-May
2019-20
July-May
2020-21(1)
(U.S.$ billion)
U.S. 3.7 3.7 3.9 4.0 3.9 3.6 4.5
United Kingdom 1.6 1.6 1.8 1.8 1.6 1.5 1.9
China 1.9 1.6 1.8 1.9 1.7 1.5 1.8
Germany 1.2 1.2 1.4 1.3 1.3 1.2 1.4
United Arab Emirates 1.1 1.1 1.4 1.4 1.6 1.5 1.3
Netherlands 0.6 0.6 0.8 0.9 1.0 0.9 1.0
Afghanistan 1.2 1.1 1.5 1.2 0.9 0.8 0.9
Spain 0.8 0.8 0.9 0.9 0.9 0.8 0.7
Italy 0.6 0.7 0.8 0.8 0.8 0.7 0.7
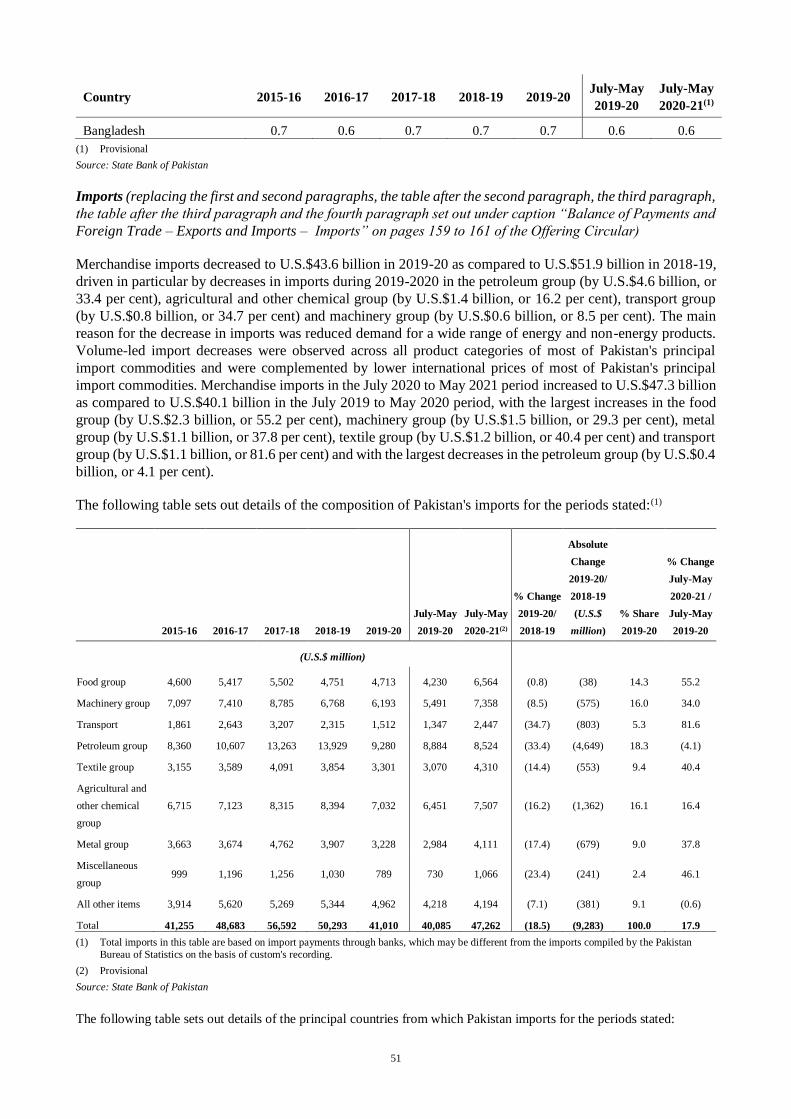
51
Country 2015-16 2016-17 2017-18 2018-19 2019-20 July-May
2019-20
July-May
2020-21(1)
Bangladesh 0.7 0.6 0.7 0.7 0.7 0.6 0.6
(1) Provisional
Source: State Bank of Pakistan
Imports (replacing the first and second paragraphs, the table after the second paragraph, the third paragraph,
the table after the third paragraph and the fourth paragraph set out under caption “Balance of Payments and
Foreign Trade – Exports and Imports – Imports” on pages 159 to 161 of the Offering Circular)
Merchandise imports decreased to U.S.$43.6 billion in 2019-20 as compared to U.S.$51.9 billion in 2018-19,
driven in particular by decreases in imports during 2019-2020 in the petroleum group (by U.S.$4.6 billion, or
33.4 per cent), agricultural and other chemical group (by U.S.$1.4 billion, or 16.2 per cent), transport group
(by U.S.$0.8 billion, or 34.7 per cent) and machinery group (by U.S.$0.6 billion, or 8.5 per cent). The main
reason for the decrease in imports was reduced demand for a wide range of energy and non-energy products.
Volume-led import decreases were observed across all product categories of most of Pakistan's principal
import commodities and were complemented by lower international prices of most of Pakistan's principal
import commodities. Merchandise imports in the July 2020 to May 2021 period increased to U.S.$47.3 billion
as compared to U.S.$40.1 billion in the July 2019 to May 2020 period, with the largest increases in the food
group (by U.S.$2.3 billion, or 55.2 per cent), machinery group (by U.S.$1.5 billion, or 29.3 per cent), metal
group (by U.S.$1.1 billion, or 37.8 per cent), textile group (by U.S.$1.2 billion, or 40.4 per cent) and transport
group (by U.S.$1.1 billion, or 81.6 per cent) and with the largest decreases in the petroleum group (by U.S.$0.4
billion, or 4.1 per cent).
The following table sets out details of the composition of Pakistan's imports for the periods stated:(1)
2015-16 2016-17 2017-18 2018-19 2019-20
July-May
2019-20
July-May
2020-21(2)
% Change
2019-20/
2018-19
Absolute
Change
2019-20/
2018-19
(U.S.$
million)
% Share
2019-20
% Change
July-May
2020-21 /
July-May
2019-20
(U.S.$ million)
Food group 4,600 5,417 5,502 4,751 4,713 4,230 6,564 (0.8) (38) 14.3 55.2
Machinery group 7,097 7,410 8,785 6,768 6,193 5,491 7,358 (8.5) (575) 16.0 34.0
Transport 1,861 2,643 3,207 2,315 1,512 1,347 2,447 (34.7) (803) 5.3 81.6
Petroleum group 8,360 10,607 13,263 13,929 9,280 8,884 8,524 (33.4) (4,649) 18.3 (4.1)
Textile group 3,155 3,589 4,091 3,854 3,301 3,070 4,310 (14.4) (553) 9.4 40.4
Agricultural and
other chemical
group
6,715 7,123 8,315 8,394 7,032 6,451 7,507 (16.2) (1,362) 16.1 16.4
Metal group 3,663 3,674 4,762 3,907 3,228 2,984 4,111 (17.4) (679) 9.0 37.8
Miscellaneous
group 999 1,196 1,256 1,030 789 730 1,066 (23.4) (241) 2.4 46.1
All other items 3,914 5,620 5,269 5,344 4,962 4,218 4,194 (7.1) (381) 9.1 (0.6)
Total 41,255 48,683 56,592 50,293 41,010 40,085 47,262 (18.5) (9,283) 100.0 17.9
(1) Total imports in this table are based on import payments through banks, which may be different from the imports compiled by the Pakistan
Bureau of Statistics on the basis of custom's recording.
(2) Provisional
Source: State Bank of Pakistan
The following table sets out details of the principal countries from which Pakistan imports for the periods stated:

52
Country 2015-16 2016-17 2017-18 2018-19 2019-20
July-May
2019-20
July-May
2020-21(1)
(U.S.$ billion)
China 8.8 10.1 11.5 10.2 9.6 8.2 11.5
United Arab Emirates 6.1 7.2 8.9 8.9 6.4 6.0 6.2
Singapore 3.0 4.1 4.5 3.3 2.4 2.1 2.8
U.S. 1.5 2.1 2.1 2.1 2.3 2.0 2.2
Saudi Arabia 2.1 2.4 3.1 3.0 1.3 1.3 2.1
Japan 1.4 1.7 1.9 1.5 1.0 1.0 1.4
Kuwait 1.2 1.1 1.1 1.2 1.0 1.0 1.2
Indonesia 1.2 1.0 1.1 1.1 1.0 1.0 1.1
India 1.8 1.7 1.8 1.6 0.4 0.4 0.2
(1) Provisional
Source: State Bank of Pakistan
The Office of Foreign Assets Control of the U.S. Department of Treasury (OFAC) administers regulations
that restrict the ability of U.S. persons to invest in, or otherwise engage in business with, certain countries,
including Iran, and specially designated nationals (together Sanction Targets). Pakistan exports to Iran food,
medical instruments and other items that are exempt from trade sanctions. The volume of Pakistan's trade with
Iran came down from U.S.$1,169 million in 2009-10 to U.S.$103 thousand in 2019-20 (with exports of
U.S.$55 thousand and imports of U.S.$48 thousand) and U.S.$261 thousand in the July 2020 to May 2021
period (with exports of U.S.$261 thousand and imports of U.S.$0 thousand).
Workers' Remittances (replacing the second paragraph set out under caption “Balance of Payments and
Foreign Trade – Workers’ Remittances” on page 161 of the Offering Circular)
The establishment of the PRI has contributed positively to the flow of workers' remittances to Pakistan, which
grew by 106.5 per cent from 2010-11 to 2019-20. In 2019-20, workers' remittances increased by 6.4 per cent
as compared to 2018-19 to US$23.1 billion. In the period July to May 2021, workers' remittances have
increased by 29.4 per cent as compared to the period July to May 2020.
(replacing the fourth, fifth and sixth paragraphs and the table after the sixth paragraph set out under caption
“Balance of Payments and Foreign Trade – Workers’ Remittances” on pages 161 and 162 of the Offering
Circular)
To further improve international workers' remittances, the Pakistan Post has partnered with the National Bank
to join the PRI for the delivery of international remittances through post offices. Under PRI, the overseas
workers will send their remittances free of service charges. Pakistan Post has started making payments through
its postal counters.
The SBP and PRI have conducted various awareness sessions related to home remittances in collaboration
with Ministry of Foreign Affairs/Pakistan Mission Abroad for the promotion of home remittances through
legal channels.
Information on total workers' remittances and in workers' remittances from certain countries and regions is
summarised in the table below:
2015-16 2016-17 2017-18 2018-19 2019-20 July-May
2019-20
July-May
2020-21(1)
(U.S.$ billion)
Total 19.9 19.4 19.9 21.7 23.1 20.7 26.7

53
2015-16 2016-17 2017-18 2018-19 2019-20 July-May
2019-20
July-May
2020-21(1)
(U.S.$ billion)
USA 2.5 2.5 2.8 3.3 1.7 1.6 2.5
UK 2.6 2.3 2.9 3.4 2.6 2.2 3.7
Saudi Arabia 6 5.5 4.9 5.0 6.6 5.9 7.0
U.A.E. 4.4 4.3 4.4 4.6 5.6 5.1 5.6
Other GCC Countries 2.4 2.3 2.2 2.1 2.9 2.6 3.0
EU Countries 0.4 0.5 0.7 0.6 1.8 1.6 2.4
All Other Countries 1.6 2 2.1 2.7 1.9 1.7 2.5
(1) Provisional
Source: State Bank of Pakistan
Foreign Direct Investment (replacing the third paragraph set out under caption “Balance of Payments and
Foreign Trade – Foreign Direct Investment” on page 162 of the Offering Circular)
Foreign private investment amounted to U.S.$2.3 billion in 2019-20 as compared to U.S.$0.9 billion in 2018-
19. Foreign direct private investment increased significantly in 2019-20 to U.S.$2.6 billion as compared to
U.S.$1.4 billion in 2018-19. In the July 2020 to May 2021 period, foreign direct investment amounted to
U.S.$1.8 billion as compared to U.S.$2.4 billion in the same period in 2019-20.
(adding a new paragraph after the fourth paragraph set out under caption “Balance of Payments and Foreign
Trade – Foreign Direct Investment” on page 162 of the Offering Circular)
In the July 2020 to May 2021 period, U.S.$728.2 million, or 41.6 per cent, of net foreign direct investment
inflows were from China, with the balance coming principally from Hong Kong (U.S.$138.1 million), the UK
(U.S.$130.5 million), the Netherlands (U.S.$116.0 million), and the United States (U.S.$105.7 million). Major
recipient sectors of foreign direct investment in 2019-20 included power, financial businesses, oil and gas
exploration and electrical trade. Insofar as net foreign private portfolio investment is concerned, it experienced
an outflow of U.S.$285.0 million in the July 2020 to May 2021 period as compared to an outflow of U.S.$238.5
million in the July 2019 to May 2020 period.
(replacing the fifth paragraph and the table after the fifth paragraph set out under caption “Balance of
Payments and Foreign Trade – Foreign Direct Investment” on pages 162 and 163 of the Offering Circular)
The following table summarises the net inflow of foreign investment in Pakistan for the periods stated:
2015-16 2016-17 2017-18 2018-19 2019-20
July-May
2019-20
July-May
2020-21(1)
(U.S.$ million)
Foreign private investment 2,073.2 1,893.8 2,539.6 947.2 2,315.8 2,184.2 1,466.7
Direct investment 2,392.9 2,406.6 2,780.3 1,362.4 2,597.5 2,422.7 1,751.7
Inflow 3,256.3 3,110.8 3,494.5 2,785.2 3,322.1 3,096.4 2,768.9
Outflow 863.4 704.2 714.2 1,422.8 724.6 673.7 1,017.2
Portfolio Investment (319.7) (512.8) (240.7) (415.2) (281.7) (238.5) (285.0)
Equity securities (319.7) (512.8) (240.7) (415.2) (281.7) (238.5) (285.0)
Debt securities - - - - - - -
Convertible bonds of Pace
Pakistan - - - - - - -
International bonds of PMCL - - - - - - -

54
Foreign public investment (8.8) 262.1 2,450.5 (1,002.0) (241.3) (289.3) 2,457.9
Portfolio investment (8.8) 262.1 2,450.5 (1,002.0) (241.3) (289.3) 2,457.9
Equity securities - - - - - - -
Debt securities(2) (8.8) 262.1 2,450.5 (1,002.0) (241.3) (289.3) 2,457.9
Total 2,064.4 2,155.9 4,990.0 (54.8) 2,074.5 1,894.9 3,924.6
(1) Provisional
(2) Net sale or purchase of special U.S. dollar denominated bonds, Eurobonds, Foreign Exchange Bearer Notes, Dollar Bearer Notes, Treasury Bills
and Pakistan Investment Bonds
Source: State Bank of Pakistan
Foreign Reserves (replacing the first paragraph set out under caption “Balance of Payments and Foreign
Trade – Foreign Reserves” on page 163 of the Offering Circular)
Principally due to the widening of the current account deficit and insufficient financial inflows, Pakistan's
liquid foreign exchange reserves decreased to U.S.$14.5 billion as at 30 June 2019 from U.S.$16.4 billion as
at 30 June 2018, U.S.$21.4 billion as at 30 June 2017 and U.S.$23.1 billion as at 30 June 2016. However, as
a result of recent stabilisation measures and support under the IMF EFF programme, Pakistan's liquid foreign
exchange reserves increased to U.S.$18.9 billion as at 30 June 2020 and U.S.$23.3 billion as at 18 June 2021.
Inflation (replacing the second paragraph set out under caption “Balance of Payments and Foreign Trade –
Inflation, Money and Monetary Policy -- Inflation” on page 163 of the Offering Circular)
However, principally due to the recovery in global commodity prices, significant depreciation of the Rupee
and upward adjustment in power tariffs, average CPI increased to 6.8 per cent in 2018-19 and to 10.7 per cent
in 2019-20 (in each case using base year 2015-16). Inflation decreased to 8.9 per cent in 2020-21.
(replacing the fourth paragraph and the table after the fourth paragraph set out under caption “Balance of
Payments and Foreign Trade – Inflation, Money and Monetary Policy -- Inflation” on pages 163 and 164 of
the Offering Circular)
The following table sets out headline and core inflation for the periods stated:
2015-16 2016-17 2017-18 2018-19 2019-20 July-May
2020-21(1)
Indices
General 203.82 212.29 220.62 236.81 263.15 140.99
Food 224.78 233.37 237.59 248.44 283.54 NA
Non-food 191.25 199.65 210.45 229.84 250.93 NA
Core(2) 190.71 200.61 212.34 229.53 247.55 NA
Annual Inflation
General 2.9 4.2 3.9 7.3 11.1 8.83
Food 2.1 3.8 1.8 4.6 14.1 NA
Non-food 3.4 4.4 5.4 9.2 9.2 NA
Core(2) 4.2 5.2 5.9 7.9 7.8 NA
(1) Provisional
(2) Core inflation is defined as overall inflation adjusted for food and energy. The base year is 2007-08 for 2014-15 to 2019-2020 whereas inflation
numbers for the July 2020 to April 2021 period are calculated as per the new base (National CPI - 2015-16).
Source: Pakistan Bureau of Statistics, Pakistan Economic Survey 2020-21

55
Money and Monetary Policy (replacing the second and third paragraphs and the table after the third
paragraph set out under caption “Balance of Payments and Foreign Trade – Inflation, Money and Monetary
Policy – Money and Monetary Policy” on pages 164 and 165 of the Offering Circular)
After raising the key policy rate by 100 basis points in early 2019-20 and maintaining status quo for several
months until March 2020, the Monetary Policy Committee cut the key policy rate by a cumulative 625 basis
points from 17 March 2020 to 25 June 2020 to counter the contractionary impact of COVID-19 on the
economy. Consequently, this substantial monetary easing helped increase demand for private sector credit,
which grew by Rupees 505.7 billion during the 1 July 2020 to 31 May 2021 period. This, along with net
budgetary borrowing from banks and continued expansion in net foreign assets owing to country's improved
external position, led to an expansion in M2 by Rupees 1,936.0 billion during the 1 July 2020 to 31 May 2021
period.
The following table provides an overview of components of monetary assets as at 30 June for the periods
stated and as at 31 May 2021:
2015-16 2016-17 2017-18 2018-19 2019-20(1) May
2021(1)
Stocks (Rupees billion)
1. Currency issued 3,563.7 4,176.9 4,644.9 5,294.8 6,468.7 7,3.3
2. Currency held by SBP 0.6 1.0 1.2 1.2 1.2 0.5
3. Currency in tills of
Scheduled Banks 229.3 264.6 255.9 343.5 325.5
470.2
4. Currency circulation
(1-2-3) 3,333.8 3,911.3 4,387.8 4,950.0 6,142.0
6,906.1
5. Other deposits with
SBP 18.8 22.7 27.0 33.6 41.2
64.1
6. Scheduled banks' total
deposits(2) 9,472.3 10,646.9 11,582.4 12,814.8 14,724.8
15,873.8
7. Resident foreign
currency deposits
(RFCD)
587.3 655.3 829.4 1,109.8 1,074.5
1,023.8
8. Monetary assets
(4+5+6) 12,824.9 14,580.9 15,997.2 17,798.5 20,908.0
22,844.0
9. Growth rate (%) 13.7 13.7 9.7 11.3 17.5 9.3
1. Currency/money ratio 26 26.8 27.4 27.8 29.4 30.2
2. Demand
deposits/money ratio 63.9 64.3 63 62.8 60.6
61.2
3. Time deposits/money
ratio 5.4 4.2 4.2 3 4.7
3.8
4. Other deposits/money
ratio 0.1 0.2 0.2 0.2 0.2
0.3
5. RFCD/money ratio 4.6 4.5 5.2 6.2 5.1 4.5
6. Income velocity(3) 2.4 2.3 2.3 2.3 2.2 -
(1) Provisional
(2) Excluding inter-bank deposits and deposits of federal and provincial governments, foreign constituents and international organisations
(3) Income velocity of money is calculated as GDP at current market prices divided by quarterly average of monetary assets (M2).
Source: State Bank of Pakistan

56
Exchange Rates (replacing the fifth and sixth paragraphs and the table after the sixth paragraph set out under
caption “Balance of Payments and Foreign Trade – Exchange Rates” on pages 165 and 166 of the Offering
Circular)
The Rupee depreciated against the U.S. dollar by 4.8 per cent in 2019-20. During the 1 July to 31 May 2021
period, the Rupee has appreciated against U.S. dollar by 8.8 per cent.
The following table sets out the average exchange rates between the Rupee and the currencies of Pakistan's
principal trading partners:
Country Currency 2015-16 2016-17 2017-18 2018-19 2019-20 Jul-20 –
May-21
Australia Dollar 76.0249 79.0809 85.2462 97.3543 106.2858 119.5789
Bangladesh Taka 1.3347 1.3171 1.3289 1.6192 1.8666 1.8948
Canada Dollar 78.7672 78.9813 86.6132 102.883 118.0313 124.5799
China Yuan 16.1967 15.3812 16.9236 19.9742 22.5127 24.1928
Hong Kong Dollar 13.4517 13.4970 14.0535 17.3807 20.3048 20.7174
India Rupee 1.5731 1.5775 1.6892 1.9315 2.1861 2.1795
Japan Yen 0.8981 0.9610 0.9976 1.2269 1.4638 1.5150
Kuwait Dinar 345.3067 344.9283 364.8187 448.7933 517.6728 527.9523
Malaysia Ringgit 25.2657 24.4449 27.0628 33.0171 37.6417 38.9549
Norway Krone 12.4177 12.4579 13.7632 16.0658 16.9660 18.2620
Singapore Dollar 75.1182 75.2259 81.9931 99.8234 114.4476 119.1763
Sri Lanka LKR 0.7343 0.7018 0.7102 0.7853 0.8672 0.8477
Sweden Krona 12.4197 11.8763 13.2399 14.8853 16.4292 18.6970
Switzerland Franc 106.5144 105.6945 113.3216 136.9096 162.0581 176.5008
Saudi
Arabia Riyal 27.8271 27.9436 29.3237 36.3311
42.1739 42.8368
Thailand Baht 2.9393 3.0023 3.3937 4.2299 5.1012 5.2109
UAE Dirham 28.4165 28.5340 29.9404 37.0981 43.0852 43.7417
United
Kingdom Pound 154.7033 132.8218 148.2579 176.323
199.6347 215.2240
U.S. Dollar 104.3738 104.8046 109.9713 136.2657 158.2561 160.6693
EMU Euro 115.8746 114.1654 131.3192 155.3441 175.0581 191.3743
Source: State Bank of Pakistan

57
PUBLIC FINANCE AND TAXATION
2021-22 Budget (replacing the text set out under caption “Public Finance and Taxation – Budgetary Process
– Budget” on pages 167 to 169 of the Offering Circular)
The 2021-22 budget is a growth budget and its preparation is based on a strategy to boost the economic growth
in accordance with the strategic priorities, revenue and spending policies of the Government. The following
are the main objectives of the 2021-22 budget:
striking a balance between the COVID-19 related fiscal deficit and boosting the growth of the
country’s economy;
keeping primary balance at a sustainable level;
protection of social spending under the Ehsaas programme to support the vulnerable segments of the
society;
resource mobilisation without unnecessary changes in tax structure;
successful continuation of the IMF programme;
carrying forward of the stimulus package approved in March 2020;
keeping development budget at an adequate level to stimulate economic growth, coupled with policy
support;
funding of crucial housing initiatives including Naya Pakistan Housing project to boost the
construction sector;
providing funding for special areas such as FATA, Azad Jammu & Kashmir and Gilgit Baltistan to
ensure their development;
continuing to fund several special initiatives led by the Prime Minister, including Kamyab Jawan
(youth entrepreneurship scheme), Sehat Card (providing access to healthcare for the underprivileged)
and Billion Tree Tsunami reforestation project;
austerity and rationalisation of non-productive expenditures are to be continued;
subsidy regime is to be rationalised to provide targeted subsidy to the deserving segments of the
society; and
NFC award is to be revisited. Moreover, the provinces will be asked to fulfil their funding commitment
made at the time of merger of the former FATA.
The main features of the 2021-22 budget are set out in the table below:
RESOURCES EXPENDITURE
(Rupees Billion)
Tax revenue
5,829 A. Current expenditure 7,523
Non-tax revenue 2,080 Interest payments 3,060
a. Gross revenue receipts 7,909 Pensions 480
b. Less provincial share 3,412 Defence services 1,370
Grants and transfers to provinces and
others 1,168

58
RESOURCES EXPENDITURE
(Rupees Billion)
I. Net revenue receipts (a-b) 4,497 Subsidies 682
II. Non-bank borrowing 1,241 Running of civil government 479
III. Net external receipts 1,246 Provision for contingencies and fund 25
IV. Estimated provincial surplus 570 Provision for disaster / emergency /
COVID 100
V. Bank borrowing (treasury bills, PIBs,
Sukuk) 681 Provision for pay and pension 160
VI. Privatisation proceeds 252 B. Development 964
Federal PSDP 900
Net lending 64
TOTAL RESOURCES (I to VI) 8,487 TOTAL EXPENDITURE (A+B) 8,487
Source: Budget in Brief 2020-21
The comparative position of 2020-21 (budget and revised) and 2021-22 (budget) is set out below:
Budget
2020-21
Revised
2020-21
Change between
original and
revised budgets
Budget
2021-22
(Rupees billion, except as stated
otherwise)
(%) (Rupees billion,
except as stated
otherwise)
Revenue receipt (FBR) 4,963 4,691 (5.5) 5,829
Non tax revenue 1,610 1,704 5.9 2,080
Gross revenue (FBR+NTR) 6,573 6,395 (2.7) 7,909
Less: transfer to provinces (2,874) (2,704) (5.9) (3,412)
Net revenue for federal
government 3,700 3,691 (0.2)
4,497
Expenditure 7,137 7,341 2.9 8,487
Federal budget deficit (3,437) (3,650) 6.2 (3,990)
Provincial surplus 242 242 (0.2) 570
Overall budget deficit (3,195) (3,408) 6.7 (3,420)
Overall fiscal deficit as % of
GDP (in percentages) (7.0) (7.1) 1.9 (6.3)
Primary deficit (249) (557) 125 (360)
Note:
GDP 45,567 47,709 4.7 53,867
Source: Budget in Brief 2020-21
Fiscal Position of Pakistan (replacing the text set out under caption “Public Finance and Taxation – Fiscal
Position of Pakistan” on pages 169 and 170 of the Offering Circular)
The following table summarises the consolidated federal and provincial governments’ revenues and
expenditures for 2017-18, 2018-19, 2019-20, for the July 2020 to March 2021 period and the budgeted position
for the year 2020-21:

59
2017-18 2018-19 2019-20
%
change
2018-19 /
2019-20
2020-21
(July –
March)(1)
2020-21
(Budget
Estimate)
(Rupees billion, except as stated
otherwise) (%)
(Rupees billion, except as
stated otherwise)
Total revenue (I + II) 5,228 4,901 6,272 28 4,993 7,261
I. Tax revenue 4,467 4,473 4,748 6 3,765 5,498
Federal 4,066 4,072 4,334 6 3,395 4,963
of which FBR revenue 3,842 3,829 3,997 4 3,395 4,963
Provincial 401 402 414 3 370 535
II. Non-tax revenue (federal and provincial) 761 427 1,524 257 1,228 1,763
Total expenditure (I+II) 7,488 8.346 9,648 16 6,645 10,455
I. Current expenditure 5,854 7,104 8,532 20 6,085 9,113
Federal 3,790 4,776 6,016 26 4,157 6,261
Of which: interest 1,500 2,091 2,620 25 2,104 2,946
Of which: defence 1,030 1,147 1,213 6 784 1,189
Provincial 2,065 2,328 2,516 8 1,928 2,853
II. Development expenditure and net
lending 1,622 1,219 1,204 (1) 723 1,342
PSDP 1,456 1,008 1090 8 654 1,252
Other development 128 170 65 (62) 14 70
Net lending 38 41 49 19 55 20
III. Statistical discrepancy 12 22 (87) (5) (164) -
Overall fiscal balance (2,260) (3,445) (3,376) (2) (1,652) (3,194)
As % of GDP (6.5) (9.0) (8.1) (10) (3.5) (7.0)
Financing of fiscal deficit 2,260 3,445 3,376 (2) 1,652 3,194
External sources 785 417 896 115 562 810
Domestic sources (I + II + III) 1,475 3,028 2,481 (18) 1,090 2,384
I. Bank 1,120 2,263 1,941 (14) 798 889
II. Non-bank 353 765 540 (29) 292 1,395
III. Privatisation proceeds 2 - - - 100
GDP at market price (billions of Rupees) 34,616 38,086 41,556 47,709 45,567
Source: Budget Wing, Ministry of Finance
(1) Provisional
Revenue and Expenditure (replacing the third, fourth, fifth, sixth, seventh and eighth paragraphs and the
table after the eighth paragraph set out under caption “Public Finance and Taxation – Fiscal Position of
Pakistan” on pages 170 and 171 of the Offering Circular)
Pakistan's fiscal deficit in 2018-19 amounted to 9.0 per cent of GDP. It was not only higher than fiscal deficits
in both 2017-18 and 2016-17, but also higher than the revised target for fiscal deficit of 7.2 per cent of GDP
(published in April 2019), which resulted in exceeding the targeted deficit by Rupees 686 billion. The single
biggest reason for the increase in fiscal deficit was the shortfall in Federal Board of Revenue (FBR) tax

60
revenues in the amount of Rupees 321 billion in 2018-19. This shortfall was principally driven by (i) a fall in
imports in 2018-19, which typically account for 45 per cent of total FBR tax collections in customs duties,
general sales tax and excise duties, and (ii) the decision of the Government to shield domestic consumers from
rising oil prices, which resulted in over Rupees 100 billion shortfall in general sales tax collections. On the
expenditures side, the rise in interest rates and a weaker Rupee have led to a significant increase in the
Government's debt servicing costs. Expenditure overruns were also necessitated by the need to expand social
safety nets and higher investment spending under the PSDP. If the Government had decided to curtail these
expenditures further, it could have led to further slowdown in GDP growth and caused a hard landing for the
economy already undergoing major monetary and exchange rate adjustments.
The Government rolled out a number of tax and administrative measures in the budget for 2019-20 to enhance
revenue mobilisation. These included reversal of earlier tax exemptions to certain sectors, increasing income
tax rates and upward revision in sales tax and federal excise duty rates on selected items. On the administrative
front, e-filing and refund systems were improved to help businesses and other taxpayers and promote the filing
culture. Prior to the COVID-19 pandemic, Pakistan’s economy was transitioning from stabilisation to growth
as a result of series of policy measures introduced in 2018-19. These measures addressed the economic
imbalances and paved the way for better economic outcomes in 2019-20. In particular, the fiscal sector
witnessed a considerable improvement during the first three quarters of 2019-20 on account of various policy
interventions to improve the revenues and prudent expenditure management. However, the downturn in
economic activity and higher COVID-19-related expenditures made fiscal management difficult in the last
quarter of 2019-20. Despite significant challenges, better fiscal performance in early 2019-20 enabled the
Government to withstand the pandemic shock and helped in containing the overall fiscal deficit to 8.1 per cent
of GDP in 2019-20, down from 9.0 per cent in 2018-19. Similarly, the primary balance posted a deficit of 1.8
per cent of GDP during 2019-20 against the deficit of 3.6 per cent of GDP in 2018-19.
The total revenue increased by 15.1 per cent of GDP in 2019-20 surpassing its revised target of 14.3 percent
of GDP for the year. In terms of growth, it grew by 28.0 per cent in 2019-20 against the negative growth of
6.3 per cent recorded in the preceding year. The increase in revenues in 2019-20 is largely attributed to (i) a
sharp rise in non-tax revenue, which grew by 256.7 per cent during 2019-20 as a result of a sharp rise in the
SBP profit and in Pakistan Telecommunication Authority profit and mark-up payments by the public sector
enterprises, and (ii) modest growth in tax collection.
On the expenditures side, prior to COVID-19, steps to strengthen fiscal discipline assisted the Government in
accumulating much-needed funds for social and development spending. However, additional spending
requirements for economic revival, health and social relief built significant pressure on the public finances and
triggered increase in the total spending. In 2019-20, total expenditure grew by 15.6 per cent to Rupees 9,648.5
billion (23.2 per cent of GDP) against Rupees 8,345.6 billion (21.9 per cent of GDP) in 2018-19.
The share of current expenditures accounted for 88.4 per cent of overall expenditure, compared to 85.1 per
cent share in 2018-19. Current expenditure grew by 20.1 per cent in 2019-20. However, it remained below the
growth of 21.3 per cent recorded in 2018-19. In absolute terms, current expenditure stood at Rupees 8,532.0
billion (20.5 per cent of GDP) during 2019-20 as compared to Rupees 7,104.0 billion (18.7 per cent of GDP)
in 2018-19. The bulk of the increase in current expenditure in 2019-20 was due to higher mark-up payments,
which grew by 25.3 per cent to Rupees 2,619.7 billion from Rupees 2,091.1 billion in 2018-19.The rise in
mark-up payments was driven by higher servicing on domestic debt due to a higher level of interest rates.
During 2019-20, the contribution of mark-up payments in total and current expenditure increased to 27.2 and
30.7 per cent from 25.1 and 29.4 per cent, respectively, in 2018-19.
Defence expenditure grew by 5.8 per cent to Rupees 1,213.3 billion in 2019-20 (2.9 per cent of GDP) as
compared to Rupees 1,146.8 billion (3.0 per cent of GDP) in the preceding year. Its contribution in total and
current expenditure has reduced from 13.7 and 16.1 per cent in 2018-19 to 12.6 and 14.2 per cent, respectively,
during 2019-20.
COVID-19-related spending accounted for most of the increase in subsidies and grants in 2019-20. Within
subsidies, power, food and agriculture sectors made a significant contribution. In addition, a subsidy to the
LNG industry for providing lower-cost gas to the industry further added to the overall increase. Thus, the rise

61
in subsidies has been realised both in terms of growth and its contribution to current expenditure. In absolute
terms, subsidies increased to Rupees 359.9 billion during 2019-20 against Rupees 195.3 billion in 2018-19,
posting a growth of 84.3 per cent. Similarly, their contribution within current expenditure grew by 4.2 per cent
in 2019-20 as compared to the share of 2.7 per cent in 2018-19.
The Government expanded the cash transfer program in response to COVID-19 in the last quarter of 2019-20,
particularly to the BISP under Ehsaas. Thus, the grants to others witnessed a noticeable increase owing to
social protection spending. In addition, other major contributing factors are grants for contingent liabilities,
railways, Azad Jammu and Kashmir, Gilgit Baltistan and encashment of sales tax and income tax refunds.
Development expenditure and net lending decreased by 1.3 per cent during 2019-20 and stood at Rupees
1,203.7 billion against Rupees 1,219.2 billion in 2018-19. Similarly, development expenditure (excluding net
lending) decreased to Rupees 1,155.2 billion during 2019-20 from Rupees 1,178.4 billion in 2018-19, thus
registering a decrease of 2.0 per cent. The decline in development expenditure is largely stemmed from a
reduction in federal PSDP spending and other development expenditure. Total PSDP expenditure grew by 8.1
per cent to Rupees 1,089.7 billion in 2019-20 against Rupees 1,008.2 billion in 2018-19. The growth in PSDP
during the year has been realised on account of 22.9 per cent growth in provincial PSDP. Within total PSDP,
federal PSDP (excluding development grants to provinces) stood at Rupees 467.7 billion, while provincial
PSDP amounted to Rupees 622.0 billion in 2019-20 against Rupees 502.1 billion and Rupees 506.2 billion,
respectively, in 2018-19.
During the July 2020 to March 2021 period, the fiscal deficit was contained at 3.5 per cent of GDP as compared
to 4.1 per cent of GDP in the comparable period of 2019-20. Similarly, the primary balance posted a surplus
of Rupees 451.8 billion (0.9 per cent of GDP) in the July 2020 to March 2021 period, a considerable increase
from the surplus of Rupees 193.5 billion (0.5 per cent of GDP) in the July 2019 to March 2020 period.
During the July 2020 to March 2021 period, total revenue grew by 6.5 per cent against the growth of 30.9 per
cent in the same period of the previous fiscal year. In absolute terms, total revenue increased to Rupees 4,992.6
billion during the July 2020 to March 2021 period from Rupees 4,689.9 billion in the same period of 2019-20
principally due to double-digit growth in tax revenue, which was partially offset by the decrease in non-tax
revenues.
Total tax revenue (federal and provincial) grew by 11.9 per cent during the July 2020 to March 2021 period
and amounted to Rupees 3,765.0 billion against Rupees 3,365.5 billion in the comparable period of 2019-20.
Within the total, federal tax collection witnessed a significant increase as it grew by 11.5 per cent to reach
Rupees 3,394.9 billion during the July 2020 to March 2021 period against Rupees 3,044.3 billion in the same
period of 2019-20.The revenue performance is not only a reflection of growing economic activities even in
the wake of the third wave of COVID-19, but it also suggests that the efforts to improve tax collection through
various policy and administrative reforms have been successful.
In contrast, non-tax revenue fell sharply during the July 2020 to March 2021 period after witnessing strong
growth in the same period of the previous fiscal year. Non-tax revenue amounted to Rupees 1,227.6 billion
during the July 2020 to March 2021 period against Rupees 1,324.4 billion in the corresponding period of the
previous fiscal year, showing a decrease of 7.3 per cent. Out of the total, federal non-tax revenue recorded a
decrease of 8.0 per cent to Rupees 1,145.4 billion during the July 2020 to March 2021 period against Rupees
1,244.8 billion in the same period of the previous fiscal year. The decrease is mainly attributed to the absence
of a one-off renewal fee for GSM licenses from telecommunication companies. In addition, lower receipts
from a surplus profit of SBP and mark-up payments by the public sector enterprises have also attributed to an
overall decline in federal non-tax collection. On the other hand, receipts from gas infrastructure development
cess, natural gas development surcharge and petroleum levy have witnessed an increase during the July 2020
to March, 2021 period over the same period in the previous fiscal year.
The breakup of non-tax revenue shows that out of the total, Rupees 497.5 billion were collected from SBP
profit followed by Rupees 369.2 billion from petroleum levy, Rupees 53.3 billion from royalties on oil/gas,
Rupees 53.2 billion from mark-up receipts, Rupees 20.0 billion from Pakistan Telecommunication Authority

62
profit, Rupees 17.2 billion from natural gas development surcharge and Rupees 15.4 billion from gas
infrastructure development cess.
During the July 2020 to March 2021 period, total expenditure grew by 4.2 per cent as compared to a 15.8 per
cent growth observed during the same period in the previous fiscal year. The efficient expenditure management
helped in curtailing the overall expenditure during 2020-21. In absolute terms, the expenditures stood at
Rupees 6,644.6 billion (13.9 per cent of GDP) during the July 2020 to March 2021 period against Rupees
6,376.0 billion (15.3 per cent of GDP) in the comparable period of the previous fiscal year. The current
expenditure grew at 8.4 per cent during the July 2020 to March 2021 period against 16.9 per cent growth
recorded in the same period of the previous fiscal year. In absolute terms, it stood at Rupees 6,085.4 billion in
the July 2020 to March 2021 period against Rupees 5,611.6 billion in the same period of 2019-20. Although
higher mark-up payments, increase in subsidies and grants to others contributed significantly to the current
fiscal year’s growth in current expenditure, the decrease in other expenditures like defence, pensions and
running of civil government slowed the pace of growth.
The mark-up payments grew by 11.9 per cent during the July 2020 to March 2021 period on account of higher
growth in domestic debt servicing. In absolute terms, the mark-up payments increased to Rupees 2,103.9
billion during the July 2020 to March 2021 period from Rupees 1,879.7 billion as compared to same period of
the previous fiscal year. Higher domestic debt servicing was observed during the first nine months of the
current fiscal year as a result of Rupees 1,502 billion in domestic borrowing that was raised to finance the
federal fiscal deficit. Most of the previous year’s short-term debt was issued through 12-month T-Bills, the
interest on which was paid in the current fiscal year. On the other hand, the foreign debt servicing witnessed a
significant decrease during the July 2020 to March 2021 period owing to re-fixing of floating rate debt at much
lower rates due to substantial decrease in international reference rates (such as LIBOR), exchange rate
appreciation (Rupee strengthening) and interest servicing deferment in the amount of U.S.$278 million
through the Debt Service Suspension Initiative (DSSI).
In contrast to higher mark-up payments, the consolidated non-mark-up current expenditure grew by 6.7 per
cent in the July 2020 to March 2021 period, mainly because the federal non-interest current expenditure
increased by only 2.3 per cent against the growth of 16.6 per cent in the same period of the previous fiscal
year. The contained spending during the said period has been observed on the back of a decrease in defence,
pension and running of civil government expenditure. During the current fiscal year, the implementation of
austerity measures aided in the reduction of expenditures for the running of civil government.
Other components, such as subsidies and grants to others, grew at a slower pace during the July 2020 to March
2021 period as compared to the same period of the previous fiscal year. Subsidies increased by 20.5 per cent
in the first nine months of the current fiscal year, compared to a 75.1 per cent increase in the same period of
2019-20. Similarly, grants to others, which grew at a faster rate in the July 2019 to March 2020 (at
approximately 60 per cent), decreased to approximately 17 per cent in the same period of the current fiscal
year. Most of the increase in both subsidies and grants covered COVID-related spending, which continued
during the current fiscal year.
In absolute terms, subsidies increased to Rupees 204.3 billion during the July 2020 to March 2021 period from
Rupees 169.5 billion in the same period of the previous fiscal year. According to the breakup of subsidies,
Rupees 197.3 billion were provided for power and petroleum sector, Rupees 3.6 billion to Pakistan Agriculture
Storage & Services Corporation, Rupees 2.1 billion for fertiliser plants (Engro, Fatima) and Rupees 1.0 billion
for Prime Minister package for rabi crops. Similarly, grants to others stood at Rupees 424.3 billion in the July
2020 to March 2021 period against Rupees 363.1 billion in the comparable period of 2019-20. In addition,
total spending with respect to the BISP under Ehsaas increased by 13.6 per cent to Rupees 71.2 billion during
the July 2020 to March 2021 period against Rupees 62.7 billion in the same period of the previous fiscal year.
The total development expenditure (excluding net lending) amounted to Rupees 668.0 billion during the July
2020 to March 2021 period as compared to Rupees 751.7 billion in the same period of 2019-20, showing a
decrease of 11.1 per cent. During the period, PSDP spending (federal and provincial) decreased by 9.5 per cent
to reach Rupees 653.9 billion against Rupees 722.5 billion in the same period of the previous year. The
decrease in expenditure under PSDP has been observed on account of a decrease in federal PSDP (net

63
excluding development grants to provinces), which decreased by 22.5 per cent, while provincial PSDP
registered a modest growth of 2.1 per cent in the July 2020 to March 2021 period over the same period of the
previous fiscal year.
As the fiscal deficit was kept on the lower side year-on-year in the July 2020 to March 2021 period, total
financing was reduced by 2 per cent in the same period. Domestic and external resources generated Rupees
1,089.9 billion and Rupees 562.2 billion, respectively, to finance the fiscal deficit in the July 2020 to March
2021 period. Within domestic sources, financing from banks amounted to Rupees 797.8 billion and from non-
banks to Rupees 292.1 billion during the July 2020 to March 2021 period.
The following table sets forth fiscal indicators as a per cent of GDP for the periods stated:
2015-16 2016-17 2017-18 2018-19(1) 2019-20(1) 2020-21
Budget
Estimate
Overall fiscal deficit 4.6 5.8 6.5 9.0 8.1 7.0
Expenditure
Total 19.9 21.3 21.6 21.9 23.2 22.9
Current 16.1 16.3 16.9 18.7 20.5 20.0
Development and net
lending 4.5 5.3 4.7 3.2 2.9 2.9
Revenue
Total 15.3 15.5 15.1 12.9 15.1 15.9
Tax 12.6 12.4 12.9 11.7 11.4 12.1
Non-tax 2.7 3.0 2.2 1.1 3.7 3.9 (1) On basis of revised GDP numbers
Source: Budget Wing, Ministry of Finance
Tax Collection (replacing the fifth paragraph set out under caption “Public Finance and Taxation – Tax
Collection” on page 172 of the Offering Circular)
The economic recovery that started to unfold during the first quarter of 2020-21 further accelerated in the
subsequent months. The Government’s measures in the wake of COVID-19 along with sector-specific support
policies helped in the revival of domestic economic activity during the current fiscal year. In particular, the
industrial sector gained significant momentum on the back of rising construction activities. All these
developments, along with the ongoing comprehensive tax measures and administrative reforms, have paid off
in a substantial rise in FBR tax collection.
The FBR tax collection achieved double-digit growth in the July 2020 to April 2021 period and surpassed the
target by more than Rupees 100 billion. The provisional net collection grew by 14.4 per cent to Rupees 3,780.3
billion during the July 2020 to April 2021 period against Rupees 3,303.4 billion in the same period of the
previous fiscal year.
The net collection of direct taxes has registered a growth of 11.2 per cent during the July 2020 to April 2021
period. The net collection has increased from Rupees 1,225.0 billion to Rupees 1,362.4 billion. The bulk of
the tax revenue of direct taxes is realised from income tax. The major contributors of income tax are
withholding tax, voluntary payments and collection on demand. The net collections of indirect taxes have
witnessed a growth of 16.3 per cent in the July 2020 to April 2021 period. It is accounted for 64 per cent of
the total FBR tax revenue during this period.
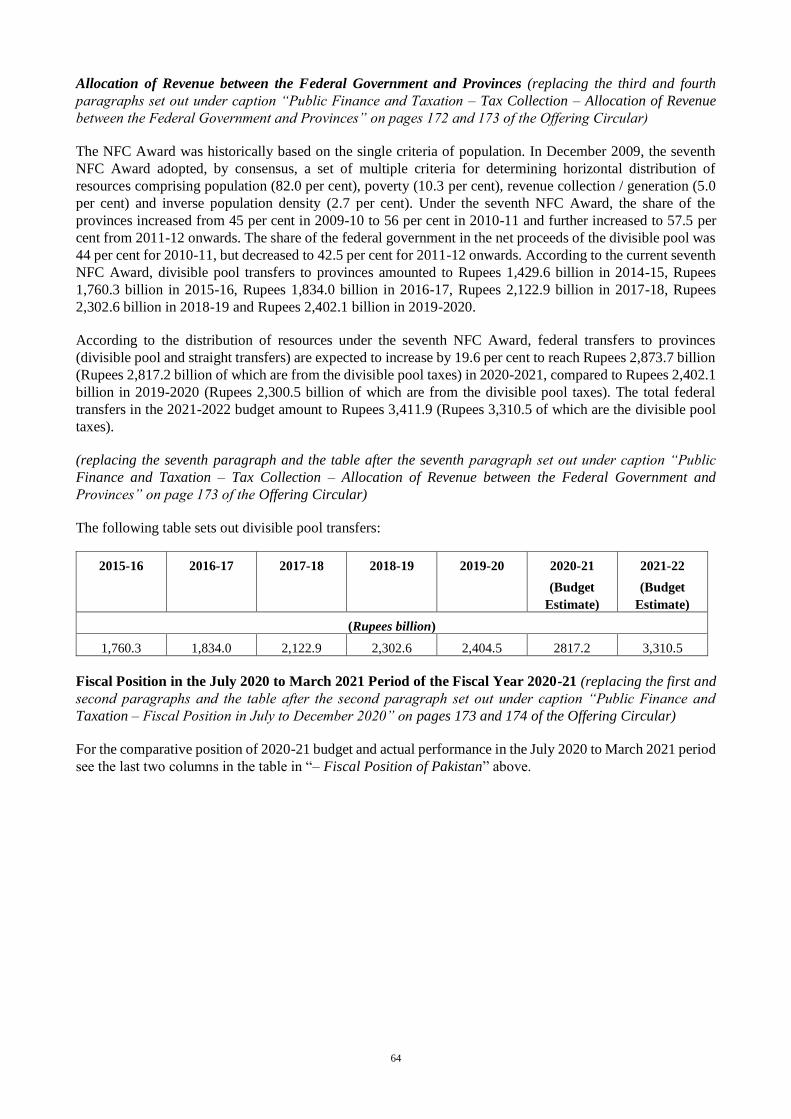
64
Allocation of Revenue between the Federal Government and Provinces (replacing the third and fourth
paragraphs set out under caption “Public Finance and Taxation – Tax Collection – Allocation of Revenue
between the Federal Government and Provinces” on pages 172 and 173 of the Offering Circular)
The NFC Award was historically based on the single criteria of population. In December 2009, the seventh
NFC Award adopted, by consensus, a set of multiple criteria for determining horizontal distribution of
resources comprising population (82.0 per cent), poverty (10.3 per cent), revenue collection / generation (5.0
per cent) and inverse population density (2.7 per cent). Under the seventh NFC Award, the share of the
provinces increased from 45 per cent in 2009-10 to 56 per cent in 2010-11 and further increased to 57.5 per
cent from 2011-12 onwards. The share of the federal government in the net proceeds of the divisible pool was
44 per cent for 2010-11, but decreased to 42.5 per cent for 2011-12 onwards. According to the current seventh
NFC Award, divisible pool transfers to provinces amounted to Rupees 1,429.6 billion in 2014-15, Rupees
1,760.3 billion in 2015-16, Rupees 1,834.0 billion in 2016-17, Rupees 2,122.9 billion in 2017-18, Rupees
2,302.6 billion in 2018-19 and Rupees 2,402.1 billion in 2019-2020.
According to the distribution of resources under the seventh NFC Award, federal transfers to provinces
(divisible pool and straight transfers) are expected to increase by 19.6 per cent to reach Rupees 2,873.7 billion
(Rupees 2,817.2 billion of which are from the divisible pool taxes) in 2020-2021, compared to Rupees 2,402.1
billion in 2019-2020 (Rupees 2,300.5 billion of which are from the divisible pool taxes). The total federal
transfers in the 2021-2022 budget amount to Rupees 3,411.9 (Rupees 3,310.5 of which are the divisible pool
taxes).
(replacing the seventh paragraph and the table after the seventh paragraph set out under caption “Public
Finance and Taxation – Tax Collection – Allocation of Revenue between the Federal Government and
Provinces” on page 173 of the Offering Circular)
The following table sets out divisible pool transfers:
2015-16 2016-17 2017-18 2018-19 2019-20 2020-21
(Budget
Estimate)
2021-22
(Budget
Estimate)
(Rupees billion)
1,760.3 1,834.0 2,122.9 2,302.6 2,404.5 2817.2 3,310.5
Fiscal Position in the July 2020 to March 2021 Period of the Fiscal Year 2020-21 (replacing the first and
second paragraphs and the table after the second paragraph set out under caption “Public Finance and
Taxation – Fiscal Position in July to December 2020” on pages 173 and 174 of the Offering Circular)
For the comparative position of 2020-21 budget and actual performance in the July 2020 to March 2021 period
see the last two columns in the table in “– Fiscal Position of Pakistan” above.

65
PUBLIC DEBT
(replacing the second, third and fourth paragraphs and the table after the fourth paragraph set out under
caption “Public Debt” on pages 175 and 176 of the Offering Circular)
Pakistan's gross public debt as at 31 March 2021 was Rupees 38,006 billion (81.4 per cent of GDP), registering
an increase of Rupees 1,607 billion in the nine months ended 31 March 2021. This increase in gross public
debt in the nine months ended 31 March 2021 was significantly lower when compared with the increase in
gross public debt of Rupees 2,499 million that occurred in the same period of the previous fiscal year. The
increase in gross public debt in the nine months ended 31 March 2021 was lower than federal government
borrowing of Rupees 2,065 billion for financing of its fiscal deficit in the same period. The differential is
primarily attributable to appreciation of the Rupee against the U.S. dollar by approximately 9 per cent, which
led to a decrease in the value of external public debt when converted into Rupees.
Total debt of the government (gross public debt minus deposits of the government (including the federal
government and the provincial governments) with the banking system) amounted to Rupees 33,724 billion as
at 31 March 2021 as compared to Rupees 31,425 billion as at 31 March 2020. The composition of Pakistan's
public debt has been weighted in favour of domestic debt over the past few years. As at 31 March 2021,
government domestic debt was Rupees 25,552 billion as compared to Rupees 22,478 billion as at 31 March
2020. Government external debt and debt from the IMF amounted to Rupees 12,454 billion as at 31 March
2021 as compared to Rupees 12,729 billion as at 31 March 2020.
The following table sets for the composition of Pakistan's Gross public debt as at 30 June for the periods stated
and as of 31 March 2021:
2015-16 2016-17 2017-18 2018-19 2019-20
31 March
2021
(Rupees billion)
Government domestic debt 13,626 14,849 16,416 20,732 23,283 25,552
Government external debt
(including debt from the IMF)
6,051 6,559 8,537 11,976 13,116 12,454
Gross public debt 19,677 21,409 24,953 32,708 36,399 38,006
Total debt of the government(2) 17,823 19,635 23,024 29,521 33,235 33,724
(% of GDP)
Government domestic debt 46.9 46.5 47.4 54.4 56.0 53.6(1)
Government external debt
(including debt from the IMF)
20.8 20.5 24.7 31.4 31.6 26.1(1)
Gross public debt 67.7 67.1 72.1 85.9 87.6 79.7(1)
Total debt of the government(2) 61.3 61.5 66.5 77.5 80.0 70.7(1)
(% of revenues)
Government domestic debt 306 301 314 423 371 -
Government external debt
(including debt from the IMF)
136 133 163 244 209 -
Gross public debt 442 434 477 667 580 -
(% of total debt)
Government domestic debt 69.2 69.4 65.8 63.4 64.0 67.2
Government external debt
(including debt from the IMF)
30.8 30.6 34.2 36.6 36.0 32.8
Foreign currency debt (U.S.$
billion)
57.8 62.5 70.2 73.4 78.0 81.6

66
Exchange rate (Rupees/U.S.$ at
end of period)
104.8 104.9 121.5 163.1 168.2 152.6
GDP (Rupees billion) 29,076 31,922 34,616 38,086 41,556 47,709(1)
Total revenue (Rupees billion) 4,447 4,937 5,228 4,901 6,272 4,992.5
(1) Provisional
(2) Gross public debt minus deposits of the government (including the federal government and the provincial governments) with the banking
system
Source: State Bank of Pakistan and Ministry of Finance
(replacing the sixth and seventh paragraphs set out under caption “Public Debt” on page 176 of the Offering
Circular)
Public debt portfolio witnessed various developments during the fiscal year 2020-21, including the following:
In the nine months ended 31 March 2021, over 80 per cent of the net borrowing from domestic sources
was through medium-to-long-term domestic debt instruments (Pakistan Investment Bonds (PIBs) and
Government Ijara Sukuk).
Maturity profile of domestic debt has improved significantly during the tenure of the present
Government. Short-term debt as percentage of total domestic debt decreased to approximately 23 per
cent as at 31 March 2021 as compared with approximately 54 per cent as at 30 June 2018.
In-line with the Government’s commitment, no new borrowing was made from the SBP. In fact, the
Government repaid Rupees 569 billion during the fiscal year 2020-21 against its debt owed to the
SBP. The cumulative debt retirement against the SBP debt amounted to over Rupees 1.1 trillion during
the last two fiscal years.
The Rupees 25,000, Rupees 15,000 and Rupees 7,500 denominations prize bonds were withdrawn
from circulation in order to improve the documentation of the economy. The holders have been given
options to (i) convert them to premium prize bonds, (ii) replace them with eligible National Savings
Certificates or (iii) cash them in at face value into their bank accounts.
Pakistan entered the international capital market after a gap of over three years by successfully raising
U.S.$2.5 billion through a multi-tranche Eurobonds with maturities of five, 10 and 30 years under its
first-ever Global Medium Term Note Programme.
Debt from multilateral and bilateral sources cumulatively constituted over 80 per cent of external
public debt portfolio as at 31 March 2021. Economic reforms initiated by the Government have
brought strong support from multilateral development partners during the last two fiscal years. This is
expected to strengthen confidence and generate additional support from development partners in the
coming years, which is also expected to help in reducing the pressure on domestic sources of
borrowings.
Pakistan is taking part in the G-20 Debt Service Suspension Initiative for a period of 20 months (May
2020 to December 2021), which will help to defer the debt servicing in the amount of approximately
U.S.$3.7 billion during this period.
Over the medium-term, the Government’s objective is to reduce its “Gross Financing Needs” through various
measures principally including (i) better cash flow management through a treasury single account; (ii)
lengthening of maturities in the domestic market taking into account cost and risks trade-off; (iii) developing
a regular Islamic finance-based borrowing programme; and (iv) obtaining maximum available concessional
external financing from bilateral and multilateral development partners to benefit from concessional terms and
conditions.
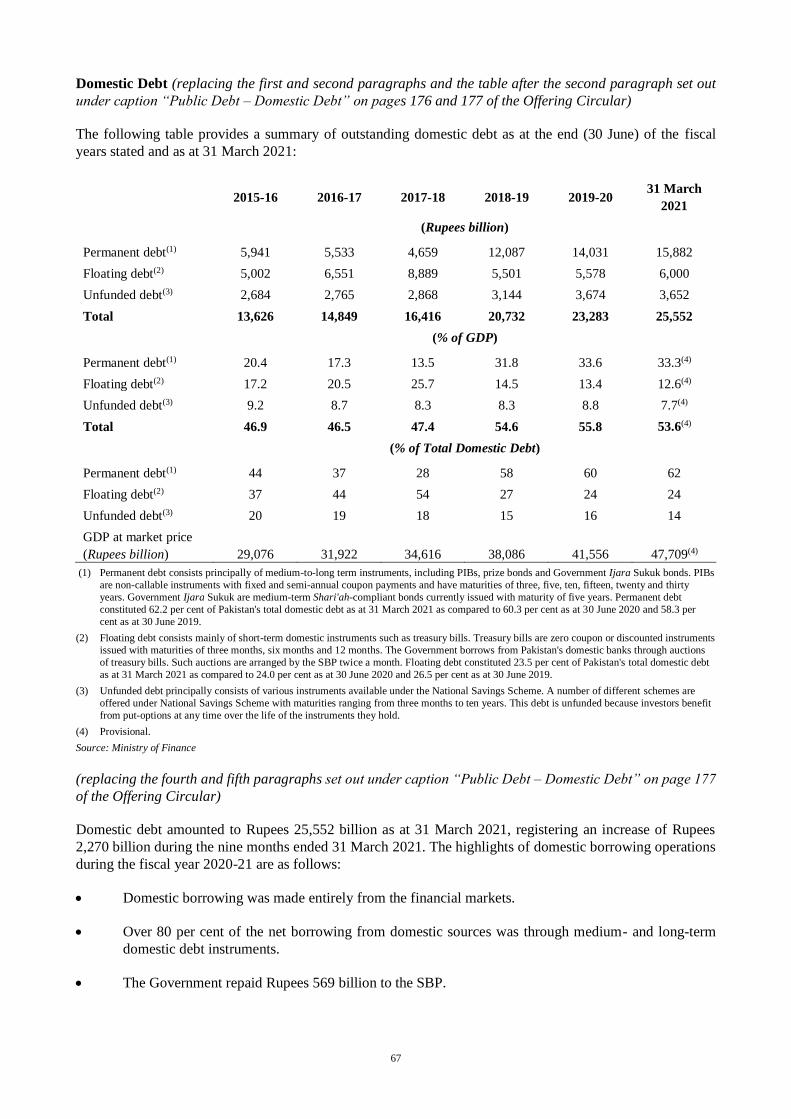
67
Domestic Debt (replacing the first and second paragraphs and the table after the second paragraph set out
under caption “Public Debt – Domestic Debt” on pages 176 and 177 of the Offering Circular)
The following table provides a summary of outstanding domestic debt as at the end (30 June) of the fiscal
years stated and as at 31 March 2021:
2015-16 2016-17 2017-18 2018-19 2019-20
31 March
2021
(Rupees billion)
Permanent debt(1) 5,941 5,533 4,659 12,087 14,031 15,882
Floating debt(2) 5,002 6,551 8,889 5,501 5,578 6,000
Unfunded debt(3) 2,684 2,765 2,868 3,144 3,674 3,652
Total 13,626 14,849 16,416 20,732 23,283 25,552
(% of GDP)
Permanent debt(1) 20.4 17.3 13.5 31.8 33.6 33.3(4)
Floating debt(2) 17.2 20.5 25.7 14.5 13.4 12.6(4)
Unfunded debt(3) 9.2 8.7 8.3 8.3 8.8 7.7(4)
Total 46.9 46.5 47.4 54.6 55.8 53.6(4)
(% of Total Domestic Debt)
Permanent debt(1) 44 37 28 58 60 62
Floating debt(2) 37 44 54 27 24 24
Unfunded debt(3) 20 19 18 15 16 14
GDP at market price
(Rupees billion) 29,076 31,922 34,616 38,086 41,556 47,709(4)
(1) Permanent debt consists principally of medium-to-long term instruments, including PIBs, prize bonds and Government Ijara Sukuk bonds. PIBs
are non-callable instruments with fixed and semi-annual coupon payments and have maturities of three, five, ten, fifteen, twenty and thirty
years. Government Ijara Sukuk are medium-term Shari'ah-compliant bonds currently issued with maturity of five years. Permanent debt
constituted 62.2 per cent of Pakistan's total domestic debt as at 31 March 2021 as compared to 60.3 per cent as at 30 June 2020 and 58.3 per
cent as at 30 June 2019.
(2) Floating debt consists mainly of short-term domestic instruments such as treasury bills. Treasury bills are zero coupon or discounted instruments
issued with maturities of three months, six months and 12 months. The Government borrows from Pakistan's domestic banks through auctions
of treasury bills. Such auctions are arranged by the SBP twice a month. Floating debt constituted 23.5 per cent of Pakistan's total domestic debt
as at 31 March 2021 as compared to 24.0 per cent as at 30 June 2020 and 26.5 per cent as at 30 June 2019.
(3) Unfunded debt principally consists of various instruments available under the National Savings Scheme. A number of different schemes are
offered under National Savings Scheme with maturities ranging from three months to ten years. This debt is unfunded because investors benefit
from put-options at any time over the life of the instruments they hold.
(4) Provisional.
Source: Ministry of Finance
(replacing the fourth and fifth paragraphs set out under caption “Public Debt – Domestic Debt” on page 177
of the Offering Circular)
Domestic debt amounted to Rupees 25,552 billion as at 31 March 2021, registering an increase of Rupees
2,270 billion during the nine months ended 31 March 2021. The highlights of domestic borrowing operations
during the fiscal year 2020-21 are as follows:
Domestic borrowing was made entirely from the financial markets.
Over 80 per cent of the net borrowing from domestic sources was through medium- and long-term
domestic debt instruments.
The Government repaid Rupees 569 billion to the SBP.

68
Various new instruments were introduced to further develop the government securities market, attract
more diversified investor base and provide more flexibility to the investors as well as to the
Government:
- The Government started issuance of 5-year Sukuk with fixed rate rental payments from July
2020;
- Similar to conventional bonds issuance, the Government introduced re-opening mechanism in
Sukuk auctions in July 2020 to increase liquidity of outstanding Sukuk issues;
- The Government started issuance of 3-, 5- and 10-year floating rate PIBs with quarterly coupon
payment frequency from October 2020; and
- The Government introduced 2-year floating rate PIBs in November 2020 with quarterly coupon
payment frequency and fortnightly interest rate re-setting.
With effect from 1 July 2020, all institutional investors have been barred from investing in National
Saving Schemes with the objective to deepen the financial markets and lower the Government’s long-
term borrowing costs by creating more competition for long-term government debt.
Prize bonds with denominations of Rupees 25,000, Rupees 15,000 and Rupees 7,500 were withdrawn
from circulation in order to improve the documentation of the economy.
The composition of domestic debt has experienced changes in recent years. As at 31 March 2021, unfunded
debt comprised 14.3 per cent of domestic debt (floating debt 23.5 per cent; permanent debt 62.2 per cent) as
compared to unfunded debt of 15.7 per cent of domestic debt (floating debt 23.9 per cent; permanent debt 60.3
per cent) as at 30 June 2020 and unfunded debt of 15.2 per cent of domestic debt (floating debt 26.5 per cent;
permanent debt 58.3 per cent) as at 30 June 2019.
Maturity profile of government domestic debt improved in 2019-20 as compared to 2018-19. More than two-
thirds of the increase in domestic debt came from permanent debt, which includes longer-tenor instruments
like PIBs, Government Ijara Sukuk and prize bonds. Within floating debt, the Government was able to
lengthen the maturity profile. The share of T-bills with the maturity of three months in the total outstanding
stock of T-bills decreased, whereas that of instruments with maturities of six months and 12 months increased
during 2019-20.
External Debt (replacing the text set out under caption “Public Debt – External Debt” on pages 178 to 181
of the Offering Circular)
Public external debt amounted to U.S.$81.6 billion as at 31 March 2021, increasing by approximately U.S.$3.6
billion in the nine months ended 31 March 2021. This increase consists of the following:
Debt from multilateral and bilateral sources increased by U.S.$2.2 billion. This amount includes
U.S.$0.5 billion received from the IMF under the IMF EFF programme. Typically, loans from
multilateral and bilateral sources are obtained on concessional terms (low cost and longer tenor).
The amount of outstanding commercial loans increased by U.S.$1.0 billion. New loans from Middle
Eastern commercial banks were the principal reason for this increase.
The amount of outstanding Pakistan Banao Certificates and Naya Pakistan Certificates cumulatively
increased by U.S.$0.4 billion.
Pakistan’s public external debt is derived from four key sources, with approximately 49 per cent coming from
multilateral loans, 31 per cent from bilateral loans, 13 per cent from commercial loans (including non-resident
investments in domestic government securities, Naya Pakistan Certificates and Pakistan Banao Certificates)
and 7 per cent from Eurobonds/Sukuk.

69
The following table summarises Pakistan's external debt as at the end (30 June) of the fiscal years stated and
as at 31 March 2021:
2015-16 2016-17 2017-18 2018-19 2019-20
31 March
2021
(U.S.$ million)
A. Public external debt
(1 + 2) 57,757 62,539 70,237 73,449 77,994 81,606
1. Government
external debt 51,714 56,430 64,142 67,800 70,314 73,972
(a) Medium and
long term
(>l year) 50,026 55,547 62,525 66,536 68,773 73,139
(b) Short term
(<1 year) 1,688 882 1,617 1,264 1,542 833
2. IMF 6,043 6,109 6,095 5,648 7,680 7,634
B. Foreign exchange
liabilities 3,600 3,564 5,121 10,488 9,891 8,678
C. Public sector
enterprises (1+2) 2,807 2,719 2,671 3,867 5,171 6,171
1. Guaranteed debt 1,265 1,214 1,384 2,800 4,244 5,213
2. Non-guaranteed
debt 1,541 1,505 1,287 1,067 927 958
D. Banks 2,695 4,522 4,417 4,721 4,620 4,689
E. Private Sector Debt 4,073 6,759 9,195 10,496 11,009 11,116
F. Debt liabilities to
direct investors /
intercompany
debt(2) 3,013 3,375 3,597 3,328 4,329 4,048
Total external debt
(A + B + C + D + E + F) 73,945 83,477 95,237 106,349 113,013 116,309
Official liquid reserves 21,766 21,403 16,407 14,482 17,971 20,836
(% of GDP)
Total external debt
(A + B + C + D + E +F) 26.5 27.4 30.2 38.1 42.8 -
A. Public external debt
(1 + 2) 20.7 20.5 22.3 26.3 29.6 -
1. Government
external debt 18.5 18.5 20.4 24.3 26.7 -
(a) Medium and long
term (>l year) 17.9 18.2 19.8 23.8 26.1 -
(b) Short Term (<1 year) 0.6 0.3 0.5 0.5 0.6 -
2. IMF 2.2 2.0 1.9 2.0 2.9 -
B. Foreign exchange
liabilities 1.3 1.2 1.6 3.8 3.8 -
C. Public sector
enterprises (1+2) 1.0 0.9 0.8 1.4 2.0 -
1. Guaranteed debt 0.5 0.4 0.4 1.0 1.6 -

70
2015-16 2016-17 2017-18 2018-19 2019-20
31 March
2021
(U.S.$ million)
2. Non-guaranteed
debt 0.6 0.5 0.4 0.4 0.4 -
D. Banks 1.0 1.5 1.4 1.7 1.8 -
E. Private Sector Debt 1.5 2.2 2.9 3.8 4.2 -
F. Debt liabilities to
direct investors /
intercompany debt(1) 1.1 1.1 1.1 1.2 1.6 -
Notes:
GDP (Rupees trillion) 29.1 31.9 34.6 38.1 41.6 47.7(2)
30 June Weighted
Average Exchange Rate
(Rupees/U.S.$) 104.8 104.9 121.5 163.1 168.2 -
GDP (U.S.$ billion) 278.9 304.9 315.2 279.0 263.5 -
(1) Based on the guidelines of IMF's external debt guide 2003, which states that "intercompany lending between entities in a direct investment
relationship is separately presented because the nature of the relationship between debtor and creditor is different from that for other debt, and
this affects economic behaviour. Whereas a creditor principally assesses claims on an unrelated entity in terms of the latter's ability to repay,
claims on a related entity may be additionally assessed in terms of the overall profitability and economic objectives of the multinational
operation".
(2) Provisional
Source: State Bank of Pakistan
The following table shows information on inflows and outflows with respect to public external debt and on
public external debt servicing for the periods stated:
2015-16 2016-17 2017-18 2018-19 2019-20 July 20 -
March 21
(U.S.$ millions)
DISBURSEMENTS
Multilateral 5,766 3,166 2,813 2,021 8,329 3.397
Bilateral 1,040 1,941 1,971 4,377 1,398 1,207
Bonds 500 1,000 2,500 - - -
Commercial / Other 1,387 4,426 3,716 4,098 3,347 3,120
Total Inflows (A) 8,693 10,533 11,000 10,496 13,074 7,724
REPAYMENTS
Multilateral 1,274 1,255 1,403 1,750 2,199 1,994 Bilateral 440 1,200 793 970 783 90
Bonds 500 750 - 1,000 1,000 -
Commercial / Other 1,000 1,922 1,995 3,634 5,061 3.063
Total Repayments (B) 3,213 5,127 4,190 7,355 9,043 5,147
Net Inflows (A-B) 5,480 5,406 6,809 3,140 4,031 2,577
INTEREST PAYMENTS
Multilateral 290 381 485 584 637 449
Bilateral 380 441 444 541 484 106 Bonds 354 366 423 503 396 213
Commercial / Other 102 124 332 475 515 312
Total Interest Payments (C) 1,127 1,313 1,684 2,103 2,032 1,080
Total Debt Servicing (B+C) 4,340 6,440 5,874 9,458 11,075 6,227
Note: Data excludes disbursements from Naya Pakistan Certificates, Pakistan Banao Certificates and non-resident investment in government domestic
securities
Source: Economic Affairs Division and State Bank of Pakistan
Total expenditure on public external debt servicing amounted to U.S.$11,075 million in 2019-20, of which
U.S.$9,043 million was accounted for by principal repayments and U.S.$2,032 million by interest payments.
Public external debt servicing increased significantly in 2019-20 as compared to 2018-19.

71
Public external debt repayments amounted to U.S.$5,147 million during the nine months ended 31 March 2021
as compared to U.S.$5,537 million during the same period of the previous fiscal year. This reduction in
repayments is primarily due to the DSSI initiative discussed below and no repayment of
Eurobonds/international Sukuk during the fiscal year 2020-21.
Interest payments amounted to U.S.$1,080 million during the nine months ended 31 March 2021 as compared
to U.S.$1,580 million during the same period of the previous fiscal year. The factors that reduced the external
interest servicing during the fiscal year 2020-21 were (i) significant reduction in global interest rates due to
the COVID-19 pandemic, which led to lower interest payments on floating rate external debt and (ii) interest
servicing deferment under the DSSI.
Pakistan considers that its external debt remains on a sustainable path, which has also been endorsed by the
IMF. If Pakistan is able to maintain an improved balance of payment situation, external debt sustainability is
expected to improve further going forward.
The following table sets forth scheduled or projected repayments of public external debt for the periods stated,
which reflects debt service suspensions under (i) the DSSI-I (as defined below), under which principal and
interest payments were suspended for a period of eight months from 1 May 2020 to 31 December 2020, (ii)
the DSSI-II (as defined below) under which principal and interest payments were suspended for a period of
six months from 1 January 2021 to 30 June 2021 and (iii) the DSSI-III (as defined below) under which principal
and interest payments were suspended for a period of six months from 1 July 2021 to 31 December 2021:
2021-22 2022-23 2023-24 2024-25 2025-26
P(1) I(2) T(3) P(1) I(2) T(3) P(1) I(2) T(3) P(1) I(2) T(3) P(1) I(2) T(3)
(U.S.$ billions)
Multilateral 3.3 0.6 3.9 3.0 0.5 3.5 3.8 0.4 4.2 3.7 0.4 4.1 2.7 0.4 3.1
Bilateral 1.0 0.2 1.2 2.5 0.4 3.0 2.7 0.3 3.0 2.3 0.3 2.5 1.7 0.2 1.9
Bonds 1.0 0.3 1.3 1.0 0.3 1.3 1.0 0.3 1.3 - 0.2 0.2 0.5 0.1 0.6
Commercial 3.6 0.1 3.7 3.4 0.1 3.5 0.1 0.0 0.1 0.1 0.0 0.1 0.1 0.0 0.1
Total 8.9 1.2 10.1 9.9 1.3 11.2 7.6 1.0 8.6 6.0 0.8 6.8 5.0 0.8 5.8
(1) Principal
(2) Interest
(3) Total
Note: Above data is exclusive of time deposits (being refinanced at maturity) and captures debt suspensions under the DSSI-I (May-December 2020),
the DSSI-II (January – June 2021) and the DSSI-III (July-December 2021).
Source: Economic Affairs Division and Debt Policy Coordination Office staff calculations
Participation in the Debt Service Suspension Initiative (replacing the text set out under caption “Public Debt
– External Debt – Participation in the debt suspension initiative” on page 181 of the Offering Circular)
In April 2020, the Debt Service Suspension Initiative (the DSSI-I) was launched to grant a limited-time debt
service suspension to the poorest countries to help them in managing the adverse impact of the COVID-19
pandemic. The key objective of the DSSI is to enable an effective crisis response, in which borrowers are
required to utilise the freed-up resources to increase social and health expenditures. Furthermore, countries are
also committed to limit their non-concessional borrowings, other than the agreements under this initiative or
in compliance with limits agreed under an IMF programme or the World Bank's policy on non-concessional
borrowing. This implies that access to commercial and bilateral loans is limited for participating countries.
Principal and interest payments under the DSSI-I were suspended for a period of eight months from 1 May
2020 to 31 December 2020. The repayment period for this restructuring is four years including one-year grace
period. G-20 countries in November 2020 have further extended the suspension period for another six months
until 30 June 2021. Under this second initiative (the DSSI-II), the repayment period is six years including one-
year grace period. On 7 April 2021, G-20 countries agreed to a final extension of the DSSI by six months
through the end of December 2021 (the DSSI-III). The repayment period and grace period under DSSI-III are
the same as the repayment period and grace period under the DSSI-II.

72
Pakistan applied for participation in the DSSI-I in the fourth quarter of 2019-20. Pakistan has deferred
approximately U.S.$1.6 billion under DSSI-I, approximately U.S.$1.1 billion under DSSI-II and
approximately U.S.$1.0 billion under DSSI-III. The cumulative deferred amount of U.S.$3.7 billion for the
period from May 2020 to December 2021 is inclusive of interest payments. This debt relief has eased pressures
on debt servicing and also created the needed fiscal space to mitigate the impact of the COVID-19 pandemic
in Pakistan.
Issuance of Bonds and International Sukuk (replacing the text set out under caption “Public Debt – External
Debt – Issuance of Bonds and International Sukuk” on page 181 of the Offering Circular)
Pakistan has issued bonds and international Sukuk in the international capital markets. There are nine
international issues outstanding: (i) U.S.$1,000 million Sukuk 5.500 per cent due October 2021, (ii)
U.S.$1,000 million Sukuk 5.625 per cent due December 2022, (iii) U.S.$1,000 million 8.25 per cent notes due
April 2024, (iv) U.S.$500 million 8.250 per cent notes due September 2025, (v) U.S.$1,500 million 6.875 per
cent notes due December 2027, (vi) U.S.$300 million 7.875 per cent notes due March 2036, (vii) U.S.$1,000
million 6.000 per cent notes due April 2026, (viii) U.S.$1,000 million 7.375 per cent notes due April 2031 and
(ix) U.S.$500 million 8.875 per cent notes due April 2051.
Progress on the Medium-Term Debt Management Strategy (replacing the text set out under caption
“Public Debt – Progress on the Medium-Term Debt Management Strategy” on pages 181 and 182 of the
Offering Circular)
In accordance with the Medium-Term Debt Management Strategy (2019/20 – 2022/23), the Government was
required to set certain benchmarks and indicative risk ranges in order to monitor the risks of total public debt
portfolio and ensure its sustainability. The following table sets forth the indicative benchmarks and targets for
key risk indicators during 2019-20:
Risk
Exposure Indicators
Indicative
Benchmarks
(Fiscal Year
2019-20 –
Fiscal Year
2022-23)
Fiscal Year
2019-20
Fiscal Year
2020-21
Target Actual Target
Currency risk Share of external debt in total public debt 40%
(Maximum) - 36 -
Refinancing
risk
Average time to maturity of domestic debt
(Years)
Average time to maturity of external debt
(Years)
Gross financing needs (% of total)
3.5
(Minimum)
6.5
(Minimum)
35%
(Maximum)
4.0
7.0
32
4.1
7.0
31
4.0
7.0
30
Share of Shari'ah-compliant instruments in government
securities (%)
- 2.0 2.0 5.0
Share of fixed rate debt in government securities (%) 25%
(Minimum) 30 34 30
Note: Total Means Total Public Debt at the end of relevant period
Source: Debt Policy Coordination Office, Ministry of Finance
As at 30 June 2020, the Government had remained within the stated benchmarks of risk indicators and achieved
all targets set for the fiscal year 2019-20.
The Government has also been able to reduce the refinancing risk of its public debt portfolio. The average time
to maturity of domestic debt portfolio was 4.1 years as at 31 December 2020 as compared with 1.6 years as at
30 June 2018. The average time to maturity of external debt was 7.0 years as at 31 December 2020 and the
Government intends to maintain this indicator at the same level over the medium to long term.

73
World Bank (replacing the text set out under caption “Public Debt – Relationship with Multilateral and
Bilateral Creditors – World Bank” on page 182 of the Offering Circular)
As reported in March 2021, the World Bank Group had a portfolio of U.S.$12.3 billion in Pakistan (U.S.$8.0
billion through the International Development Association (IDA), U.S.$4.0 billion through the International
Bank of Reconstruction and Development (IBRD) and U.S.$244 million in trust funds). This portfolio is
supporting reforms and investments to strengthen institutions, particularly in fiscal management and human
development. Partnerships are being strengthened at provincial levels, focusing on multi-sectoral initiatives in
areas such as children's nutrition, education and skills, irrigated agriculture, tourism, disaster risk management
and urban development.
The World Bank's programme in Pakistan is governed by the Country Partnership Strategy for fiscal years
2015-2020 with four priority areas of engagement: energy, private sector development, inclusion and service
delivery. The World Bank Group is in the process of preparing a new Country Partnership Framework for
Pakistan that will outline its strategic support in the country for the period from 2022 to 2026.
On 18 June 2021, the World Bank’s Board of Executive Directors approved U.S.$442 million in financing to
support Pakistan in improving access to water and sanitation services for the most vulnerable rural
communities in Punjab province. On 28 June 2021, the World Bank’s Board of Executive Directors approved
U.S.$800 million in financing for two programmes in Pakistan. The U.S.$400 million Pakistan Programme for
Affordable and Clean Energy focusses on measures to improve the financial viability of the power sector and
support the country’s transition to low-carbon energy. This programme prioritises actions needed to initiate
critical power sector reforms focussed on reducing power generation costs, better targeting of subsidies and
tariffs for consumers and improving efficiencies in electricity distribution with the participation of the private
sector. The U.S.$400 million Second Securing Human Investments to Foster Transformation programme
supports a federal structure to strengthen basic service delivery for human capital accumulation. This
programme is expected to help improve health and education services, increase income-generation
opportunities for the poor and promote inclusive economic growth. All U.S.$400 million allocated under this
programme were received by Pakistan on 30 June 2021.
As at 31 March 2021, the IBRD had commitments totalling U.S.$4,173 million under eight grants and 13 non-
guaranteed loans, of which U.S.$3,202 million was undisbursed as at that date. As at 31 March 2021, Pakistan's
outstanding debt to the IBRD amounted to U.S.$1,743 million.
As at 31 March 2021, the IDA had commitments totalling U.S.$8,444 million under 33 non-guaranteed loans,
of which U.S.$4,946 million was undisbursed as at that date. As at 31 March 2021, Pakistan's outstanding debt
to the IDA amounted to U.S.$15,284 million.
Asian Development Bank (ADB) (replacing the first paragraph set out under caption “Public Debt –
Relationship with Multilateral and Bilateral Creditors – Asian Development Bank (ADB)” on page 182 of the
Offering Circular)
The ADB provides various types of financial support to Pakistan, including programme lending, project loans,
grants and technical assistance to bridge the financing gap and meet the development needs of the country.
The ADB is one of the largest development partners of Pakistan. From 1966 to 31 March 2021, the ADB has
committed U.S.$34.4 billion for 785 projects in key priority areas including energy, road and transport,
agriculture and water, social sector and economic reforms. Of this committed amount, the ADB has disbursed
U.S.$23 billion to Pakistan.
(replacing the third, fourth and fifth paragraphs set out under caption “Public Debt – Relationship with
Multilateral and Bilateral Creditors – Asian Development Bank (ADB)” on pages 182 and 183 of the Offering
Circular)
The ADB has an ongoing portfolio of U.S.$6.5 billion for 32 projects in energy, road and transport, water and
agriculture, urban development, public-private partnership, disaster risk reduction and social sector. Pakistan's
active technical assistance portfolio totals U.S.$72 million and comprises 35 technical assistance projects.
74
As at 31 March 2021, the ADB had commitments totalling U.S.$9,136 million under 15 grants and 65 non-
guaranteed loans, of which U.S.$4,362 million was undisbursed as at that date.
As at 31 March 2021, Pakistan's outstanding debt to the ADB amounted to U.S.$13,457 million.
Islamic Development Bank (IsDB) (replacing the text set out under caption “Public Debt – Relationship with
Multilateral and Bilateral Creditors – Islamic Development Bank (IsDB)” on page 183 of the Offering
Circular)
Pakistan joined the IsDB on 12 August 1974 as a founding member. Pakistan is the third largest beneficiary
of the IsDB Group financing among its 57 member countries. From 1974 up to March 2021, the IsDB Group
approved total financing of U.S.$14.2 billion for Pakistan. Over the last five years (2016-20), there has been a
significant increase in IsDB Group's approvals, with the total amount of such approvals (U.S.$3.8 billion)
accounting for almost 30 per cent of total approvals since 1974.
As at 31 March 2021, the IsDB had medium- and long-term commitments totalling U.S.$1,069 million under
four grants and 12 non-guaranteed loans, of which U.S.$224 million was undisbursed as at that date. As at the
same date, the IsDB had short-term commitments totalling U.S.$3,081 million under 12 non-guaranteed loans,
which were fully disbursed as at that date.
As at 31 March 2021, Pakistan's outstanding medium- and long-term debt to the IsDB amounted to U.S.$963
million, while its outstanding short-term debt to the IsDB amounted to U.S.$451 million.
Asia Infrastructure Investment Bank (AIIB) (replacing the third paragraph set out under caption “Public
Debt – Relationship with Multilateral and Bilateral Creditors – Asia Infrastructure Investment Bank (AIIB)”
on page 183 of the Offering Circular)
With respect to the first project of the AIIB in Pakistan, the Shorkot-Khanewal section of the M-4 Motorway,
the AIIB has committed U.S.$100 million for this project, of which U.S.$80.3 million was disbursed as at 31
March 2021. The AIIB has approved U.S.$300 million for its second project in Pakistan, the Tarbella-V
extension project, of which U.S.$296.2 million remained undisbursed as at 31 March 2021.
(replacing the sixth and seventh paragraphs set out under caption “Public Debt – Relationship with
Multilateral and Bilateral Creditors – Asia Infrastructure Investment Bank (AIIB)” on page 183 of the Offering
Circular)
As at 31 March 2021, the AIIB had commitments totalling U.S.$1,247 million under two grants and six non-
guaranteed loans, of which U.S.$412 million was undisbursed as at that date.
As at 31 March 2021, Pakistan's outstanding debt to the AIIB amounted to U.S.$835 million.
China (replacing the text set out under caption “Public Debt – Relationship with Multilateral and Bilateral
Creditors – China” on page 183 of the Offering Circular)
China provides extensive economic assistance to Pakistan. As at 31 March 2021, China had commitments
totalling U.S.$5,668 million under two guaranteed loans related to the Karachi nuclear power project, of which
U.S.$2,202 million remained undisbursed as at that date. In addition, as at 31 March 2021, China had
commitments totalling U.S.$5,757 million under six grants and 12 non-guaranteed loans, of which U.S.$956
million was undisbursed as at that date.
As at 31 March 2021, Pakistan's outstanding debt to China amounted to U.S.$14,180 million.

75
European Union (replacing the second paragraph set out under caption “Public Debt – Relationship with
Multilateral and Bilateral Creditors – European Union” on page 184 of the Offering Circular)
As at 31 March 2021, the EU had commitments totalling U.S.$854 million under 27 grants, of which U.S.$683
million remained undisbursed as at that date.
France (replacing the text set out under caption “Public Debt – Relationship with Multilateral and Bilateral
Creditors – France” on page 184 of the Offering Circular)
As at 31 March 2021, France had commitments totalling U.S.$814 million under six grants and 11 non-
guaranteed loans, of which U.S.$556 million was undisbursed as at that date.
As at 31 March 2021, Pakistan's outstanding debt to France amounted to U.S.$1,529 million.
Japan (replacing the text set out under caption “Public Debt – Relationship with Multilateral and Bilateral
Creditors – Japan” on page 184 of the Offering Circular)
Japan provides support to Pakistan through its Official Development Assistance programme (ODA). ODA
loans are extended mostly for basic economic and social infrastructure projects. As at 31 March 2021, Japan
had commitments with respect to an active portfolio of grants and non-guaranteed loans totalling U.S.$540
million under 15 grants and four non-guaranteed loans, of which U.S.$211 million was undisbursed as at that
date.
As at 31 March 2021, Pakistan's outstanding debt to Japan amounted to U.S.$5,416 million.
Saudi Arabia (replacing the text set out under caption “Public Debt – Relationship with Multilateral and
Bilateral Creditors – Saudi Arabia” on page 184 of the Offering Circular)
As at 31 March 2021, Saudi Arabia had commitments totalling U.S.$4,001 million under nine grants and eight
non-guaranteed loans, of which U.S.$2,717 million was undisbursed as at that date.
As at 31 March 2021, Pakistan's outstanding debt to Saudi Arabia amounted to U.S.$954 million.
United Arab Emirates (replacing the second paragraph set out under caption “Public Debt – Relationship
with Multilateral and Bilateral Creditors – United Arab Emirates” on page 184 of the Offering Circular)
The UAE provided U.S.$2.0 billion in financial assistance to Pakistan through two U.S.$1.0 billion deposits
made by the Abu Dhabi Fund for Developments with the SBP in January and March 2019. The first of these
deposits matured in January 2021 and was rolled over in full. The second deposit maturing in March 2021 was
also rolled over.
United Kingdom (replacing the second paragraph set out under caption “Public Debt – Relationship with
Multilateral and Bilateral Creditors – United Kingdom” on page 184 of the Offering Circular)
As at 31 March 2021, the UK had commitments totalling U.S.$2,481 million under 16 grants, of which
U.S.$588 million was undisbursed as at that date. As at 31 March 2021, Pakistan's outstanding debt to the UK
amounted to U.S.$5 million.
United States (replacing the text set out under caption “Public Debt – Relationship with Multilateral and
Bilateral Creditors – United States” on pages 184 and 185 of the Offering Circular)
In September 2010, the U.S. government and Pakistan signed the Pakistan Enhanced Partnership Agreement
(PEPA), under which the U.S. government committed to provide Pakistan with U.S.$7.5 billion by 2014 in
the form of non-repayable grants. Sectors that benefited from the assistance included energy security, food
security, social development and affected areas. Subsequently, the duration of PEPA has been extended to
2023. The U.S. government and Pakistan also signed an Assistance Agreement (AAG) in 2009 with a total
grant of U.S.$120 million. The U.S. government, through the United States Agency for International
76
Development, made commitments of U.S.$4,377 million under PEPA and AAG from 2010 to June 2021
on a grant basis, of which U.S.$3,718 have already been disbursed for the implementation of various
projects.
Currently, the United States Agency for International Development is funding 14 government-to-
government projects under PEPA with total Commitment of U.S.$1.05 billion, of which U.S.$789 million
have already been disbursed as of 31 March 2021.
Other creditors (replacing the text set out under caption “Public Debt – Relationship with Multilateral and
Bilateral Creditors – Other creditors” on page 185 of the Offering Circular)
Other principal sources of bilateral foreign economic assistance include Germany (with commitments of
U.S.$564 million as at 31 March 2021, of which U.S.$307 million was undisbursed), South Korea (with
commitments of U.S.$343 million as at 31 March 2021, of which U.S.$321 million was undisbursed) and
Kuwait (with commitments of U.S.$139 million as at 31 March 2021, of which U.S.$32 million was
undisbursed).
77
GENERAL INFORMATION
Significant Change
(deleting and replacing the second paragraph set out in the section entitled “General Information—Significant
Change” on page 210 of the Base Prospectus in its entirety)
There has been no significant change in the tax and budgetary systems, gross public debt, foreign trade and
balance of payments, foreign exchange reserves, financial position and resources, income and expenditure
figures of the Issuer since 31 March 2021.
Litigation
(deleting and replacing the second paragraph set out in the section entitled “General Information—
Litigation” on page 210 of the Base Prospectus in its entirety)
With the exception of a dispute between the Issuer and Tethyan Copper Company Pty Limited, discussed in
“The Islamic Republic of Pakistan – Significant Litigation”, the Issuer is not, nor has it been, involved in any
governmental, legal or arbitration proceedings (including any such proceedings which are pending or
threatened of which the Issuer is aware) in the 12 months preceding the date of this Offering Circular
Supplement which may have, or have had in such period, a significant effect on the financial position of the
Issuer.