BALL D L - The Subject Matter Preparation of Prospective Mathematics Teachers


The Preparation of Mathematics Teachers in Australia
Meeting the demand for suitably qualified mathematics teachers in secondary schools
Report prepared for
Australian Council of Deans of Science
Kerri-Lee Harris and Felicity Jensz Centre for the Study of Higher Education
The University of Melbourne
July 2006

ISBN 0 7340 3661 2 ISBN 0 7340 3662 0 (electronic/internet copy) © Centre for the Study of Higher Education, University of Melbourne 2006. Except as provided by the Copyright Act 1968, no part of this publication may be reproduced, stored in a retrieval system or transmitted in any form or by any means without the prior written permission of the publisher. This report was commissioned by the Australian Council of Deans of Science

i
Contents Contents ............................................................................................................................... i List of Tables and Figures................................................................................................... ii Foreword ............................................................................................................................ iv Executive Summary ........................................................................................................... vi Acknowledgements ............................................................................................................ ix Chapter 1: Context of the study .......................................................................................... 1 Chapter 2: The study’s purpose, methodology and resulting dataset ................................ 2
2.1 Purpose ...............................................................................................................................2 2.2 Survey method.....................................................................................................................2 2.3 The dataset..........................................................................................................................4
Chapter 3: The distribution of mathematics teaching in schools ........................................ 7 3.1 The number of mathematics teachers in schools.................................................................7 3.2 The teaching patterns of mathematics teachers ................................................................10
Chapter 4: Suitable preparation for teaching mathematics – the views of heads of mathematics departments................................................................................................. 15
4.1 Necessary levels of tertiary study for mathematics teachers .............................................16 4.2 Heads of mathematics’ rating of school strength in mathematics teaching........................18
Chapter 5: Mathematics teachers – tertiary qualifications and subsequent training ........ 20 5.1 Undergraduate and postgraduate qualifications ................................................................20 5.2 Mathematics teaching method studies...............................................................................21 5.3 Mathematics studies ..........................................................................................................23 5.4 Teachers perceptions of their tertiary preparation .............................................................25 5.5 Ongoing professional development for practising teachers ...............................................30 5.6 Tertiary qualifications of mathematics teachers – a summary ...........................................32
Chapter 6: Mathematics teachers – demographic characteristics and employment histories............................................................................................................................. 33
6.1 Location and sector representation in mathematics teachers survey ................................33 6.2 Demographics – age and gender.......................................................................................35 6.3 Employment histories ........................................................................................................37 6.4 The teachers of junior, middle and senior schools mathematics classes...........................42
Chapter 7: Recruiting and retaining suitably qualified mathematics teachers .................. 44 7.1 The issues for schools .......................................................................................................44 7.2 The career plans of mathematics teachers in secondary schools......................................48
Chapter 8: What attracts people to a career in mathematics teaching?........................... 54 8.1 Mathematics teachers' original motivations. ......................................................................54 8.2 Suggestions for attracting more people to mathematics teaching......................................56
Chapter 9: Conclusions..................................................................................................... 58 Appendix 1: Schools surveyed – additional information...................................................................60 Appendix 2: Senior school mathematics subjects............................................................................63 Appendix 3: Demographics of mathematics teachers – additional information................................64 Appendix 4: Mathematics teachers original motivations – additional information ............................65
References........................................................................................................................ 66

ii
List of Tables and Figures Chapter 2 Table 2.1 Number of responses from teachers, heads and schools: grouped by state/territory. ...... 4 Box 1: Definitions of selected terms as applied within this report...................................................... 6 Chapter 3 Table 3.1 Responses to survey of heads of mathematics, grouped by state/territory. ...................... 8 Figure 3.1 Number of mathematics teachers per school, as reported by heads of mathematics
departments. ............................................................................................................................. 9 Table 3.2 Number of mathematics teachers per school, as reported by each school’s head of
mathematics.............................................................................................................................. 9 Table 3.3 Comparison of mathematics teacher numbers for New South Wales, Queensland and
Victoria, grouped by ARIA....................................................................................................... 10 Table 3.4 Senior school mathematics subjects offered by the schools surveyed, as reported by
heads of mathematics departments. ....................................................................................... 11 Table 3.5 The number of respondents teaching the various combinations of junior, middle and
senior school mathematics, their average age and years of teaching experience .................. 12 Table 3.6 The number of respondents teaching the various combinations of junior, middle and
senior school science, and their patterns of non-mathematics teaching ................................. 13 Table 3.7 Range of teaching responsibilities of mathematics teachers, shown as the average
number of different subjects taught – grouped by state. Results drawn from survey of 2924 teachers of mathematics. ........................................................................................................ 14
Table 3.8 Comparison of patterns of teaching for mathematics teachers of New South Wales, Victoria and Queensland......................................................................................................... 14
Chapter 4 Table 4.1 Heads of mathematics departments’ assessment of the necessary level of mathematics
(disciplinary) study for teachers of mathematics, by year level ............................................... 16 Table 4.2 Heads of mathematics departments’ assessment of the necessary level of mathematics
teaching methods study for teachers of mathematics, by year level ....................................... 16 Table 4.3 Heads of mathematics’ rating of their schools mathematics teaching in terms of the
disciplinary knowledge of teaching staff .................................................................................. 18 Table 4.4 Heads of mathematics’ rating of their schools mathematics teaching in terms of
mathematics teaching skills of teaching staff .......................................................................... 18 Chapter 5 Table 5.1 Tertiary qualifications held by mathematics teachers...................................................... 21 Table 5.2 Number of units of mathematics teaching methods studied, grouped by teaching at each
school level ............................................................................................................................. 22 Table 5.3 Number of units of mathematics teaching methods studied, grouped according to senior
school mathematics teaching.................................................................................................. 22 Figure 5.1 Tertiary mathematics teaching method studies of mathematics teachers, grouped by age
…………………………………………………………………………………………………………..23 Table 5.4 Highest year level of university mathematics study, grouped according to school level
teaching .................................................................................................................................. 23 Figure 5.2 Tertiary mathematics studies of mathematics teachers, grouped by age …..…………...24 Figure 5.3 The proportion of teachers’ university study that involved mathematics units, by
university year level - (Years 1 – 3)......................................................................................... 25 Table 5.5 Degree qualifications of teachers, grouped by their level of mathematics study at
university................................................................................................................................. 25 Table 5.6 Teachers’ perceptions of their university studies as preparation for their current teaching
roles ........................................................................................................................................ 26 Figure 5.4 Teachers’ perceptions of their university studies as preparation for their current teaching
roles, grouped by mathematics (disciplinary) studies at university.......................................... 27 Figure 5.5 Teachers’ perceptions of their university studies as preparation for their current teaching
roles, grouped by mathematics teaching methods units studied at university......................... 27 Table 5.7 Teachers’ comments regarding their university studies as preparation for teaching....... 28 Table 5.8 Teachers’ comments regarding professional development ............................................. 31 Chapter 6 Table 6.1 Responses received to the survey of mathematics teachers, grouped by state/territory. 34 Table 6.2 Responses received to the survey of mathematics teachers, grouped by state/territory x
sector, and state/territory x ARIA category.............................................................................. 34

iii
Table 6.3 Average age of secondary school mathematics teachers, grouped by state and sector .35 Figure 6.1 Age distribution of secondary school mathematics teachers ..........................................35 Figure 6.2 Age distribution of secondary school mathematics teachers, by school sector ..............36 Figure 6.3 Age distribution of teachers in government secondary schools: teachers generally (all
disciplines), 2003; and mathematics teachers, 2005. ..............................................................37 Table 6.4 Gender characteristics of secondary school mathematics teachers, grouped by sector..37 Figure 6.4 Age distribution of secondary school mathematics teachers, by gender ........................38 Table 6.5 Mean and median age of mathematics teachers, by gender ...........................................38 Table 6.6 Years of teaching experience, by state/territory...............................................................39 Figure 6.5 Distribution of age and years of experience for mathematics teachers. .........................39 Figure 6.6 Age distribution of early career teachers, grouped by teaching experience....................40 Figure 6.7 Distribution of teaching experience of teachers, presented by gender ...........................40 Table 6.7 Employment history of mathematics teachers .................................................................41 Figure 6.8 Employment history of mathematics teachers, grouped by: years of teaching experience;
and age....................................................................................................................................41 Table 6.8 Career plans of early career teachers, grouped according to previous employment .......42 Table 6.9 Characteristics of teachers of different levels of mathematics ........................................43 Table 6.10 Characteristics of three groups of teachers with restricted patterns of mathematics
teaching: non-senior school only; senior school only; and intermediate/advanced senior school only. .........................................................................................................................................43
Chapter 7 Table 7.1 Schools experiencing difficulty recruiting mathematics teachers, grouped by state.........45 Figure 7.1 Schools reporting difficulty in recruiting mathematics teachers, expressed as a
proportion of the total number of schools responding per ARIA category................................45 Table 7.2 Career plans of mathematics teachers, grouped by state................................................48 Table 7.3a Profile of the group of 1298 teachers who intended to continue mathematics teaching
until at least 2010.....................................................................................................................49 Table 7.3b Profile of the group of 452 teachers who intended to leave the teaching profession
before 2010..............................................................................................................................49 Table 7.3c Profile of the group of 1133 teachers who were undecided about their career paths.....49 Table 7.4 Teachers’ comments regarding their career plans for five years time..............................50 Figure 7.2 Career plans of mathematics teachers for the next five years, grouped by: age; years of
experience; and mathematics teaching. ..................................................................................53 Chapter 8 Table 8.1 Teachers’ motivation for joining the teaching profession .................................................55 Table 8.2 Teachers’ motivation for joining the teaching profession, grouped by sector and gender55 Table 8.3 Suggestions for attracting people to mathematics teaching as a career, offered by
mathematics teachers and heads of mathematics...................................................................57 Appendices Table A1.1 Number of responses from teachers, heads and schools, grouped by state/territory and
ARIA code................................................................................................................................60 Table A1.2 Number of responses from schools: grouped by state/territory and country/metropolitan
classification. ...........................................................................................................................61 Table A1.3 Number of responses from schools: grouped by school size. .......................................61 Table A1.4 Number of responses from schools: grouped by year levels offered.............................62 Table A2.1 Categorisation of senior school mathematics subjects..................................................63 Table A3.1 Age of mathematics teachers by experience, showing female percentage of total .......64 Table A4.1 Original attraction to the profession of teaching, grouped by state and sector ..............65
iv
Foreword The range of fields that require mathematical and statistical sophistication extends far beyond the sciences, into engineering, medicine, business, agriculture and economics, for example. Furthermore, successful application of mathematics and statistics today requires new conceptual understanding, and computational skills that capitalise on the availability of tools such as graphing and statistical packages and computer algebra systems. Hence more students must be attracted to studying mathematics for longer, and it is of great importance to the nation that teachers of mathematics know their discipline well, are up to date with it, and know how to inspire their students.
Unfortunately, teachers who trained in mathematics many years ago are unlikely to have acquired a sufficiently modern view of their discipline at university, or to have kept abreast of the current tools and techniques that are more recently available.
Following our commissioned study of the qualifications and views of secondary science teachers and heads of science departments about their science background, Who’s Teaching Science: Meeting the demand for qualified science teachers in Australian secondary schools1, the Australian Council of Deans of Science (ACDS) commissioned the Centre for the Study of Higher Education at the University of Melbourne to do a similar study for mathematics.
In some ways, the results of the study for mathematics may be slightly more encouraging than those for science, especially physics. For example, three quarters of teachers of senior (Year 11 and 12) mathematics had studied some mathematics to third year at university, whereas only 57% of senior physics teachers had a physics major. This still leaves one in four teachers of senior mathematics without any third year mathematics study at university. Further it could well be that a proportion of those with third year mathematics did not have a full major. Even more worrying, one in twelve of all mathematics teachers studied no mathematics at university and one in five of all mathematics teachers studied no mathematics beyond first year.
This data, along with the changing face of modern mathematics, explains why forty per cent of those teaching at the moment were dissatisfied with their mathematics preparation as mathematics teachers. Fewer than half of the teachers were confident that they would be teaching mathematics in five years times.
The study also confirms that many mathematics teachers will retire over the next 10 years, and so recruitment of (well-qualified) mathematics teachers is very important. In this regard, the report's findings are also worrying. Three quarters of schools report difficulties in recruiting suitably qualified mathematics teachers now, particularly in Queensland. These problems can only get worse in the short to medium term because fewer students are studying mathematics at school at advanced levels (Participation in Year 12 Mathematics Across Australia 1995-20042) and retirements will increase.
The ACDS regards the updating of mathematics skills for practising teachers as a major and important problem that requires concerted responses from universities, and State and Federal Governments. It also stresses the need for universities, and State and Federal Governments to act together to increase the supply of well-qualified mathematics teachers.
1 Prepared by Kerri-Lee Harris, Felicity Jensz and Gabrielle Baldwin, Centre for the Study of Higher Education, 2005, and available at http://www.acds.edu.au/teachsci.pdf 2 Prepared by Frank Barrington, Australian Mathematical Sciences Institute, 2006, and available at http://www.ice-em.org.au/pdfs/Participation_in_Yr12_Maths.pdf

v
Recommendations: The Australian Council of Deans of Science calls on State and Federal governments, as well as secondary and tertiary education authorities, to:
1. Take note of this report;
2. Implement rigorous workplace planning to ensure that sufficient numbers of suitably qualified teachers of mathematics and science are available to nurture future generations of school students;
3. Cooperate across sectoral, State and Territory boundaries to develop a national science and mathematics teacher workforce plan;
4. Work with the university sector (particularly Deans of Education) and state government education departments to develop international best practice in science and mathematics teacher education programmes;
5. Adopt minimum standards, focused on science as well as pedagogy, of qualifications for science and mathematics teachers at the various levels of secondary school education;
6. In the medium term, introduce a meaningful accreditation mechanism for science and mathematics teachers, involving minimum qualification levels in science as well as pedagogy;
7. Implement bonded teaching scholarships to encourage students to enrol in combined science, mathematics and education programs.
Professor Tim Brown (President)
Australian Council of Deans of Science

vi
Executive Summary This report examines the characteristics of mathematics teaching in Australian secondary schools – the demographics and qualifications of the teachers involved, their teaching responsibilities, and the issues for schools with regard to teacher supply and quality. The objective is to determine the current status of mathematics teaching in order to inform the decision-making processes of governments, universities and education authorities with regard to mathematics education and teacher training.
The project’s findings draw upon a nationwide survey of mathematics teachers and heads of mathematics departments in secondary schools conducted in late 2005. All mainstream secondary schools were included in the survey, with the permission of the relevant education authorities. Responses were received from 2924 teachers of mathematics and 612 heads of mathematics, representing 30 per cent of the nation’s secondary schools. The resulting dataset is representative in terms of state/territory, school sector and country/metropolitan regions.
The results of this study highlight the urgent need to prepare more people for mathematics teaching in schools. Three in four schools currently experience difficulty recruiting suitably qualified teachers for mathematics classes, and the impending retirement of the ‘baby-boomers’ is set to exacerbate this situation. In addition, many younger teachers are unsure of their career plans and so may also be lost from the system in the next few years.
Preparation for mathematics teaching needs to be highly discipline-specific. Mathematics teachers typically cover a broad range of mathematics subjects, with limited involvement in teaching non-mathematics subjects. They therefore require a strong tertiary grounding in mathematics knowledge, skills, and teaching methods specific to mathematics. Teachers tell us this themselves – those with the highest levels of attainment in tertiary mathematics are the most satisfied with their qualifications.
Mathematics, unlike science, is a subject studied by virtually all students throughout their school years. Schools therefore need to staff a large number of mathematics classes. As teachers teaching ‘out-of-field’ are not well equipped to teach mathematics, the challenge for schools lies in recruiting and retaining suitably qualified and motivated mathematics teachers. The challenge for universities, governments and education authorities is to ensure the supply of such teachers – teachers with the strong, mathematics-specific grounding necessary to teach mathematics well.
Tertiary qualifications of mathematics teachers • Ninety per cent of teachers held a teaching-related qualification, ranging from
teaching certificates to diplomas and bachelor degrees in education. The most common qualification combination was a bachelor degree in science with a Diploma of Education.
• Teachers with science-based degrees had, on average, studied more discipline-based mathematics than teachers holding a bachelor degree in education.
• Seventy-five per cent of teachers of senior school mathematics held a mathematics major.
• Mathematics teachers with the highest levels of mathematics-related tertiary study were the most satisfied with their tertiary preparation. Forty per cent of teachers were not satisfied with their tertiary background as preparation for their current teaching roles.
• Eight per cent of mathematics teachers had studied no mathematics at university. One in five teachers had not studied mathematics beyond first year, including 23 per cent of junior school teachers.
• Many teachers had studied no mathematics teaching methods, including one third of those who taught only junior/middle school.
• Teachers under 30 years of age were significantly less likely than their older colleagues to hold a mathematics major or to have studied mathematics teaching methods.

vii
• Heads of mathematics expressed lower levels of satisfaction with their schools’ junior school teaching than with teaching at other year levels. While the specified level varied, most heads expected teachers of junior school to have studied some mathematics at university. Ten per cent of junior school teachers had not. Seventeen per cent of junior school teachers had not studied mathematics teaching methods, yet this was deemed essential by nearly all heads.
• The expectations of most heads of mathematics for middle school mathematics teachers to have studied to second year university were met by 83 per cent of teachers.
• Heads of mathematics’ expectations of tertiary study were highest for teachers of senior school mathematics, and this was the most highly qualified group of teachers. A major in mathematics was the minimum required by 60 per cent of heads, and another 20 per cent expected senior teachers to have studied mathematics at higher levels. However, one in four senior school teachers lacked a mathematics major, including 17 per cent of teachers of intermediate and advanced senior school mathematics.
Recruiting and retaining suitably qualified mathematics teachers • Three in four schools reported difficulties recruiting suitably qualified
mathematics teachers. Schools received numerous applications for advertised positions but few applicants had the necessary mathematics background to teach mathematics, particularly at senior school level.
• Schools in more remote regions reported the greatest difficulty. Among the large eastern states, recruitment was a particular challenge for Queensland schools.
• The shortage of available mathematics teachers was seen as a relatively recent and growing problem, predicted to worsen as experienced teachers retire in coming years.
• Early career teachers were more likely than their colleagues to have been employed elsewhere prior to taking a teaching position, suggesting this is an increasingly common career pathway for mathematics teachers. Half the teachers with less than 5 years of teaching experience had taken such a path. These teachers were more confident that they would continue teaching, than were their ‘first profession’, early career peers.
Demographics and teaching experience of mathematics teachers • The average age of mathematics teachers was 44 years, with a median age of
46 years. Thirty-eight per cent of teachers were at least 50 of age, and 15 per cent were 55 or older.
• Male teachers were older and had more years of teaching experience than their female colleagues.
• Mathematics teachers from government schools were older than their colleagues in the non-government sector. Teachers in Catholic schools were youngest, with a median age of 43 years.
• Teaching was the first profession for three in four mathematics teachers. • Two thirds of the teachers had more than ten years experience, and 18 per cent
had been teaching for more than 30 years. There were also a large number of early career teachers – 17 per cent of teachers had been teaching for fewer than five years.
• Teachers of junior school mathematics were, on average, younger and less experienced than their colleagues.
• Teachers of advanced senior mathematics are most likely to be male, highly experienced and among the least likely to teach non-mathematics subjects.
Career plans of mathematics teachers • Fewer than half the teachers surveyed were confident that they would be
teaching mathematics in five years time. Sixteen per cent stated that they would be leaving teaching, and another 39 per cent were undecided.
• Most of the teachers committed to continue teaching had at least ten years teaching experience, and 40 per cent had been teaching for at least twenty
viii
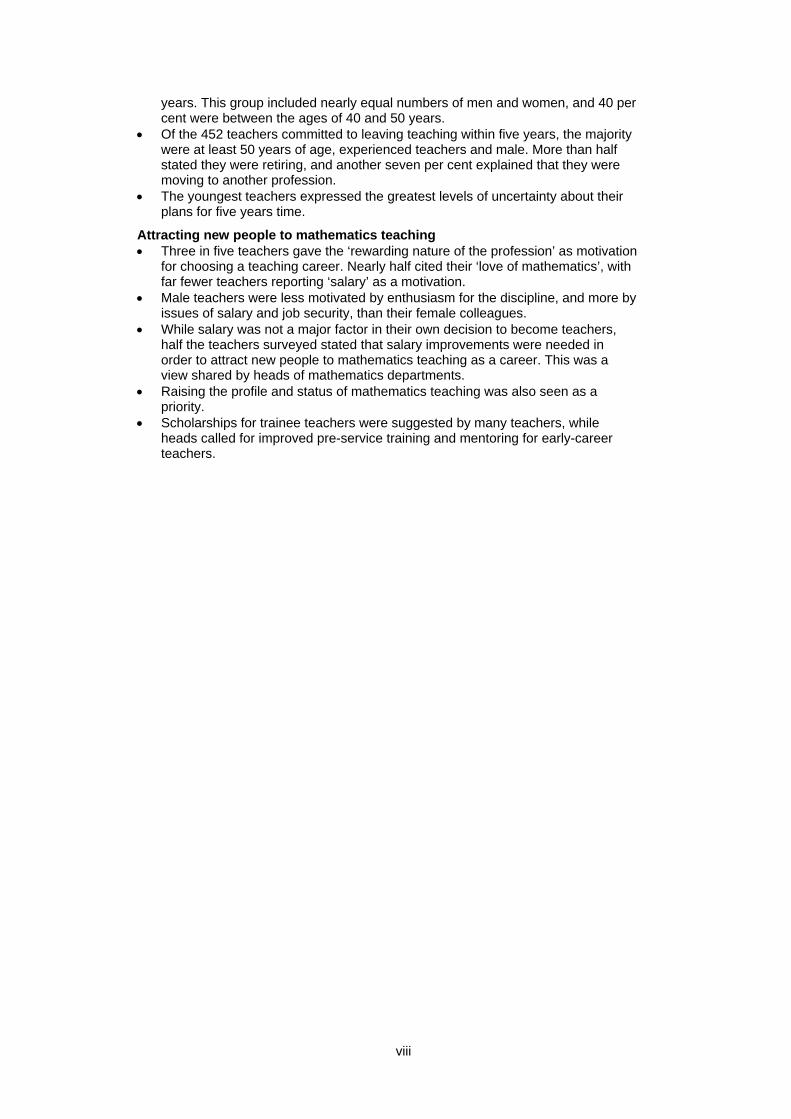
years. This group included nearly equal numbers of men and women, and 40 per cent were between the ages of 40 and 50 years.
• Of the 452 teachers committed to leaving teaching within five years, the majority were at least 50 years of age, experienced teachers and male. More than half stated they were retiring, and another seven per cent explained that they were moving to another profession.
• The youngest teachers expressed the greatest levels of uncertainty about their plans for five years time.
Attracting new people to mathematics teaching • Three in five teachers gave the ‘rewarding nature of the profession’ as motivation
for choosing a teaching career. Nearly half cited their ‘love of mathematics’, with far fewer teachers reporting ‘salary’ as a motivation.
• Male teachers were less motivated by enthusiasm for the discipline, and more by issues of salary and job security, than their female colleagues.
• While salary was not a major factor in their own decision to become teachers, half the teachers surveyed stated that salary improvements were needed in order to attract new people to mathematics teaching as a career. This was a view shared by heads of mathematics departments.
• Raising the profile and status of mathematics teaching was also seen as a priority.
• Scholarships for trainee teachers were suggested by many teachers, while heads called for improved pre-service training and mentoring for early-career teachers.

ix
Acknowledgements This report was prepared by the Centre for the Study of Higher Education at the University of Melbourne, at the invitation of the Australian Council of Deans of Science.
We would like to thank Connie Yuen for her many hours of research assistance, Malcolm Anderson for his assistance with data analysis, and Professor Richard James and other CSHE colleagues for their assistance and support.
We express particular gratitude to Professor Tim Brown (Dean of Science, Australian National University) for his input as representative of the nation’s Deans of Science. The feedback and suggestions provided by Ms Jan Thomas, Executive Officer, Australian Mathematical Sciences Institute is gratefully acknowledged. We also appreciate the feedback and support provided by Barry Kissane as President of the Australian Association of Mathematics Teachers.
Special thanks are offered to the state and territory education departments, Catholic dioceses and independent schools that granted us permission to conduct the research.
Finally, we wish to thank the many mathematics teachers and the heads of mathematics who participated in the survey. We recognise that schools are often asked to take part in research of various kinds, and appreciate that so many of the nation’s teachers made time to provide us with considered comments and suggestions. Kerri-Lee Harris Felicity Jensz July 2006

x

1
Chapter 1: Context of the study In recent years a number of studies have raised concerns about the current and future supply of mathematics and science teachers in Australia’s secondary schools. In particular, the review chaired by Professor Kwong Lee Dow, Australia’s Teachers: Australia’s Future3 highlighted the need for comprehensive statistics relating to teacher workforce trends and teacher education.
In 2004, and in response to the recommendations of Australia’s Teachers: Australia’s Future, the Australian Council of Deans of Science commissioned the Centre for the Study of Higher Education to conduct a study into science teaching in Australian secondary schools4. The resulting report, Who’s Teaching Science?, described the qualifications, teaching patterns, demographics and career plans of science teachers, including teachers of senior school biology, chemistry and physics. Mathematics teaching, however, was not included in the science study.
Ensuring the quality of mathematics teaching in Australia’s schools is a recognised priority of both state and federal governments. A recent report from the Victorian Government’s Education and Training Committee detailed an inquiry into mathematics and science education that included an examination of teacher supply and demand, and teacher quality in Victoria5. In 2005, the Australian Government’s Department of Education, Science and Training commissioned a study into mathematics and ICT education in primary and secondary non-metropolitan schools6. The present study sought to complement such studies through a nationwide survey of secondary schools, with a focus on mathematics teaching and teachers.
As the present report reveals, high quality mathematics teaching requires that teachers are well equipped with knowledge and skills in both mathematics as a discipline, and mathematics teaching methods. Mathematics teachers tend to specialise in mathematics teaching, further suggesting that out-of-field teaching is not a viable option for staffing mathematics classes. This study contributes new findings on the staffing patterns of mathematics teaching in schools, and the challenges faced by schools in recruiting and retaining mathematics teachers. It provides new information on the characteristics, career plans and attitudes of mathematics teachers that might assist in the training, recruitment and retention of future teachers. In addition, the report provides information on the professional development requirements of mathematics teachers. The project’s findings are presented around five themes:
• The distribution of mathematics teaching in schools, including the number of people teaching mathematics and the range of subjects they teach (Chapter 3).
• The tertiary qualifications of mathematics teachers: the levels of study deemed necessary by heads of mathematics departments (Chapter 4); teachers actual qualifications; their satisfaction with their tertiary preparation for their current teaching roles; and their attitudes toward ongoing professional development (Chapter 5).
• The demographic characteristics and employment histories of mathematics teachers (Chapter 6).
• The supply of mathematics teachers, including recruitment difficulties experienced by schools and the career plans of mathematics teachers (Chapter 7).
• The factors attracting people to a career in mathematics teaching (Chapter 8).
3 DEST (2003a) 4 Harris, Jensz & Baldwin (2005) 5 Education and Training Committee, Parliament of Victoria (2006) 6 SiMERR (Project in progress)

2
Chapter 2: The study’s purpose, methodology and resulting dataset
2.1 Purpose The purpose of the study was to investigate the supply and qualifications of mathematics teachers in Australian secondary schools, and possible strategies for attracting more, suitably qualified people to the teaching profession. The study was informed by the 2003 review, Australia’s Teachers: Australia’s Future, chaired by Professor Kwong Lee Dow, that called for the collection of comprehensive statistics relating to teachers, teacher workforce trends and teacher education, noting in particular a gap in the information available for specific fields of study7. The review recommended that research be undertaken into the working lives of teachers, their intentions and motivations, and the ways in which conditions of schooling and employment might enhance the attractiveness of careers in teaching.
Like the Who’s Teaching Science? study, the present study has collected information on teacher demographics, motivations, tertiary qualifications and career plans. It differs from the science study in that teachers were asked to distinguish their tertiary study of mathematics teaching methods from their other mathematics studies. They were also asked to comment on how well they believed their study prepared them for their current teaching role, and the value of ongoing professional development.
The project examined the following questions: 1 How is mathematics teaching distributed between teachers of mathematics in secondary
schools? 2 What tertiary preparation do heads of mathematics departments in schools deem appropriate
for teachers of mathematics? 3 What are the tertiary qualifications of mathematics teachers, including levels of disciplinary and
teaching methods studies? 4 To what extent are mathematics subjects in secondary schools being taught by teachers
appropriately qualified in the discipline? 5 Do teachers of mathematics feel prepared for their current teaching role, and what are their
views on professional development? 6 Do the demographic characteristics, employment histories and career plans of mathematics
teachers provide insight into future recruitment needs and necessary workforce planning? 7 Are schools currently experiencing difficulties recruiting suitably qualified mathematics
teachers? 8 What factors originally attracted people into the teaching profession, and what incentives will
ensure a supply of suitably qualified mathematics teachers into the future?
2.2 Survey method The study involved two questionnaire-based surveys distributed to secondary schools across Australia:
• Survey of mathematics teachers; and
• Survey of heads of mathematics departments.
Rather than take a sampling approach to school selection, the study sought to involve all mainstream secondary schools in Australia (see Appendix 1 for details). Special purpose schools such as hospital schools were omitted. Written consent to invite schools to participate was obtained from the relevant governing bodies of government and Catholic schools. Three Catholic diocese, involving 23 schools, did not respond to our request and these schools were therefore excluded from the survey. Independent schools were approached directly. 7 DEST 2003a p96

3
2.2.1 Questionnaire distribution
Each school in the survey group was sent one package containing documents for the Principal, for the head of mathematics, and for mathematics teachers. In addition to copies of heads’ and teachers’ questionnaires, the package included various letters of invitation and envelopes for the confidential return of individual responses. The process at schools involved three steps of ‘permission’, as follows: 1. Letter of invitation to Principal, requesting that the documents be passed on to the head of
mathematics if the Principal gave permission for the school’s involvement; 2. Letter of invitation and questionnaire for the head of mathematics. Heads were asked to distribute
letters and questionnaires to all people teaching mathematics in their school. 3. Multiple letters of invitation and questionnaires for mathematics teachers.
Questionnaires were distributed to schools in a rolling mail out between October 2005 and December 2005, in response to the receipt of permission from the relevant agencies. The one exception was government schools of Western Australia. Permission from Western Australia’s Department of Education and Training was received in February 2006, and questionnaires distributed immediately thereafter with the express request for participants to respond to the survey ‘as if it were 2005’.
In total, survey packages were distributed to 2808 schools. Responses were received from thirty per cent of schools (n=841; further details in Section 2.3).
2.2.2 Survey of heads of mathematics departments From heads of school mathematics departments we sought a ‘school-wide’ perspective. Heads of mathematics provided information on:
• the number of people teaching mathematics at the school; • the mathematics units offered and, if appropriate, the reasons for not offering units; • views on the strengths of the mathematics and teaching skills of the mathematics teachers at
the school; • views on the minimum level of university mathematics and teaching methods background
that a teacher ought to have completed to be equipped to teach mathematics at various year levels;
• the ease or otherwise of recruiting and retaining suitably qualified mathematics teachers; and • views and suggestions on strategies and possibilities for attracting appropriately qualified
people to mathematics teaching.
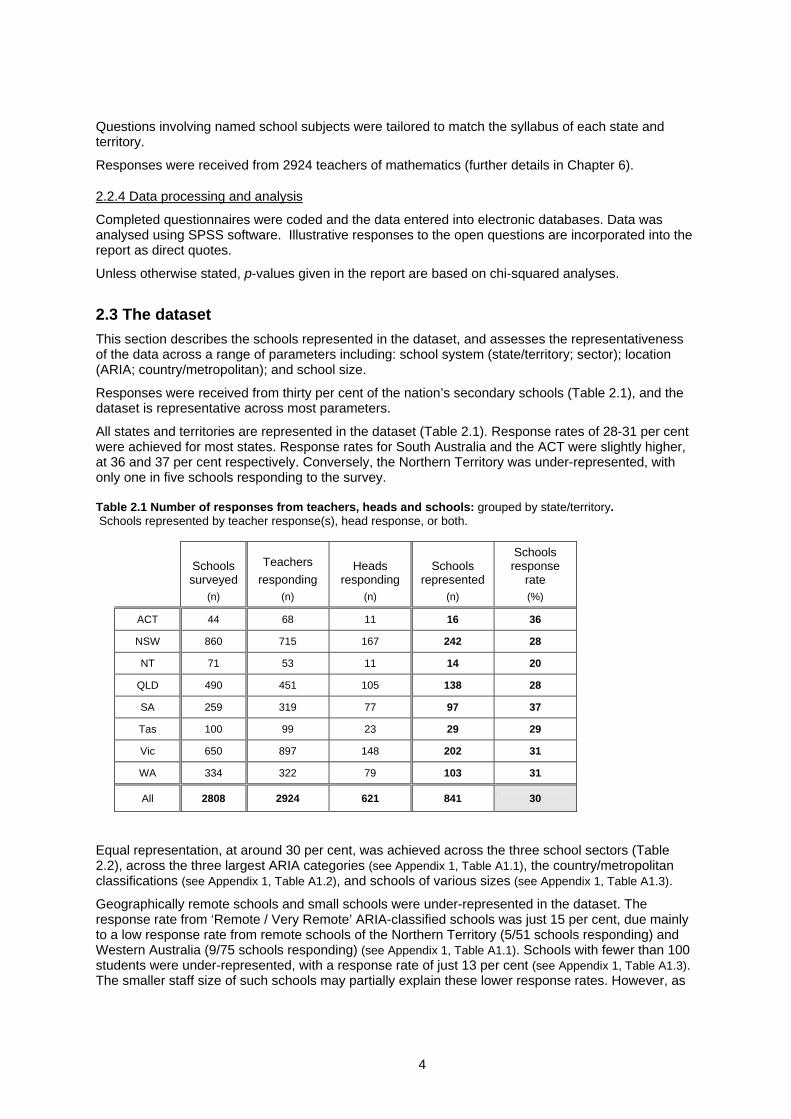
Questions involving named school subjects were tailored to match the syllabus of each state and territory.
Responses were received from 621 heads of mathematics departments (further details in Chapter 3).
2.2.3 Survey of mathematics teachers
The survey of mathematics teachers sought information on teachers, directly, by asking them to describe their:
• mathematics and other teaching ; • highest tertiary education qualifications; • university study of mathematics teaching methods; • university study of mathematics; • sex and age; • years of teaching experience in secondary schools; • previous employment; • motivation for joining the teaching profession; • views on the effectiveness of their tertiary study in preparation for their current teaching role; • views on continuing professional development, including specification of the types of
professional development deemed most helpful; • career plans for five years from the date of the survey (ie. 2010); and • views and suggestions on strategies and possibilities for attracting appropriately qualified
people to mathematics teaching.
4
Questions involving named school subjects were tailored to match the syllabus of each state and territory.
Responses were received from 2924 teachers of mathematics (further details in Chapter 6).
2.2.4 Data processing and analysis
Completed questionnaires were coded and the data entered into electronic databases. Data was analysed using SPSS software. Illustrative responses to the open questions are incorporated into the report as direct quotes.
Unless otherwise stated, p-values given in the report are based on chi-squared analyses.
2.3 The dataset This section describes the schools represented in the dataset, and assesses the representativeness of the data across a range of parameters including: school system (state/territory; sector); location (ARIA; country/metropolitan); and school size.
Responses were received from thirty per cent of the nation’s secondary schools (Table 2.1), and the dataset is representative across most parameters.
All states and territories are represented in the dataset (Table 2.1). Response rates of 28-31 per cent were achieved for most states. Response rates for South Australia and the ACT were slightly higher, at 36 and 37 per cent respectively. Conversely, the Northern Territory was under-represented, with only one in five schools responding to the survey. Table 2.1 Number of responses from teachers, heads and schools: grouped by state/territory. Schools represented by teacher response(s), head response, or both.
Schools surveyed
(n)
Teachers responding
(n)
Heads responding
(n)
Schools represented
(n)
Schools response
rate (%)
ACT 44 68 11 16 36
NSW 860 715 167 242 28
NT 71 53 11 14 20
QLD 490 451 105 138 28
SA 259 319 77 97 37
Tas 100 99 23 29 29
Vic 650 897 148 202 31
WA 334 322 79 103 31
All 2808 2924 621 841 30
Equal representation, at around 30 per cent, was achieved across the three school sectors (Table 2.2), across the three largest ARIA categories (see Appendix 1, Table A1.1), the country/metropolitan classifications (see Appendix 1, Table A1.2), and schools of various sizes (see Appendix 1, Table A1.3).
Geographically remote schools and small schools were under-represented in the dataset. The response rate from ‘Remote / Very Remote’ ARIA-classified schools was just 15 per cent, due mainly to a low response rate from remote schools of the Northern Territory (5/51 schools responding) and Western Australia (9/75 schools responding) (see Appendix 1, Table A1.1). Schools with fewer than 100 students were under-represented, with a response rate of just 13 per cent (see Appendix 1, Table A1.3). The smaller staff size of such schools may partially explain these lower response rates. However, as
5
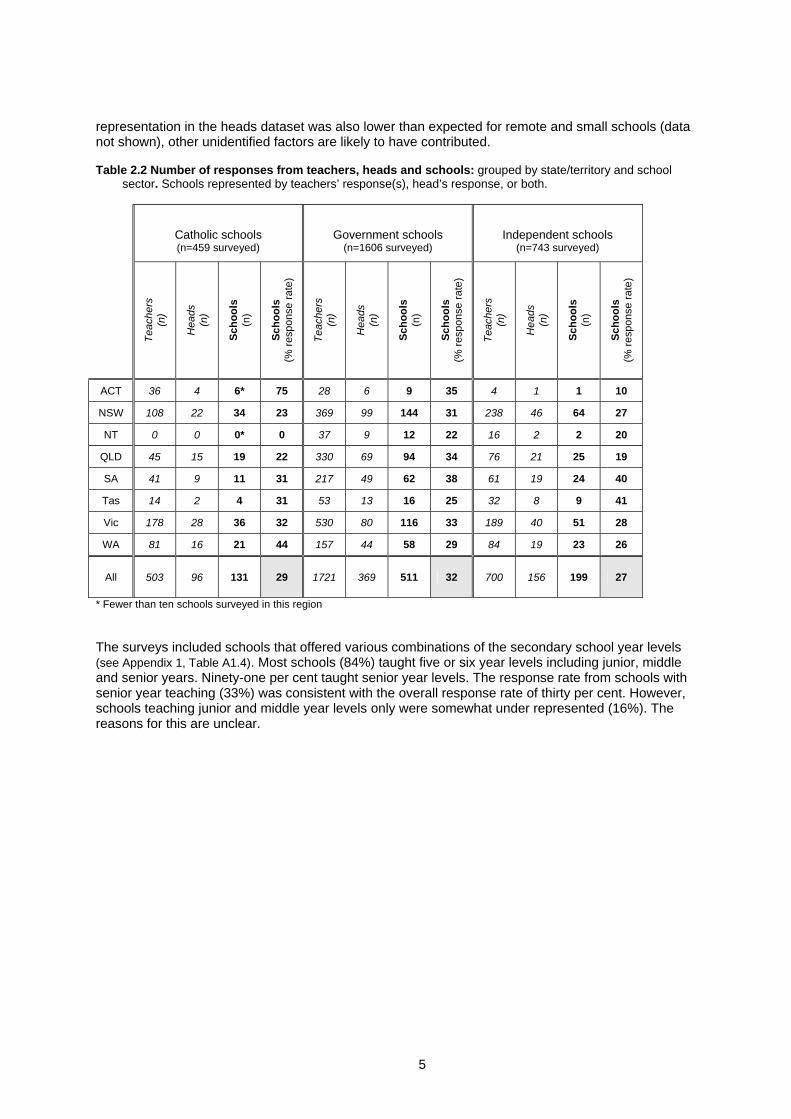
representation in the heads dataset was also lower than expected for remote and small schools (data not shown), other unidentified factors are likely to have contributed. Table 2.2 Number of responses from teachers, heads and schools: grouped by state/territory and school
sector. Schools represented by teachers’ response(s), head’s response, or both.
Catholic schools (n=459 surveyed)
Government schools (n=1606 surveyed)
Independent schools (n=743 surveyed)
Teac
hers
(n
)
Hea
ds
(n)
Scho
ols
(n)
Scho
ols
(%
resp
onse
rate
)
Teac
hers
(n
)
Hea
ds
(n)
Scho
ols
(n)
Scho
ols
(%
resp
onse
rate
)
Teac
hers
(n
)
Hea
ds
(n)
Scho
ols
(n)
Scho
ols
(%
resp
onse
rate
)
ACT 36 4 6* 75 28 6 9 35 4 1 1 10
NSW 108 22 34 23 369 99 144 31 238 46 64 27
NT 0 0 0* 0 37 9 12 22 16 2 2 20
QLD 45 15 19 22 330 69 94 34 76 21 25 19
SA 41 9 11 31 217 49 62 38 61 19 24 40
Tas 14 2 4 31 53 13 16 25 32 8 9 41
Vic 178 28 36 32 530 80 116 33 189 40 51 28
WA 81 16 21 44 157 44 58 29 84 19 23 26
All 503 96 131 29 1721 369 511 32 700 156 199 27
* Fewer than ten schools surveyed in this region The surveys included schools that offered various combinations of the secondary school year levels (see Appendix 1, Table A1.4). Most schools (84%) taught five or six year levels including junior, middle and senior years. Ninety-one per cent taught senior year levels. The response rate from schools with senior year teaching (33%) was consistent with the overall response rate of thirty per cent. However, schools teaching junior and middle year levels only were somewhat under represented (16%). The reasons for this are unclear.
6
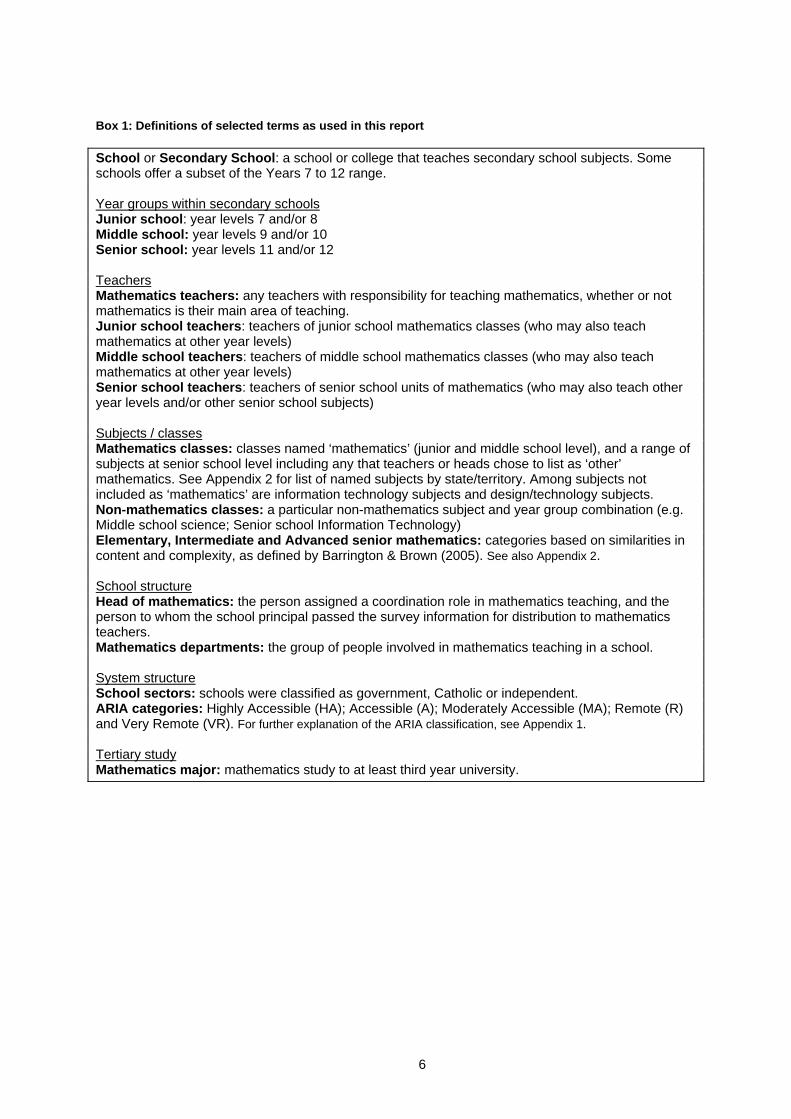
Box 1: Definitions of selected terms as used in this report School or Secondary School: a school or college that teaches secondary school subjects. Some schools offer a subset of the Years 7 to 12 range. Year groups within secondary schools Junior school: year levels 7 and/or 8 Middle school: year levels 9 and/or 10 Senior school: year levels 11 and/or 12 Teachers Mathematics teachers: any teachers with responsibility for teaching mathematics, whether or not mathematics is their main area of teaching. Junior school teachers: teachers of junior school mathematics classes (who may also teach mathematics at other year levels) Middle school teachers: teachers of middle school mathematics classes (who may also teach mathematics at other year levels) Senior school teachers: teachers of senior school units of mathematics (who may also teach other year levels and/or other senior school subjects) Subjects / classes Mathematics classes: classes named ‘mathematics’ (junior and middle school level), and a range of subjects at senior school level including any that teachers or heads chose to list as ‘other’ mathematics. See Appendix 2 for list of named subjects by state/territory. Among subjects not included as ‘mathematics’ are information technology subjects and design/technology subjects. Non-mathematics classes: a particular non-mathematics subject and year group combination (e.g. Middle school science; Senior school Information Technology) Elementary, Intermediate and Advanced senior mathematics: categories based on similarities in content and complexity, as defined by Barrington & Brown (2005). See also Appendix 2. School structure Head of mathematics: the person assigned a coordination role in mathematics teaching, and the person to whom the school principal passed the survey information for distribution to mathematics teachers. Mathematics departments: the group of people involved in mathematics teaching in a school. System structure School sectors: schools were classified as government, Catholic or independent. ARIA categories: Highly Accessible (HA); Accessible (A); Moderately Accessible (MA); Remote (R) and Very Remote (VR). For further explanation of the ARIA classification, see Appendix 1. Tertiary study Mathematics major: mathematics study to at least third year university.
7
Chapter 3: The distribution of mathematics teaching in schools This chapter describes the distribution of mathematics teaching in schools, including the number of mathematics teachers per school, their range of teaching responsibilities, and differences in the pattern of staffing between schools in different states. This data is essential for workforce planning, and yet is not readily available from existing data sources.
Section 3.1 describes the numbers of mathematics teachers per school and the differences observed between different state/territory systems. This data was collected through the heads of mathematics survey, which asked heads to list the number of mathematics teachers at their school irrespective of whether mathematics constituted all or only part of each person’s teaching responsibility. As an introduction to this section, the heads dataset is described in terms of state-based representation.
Section 3.2 describes the pattern of teaching responsibilities of mathematics teachers, including the range of mathematics and other subject teaching. This data was collected from teachers directly. As an introduction to this section, the pattern of mathematics subject offerings by schools is presented. This information was collected from heads of mathematics.
While some demographic information is included, the demographics of mathematics teachers is covered more extensively in Chapter 6.
In summary: • Schools had, on average, eleven people involved in mathematics teaching per school. • Most schools offered elementary and intermediate senior school mathematics, while less than
two-thirds offered advanced senior mathematics. • Mathematics teachers taught a broad range of year levels. • Fifty per cent of mathematics teachers also taught other subjects. • Most teachers of senior school mathematics taught only mathematics. • New South Wales schools had fewer mathematics teachers per school, and these teachers
taught a broader range of mathematics subjects. They were also less likely to teach non-mathematics subjects.
• The state-based differences in the size of mathematics departments were independent of school size and geographic location.
3.1 The number of mathematics teachers in schools
3.1.1 Schools represented in the heads dataset
Responses to the survey of heads of mathematics departments were received from 621 schools, representing all states and sectors (Table 3.1). The number of responses received from each state/territory reflected the size of the school system in that state/territory, with the possible exceptions of the Northern Territory and South Australia. The response rate for all other states and territories was between 19 and 26 per cent. The Northern Territory was under represented at 16 per cent and South Australia over represented at nearly 30 per cent.

8
Table 3.1 Responses to survey of heads of mathematics, grouped by state/territory
Responses received to survey of heads of mathematics departments in schools
Responses received (1 per school)1
n
As proportion of heads dataset (n=621)
%
As proportion of schools surveyed in each state/territory
%
ACT 11 1.8 25.0
NSW 167 26.9 19.4
NT 11 1.8 15.5
QLD 105 16.9 21.4
SA 77 12.4 29.7
Tas 23 3.7 23.0
Vic 148 23.8 22.8
WA 79 12.7 23.7
All 621 100 22.1
1Five schools returned multiple responses to the heads survey. In these cases, the responses were consolidated into a single response for each school.
3.1.2 The number of mathematics teachers per school
On average, schools had eleven people teaching mathematics, ranging from single-teacher departments (n=10) to schools with more than 30 mathematics teachers (n=8) (Fig. 3.1).
Although not specifically asked to report the relative mathematics teaching ‘loads’ of teachers in their schools, nearly one in ten heads did elaborate. Of these, 54 per cent stated that the majority of mathematics teachers in their schools taught mathematics exclusively, while another 30 per cent stated that this was true for fewer than half their mathematics teachers.
State-based differences
There were significant state-based differences in the size of mathematics departments (p<0.001). Schools in New South Wales reported fewer teachers per school, while Victoria and Queensland schools had the highest numbers (Table 3.2; Fig. 3.2). Table 3.2 is based on the result of a direct question asked in the survey of heads of mathematics departments. This data is supported by the pattern of state-based responses received from teachers – responses per school were highest from Victoria (mean 4.6), and lowest from New South Wales (mean 3.15).
Neither school size nor geographic accessibility could explain the small number of mathematics teachers per school in New South Wales:
School size There was no difference between the enrolment size of schools representing New South Wales, Victoria or Queensland (p>0.05). Therefore, the difference in the number of mathematics teachers per school was not explained by school size. Geographic ‘remoteness’ The lower number of mathematics teachers per school in New South Wales did not correlate with geographic remoteness. Responses from ‘Highly Accessible’ (ARIA) schools in NSW had, on average, 9 teachers per school compared to 14 and 15 for Queensland and Victoria respectively (Table 3.3)

9
0
50
100
150
200
250
<5 5 to 9 10 to 14 15 to 19 >19number of mathematics teachers per school
Figure 3.1 Number of mathematics teachers per school, as reported by heads of mathematics
departments Table 3.2 Number of mathematics teachers per school, as reported by each school’s head of
mathematics number of mathematics teachers per school total <5 5 to 9 10 to 14 15 to 19 > 19 mean
ACT 11 0 5 3 2 1 11.27
NSW 165 16 92 48 7 2 8.45
NT 11 1 5 5 0 0 8.55
QLD 102 5 29 34 16 18 12.76
SA 75 14 24 23 12 2 9.76
TAS 23 4 11 5 3 0 8.17
VIC 144 17 34 33 29 31 13.53
WA 77 14 34 24 4 1 8.44
608 71 234 175 73 55 total
(100%) (12%) (38%) (29%) (12%) (9%)
Compared to their counterparts in Victoria and Queensland, mathematics teachers in New South Wales taught a broader range of mathematics subjects and were less likely to teach non-mathematics subjects (see Section 3.2; Table 3.7). Mathematics teachers in New South Wales were also more likely to have studied mathematics to third year or beyond at university (p<0.001; see Chapter 5 for further details).

10
0.0%
10.0%
20.0%
30.0%
40.0%
50.0%
60.0%
number of mathematics teachers per school
New South Wales
Queensland
Victoria
New South Wales 9.7% 55.8% 29.1% 4.2% 1.2%Queensland 4.9% 28.4% 33.3% 15.7% 17.6%Victoria 11.8% 23.6% 22.9% 20.1% 21.5%
<5 5 to 9 10 to 14 15 to 19 >19
Figure 3.2 Distribution of mathematics teacher numbers per school for New South Wales, Queensland and Victoria. Table 3.3 Comparison of mathematics teacher numbers for New South Wales, Queensland and Victoria,
grouped by ARIA.
Highly Accessible Accessible Moderately Accessible
number of teachers (mean) n (schools)
number of teachers (mean) n (schools)
number of teachers (mean) n (schools)
NSW 9.04 120 7.53 36 5.44 9
VIC 14.7 121 9.78 18 5.89 9
QLD 13.81 71 13.6 11 9.39 18
3.2 The teaching patterns of mathematics teachers Section 3.2.1 details the pattern of subject offerings of the schools surveyed, based on the responses from heads of mathematics, before Section 3.2.2 describes the teaching patterns of the mathematics teachers surveyed.
3.2.1 Subjects offered by schools at senior school level
Heads of mathematics were asked to indicate the senior school mathematics subjects offered by their schools. Elementary and Intermediate mathematics were taught by the majority of schools (Table 3.4) (see Appendix 2 for details of subject classifications). In contrast, advanced mathematics was offered by just 64 per cent of the schools surveyed. There are indications that this was due to lower student demand. Half of the heads whose schools offered elementary and intermediate mathematics, but not advanced mathematics (n=81/155), cited ‘insufficient demand from students’ as the reason, while only six cited ‘shortage of qualified teachers’. Barrington and Brown (2005) estimated that, in 2005, just 25,000 students studied advanced mathematics at Year 12 – compared to an estimated 100,000 to study elementary mathematics.
3.2.2 Teaching patterns of mathematics teachers
Most (91%) of the teachers responding to the survey were employed in schools that taught senior school, and 85 per cent were from schools offering five or six year levels including junior, middle and senior years.
The majority of mathematics teachers taught mathematics at multiple school levels (Table 3.5). For example, one third taught either junior plus middle school or middle plus senior school. Another third

11
Table 3.4 Senior school mathematics subjects offered by the schools surveyed, as reported by heads of mathematics departments.
Senior school mathematics subjects1
Proportion of surveyed schools offering this subject
(%)
Elementary mathematics 87.2
Intermediate mathematics 94.0
Advanced mathematics 63.8
Combinations of seniors school mathematics subjects
Proportion of surveyed schools offering this subject
combination (%)
Elementary only 3.7
Intermediate only 2.8
Elementary and Intermediate only 27.5 Elementary, Intermediate and
Advanced 56.0
Intermediate and Advanced only 7.6
Advanced only 0.2 none
(offered only ‘other’ senior mathematics subjects)
2.1
1Categories based on those described by Barrington & Brown (2005) – see Appendix 2 for details.
taught at all three school levels. Most (73%) were involved in senior school teaching, but only ten percent were teaching only senior school.
This ‘broad’ pattern of teaching in mathematics contrasts with the findings from a previous study undertaken into secondary school science teaching8. Science teachers in secondary schools were more likely to teach only senior school (21% science, cf 10% for mathematics) and less likely to teach across all school levels (17% for science, cf 35% for mathematics).
Almost 50 per cent of mathematics teachers taught non-mathematics subjects and one in four taught senior school subjects other than mathematics (Table 3.6). The non-mathematics subjects most commonly taught by mathematics teachers were junior and middle school science (18% & 19% of teachers, respectively).
Teachers of senior school mathematics were the least likely to be involved in non-mathematics teaching (37%; n=779/2116), and this was particularly true for the large group of mathematics teachers who taught across all school levels. Fewer that thirty per cent of these teachers were involved in teaching subjects other than mathematics (n=285/1021; Table 3.6).
As reported in Section 3.1, the teaching patterns of mathematics teachers in New South Wales differed from their peers in the other two largest states, Victoria and Queensland. On average, mathematics teachers in New South Wales schools taught a broader range of mathematics subjects and were less likely to teach non-mathematics subjects (Tables 3.7 & 3.8). Nearly 30 per cent taught both intermediate and advanced mathematics at senior school level (cf 5% Vic & 12% QLD), and only 25 per cent taught non-mathematics subjects (cf 64% QLD & 62% Vic) (Table 3.8). These differences cannot be accounted for by differences in school year ranges. For each state, the majority of teachers responding to the survey were from schools offering junior, middle and senior school subjects (NSW 90%; Vic 80%; QLD 95%).
8 Harris, Jensz & Baldwin (2005) Table 3.6, page 11.

12
Table 3.5 The number of respondents teaching the various combinations of junior, middle and senior school mathematics, their average age and years of teaching experience
Combinations of junior, middle and senior school mathematics taught by individual
teachers
solid block = ‘taught’ empty (white) = ‘not taught’
Junior school n=1730
Middle school n=2022
Senior school n=1992
Number of teachers1, followed by percentage of
all2 respondents (n) (%)
Mean age (years)
Mean teaching
experience (years)
273 9.41 39.1 11.6
343 11.82 42.1 14.5
169 5.83 43.5 16.3
178 6.14 43.3 17.3
613 21.13 45.6 19.4
304 10.48 46.6 21.4
1021 35.19 44.3 17.6
29012 100.00 44.0 17.3
185 per cent of responding teachers were from schools teaching all year levels (ie junior, middle and senior). See also Table 3.6 223 teachers responding to the survey did not list mathematics subjects among their teaching responsibilities at the time of the survey

13
Table 3.6 The number of respondents teaching the various combinations of junior, middle and senior
school mathematics, and their patterns of non-mathematics teaching
Non mathematics teaching proportion of teachers
(%)
Junior school
Middle school
Senior school
Mathematics teaching - combinations of various school
levels taught by individual teachers
Non
e
Sci
ence
Tech
nolo
gy
Sci
ence
Tech
nolo
gy
Bio
logy
Che
mis
try
Phy
sics
any1
n 1515 517 109 544 118 74 152 187 742
all mathematics teachers n=2924
% 51.8 17.7 3.7 18.6 4.0 2.5 5.2 6.4 25.4
Junior school n=1815
Middle school n=2146
Senior school n=2116
10.3 53.5 11.7 34.1 7.3 9.2 9.5 3.3 37.4
32.9 35.6 6.1 31.8 5.0 1.7 2.6 3.8 21.3
18.9 15.4 5.3 40.8 13.0 2.4 8.9 8.9 43.2
40.4 28.1 7.3 18.5 5.6 3.4 8.4 8.4 34.3
59.4 4.7 1.3 17.1 3.3 1.8 5.1 8.8 26.1
54.3 4.3 1.0 10.2 4.6 4.3 7.9 12.2 39.5
72.1 12.4 2.1 9.5 1.3 0.8 2.9 4.1 13.9 1including both science and non-science subjects

14
Table 3.7 Range of teaching responsibilities of mathematics teachers, shown as the average number of different subjects taught – grouped by state. Results drawn from survey of 2924 teachers of mathematics.
Range of teaching responsibilities of mathematics teachers
Number of mathematics subjects
taught (average)
Number of senior mathematics subjects
taught1 (average)
Number of non-mathematics subjects
taught (average)
All states/ territories 2.6 0.9 0.9
ACT 2.7 1.2 0.5
NSW 3.2 1.5 0.4
NT 2.2 0.5 1.1
QLD 2.6 1.0 1.4
SA 2.2 0.6 1.2
TAS 1.7 0.4 1.2
VIC 2.2 0.6 1.2
WA 2.6 0.8 0.4 1Including elementary, intermediate and advanced level subjects, but excluding additional senior mathematics such as ‘Mathematics Life Skills’ (NSW) and ‘General Mathematics’ (Vic)
Table 3.8 Comparison of patterns of teaching for mathematics teachers of New South Wales, Victoria and
Queensland
Proportion of mathematics teachers (per state) teaching the following subjects and school levels
mathematics other (non-mathematics)
J, M and S school
S school: both
intermediate and
advanced subjects
Any school level J school M school S school
NSW (n=715) 62.4% 29.2% 24.5% 15.0% 11.6% 11.9%
VIC (n=897) 19.4% 5.1% 61.5% 35.1% 31.4% 32.9%
QLD (n=451) 34.6% 11.5% 64.3% 33.7% 45.0% 39.5%
J=Junior; M=Middle; S=Senior
15
Chapter 4: Suitable preparation for teaching mathematics – the views of heads of mathematics departments One of the aims of this study was to obtain information on the tertiary qualifications of the nation’s mathematics teachers. Australia’s Teachers, Australia’s Future9 describes the need for additional and improved data collection, in specific fields of teaching, to inform workforce planning:
Building on the teacher supply and demand information gathered by MCEETYA, greatly improved national data collection and analysis, including for specific fields of teaching and geographic areas, are required. Comprehensive statistics relating to teachers and teacher workforce trends generally, and for specific fields of teaching, teacher motivations and teacher education needs to be consistently, reliably and regularly collected on a national and collaborative basis. Studies of teacher aspirations and working conditions are essential10
As the focus of both this chapter and Chapter 5 is upon the tertiary qualifications of mathematics teachers, it is necessary to first describe the situation in Australia regarding teaching accreditation.
Teaching qualifications There is no single definition of a ‘suitable qualification’ for teachers of secondary school mathematics, nor for school teachers generally. Teacher registration in Australia is the jurisdiction of states and territories, and the specifics of pre-service education requirements vary. While this has been acknowledged as both necessary and appropriate11, the need for national standards has also been recognised by State, Territory and Australian Government Ministers with responsibility for education12.
In addition to state-based differences, the growth in multiple entry pathways to teaching further complicates measurement of teacher quality and the definition of suitability of qualifications13. In response, states tend to avoid prescription of formal qualifications and instead develop professional standards and guidelines. A recently released report from the Victorian Government describes one approach to the review of teacher quality and qualifications14.
It is also recognised that formal qualifications alone cannot predict the suitability of a teacher to a particular teaching role. However, the content knowledge and pedagogical skills developed during pre-service education and training are obviously important. We would argue that the pattern of tertiary study is the best proxy currently available for measuring the preparedness of teachers for specific teaching roles.
Overview of this chapter This chapter presents the views of heads of mathematics departments in schools regarding the tertiary study necessary to prepare teachers for mathematics teaching at various school year levels. We reasoned that heads of mathematics were well placed to understand the particular needs of schools and school students. This data provides a frame of reference for Chapter 5, which details the actual tertiary qualifications of practising mathematics teachers.
Section 4.1 describes heads’ views on the necessary levels of: a) mathematics study, and b) mathematics teaching methods study, for teachers of secondary school mathematics. In summary:
• Heads’ expectations of tertiary study were highest for teachers of senior school mathematics. • Almost all heads deemed study of mathematics teaching methods essential for all
mathematics teachers. • Most heads required senior school teachers to hold at least a major in mathematics, and 19
per cent expected higher level study.
9 DEST 2003a 10 DEST 2003b page 17 11 DEST 2003a 12 MCEETYA 2003a 13 DEST 2003a 14 Education & Training Committee, Parliament of Victoria 2006

16
• The expectation of most heads was for middle school mathematics teachers to have studied mathematics to at least second year at university.
• While the specified level varied, most heads expected teachers of junior school to have studied some mathematics at university.
In addition, heads were asked to indicate their level of satisfaction with the strength of their schools’ current mathematics teaching in terms of both the disciplinary knowledge and teaching skills of staff. The responses of heads are described in Section 4.2.
In summary: • Very few heads rated the teaching strength in their schools as ‘lacking’. • Heads expressed lower satisfaction with their schools’ junior school teaching than with
teaching at other year levels.
4.1 Necessary levels of tertiary study for mathematics teachers Heads of mathematics departments recognised a need for both disciplinary knowledge and teaching methods training in the preparation of mathematics teachers. In general, heads required teachers of higher school level mathematics to have undertaken more advanced tertiary mathematics units (Table 4.1) and more units of mathematics teaching methods study (Table 4.2). Table 4.1 Heads of mathematics departments’ assessment of the necessary level of mathematics
(disciplinary) study for teachers of mathematics, by year level
Necessary year level mathematics study (% responses) School level of
mathematics teaching none first year second year third year
beyond third year
Junior school 9.9 42.3 28.0 16.9 2.9
Middle school 2.7 23.2 35.6 32.6 5.9
Senior school 0.3 3.9 15.6 61.7 18.5 * 97% heads completed this question (n=603) Table 4.2 Heads of mathematics departments’ assessment of the necessary level of mathematics
teaching methods study for teachers of mathematics, by year level
Necessary number of mathematics teaching methods units (% responses)
School level of mathematics
teaching none 1 2 > 2
Junior school 4.5 22.3 37.0 36.2
Middle school 1.4 13.7 39.0 45.9
Senior school 0.5 6.1 29.8 63.7
* 95% heads completed this question (n=589) Teachers of junior school mathematics Fewer than fifty per cent of heads of mathematics required teachers of junior school mathematics to have studied mathematics beyond first year at university (Table 4.1). A large majority (73%), however, required at least two units of mathematics teaching methods study (Table 4.2). Teachers of middle school mathematics Most (74%) heads of mathematics required teachers of middle school mathematics to have studied mathematics beyond first year at university, and nearly 40 per cent required study to at least third year (Table 4.1). Extensive grounding in teaching methods was also deemed important, with 46 per

17
cent of heads of mathematics checking the highest category listed on the questionnaire, ‘>2 units’ (Table 4.2). Teachers of senior school mathematics The overwhelming majority of heads (96%) indicated that mathematics study beyond first year university was necessary preparation for senior school mathematics teaching (Table 4.1). Most (80%) required study to at least third year, and one in five required higher-level study. Similarly, the requirement for the strongest grounding possible in teaching methods was favoured (64%), and nearly all (93%) required at least two unit of mathematics teaching methods study (Table 4.2).
Many heads (n=233) expanded on their responses with written comments. Most emphasised the need for disciplinary knowledge (29%), training in mathematics teaching skills (17%) or both (16%).
As a nation we must have people in the classroom who know the content [head of mathematics in a school with 16 mathematics teachers; required mathematics study to 1st year for junior school teachers, to 2nd year for middle school teachers, and to 3rd year for senior school teachers]
To teach with confidence a solid maths background is necessary [head of mathematics in a school with 25 mathematics teachers; required mathematics study to 2nd year university for teachers of all year levels]
How can teachers be expected to impart the skills of ‘thinking mathematically’ if they themselves have not been exposed to it? [head of mathematics in a school with 14 mathematics teachers; required mathematics study to 2nd year for junior school teachers, and to 3rd year for middle and senior school teachers]
Recent (ie last 10 years) graduates have excellent teaching methods and skills (which can be learnt on the job) but poor maths skills (which can not be learnt on the job) [head of mathematics in a school with 21 mathematics teachers; required mathematics study to 1st year for junior and middle school teachers and to 3rd year for senior school teachers; required 1 mathematics teaching method unit for all teachers]
In practice, the teaching methodology is more critical than the mathematical understanding, up to a point [head of mathematics in a school with 12 mathematics teachers; required mathematics study to 2nd year university for teachers of junior and middle school, and to 3rd year for teachers of senior school; required >2 units of mathematics teaching methods for teachers of all year levels]
Many qualified their specification of necessary levels of study by stating that level of study was not the only factor in developing effective mathematics teachers.
Many excellent teachers have had less that these and some poor teachers have had the (indicated) levels. However, in general the best (teachers) have been suitably qualified in both areas or have been outstanding teachers in another area and have had the abilities and motivation to adapt to teach mathematics well ie personal motivation [head of mathematics in a school with 23 mathematics teachers; required mathematics study to 3rd year and mathematics teaching methods study at the highest level for teachers of all school year levels]
I have master level mathematics in my degree and it doesn’t help teach 7-10. My experience and work with numeracy and working mathematically is what makes it effective. HOWEVER! I find teachers that have studied uni maths at a high level do so because they have a passion for it. This is very important. Many of our teachers are entering maths teaching because they see at as ‘easy’ or a ‘job’ [head of mathematics in a school with 5 mathematics teachers; required mathematics study for ‘0-3’ years for teachers of junior and middle school, and to 2nd year for senior school teachers]
Many excellent teachers have never studied ‘Mathematics Teaching Methods’ [head of mathematics in a school with 12 mathematics teachers; required mathematics study to 2nd year for junior school teachers, and to 3rd year for middle and senior school teachers; required 1 mathematics teaching method unit for all teachers]
Some heads of mathematics commented that while these qualifications would be ideal, they could not always be met by the teachers available.
The higher the level of math understanding the better; but we need teachers in country schools and some maths in the degree is O.K. [head with 4 mathematics teachers in school; required mathematics study to 1st year for junior school teachers, to 2nd year for middle school teachers, and to 3rd year for senior school teachers]

18
In light of the recognised differences in state/territory mathematics curricula, particularly at senior school levels15, we tested for state-based difference in the views of heads of mathematics regarding the necessary disciplinary knowledge to teach senior school mathematics. There was no difference (p>0.05). Heads of mathematics from schools in each of the five largest states (NSW, Vic, QLD, WA & SA) agreed that senior school teachers should have studied mathematics to at least third year university (range 74%-85%).
By the criteria described by heads of mathematics, many of the mathematics teachers surveyed lacked the tertiary background appropriate to their current teaching roles (see Chapter 5 for details of teachers’ qualifications). For example, among the 2116 teachers of senior school mathematics, 13 per cent had not studied mathematics beyond first year and 25 per cent had studied to second year only. While more teachers of intermediate and/or advanced mathematics did meet the heads’ criteria, 17 per cent did not meet the higher ‘standard’ of study to third year required by 80 per cent of heads.
4.2 Heads of mathematics’ rating of school strength in mathematics teaching Heads of mathematics departments were asked to rate their schools’ strength with regard to mathematics teaching at junior, middle and senior school levels. Generally, heads of mathematics were satisfied with the disciplinary knowledge and teaching skills of their mathematics teaching staff (Tables 4.3 & 4.4). Levels of satisfaction were highest for senior school teaching, with most heads of mathematics (68%; n=364/545) rating the teaching of senior classes as ‘strong’ on both counts, and 75 per cent rated the disciplinary knowledge of these teachers as strong (Table 4.3). In contrast, fewer than half the heads rated junior school teaching above ‘adequate’ in terms of both disciplinary knowledge and teaching skills (46%; 256/554), and just 52 per cent rated the teaching skills of these teachers as strong (Table 4.4).
Heads’ assessment of both junior and senior school mathematics teaching within their schools’ showed no significant difference in terms of disciplinary knowledge and teaching skills. However, there was a difference at the middle school level. Heads were significantly more satisfied with middle school teachers’ disciplinary background than with their mathematics teaching skills (respective means on 1-3 point scale of increasing satisfaction = 1.6 versus 1.5, T-test = 2.3, df = 1139, p < 0.02). Table 4.3 Heads of mathematics’ rating of their schools mathematics teaching in terms of the disciplinary
knowledge of teaching staff
Heads of mathematics’ responses to the question:
Please indicate your impression of your school’s teaching strength in mathematics skills and knowledge
(ie disciplinary knowledge)
Mathematics teaching
Strong (%)
Adequate (%)
Lacking (%)
Junior school classes (n=578) 56.2 39.8 4.0
Middle school classes (n=586) 64.0 32.1 3.9
Senior school classes (n=570) 74.7 21.2 4.0
In addition to rating their schools’ teaching on a three-point scale, heads were also invited to make written comments. Forty per cent of heads responded, contributing a total of 317 comments. While the most frequently made comments expressed satisfaction, there were also numerous expressions of concern regarding staffing.
15 Barrington & Brown 2005

19
Table 4.4 Heads of mathematics’ rating of their schools mathematics teaching in terms of mathematics teaching skills of teaching staff
Heads of mathematics’ responses to the question:
Please indicate your impression of your school’s teaching strength in mathematics teaching skills and
knowledge (ie mathematics teaching skills)
Mathematics teaching
Strong (%)
Adequate (%)
Lacking (%)
Junior school classes (n=555) 51.7 43.6 4.7
Middle school classes (n=562) 56.8 38.6 4.6
Senior school classes (n=548) 71.5 25.7 2.7
Over one third of responses (n=109/317) expressed heads’ satisfaction with their mathematics staff. Such comments included reference to mathematics knowledge, teaching skills, and levels of staff experience.
Very pleased with all maths teachers at the moment [school with 14 mathematics teachers, and head reporting strong mathematics disciplinary and teaching skills for all levels]
The maths faculty members are mostly very experienced teachers with a strong maths background [school with 15 mathematics teachers, and head reporting adequate mathematics disciplinary and teaching skills for junior school, and strong for middle school]
One in four responses (n=83/317) referred to difficulties staffing classes for specific year levels. Some heads of mathematics described difficulties recruiting teachers for senior school teaching. Others wrote of underqualified teachers at junior school level, with some commenting that all the suitably qualified teachers were based in the senior school leaving less qualified people teaching in the lower year levels. This is described further in Chapter 7, Section 7.1.
Senior school class have qualified and experienced/well skilled teachers who teach only maths. Junior classes have teachers less experienced and whose main teaching area is not maths [school with 8 mathematics teachers, and head reporting adequate mathematics teaching skills for junior school]
We have primary trained teachers being asked to teach at secondary level [school with 23 mathematics teachers, and head rating the both mathematics disciplinary and teaching skills as ‘lacking’ for junior school]
One in five responses (10% heads) expressed dissatisfaction with their staff’s teaching skills (n=64/317).
Being good at maths seems to require a lot of perseverance and practise that many do not seem prepared to undertake. How to engage junior students and cater for their learning styles is a big area of concern [school with 7 mathematics teachers, and head rating the mathematics teaching skills as ‘lacking’ for junior and middle school, and ‘adequate’ for senior school]
Some heads (5% heads; n=29/317 comments) commented that the teaching strength varied between individuals and therefore their schools’ strength was not easily rated.
Our quality of teachers at year 9-10 level varied from strong (with some) to adequate (with others). For some it is a second teaching area [school with 9 mathematics teachers, and head reporting: adequate mathematics disciplinary and teaching skills for junior and middle school; strong mathematics disciplinary and teaching skills for senior school]

20
Chapter 5: Mathematics teachers – tertiary qualifications and subsequent training The preceding chapter described the views of heads of mathematics departments regarding the preparation and training of mathematics teachers. Heads were generally of the view that teachers of senior school mathematics required the most extensive tertiary preparation, in terms of both disciplinary knowledge and teaching skills. More than half were also of the view that teachers of junior school mathematics should have studied mathematics beyond first year at university.
Chapter 5 continues the analysis of tertiary qualifications by presenting the information collect directly from mathematics teachers. Current teachers of mathematics were asked to describe their university studies in terms of:
• Diploma and degree (eg Bachelor of Science; Bachelor of Education; Diploma of Education), and higher level qualification (eg Masters or PhD) – Section 5.1;
• Number of mathematics teaching method units studied – Section 5.2; • Year level/s at which they studied mathematics and the proportions of their university studies
that comprised mathematics - Section 5.3.
The final two sections of this chapter describe teachers’ perceptions of the effectiveness of their tertiary study in preparing them for their current teaching roles (Section 5.4), and the type of in-service training most relevant to their needs (Section 5.5).
In summary: • Most teachers (91%) held a teaching-related qualification, ranging from teaching certificates
to diplomas and bachelor degrees in education. • The most common qualification combination was a bachelor degree in science with a Diploma
of Education (33%). • Some teachers, particularly teachers of junior school mathematics (17%) and younger
teachers, had studied no mathematics teaching methods. • One in five teachers had not studied mathematics beyond first year, including 23 per cent of
junior school teachers. • The majority of teachers of senior school mathematics (74%) held a major in mathematics. • Teachers with science-based degrees had, on average, studied more mathematics than
teachers holding a bachelor degree in education. • Forty per cent of teachers were not satisfied with their tertiary background as preparation for
their current teaching roles. • Mathematics teachers with the highest levels of mathematics-related tertiary study were the
most satisfied with their tertiary preparation. • Irrespective of their tertiary background or years of teaching experience, teachers valued
ongoing professional development.
5.1 Undergraduate and postgraduate qualifications Table 5.1 shows the number of mathematics teachers holding each of a range of tertiary qualifications. Most teachers held multiple qualifications.
Nearly all the mathematics teachers (91%) listed an education or teaching related qualification of some kind. Most held either a Diploma of Education or an education-specific bachelor degree (85%), while another six per cent held teaching-related certificates or diplomas.
More than half the mathematics teachers (58%) held a Diploma of Education (Table 5.1). This was most commonly in combination with a Bachelor of Science or other science-related bachelor degree (33% of all teachers). A Diploma of Education was held by most of the teachers with an arts-related

21
bachelor degree (n=220/313; 8% of all teachers) and by a minority of teachers with an education-related bachelor degree (n=112/921; 4% of all teachers). Table 5.1 Tertiary qualifications held by mathematics teachers
Tertiary qualification Number of teachers
with qualification
Proportion of all respondents
(%)1 (n=2924)
Diploma of Education 1680 57.5 other Diploma/Certificate (teaching
related) 237 8.1
Diploma/Certificate (mathematics) 44 1.5 dipl
oma
/ ce
rtific
ate
other Diploma/Certificate 142 4.9
Bachelor (science) 1378 47.1
Bachelor (education/teaching) 921 31.5
Bachelor (arts/humanities) 313 10.7
Bachelor (engineering) 83 2.8
Bachelor (commerce/economics) 69 2.4
Bachelor (mathematics) 36 1.2 bach
elor
deg
ree
other Bachelor (eg health-related) 24 0.8
Honours 328 11.2
Masters 344 11.8
PhD 36 1.2
hono
urs
/ hi
gher
deg
ree
other higher degree qualification 49 1.7 1 Most respondents listed two or more qualifications. Where two Bachelor degrees were indicated by the respondent, each is included as a discrete qualification in the frequencies above. It should be noted, however, that some of these may have been taken as combined, or ‘double’, degrees. Nearly half the mathematics teachers (45%) held a bachelor degree in science (Table 5.1), some at honours level (n=216/1326). A small number held mathematics (n=34) or science-related (n=67) higher degree qualifications.
5.2 Mathematics teaching method studies Most teachers (84%) had studied mathematics teaching methods units as part of their tertiary study (Table 5.2), and more than 60 per cent of teachers had completed more than one unit of study.
Teachers of senior school had the strongest background in this area (Table 5.2). Senior school teachers were significantly more likely to have studied more than two units, while one in three of their peers without senior teaching responsibilities had studied none (p<0.001; Table 5.3A). The difference was further exaggerated for the teachers of intermediate and advanced senior classes, with 73 per cent having studied at least two units (Table 5.3B).
Teachers reporting no mathematics teaching methods study represented a variety of degree and diploma graduates: bachelor degrees in the sciences (n=231/472), in education (n=130/472), and in arts/humanities (n=32/472); and more than half held a Diploma of Education (n=267/472).
Teachers under 30 years of age were less likely than their older colleagues to have a strong grounding in mathematics teaching method studies (p<0.001) (Fig. 5.1).

22
Table 5.2 Number of units of mathematics teaching methods studied, grouped by teaching at each
school level Mathematics teachers1
All Junior school1 Middle school1 Senior school –
any level1
Senior school - intermediate
and/or advanced level1
Number of mathematics
teaching methods units studied at
university2 n % n % n % n % n %
0 units 472 16.1 315 17.4 285 13.3 203 9.6 69 5.4
1 unit 464 15.9 281 15.5 321 15.0 308 14.6 181 14.2
2 units 730 25.0 462 25.5 556 25.9 575 27.2 363 28.4
> 2 units 1067 36.5 656 36.1 843 39.3 877 41.4 572 44.8
unknown3 191 6.5 101 5.6 141 6.6 153 7.2 93 7.3
2924 100 1815 100 2146 100 2116 100 1278 100
1 Individual teachers were included at more than one school level, according to their teaching responsibilities. See also Table 3.5 for patterns of teaching responsibilities. 2 The questionnaire included these four options as check boxes. 3 Respondent did not complete this question. Table 5.3 Number of units of mathematics teaching methods studied, grouped according to senior school
mathematics teaching
Teaching responsibility of mathematics teachers A B
Senior school – any level other
Senior school - intermediate
and/or advanced level other
Number of mathematics
teaching methods units studied at
university1 n % n % n % n %
0 units 203 9.6 269 33.3 69 5.4 403 24.5
1 unit 308 14.6 156 19.3 181 14.2 283 17.2
2 units 575 27.2 155 19.2 363 28.4 367 22.3
> 2 units 877 41.5 190 23.5 572 44.8 495 30.1
unknown2 153 7.2 38 4.7 93 7.3 98 6.0
2116 100 808 100
1278 100 1646 100
Total = 2924 teachers Total = 2924 teachers 1 The questionnaire included these four options as check boxes. 2 Respondent did not complete this question.
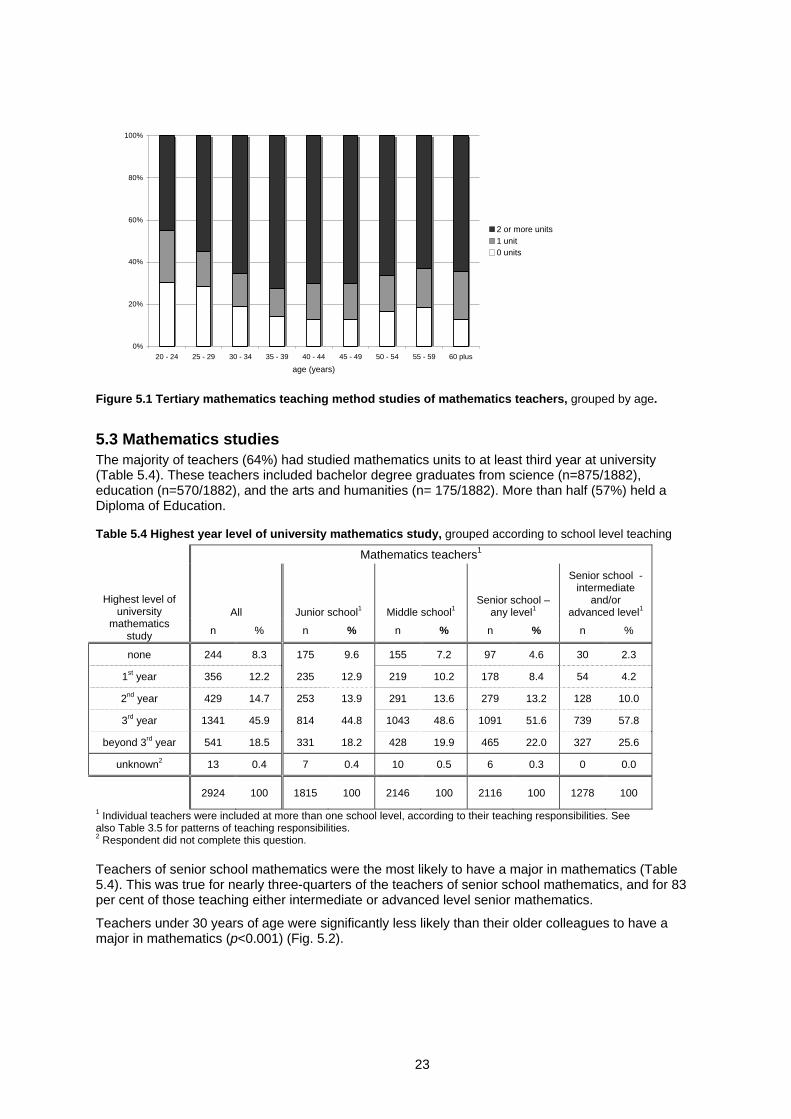
23
0%
20%
40%
60%
80%
100%
20 - 24 25 - 29 30 - 34 35 - 39 40 - 44 45 - 49 50 - 54 55 - 59 60 plus
age (years)
2 or more units1 unit0 units
Figure 5.1 Tertiary mathematics teaching method studies of mathematics teachers, grouped by age.
5.3 Mathematics studies The majority of teachers (64%) had studied mathematics units to at least third year at university (Table 5.4). These teachers included bachelor degree graduates from science (n=875/1882), education (n=570/1882), and the arts and humanities (n= 175/1882). More than half (57%) held a Diploma of Education. Table 5.4 Highest year level of university mathematics study, grouped according to school level teaching
Mathematics teachers1
All Junior school1 Middle school1 Senior school –
any level1
Senior school - intermediate
and/or advanced level1
Highest level of university
mathematics study n % n % n % n % n %
none 244 8.3 175 9.6 155 7.2 97 4.6 30 2.3
1st year 356 12.2 235 12.9 219 10.2 178 8.4 54 4.2
2nd year 429 14.7 253 13.9 291 13.6 279 13.2 128 10.0
3rd year 1341 45.9 814 44.8 1043 48.6 1091 51.6 739 57.8
beyond 3rd year 541 18.5 331 18.2 428 19.9 465 22.0 327 25.6
unknown2 13 0.4 7 0.4 10 0.5 6 0.3 0 0.0
2924 100 1815 100 2146 100 2116 100 1278 100 1 Individual teachers were included at more than one school level, according to their teaching responsibilities. See also Table 3.5 for patterns of teaching responsibilities. 2 Respondent did not complete this question. Teachers of senior school mathematics were the most likely to have a major in mathematics (Table 5.4). This was true for nearly three-quarters of the teachers of senior school mathematics, and for 83 per cent of those teaching either intermediate or advanced level senior mathematics.
Teachers under 30 years of age were significantly less likely than their older colleagues to have a major in mathematics (p<0.001) (Fig. 5.2).

24
0%
20%
40%
60%
80%
100%
20 - 24 25 - 29 30 - 34 35 - 39 40 - 44 45 - 49 50 - 54 55 - 59 60 plus
age (years)
major
less than major
Figure 5.2 Tertiary mathematics studies of mathematics teachers, grouped by age.
One in five mathematics teachers had not studied mathematics beyond first year at university (Table 5.4). This group of 600 teachers included bachelor degree graduates from sciences (n=257), education (n=186) and arts/humanities (n=41). Many (n=336) held a Diploma of Education. Most (67%) taught junior, or junior and middle school mathematics. Nearly half taught senior mathematics (n=275), but fewer were involved in teaching intermediate or advance senior mathematics classes (n=84).
As reported in Chapter 3, mathematics teachers in New South Wales were more likely to hold a mathematics major (77% NSW teachers) than their counterparts in other states (60%), including the large states of Victoria (59%) and Queensland (62%) (p<0.01).
In addition to reporting their year levels of mathematics study, teachers were asked to detail the proportion mathematics contributed to their studies. One in three teachers reported that mathematics formed at least 50 per cent of their third year (Fig. 5.3). This group of 956 teachers were significantly more likely than their peers to have studied a Bachelor of Science (Table 5.5) and less likely to have studied a Bachelor of Education (p<0.001). It is worth noting that a ‘major’ in science typically requires at least 50 per cent of the third year study to be in the specified discipline area.

25
0
10
20
30
40
50
60
70
80
90
proportion of tertiary course that was mathematics, by year level
75-100% 5.0 8.9 14.1
50-74% 19.0 21.9 18.6
25 - 49% 35.0 22.4 11.7
1-24% 8.2 6.5 4.7
none 7.7 17.4 29.3
1st year 2nd year 3rd year
Figure 5.3 The proportion of teachers’ university study that involved mathematics units, by university year
level - (Years 1 – 3). 75-80% of teachers answered these questions. Table 5.5 Degree qualifications of teachers, grouped by their level of mathematics study at university Bachelor degree
Mathematics studied at university
Science (B.Sc)
and Education
(B.Ed) Science (B.Sc)
Education (B.Ed)
Arts (B.A)1
Other, science- related
(not BSc)
Other, education- related (not
BEd)
Non-bachelor
degree (eg diploma)2 Total3
n 51 458 157 106 46 18 17 857 3rd year studies
comprising 50% or more mathematics
% 6.4 53.4 18.3 12.4 5.4 2.1 2.0 100%
n 93 455 313 116 102 31 114 1224 other
% 7.6 37.2 25.6 9.5 8.3 2.5 9.3 100% 1 Excludes teachers with combined Arts/Science degrees, as these are included under Science. Excludes teachers with combined Arts/Education degrees, as these are included under Education 2 Excludes teachers with a Bachelor degree 3 70 per cent of the teachers surveyed are covered by these qualification categories
5.4 Teachers perceptions of their tertiary preparation Forty per cent of mathematics teachers did not believe that their university studies had prepared them well for their current teaching role, and another five per cent expressed ambivalence (Table 5.6). However, nearly half the teachers surveyed (49%) were satisfied with their tertiary preparation.

26
Table 5.6 Teachers’ perceptions of their university studies as preparation for their current teaching roles
Mathematics teachers’ response to the question: Do you think that your mathematics and education
studies at university prepared you well for your current teaching role?
(%)
YES NO YES & NO did not answer
All mathematics teachers (n=2924) 48.7 39.7 4.7 6.9
Mathematics teachers, grouped by degree qualifications1
Bachelor (science) + Diploma of Education
(n=925 teachers) 47.1 40.4 6.0 6.5
Bachelor (science) (and no Diploma of Education) (n=385) 54.5 36.4 3.4 5.7
Bachelor of Education (n=869) 50.2 39.5 3.5 6.9
Mathematics teachers, grouped by mathematics teaching
responsibilities1
Senior school mathematics (any) (n=2116) 50.6 37.6 5.4 6.4
Senior school mathematics – Intermediate and/or Advanced
(n=1278) 52.7 34.7 5.9 6.7
Junior school mathematics (only) (n=273) 42.5 46.9 1.8 8.8
Middle school mathematics (and not senior school mathematics)
(n=512) 44.1 44.9 3.3 7.6
Mathematics teachers, grouped by number of non-mathematics
teaching responsibilities
(number of non-mathematics subjects taught)
0 (n=1515) 50.4 36.6 5.6 7.3
1 (n=560) 50.0 38.2 5.0 6.8
2 (n=533) 43.0 46.9 3.4 6.8
3 (n=221) 49.8 43.0 1.8 5.4
>3 (n=95) 44.2 48.4 3.2 4.2
1 Categories do not cover all possible combinations and are not necessarily discrete In an attempt to understand the basis for these different perceptions, we compared the responses of teachers grouped by: degree type (Table 5.6); university subjects studied (Fig’s. 5.4 & 5.5); current teaching responsibilities (Table 5.6); and teachers’ written explanatory comments (Table 5.7).
There was some correspondence between teachers’ perceptions of their tertiary preparation and their tertiary qualification (Table 5.6). Among teachers with a Bachelor of Science, those without a Diploma of Education were significantly more likely to respond ‘yes’ (55%) than were their peers who held a Diploma of Education (47%) (p<0.05).
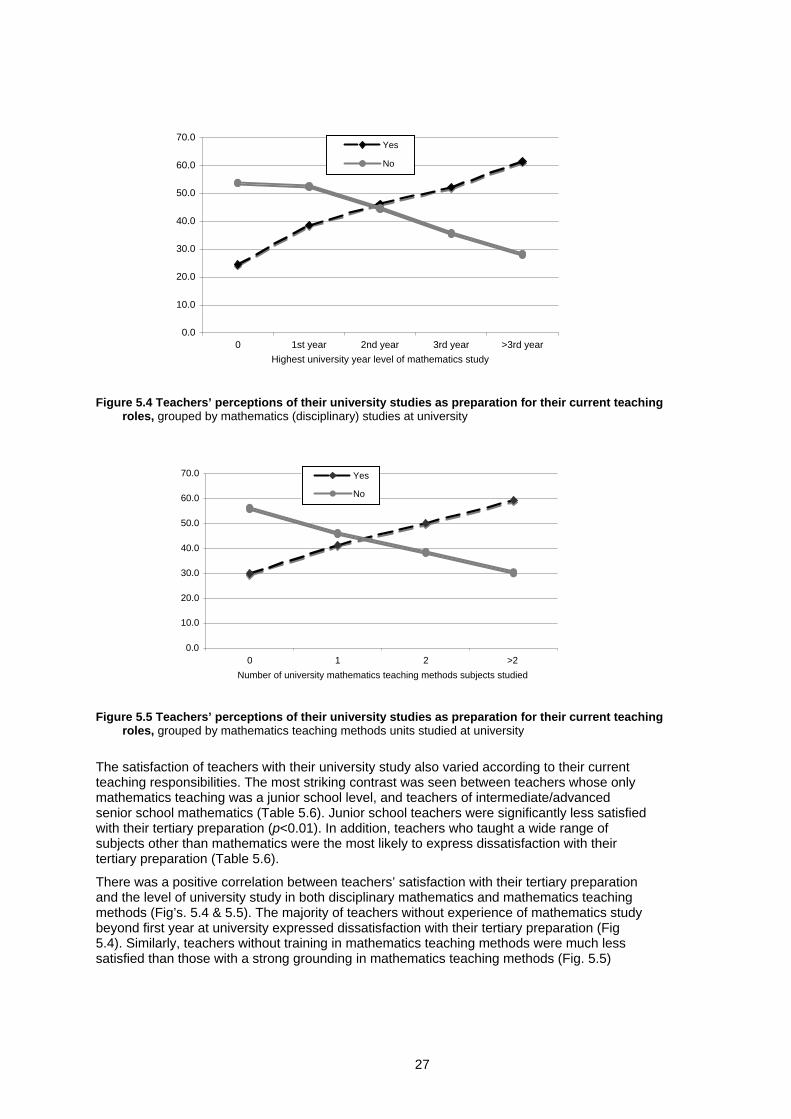
27
0.0
10.0
20.0
30.0
40.0
50.0
60.0
70.0
0 1st year 2nd year 3rd year >3rd yearHighest university year level of mathematics study
Yes
No
Figure 5.4 Teachers’ perceptions of their university studies as preparation for their current teaching
roles, grouped by mathematics (disciplinary) studies at university
0.0
10.0
20.0
30.0
40.0
50.0
60.0
70.0
0 1 2 >2 Number of university mathematics teaching methods subjects studied
Yes
No
Figure 5.5 Teachers’ perceptions of their university studies as preparation for their current teaching
roles, grouped by mathematics teaching methods units studied at university
The satisfaction of teachers with their university study also varied according to their current teaching responsibilities. The most striking contrast was seen between teachers whose only mathematics teaching was a junior school level, and teachers of intermediate/advanced senior school mathematics (Table 5.6). Junior school teachers were significantly less satisfied with their tertiary preparation (p<0.01). In addition, teachers who taught a wide range of subjects other than mathematics were the most likely to express dissatisfaction with their tertiary preparation (Table 5.6).
There was a positive correlation between teachers’ satisfaction with their tertiary preparation and the level of university study in both disciplinary mathematics and mathematics teaching methods (Fig’s. 5.4 & 5.5). The majority of teachers without experience of mathematics study beyond first year at university expressed dissatisfaction with their tertiary preparation (Fig 5.4). Similarly, teachers without training in mathematics teaching methods were much less satisfied than those with a strong grounding in mathematics teaching methods (Fig. 5.5)

28
Table 5.7 Teachers’ comments regarding their university studies as preparation for teaching Teachers’ responses to the question:
Do you think that your mathematics and education studies at university prepared you well for your current teaching role?
Broad categories: D=disciplinary mathematics TM=teaching methods P=practical
Percentage of teachers
(n=1979 teachers)1 %
Percentage of comments
(n=2823 comments)1 %
D Mathematics disciplinary knowledge and skills 23.9 16.8
TM P
Education course provided valuable practical skills 17.4 12.2
Affi
rmat
ive
com
men
ts
P Teaching placements were valuable experiences 8.3 5.8
TM Teaching methods training not helpful 19.1 13.3
P Insufficient practical advice 14.4 10.1
P Insufficient practical experience 8.4 5.9
D University mathematics not
relevant to secondary school mathematics
9.4 6.6
D Insufficient (disciplinary) mathematics studied 2.0 1.4
I was not trained to teach secondary school 2.6 1.8
Neg
ativ
e co
mm
ents
Insufficient preparation for the non-teaching aspects of my
current role (eg administration) 2.5 1.8
TM
I did not study mathematics teaching methods / I would like to have studied more mathematics
methods training
10.9 7.7
D I did not study mathematics at university 4.2 3.0
Teaching is best learned ‘on the job’ 12.8 9.0
Life experience is the best preparation 1.6 1.1 O
ther
com
men
ts
Adequate preparation for
commencing teaching, but need more/continued professional
development
4.9 3.4
1Two-thirds of the teachers surveyed provided written responses to this question (n=1979/2924). Once coded, 2823 individual responses/comments were scored and categorised.
In addition to providing an absolute ‘yes or no’ response to the question of tertiary preparation, most teachers offered written explanation (Table 5.7). In general, teachers valued their disciplinary grounding and the practical aspects of their education studies.
(Yes) – the study of mathematics (logic, lateral thinking etc., processes) directly helped. Actual topics studied were useful for personal ability and confidence [age 43yrs; teaching experience 20yrs; teaching junior, middle and senior (advanced) mathematics, and senior physics; BSc and DipEd]
(Yes) – It gave me a good technical grounding from which I was able to explore some of the history of mathematics (and become intrigued) [age 65yrs; teaching experience 43yrs; teaching junior, middle and senior (intermediate) mathematics, junior and middle science and senior chemistry; BSc (with mathematics to 3rd year) and DipEd]
(Yes) – The uni where I studied placed a heavy emphasis on classroom management, curriculum and pastoral care. They also organised practicum in a way that gradually built experience

29
(varied) and built load [age 53yrs; teaching experience 19yrs; teaching senior mathematics at all levels; BSc and postgraduate Dip Ed]
(Yes) – actually had teaching practice over a 4 year period [teacher experience 26yrs; BSc and DipEd; mathematics to 3rd year and >2 units of mathematics teaching method]
(Yes) - I had a very positive and supportive time at university. I was in schools from very early stages [teaching experience 22yrs; BSc/BEd combination and Dip Ed]
Some less satisfied teachers suggested that their education studies were inadequate or irrelevant, while others said the same of their university mathematics study.
(Yes and No) – reasonably well from a mathematics point of view but poorly in the practicalities of teaching e.g. I never did any classroom management techniques at uni [age 34yrs; teaching experience 12yrs; teaching junior school mathematics and science; BA and DipEd]
(Yes) – the degree as far as maths knowledge is concerned. DipEd – provided minimal preparation. Learning from experienced teachers in schools was most helpful [age 52yrs; teaching experience 30 yrs; teaching middle and senior (elementary and intermediate) mathematics; BSc and DipEd]
(No) – Much of the education studies lacked practicality and emphasised philosophical issues (which could have been useful, but had no context at the time). Perhaps Grad Dip Eds could be split – concentrate on the practical needs for the subject area, allow suitable lengthy time in the classroom, then come back for the philosophical units as ongoing PD [age 43yrs; teaching experience 22yrs; teaching senior elementary and advanced mathematics and senior IT; BSc and DipEd]
(No) – There was not enough practical time in the schools. Out of a total of 4 years study, I spent 12½ weeks at a school [age 37yrs; teaching experience 15yrs; teaching junior, middle and senior (elementary, intermediate and advanced) mathematics; B.Ed.]
(No) - The Maths you learn at University is different to the Maths taught in schools. Most of the knowledge and teaching skills have come through my teaching experiences. [age 30yrs; teaching experience 8yrs; middle and senior intermediate mathematics; studied mathematics to 3rd year, with mathematics subjects forming 50% of 3rd year studies]
(No) – I only completed 1st year mathematics at uni. I would need to do more study to be more confident in my understanding and explanation [age 32yrs; teaching experience 2yrs; teaching middle school mathematics and science, and senior school chemistry; BSc]
Some teachers expressed frustration at being asked to teach subjects for which they believed they were under-prepared.
(No) - As a science based teacher I was given one workshop on mathematics during my course. It was a token, as I was told I would be asked to teach junior maths wherever I was teaching [age 23 yrs; teaching experience 1yr; junior and middle school mathematics; studied no mathematics subjects at university]
(No) – It should be assumed that if you teach science you will be teaching maths, therefore during the DipEdSc, students need to be exposed to maths teaching methods [age 49yrs; teaching experience 5yrs; teaching junior school maths, and junior and middle school science; BSc and DipEd, with no mathematics teaching method units]
(No) – I trained as a science teacher with maths as a secondary consideration. I have moved into maths teaching at junior secondary in the last 5 years – therefore my maths method training in 1972 wasn’t relevant [age 55yrs; teaching experience 20yrs; teaching junior and middle school mathematics; BSc(Hons) and DipEd]
One in eight teachers commented that, ultimately, teaching skills were only really developed ‘on the job’.
(Yes) – I was prepared as well as I could be, but much of the learning is done “on the job” [age 52 yrs; teaching experience 17yrs; junior, middle and elementary senior mathematics teaching; Honours in mathematics and a DipEd]
(No) – you only learn on the dance floor. Everything else is artificial [age 43yrs; teaching experience 15yrs; teaching middle and senior (intermediate and advanced); BSc and DipEd]

30
Further analysis revealed a relationship between disciplinary comments and senior school teaching. Teachers of senior school mathematics were the group most likely to comment positively about their disciplinary grounding (18% of all senior school mathematics teachers, and 22% of those teaching intermediate or advanced mathematics; cf 10% of teachers without senior mathematics classes).
One in ten teachers wrote that they would have liked more training in mathematics teaching methods (Table 5.7). This was more prevalent among those with junior, but no senior, mathematics classes (13%, cf 5% senior mathematics teachers) and with no tertiary mathematics methods studies.
5.5 Ongoing professional development for practising teachers Mathematics teachers were asked to describe their views regarding ongoing professional development. They were also asked to specify the types of professional development that they considered most helpful.
Professional development was deemed valuable, particularly if it was practical in focus and relevant to participants (Table 5.8). While general pedagogy was favoured, so too were workshops with a disciplinary or curriculum-specific focus.
Teachers need ongoing PD, as practices are undergoing constant review and change. Pedagogy is by far the most important area [age 49yrs; teaching experience 26yrs; teaching middle school mathematics and science; BSc and DipEd, with mathematics study to 1st year]
Discipline-specific appeals most to me and I have successfully used many of the activities that have been demonstrated to me. My students have enjoyed what we have done, and I have spent minimum time out of the classroom [age 48yrs; teaching experience 26yrs; teaching junior, middle and senior (all levels) school; BSc(Ed), with mathematics study to 3rd year]
Teachers also valued structured opportunities for sharing ideas with their peers. Sit down with practising teachers and go through their lesson plans, teaching notes, markbooks and worksheets [age 53yrs; teaching experience 31yrs; teaching middle school mathematics and IT, and senior school IT; BSc, DipEd, Masters in Education, mathematics study to 3rd year]
Ongoing PD is vital. As for what – there are as many needs as there are teachers. In the end though we all live in a classroom - so PD that leads to improved environment, involvement, and fun in the classroom must be a priority [age 49yrs; teaching experience 25yrs; teaching senior mathematics (intermediate), senior biology, and junior science]
Nearly one in three teachers favoured workshops that focussed on ‘pedagogy’, teaching principles and strategies. Such comments were not associated with a particular qualification type. Teachers holding a Diploma or Bachelor of Education were as likely to make this comment as were those without an education-based qualification. Nor were these comments associated with levels of mathematics teaching methods studied, or years of teaching experience.
Similarly, the many teachers who favoured professional development with a mathematics-specific focus were from diverse tertiary backgrounds. Teachers with a Bachelor of Science were as likely to make this comment as were teachers without a science degree or those with a Bachelor of Education. There was no association with levels of mathematics study at university, nor with years of teaching experience.

31
Table 5.8 Teachers’ comments regarding professional development
Teachers’ responses to the open questions: What are your views regarding continuing professional development for practicing teachers? What types of professional development would you consider to be most
helpful (eg pedagogy; discipline-specific; administrative; other)?
Frequency of responses
Percentage of teachers1 (n=2487)
%
Percentage of responses (n=4954)
%
highly valuable / essential 653 26.3 13.2
more needed 201 8.1 4.1
Val
ue o
f on
goin
g P
D
of little use 101 4.1 2.0
general pedagogy 783 31.5 15.8
mathematics (discipline) specific 642 25.8 13.0
resource-use, including IT 463 18.6 9.3
enhancing student engagement 331 13.3 6.7
classroom management 332 13.3 6.7
curriculum-specific 206 8.3 4.2
administration 109 4.4 2.2
assessment / grading of student work 82 3.3 1.7
general (eg time and stress-management) 46 1.8 0.9
Wor
ksho
p/se
min
ar to
pics
of m
ost b
enef
it
all topics should be covered 118 4.7 2.4
must be practical and relevant 420 16.9 8.5
Effe
ctiv
e P
D
peer-learning / sharing ideas and strategies 245 9.9 4.9
time-release and/or funding for attendance 160 6.4 3.2
Oth
er
optional attendance and topic choice 62 2.5 1.3
185% of teachers (n=2487) responded to this question

32
5.6 Tertiary qualifications of mathematics teachers – a summary There was no consensus among heads of mathematics regarding the necessary level of tertiary study for teachers of mathematics. However, it is possible to compare the qualifications of mathematics teachers (as described in this chapter) with the range of heads’ views presented in Chapter 4. Teachers of junior school mathematics
- Heads of mathematics expressed lower satisfaction with their schools’ junior school teaching than with teaching at other year levels (see Section 4.2). Forty per cent of heads rated the disciplinary strength of their junior school teachers as ‘adequate’ rather than ‘strong’. Satisfaction with the teaching skills of junior school teachers was lower still, with 44 per cent giving an ‘adequate’ rating.
- While the specified level varied, most heads expected teachers of junior school to have studied some mathematics at university (see Section 4.1). Ten per cent of junior school teachers had not (Table 5.4).
- Half the heads of mathematics were satisfied with first year level mathematics study (see Section 4.1), and the majority of teachers (90%) satisfied this criterion (Table 5.4).
- Seventeen per cent of junior school teachers had not studied mathematics teaching methods (Table 5.2), yet this was deemed essential by nearly all heads of mathematics (95%; see Section 4.1).
Teachers of middle school mathematics - The expectations of most heads for middle school mathematics teachers to have studied
mathematics to second year university level (see Section 4.1) were met by 83 per cent of teachers (Table 5.4)
- Nearly 40 per cent of the heads expected teachers of middle school mathematics to have at least a major in mathematics (see Section 4.1). Thirty per cent of teachers did not meet this criterion (Table 5.4).
- Almost all heads deemed study of mathematics teaching methods essential (see Section 4.1). Thirteen per cent of teachers did not meet this criterion (Table 5.2).
Teachers of senior school mathematics - Heads’ expectations of tertiary study were highest for teachers of senior school mathematics,
and these were the most highly qualified group of teachers. - A major in mathematics was the minimum required by most heads (62%), and another 20 per
cent expected senior teachers to have studied mathematics at higher levels (see Section 4.1). However, one in four senior school mathematics teachers lacked a mathematics major, including 17 per cent of teachers of intermediate and advanced senior school mathematics (Table 5.4).
- Almost all heads required senior school mathematics teachers to have studied two units, or more, of mathematics teaching methods (see Section 4.1). More than twenty per cent of teachers had not (Table 5.3).
33
Chapter 6: Mathematics teachers – demographic characteristics and employment histories The preceding three chapters describe the pattern of mathematics teaching in schools (Chapter 3), the views of heads regarding tertiary preparation of mathematics teachers (Chapter 4) and teachers’ tertiary qualifications as provided by teachers themselves (Chapter 5). This chapter looks in more detail at who is teaching mathematics – the age and gender characteristics of mathematics teachers, and their pathways to teaching as a career. Their career plans are discussed further in Chapter 7. Chapter 6 has the following structure:
Section 6.1 - state/territory, sector and ARIA representation in the dataset of teacher responses. While some of this information also appears in Chapter 2, the emphasis here is on teacher rather than school representation.
Section 6.2 - the age and gender characteristics of the 2924 teachers surveyed. State/territory and sector-based differences are also discussed. A comparison is made with national statistics for the age of teachers generally (i.e. all disciplines), as reported elsewhere.
Section 6.3 – the employment histories of mathematics teachers, including years of teaching experience and details of previous employment.
Section 6.4 – characteristics of teachers grouped according to teaching responsibilities.
In summary: - The average age of mathematics teachers was 44.0 years, with a median of 46 years. - Thirty-eight per cent of teachers were over 49 years of age, and fifteen per cent over the age
of 54 years of age. - Nearly equivalent numbers of responses were received from male and female teachers
nationally. - Male teachers represented 58 per cent of responses from South Australia. - One in three teachers had less than ten years teaching experience, and 17 per cent had been
teaching for fewer than five years. - Male teachers were older (median age 49 years) and more experienced than female
teachers. - Teaching was the first profession for three out of four mathematics teachers. - Teachers of junior school mathematics were, on average, younger and less experienced than
their colleagues. - Teachers of advanced senior mathematics are most likely to be male, highly experienced and
among the least likely to teach non-mathematics subjects.
6.1 Location and sector representation in mathematics teachers survey Response to the survey of teachers was received from all eight states and territories, each of the three school sectors (Catholic, Government and Independent), and all ARIA categories.
Twenty-eight per cent of the nation’s secondary schools were represented, with representation ranging from 20 per cent (NT) to 36 per cent (SA) (Table 6.1). The large number of responses from Victoria and New South Wales simply reflects the size of these school systems. The number of schools represented is consistent with other states, as is the number of teachers responding per school16 (Table 6.1).
16 The high number of teacher responses per school from Victoria and low number from NSW accords with the size of mathematics departments (see Section 3.1.2)

34
Table 6.1 Responses received to the survey of mathematics teachers, grouped by state/territory.
number of responses from teachers
school representation (schools represented/ schools
surveyed)
number of teachers
responding per school
(n) (%) (n) (%) (mean)
ACT 68 2.3 16 36.4 4.25
NSW 715 24.5 227 26.4 3.15
NT 53 1.8 14 19.7 3.79
QLD 451 15.4 127 25.9 3.55
SA 319 10.9 93 35.9 3.43
TAS 99 3.4 28 28.0 3.54
VIC 897 30.7 195 30.0 4.60
WA 322 11.0 94 28.1 3.43
Total 2924 100 794 28.3 3.68
Responses were received from teachers of all three school sectors in proportions corresponding to the number of schools surveyed for each sector (Table 6.2). Larger numbers of teachers responded from the more accessible schools on the ARIA scale. This is likely to reflect the larger size of mathematics departments in these schools (see also Chapter 3; Section 3.1.2), as the number of schools represented correlates closely with the number of schools surveyed in each ARIA category (see also Appendix 1.2). Table 6.2 Responses received to the survey of mathematics teachers, grouped by state/territory x sector,
and state/territory x ARIA category
School sector ARIA classification
Catholic (n)
Govern. (n)
Independ.
(n) Highly
Accessible Accessible Moderately Accessible
Remote or Very
Remote
ACT 36 28 4 68 * * *
NSW 108 369 238 531 156 22 6
NT 0 37 16 * 33 2 18
QLD 45 330 76 302 48 79 22
SA 41 217 61 233 46 29 11
TAS 14 53 32 79 19 1 0
VIC 178 530 189 792 67 38 *
WA 81 157 84 275 22 16 9
503 1721 700 2280 391 187 66 Total
(n=2924) 17.2% 58.9% 23.9% 78.0% 13.4% 6.4% 2.3%
459 1606 743 1927 436 219 226 Schools surveyed (n=2808) 16.3% 57.2% 26.5% 68.6% 15.5% 7.8% 8.1%
*No schools surveyed

35
6.2 Demographics – age and gender
6.2.1 Age distribution of mathematics teachers The average age of the mathematics teachers responding to this study was 44.0 years, with a median age of 46 years (Table 6.3). Thirty-eight per cent of teachers were over 49 years of age, and fifteen per cent over 54 years of age (Figure 6.1). Table 6.3 Average age of secondary school mathematics teachers, grouped by state and sector
All sectors Catholic Government Independent
ACT 46.5 46.0 47.9 41.3*
NSW 44.0 42.1 45.1 43.2
NT 42.7 - 44.0 39.5*
QLD 42.4 43.3 41.6 45.1
SA 44.5 41.4 45.5 43.4
TAS 47.0 47.1* 47.4 46.4
VIC 44.0 42.6 44.1 44.9
WA 44.1 44.2 45.3 41.6
All states / territories (n=2852)1
mean (median)
44.0 (46) 43.1 (43) 44.3 (47) 43.8 (45)
*Fewer than 20 respondents 1 Most teachers (98%) answered this question
0.0
5.0
10.0
15.0
20.0
25.0
age (years)% teachers 2.9 10.1 9.1 11.1 13.1 15.9 22.4 12.3 2.5 0.6
20 - 24 25 - 29 30 - 34 35 - 39 40 - 44 45 - 49 50 - 54 55 - 59 60 - 64 65 plus
Figure 6.1 Age distribution of secondary school mathematics teachers The average age of teachers differed between states/territories (Table 6.3), ranging from a low of 42.4 years for Queensland to 47.0 years for Tasmania. The largest states, New South Wales and Victoria, were intermediate at 44.0 years of age.
The age distribution differed significantly between the school sectors (p<0.001) (Figure 6.2). Mathematics teachers from Catholic schools were the youngest group, with a median age of 43 years, contrasting with the group from government schools (median 47 years) (Table 6.3). The

36
difference was marked by a ‘spike’ in the 50-54 year bracket (Figure 6.2). Forty-two per cent of government school teachers were at least fifty years of age (cf 34% Catholic school teachers).
0
5
10
15
20
25
30
age (years)
Catholic (n=486) % 3.7 9.5 8.8 13.8 16.7 17.5 16.7 9.9 2.7 0.8
independent (n=689) % 1.6 11.0 11.2 11.3 13.2 17.9 17.7 11.3 3.6 1.2
government (n=1677) % 3.2 9.8 8.3 10.3 12.1 14.6 25.9 13.5 2.0 0.2
20 - 24
25 - 29
30 - 34
35 - 39
40 - 44
45 - 49
50 - 54
55 - 59
60 - 64
65 plus
Figure 6.2 Age distribution of secondary school mathematics teachers, by school sector Comparison with available national data for teachers generally A number of recent studies and reports have described school teaching in Australia as an ageing profession. A MCEETYA report from 200317 reports the average age of teachers to be 43.1 years (in 2002). More recently, the 2005 MCEETYA18 report on the demand and supply of teachers in Australian schools draws upon School Staffing Survey data to report that almost one third of secondary school teachers in government schools were fifty years of age or older in 2003. Only one third were under forty years of age at that time.
Figure 6.3 illustrates the age distribution of government secondary school teachers of all subjects, as reported in the MCEETYA report of 200519, alongside the data for mathematics teachers collected in the present study. The mathematics teachers were older, with 42 per cent at least fifty years of age (cf 32% for all teachers). However, as the MCEETYA data was collected two years before the mathematics data in this report, the difference must be interpreted with caution.
6.2.2 Gender characteristics of mathematics teachers Nearly equivalent numbers of responses were received from male and female teachers (Table 6.4), suggesting an equal gender ratio among teachers of mathematics nationally. This contrasts with the overall situation for secondary school teachers, where females are over represented in the workforce (55%)20.
Most states/territories also returned close to a 1:1 ratio. The two exceptions were South Australia, with 58 per cent males (p<0.01), and the ACT with 60 per cent females. The result for South Australia was statistically significant.
17 MCEETYA 2003b 18 MCEETYA 2005 19 MCEETYA 2005 20 MCEETYA 2005 (p10).

37
0
5
10
15
20
25
30
age (years)
all teachers* 3.8 8.4 10.2 10.5 14 20.8 20.4 9.3 2.5 0.1mathematics teachers 3.2 9.8 8.3 10.3 12.1 14.6 25.9 13.5 2.0 0.2
20 - 24 25 - 29 30 - 34 35 - 39 40 - 44 45 - 49 50 - 54 55 - 59 60 - 64 65 plus
Figure 6.3 Age distribution of teachers in government secondary schools: teachers generally (all
disciplines), 2003; and mathematics teachers, 2005. * ‘All teachers’ data reported in MCEETYA 2005 report, and drawn from DEST survey of school staffing (2003). Data of mathematics teachers was collected in the present study (2005).
There were also significant differences in the gender ratio of mathematics teachers between school sectors (p<0.01) (Table 6.4). Males outnumbered females in government schools, while the opposite was true for non-government schools. Table 6.4 Gender characteristics of secondary school mathematics
teachers, grouped by sector.
All sectors
Catholic schools (n=496)
Government schools (n=1711)
Independent schools (n=698)
Female (n=1434) 49.4% 53.4% 46.7% 53.0%
Male (n=1471) 50.6% 46.6% 53.3% 47.0%
6.2.3 Age and gender Male and female teachers showed different age distributions (Fig. 6.4), with male teachers being significantly older (p<0.001) (Table 6.5).
6.3 Employment histories
6.3.1 Years of secondary school teaching experience
The mathematics teachers in the survey had taught, on average, for 17.3 years. Two thirds had more than ten years experience, and 18 per cent had been teaching for more than thirty years (Table 6.6). There were also a large number of early career teachers – 17 per cent of mathematics teachers had been teaching for fewer than five years. Geographic differences in teaching experience There were differences in the pattern of teaching experience between states/territories and between ARIA categories.
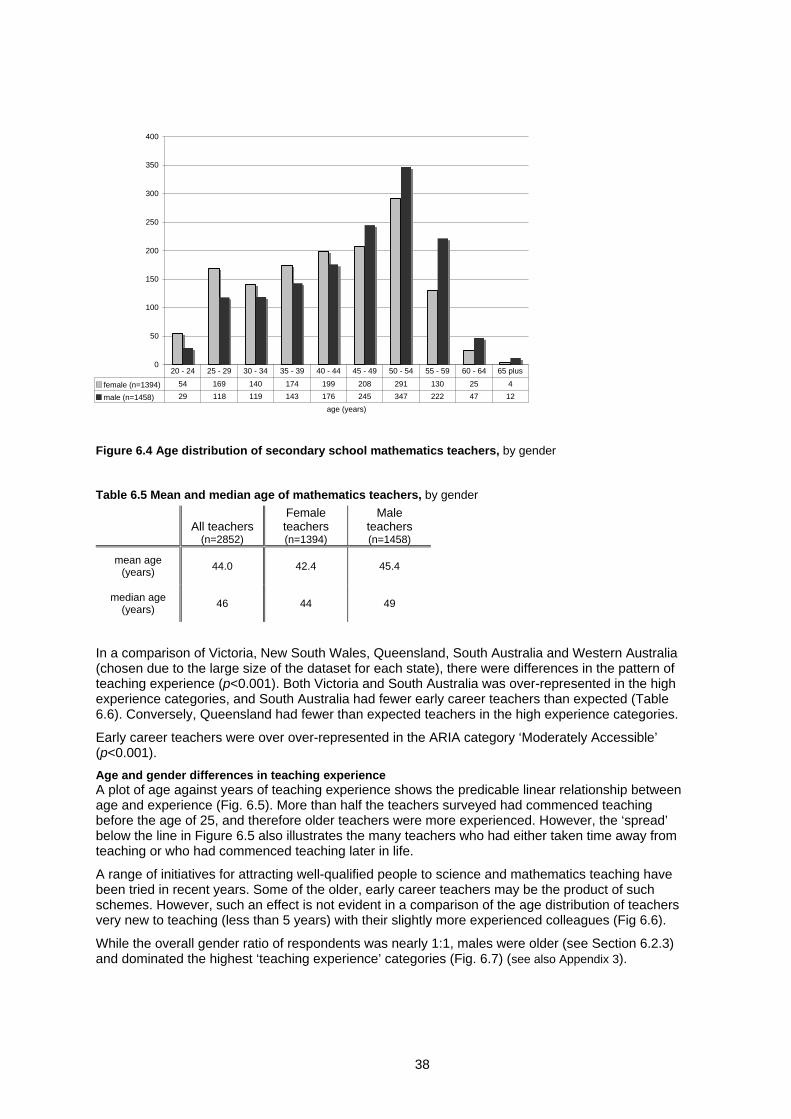
38
0
50
100
150
200
250
300
350
400
age (years)
female (n=1394) 54 169 140 174 199 208 291 130 25 4
male (n=1458) 29 118 119 143 176 245 347 222 47 12
20 - 24 25 - 29 30 - 34 35 - 39 40 - 44 45 - 49 50 - 54 55 - 59 60 - 64 65 plus
Figure 6.4 Age distribution of secondary school mathematics teachers, by gender Table 6.5 Mean and median age of mathematics teachers, by gender
All teachers (n=2852)
Female teachers (n=1394)
Male teachers (n=1458)
mean age (years) 44.0 42.4 45.4
median age (years) 46 44 49
In a comparison of Victoria, New South Wales, Queensland, South Australia and Western Australia (chosen due to the large size of the dataset for each state), there were differences in the pattern of teaching experience (p<0.001). Both Victoria and South Australia was over-represented in the high experience categories, and South Australia had fewer early career teachers than expected (Table 6.6). Conversely, Queensland had fewer than expected teachers in the high experience categories.
Early career teachers were over over-represented in the ARIA category ‘Moderately Accessible’ (p<0.001). Age and gender differences in teaching experience A plot of age against years of teaching experience shows the predicable linear relationship between age and experience (Fig. 6.5). More than half the teachers surveyed had commenced teaching before the age of 25, and therefore older teachers were more experienced. However, the ‘spread’ below the line in Figure 6.5 also illustrates the many teachers who had either taken time away from teaching or who had commenced teaching later in life.
A range of initiatives for attracting well-qualified people to science and mathematics teaching have been tried in recent years. Some of the older, early career teachers may be the product of such schemes. However, such an effect is not evident in a comparison of the age distribution of teachers very new to teaching (less than 5 years) with their slightly more experienced colleagues (Fig 6.6).
While the overall gender ratio of respondents was nearly 1:1, males were older (see Section 6.2.3) and dominated the highest ‘teaching experience’ categories (Fig. 6.7) (see also Appendix 3).

39
Table 6.6 Years of teaching experience, by state/territory Teachers’ years of experience teaching in secondary schools
(% by state/territory)
< 5 yrs
5-9 yrs
10-14 yrs
15-19 yrs
20-24 yrs
25-29 yrs
30 + yrs
Total1 (n)
All states/ territories 16.8 14.1 10.5 12.0 14.3 14.7 17.5 2856
ACT 13.8 13.8 9.2 9.2 13.8 15.4 24.6 65
NSW 14.5 14.5 12.0 12.3 13.4 14.2 19.1 702
NT 17.6 17.6 17.6 7.8 13.7 13.7 11.8 51
QLD 19.8 16.1 10.3 15.9 13.8 11.32 13.1 429
SA 12.6 13.8 9.1 11.9 17.0 11.3 24.2 318
Tas 7.3 15.6 10.4 13.5 12.5 18.8 21.9 96
Vic 19.6 11.9 8.5 11.5 15.1 18.0 15.4 879
WA 17.4 15.8 13.9 8.5 13.0 13.9 17.4 316
0
10
20
30
40
50
20 25 30 35 40 45 50 55 60 65 70 75Age
Figure 6.5 Distribution of age and years of experience for mathematics teachers. Dot size represents
relative frequency at each point.

40
0
50
100
150
200
250
20 - 24 25 - 29 30 - 34 35 - 39 40 - 44 45 - 49 50 - 54 55 - 59 60 - 64 65 plusage (years)
< 5 yrs experience (n=479)
5 to 9 years experience (n=403)
Figure 6.6 Age distribution of early career teachers, grouped by teaching experience
0
50
100
150
200
250
300
350
<5 5 to 9 10 to 14 15 to 19 20 to 24 25 to 29 30 +teaching experience (years)
female teachers(n=1401)
male teachers(n=1454)
Figure 6.7 Distribution of teaching experience of teachers, presented by gender
6.3.2 Previous employment Teaching was the first profession for three out of four mathematics teachers (Table 6.7). Most others had been previously employed in a professional capacity, some in the fields of science or mathematics.
Employment history was related to teaching experience, but not to age (Figure 6.8). Early career teachers were more likely than their colleagues to have been employed elsewhere prior to taking a teaching position, suggesting that this may be an increasingly common career pathway for mathematics teachers. Half the teachers within the earliest career grouping (<5 years teaching experience) had taken such a path. These teachers were more confident that they would continue teaching, than were their ‘first profession’ early career peers (p<0.05) (Table 6.8). The career plans of teachers are described further in Chapter 7.

41
Table 6.7 Employment history of mathematics teachers
responses Employment history
(if teaching was not their first profession, teachers were asked to describe their
most recent, previous occupation) n %
Teaching as first profession* 2116 72.4
Previous profession - science-base e.g chemical research 112 3.8
Previous profession – mathematics-based e.g statistical analysis 16 0.5
Previous profession – other e.g computing systems engineering 434 14.8
Previous occupation e.g military service 168 5.7
Unknown** 26 2.7
Total* 2924 100
*2875/2924 teachers completed this question **teachers indicated that teaching was not their first profession, but did not provide details
0% 20% 40% 60% 80% 100%
30 plus (n=497)
25 to 29 (n=410)
20 to 24 (n=414)
15 to 19 (n=333)
10 to 14 (n=293)
5 to 9 (n=392)
<5 (n=457)
teac
hing
exp
erie
nce
(yea
rs)
percentage
Teaching 1stprofession
Previousemployment -professional
Previousemployment - other
0% 20% 40% 60% 80% 100%
60 plus (n=89)
50 to 59 (n=974)
40 to 49 (n=809)
30 to 39 (n=562)
< 30 (n=362)
age
(yea
rs)
percentage
Teaching 1stprofession
Previousemployment -professional
Previousemployment -other
Figure 6.8 Employment history of mathematics teachers, grouped by: years of teaching experience (upper chart); age (lower chart).

42
Table 6.8 Career plans of early career teachers, grouped according to previous employment
Response to the question: Do you think that you will be teaching secondary school
mathematics in 5 years time? Mathematics teachers with < 5 years
teaching experience Yes Probably Unsure No
Teaching as first profession (n= 230)
37.0% 33.5% 19.6% 10.0%
Previously employed (n=234) 49.1% 23.1% 18.4% 9.4%
6.4 The teachers of junior, middle and senior schools mathematics classes Section 6.2 describes the characteristics of all mathematics teachers, independent of the type of mathematics that they taught. In this section, teacher characteristics are described from the perspective of the mathematics taught, rather than the teachers. For example, where the focus is on middle school mathematics, the characteristics of all teachers teaching at that level is presented.
A teacher-focused analysis of teaching patterns, including analysis of age and teaching experience, is presented Chapter 3, Section 3.2. This section makes reference to Chapter 3, and to Table 3.5 in particular.
Teachers of junior school mathematics were the group of mathematics teachers most likely to teach non-mathematics subjects (Table 6.9). They also tended to be, on average, younger and less experienced. Conversely, teachers of senior school mathematics are the eldest, most experienced and least likely to teach non-mathematics subjects. More pronounced differences emerged in the characteristics of teacher groups when senior school mathematics were analysed by level of complexity (Table 6.9). Teachers of advanced senior mathematics were typically male, highly experienced and among the least likely to teach non-mathematics subjects.
As Table 6.9 describes all teachers involved in teaching a particular school level, and because many teachers were involved in teaching several school levels (see Chapter 3; Table 3.5), some more pronounced differences in teacher groups were masked. Table 6.10 describes the characteristics of three groups of teachers with ‘narrower’ mathematics teaching responsibilities - those who teach: only junior or middle school mathematics; only senior mathematics; or only intermediate or advanced senior mathematics.
Mathematics teachers who do not teach senior school are far more likely (78%) to teach non-mathematics subjects than are those who teach intermediate or advanced senior mathematics (44%) (Table 6.10). The difference in teaching experience is equally marked. Those who do not teach senior school have a median of ten years teaching experience, in contrast to a median of 22 years for those who teach only senior school (Table 6.10).
Teachers whose mathematics teaching is restricted to junior school (see Chapter 3, Table 3.5) are, on average, younger than their colleagues (39.1yrs) (p<0.001). They are also more likely to be teaching biology at a senior school level (see Chapter 3, Table 3.6) (p<0.001).

43
Table 6.9 Characteristics of teachers of different levels of mathematics
Age and sex
Teaching experience
(years)
Also teach non-
mathematics subjects1
Teachers of mathematics
at: n* % aver
age
age
(yrs
)
med
ian
age
(yrs
)
gend
er
(fem
ale
%)
aver
age
(yea
rs)
med
ian
(yea
rs)
% aver
age
num
ber
of
subj
ects
Any level 2924 100 44.0 46 49.4 17.3 18 48.2 1.9
Junior school 1815 62.1 43 45 51.0 16.1 15 47.7 2.0
Middle school 2146 73.4 44.3 46 49.1 17.5 18 42.0 1.9
Senior school – all subjects levels 2116 72.4 45.0 47 48.6 18.6 20 36.8 1.8
Senior school – elementary 985 33.7 44.5 47 50.7 17.8 18 33.5 1.8
Senior school – intermediate 1068 36.5 45.6 48 49.9 20.1 21 30.2 1.7
Senior school – advanced 564 19.3 46.7 48 46.9 21.4 22 20.2 1.7
*Individual teachers may be included in more than one category 1See Chapter 3 (Section 3.2) for more detailed analysis of teaching patterns, including teaching in subjects other than mathematics. Table 6.10 Characteristics of three groups of teachers with restricted patterns of mathematics teaching:
non-senior school only; senior school only; and intermediate/advanced senior school only.
Proportion of all respondents to
teach these levels/subjects
(n=2924) Age Sex
Teaching experience
(years)
Also teach non-
mathematics subjects
Teachers of mathematics at:
(n)* (%)
aver
age
(yea
rs)
med
ian
(yea
rs)
prop
ortio
n fe
mal
e (%
)
aver
age
(yea
rs)
med
ian
(yea
rs) proportion
of this group (%)
average number of subjects taught
Junior and/or Middle school
only 785 26.8 41.4 43 51.2 13.9 10 78.0 2.1
Senior school only 304 10.4 46.6 49 43.2 21.4 22 45.7 1.7
Senior school – intermediate
and/or advanced only
102 3.5 47.9 49 41.2 23.1 23 44.1 1.6

44
Chapter 7: Recruiting and retaining suitably qualified mathematics teachers This chapter examines issues of recruitment and retention, drawing upon responses from both heads of mathematics and mathematics teachers. Heads were asked to comment, from the schools’ perspective, on both the recruitment and retention of suitably qualified mathematics teachers (Section 7.1). Teachers were asked their future career plans, information complementary to the ‘retention’ question asked of heads (Section 7.2).
In summary: • Three in four schools reported difficulty recruiting suitably qualified mathematics teachers. • The shortage of mathematics teachers was seen as an emerging and growing concern, with
many heads of mathematics predicting that the demand is set to increase in the next few years as large numbers of experienced staff retire.
• Country schools and the more remote schools reported the greatest difficulties. • Difficulties filling block vacancies was of particular concern to many schools. • Fewer than half the teachers surveyed were confident that they would be teaching
mathematics in five years time. These were typically experienced teachers, many between the ages of 40 and 50 years.
• Sixteen per cent of teachers were definite that they would leave teaching within five years. The majority were at least 50 years of age, experienced teachers and male.
• Teachers undecided about their career plans included a large number of young teachers and early-career teachers.
7.1 The issues for schools
7.1.1 Recruitment of mathematics teachers
The majority of heads (72%) reported difficulties with recruitment of mathematics teachers (Table 7.1). There was no difference between school sectors, but some differences between states/territories (Table 7.1). For example, heads from schools in Queensland reported greater difficulty than the other eastern mainland states. Schools in more remote regions reported the greatest difficulty (Fig 7.1).
Many heads (427) elaborated on their schools’ recruitment difficulties in written comments. Most comments referred to a shortage of suitably qualified mathematics teachers, although no shortage of applicants.
Qualified teachers are hard to find, although many unqualified teachers want to teach maths (seen as simple from the outside) [Highly Accessible school in Queensland with 24 mathematics teachers]
There seems to be no shortage of applicants, but certainly a shortage of “quality” mathematics teachers available [Highly Accessible school in Victoria with 9 mathematics teachers]
Not many applicants have maths qualifications. Lots of engineers and biologists apply! The notion of science-trained equals maths-trained does NOT work! [Highly Accessible school in Western Australia with 13 mathematics teachers]
Unfortunately, teachers of any background consider that they are able to teach Yr 8 & 9 Maths, which is not the case. They’ve chosen Arts or PE because they were not good at Maths in high school and they end up teaching Maths [Highly Accessible school in South Australia with 8 mathematics teachers]

45
Table 7.1 Schools experiencing difficulty recruiting mathematics teachers, grouped by state
Responses from head of mathematics to the question:
Does your school have difficulty recruiting mathematics teachers?
Total number of responses
Yes (%)
Sometimes (%)
No (%)
All schools 607 39.0 33.1 27.8
ACT 11 36.4 9.1 54.5
NSW 166 38.5 27.7 33.7
NT 11 45.5 54.5 0.0
QLD 104 47.1 33.7 19.2
SA 75 34.7 45.3 20.0
TAS 22 50.0 40.9 9.1
VIC 141 35.5 31.9 32.6
WA 77 36.4 32.5 31.2
0
10
20
30
40
50
60
HA (n=433) A (n=100) MA (n=52) R & VR (n=22)
ARIA
NoYesSometimes
Figure 7.1 Schools reporting difficulty in recruiting mathematics teachers, expressed as a proportion of the
total number of schools responding per ARIA category [HA = highly accessible; A = accessible; MA = moderately accessible; R = remote; VR = very remote). The differences seen are significant [p<0.01)
This appears to be a recently emerging and growing problem. We have had a very stable staff until recently. In the recent interviewing process, suitably qualified and skilled applicants were few and far between [Highly Accessible school in Victoria with 7 mathematics teachers]

46
In previous years I have had little problem, but I recently placed an ad for one full time position and received no applicants that I considered worthwhile [Highly Accessible school in New South Wales with 10 mathematics teachers]
There is not the same number of suitable candidates as in the past. In the end, you take the best of an ordinary lot [Highly Accessible school in Victoria with 23 mathematics teachers]
Particularly in recent years, there seems to be a lack of graduates with a Maths major – it is more common to have it as an add-on [Highly Accessible school in South Australia with 13 secondary classes]
We have found recently there seems to be less maths teachers available who have a major in mathematics – ie less available for senior school teaching [Highly Accessible school in South Australia with 20 mathematics teachers]
We have not recruited a Maths Methods or Specialist Maths teacher for over ten years now. 3 teachers over 50 (years of age) teach these units [Highly Accessible school in Victoria with 14 mathematics teachers]
Faced with a shortage of ‘maths-qualified’ teachers, particularly for seniors school teaching, there was a tendency for schools to move their most experienced teachers to senior classes and fill ‘gaps’ at junior school level with less qualified staff.
We usually need to use lesser-qualified teachers (ie maths as 2nd teaching area or not a teaching area at all) to fill all junior classes [Remote school in Queensland with 11 mathematics teachers]
There are more Maths classes than the number of classes taught by Maths teachers … ie teachers outside the Maths Faculty are brought in to teach. They do not have the experience, knowledge or dedication to deliver meaning and good understanding [Highly Accessible school in Queensland with 13 mathematics teachers]
One in five comments referred to difficulties linked to location or school type.
Country school. We have difficulty recruiting teachers, let alone trained maths teachers [Accessible school in SA with 8 mathematics teachers]
Mainly due to geographic location. The school is a small country school. This poses a general difficulty in attracting staff – not specifically mathematics staff [Accessible school in Victoria with 3 mathematics teachers]
Isolated area, small school, they have to teach over several disciplines [Remote school in South Australia with 5 mathematics teachers]
Being a large provincial town, we run into the situation where we lose specialist Maths graduates soon after they arrive at the school, because they are called on to do their “country service” in 1st and 2nd year here [Moderately Accessible school in Queensland with 21 mathematics teachers]
We are an outer metropolitan school in a less affluent area. Many students are not academically inclined. We do not have a lot of applications by Maths teachers, especially if they want to work in an academically rigorous situation. Travel is also an issue for many [Highly Accessible school in South Australia with 8 mathematics teachers]
A further 18 per cent of comments referred to difficulties filling short-term and ‘block’ vacancies, such as those that arose through maternity and long-service leave. These included school which otherwise reported no difficulties.
Maths casuals are very rare in our area. Our whole department will retire within 7 years [Accessible school in New South Wales with 9 mathematics teachers]
It is very difficult to source casual teachers with a mathematics background - (Yet) we are a popular school on the coast and teachers want to work in our location [Highly Accessible school in New South Wales with 5 mathematics teachers]
It’s getting hard to find replacement teachers (especially for temporary and part-time) who are skilled, qualified and experienced. Many are being recruited after retirement [Highly Accessible school in South Australia with 8 mathematics teachers]
When we need a contract person to replace someone on long service leave the pickings are poor. To replace a Year 11 or 12 teacher is practically impossible [Highly Accessible school in South Australia with 15 mathematics teachers]

47
We have had difficulty getting suitable mathematics trained teachers for 1 year temporary positions. Have used PE or Science trained teachers [Highly Accessible school in New South Wales]
7.1.2 Retaining mathematics teachers Heads of mathematics departments were asked if their schools experienced difficulties in retaining mathematics teachers.
Nearly 30 per cent of schools reported difficulties with teacher retention, citing a diversity of factors including school location and challenging students.
Teachers transfer to “better” locations or are poached by the private sector due to lack of Sci/Maths teachers [Remote school in Queensland with 5 mathematics teachers]
Some mathematics teachers travel from a larger centre about an hour away. Our school can be a “fill in measure” until something else comes up closer to home [Highly Accessible school in Victoria with 10 mathematics teachers]
We are in an isolated rural environment. We only really get teachers who have grown up in area or are recruited by local sports clubs. Most young staff stay 2-3 years and move back to wherever they came from [Accessible school in Victoria with 12 mathematics teachers]
Some (teachers) do not want to teach maths – they feel it is unfair to students if they themselves have a poor knowledge base. Discipline becomes a problem when students realise the teacher is not confident in the subject area [Moderately Accessible school in Queensland with 19 mathematics teachers]
The young teachers know that in the private schools they do not have to put up with the discipline problems associated with the public schools. They do a few years in the state system and then leave due to disenchantment and possible transfer to the country [Highly Accessible school in Queensland with 23 mathematics teachers]
The approaching retirement of experienced staff was of concern to many schools. Most teachers have been here “forever” and will retire from here (in the next 2 years) [Accessible school in Victoria with 9 mathematics teachers]
I foresee a possible problem in the next 5-10 years when long-standing staff retire [Accessible school in New South Wales with 6 mathematics teachers]
This difficulty is just starting to happen because senior teachers are locked into “seeing out” their time due to superannuation. The upcoming generation will not be shackled to the same extent and then retention will become a major issue [Highly Accessible school in Victoria with 9 mathematics teachers]
Heads of mathematics also offered a range of suggestions for retaining teachers. Many of these comments were offered as suggestions for both the attraction and retention of suitably qualified teachers, and are described in Chapter 8. Of particular note regarding retention, however, were calls from heads for improved professional development strategies. In addition, heads from Western Australian schools mirrored teachers concerns regarding curriculum changes in that state (see also Section 7.2.2).
Mini courses provided – 3-4 days, with compulsory withdrawal from schools to attend courses. Maths topic-based: theory of topic in depth; techniques to teach effectively; resource material – project exercises; test questions; sharing ideas. This would inject more vitality/interest in Maths and also improve the confidence of teachers [head of mathematics; 7-12 school]
Provide a quality curriculum that involves teaching using different strategies – forget outcomes based education [head of mathematics; 7-12 school Western Australia]
Reduce the frequency of ‘change’ – it has been unrelenting for nigh on 20+ years [head of mathematics; 7-12 Western Australia school]
Ensure the curriculum is a national curriculum; a common form of assessment from state to state and common reporting methods. A lot of time is wasted “reinventing the wheel” creating new programmes and assessments, when this could be created nationally (via a website?). Have a common programme where beginning or inexperienced or isolated teachers know they can refer to video links, technology resources based on a national website. Respect the workload of teachers and try to identify ways to cut this down – not increase it with new courses and without a database of resources [head of mathematics; 7-12 school; Western Australia; Highly Accessible metropolitan school].

48
7.2 The career plans of mathematics teachers in secondary schools
7.2.1 Overview The supply of mathematics teachers in the future will partly depend upon the career plans of those teachers currently in the system. Teachers were asked if they planned to still be teaching in five years time. This data was tested for correlation against a number of variables, including personal profiles (age, gender, teaching experience), school type (location, sector) and subjects taught.
Fewer than half the teachers surveyed were confident that they would be teaching mathematics in five years time (Table 7.2). Sixteen per cent stated that they would be leaving teaching, and another 39 per cent were undecided.
Teachers from Western Australia expressed less certainty than teachers from other states (p<0.001) (Table 7.2). Teachers from the Northern Territory were similarly noncommital. This contrasts with South Australia, from where more than half the teachers were confident they would be teaching into the future. Table 7.2 Career plans of mathematics teachers, grouped by state
Teachers responses, in each of 4 categories1, to the question:
Do you think that you will be teaching secondary school mathematics in 5 years time?
%
Total
number of responses Yes Probably Unsure No
All 2885 45.0% 23.9% 15.4% 15.7%
ACT 66 27.3% 30.3% 19.7% 22.7%
NSW 694 48.3% 21.0% 13.7% 17.0%
NT 53 26.4% 37.7% 22.6% 13.2%
QLD 426 46.9% 23.7% 15.5% 13.8%
SA 304 51.6% 23.0% 13.8% 11.5%
TAS 99 46.5% 17.2% 13.1% 23.2%
VIC 866 45.5% 23.8% 14.5% 16.2%
WA 377 35.5% 29.2% 20.7% 14.6% 1The 4 options (yes; probably; unsure; no) were provided as check boxes on the questionnaire
7.2.2 Comparison of the profiles of teachers with different career plans ‘Yes’, teaching in five years time Most of the teachers in this group had at least ten years teaching experience, and 40 per cent had been teaching for at least twenty years (Table 7.3a). The group included nearly equal numbers of men and women, and 40 per cent were between 40 and 50 years of age.

49
Table 7.3a Profile of the group of 1298 teachers who intended to continue mathematics teaching until at least 2010 (age, years of secondary school teaching, teaching responsibilities and gender)
Less than 30 years
30 – 39 years
40 – 49 years
50 years or older AGE
10.3% 24.6% 39.5% 25.6% Less than 5
years 5 – 9 years 10 – 19 years 20 years or more TEACHING EXPERIENCE 15.9% 14.2% 27.6% 42.3%
Junior school Middle school Senior school Senior
intermediate / advanced
MATHEMATICS TEACHING
62.5% 75.5% 77.0% 50.2%
Female Male GENDER
49.2% 50.8%
Table 7.3b Profile of the group of 452 teachers who intended to leave the teaching profession before 2010
(age, years of secondary school teaching, teaching responsibilities and gender) Less than 30
years 30 – 39 years
40 – 49 years
50 years or older AGE
8.5% 6.7% 10.3% 74.6% Less than 5
years 5 – 9 years 10 – 19 years 20 years or more TEACHING EXPERIENCE 10.3% 7.6% 9.4% 72.6%
Junior school Middle school Senior school Senior
intermediate / advanced
MATHEMATICS TEACHING
59.5% 73.0% 70.8% 42.7%
Female Male GENDER
41.7% 58.3%
Table 7.3c Profile of the group of 1133 teachers who were undecided1 about their career paths (age, years
of secondary school teaching, teaching responsibilities and gender) Less than 30
years 30 – 39 years
40 – 49 years
50 years or older AGE
17.7% 21.0% 24.3% 37.0% Less than 5
years 5 – 9 years 10 – 19 years 20 years or more TEACHING EXPERIENCE 20.0% 16.9% 22.4% 40.7%
Junior school Middle school Senior school Senior
intermediate / advanced
MATHEMATICS TEACHING
62.3% 72.3% 68.5% 37.4%
Female Male GENDER
52.1% 47.9%
1 Includes ‘probably’ and ‘unsure’ responses to the question: Do you think that you will be teaching secondary school mathematics in 5 years time?
The most common explanation from this group referred to the rewarding nature of teaching (n=250/407 written responses), while one in ten responses referred to a lack of other professional options (n=42/407) (Table 7.4).
(Yes) – Enjoy the job and would expect to still be doing it for a long time yet [male; age 29yrs; teaching experience 7yrs]
(Yes) - I love what I do. Teaching is more than a job for me. I cannot imagine doing anything else [female; age 41yrs; teaching experience 20yrs]

50
(Yes) – Getting too old to teach PE (Physical Education) all the time [male; age 41yrs; teaching experience 18yrs; teaching junior mathematics, middle and senior school PE]
(Yes) – I enjoy my work and currently have a mix of teaching and administration [male; age 57yrs; teaching experience 34yrs]
(Yes) – I love teaching maths and want to study to become qualified to teach it [female; age 28yrs; teaching experience 5yrs; teaching junior, middle and senior (elementary) mathematics, junior and middle school science]
(Yes) – I’m committed (till age 54yrs 11mths for superannuation reasons) [male; age 48yrs; teaching experience 2yrs]
(Yes) – Too tired to do anything else, too old to retrain, too much financial baggage to break-free [male; age 50yrs; teaching experience 25yrs]
Table 7.4 Teachers’ comments regarding their career plans for five years time
Teachers’ comments in response to the question: Do you think that you will be teaching secondary school mathematics in 5 years time?
Proportion of responding teachers in each group to make the comment
(%)
Yes Probably Unsure No
Number of teachers offering explanatory comments 407 294 273 320
Rewarding nature of teaching 61.4 13.3 1.5 0.6
General statement of commitment 21.6 3.1 0.0 0
Contingent upon contract renewal 2.5 13.9 7.0 0.6
No other professional options 10.3 6.8 1.1 0.6
Family commitments 5.9 8.5 4.8 2.5
Stressful nature of teaching 2.7 10.9 14.3 7.8
Retiring 3.7 21.8 36.3 74.4
Moving out of teaching profession 1.0 13.6 20.1 10.6
Moving out of mathematics (still teaching) 0.7 9.9 8.4 5.0
Moving into school administration (still in school system) 1.0 3.4 5.1 1.9
Moving to part-time employment 2.2 6.1 3.3 1.9
‘No’, not teaching in five years time Of the 452 teachers committed to leaving teaching within five years, the majority were at least 50 years of age, experienced teachers and male (Table 7.3b). More than half stated they were retiring, and another seven per cent explained that they were moving to another profession (Table 7.4).

51
(No) – Retiring from teaching in 2006 [male; age 58yrs; teaching experience 37yrs]
(No) - I will have retired from full time work by then. I may do relief/contract work [female; age 53yrs; teaching experience 19yrs]
(No) – Career change – studying a Masters Degree in Property Investment (completed in 2006) [male; age 36yrs; teaching experience 14yrs]
(No) – I will probably be raising a family [female; age 26yrs; teaching experience 5yrs]
Undecided about career plans (‘probably’ and ‘unsure’) Teachers undecided about their career plans included a large number of young teachers and early-career teachers (Table 7.3c), undecided for a variety of reasons.
(Probably) – It is my first year teaching. I am yet to commit to the profession in the long term [male; age 28yrs; teaching experience 1yr]
(Probably) – Will probably be overseas by then – will see what happens [female; age 29yrs; teaching experience 8yrs]
(Unsure) – Mathematics is not my forte; if I can avoid teaching it I will [female; age 23yrs; teaching experience 1yr; teaching junior and middle mathematics and science, and senior biology]
(Unsure) – Looking at furthering other areas of my life. A more flexible profession would be more suitable [female; age 24yrs; teaching experience 2yrs]
(Probably) – Still interested in university lecturing but may not go for a few more years [male; age 27yrs; teaching experience 5yrs]
(Probably) – Teachers are generally not respected, even by the executive staff in their own schools. No appreciation for all the hard work is a deterrent [female; age 25yrs; teaching experience 3yrs]
Many explanatory comments referred to possible retirement or the stressful nature of the job. Changes to curriculum were of particular concern to teachers from Western Australia.
(Probably) – Coming close to retirement – and having enough of the politics of the workplace (in general). At this stage I’m still enjoying the classroom [female; age 50yrs; teaching experience 28yrs]
(Unsure) - Next year I am reducing to 0.8FTE in order to ‘have a life’ [female; age 52yrs; teaching experience 30yrs]
(Unsure) – Children are getting more difficult and most of the time is not spent teaching unless you have a high level maths group [female; age 45yrs; teaching experience 20yrs]
(Probably) – Introduction of OBE and the extra workload makes teaching mathematics less attractive and rewarding [female; age 50yrs; teaching experience 15yrs; teaching middle and senior (all levels) mathematics; Western Australia school]
(Unsure) – The new upper school units are disastrous and if they are as bad as I think, I will be looking for alternative employment [male; age 45yrs; teaching experience 22yrs; teaching junior, middle and senior (elementary & advanced) mathematics; Western Australia school]
Some teachers remarked on the relationship between mathematics and science teaching responsibilities. For some schools, science teachers were expected to also teach mathematics and therefore the decision for these teachers was one made by school management rather than personal preference.
(Probably) – Small school, so may still be teaching maths [female; age 50yrs; teaching experience 10yrs; teaching junior mathematics and science, and senior biology, chemistry and physics; Moderately Accessible country school]
(Probably) – Well, there are relatively few continuing Math teachers in our school. So quite possible, not definitely [male; age 26yrs; teaching experience 1yr; teaching middle school science and RE, senior (elementary) mathematics and science; Highly Accessible metropolitan school]
(Yes) – Science teachers teach Maths! [male; age 31yrs; teaching experience 3yrs; teaching junior mathematics and science; middle science; Highly Accessible metropolitan school]
Figure 7.2 further illustrates the relationship between career plans, age and experience. Those teachers most committed to continue teaching were between the ages of 35 and 49 years, and there was little difference between the three five-year age bands spanning this range. Several factors may

52
have contributed to this trend, including: changes of attitude over time; early- career teachers leaving the profession within the first ten years; and differences in the attitudes of more recent teacher intakes.
There was very little difference in the career plans of teachers of different mathematics year levels (Figure 7.2). The exception was teachers with no senior teaching responsibilities, who were less likely than their colleagues to express confidence that they would be teaching in 2010.
Among early career teachers, career plans differed depending upon whether or not teaching was their first profession (see Chapter 6, Section 6.3.2). Teachers with pre-teaching careers were more confident that they would continue teaching, than were their ‘first profession’ early career peers (p<0.05) (see Chapter 6, Table 6.8). Other dimensions of employment history are discussed in Chapter 6.

53
0%
20%
40%
60%
80%
100%
< 25
25 - 2
9
30 - 3
4
35 - 3
9
40 - 4
4
45 - 4
9
50 - 5
4
55 - 5
960
+
age (years)
nounsureprobablyyes
0%
20%
40%
60%
80%
100%
<5 5 - 9
10 - 1
4
15 - 1
9
20 - 2
4
25 - 2
9
30 - 3
435
+
teaching experience (years)
nounsureprobablyyes
0%
20%
40%
60%
80%
100%
junior
middle
senio
r
senio
r E
senio
r I
senio
r A
J/M on
ly
senio
r only
mathematics teaching
no
unsure
probably
yes
Figure 7.2 Career plans of mathematics teachers for the next five years, grouped by: age (upper chart);
years of experience (middle chart); and mathematics teaching (lower chart). Teachers’ comments in response to the question: Do you think that you will be teaching secondary school mathematics in 5 years time?

54
Chapter 8: What attracts people to a career in mathematics teaching? With the impending retirement of large numbers of mathematics teachers nationally, universities, governments and schools face the current and future challenge of attracting people to mathematics teaching as a career. Education faculties in universities have a direct and vested interest in attracting suitably prepared students into teaching programs. Science faculties recognise their role in the preparation of future teachers of science and mathematics, and also appreciate the critical role that school teachers play in preparing school students for tertiary study. Governments play important roles through funding and policy initiatives that support universities, schools and trainee-teachers. And schools face the practical challenge of recruiting suitably qualified teachers. Insights into what motivates people to become teachers can inform decision making by each of these stakeholders.
In this study, teachers were asked to explain their reasons for choosing a career in teaching. The findings are reported in Section 8.1.
Both heads of mathematics and teachers were also invited to offer suggestions for attracting more, suitably qualified people to mathematics teaching. Their comments are summarised in Section 8.2.
8.1 Mathematics teachers’ original motivations Teachers of mathematics were asked what attracted them to a career in teaching. They were offered six options (see Table 8.1) and an opportunity to list any other factors. The responses are presented in Table 8.1. Most teachers cited multiple motivations.
Three in five teachers gave the ‘rewarding nature of the profession’ as motivation for choosing a teaching career (Table 8.1). Nearly half cited their ‘love of mathematics’ (49%), with far fewer teachers listing ‘salary’ as a motivation (16%). Male teachers were less motivated by enthusiasm for the discipline, and more by issues of salary and job security, than their female colleagues (Table 8.2).
Half of the respondents from government schools stated they were originally attracted to the teaching profession by the job security offered, while less than one third of teachers from Catholic or independent schools indicated that this was a decisive factor (Table 8.2). Salary was a factor for almost one in five teachers in government schools, but for significantly fewer Catholic school teachers (p<0.01). The receipt of a scholarship was a factor for more government school respondents (6.8%), than for teachers in non-government schools (Ind: 4.5%; Cath 2.7%).
The pattern of responses was similar for the eight states and territories (see Appendix 4).

55
Table 8.1 Teachers’ motivation for joining the teaching profession
Proportion of teachers listing this response1 to the question:
What originally attracted you into the profession of teaching?
% of responses
(n=7683)
% of respondents
(n=2859)
Rewarding nature of the profession* 23.2 62.3
Love of mathematics* 18.4 49.4
Opportunities for social interaction with students and staff* 13.3 35.8
Intrinsic personal benefits
Transferability of skills (both into the career, and to other careers) 1.7 0.9
Work conditions* (eg. holidays) 16.6 44.5
Job security* 15.9 42.8
Salary* 5.9 15.8
Conditions of employment
Scholarship support / obligations 5.6 2.1
No more desirable alternatives at the time 1.3 0.4
‘Wanted to make a difference’ and other altruistic comments 2.6 1.0
Had good role models 1.6 0.6 Other
Good for working parents 2.1 0.8
* Option presented as a ‘check-box’ on questionnaire. The unmarked categories are derived from the written comments of teachers.
Table 8.2 Teachers’ motivation for joining the teaching profession, grouped by sector and gender
Proportion of teachers listing this response1 to the question: What originally attracted you into the profession of teaching?
(%)
Rewarding nature
(n=1781)
Opportunities for social
interaction (n=1025)
Love of Mathematics
(n=1413) Job security
(n=1224) Salary
(n=451)
Working conditions (n=1272)
Other (n=491)
All teachers (n=2859) 62.3 35.8 49.4 42.8 15.8 44.5 17.2
Catholic (n=487) 67.1 36.8 47.6 31.6 8.8 42.9 17.5
Government (n=1682) 57.6 34.0 47.1 50.2 19.0 44.8 17.4
Independent (n=692) 70.2 39.6 56.1 32.5 12.9 44.7 16.3
female % of total for each
response 49.7 52.6 54.0 45.4 44.3 46.7 51.1
1Each of these was listed as on option on the questionnaire

56
8.2 Suggestions for attracting more people to mathematics teaching As described in Section 8.1, most of the practising teachers surveyed were attracted to the profession through their interest in teaching and in mathematics. Only one in six listed salary as a motivating factor. However, when asked what could be done to attract more teachers into the profession, 50 per cent stated that salary improvements were needed (Table 8.3). A similar response was received from secondary school science teachers in a previous study21. Heads of mathematics also listed salary as a critical issue (Table 8.3).
Let’s be realistic – for the person who excels at Maths there are plenty of more exciting, better paid jobs available e.g. Data Mining … While in 3rd at university, the lecturer offered me work in the statistics field. (If you want them as teachers, comparable salaries will need to be considered). I chose a secure job [male teacher; age 46yrs; teaching experience 5yrs] Pay them more and in proportion to their qualifications – not some ‘jump through the hoops’ professional measurement. This is really the only way – nothing else has ever worked (and there have been, and still are, a great many schemes) [head of mathematics; 7-12 school]
The public perception of teaching was also an issue raised by many. Raising the profile and status of mathematics teaching was seen as a priority (Table 8.3), as was raising students awareness of the career paths for people with a strong mathematics background.
More exposure of the importance of maths – the enjoyment and satisfaction of teaching [female teacher; age 52yrs; teaching experience 1yr]
The potential for use of Mathematics as a tertiary discipline and its support across many subject areas need to be made more widely known so that students at school don’t think that they have to study Maths because their parents want them to, but understand its need, use and value so that more students want to study the subject further. If this doesn’t happen we will not have a pool of graduates from which to draw our teachers in this subject [head of mathematics; 7-12 school]
Some comments referred to encouraging more ‘reasonable’ expectations of teachers. Public perceptions need to be changed. Teachers are like any other workers. There are excellent, capable, average and poor ones. Public seem to believe that if a teacher is not brilliant they are useless and should be sacked. This is an unreasonable expectation of any profession [male teacher; age 43yrs; teaching experience 13yrs]
The press needs to stop denigrating teachers – teaching a subject that parents of kids have struggled through (themselves) receives little support from home – we need to sell our subject [female teacher; age 53yrs; teaching experience 30yrs]
As in the related science study22, both teachers and heads advocated more supportive school environments as a way of encouraging more people to consider a career in school teaching. Their suggestions included the provision of professional development.
More support in the classroom and time to prepare quality units and resources [male teacher; age 33yrs; teaching experience 7rs]
Better preparation of teachers ie work unit to be used immediately. PD which also does this [female teacher; age 49yrs; teaching experience 26 yrs]
More professional development. No requirement to teach other subjects. Updated curriculum and resources. IT based instruction. [head of mathematics; 7-10 school]
Give them lots of room and professional opportunities. With low salaries the only retaining force is working conditions – make it great for them [head of mathematics, 7-12 school]
The main difficulty for teachers, including mathematics teachers, is behaviour management. If improved systems were in place at a department level to deal with difficult students, most teachers would be far less stressed and more willing to stay in the profession [head of mathematics; 7-10 school]
21 Harris, Jensz & Baldwin (2005) 22 Harris, Jensz & Baldwin (2005)

57
Table 8.3 Suggestions for attracting people to mathematics teaching as a career, offered by mathematics teachers and heads of mathematics
Responses from mathematics
teachers1 (n=5479 responses)
Responses from heads of
mathematics2 (n=1237 responses)
n % n %
Increase salaries 2257 41.2% 338 27.3%
Offer incentives (e.g. study leave; sebbatical; better employment conditions) 130 2.4% 26 2.1%
Reduce contact time and/or overall workload 236 4.3% 74 6.0%
Teac
her-
cent
red
Reduce administration load 58 1.1% 27 2.2%
Stu
dent
-ce
ntre
d
Improve student behaviour 263 4.8% 58 4.7%
Provide more support for trainee teachers (e.g. pre-service improved training; mentoring) 206 3.8% 161 13.0%
Improve resources and infrastructure 128 2.3% 61 4.9%
Scholarships 814 14.9% 51 4.1%
Create more attractive career pathways 65 1.2% 48 3.9%
Create more supportive school environment 360 6.6% 116 9.4%
Reduce frequency of curriculum change 150 2.7% 65 5.3%
Gov
erna
nce
Improve the promotion of mathematics, mathematics teaching, and teaching generally to
tertiary students and in the wider community 668 12.2% 158 12.8%
Oth
er
144 2.6% 54 4.4%
1 2178 mathematics teachers responded, and 1131 offered multiple suggestions/comments 2 553 heads of mathematics responded, and 413 offered multiple suggestions/comments

58
Chapter 9: Conclusions The growing shortage in mathematics teachers The findings from this study highlight the importance of attracting more people to careers in mathematics teaching. Many secondary schools are struggling to staff mathematics classes with suitably qualified teachers. Experienced teachers are being moved from lower year levels to cover senior school mathematics teaching, leaving teachers from other subject areas such as science to cover the gaps in junior and middle school mathematics teaching. And heads of mathematics departments in schools predict that the situation is set to worsen in coming years.
The age profile of mathematics teachers in Australia is a further cause for concern, particularly in light of current staff shortages. Many schools report low turnover of mathematics teachers to date, but state that this is about to change. Like many other professions in Australia, the teaching profession is an ageing one. Large numbers of highly experienced mathematics teachers will retire in the next five to ten years. In addition, the ‘experience’ profile of mathematics teachers means that long service leave is an important factor in workforce planning. Even schools that have yet to experience difficulty filling continuing positions are concerned by the shortage of suitable teachers to cover classes when staff take extended periods of leave.
Most teachers of senior school mathematics are mathematics specialists. They teach mathematics classes across a range of year levels, but have limited involvement in teaching other subjects. On average they have the strongest mathematics-specific qualifications and the most teaching experience. Most heads of mathematics departments in schools require teachers of senior school mathematics to have at least a major in the discipline. Preparation for the replacement of these teachers in coming years presents a challenge for universities. Increasing numbers of graduates with high-level mathematics knowledge and teaching skills will be needed by secondary schools.
The earlier years of mathematics schooling also deserve attention. Many junior school mathematics classes are taken by teachers whose mathematics background is limited. These teachers are the most likely to teach other subjects, such as science at junior and middle school. They are younger, less experienced and the least satisfied with their tertiary preparation for their current teaching role. Heads of mathematics departments are also less satisfied with their schools’ strength in mathematics teaching at the more junior school levels. If teachers are to be expected to teach both science and mathematics, they need suitable preparation in both disciplines.
What constitutes effective preparation for teaching mathematics? Mathematics teachers need a strong tertiary background in mathematics as a discipline. They also need practical teaching skills specific to teaching mathematics. Tertiary studies with integrated in-school experience are highly valued, and the further development of these skills should be fostered during the early years of school placement.
Tertiary preparation that included high level mathematics study was valued by both mathematics teachers and heads of mathematics departments in schools. The fact that the specific mathematics concepts and topics taught at university are often not introduced at secondary school was acknowledged. However, teachers’ development of higher level understanding was seen as essential preparation for conveying both concepts and enthusiasm.
Education studies that included practical experience and teaching method subjects specific to mathematics were highly valued by the teachers surveyed. The most passionate comments from teachers regarding their tertiary training referred to the need for extensive in-school experience, integrated with the on-campus components of their teacher training. Teachers with the highest levels of mathematics teaching methods studies were among the most satisfied with their tertiary preparation for their teaching duties. Teachers believed that some aspects of their education studies were less relevant for pre-service courses, typically describing these as ‘too theoretical’.
Retaining mathematics teachers in schools Fewer than half the teachers surveyed were confident that they would be teaching mathematics in five years time. In addition to those considering retirement, teachers cited the stressful nature of the job and uncertain tenure as influences leading to their uncertainty. Major curriculum changes in Western

59
Australia were causing dissatisfaction and concern among teachers and heads of mathematics in that state.
Career uncertainty was highest among young, early-career teachers. This highlights the value in providing a supportive and attractive school environment if the loss of large numbers of new teachers is to be avoided. The findings point to a trend in recent years for teachers to have come to teaching as a ‘second profession’. It is worth noting that early-career teachers who have followed this pathway were more certain of their future as teachers than were their first-profession colleagues.
Irrespective of their qualifications, teaching experience or pattern of teaching responsibilities, mathematics teachers encouraged the provision of ongoing professional development opportunities. They valued professional development that was practical, relevant to the discipline, and that encouraged greater networking and sharing of ideas and resources.
Attracting people to careers in mathematics teaching Both heads and teachers advocated greater financial incentives in order to attract more people to mathematics teaching in the future. They also described a need to promote both mathematics and teaching in schools, universities and society more broadly. Societal attitudes toward the teaching profession were of concern to many teachers, and seen as a disincentive for people considering a career in teaching.
The demand for teachers with strong mathematics backgrounds is set to increase dramatically in coming years. Governments and universities need to be alert to this, and to be ensuring that sufficient numbers of graduates have the necessary knowledge, skills and motivation to meet the rising demand. Failure to do so will have consequences beyond secondary schools. Mathematical understanding is central to many disciplines, studies and professions. Australia cannot afford to compromise the ability of schools to offer the best in mathematics teaching.

60
Appendix 1: Schools surveyed – additional information A.1.1 Schools surveyed
A database of school details was obtained from a commercial source, Prime Prospects (Melbourne).
Permission to survey government schools was sought and obtained from the relevant state and territory based government authorities. Catholic diocese’/Archdiocese’ were approached for permission to survey Catholic schools. Permission was received from all except three that did not respond. The 23 schools they represented were therefore excluded from the survey. All independent schools were contacted directly.
In total, 2808 schools were surveyed.
A.1.2 Further description of the dataset
State and sector responses are detailed in Chapter 2. The following tables detail responses from: different ARIA regions (Table A1.1); country and metropolitan schools (Table A1.2); schools of different sizes (Table A1.3); and schools offering various year level combinations (Table A1.4). Table A1.1 Number of responses from teachers, heads and schools, grouped by state/territory and ARIA
code. Schools represented by teacher response(s), head response, or both
Highly Accessible (n=1927 schools
surveyed)
Accessible (n=436 schools
surveyed)
Moderately Accessible
(n=218 schools surveyed)
Remote or Very Remote
(n=227 schools surveyed)
Teac
hers
(n
)
Hea
ds
(n)
Scho
ols
(n)
Scho
ols
(%
resp
onse
rate
)
Teac
hers
(n
)
Hea
ds
(n)
Scho
ols
(n)
Scho
ols
(%
resp
onse
rate
)
Teac
hers
(n
)
Hea
ds
(n)
Scho
ols
(n)
Scho
ols
(%
resp
onse
rate
)
Teac
hers
(n
)
Hea
ds
(n)
Scho
ols
(n)
Scho
ols
(%
resp
onse
rate
) ACT 68 11 16 36 * * * * * * * * * * * *
NSW 531 120 170 27 156 36 59 35 22 9 9 21 6 2 4 22
NT * * * * 33 6 8 42 2 1 1** 100 18 4 5 10
QLD 302 71 85 29 48 11 19 26 79 18 24 31 22 5 10 21
SA 233 53 67 42 46 11 14 34 29 7 9 38 11 6 7 22
Tas 79 13 19 33 19 9 9 27 1 1 1** 13 0 0 0** 0
Vic 792 121 173 31 67 18 18 26 38 9 12 41 * * * *
WA 275 57 71 38 22 9 12 34 16 7 11 31 9 6 9 12
all 2280 446 601 31 391 100 139 32 187 52 67 31 66 23 35 15
* No schools listed in this classification ** Fewer than ten schools surveyed in this region
Note regarding ARIA codes Accessibility/Remoteness Index of Australia (ARIA) categories: schools were classified into one of 5 ARIA categories. These are based on road distances to large population centres, and excude any reference to socio-economic status or urban/rural environment. From most to least accessible they are: Highly Accessible (HA); Accessible (A); Moderately Accessible (MA); Remote (R) and Very Remote (VR).

61
Table A1.2 Number of responses from schools: grouped by state/territory and country/metropolitan
classification. Schools represented by teacher response(s), head response, or both Country schools Metropolitan schools
number of schools
surveyed
number of schools
represented in dataset
response rate %
number of schools
surveyed
number of schools
represented in dataset
response rate %
ACT * * * 44 16 36
NSW 427 129 30 433 113 26
NT 55 7 13 16 7 44
QLD 355 92 26 135 46 34
SA 118 36 31 141 61 43
Tas 49 15 31 51 14 27
Vic 247 85 34 403 117 29
WA 160 36 23 174 67 39
all states/ territories 1411 400 28 1397 441 32
* No schools listed in this classification Table A1.3 Number of responses from schools: grouped by school size (ie student enrolment). Schools
represented by teacher response(s), head response, or both
number of students enrolled
number of schools
surveyed
number of schools
represented in dataset
response rate %
< 101 564 75 13
101 – 200 266 67 25
201 – 400 404 134 33
401 – 600 395 153 39
601 – 800 406 146 36
801 – 1000 318 114 36
> 1000 310 111 36
unclassified 145 41 28
2808 841 30
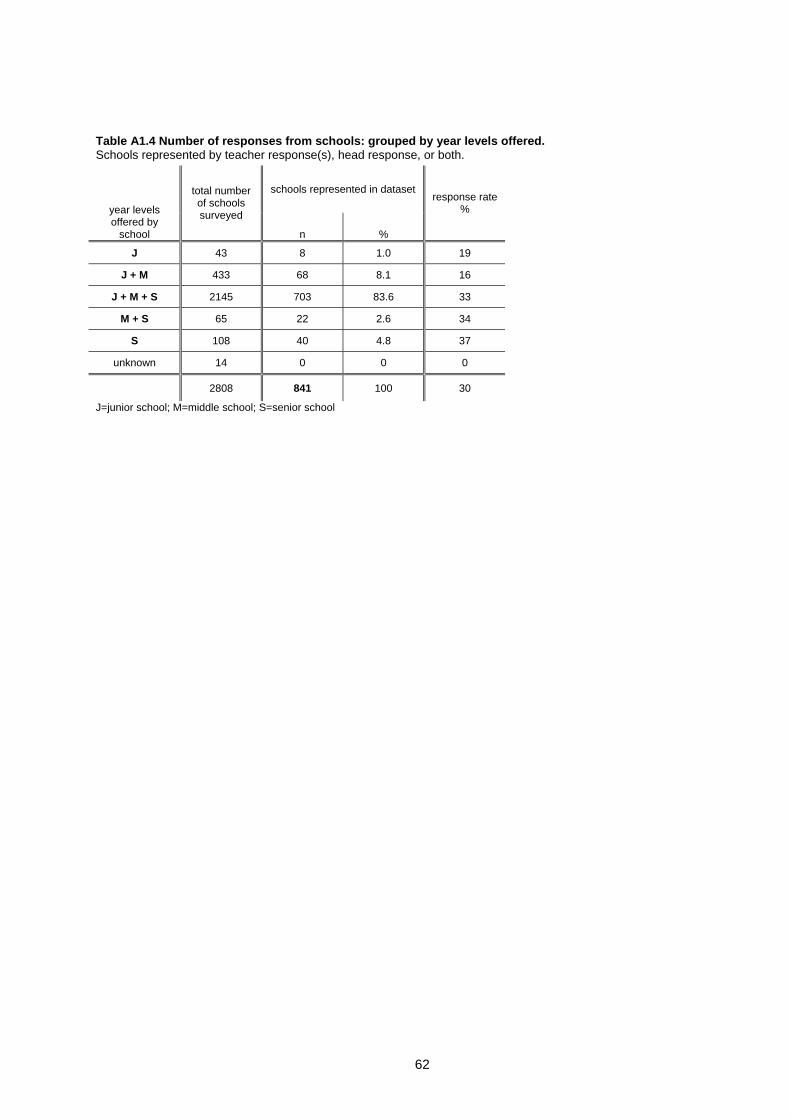
62
Table A1.4 Number of responses from schools: grouped by year levels offered. Schools represented by teacher response(s), head response, or both.
schools represented in dataset
year levels offered by
school
total number of schools surveyed
n %
response rate %
J 43 8 1.0 19
J + M 433 68 8.1 16
J + M + S 2145 703 83.6 33
M + S 65 22 2.6 34
S 108 40 4.8 37
unknown 14 0 0 0
2808 841 100 30
J=junior school; M=middle school; S=senior school

63
Appendix 2: Senior school mathematics subjects Senior school mathematics subjects were categorised as elementary, intermediate, advanced and ‘other’ (Table A2.1), based on a recent comparison of year 11 and 12 mathematics curricula23 Table A2.1 Categorisation of senior school mathematics subjects1 Elementary Intermediate Advanced Other
NSW General Mathematics Mathematics Maths Extension 1 Maths Extension 2 Mathematics Life Skills
Vic Further Mathematics Mathematical Methods Specialist mathematics Foundation Mathematics General Mathematics
QLD Mathematics A Mathematics B Mathematics C Logic Philosophy and Reason
SA Mathematical Methods Mathematical studies Specialist mathematics
NT Mathematical Methods Mathematical studies Specialist mathematics
ACT Mathematical Applications Mathematical Methods Specialist mathematics
WA Discrete Mathematics Applicable Mathematics Calculus
Tas Mathematics Applied Mathematics Methods Mathematics Specialised
23 Barrington & Brown (2005)

64
Appendix 3: Demographics of mathematics teachers – additional information Chapter 6 describes the age distribution, teaching experience and gender characteristics of mathematics teachers nationally. Section 6.3 includes an analysis of age by employment history, and Section 6.4 describes the gender ration of teachers of various year levels. Table A3.1 details the distribution of mathematics teachers by three criteria: age; teaching experience; and gender. Table A3.1 Age , teaching experience and sex of mathematics teachers, showing number in each
age/experience category, and female percentage (in italics)
teaching experience (years)
age (years) < 5 5-9 10-14 15-19 20-24 25-29 30+ Total*
%
female
< 25 81 65.4 81 65.4
25-29 190 55.3
93 66.7 283 59.0
30-34 54 46.3
132 54.5
71 59.2
257 54.1
35-39 46 52.2
62 45.2
94 51.2
111 64.9 313 55.0
40-44 44 47.7
46 60.2
50 64.0
99 44.4
126 54.8 365 53.2
45-49 34 41.2
36 41.7
31 51.6
50 64.0
151 44.4
143 43.4
3 33.3 448 45.8
50-54 15 33.3
23 52.2
39 59.0
55 61.8
86 58.1
204 38.2
208 40.4 630 45.4
55-59 7 0
4 0
12 58.3
18 72.2
35 45.7
57 43.9
217 30.9 350 36.6
60+ 3 0
3 0
1 0
4 25.0
4 0
9 5.6
63 34.9 87 32.2
Total* 474 399 298 337 402 413 491
% female 52.1 54.4 56.4 58.2 50.2 40.9 35.2
*Includes the 2814 responses that included both age and teaching experience

65
Appendix 4: Mathematics teachers’ original motivations – additional information The factors that originally attracted the responding mathematics teachers to the teaching profession are described in Chapter 8. Table A4.1 presents responses grouped by state/territory. Table A4.1 Original attraction to the profession of teaching, grouped by state and sector
Proportion of teachers listing this response1 to the question: What originally attracted you into the profession of teaching?
(%)
Rewarding nature
(n=1781)
Opportunities for social
interaction (n=1025)
Love of Mathematics
(n=1413) Job security
(n=1224) Salary
(n=451)
Working conditions (n=1272)
Other (n=491)
All teachers (n=2859) 62.3 35.8 49.4 42.8 15.8 44.5 17.2
ACT (n=67) 67.2 37.3 58.2 37.3 9.0 47.8 31.3
NSW (n=710) 60.7 34.5 57.7 42.8 14.5 44.4 19.6
NT (n=53) 69.8 32.1 39.6 39.6 13.2 34.0 26.4
QLD (n=428) 54.7 34.3 44.4 50.0 20.3 49.5 13.3
SA (n=313) 64.5 41.5 42.8 44.7 21.7 40.9 17.3
TAS (n=98) 60.2 32.7 35.7 51.0 27.6 61.2 21.4
VIC (n=877) 67.5 37.7 45.2 38.8 12.8 41.5 15.8
WA (n=313) 57.8 31.3 60.1 41.5 13.1 45.7 14.7

66
References
Barrington, F. and Brown, P. (2005) Comparison of Year 12 Pre-tertiary Mathematics Subjects in Australia 2004-2005. International Centre of Excellence in Mathematics and the Australian Mathematics Sciences Institute. October 2005.
Department of Science, Education and Training. (2003a) Australia’s Teachers: Australia’s Future: Advancing Innovation, Science, Technology and Mathematics
Department of Science, Education and Training (DEST) (2003b). Australia’s Teachers: Australia’s Future: Advancing Innovation, Science, Technology and Mathematics. Agenda for Action.
Education and Training Committee, Parliament of Victoria. (2006) Inquiry into the Promotion of Mathematics and Science Education. March 2006.
Harris, K-L., Jensz, F. and Baldwin, G. (2005) Who’s Teaching Science? Meeting the demand for qualified science teachers in Australian secondary schools. Report prepared for Australian Council of Deans of Science. January 2005.
Ministerial Council on Education, Employment, Training and Youth Affairs (MCEETYA) (2003a), A national framework for professional standards of teaching. Report prepared by Teacher quality and education leadership taskforce. November 2003
Ministerial Council on Education, Employment, Training and Youth Affairs (MCEETYA) (2003b), Demand and Supply of Primary and Secondary School Teachers in Australia
Ministerial Council on Education, Employment, Training and Youth Affairs (MCEETYA) (2005), Demand and Supply of Primary and Secondary School Teachers in Australia
National Centre of Science, Information and Communication Technology, and Mathematics Education for Rural and Regional Australia (SiMERR). Study in progress: Issues in Teaching and Learning Science, ICT, and Mathematics in Rural and Regional Australia: A National Survey. http://simerr.une.edu.au/projects/survey.html (accessed 6 May 2006). Department of Education, Science and Training.