The Power of Signaling: Presidential leadership and rhetoric over...
31
1 The Power of Signaling: Presidential leadership and rhetoric over 20 years Abstract Purpose: Our research explored the importance of leadership rhetoric with a theoretical foundation of signaling theory. Past research mostly focuses on followers and not other stakeholders, in specific to our research; investors, and we attempt to fill that research gap. Design/methodology/approach: Our research explored nearly 20 years and 51,500 pages of information from USA Presidents and explored the impact on stock market volatility using GARCH. Findings: Our research findings suggest that leaders can/do have an influencing impact on stakeholders. In particular negative statements will cause the greatest reaction due to risk adverse stockholders, neutral rhetoric will calm the market and decrease volatility and positive rhetoric was not significant. Research limitations/implications: Past research suggests that a focus on the consequences of leadership rhetoric be explored and our research suggests that people do respond to influential leaders, even if they are not followers. Also we filled a gap in regard to the impact of leader communication about economic and marketplace events. Practical implications: Practitioners benefit from our research as they can focus upon the USA Presidents’ rhetoric and strategically apply our research as they can predict the movement of the stock market immediately thereafter. Originality/value. Very little research has ever explored the impact of a leader’s rhetoric and the subsequent economic impact, and no one has explored in particular the President’s rhetorical impact (who is considered by many the top leader in the USA).
Transcript of The Power of Signaling: Presidential leadership and rhetoric over...
1
The Power of Signaling: Presidential leadership and rhetoric over 20 years
Abstract
Purpose: Our research explored the importance of leadership rhetoric with a theoretical
foundation of signaling theory. Past research mostly focuses on followers and not other
stakeholders, in specific to our research; investors, and we attempt to fill that research gap.
Design/methodology/approach: Our research explored nearly 20 years and 51,500 pages of
information from USA Presidents and explored the impact on stock market volatility using
GARCH.
Findings: Our research findings suggest that leaders can/do have an influencing impact on
stakeholders. In particular negative statements will cause the greatest reaction due to risk
adverse stockholders, neutral rhetoric will calm the market and decrease volatility and
positive rhetoric was not significant.
Research limitations/implications: Past research suggests that a focus on the consequences of
leadership rhetoric be explored and our research suggests that people do respond to
influential leaders, even if they are not followers. Also we filled a gap in regard to the impact
of leader communication about economic and marketplace events.
Practical implications: Practitioners benefit from our research as they can focus upon the
USA Presidents’ rhetoric and strategically apply our research as they can predict the
movement of the stock market immediately thereafter.
Originality/value. Very little research has ever explored the impact of a leader’s rhetoric and
the subsequent economic impact, and no one has explored in particular the President’s
rhetorical impact (who is considered by many the top leader in the USA).
2
The Power of Signaling: Presidential leadership and rhetoric over 20 years
Introduction
Recent research on the use of imagery in the campaign speeches of President Barrack
Obama and contender John McCain suggest how influential rhetoric can be over stakeholders
(McGuire, Garavan, Cunningham and Duffy, 2016). Although Presidential leadership research
continues (Williams et al., 2012; Beck et al., 2012) very little leadership literature has focused
on how leaders react to, and communicate about, economic and marketplace events (Bligh and
Hess, 2007). Also, past research indicates that most approaches to leadership focus almost
extensively on followers and not upon other stakeholders (Ammeter, Douglas, Gardner,
Hochwater and Ferris, 2002) while adequate consideration to the context as well as the
consequences of leaders’ behaviors should be explored (House and Aditya, 1997). Our
research attempts to address all 3 of these contentions (i.e. other stakeholders than a follower
which in our research is the investment community, consequences of behaviors, and
communication about economic/marketplace events).
Rhetorical leadership in regard to the President has been described as information of
which the President expresses publicly (Wood, 2002, 2004; Eshbaugh-Soha, 2005). There is
a robust body of literature on the president and their rhetorical impact on the economy (not
market volatility of which we investigate) (i.e., Beck, 1991; Light, 1999; Niskanen, 1988;
Roundtree, 1995; Tufte, 1978; Wood, 2002; Wood, 2004), but as Eshbaugh-Soha (2005:719)
notes, “…we do not have a theory of how presidents might influence the economy directly
through their rhetoric”, and little literature on how the president’s rhetorical signals influence
the stock market. Presidential rhetoric is the most underappreciated force in politics, because
it does not disappear, rather presidential rhetoric lasts forever (Alter, 2005).

3
Presidential rhetoric can have five key characteristics (Alter, 2005; Muir, 1992;
Gelderman, 1997; Goodwin, 1994; Reeves, 1991; Sorensen, 1988): First, it is memorable and
can shape how we discuss and view a myriad of topics. Second, presidential rhetoric can be
uplifting. Third, presidential rhetoric can be depressing. Fourth, presidential rhetoric can have
life or death consequences. Fifth, presidential rhetoric can be persuasive. In regard to
presidential rhetoric and the economy, past research suggests that there is a correlation between
presidential rhetoric and inflation and unemployment (Wood, 2002, 2007). Other research
suggest that presidential signals seem to have an impact as long as they have the authority to
act on those signals, act in the short run, and have a measure of credibility in the workplace
(Eshbaugh-Soha, 2007). Presidential rhetoric is an influential instrument of economic
leadership that can affect the marketplace’s perception of current and future economic
conditions and is a cue for businesses and consumer making decisions on investment and
spending (Wood 2004; Wood, et al, 2005).
The electronic media has created a greater impact over what Presidents say and is very
quickly disseminated (immediately in many cases) (Sarros, Luca, Densten and Santora, 2014).
This assisted our study as we utilized as many informational variations such as press
conferences, Q & A sessions with reporters, radio addresses, addresses to joint sessions of
Congress, addresses to the nation, and announcements of economic programs for about 20
years filling over 51,500 pages of information. The purpose of this study was to assess the
influence of leadership rhetoric by using one of the most significant leaders in the USA, the
President of the United States, as they can focus the public’s attention on a particular issue
through presidential rhetoric (Baumgartner and Jones, 1993). Economic policy is an important
factor to the presidency as research suggests it correlates to future electoral success (Campbell,
2000); so presidents will frequently devote a large share of their rhetoric in discussing current
economic conditions and potential solutions (Eshbaugh-Soha and Peake, 2005). Yet we found
4
no research that attempted to explore whether this economic Presidential rhetoric had any effect
stock market volatility. Stock market volatility is the non-normal buying and selling of stock,
while the stock market in total does not change, also known as a rebalancing of portfolio.
Hence, our research explores leadership rhetoric through the U.S. presidents and to measure its
subsequent impact on the investment community through stock market volatility.
Our research is important for a variety of reasons. First, we measure the influence of
leadership rhetoric by the consequences of the reactions in the marketplace (or lack thereof).
In addition, we explore the empirical impact of this critical communication format. Other past
leadership research in regard to the president, primarily focuses on presidential charisma,
popularity ratings, etc. But, past research (except for a few exceptions) has not explored the
consequences of presidential rhetoric directly toward the investment community. In particular,
we focus on presidential rhetoric in regard to the economy, inflation, interest rates and the
deficit and the reaction by experts in the marketplace, the investors. Extensive research, and
the foundation for most economic and finance theory, suggests that new information will cause
investors to immediately react, but there has been limited research performed as to whether
presidential rhetoric has the ability and importance to affect the stock market. Our paper is
organized as follows: we explore the leadership research in regard to leadership rhetoric, then
introduce the underlying theoretical foundation of signaling theory, then proceed into our
methods.
Leadership and Leader Rhetoric
Leadership research continues to be very active, and over the years has given birth to
numerous theoretical foundations in attempting to understand the phenomena. There is much
research that has performed comprehensive reviews and as such will not replicate their work
(e.g., Bligh, Kohles, Pilai, 2011; Mumford, 2011; Gardner, Lowe, Moss, Mahoney, Cogliser,
2010; Bass, 1990; House and Aditya, 1997; Yukl and Van Fleet, 1992) but will focus on the

5
research gap that we are exploring. Rhetorical leadership can be either formal and/or informal
communication used by leaders to convey their message to stakeholders (Naidoo and Lord,
2008).
Rhetorical leadership has been explored in recent leadership research including, how
Bush’s speeches changed after the September 11 crisis (Bligh, Kohles and Meindl, 2004), that
Federal Reserve Chairman rhetoric was a manifestation of his leadership style (Bligh and Hess,
2007), use of metaphors in a leader’s rhetoric to inspire audiences (Mio, Riggio, Levin and
Reese, 2005), how imagery in a leader’s rhetoric impacted ratings of charisma (Emrich,
Brower, Feldman and Garland, 2001), how presidential expressions of optimism influence
marketplace performance (Wood, Owens and Durham, 2005), how CEO speeches are related
to globalization intent (Den Harog and Vergur, 1997), and which type of leadership rhetoric
can be effective for social change (Seyranian and Bligh, 2008)
Rhetorical leadership is important for the president of the United States as there is
extensive media exposure and then subsequent public scrutiny (Sarros, Luca, Densten and
Santora, 2014; Foti, Fraser and Lord, 1982). The role of the Executive Branch has evolved
over the years and now has numerous foci from international engagement to discussions about
the economy, with the president having much discretionary action through his use of rhetoric
(Renshon, 1998). Presidential leadership is a relational process through which the president is
constantly interacting with stakeholders (Neustadt, 1960) and with new technologies and 24/7
cable television rhetoric becomes more central in the evaluation of an administration’s handling
of complex environmental problems.
Our research, however, continues the stream of research in regard to rhetorical
leadership and leadership effectiveness (Naidoo and Lord, 2008). The president has the
leadership role to influence others and proactively pursues an agenda impacting stakeholders
(Deluga, 1998). This leadership role identifies opportunities, takes direct action and perseveres

6
until the goal is accomplished (Bateman and Crant, 1993). For example, recent research
suggests presidential rhetoric is a policy making instrument to expand presidential power
(Rottinghaus and Maier, 2007) and can set the country’s agenda (Kingdon, 1995). Presidential
power can be utilized in differing ways without the consent of Congress, the courts, and the
public, by signaling to the public through rhetoric a focus and a possible future agenda (Elsea,
2003; Deering and Maltzman, 1999).
Communication is an essential aspect of the leadership process (e.g. Bligh, Kohles and
Meindl, 2004; Conger and Toegel, 2002; Insch, Moore and Murphy, 1997) and the leadership
relationship to stakeholders is grounded in language and the process of communication
(Conger, 1991; Fiol, Harris and House, 1999; House and Shamir, 1993). Leadership is the
process of attempting to frame and define circumstances for other individuals (Smircich and
Morgan, 1982). Presidents are continuously commenting, formally and informally, on issues
throughout each day to assist to explain events that are occurring in the public and international
arena. Yet, the research question then becomes, is there any impact on stakeholders (in
specific, investors) due to this rhetoric (e.g., is the rhetoric effective)?
Leadership and Signaling Theory
We use signaling theory as our theoretical foundation as presidential proclamations are
often symbolic in nature (Mayer 2001; Howell 2003) and as such carry important substantive
policy influence affecting the marketplace, but may offer no concrete policy change at that time
(Rottinghaus and Meier, 2007). The unexpected timing of statements of economy, inflation,
interest rates and the deficit will cause signals to be observed by the market place affecting
investor decisions. Signaling theory is in regard to information asymmetry, as some
individuals/organizations will have more information than another. Information asymmetries
occur when different people know different things, hence signaling theory focuses on
information asymmetry reduction. Public information is freely available, yet is only a portion

7
of information that is available, as much information is private and only certain people may
have access to it.
There are a number of studies that discuss signals in the management field. For
example, present-focused rhetoric by the Chairman of the Federal Reserve Board signaled to
the markets that the Fed was working on the current situation (Bligh and Hess, 2007); a
workgroup leader displaying ethical leadership of dependability, self-discipline, responsibility
and high standards will signal this behaviour such as the group will develop a norm consistent
with that behavior (Walumbwa, Morrison and Cristensen, 2012); Leaders have multiple
reputations, each signaling a likelihood of behaviour to a given social context (Hall, Blass,
Ferris and Massengale, 2004); Celebrity CEOs leadership success is founded on reputation
which is grounded in signaling theory and on theories of mass communication (Treadway,
Adams, Ranft, and Ferris, 2009); The top leaders in multinational organizations signal through
informal web-based memos appropriate practices for subsidiaries and future leaders (Novicevic
and Harvey, 2004).
The basis for signaling theory is that the positive or negative private information
unavailable to others will be useful if one has access (Kirmani and Rao, 2000). This private
information has a privileged perspective regarding either new information, or additional new
details regarding older information. As presidents are insiders with access to numerous and
varied privileged information, they must determine which information they wish to disclose,
and as such signaling takes on a greater value due to its selective nature. Presidents also enjoy
the foundation of a “positivity bias” on how the public views the president (Greenstein, 1974;
Edwards and Wayne, 1997).
Although the signal itself is important, the “quality” of the signaler has been identified
in the research as significant (Connelly, Certo, Ireland and Reutzel, 2011). Quality of a signal
has been identified with the reputation of the signaler (Kreps and Wilson, 1982) and/or prestige

8
of the signaler (Certo, 2003) as there is much market noise and signaling and investors will
only focus on legitimate information. Recent research supports this assertion as a critical
component to signaling theory as both the sender’s identity and the signal sent, work together
for credibility, with the president as the credible individual who is signaling new information
to the marketplace (Cameron, Segal and Songer, 2000; Black and Owens, 2012).
The marketplace environment is fraught with signals, insider information, public
information, misinformation and noise that affect the reduction of information asymmetry
(Lester et al. 2006). For example, presidential rhetoric may provide an appropriate signal, but
the media outlets then comment and report introducing possible changes and alterations
(Carter, 2006). Other receivers influencing one another also have an opportunity to
alter/influence signals for their own advantage (Branzei et al. 2004). A bandwagon effect can
then occur as those that are not sure how to interpret a signal look to others and their actions,
translating into potential market volatility (Sliwka, 2007).
Research suggests that most market situations will involve multiple signalers, multiple
people receiving the signals, thus incurring varying signals (Connelly, Certo, Ireland and
Reutzel, 2011). As all investors are constantly seeking market information for portfolio
decision making, any information from a respected qualified source would affect these
decisions. Adding to the complexity of signals is the presence of false signalers, thus placing
more emphasis on the quality of the signal (Ndofor and Levitas, 2004), and as such, presidential
rhetoric becomes more valuable due to its inherent quality. The signal honesty, veracity,
genuineness/suspiciousness, or the associated underlying quality of the signaler is high in
presidential rhetoric due to the signaler’s integrity (Durcikova and Gray, 2009; Cohen and
Dean, 2005).
Presidents “go public” with information unexpectedly which signals the importance of
the new rhetoric (Kernell, 2003; Edwards, 2003) and just mentioning an issue heightens public
9
concern (Cohen, 1995) while ignoring an issue also has important implications and sends
signals (Giglio, 1991). Research suggests that the president is the most visible economic
commentator in the U.S. system and that the president’s optimism or pessimism when speaking
about the economy can have significant effects on U.S. economic growth and unemployment
affecting consumer perception of the current and future economic conditions (Wood, 2002;
2004; 2007). To compare the influence of the president to marketplace reaction, research
suggests the the second most powerful man in America is the Federal Reserve Board Chairman
who can send the financial markets into chaos with his rhetoric (Willett, 2005; Meyer, 2004;
Beales and Hughes, 2006).
The existing literature suggests that U.S. president is not responding to the marketplace,
but is attempting to “craft the future”, as announcements from the president are not driven by
only poor macroeconomic performance, as presidents talk steadily about the economy when
conditions are both good and bad (Wood, 2004). The timing of marketplace rhetoric provides
further signaling as each comment is first filtered through the massive executive branch
bureaucracy. For an item to get on the president’s agenda, potential agenda items might have
to pass through 13 offices before it reached the president’s office (Light 1999).
Efficient market hypothesis
Hypothesis Development
There has been abundant research that illustrates the causality of new information to
the market and how investors react to that new information immediately, and is the foundation
of most economic and financial theory. The Efficient Market Hypothesis (EMH) has been the
dominant theoretical foundation suggesting that whenever new relevant information appears,
investors update their expectations appropriately and act immediately (Fama, 1970). This
theory further suggests that stock prices adjust instantaneously to unexpected events and the
arrival of new information (Mehdian, Nas and Perry, 2008). Recent extensions of the theory

10
suggest that investors often overreact to new information (the Overreaction Hypothesis: see
DeBondt and Thaler, 1985) or that new information elevates uncertainty and risk in the equity
market (the Uncertain Information Hypothesis see Brown, Harlow and Tinic, 1988, 1993) both
causing investors to rebalance their portfolio. The only difference in these hypotheses is in
how the long-term effect of their immediate reaction to the new information affects their future
decisions.
New presidential rhetoric will cause investors to react as people will overweigh new
information and underweight prior information (Kahneman and Tversky, 1982) and
professional investors also display this same overreaction to new information (DeBondt and
Thaler, 1985). Even though there can be other marketplace and firm specific signals (i.e.
Dividend declaration), investors place an overly disproportionate importance to short-term
developments (Shiller, 1981). Investors are often overconfident (Locke and Mann, 2001) and
due to investor heterogeneity reactions will occur because of new information but the reaction
may not be uniform (Ekholm, 2006).
For example, new information in regard to the ratings of funds will cause investors to
buy newly upgraded funds and withdraw from downgraded funds, as the rating is a signal to
investors of potential returns (Faff, Parwada and Poh, 2007). An announcement of a small
shortfall in reported versus expected earnings often leads to an immediate overreaction by
investors who sell the firms’ stock (Hotchkill and Strickland, 2003). Firms who only changed
their name to a “.com” had dramatic increases in shareholder wealth even though the firm,
fundamentals, profit, etc. did not change (Cooper, Dimitrov and Rau, 2001).
Recent research used a comprehensive database of headlines about individual
companies and then compared to firms that did not have headline financial market information.
The results concluded that when new information was presented to the marketplace investors
overreacted to the new information (Chan, 2003). Similar research collected daily news stories
11
from The Wall Street Journal and Dow Jones News Wire, and found that new information
about particular firms had both positive and negative abnormal returns due to the new (positive
or negative) information in the article (Pritamani and Singal, 2001).
On a broader note in regard to country-wide-specific new information, coverage of
major news item in The New York Times correlated with a reaction in financial asset prices as
investors assign importance to prominent news topics (Klibanoff, Lamont and Wizman, 1998).
Other research investigated news releases in The Wall Street Journal and found investors
conducted a high degree of trading around the time of the news release. In particular, macro-
announcements about the economy, inflation, etc. showed volatility in regard to both good
news (buying of large firm stock) and bad news (selling of large firm stock) (Nofsinger, 2001).
Research into presidential rhetoric suggests it does have an effect on public reactions, that the
president has the ability to sway public opinion (Trager and Vavreck, 2011), and that his
presidential “saber rattling” can affect a country’s economic performance (Wood, 2009).
The importance of presidential economic rhetoric is highlighted by research that
suggests the president’s rhetoric on economic policy is signaling to congress to support his
solutions (Edwards and Barrett, 2000) as well as to the marketplace of future
changes/implementation items that may occur. Research into signaling theory suggests that
shareholders gain from making decisions based upon the information provided by the signaler,
or in this instance, the president. Shareholders would buy or sell their stock that signal more
profitable returns based upon the future suggested by this signaling by the president (Certo,
Daily, and Dalton, 2001).
Even of more importance to presidential rhetoric is the change in investor ownership
patterns over the years. A review of the NYSE and the NASDQ over the past two decades
suggest that the average holding period for stocks has fallen from roughly two years to about
10 months and many of the largest-capitalization technology stocks turn over their entire share

12
base every two or three months (Wall Street Journal, 2003). Empirical research investigating
this phenomenon suggests that when investors have short term horizons they may all herd on
the same information and may even choose to focus on information that is different from their
fundamental trading basics (Froot, Schargstein and Stein, 1992). Hence, short term volatility
should very well react immediately to new information from the president due to its sensitivity.
The assertion that presidential rhetoric creates a market response agrees with previous
research that the volatility of prices is directly related to the flow of information to the market
(Ross, 1989). Presidential communications could affect stock volatility as the early resolution
of uncertainty helps investors to plan (Epstein and Turnball, 1980). Portfolio holders show an
aversion to ambiguity (payoff probability occurrence) (Ahn et al., 2010; Bossaerts et al., 2010)
and this interaction between risk and ambiguity are illustrated through stock price volatility
from negative political announcements (Bloom, 2009).
In summary, our primary purpose of this study is to test the influence of presidential
rhetoric by addressing its effect on the stock market. Marketplace information may have been
already been made available to investors prior to the presidential rhetoric, but the president
then confirms, denies, or puts their own twist on the information signaling his potential further
actions or policy changes. Past research suggests that information can be positive, negative or
neutral. We test the following hypothesis in regard to presidential rhetoric and the stock
market:
H1: Negative Presidential signaling will increase stock market volatility
H2: Positive Presidential signaling will increase stock market volatility, but less than
negative rhetoric.
H3: Neutral Presidential signaling will decrease volatility in the stock market.
The rationale for our hypotheses, in summary, is that the president is very influential
and the first time they discuss marketplace information (the economy, inflation/interest rates,
or the deficit) their signals will cause investors to rebalance their portfolio to seek

13
firms/industries that will benefit from their signal and to exit firms/industries that may be
affected detrimentally. We hypothesize that when presidents make new positive or new
negative comments about the economy, that signal would create a short-term market response.
This immediate reaction to the new rhetoric is based upon the theoretical foundation of the
Efficient Market Hypothesis (EMH) that states investors will react immediately to important
new market information, and lesser/or none, to any repeat of the same information. To the best
of our knowledge, there has been no empirical work performed on the impact of the president’s
rhetoric on financial market volatility illustrating the influence of leadership rhetoric.
As investors are risk averse, negative news should have a greater impact than positive
news, as research suggests the media emphasizes negative news stories (Bennett, 2003).
Positive news will create volatility of those joining the “herd” to seek out greater returns (Froot,
Schargstein and Stein, 1992). Neutral news (those comments which are made a second time
(or third time, or fourth, etc.) or are of nothing that is of importance to the USA) will signal to
investors that no new information is forthcoming and no change in current policy thus volatility
will decrease.
Sample
In order to properly collect, code, and analyze presidential signals as they relate to
market responsiveness, data is used from two primary sources and a software application was
created uniquely for this project. For presidential signals, an electronic file of the Public
Papers of the President of the United States provides the most thorough and comprehensive
information including press conferences, Q & A sessions with reporters, radio addresses,
addresses to joint sessions of Congress, addresses to the nation, and announcements of
economic programs of any president. Every time the president says something about the
economy it had been recorded by the Public Papers. The study covers 1981 to 1999, nearly 20
years. All prepared and unprepared statements, proclamations, etc., that Presidents Reagan,

14
Bush, and Clinton made about the economy, whether they are positive, negative, neutral,
intended or unintended, verbal or written, are coded.
The second primary source of data gathering and analysis is the Standard & Poor's 500
(S&P 500) Index. S&P 500 Index is a weighted combination of 500 firms chosen based on
their market capitalizations and represents the large cap firms. Investors use this index to track
the broad domestic economy.
Methods
A software application was designed uniquely for this project. The first tool, the RTF
(rich-text format) document parser, reads through (parses) extremely large RTFs Public Papers
of the President of the United States, and isolates publication year, publication date, the
publication title (President’s Remarks at a News Conference, for example) and the paragraph
text under that particular title. President Reagan’s page count from 1981 to 1988 is 18,120,
President Bush’s page count from 1989 to 1992 is 10,512, and President Clinton’s page count
from 1989 to 1999 is 22,906. The second tool, the natural text search engine of Oracle database
technology, provides a visual front-end on the primary database table structure. The basic
keyword search operation allows the user to search the approximately 51,500 pages for the
keywords that are of interest. Documents that match are returned into a separate tree view
control. After parsing and categorization of texts, two graduate students in separate locations
examined each paragraph and identified when the president used the keywords (Economy,
Deficit, Inflation, and Interest Rate: see below for discussion of keywords) “positively”,
“negatively”, “neutrally”, or not at all (see tests for inter-rater reliability below).
As Laver et al. 2003 note, the use of computer-aided analysis offers a dramatic increase
in the amount of text that can be analyzed and automates the tediousness of human coding.
However, it is not a substitute for a good research design and computer-aided analysis does not
do away with extensive human input. For example, just looking at a sentence that contains the

15
keyword Economy, may not capture that the President is talking about Japan’s economy and
not the United States’. Moreover, computer programs fail to pick up nuance in a president’s
remarks and cannot handle words that have more than one meaning, phrases, or idioms and
thus human coding is needed (Weber, 1990).
Inter-rater Reliability
As this is perceptual data, inter-rater reliability is of utmost importance. As two coders
separately coded the signals, we compared for both the reliability of the judgments empirically,
and when there was a disagreement, the signal could then be coded appropriately. After two
raters finish coding all keyword signals, an analysis of inter-rater agreement was performed to
establish reliability. Based on guidelines provided by Lombard, et al. (2002) for calculating
and reporting inter-rater agreement, we followed the following steps: First, the measure of
inter-rater agreement is determined, using the proportion of percentage agreement; Second, a
level of 90% for reliability is established; Third, a pilot test is performed of 30 signals selected
randomly by year, by month and then by keyword; Fourth, since the pilot test indicated that
reliability levels will be adequate, another sample of the signals was performed.
The percentage agreement between the two coders, adjusting for chance agreements,
equals 79.29%. Landis and Koch (1977: 165) provide a table for interpreting κ values, and
those values are reproduced in Table 1. The 79.29% agreement between coders suggests that
inter-rater agreement is “substantial” as 81% is considered “nearly perfect”. We were
comfortable with our results that our data coding reflected the correct signals from presidential
rhetoric.
---- Insert Table 1 about here ----
Presidential Signal Categories
Signals are identified as Positive, Negative, Neutral, or No Value by examining a list of
keywords, Economy, Deficit, Inflation, and Interest Rate (Table 2). Positive signals are defined

16
as new optimistic economic news, initiatives, proclamations, etc. that the market would react
favorably during a given day when signaled by the president for the first time. Negative signals
are defined as new negative economic news, proclamations, sanctions, etc. that the market
would react unfavorably, signaled during a given day by the president for the first time.
Good news or bad news repeated a second time is considered neutral. Presidents often
repeat signals and rehash speeches about the economy, education, and social security, to name
a few issues. The theoretical foundation of Efficient Market Hypothesis (EMH) states that
investors pay attention to what the president says the first time, and any further rhetoric will
have no effect. We have grouped interest rate and inflation comments together for both
statistical and face validity purposes. In reality, interest rates and inflation and highly
correlated. When a country is experiencing high inflation, interest rates also increase. The
effect on professional investors that receive presidential rhetoric about high inflation will also
react similarly to high interest rates. Secondly, we found that statistically both high inflation
and interest rates were highly correlated. Finally, for statistical power for all three presidents
in our 20-year data, we need to combine the two, as there were not enough inferences separately
to make any reliable valid statistical conclusion.
---- Insert Table 3 and 4 about here ----
Controlling for Macroeconomic Announcements
Presidential signals are categorized as new if the president is talking about them for the
first time. However, investors are also following official macroeconomic announcements and
these announcement releases may coincide with the presidential signals that we are analyzing.
In this regard, we need to control for a significant number of announcements in our study
including Consumer Price Index (CPI), Producer Price Index (PPI), Industrial Production and
Capacity Utilization (IPCU), New Residential Construction, Productivity and Costs, Gross
Domestic Product (GDP), Employment Situation (Unemp), Personal Income and Outlays (PI)
17
and Federal Open Market Committee (FOMC) meeting dates. These are the major
announcements that are employed in the literature investigating effects of macroeconomic
news on the financial markets. The data for macroeconomic announcements is collected from
the website of Federal Reserve Bank of St. Louis. FOMC meeting dates are kindly provided
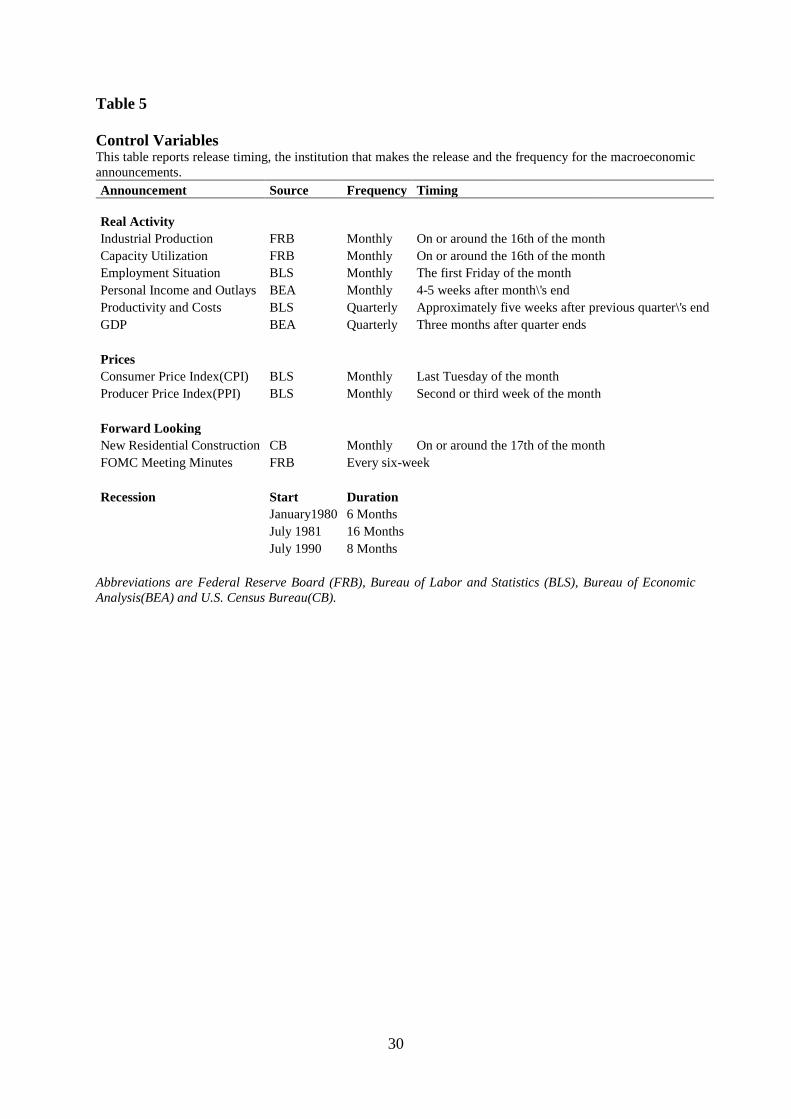
by Gurkaynak et al. (2005). Table 5 reports release timing, the institution that makes the release
and the frequency for the macroeconomic announcements that we include as controls. We
control for the announcement effects by employing a dummy variable which takes one on the
day of an announcement and zero otherwise.
There is also evidence that news effects differ across business cycles. Investors may
react to the same set of news differently in good and bad times (Blanchard, 1981; McQueen
and Roley, 1993). For example, Andersen, Bollerslev, Diebold and Vega (2007) find that
positive PPI and CPI shocks have significant effects on stock markets during expansion while
the same inflationary shocks do not have a significant effect on stock markets during recession.
In this respect, investors may also react differently to presidential signals during expansions
and recessions. Although our macroeconomic announcement day dummies may interact with
the business cycle timing, we control for the business cycle effect with employing dummies
for the recessions. The data for the chronology of business cycles are obtained from the website
of the National Bureau of Economic Research (NBER). We have only three recessions in our
sample period. The first one starts January 1980 and lasts for six months. The second one starts
July 1981 and lasts for 16 months. The final recession starts July 1990 and lasts eight months.
--------- Insert Table 5 about here ------------
Empirical Tests
This study explores how the president’s rhetorical signals influence the stock market volatility
of S&P 500 Composite Index. In order to capture the time varying nature of the conditional
variance of returns of the indices, we use Generalized Autoregressive Conditional
18
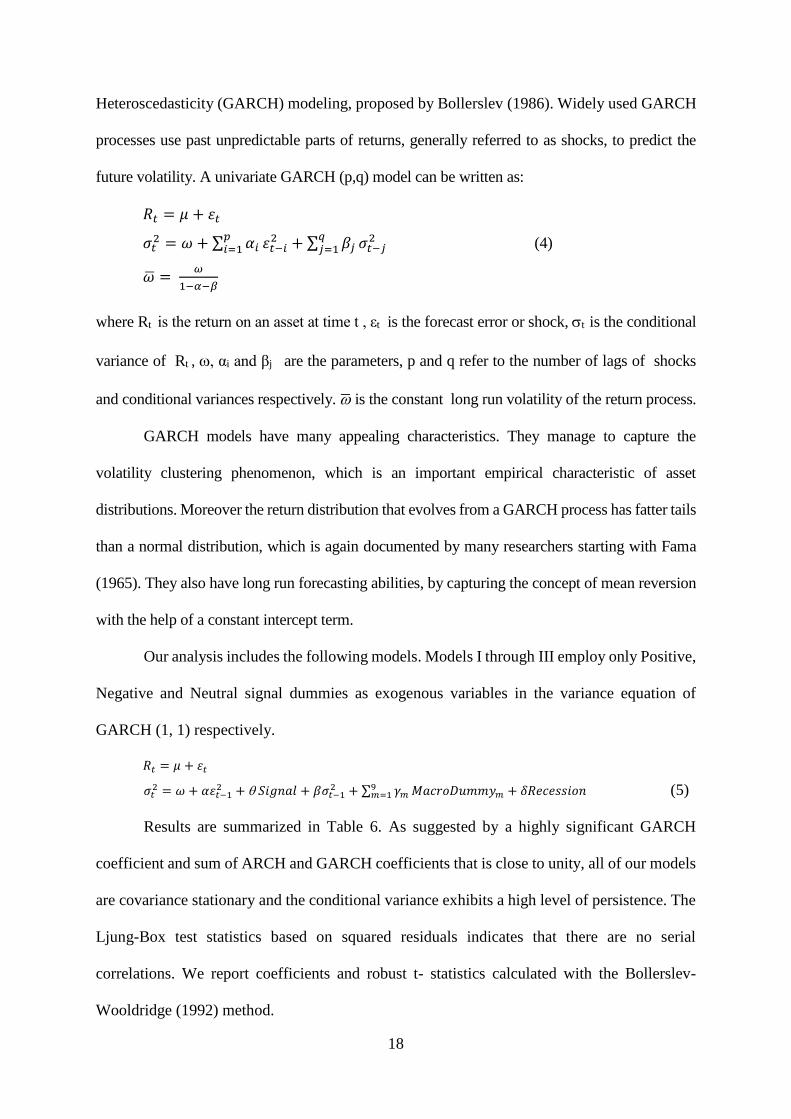
Heteroscedasticity (GARCH) modeling, proposed by Bollerslev (1986). Widely used GARCH
processes use past unpredictable parts of returns, generally referred to as shocks, to predict the
future volatility. A univariate GARCH (p,q) model can be written as:
𝑅𝑡 = 𝜇 + 휀𝑡
𝜎𝑡2 = 𝜔 + ∑ 𝛼𝑖
𝑝𝑖=1 휀𝑡−𝑖
2 + ∑ 𝛽𝑗𝑞𝑗=1 𝜎𝑡−𝑗
2 (4)
�̅� = 𝜔
1−𝛼−𝛽
where Rt is the return on an asset at time t , εt is the forecast error or shock, t is the conditional
variance of Rt , , αi and βj are the parameters, p and q refer to the number of lags of shocks
and conditional variances respectively. ̅ is the constant long run volatility of the return process.
GARCH models have many appealing characteristics. They manage to capture the
volatility clustering phenomenon, which is an important empirical characteristic of asset
distributions. Moreover the return distribution that evolves from a GARCH process has fatter tails
than a normal distribution, which is again documented by many researchers starting with Fama
(1965). They also have long run forecasting abilities, by capturing the concept of mean reversion
with the help of a constant intercept term.
Our analysis includes the following models. Models I through III employ only Positive,
Negative and Neutral signal dummies as exogenous variables in the variance equation of
GARCH (1, 1) respectively.
𝑅𝑡 = 𝜇 + 휀𝑡
𝜎𝑡2 = 𝜔 + 𝛼휀𝑡−1
2 + 𝑆𝑖𝑔𝑛𝑎𝑙 + 𝛽𝜎𝑡−12 + ∑ 𝛾𝑚
9𝑚=1 𝑀𝑎𝑐𝑟𝑜𝐷𝑢𝑚𝑚𝑦𝑚 + 𝛿𝑅𝑒𝑐𝑒𝑠𝑠𝑖𝑜𝑛 (5)
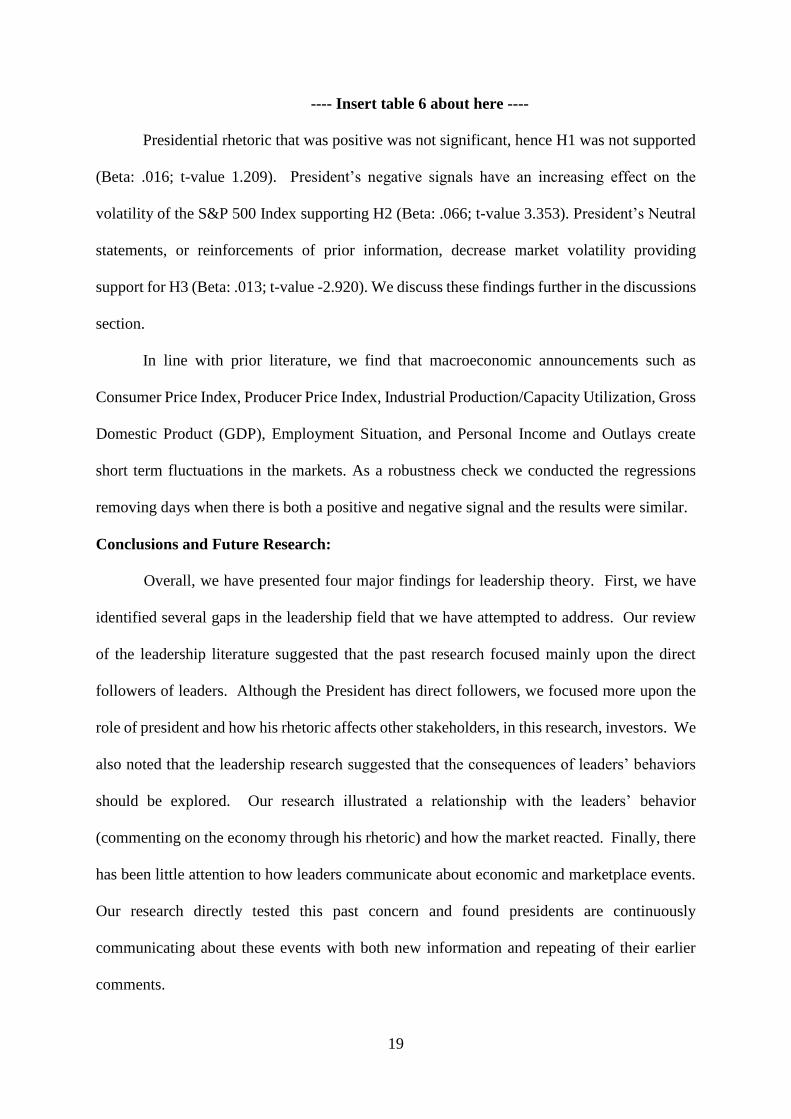
Results are summarized in Table 6. As suggested by a highly significant GARCH
coefficient and sum of ARCH and GARCH coefficients that is close to unity, all of our models
are covariance stationary and the conditional variance exhibits a high level of persistence. The
Ljung-Box test statistics based on squared residuals indicates that there are no serial
correlations. We report coefficients and robust t- statistics calculated with the Bollerslev-
Wooldridge (1992) method.
19
---- Insert table 6 about here ----
Presidential rhetoric that was positive was not significant, hence H1 was not supported
(Beta: .016; t-value 1.209). President’s negative signals have an increasing effect on the
volatility of the S&P 500 Index supporting H2 (Beta: .066; t-value 3.353). President’s Neutral
statements, or reinforcements of prior information, decrease market volatility providing
support for H3 (Beta: .013; t-value -2.920). We discuss these findings further in the discussions
section.
In line with prior literature, we find that macroeconomic announcements such as
Consumer Price Index, Producer Price Index, Industrial Production/Capacity Utilization, Gross
Domestic Product (GDP), Employment Situation, and Personal Income and Outlays create
short term fluctuations in the markets. As a robustness check we conducted the regressions
removing days when there is both a positive and negative signal and the results were similar.
Conclusions and Future Research:
Overall, we have presented four major findings for leadership theory. First, we have
identified several gaps in the leadership field that we have attempted to address. Our review
of the leadership literature suggested that the past research focused mainly upon the direct
followers of leaders. Although the President has direct followers, we focused more upon the
role of president and how his rhetoric affects other stakeholders, in this research, investors. We
also noted that the leadership research suggested that the consequences of leaders’ behaviors
should be explored. Our research illustrated a relationship with the leaders’ behavior
(commenting on the economy through his rhetoric) and how the market reacted. Finally, there
has been little attention to how leaders communicate about economic and marketplace events.
Our research directly tested this past concern and found presidents are continuously
communicating about these events with both new information and repeating of their earlier
comments.

20
Second, that presidential rhetoric is influential and when they are addressing economic
policy the market reacts to his signals. Our research continued the stream of rhetorical
leadership (Naidoo and Lord, 2008) through the president as research suggests communication
is an essential aspect of the leadership process and that the president is one of the most
influential people. Although no research has explored whether presidential rhetoric indeed is
as influential as to affect the stock market volatility. Our research concludes that when
presidential rhetoric is in regard to the economy, inflation, interest rates or the deficit, investors
will rebalance their portfolio and abnormal volatility will occur.
Third, we categorized the presidential rhetoric as positive, negative, or neutral to
understand the impact of the type of rhetoric that affects risk averse investors. Our results
indicate that negative rhetoric from the president will cause the greatest volatility in the
marketplace. This is typically due to the risk aversion of investors and the media prefers to
cover negative news over positive news so will apply more resources to report this new
information. Neutral rhetorical comments by the president illustrated decreased volatility, as
the president was signaling that there was no news forthcoming and the investors had all the
public marketplace information available. Neutral comments are supported by past research
as just mentioning an issue heightens public concern (Cohen, 1995) while ignoring an issue
(neutral rhetoric) also has important implications and sends signals (Giglio, 1991).
Positive presidential rhetoric was not significant and H1 was not supported. Although
our arguments suggested a relationship, leadership research in regard to charismatic leadership
provides a possible explanation (although one could argue Bush was not charismatic, both
Reagan and Clinton are considered very high in charisma according to past research).
Charismatic leaders are inspirational, use persuasive rhetoric, and express more positive
emotions (Beck, Carr and Walmsley, 2012) and as such the marketplace would expect a
continuous stream of positive information. Hence, savvy investors will not rebalance their

21
portfolio based on positive information that is continually entering the marketplace from the
president, but will react quickly and strongly upon negative rhetoric.
Fourth, we used a theoretical foundation of signaling theory. Although there is some
rhetorical leadership research that utilizes signaling (e.g. Bligh and Hess, 2007; Walumbwa,
Morrison and Cristensen, 2012; Hall, Blass, Ferris and Massengale, 2004; Treadway, Adams,
Ranft and Ferris, 2009) but very little research is directly associated signaling theory with
leadership rhetoric. Rhetoric is formal and informal communication used by leaders to convey
their message to stakeholders and can include voice inflections, eye contact or lack thereof, use
of figurative language and imagery, use of stories and metaphors, etc. As such the meaning
can often be emotive and is a signal, much often less a concrete statement. Our foundation of
signaling theory suggests that when presidential rhetoric is used, investors will react and market
volatility will be effected. We suggest that signaling theory should be considered in future
rhetorical leadership research.
It is important to note that this study, although it is over 20 years with over 51,000 pages
of documentation, is on three presidents and their rhetoric due to the limitation of the
availability of the data. This type of research can be important in exploratory research to
identify constructs, but we realize much more work will be needed to establish an empirical
link between leadership rhetoric and consequences (Eisenhardt, 1998). Also, this research is
focused on other stakeholders, not direct followers, and more research needs to evaluate that
link. Future research will also need to evaluate actual messages and the signal and the strength
of the reaction by stakeholders.
Implications for Managers and Organizations:
There are many implications for managers and organizations. Managers are always
attempting to develop future strategy through external environmental analysis. Their future
tactics depend upon an accurate assessment of how to utilize their current internal core

22
competencies in regard to the changing global facets of the marketplace. If managers can
include one more variable, that of presidential rhetoric, this will assist them in determining the
future of the marketplace. Items of critical importance could be issuance of stock, sales figures,
borrowing, bonds, inventory management, etc. that could be directly influenced by presidential
rhetoric due to stock market volatility. Also most top managers’ compensation is tied to their
firms’ stock price (stock, stock options, etc.) and presidential rhetoric could influence their
compensation.
From an investor’s view, the implications are enormous, as they trade within seconds
of new information and first movers could reap the largest rewards. For example, when
negative presidential rhetoric is announced, market volatility is predicted. Savvy investors
could then identify where the re-investment would take place and ‘short’ industries that would
be dropping and ‘buy’ into industries that would be rising. There are many techniques and
portfolio positions that these professionals can take, but just being aware that presidential
rhetoric affects the volatility of the stock market will give these professional investors and
advantage.

23
References
Ammeter, A. P., Douglas, C., Gardner, W. L., Hochwarter, W. A., & Ferris, G. R. (2002).
“Toward a political theory of leadership”. The Leadership Quarterly, Vol. 13 No. 6 pp.
751-796.
Bass, B. M. (1990). Bass and Stogdill's handbook of leadership: Theory, research, and
managerial applications (3rd ed.). New York: Free Press.
Bateman, T. S., & Crant, J. M. (1993). “The proactive component of organizational behavior:
A measure and correlates”. Journal of organizational behavior, Vol. 14 No. 2 pp. 103-
118.
Baumgartner, F., and Jones, B. (1993). Agendas and Instability in American Politics.
Chicago: University of Chicago Press
Beck, J., Carr, A. and Walmsley, P. (2012) "What have you done for me lately? Charisma
attenuates the decline in US presidential approval over time." The Leadership
Quarterly Vol. 65 No. 2 pp: 385-395.
Bligh, M. C., & Hess, G. D. (2007). “The power of leading subtly: Alan Greenspan,
rhetorical leadership, and monetary policy”. The Leadership Quarterly, Vol. 18 No. 2
pp, 87-104.
Bligh, M. and Kohles, J. (2009) "The enduring allure of charisma: How Barack Obama won
the historic 2008 presidential election." The Leadership Quarterly Vol. 20 No.3 pp:
483-492.
Bligh, M., Kohles, J. and Meindl, J. (2004) "Charisma under crisis: Presidential leadership,
rhetoric, and media responses before and after the September 11th terrorist attacks."
The Leadership Quarterly Vol. 15 No. 2 pp: 211-239.
Bligh, M. C., Kohles, J. C., & Pillai, R. (2011). “Romancing leadership: Past, present, and
future.” The Leadership Quarterly, Vol. 22 No. 6 pp, 1058-1077.
Branzei, O., Ursacki-Bryant, T. J., Vertinsky, I., & Zhang, W. (2004). “The formation of
green strategies in Chinese firms: Matching corporate environmental responses and
individual principles.” Strategic Management Journal, Vol. 25 pp: 1075-1095.
Calogero, R., and Mullen, B. (2008) "About face: Facial prominence of George W. Bush in
political cartoons as a function of war." The Leadership Quarterly Vol. 19 No.1 pp:
107-116.
Cameron, C., Segal, J. and Songer, D. (2000). “Strategic auditing in a political hierarchy: An
informational model of the Supreme Court's certiorari decisions.” American Political
Science Review Vol. 94 pp:101-16
Campbell, J. (2000). The American Campaign: U.S. Presidential Campaigns and the
National Vote. College Station: Texas A&M University Press.

24
Carter, S. M. (2006). “The interaction of top management group, stakeholder, and situational
factors on certain corporate reputation management activities.” Journal of
Management Studies, Vol. 43 pp: 1146-1176.
Certo, S. T. (2003). “Influencing initial public offering investors with prestige: Signaling with
board structures.” Academy of Management Review, Vol. 28 pp: 432-446.
Cohen, B. D., & Dean, T. J. (2005). “Information asymmetry and investor valuation of IPOs:
Top management team legitimacy as a capital market signal.” Strategic Management
Journal, Vol. 26 pp: 683-690.
Conger, J. A. (1991). “Inspiring others: The language of leadership.” The executive, Vol. 5
No. 1 pp, 31-45.
Conger, J. A., & Toegel, G. (2002). “A story of missed opportunities.” Grounding
Leadership Theory and Research: Issues, Perspectives and Methods, Vol. 1 pp, 175.
Connelly S., Brian, L. Trevis Certo, R. Duane Ireland and Christopher R. Reutzel (2011)
“Signaling Theory: A Review and Assessment,” Journal of Management, Vol. 37 Noç
1 pp: 39-67
Davis, W. and Gardner, W. (2004) "Perceptions of politics and organizational cynicism: An
attributional and leader–member exchange perspective." The Leadership Quarterly
Vol. 15 No.4 pp: 439-465.
Deering, C. and Maltzmanö F. (1999). “The politics of executive orders: Legislative
constraints on presidential power.” Political Research Quarterly Vol. 52 No. 4 pp:
767-83.
Deluga, R. (1998) "American presidential proactivity, charismatic leadership, and rated
performance." The Leadership Quarterly Vol. 9 No. 3 pp: 265-291.
Deluga, R. (2001) "American presidential Machiavellianism: Implications for charismatic
leadership and rated performance." The Leadership Quarterly Vol. 12 No.3 pp: 339-
363.
Den Hartog, D. N., & Verburg, R. M. (1997). “Charisma and rhetoric: Communicative
techniques of international business leaders.” The Leadership Quarterly, Vol. 8 No. 4
pp, 355−391.
Durcikova, A., & Gray, P. (2009). “How knowledge validation processes affect knowledge
contribution.” Journal of Management Information Systems, Vol. 25 No. 4 pp: 81-107.
Edwards, G. and Wayne, S. (1997). Presidential leadership: Politics and policy making. 4th
ed. New York St. Martin’s.
Elsea, J. (2003). “Presidential authority to detain “enemy combatants.” Presidential Studies
Quarterly Vol. 33 No. 3 pp: 568-601.
25
Emrich, C. G., Brower, H. H., Feldman, J. M., & Garland, H. (2001). “Images in words:
Presidential rhetoric, charisma, and greatness.” Administrative Science Quarterly, Vol.
46 No. 3 pp, 527-557.
Eshbaugh-soha, M. and Peakeö J. (2005) “Presidents and the Economic Agenda”, Political
Research Quarterly, Vol. 58 No. 1 pp: 127-138.
Fiol, C. M., Harris, D., & House, R. (1999). “Charismatic leadership: Strategies for effecting
social change.” The Leadership Quarterly, Vol. 10 No. 3 pp, 449-482.
Foti, R. J., Fraser, S. L., & Lord, R. G. (1982). “Effects of leadership labels and prototypes on
perceptions of political leaders.” Journal of Applied Psychology, Vol. 67 No. 3 pp,
326.
Gardner, W., Lowe, K., Moss, T., Mahoney, K. and Cogliser, C. (2010) “Scholarly leadership
of the study of leadership: A review of The Leadership Quarterly's second decade, 2000–
2009,” The Leadership Quarterly, Vol. 21 No. 6 pp: 1-15.
Greenstein, F. (1974). What the president means to Americans: Presidential ‘choice”
between elections. In Choosing the president, edited by J. D. Barber. Englewood
Cliffs, NJ: Prentice Hall.
Hall, A. T., Blass, F. R., Ferris, G. R., & Massengale, R. (2004). “Leader reputation and
accountability in organizations: Implications for dysfunctional leader behavior.” The
Leadership Quarterly, Vol. 15 No. 4 pp, 515-536.
House, R. J., & Aditya, R. N. (1997). “The social scientific study of leadership: quo vadis?”
Journal of Management, Vol. 23 pp, 409–473.
House, R. and Shamir, B. (1993) Toward the integration of transformational, charismatic,
and visionary theories. In Chemers, Martin M. (Ed); Ayman, Roya (Ed), (1993).
Leadership theory and research: Perspectives and directions. , (pp. 81-107). San Diego,
CA, US: Academic Press..
Immelman, A. (1998). “The political personalities of 1996 US presidential candidates Bill
Clinton and Bob Dole.” The Leadership Quarterly, Vol. 9 Vol. 3 pp, 335-366.
Insch, G. S., Moore, J. E., & Murphy, L. D. (1997). “Content analysis in leadership research:
Examples, procedures, and suggestions for future use.” The Leadership Quarterly, Vol.
8 No. 1 pp, 1-25.
Kingdon, J. (1995). Agendas, Alternatives, and Public Policies. Second Edition. Boston:
Little, Brown.
Kirmani, A. and Rao, A. (2000). “No Pain, No Gain: A Critical Review of the Literature on
Signaling Unobservable Product Quality.” Journal of Marketing, Vol. 64 No. 2 pp: 66-
79.
Kreps, D. M., & Wilson, R. (1982). “Reputation and imperfect information.” Journal of
Economic Theory, Vol. 27 pp: 253-279.

26
Lester, R. H., Certo, S. T., Dalton, C. M., Dalton, D. R., & Cannella, A. A. (2006). “Initial
public offering investor valuations: An examination of top management team prestige
and environmental uncertainty.” Journal of Small Business Management, Vol. 44 pp:
1-26.
McGuire, D., Garavan, T., Cunningham, J. and Duffy, G (2016) “The use of imagery in the
campaign speeches of Barak Hussein Obama and John McCain during the 2008 US
presidential election,” Leadership and Organization Development Journal. Accepted
for publication.
Mio, J. S., Riggio, R. E., Levin, S., & Reese, R. (2005). “Presidential leadership and
charisma: The effects of metaphor.” The Leadership Quarterly, Vol. 16 No. 2 pp, 287-
294.
Mumford, M. (2011) A hale farewell: The state of leadership research. The Leadership
Quarterly, Vol. 22 No.1 pp: 1-13.
Naidoo, L. and Lord, R. (2008) "Speech imagery and perceptions of charisma: The mediating
role of positive affect." The Leadership Quarterly Vol. 19 No.3 pp: 283-296.
Ndofor, H. A., & Levitas, E. (2004). “Signaling the strategic value of knowledge.” Journal of
Management, Vol. 30 pp: 685-702.
Neustadt, R. (1960). Presidential power. New York: Free Press.
Novicevic, Milorad M., and Michael G. Harvey. (2004) "The political role of corporate
human resource management in strategic global leadership development." The
Leadership Quarterly Vol. 15 No.4 pp: 569-588.
Ospina, S., & Foldy, E. (2009). “A critical review of race and ethnicity in the leadership
literature: Surfacing context, power and the collective dimensions of leadership.” The
Leadership Quarterly, Vol. 20 No. 6 pp, 876-896.
Pillai, Rajnandini, and Ethlyn A. Williams. (1998) "Does leadership matter in the political
arena? Voter perceptions of candidates' transformational and charismatic leadership
and the 1996 US president." The Leadership Quarterly Vol. 9 No.3 pp: 397-416.
Pillai, R., Williams, E. A., Lowe, K. B., & Jung, D. I. (2003). “Personality, transformational
leadership, trust, and the 2000 US presidential vote.” The Leadership Quarterly, Vol.
14 No. 2 pp, 161-192.
Renshon, S. A. (1998). The psychological assessment of presidential candidates. Routledge.
Rottinghaus, B. and Maier, J. (2007), “The Power of Decree: presidential Use of Executive
Proclamations, 1977-2005”, Political Research Quarterly, Vol. 60 No. 2 pp: 338-343.
Sarros, J., Luca, E., Densten, I. and Santora, J. (2012) “Leaders and their use of motivating
language,” Leadership and Organization Development Journal, Vol. 35 No. 3 pp: 226-
240.
27
Seyranian, V. and Bligh, M. (2008) "Presidential charismatic leadership: Exploring the
rhetoric of social change." The Leadership Quarterly Vol. 19 No.1 pp: 54-76.
Sliwka, D. 2007. “Trust as a signal of a social norm and the hidden costs of incentive
schemes.” American Economic Review, Vol. 97 pp: 999-1012.
Smircich, L., & Morgan, G. (1982). “Leadership: The management of meaning.” Journal of
Applied Behavioral Science, Vol. 18 No. 3 pp, 257-273.
Stulp, G., Buunk, A. P., Verhulst, S., & Pollet, T. V. (2013). “Tall claims? Sense and
nonsense about the importance of height of US presidents.” The Leadership Quarterly,
Vol. 24 No. 1 pp, 159-171.
Treadway, D. C., Adams, G. L., Ranft, A. L., & Ferris, G. R. (2009). “A meso-level
conceptualization of CEO celebrity effectiveness.” The Leadership Quarterly, Vol. 20
No. 4 pp, 554-570.
Walumbwa, F, Morrison, E. and Christensen, A. (2012) "Ethical leadership and group in-role
performance: The mediating roles of group conscientiousness and group voice." The
Leadership Quarterly Vol. 23 No.5 pp: 953-964.
Williams, E. A., Pillai, R., Lowe, K. B., Jung, D., & Herst, D. (2009). “Crisis, charisma,
values, and voting behavior in the 2004 presidential election.” The Leadership
Quarterly, Vol. 20 No. 2 pp, 70-86.
Williams, E., Pillai, R., Deptula, B. and Lowe, K. (2012) “The effect of crisis, cynism and
value congruence on perceptions of authentic leadership and attributed charisma in the
2008 presidential election,” The Leadership Quarterly, Vol. 23 No. 3 pp: 324-341.
Wood, B. D., Owens, C. T., & Durham, B. M. (2005). “Presidential rhetoric and the
economy.” Journal of Politics, Vol. 67 No. 3 pp, 627-645.
Yukl, G., & Van Fleet, D. D. (1992). Theory and research on leadership in organizations. In
M. D. Dunnette, & L. M. Hough (Eds.), Handbook of industrial and organizational
psychology, 2nd ed., vol. 3 (pp. 147–197). Palo Alto, CA: Consulting Psychologists
Press.

28
Table 1
Agreement Strength for Signaling Data
Kappa
Statistic
Strength of
Agreement
<0.00 Poor
0.00 - 0.20 Slight
0.21 – 0.40 Fair
0.41 – 0.60 Moderate
0.61 – 0.80
Substantial
0.81 – 1.00
Nearly
Perfect
Frequencies provided by Landis and Koch (1977).
Table 2
Keyword Descriptions
Keyword Description
Economy The total wealth and resources of the United States in terms of the
production and consumption of goods and services
Deficit When government spending exceeds the receipts (tax revenue) it
receives in a given year. The total accumulation of these deficits is the
national debt. Governments finance deficits through the bond market
Inflation An increase in the overall prices of goods and services in an economy
and the inflation rate is the percentage change in the Consumer Price
Index – a measure of the overall cost of the goods and services bought
by a typical consumer - from one period to the next, measured monthly.
Interest Rates The supply of money into the system is under the partial control of the
Federal Reserve System as it manipulates the federal funds rate through
the open market operations. As interest rates increase, economic actors
should borrow, consume, and invest less; as they decrease, economic
actors should borrow, consume, and invest more.
All definitions taken from (Mankiw, 2007)

29
Table 3
Average Number of Signals per Year This table presents summary statistics of the average number of times President Reagan, Bush, and Clinton
signaled to the market each year, using keywords Deficit, Economy, Inflation, and Interest Rates, from January
1981 to December 1999
President Deficit Economy Inf&Int
Rates
Reagan 61 115.5 108.25
Bush 60.25 134.25 55.25
Clinton 94.86 152.43 107.86
Table 4
Number of Positive and Negative Signals to the Market
This table presents summary statistics of the number of times President Reagan, Bush, and Clinton sent a positive
and negative signal to the market, using keywords Deficit, Economy, Inflation, and Interest Rates, from January
1981 to December 1999.
President Deficit Economy Inf&Int Rates
Pos Neg Ntrl Pos Neg Ntrl Pos Neg Ntrl
Reagan 36 14 422 85 38 658 30 15 741
Bush 10 8 196 70 52 340 20 13 139
Clinton 42 7 599 53 53 887 24 8 704
30
Table 5
Control Variables This table reports release timing, the institution that makes the release and the frequency for the macroeconomic
announcements.
Announcement Source Frequency Timing
Real Activity Industrial Production FRB Monthly On or around the 16th of the month
Capacity Utilization FRB Monthly On or around the 16th of the month
Employment Situation BLS Monthly The first Friday of the month
Personal Income and Outlays BEA Monthly 4-5 weeks after month\'s end
Productivity and Costs BLS Quarterly Approximately five weeks after previous quarter\'s end
GDP BEA Quarterly Three months after quarter ends
Prices Consumer Price Index(CPI) BLS Monthly Last Tuesday of the month
Producer Price Index(PPI) BLS Monthly Second or third week of the month
Forward Looking New Residential Construction CB Monthly On or around the 17th of the month
FOMC Meeting Minutes FRB Every six-week
Recession Start Duration
January1980 6 Months
July 1981 16 Months
July 1990 8 Months
Abbreviations are Federal Reserve Board (FRB), Bureau of Labor and Statistics (BLS), Bureau of Economic
Analysis(BEA) and U.S. Census Bureau(CB).

31
Table 6
GARCH (1, 1) Estimates for S&P 500 Index Returns on Presidential Signals and Controls
This table presents results for the estimation of following GARCH models.
𝑅𝑡 = 𝜇 + 휀𝑡
𝜎𝑡2 = 𝜔 + 𝛼휀𝑡−1
2 + 𝛽𝜎𝑡−12 + 𝑆𝑖𝑔𝑛𝑎𝑙 + ∑ 𝛾𝑚
8
𝑚=1
𝑀𝑎𝑐𝑟𝑜𝐷𝑢𝑚𝑚𝑦𝑚
Models I through III include only Positive, Negative and Neutral signals that the president sends to investors
respectively. Macroeconomic announcements enter the conditional variance equation as control dummies. The
return series is the S&P 500 Composite Index daily returns. Sample period is 1981 to 1999. We report the
coefficients and robust t- statistics calculated with the Bollerslev-Wooldridge (1992) method.
H2 H1 H3
Beta t-value Beta t-value Beta t-value Constant in Mean 0.065 5.639 0.068 5.867 0.066 5.656 Constant in Var. 0.015 3.312 0.016 3.573 0.023 4.267 ARCH(1) 0.074 31.778 0.075 31.850 0.074 31.435 GARCH(1) 0.917 234.507 0.916 230.764 0.915 217.200 Positive Signals 0.016 1.209
Negative Signals 0.066 3.353 ***
Neutral Signals -0.013 -2.920 ***
Controls
CPI -0.017 -0.417 -0.024 -0.621 -0.010 -0.243 Unemp. 0.095 3.140 *** 0.091 3.002 *** 0.097 3.288 ***
IPCU -0.036 -0.884 -0.052 -1.285 -0.025 -0.632 ResCons -0.018 -0.474 0.006 0.161 -0.032 -0.910 PPI 0.110 3.971 *** 0.084 2.640 *** 0.108 3.788 ***
GDP -0.164 -4.951 *** -0.153 -4.542 *** -0.144 -4.096 ***
PI 0.013 0.408 -0.003 -0.103 0.005 0.167 ProdCosts -0.097 -3.201 *** -0.094 -3.103 *** -0.084 -2.882 ***
*** Significant at .01
** Significant at .05
* Significant at .10