The Power of Data to Accelerate Development of Robust ... · 2096-WellPlate_AN_HR.pdf. 5. ......
22
1 The Power of Data to Accelerate Development of Robust & Scalable Manufacturing Processes Susan Abu-Absi Director, Manufacturing Sciences & Technology Bristol-Myers Squibb Devens, MA USA May 11, 2016 CMC Strategy Forum Europe 2016
Transcript of The Power of Data to Accelerate Development of Robust ... · 2096-WellPlate_AN_HR.pdf. 5. ......

1
The Power of Data to Accelerate Development of Robust & Scalable
Manufacturing Processes
Susan Abu-Absi
Director, Manufacturing Sciences & Technology
Bristol-Myers Squibb
Devens, MA USA
May 11, 2016
CMC Strategy Forum Europe 2016

2
Speed to Patient
On Platform
Readiness forCommercial
Launch Process
Phase 1 LifecyclePhase 2 Phase 3
Adaptive Trial Design
* *
* = traditional starting point
Accelerate early-phase compounds into late-stage trials
HARMONIZATION & PLATFORMS
DATA AGGREGATION
& ANALYSIS
Greater utilization of prior knowledge
Enable ongoing knowledge generation
CMC Strategy Forum Europe 2016

3
• Ongoing assurance that process remains in control
• Statistics-based monitoring and intervention when shifts and trends are identified
Process Development Ranging Studies Full-Scale Manufacturing Process Validation
• Acceptance criteria developed from small-scale data
• Fewer batches required
• Prior knowledge• Platform Technologies
− Cell Lines− Media− Resins− Methods
• Risk-Based Approach• Design of Experiments (DOE)
− Increased process knowledge− Understanding of parameter
interactions• Leverage scale-down models• Few full-scale runs with commercial
process before performance qualification lots
Process Development
Process Performance Qualification
Traditional
Enhanced
Time
Time
Process Characterization
Full-Scale Experience
Continued Process Verification
Evolution of Product Development
CMC Strategy Forum Europe 2016

4
• High throughput, rapid data generation
• Thorough exploration of design space and edge of failure
• Troubleshooting and continuous improvement
The Power of Scale-Down Models
CMC Strategy Forum Europe 2016
TAP Biosystems ambr™http://www.tapbiosystems.com
TPP TubeSpin® Bioreactorhttp://www.tpp.ch
PALL Life Sciences Application Note USTR 2795
http://www.pall.com/pdfs/Biopharmaceuticals/10-4610_DoE%2096-WellPlate_AN_HR.pdf
5
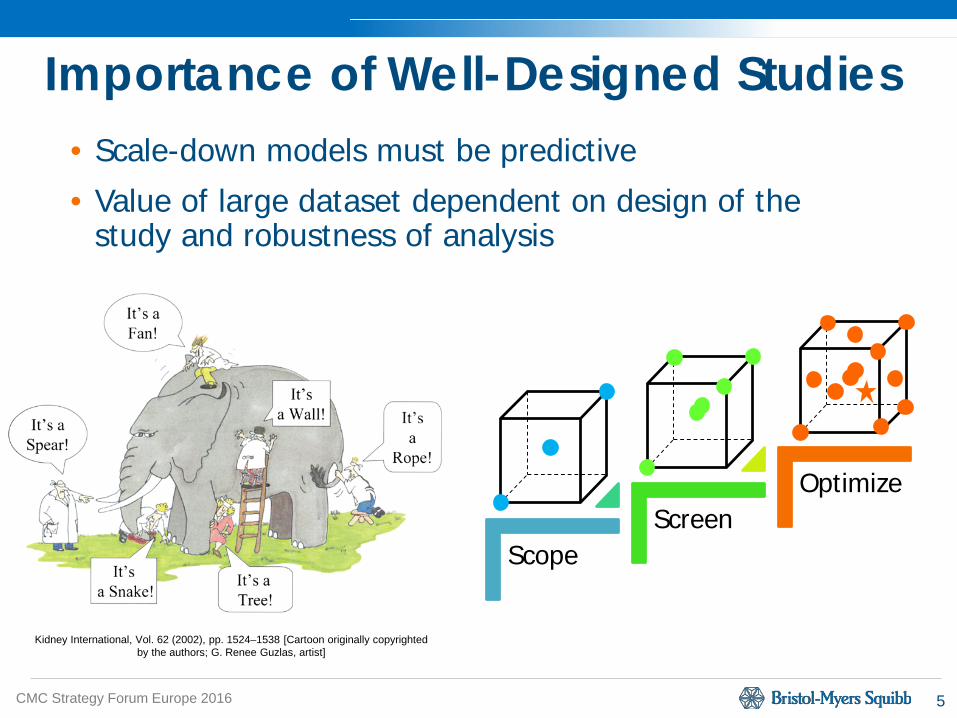
Importance of Well-Designed Studies
CMC Strategy Forum Europe 2016
• Scale-down models must be predictive
• Value of large dataset dependent on design of the study and robustness of analysis
Kidney International, Vol. 62 (2002), pp. 1524–1538 [Cartoon originally copyrighted by the authors; G. Renee Guzlas, artist]
ScopeScreen
Optimize

6
Data Accumulation
CMC Strategy Forum Europe 2016
Product and Process DevelopmentProcess
Character-ization
PPQ BLA and PAI
Post-Approval Changes
FIH “Go”
Commercialization “Go”
BLA “Go”
Pre-Clinical Phase I Phase II Phase III Registration Lifecycle Management
Tox Lots
FIH Lots
Clinical Lots
Lab-Scale Data
PPQ Lots
Launch Lots
Commercial Lots
time
data
7
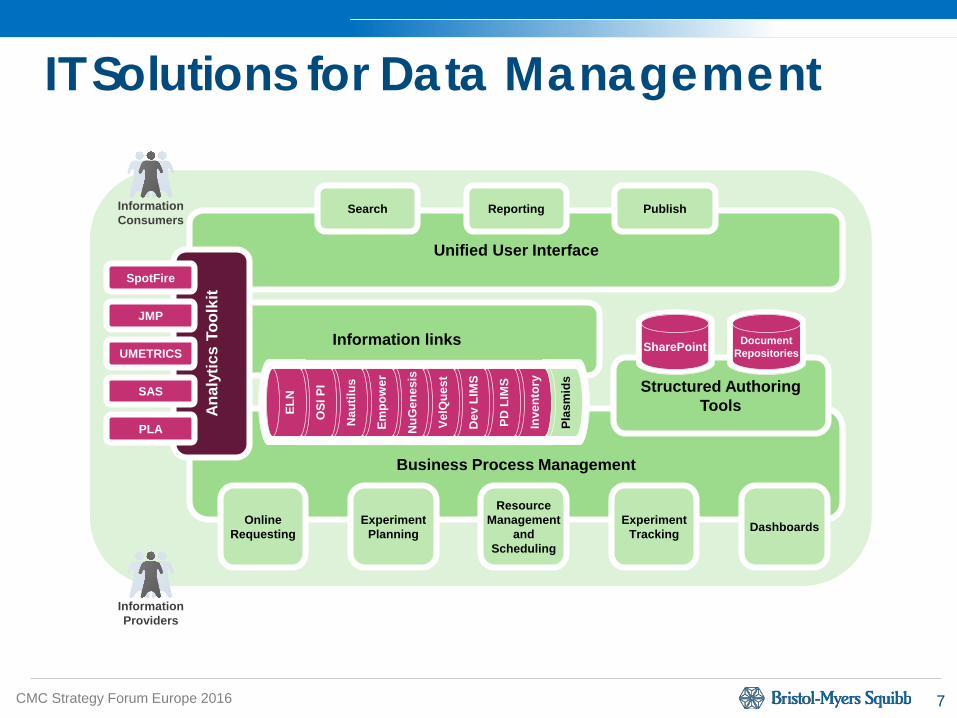
IT Solutions for Data Management
CMC Strategy Forum Europe 2016
Information links
Business Process Management
Structured AuthoringTools
Unified User Interface
Online Requesting
Experiment Planning
Resource Management
and Scheduling
Experiment Tracking Dashboards
Anal
ytic
s To
olki
tInformation Consumers
Stat Analyst
EmpowerSharePoint EmpowerDocument Repositories
Information ProvidersStat Analyst
Search Reporting Publish
ELN
ELN
Plas
mid
s
Inve
ntor
y
PD L
IMS
Dev
LIM
S
VelQ
uest
NuG
enes
is
Empo
wer
Nau
tilus
OSI
PI
ELN
SpotFire
JMP
SAS
PLA
UMETRICS

8
Case Study: Data Aggregation
CMC Strategy Forum Europe 2016
• Production process designed to control glycoform profile of an Fc fusion protein
• Second chromatography column main point of control to ensure CQA
• New, more sensitive orthogonalmethods developed
• Gap in understanding of process control for new methods
• Rapid mobilization of DoE studies in scale-down model to fill knowledge gap
Production Bioreactor
Chromatography#1
Chromatography #2
Chromatography #3
Drug Substance

9
Case Study: Data Aggregation (cont’d)
CMC Strategy Forum Europe 2016
• Small-scale data combined with manufacturing data to bolster empirical models
• Control strategy adjusted to ensure product quality
12 g/Lresinloading
Predicted CQA #1(full-scale)
Bior
eact
or C
QA
Chrom #2 Wash Conductivity
Predicted CQA #1 (complete dataset)
Predicted CQA #2 (complete dataset)
Predicted CQA #2(full-scale)
Predicted CQA #3 (lab-scale)
22 g/Lresinloading
Predicted CQA #1(full-scale)
Bior
eact
or C
QA
Chrom #2 Wash Conductivity
Predicted CQA #1 (complete dataset)
Predicted CQA #2 (complete dataset)
Predicted CQA #2(full-scale)
Predicted CQA #3 (lab-scale)
10
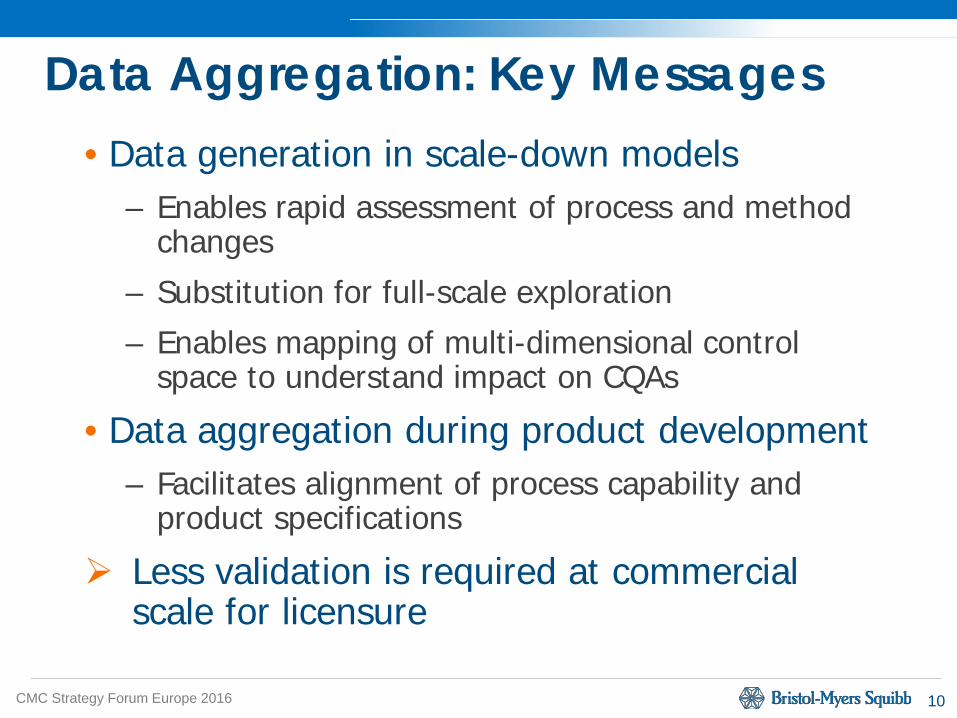
Data Aggregation: Key Messages
CMC Strategy Forum Europe 2016
• Data generation in scale-down models – Enables rapid assessment of process and method
changes
– Substitution for full-scale exploration
– Enables mapping of multi-dimensional control space to understand impact on CQAs
• Data aggregation during product development– Facilitates alignment of process capability and
product specifications
Less validation is required at commercial scale for licensure
11
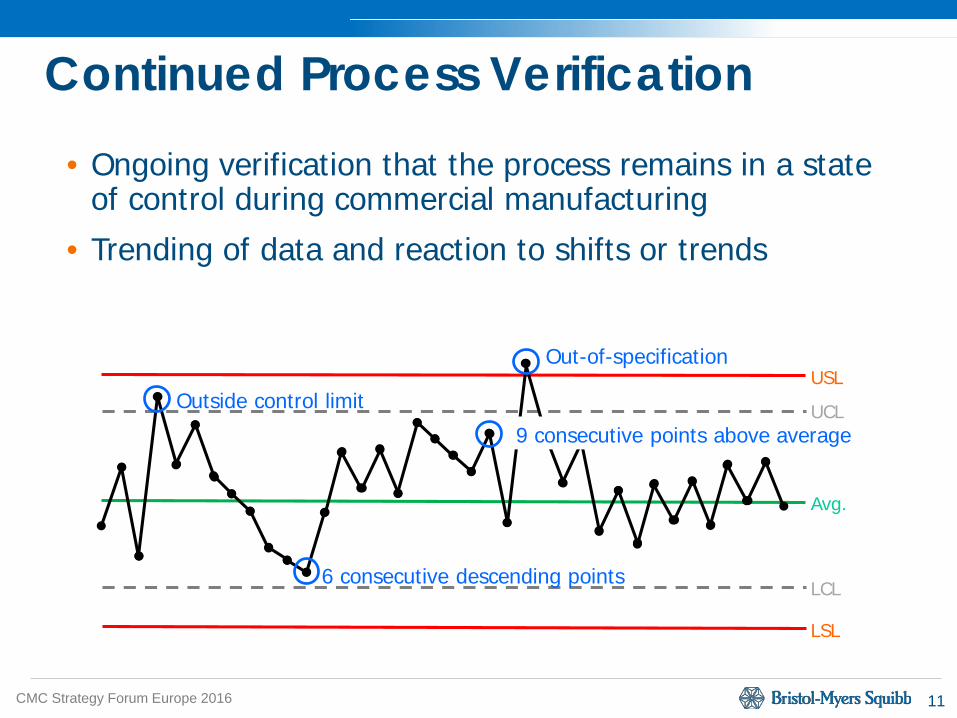
Continued Process Verification
CMC Strategy Forum Europe 2016
• Ongoing verification that the process remains in a state of control during commercial manufacturing
• Trending of data and reaction to shifts or trends
Outside control limit
6 consecutive descending points
Out-of-specification
9 consecutive points above average
USL
LSL
LCL
UCL
Avg.

12
IT Solutions for Data Management
CMC Strategy Forum Europe 2016
Robustness VISION
IT TOOLS
Automate
and Enable
From Reactive
To Proactive

13
CPV: Cycle of Continuous Improvement
CMC Strategy Forum Europe 2016
CQATiter
Multivariate Analysis
Improved Process Understanding & Enhanced Control
Reduced In-Process Variability
YoY Improvements
Monitor Batch Data in Real Time

14
Case Study: CPV
CMC Strategy Forum Europe 2016
• Monitoring of high molecular weight (HMW) at final control point in purification process
• Ongoing issue that “came and went” several times over years of commercial manufacturing
• Mitigated by pulling process levers that also reduce yield
• CPV enabled identification of root cause– Multi-variate analysis identified hypotheses,
– Laboratory studies confirmed link between process control and HMW clearance
– Changes implemented in manufacturing
CQATiter
Multivariate Analysis
Improved Process Understanding & Enhanced Control
YoY Improvements
Monitor Batch Data in Real Time
15
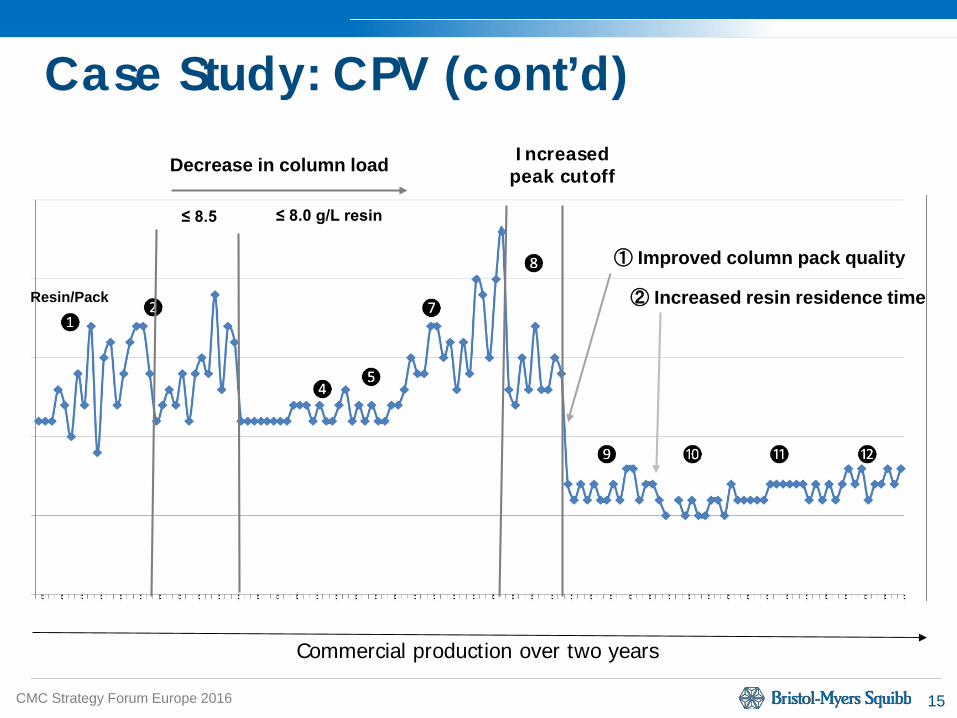
Case Study: CPV (cont’d)
CMC Strategy Forum Europe 2016
Decrease in column load Increased peak cutoff
① Improved column pack quality
② Increased resin residence time
≤ 8.5 ≤ 8.0 g/L resin
Resin/Pack
Commercial production over two years
16
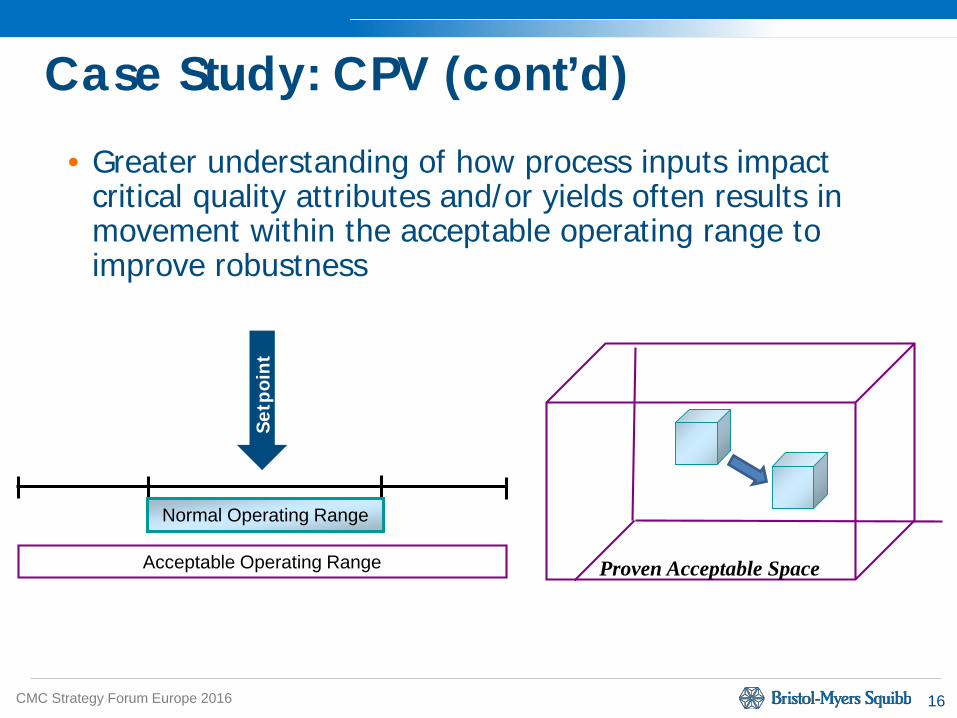
Case Study: CPV (cont’d)
CMC Strategy Forum Europe 2016
• Greater understanding of how process inputs impact critical quality attributes and/or yields often results in movement within the acceptable operating range to improve robustness
Proven Acceptable Space
Normal Operating Range
Acceptable Operating Range
Setp
oin
t

17
Multi-Site CPV
CMC Strategy Forum Europe 2016
• Holistic end-to-end CPV approach
• Monitor performance at all sites of manufacture
• Leverage best practices across sites
• Identify common issues and share learnings
11%11%
78%
Site #1
15%4%
81%
Site #2
8%
92%
Site #3
Site #1 Site #2 Site #3

18
Data Analysis Maturity
CMC Strategy Forum Europe 2016
• Univariate control charts may not be efficient or adequate
• Multivariate models reduce the dimensionality of the problem to a few variables that explain the most variation
• Enables fault detection in real-time

19
Fault Detection
CMC Strategy Forum Europe 2016
1. Input data from PI or Discoverant
2. Create offline Batch Evolution models (BEM) on Simca
4. Test BEM model by using “good”
and “bad” batches5. Input final control limits to Simca-
online
6. Monitor the new batches in real time
by Simca-online

20
Case Study: Data-Driven Intervention
CMC Strategy Forum Europe 2016
• The batch score control charts detect the outliers and identify the parameters that are contributing to them
• In the model for online parameters, the control chart of t1 detected an outlier which was caused by higher sparge rate
21
CPV: Key Messages
CMC Strategy Forum Europe 2016
• CPV enables knowledge generation to continue post approval
With a robust CPV program can we increase speed to patient even more? What value is derived from traditional PPQ?
• Continued process optimization based upon manufacturing-scale data analysis coupled with small-scale confirmation ensures robustness
Regulatory flexibility is key to enabling robustness improvements

22
• Brendan Hughes• Lori Harmon• Francis Sidnam• Syama Adhibhatta• Jeffrey Savard• Itzcoatl Pla
Acknowledgements
CMC Strategy Forum Europe 2016
• Joseph Shiminsky• Cheng Zhang• Cheng Wenren• Kedar Dave• Marc d’Anjou