
The Poverty Challenge in Northern Ireland Mike Tomlinson Sociology and Social Policy
30
1 www.qub.ac.uk/ssp PSE in Northern Ireland The Poverty Challenge in Northern Ireland Mike Tomlinson Sociology and Social Policy Queen’s University Belfast CASE Social Exclusion Seminar LSE, 10th December 2003
-
Upload
jacqueline-burks -
Category
Documents
-
view
16 -
download
3
description
The Poverty Challenge in Northern Ireland Mike Tomlinson Sociology and Social Policy Queen’s University Belfast CASE Social Exclusion Seminar LSE, 10th December 2003. Why a PSE survey?. a) no publicly available income data (new earnings survey, LFS, FES, CHS) - PowerPoint PPT Presentation
Transcript of The Poverty Challenge in Northern Ireland Mike Tomlinson Sociology and Social Policy

1
www.qub.ac.uk/ssp
PSE in Northern Ireland
The Poverty Challenge in
Northern Ireland
Mike TomlinsonSociology and Social Policy
Queen’s University Belfast
CASE Social Exclusion SeminarLSE, 10th December 2003

2
www.qub.ac.uk/ssp
PSE in Northern Ireland
Why a PSE survey?
a) no publicly available income data (new earnings survey, LFS, FES, CHS)
b) no NI-wide poverty survey since Townsend (1968)
c) Robson and Noble multiple deprivation indexes and (new) Targeting Social Need
d) equality monitoring deficits e.g. social security data, religion, children

3
www.qub.ac.uk/ssp
PSE in Northern Ireland
a) to provide a baseline measurement of PSE in N. Ireland
b) to provide data on the extent to which poverty impacts across the nine dimensions of equality specified in Section 75 of the Northern Ireland Act 1998; and
c) to provide data which allow Northern Ireland to be compared with the results of the British PSE Survey, HBAI and poverty levels in the Republic of Ireland.
Key objectives:
4
www.qub.ac.uk/ssp
PSE in Northern Ireland
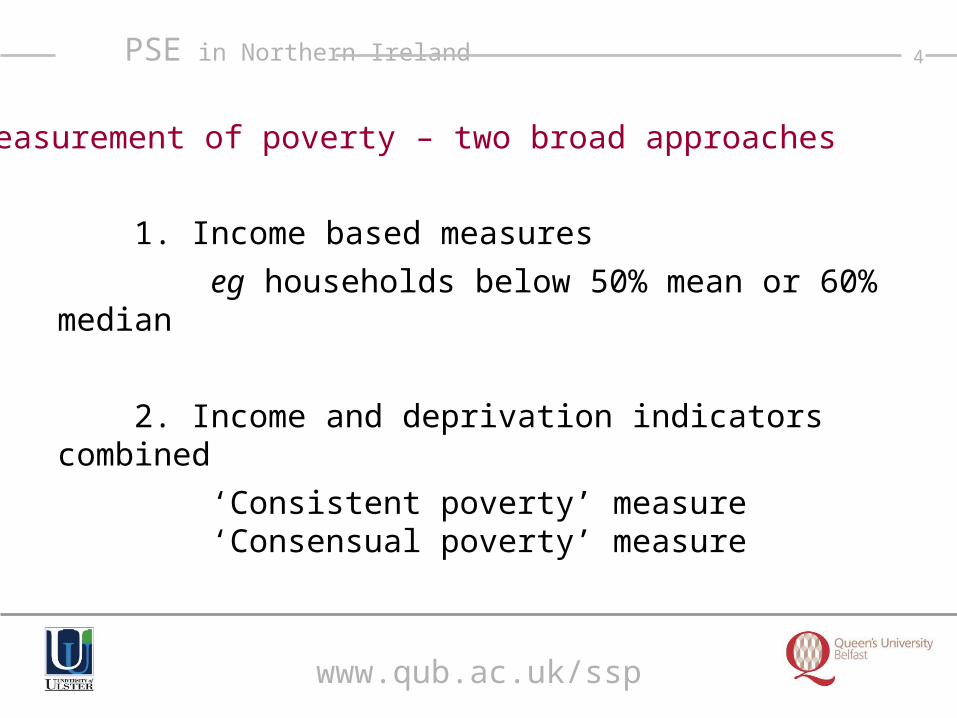
1. Income based measures
eg households below 50% mean or 60% median
2. Income and deprivation indicators combined
‘Consistent poverty’ measure ‘Consensual poverty’ measure
Measurement of poverty – two broad approaches

5
www.qub.ac.uk/ssp
PSE in Northern Ireland
Different equivalence scales
PSE NI weekly household incomes
Raw PSE McCl OECD RoI
Mean 370.1 304.8 343.9 221.3 205.7
Median 290.0 236.4 270.0 170.0 162.2

6
www.qub.ac.uk/ssp
PSE in Northern Ireland
PSE1 McClements2 Modified RoI (A) OECD
First Adult 0.70 0.61 1.0 1.00Spouse 0.30 0.39 0.5 0.66Other Second Adult 0.45 0.46 0.5 0.66Third Adult 0.45 0.42 0.5 0.66Subsequent Adults 0.45 0.36 0.5 0.66Children aged < 14yrs 0.35 0.20 0.3 0.33Children aged 14yrs + 0.30 0.30 0.5 0.33
Notes1. The PSE scale weights the first child at 0.35 and each additional child at 0.3.
If the head of the household is a lone parent 0.1 is added.2. The McClements scale has more age groups than shown above:
0-1 = 0.09; 2-4 = 0.18; 5-7 = 0.21; 8-10 = 0.23; 11-12 = 0.25; 13-15 = 0.27; 16 and over = 0.36.

7
www.qub.ac.uk/ssp
PSE in Northern Ireland
Proportion of persons in households below relative income thresholds using different equivalence scales

8
www.qub.ac.uk/ssp
PSE in Northern Ireland
1. Survey 1: which items are ‘necessities’?
2. Survey 2: necessities which people can’t afford
3. Select necessities which are robust indicators of deprivation
4. Maximise difference between ‘poor’ and ‘non-poor’ groups and minimise the difference within those groups
5. Produce poverty threshold
Steps in the consensual poverty measure

9
www.qub.ac.uk/ssp
PSE in Northern Ireland
Necessities – examples (1) Omnibus Have Can’t ‘necessary’ afford
FOOD Fresh fruit & veg every day 92 84 5
HOUSING Pay heating/electricity/’phone bills on time 99 91 8 Replace worn out furniture 79 67 28
CLOTHES Warm, waterproof coat 93 91 5 Good clothes for job interviews 86 85 6 New not 2nd hand clothes 62 91 6
INFORMATION Telephone 81 95 3

10
www.qub.ac.uk/ssp
PSE in Northern Ireland
Necessities – examples (2) Omnibus Have Can’t ‘necessary’ afford
DURABLE GOODS Replace/repair goods e.g. fridge, washing machine 95 75 23 Car 53 71 12
PERSONAL FINANCES Access to decent pension 94 57 24 Home contents insurance 89 78 12
SOCIAL Family days out 86 74 7 One weeks annual holiday away from home 60 57 24
11
www.qub.ac.uk/ssp
PSE in Northern Ireland
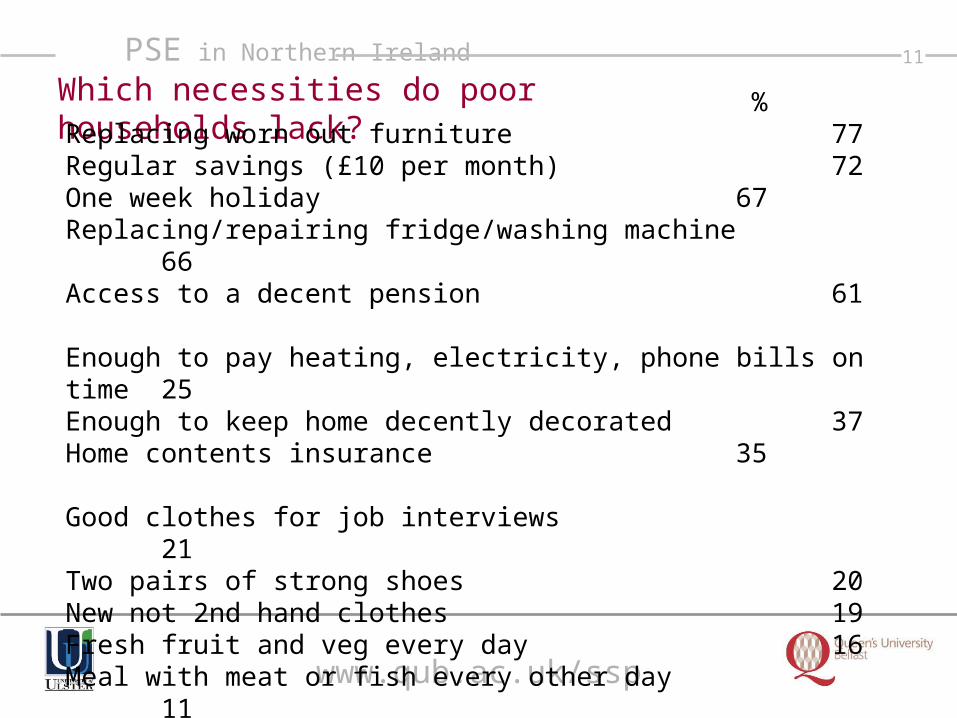
Which necessities do poor households lack?
%Replacing worn out furniture 77Regular savings (£10 per month) 72One week holiday 67Replacing/repairing fridge/washing machine 66Access to a decent pension 61
Enough to pay heating, electricity, phone bills on time 25Enough to keep home decently decorated 37Home contents insurance 35
Good clothes for job interviews 21Two pairs of strong shoes 20New not 2nd hand clothes 19Fresh fruit and veg every day 16Meal with meat or fish every other day 11

12
www.qub.ac.uk/ssp
PSE in Northern Ireland
Combining low income and deprivation
Living in Ireland – ‘consistent poverty’1 of 8 pre-determined items plus low income
(60 per cent of median)
PSE – ‘consensual poverty’3 of 29 items defined by popular consensus
plus low income

13
www.qub.ac.uk/ssp
PSE in Northern Ireland
29.6% of households were in poverty
37.4% of children were growing up in poor households
185,000 of Northern Ireland's households were in poverty
502,000 people were living in poor households
148,900 children were growing up in poor households
Baseline poverty measure:

14
www.qub.ac.uk/ssp
PSE in Northern Ireland
Poverty and Inequality – Section 75 [29.6]
Poverty rates by religion of HR
25% of Protestant households 36% of Catholic households (a ratio of 1:1.44)
by national identity (not a Section 75 dimension)
25% of ‘British’ households 37% of ‘Irish’ households

15
www.qub.ac.uk/ssp
PSE in Northern Ireland
Poverty and Inequality – Section 75… [29.6]
Poverty rates by political opinion
19% Ulster Unionist Party 30% SDLP 32% DUP 43% Sinn Féin (a ratio of 2.26:1UUP)

16
www.qub.ac.uk/ssp
PSE in Northern Ireland
Poverty and Inequality – Section 75… [29.6]
Poverty rates by ‘race’
19% ethnic minority groups
by sexual orientation
48% same sex 44% bi-sexual
Not reliable or significant

17
www.qub.ac.uk/ssp
PSE in Northern Ireland
Poverty and Inequality – Section 75… [29.6]
Poverty rates by age
0
5
10
15
20
25
30
35
40
45
16-24 25-34 35-44 45-54 55-64 65-74 75+
18
www.qub.ac.uk/ssp
PSE in Northern Ireland
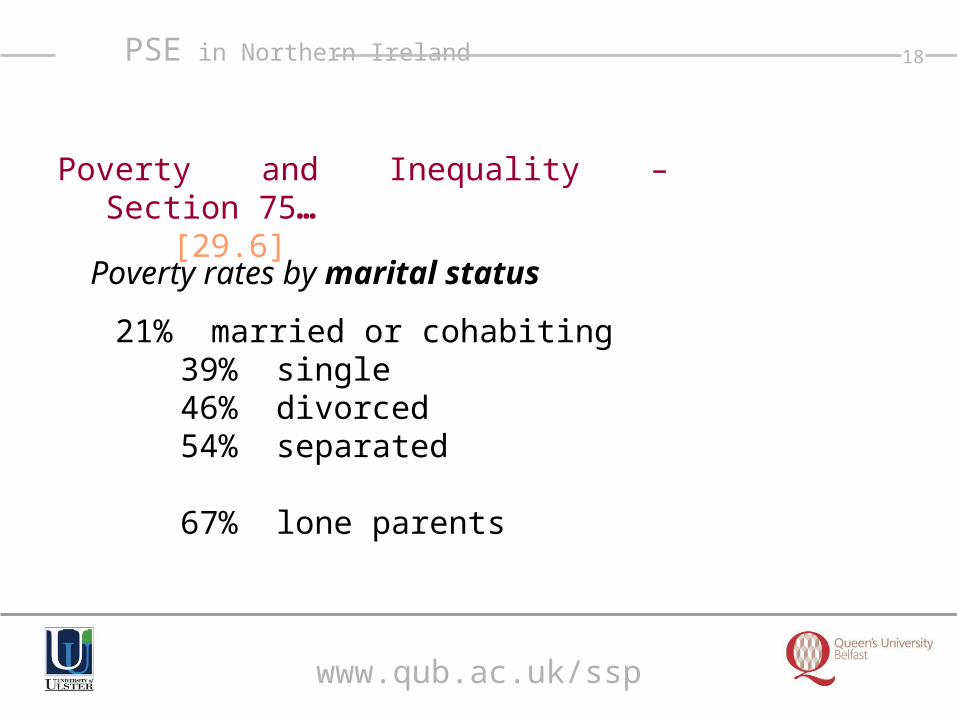
Poverty and Inequality – Section 75… [29.6]
Poverty rates by marital status
21% married or cohabiting 39% single 46% divorced 54% separated 67% lone parents

19
www.qub.ac.uk/ssp
PSE in Northern Ireland
2. Poverty and Inequality – Section 75… [29.6]
Poverty rates by gender
25% of all men were living in poor households 29% of all women (a ratio of 1: 1.16)
Of all adults in poor households: 57 per cent were women
RESULTS

20
www.qub.ac.uk/ssp
PSE in Northern Ireland
Poverty and Inequality – Section 75… [29.6]
Poverty rates by disability
56% households with one or more disabled people
29% households without disability (a ratio of 1.93:1)
100% of the households in which no-one was working and which contained someone sick or disabled
were in poverty

21
www.qub.ac.uk/ssp
PSE in Northern Ireland
Poverty and Inequality – Section 75… [29.6]
Poverty rates, with or without dependants
36% childless households in which one adult was caring for another adult, in their own household or elsewhere (18% of all poor households)
32% households caring for children (19% of all poor households)

22
www.qub.ac.uk/ssp
PSE in Northern Ireland
Poverty and Inequality –
64% of individuals have below average incomes (60% in Britain).
Top 40% of households together possess 67% of the total household income
Gini coefficient for Northern Ireland:
1998/99 38
2002/03 42

23
www.qub.ac.uk/ssp
PSE in Northern Ireland
Northern Ireland compared – east/west

24
www.qub.ac.uk/ssp
PSE in Northern Ireland
Northern Ireland compared – east/west
Proportion of persons living in households below HBAI median income thresholds

25
www.qub.ac.uk/ssp
PSE in Northern Ireland
Northern Ireland compared – north/south
Proportion of persons in ‘consistent’ poverty (Ireland, North and South)

26
www.qub.ac.uk/ssp
PSE in Northern Ireland
Northern Ireland compared – north/south
Proportion of persons in ‘overall’ poverty – (Ireland, North and South)

27
www.qub.ac.uk/ssp
PSE in Northern Ireland
0 5 10 15 20 25 30 35 40
RoI: Consistent <50% Mean*
RoI: Consistent <60% Mean*
GB: HBAI <60% Median
RoI: Overall <60% Median
GB: HBAI <50% Mean
RoI: Overall <50% Mean*
GB: HBAI <70% Median
PSE
RoI: Overall <70% Median
GB: HBAI <60% Mean
RoI: Overall <60% Mean*N. Ireland poverty rates, using different methods of calculation – proportions of persons (*households)

28
www.qub.ac.uk/ssp
PSE in Northern Ireland
Labour market exclusion
one worker29%
two worker35%
no workers, retired21%
no workers, sick/disabled
1%
no workers, unemployed/
other14%

29
www.qub.ac.uk/ssp
PSE in Northern Ireland
Poverty and conflict
Poverty rate Catholics Protestants
(36) (25)
Close relative killed 54 30
Personally injured 40 33
Relative injured 48 26
Witnessed murder 48 39
Witnessed 3 or more ‘troubles’ 42 25
Knows people killed & injured 47 24
Severe troubles experience 52 20

30
www.qub.ac.uk/ssp
PSE in Northern Ireland
Download report at
www.democraticdialogue.org
Online necessities questionnaire is at:
www.qub.ac.uk/ssp/webpages/pse.htm


![Resume - Dr.brian Tomlinson[1]](https://static.fdocuments.in/doc/165x107/55cf9ba3550346d033a6d01a/resume-drbrian-tomlinson1.jpg)


