The Potential Economic and Fiscal Benefits of New Gaming
42
The Potential Economic and Fiscal Benefits of New Gaming Agreements with the Agua Caliente, Morongo, Pechanga, and Sycuan Bands of Indians Submitted to: Coalition to Protect California’s Budget & Economy Submitted by: Analysis Group, Inc. Contact: Alan Meister, Ph.D. Analysis Group, Inc. 601 S. Figueroa Street Suite 1300 Los Angeles, CA 90017 213-896-4500 (phone) 213-623-4112 (fax) [email protected] January 4, 2008
Transcript of The Potential Economic and Fiscal Benefits of New Gaming

The Potential Economic and Fiscal Benefits of New Gaming Agreements with the Agua Caliente, Morongo, Pechanga, and Sycuan Bands of Indians
Submitted to: Coalition to Protect California’s Budget & Economy Submitted by: Analysis Group, Inc. Contact: Alan Meister, Ph.D. Analysis Group, Inc. 601 S. Figueroa Street Suite 1300 Los Angeles, CA 90017 213-896-4500 (phone) 213-623-4112 (fax) [email protected] January 4, 2008

The Potential Economic and Fiscal Benefits of New Gaming Agreements
Report Submitted to the Coalition to Protect California’s Budget & Economy
i
Executive Summary
In 2006, the Governor of California negotiated new agreements with four Tribes that have gaming facilities on their Reservations in Riverside and San Diego counties: the Agua Caliente Band of Cahuilla Indians, Morongo Band of Mission Indians, Pechanga Band of Luiseño Mission Indians, and Sycuan Band of the Kumeyaay Nation. These agreements, commonly referred to as compacts and which amended the respective Tribes' existing 1999 compacts, will allow the Tribes to operate additional gaming machines and extend the term of their compacts through December 31, 2030 in exchange for increased revenue-sharing payments to the State, local governments, and non-gaming tribes. In addition, the amended gaming compacts increase protections and benefits for local communities, the environment, patrons, and employees. The amended compacts were ratified by the State Legislature in June 2007 and referenda on the Legislature's ratification will appear on the February 5, 2008 statewide ballot as Propositions 94, 95, 96 and 97.
Analysis Group was commissioned by the Coalition to Protect California’s Budget & Economy to estimate the economic and fiscal benefits of the amended compacts to California’s economy. For the purposes of this study, it was assumed that the amended compacts will be approved by California voters on February 5, 2008 and the Tribes would be able to begin expanding their gaming operations on March 1, 2008.
ECONOMIC BENEFITS OF THE AMENDED COMPACTS
The amended compacts would generate significant economic benefits for the State of California. These benefits would result from increased gaming activity allowed by the amended compacts, as well as the construction expenditures that would be made by the Tribes to expand existing gaming facilities and/or construct new gaming facilities in order to accommodate the increase in gaming activity.
Over the life the amended compacts (22 years and 10 months), the direct and indirect operations-related and construction-related economic benefits would total approximately:
$116.5 billion in output (i.e., value of sales);
875,500 jobs (i.e., person-years of employment); and
$44.5 billion in wages.
FISCAL BENEFITS OF THE AMENDED COMPACTS
The amended compacts would also generate significant fiscal benefits within the State. The first type of fiscal benefit to the State and local governments would be an increase in tax revenue. Taxes would be paid on all taxable secondary economic activity (e.g., business purchases and employee wages and spending) generated by increased gaming activity.

The Potential Economic and Fiscal Benefits of New Gaming Agreements
Report Submitted to the Coalition to Protect California’s Budget & Economy
ii
These taxes would include corporate profit taxes, income taxes, sales and excise taxes, property taxes, motor vehicle licensing fees, personal license fees, and other fees and fines.
The second type of fiscal benefit that would be generated by the amended compacts is an increase in direct payments by the Tribes to the State, local governments, and non-gaming tribes (i.e., revenue sharing). Under existing gaming compacts, the Agua Caliente, Morongo, Pechanga, and Sycuan Bands currently share a portion of gaming revenue with the State, some of which is redistributed to local governments and non-gaming tribes, but none of which goes into the General Fund. Under the amended gaming compacts, given the projected timetables for constructing new gaming machines and either expanding existing gaming facilities or constructing new gaming facilities to accommodate these new machines, there would be a substantial increase in the revenue-sharing payments by the four Tribes to the State, local governments, and non-gaming tribes.
Over the life the amended compacts, the direct and indirect operations-related and construction-related fiscal benefits would total approximately:
$5.4 billion in state and local taxes; and
$10.6 billion in revenue-sharing payments to the State, local governments, and non-gaming tribes.
Of the revenue sharing total, approximately $10.2 billion would go to the State, $275 million to local governments, and $128 million to non-gaming tribes.
Total statewide fiscal benefits of the amended compacts, which are the sum of tax revenue and revenue-sharing payments, are approximately $16 billion over the life of the compacts.

The Potential Economic and Fiscal Benefits of New Gaming Agreements
Report Submitted to the Coalition to Protect California’s Budget & Economy
iii
Table of Contents
Executive Summary ............................................................................................................................. i
1. Assignment.................................................................................................................................... 1
2. Background.................................................................................................................................... 2 The Tribes and their Existing Gaming Operations................................................................... 2
Agua Caliente Band of Cahuilla Indians ............................................................................................ 2 Morongo Band of Mission Indians ...................................................................................................... 3 Pechanga Band of Luiseño Mission Indians....................................................................................... 4 Sycuan Band of the Kumeyaay Nation ............................................................................................... 4
Amended Compacts ..................................................................................................................... 5 U.S. Casino Gaming Market ........................................................................................................ 6 Casino Gaming Options for Californians .................................................................................. 8 Southern California Casino Gaming Market........................................................................... 12
3. Methodology ............................................................................................................................... 15 Economic Benefits Analysis ....................................................................................................... 15 Fiscal Benefits Analysis .............................................................................................................. 16
Tribal Fiscal Benefits............................................................................................................................ 16 Non-Tribal Fiscal Benefits................................................................................................................... 17
Gross Benefits Versus Net Benefits........................................................................................... 18 IMPLAN ....................................................................................................................................... 18
4. Data ............................................................................................................................................... 19
5. Analysis and Results ................................................................................................................. 20 Construction-Related Economic and Fiscal Benefits .............................................................. 20
Construction Costs............................................................................................................................... 20 Construction-Related Economic Benefits – Life of the Amended Compacts............................... 22 Construction-Related Fiscal Benefits – Life of the Amended Compacts ...................................... 22
Operations-Related Economic and Fiscal Benefits ................................................................. 22 Incremental Gaming Revenue............................................................................................................ 22 Incremental Non-Gaming Revenue................................................................................................... 25 Direct Effect .......................................................................................................................................... 26 Tribe and Casino Expenditures.......................................................................................................... 29 Revenue Sharing .................................................................................................................................. 29 Operations-Related Economic Benefits – Average Annual Benefits............................................. 32 Operations-Related Fiscal Benefits – Average Annual Benefits .................................................... 32 Operations-Related Economic Benefits – Life of the Amended Compacts .................................. 33 Operations-Related Fiscal Benefits – Life of the Amended Compacts ......................................... 33
Total Economic and Fiscal Benefits........................................................................................... 33
Appendix A: About the Author ..................................................................................................... 35
Appendix B: About Analysis Group, Inc..................................................................................... 36
Appendix C: Casino Gaming Spending by Californians ......................................................... 38

The Potential Economic and Fiscal Benefits of New Gaming Agreements
Report Submitted to the Coalition to Protect California’s Budget & Economy
1
1. Assignment
In 2006, the Governor of California negotiated new agreements with four Tribes that have gaming facilities on their Reservations in Riverside and San Diego counties: the Agua Caliente Band of Cahuilla Indians (“Agua Caliente Band”), Morongo Band of Mission Indians (“Morongo Band”), Pechanga Band of Luiseño Mission Indians (“Pechanga Band”), and Sycuan Band of the Kumeyaay Nation (“Sycuan Band”). These agreements, commonly referred to as compacts and which amended the respective Tribes' existing 1999 compacts, will allow the Tribes to operate additional gaming machines and extend the term of their compacts through December 31, 2030 in exchange for increased revenue-sharing payments to the State, local governments, and non-gaming tribes, as well as increased protections and benefits for local communities, the environment, patrons, and employees. The amended compacts were ratified by the State Legislature in June 2007 and referenda on the Legislature's ratification will appear on the February 5, 2008 statewide ballot as Propositions 94, 95, 96 and 97.
Analysis Group was commissioned by the Coalition to Protect California’s Budget & Economy to estimate the potential economic and fiscal benefits of the amended gaming compacts on California’s economy.1 Specifically, we were asked to estimate:
Revenue-sharing payments that will be paid by the Tribes to the State, local governments, and non-gaming tribes;
The economic and fiscal benefits of future casino construction that will need to be completed in order to accommodate the increase in gaming allowed by the amended compacts; and
The economic and fiscal benefits of increased gaming activity allowed by the Tribes’ amended compacts.
Background on Dr. Alan Meister, the primary author of this study, and Analysis Group is set forth in Appendices A and B, respectively.
1 This study does not explore potential social impacts of the amended compacts. However, in the existing literature on the subject, there are conflicting views regarding the existence, nature, and extent of the social impacts of Indian gaming.

The Potential Economic and Fiscal Benefits of New Gaming Agreements
Report Submitted to the Coalition to Protect California’s Budget & Economy
2
2. Background
The Agua Caliente, Morongo, Pechanga, and Sycuan Bands are federally recognized tribes with Reservations in Southern California. The Tribes operate successful, but capacity-constrained gaming facilities per their gaming compacts entered into with the State of California in 1999. In August 2006, the Tribes completed negotiations with the Governor to operate additional gaming machines in exchange for significantly increased revenue-sharing payments to the State, local governments, and non-gaming tribes, as well as increased protections and benefits for local communities, the environment, patrons, and employees. This section of the report provides background on the Tribes, their existing gaming facilities operated under their 1999 gaming compacts, the amended compacts, and the casino gaming market.
THE TRIBES AND THEIR EXISTING GAMING OPERATIONS2
Agua Caliente Band of Cahuilla Indians
The Agua Caliente Band is a federally recognized tribe whose Reservation was established in 1876. The 31,500-acre Reservation is located in the Palm Springs area of Riverside County, California. In fact, a portion of the City of Palm Springs is located within the boundaries of the Reservation.
Per its 1999 gaming compact,3 the Tribe is authorized to operate two Class III gaming facilities. Currently, it operates the Spa Resort Casino and the Agua Caliente Casino.
The Spa Resort Casino, which was originally opened in April 1995 and newly opened in November 2003, is located in downtown Palm Springs. The casino is approximately 131,000 square feet and consists of:
Approximately 30,000 square feet of gaming space with 1,000 Class III machines, 33 table games, a high-limit gaming room, and an eight-table poker room;
A spa hotel with 228 rooms (one block from the casino building);
Four dining options, including two restaurants, a 300-seat buffet, and a deli;
Two bars;
A 200-seat entertainment lounge; and
Parking for approximately 1,600 customer vehicles.
2 Unless otherwise noted, all tribal and casino background information was provided by the Tribes. 3 Tribal-State Compact between the State of California and the Agua Caliente Band of Cahuilla Indians, September 14, 1999 (published in the Federal Register on May 16, 2000).

The Potential Economic and Fiscal Benefits of New Gaming Agreements
Report Submitted to the Coalition to Protect California’s Budget & Economy
3
The Agua Caliente Casino, which was opened in April 2001, is located in the City of Rancho Mirage, near Palm Springs. The casino is approximately 161,000 square feet and consists of:
Approximately 53,000 square feet of gaming space with 1,000 Class III machines, 48 table games, a high-limit gaming room, and a 10-table poker room;
Four dining options, including two restaurants, a 450-seat buffet, and a food court;
Three bars;
A 150-seat entertainment lounge;
A 1,000-seat entertainment venue; and
A parking garage with approximately 2,200 spaces.
The Agua Caliente Casino is currently completing remodeling to add additional gaming space, a resort hotel, and other additional amenities. The resort hotel facility, which will be attached to the casino, will include 340 rooms, three restaurants, a full-service spa, and 13,000 square feet of meeting space. Other additional amenities to be added to the Agua Caliente Casino include a 2,000-seat headliner entertainment venue, an additional parking garage with 1,100 parking spaces, and a 10,000 square-foot general multipurpose warehouse. Most of the remodeling is currently scheduled to be completed within the first quarter of calendar year 2008.
Morongo Band of Mission Indians
The Morongo Band is a federally recognized tribe whose Reservation was established in 1876. The 34,000-acre Reservation is near the City of Banning in Riverside County, California. The Reservation is located at the foot of the San Gorgonio and San Jacinto Mountains, west of Palm Springs.
Per its 1999 gaming compact,4 the Tribe is authorized to operate two Class III gaming facilities. However, it currently only operates one such gaming facility, Morongo Casino, Resort & Spa. The Morongo Casino, Resort & Spa, which was originally opened in 1985 as Casino Morongo and newly opened in 2004, is located off the I-10 freeway in Cabazon and is the second closest casino to downtown Los Angeles (located approximately 89 miles west).5 The casino is approximately 580,000 square feet and consists of:
Approximately 180,000 square feet of gaming space with 2,000 Class III machines, 800 Class II machines, 100 table games, a 22-table poker room, and a 600-seat bingo hall;
A 310-room spa resort hotel;
4 Tribal-State Compact between the State of California and the Morongo Band of Mission Indians, October 12, 1999 (published in the Federal Register on May 16, 2000). 5 Mileage estimated using Yahoo Maps (http://maps.yahoo.com).

The Potential Economic and Fiscal Benefits of New Gaming Agreements
Report Submitted to the Coalition to Protect California’s Budget & Economy
4
Six dining options, including four restaurants, a buffet, and a food court;
Four entertainment venues, including three bars/lounges, a nightclub, and a 1,200-seat grand ballroom; and
Approximately 12,000 square feet of meeting and special events space.
The Morongo Travel Center, which is a gas station owned and operated the Tribe a few hundred feet from the casino, offers 25 Class II gaming machines.
Pechanga Band of Luiseño Mission Indians
The Pechanga Band is a federally recognized tribe whose Reservation was established in 1882. The 5,500-acre Reservation is located near the City of Temecula in Riverside County, California.
Per its 1999 gaming compact,6 the Tribe is authorized to operate two Class III gaming facilities. However, it currently only operates one such gaming facility, Pechanga Resort & Casino, which was originally opened in 1985 and re-opened in 2002. The casino is located just off the I-15 freeway in Temecula and is the third closest casino to downtown Los Angeles (located approximately 91 miles west).7 The casino is approximately 1.2 million square feet and consists of:
Approximately 188,000 square feet of gaming space with 2,000 Class III machines, 1,600 Class II machines, 155 table games, and a 54-table poker room;
A 522-room resort and spa;
Eight dining options, including five restaurants, a buffet, a food court, and a cafe;
Six entertainment venues, including a full-service bar and lounge, a club, a nightclub, the IMPROV Comedy Club, a 1,200-seat showroom, and a 3,000-seat ballroom; and
Over 40,000 square feet of meeting/convention space with a 125-seat teleconferencing theater.
Sycuan Band of the Kumeyaay Nation
The Sycuan Band is a federally recognized tribe whose Reservation was established in 1875. The 808-acre Reservation is located near the City of El Cajon in San Diego County, California.
Per its 1999 gaming compact,8 the Tribe is authorized to operate two Class III gaming facilities. However, it currently only operates one such gaming facility, Sycuan Casino, 6 Tribal-State Compact between the State of California and the Pechanga Band of Luiseño Mission Indians, September 10, 1999 (published in the Federal Register on May 16, 2000). 7 Mileage estimated using Yahoo Maps (http://maps.yahoo.com). 8 Tribal-State Compact between the State of California and the Sycuan Band of Mission Indians, September 10, 1999 (published in the Federal Register on May 16, 2000).

The Potential Economic and Fiscal Benefits of New Gaming Agreements
Report Submitted to the Coalition to Protect California’s Budget & Economy
5
which originally opened as a bingo hall in November 1983. The casino is several miles from the I-8 freeway and is the closest casino to the City of San Diego (located approximately 25 miles west). The casino is approximately 300,000 square feet and consists of:
Approximately 100,000 square feet of gaming space with 2,000 Class III machines, 340 Class II machines, 70 table games, a 24-table poker room, and a 1,200-seat bingo hall;
Six dining options, including two restaurants, a buffet, patio cafe, lounge, and snack bar; and
A 500-seat theater.
Nearby to the Sycuan Casino is the tribally owned Sycuan Resort, which offers 100 rooms, a spa, a café grill and bar, banquet facilities, a golf course, and tennis courts.
AMENDED COMPACTS
In August 2006, the Tribes amended their 1999 compacts with the Governor of California to allow for an increase in gaming.9 In conjunction with additional provisions agreed to by the Tribes in separate memoranda of agreement with the State, the amended compacts were ratified by the State Legislature in June 2007. Referenda on the Legislature's ratification of all four of the amended compacts will appear on the February 5, 2008 statewide ballot as Propositions 94, 95, 96 and 97.
In exchange for significantly increased revenue-sharing payments to the State, local governments, and non-gaming tribes, as well as increased protections and benefits for local communities, the environment, patrons, and employees, the amended compacts would extend the term of the 1999 compacts by 10 years through 2030 and allow the Tribes to operate additional Class III machines and, in the case of two of the Tribes, add a gaming facility. The increases in gaming machines and gaming facilities vary by Tribe according to their unique set of circumstances, including growth potential:
The Agua Caliente Band would be able to offer 3,000 additional Class III machines and, with local community support, a third gaming facility with no more than 1,000 of the additional Class III machines;
The Morongo Band would be able to offer 5,500 additional Class III machines and a small auxiliary Class III gaming facility with no more than 25 of the additional Class III machines;
The Pechanga Band would be able to offer 5,500 additional Class III machines; and
9 First Amendment to the Tribal-State Compact between the State of California and the Agua Caliente Band of Cahuilla Indians, August 8, 2006; Amendment to the Tribal-State Compact between the State of California and the Morongo Band of Mission Indians, August 29, 2006; Amendment to the Tribal-State Compact between the State of California and the Pechanga Band of Luiseño Indians, August 28, 2006; and Amendment to the Tribal-State Compact between the State of California and the Sycuan Band of the Kumeyaay Nation, August 30, 2006.

The Potential Economic and Fiscal Benefits of New Gaming Agreements
Report Submitted to the Coalition to Protect California’s Budget & Economy
6
The Sycuan Band would be able to offer 3,000 additional Class III machines.10
Due to capacity constraints at their existing gaming facilities, the Tribes would initially introduce a portion, but not all, of the additional Class III machines allowed by their amended compacts. The Tribes would then add the remainder of their allowable machine increases over time after the completion of expansions of their existing gaming facilities and/or construction of new gaming facilities.
For the purposes of measuring potential economic and fiscal benefits in this study, it is assumed that the amended compacts will be approved by California voters on February 5, 2008 and the Tribes would be able to begin expanding their gaming operations on March 1, 2008.
U.S. CASINO GAMING MARKET
In the United States, the gaming industry consists of a number of market segments:
Casinos – commercial casinos (i.e., land-based, riverboat, and dockside casinos), racetrack casinos (a.k.a. “racinos”), and Indian gaming facilities;11
Lotteries – state-operated lottery games;
Card rooms – gaming facilities that offer only offer card games, generally poker;
Pari-mutuels – wagering at horse and greyhound racetracks and jai alai frontons (excludes electronic gaming machines operated at pari-mutuel facilities, which are captured as racinos under the Casinos segment);
Convenience gaming – commercial, non-casino facilities offering a limited number of gaming devices alongside some primary non-gaming activities (e.g., bars, taverns, or restaurants);
Legal bookmaking – sports and race books; and
Charitable gaming – gaming, such as bingo and raffles, operated by charitable/non-profit organizations.
The largest of these segments in terms of lawful consumer spending is by far and away casinos, with roughly 66 percent ($60.8 billion) of the $91.5 billion industry in calendar year 2006.12 This is evidence of the popularity and social acceptability of casino gaming as a form
10 The amended compact for the Sycuan Band allows the second gaming facility to be located within the boundaries of its Reservation as it exists as of the execution date of the amended compact or as those boundaries thereafter are adjusted to include 1,600 acres contiguous to the existing Reservation boundaries. 11 While Indian gaming facilities look and operate like commercial casinos, as tribal government operations, they are more akin to government-operated gaming in terms of principle and purpose. 12 Meister, Alan, Indian Gaming Industry Report, 2007-2008 Edition, Newton: Casino City Press; Meister, Alan, “The State of Indian Gaming,” a presentation at the Forum on the Economic and Social Impact of Indian Gaming in the U.S., University of California, Davis, October 26, 2007. Note that this excludes online/Internet gaming, which is considered illegal in the United States.

The Potential Economic and Fiscal Benefits of New Gaming Agreements
Report Submitted to the Coalition to Protect California’s Budget & Economy
7
of entertainment. According to a recent nationwide survey by the American Gaming Association,13 nearly one-third of all adults (31 percent) gambled in a casino in 2006. This made casino gaming the second most popular form of gambling behind lotteries, in which approximately 51 percent of all adults participated in 2006. Casino gaming is also viewed by the vast majority of Americans as a socially acceptable form of entertainment, regardless of whether they participated in it or not. The results of the same nationwide survey showed that 82 percent of Americans viewed casino gaming as acceptable for themselves or others to participate in.14
The casino gaming segment is quite distinct from other gaming segments in terms of product offering:
Casinos are first and foremost gaming facilities – gaming is their primary product offering.15
Casinos tend to be larger-sized facilities with a variety of gaming options.
Casinos offer electronic gaming machines, which are the primary gaming revenue generators.
Casinos often offer other types of gaming, such as table games or race/sports books, in conjunction with gaming machines. In the case of racinos, gaming machines are typically offered in conjunction with pari-mutuel wagering.
As of the end of calendar year 2006, there were 37 states with casino gaming.16 As shown in Table 1, there were 11 states with commercial casinos, 11 states with racinos, and 28 states with Indian gaming facilities, including California.
13 American Gaming Association, 2007 State of the States: The AGA Survey of Casino Entertainment, 2007. 14 American Gaming Association, 2007 State of the States: The AGA Survey of Casino Entertainment, 2007. 15 While, casinos often offer non-gaming activities and amenities, they are not the primary attraction. However, it should be noted that non-gaming amenities have become a more critical part of many commercial and Indian casinos over the years. 16 Meister, Alan, Indian Gaming Industry Report, 2007-2008 Edition, Newton: Casino City Press.

The Potential Economic and Fiscal Benefits of New Gaming Agreements
Report Submitted to the Coalition to
Table 1. States with Casino Gaming
StatesCommercial
Casinos RacinosIndian
GamingAlabama XAlaska XArizona XCalifornia XColorado X XConnecticut XDelaware XFlorida X XIdaho XIllinois XIndiana XIowa X X XKansas XLouisiana X X XMaine XMichigan X XMinnesota XMississippi X XMissouri XMontana XNebraska XNevada X XNew Jersey XNew Mexico X XNew York X XNorth Carolina XNorth Dakota XOklahoma X XOregon XPennsylvania XRhode Island XSouth Dakota X XTexas XWashington XWest Virginia XWisconsin XWyoming XSource: Meister, Alan, Indian Gaming Industry Report , 2007-2008 Edition.
CASINO GAMING OPTIONS FOR CALIFORNIANS
In California, there exist several gaming segments: casinos, the state lottery, card rooms, horse racetracks, and charitable gaming. However, in terms of casinos, there are only Indian gaming facilities. There are no commercial casinos or racinos in the state. Thus, the nearest
Protect California’s Budget & Economy 8

The Potential Economic and Fiscal Benefits of New Gaming Agreements
Report Submitted to the Coalition to
competing casino gaming (outside of Indian gaming itself) are commercial casinos in Nevada.
Many Californians patronize Nevada casinos, particularly those in Las Vegas, Reno, Laughlin, and Lake Tahoe. This is not surprising given Nevada’s well-established reputation of having premier gaming destinations with large clusters of high-quality facilities, as well as California’s large population of gamblers and their proximity to Nevada casinos. Generally speaking, California is the top state in the U.S. in terms of the number of total casino gamblers and casino trips.17 More specifically, it is also the state with the largest number of visitors and visits to Nevada. As such, Nevada relies heavily upon California residents for a large proportion of its business. In 2006, visitor surveys showed that Californians represented approximately 32 percent of Las Vegas visitors, 49 percent of Reno/Sparks/North Lake Tahoe visitors, 33 percent of Laughlin visitors, and 54 percent of South Lake Tahoe visitors.18 Industry survey data also support these general findings for Nevada on the whole. In 2006 and 2007, 31 percent of Californian’s casino visits were to Nevada casinos.19
However, California Indian gaming facilities have also been able to garner a significant portion of Californians’ casino spending dollars. As shown in Table 2, California Igaming has more than doubled from $2.9 billion in 2001 to $7.7 billion in 2006.
Table 2. Gaming Revenue at California Indian Gaming Facilities ($ Billions)
YearGaming Revenue
2001 $2.92002 $3.72003 $4.82004 $5.92005 $7.02006 $7.7
Average Annual Growth Rate1 21.3%
Notes:1.
Sources:
Computed as the compound annual growth rate.
Meister, Alan, Indian Gaming Industry Report , 2007-2008 Edition.
ndian
20 This reflects an average annual growth rate of just over 21 percent.21
17 Harrah’s Entertainment, Inc., Harrah’s Survey: Profile of the American Casino Gambler, 2004; Harrah’s Entertainment, Inc., Harrah’s Survey: Profile of the American Casino Gambler, 2006. 18 GLS Research, Las Vegas Visitor Profile, Calendar Year 2006; GLS Research, Laughlin Visitor Profile, Calendar Year 2006; Reno-Sparks Convention & Visitors Authority, Marketing Statistics Report, 2006; Lake Tahoe Visitors Authority, South Shore Intercept Survey, Winter 2004 and Summer 2004 (average of the two surveys). 19 Californians’ visits to Nevada included Las Vegas, Reno, Laughlin, and Lake Tahoe. Visits to California Indian casinos represented 64 percent of Californians’ casino visits. The remaining 5 percent of Californians’ visits were to casinos in other states. Source: confidential industry survey data, 2006-2007 (results used with permission). 20 California Indian gaming experienced 27 percent growth in gaming revenue in 2002, 28 percent in 2003, 24 percent in 2004, 19 percent in 2005, and 10 percent in 2006. Source: Meister, Alan, Indian Gaming Industry Report, 2007-2008 Edition, Newton: Casino City Press; and underlying data. These growth rates are correlated with growth rates for the number of gaming machines, which have not been growing as fast in recent years, in large part due to restrictions on the number of gaming machines per tribe. 21 The average annual growth rate is computed as the compound annual growth rate (CAGR).
Protect California’s Budget & Economy 9

The Potential Economic and Fiscal Benefits of New Gaming Agreements
Report Submitted to the Coalition to Protect California’s Budget & Economy
10
The growth of California Indian gaming has come from three sources. First, California Indian gaming facilities have been attempting to meet existing excess demand. Excess demand, which still exists today, has been the result of strong demand, as well as restricted supply in the form of strong regulations, tight restrictions on market entry, and caps on the number of gaming machines that can be operated (for all tribes except seven that renegotiated their compacts in 2004 to do away with the machine caps). Some tribes, including three of the four that are the focus of this study, have attempted to increase supply by adding Class II gaming machines as supplements to their Class III machines, which are capped at 2,000 per Tribe.
Second, the growth of California Indian gaming facilities has also been the result of natural growth. Increases in population and disposable personal income have meant more potential customers and more available spending dollars.
Third, California Indian gaming facilities have been able to capture some of the excess demand being fulfilled in Nevada (i.e., of Californians’ casino spending in Nevada). This phenomenon is typically referred to as the recapture effect because dollars that were previously leaving the economy are brought back in. Evidence of the recapture effect can be found in a variety of industry data:
Visitor Surveys – The results of surveys by visitor and convention authorities have shown that the proportion of Nevada visitors that come from California has been declining in recent years. The percentage of Las Vegas visitors from California decreased slightly from 34 percent in 2003 to 32 percent in 2006 (a 6 percent decrease).22 The decrease has been more dramatic for Reno/Sparks/Lake Tahoe and Laughlin visitors. The percentage of Reno/Sparks/Lake Tahoe visitors from California decreased from 59 percent in 2002 to 49 percent 2006 (a 17 percent decrease).23 And the percentage of Laughlin visitors from California decreased from 40 percent in 2003 to 33 percent in 2006 (an 18 percent decrease).24
Industry Surveys – Data from an ongoing nationwide industry survey show a decline in Californians’ visits to Nevada casinos. The percentage of casino visits by Californians to Nevada casinos decreased from 42 percent in 2003 to 31 percent in
22 GLS Research, Las Vegas Visitor Profile, Calendar Year 2006. Note that pre-2003 visitor statistics were reported on a different annual basis than later years (fiscal rather than calendar year) and thus were not used in this comparison. The decrease in the percentage of Las Vegas visitors from California = (32-34)/34 = 6 percent. 23 Reno-Sparks Convention & Visitors Authority, Marketing Statistics Report, 2003 and 2006. Note that the 2002 percentage of visitors from California utilized a slightly different methodology than later years. According to the consultant that conducts the survey research on behalf of the Reno-Sparks Convention & Visitors Authority, the 59 percent figure for 2002 is likely to be slightly underestimated due to this difference in methodology. Thus, the decrease in the percentage of Reno/Sparks/Lake Tahoe visitors from California from 2002 to 2006 is larger than it appears. The calculated decrease in the percentage of Reno/Sparks/Lake Tahoe visitors from California = (49-59)/59 = 17 percent. 24 GLS Research, Laughlin Visitor Profile, Calendar Year 2006. Note that before 2003, visitor statistics were reported on a different annual basis than later years (fiscal rather than calendar year) and thus were not used in this comparison. The decrease in the percentage of Laughlin visitors from California = (33-40)/40 = 18 percent.

The Potential Economic and Fiscal Benefits of New Gaming Agreements
Report Submitted to the Coalition to
2006/2007, while increasing at California Indian gaming facilities from 53 percent in 2003 to 64 percent in 2006/2007.25
Analysis of Casino Gaming Spending by Californians – As shown in Figure 1, Californians’ spending at California Indian gaming facilities and Nevada casinos combined has substantially increased in recent years,26 almost doubling from approximately $5.6 billion in 2001 to $10.9 billion in 2006.27 In addition, California Indian gaming’s share of this total also substantially increased from 49 percent in 2001 to 67 percent in 2006, and Nevada casinos’ share decreased from 46 percent to 28 percent over that same period. Meanwhile, the absolute dollars spent at Nevada casinos by Californians remained fairly flat (as represented by the height of the green bars in Figure 1 or as shown in the row titled “Nevada Gaming Revenue from California Visitors ($ Billions)” in Appendix C).
Figure 1. Casino Gaming Spending by Californians
$0.0
$2.0
$4.0
$6.0
$8.0
$10.0
$12.0
$14.0
2001 2002 2003 2004 2005 2006
Cas
ino
Gam
ing
Spen
ding
($ B
illio
ns)
California Indian Gaming
Nevada Casinos
Other Casinos
46% 42% 35% 31%30% 28%
49%
53%60%
64%
65%67%
$6.0
$7.0
$8.0
$9.2
$10.8
$11.5
Source: Appendix C.
25 Confidential industry survey data, 2003 and 2006-2007 (results used with permission). The remaining 5 percent of casino visits in 2003 and 2006-2007 were made to casinos in other states (2003: 100 percent – 42 percent – 53 percent = 5 percent; 2006-2007: 100 percent – 31 percent – 64 percent = 5 percent). 26 According to industry survey data, 95 percent of all casino visits by Californians in 2006 and 2007 were made to California Indian gaming facilities and Nevada casinos in Las Vegas, Reno, Laughlin, and Lake Tahoe (Source: confidential industry survey, 2006-2007 (used with permission)). The remaining 5 percent of casino visits was made to casinos in other states. 27 Note that in Figure 1, the percentage of Nevada visitors from California was used as a proxy for the percentage of Nevada casino gaming spending by Californians because data on Nevada casino spending were not available by visitor origin.
Protect California’s Budget & Economy 11

The Potential Economic and Fiscal Benefits of New Gaming Agreements
Report Submitted to the Coalition to Protect California’s Budget & Economy
12
At first glance, these results might be interpreted to mean that most of the aforementioned increase in the casino gaming market was not due to the recapture effect, but pure growth on the part of the California Indian gaming facilities. But this is not likely to be the case given that the proportion of Nevada visitors from California has been declining over time (see the two previous bullets). In Figure 1, the true decrease in the number of Nevada visitors from California is at least partially masked by the increase in spend per visit.28 Therefore, at least some portion of the increase in California Indian gaming’s share of Californians’ casino spending in Nevada is due to the recapture effect.
Over time, California Indian gaming facilities have been successful in recapturing some of Californians’ spending at Nevada casinos because of:
A substantial geographic competitive advantage – Indian gaming is much closer for most Californians;
Some increases in the supply of gaming – more gaming machines and table games, introductions of new gaming facilities, and expansions of existing gaming facilities;
Substantial increases in the supply of non-gaming amenities – introductions/ additions of lodging, restaurants, entertainment, and retail at and around Indian gaming facilities; and
Vast improvements in quality – an updated look and feel, and improved gaming options and non-gaming amenities at Indian gaming facilities.
SOUTHERN CALIFORNIA CASINO GAMING MARKET
Despite somewhat remote casino locations,29 the Tribes all participate in the Southern California gaming market, which includes Los Angeles, Orange, San Diego, San Bernardino, and Riverside counties. It consists of a very large population that enjoys casino gambling. Southern California generally consists of two major market areas: Los Angeles and San Diego.30
Los Angeles: Participation in casino gambling by Los Angeles area residents ranks among the highest in the country. According to survey research conducted on behalf
28 Total casino gaming spending is the product of three amounts: the number of visitors, frequency of visits, and spend per visit. As noted before, visitor survey data revealed that the proportion of Nevada visitors from California has been declining over time. These data also showed little or no growth in the frequency of casino visits per patron (e.g., for Las Vegas visitors, 1.7 in 2003, 1.8 in 2004, 1.7 in 2005, and 1.7 in 2006), but a significant increase in the dollars gambled per visit over time (e.g., for Las Vegas, $490.87 in 2003, $544.93 in 2004, $626.50 in 2005, and $651.94 in 2006). Source: GLS Research, Las Vegas Visitor Profile, Calendar Year 2006. Note that if there was not a decrease in visitors in Figure 1, then the absolute dollars spent at Nevada casinos by Californians (again the height of the green bars in Figure 1) should have been significantly higher given the increase in the dollars gambled per visit. 29 Of course, the remote locations of the Tribes’ casinos are the result of the remote locations of the Tribes’ Reservations. 30 Southern California is typically broken down into two key Designated Market Areas (DMAs): the Los Angeles DMA, which includes Los Angeles, Orange, San Bernardino, Riverside (part thereof), Ventura, Kern (part thereof), and Inyo counties; and the San Diego DMA, which includes San Diego County. No data were available for the Palm Springs DMA, which includes the other part of Riverside County not included in the Los Angeles DMA.

The Potential Economic and Fiscal Benefits of New Gaming Agreements
Report Submitted to the Coalition to Protect California’s Budget & Economy
13
of Harrah’s Entertainment, Inc.,31 the participation rate is 37 percent. In other words, almost four out of every 10 residents of the Los Angeles market gambles in a casino. This is well above the U.S. average participation rate of 25 percent. Given its large population and high participation rate, the Los Angeles market is by far the largest source of casino trips in California (38 percent of the statewide total), and the second largest source of casino trips in the country (7 percent of the U.S. total), only behind New York City.32 In addition, travel industry survey research found that residents of the Los Angeles area have a greater propensity to include gambling in a trip than residents of any other market area in the country.33
San Diego: Participation in casino gambling by San Diego area residents is the highest in the country. According to Harrah’s survey research,34 the participation rate is 41 percent, well above the U.S. average rate of 25 percent. The average number of annual casino visits per casino gambler for San Diego (7.6) is also the highest in the country and well above the U.S. average (5.8).35 Given its decent-sized population, high participation rate, and high trip frequency, the San Diego market ranks as the second largest source of casino trips in California (12 percent of the statewide total), and the eighth largest source of casino trips in the country (2 percent of the U.S. total).36
Aside from market demographics, limited competition also makes Southern California an excellent source of gaming customers. As was previously noted, the only casino gaming available in Southern California is Indian gaming. And while there are horse racetracks and card rooms in Southern California, they are not good substitutes for casino gaming. Neither of these two segments can offer gaming machines, the primary games of interest for patrons and primary revenue generators for casinos.
For these reasons (and others mentioned earlier in this chapter), Las Vegas casinos have traditionally been able to attract a large number of Southern Californians. In 2006, the percentage of Las Vegas visitors from Southern California was 27 percent.37 This is the vast majority of the 32 percent of Las Vegas visitors that came from California overall.
31 Harrah’s Entertainment, Inc., Harrah’s Survey 2006: Profile of the American Casino Gambler, 2006. The participation rate was measured by whether someone gambled at least once in a casino in the previous 12 months. 32 While the relative rankings were confirmed in the 2006 Harrah’s survey, it did not provide detailed data as in previous years. Thus, the calculations of the Los Angeles DMA’s casino trips as a percent of total California casino trips and as a percent of total U.S. casino trips were made based on data from the 2004 Harrah’s survey (Source: Harrah’s Entertainment, Inc., Harrah’s Survey ’04: Profile of the American Casino Gambler, 2004). 33 Travel Industry Association of America, “Profile of Travelers Who Participate in Gambling,” 2000 edition. 34 Data for San Diego were not included in the 2006 Harrah’s survey. Thus, data from the 2004 Harrah’s survey were used (Source: Harrah’s Entertainment, Inc., Harrah’s Survey ’04: Profile of the American Casino Gambler, 2004). 35 Data for San Diego were not included in the 2006 Harrah’s survey. Thus, data from the 2004 Harrah’s survey were used (Source: Harrah’s Entertainment, Inc., Harrah’s Survey ’04: Profile of the American Casino Gambler, 2004). 36 While the relative rankings were confirmed in the 2006 Harrah’s survey, it did not provide detailed data as in previous years. Thus, the calculations of the San Diego DMA’s casino trips as a percent of total California casino trips and as a percent of total U.S. casino trips were made based on data from the 2004 Harrah’s survey (Source: Harrah’s Entertainment, Inc., Harrah’s Survey ’04: Profile of the American Casino Gambler, 2004). 37 GLS Research, Las Vegas Visitor Profile, Calendar Year 2006.

The Potential Economic and Fiscal Benefits of New Gaming Agreements
Report Submitted to the Coalition to Protect California’s Budget & Economy
14
In light of all of the foregoing, there is significant growth potential for tribes in the Southern California market, particularly those situated closer to large populations. If Tribes can continue to increase their gaming supply (particularly the number of gaming machines), introduce and/or add non-gaming amenities, and develop additional high quality gaming facilities, thus creating more of a clustering effect, they will be in a good position to further grow the gaming market and recapture more Californians that are currently gambling in Nevada. As long as there are Southern Californians visiting Nevada casinos, there is room for growth of California Indian gaming facilities.

The Potential Economic and Fiscal Benefits of New Gaming Agreements
Report Submitted to the Coalition to Protect California’s Budget & Economy
15
3. Methodology
This section provides background on the methods used in this report to assess the economic and fiscal benefits of the amended compacts.
ECONOMIC BENEFITS ANALYSIS
In order to measure the potential economic benefits of the amended compacts, an input-output analysis was utilized. Generally, an input-output analysis is used to measure the total economic impact of one or more events, projects, businesses, or industries to a region’s economy. Through its use, the impact of an initial change in an economy, such as an increase in the supply of gaming, can be traced to determine secondary effects in that economy. An input-output analysis models an economy by accounting for the economic interdependence between industries, households, and government institutions.
The initial change in economic activity is typically referred to as the direct effect. The direct effect is the “input” into the input-output analysis. In the case of the gaming facilities, the direct effect can be measured as patron expenditures while visiting the gaming facilities. This includes gaming and non-gaming expenditures at the facilities, as well as at off-site businesses during a casino visit.
Secondary effects come about as the initial patron expenditures are spent and re-spent throughout the economy. These successive rounds of spending are often referred to as the “multiplier effect.” The secondary effects continue until leakages (e.g., imports, profit, and savings) stop the cycle. There are two types of secondary effects: indirect and induced.
The indirect effect arises from the iteration of businesses purchasing from other businesses as a result of the direct effect. For instance, gaming facilities will purchase goods and services from suppliers, who in turn purchase goods and services from their suppliers, and so on.
The induced effect arises from household spending that is stimulated by wages directly or indirectly earned as a result of the direct effect. For instance, gaming facility employees use their wages to make household purchases. So do employees of businesses that are indirectly impacted by the gaming facilities (e.g., employees of suppliers).
Because other segments of the economy are supported, at least in part, by the initial economic activity, the total economic impact equals the sum of the direct, indirect, and induced effects. In order to estimate the secondary effects, an input-output analysis generates multipliers that are then applied to the direct effect.
In conducting an economic impact analysis, a study area must be defined. The study area is the geographic region in which the economic impact is to be measured. A wide range of geographic regions can be analyzed with economic impact analyses. In fact, study areas can

The Potential Economic and Fiscal Benefits of New Gaming Agreements
Report Submitted to the Coalition to Protect California’s Budget & Economy
16
be defined as small as a zip code, as large as the entire United States, and everywhere in between. In this report, the study area for the analyses of the amended compacts is the State of California. The state level was chosen for the study area because the economic benefits of the amended compacts would be felt statewide. Furthermore, the referenda in the February 5, 2008 election are statewide issues before all California voters.
An input-output analysis yields three primary measure of economic activity: output, jobs, and wages. Output equals the value of production or sales. Jobs are the number of person-years of employment. A person-year is equal to the hours of work needed to keep an individual fully employed for one year. Wages consist of income earned by households, including self-employed individuals. It also includes tips and benefits, such as health insurance and retirement payments.
FISCAL BENEFITS ANALYSIS
A fiscal benefits analysis measures the financial effect on government entities. This includes both tribal and non-tribal governments.
Tribal Fiscal Benefits
As prescribed by the Indian Gaming Regulatory Act (IGRA), Indian gaming is intended “as a means of promoting tribal economic development, self-sufficiency, and strong tribal governments.”38 In other words, Indian casinos are owned and operated for the benefit of tribes. However, IGRA restricts the uses of gaming profit (i.e., gaming revenue minus all expenses) by tribes. IGRA sets forth that tribes may only use gaming profit to:39
1) Fund tribal government operations or programs;
2) Provide for the general welfare of tribal members;
3) Promote tribal economic development;
4) Donate to charitable organizations; and
5) Help fund operations of local government agencies.
In accordance with these requirements, tribes have historically used gaming profit to:
Support social and economic tribal programs and services, such as health care, housing development, educational programs, elderly care, vocational training, environmental services, loans, and scholarships;
Fund the development of other tribal enterprises;
Help charitable causes; and
Assist state and local governments. 38 Indian Gaming Regulatory Act, 25 U.S.C. § 2702(1). 39 Indian Gaming Regulatory Act, 25 U.S.C. § 2710.

The Potential Economic and Fiscal Benefits of New Gaming Agreements
Report Submitted to the Coalition to Protect California’s Budget & Economy
17
Due to the confidentiality of tribal financial data, actual and projected gaming profit to the Tribes is not set forth in this report.
Non-Tribal Fiscal Benefits
There exists a common misperception that Indian gaming does not generate any fiscal benefits beyond tribal governments. However, this is incorrect. In most cases, federal, state, and local governments each experience fiscal benefits from tribal business operations, including gaming facilities.
The first type of fiscal benefit to federal, state, and local governments is tax revenue. There are only a few situations where taxes are not paid: (1) tribes, as sovereign governments, do not pay corporate income taxes on revenue, property taxes on tribal land, or for California tribes, state sales tax on purchases if the goods are delivered and ownership is transferred on a reservation; (2) tribal members who both live and work on an Indian reservation do not pay state income taxes; and (3) no state or local sales/excise taxes are levied on purchases by tribal members on reservations.
However, taxes are paid in all other circumstances, including all secondary economic activity generated by Indian gaming (i.e., the indirect and induced effects of the economic impact analysis). The taxes on secondary economic activity include: corporate profit taxes; income taxes; sales and excise taxes; property taxes; motor vehicle licensing fees; fishing, hunting, and other personal license fees; and other fees and fines.
Tax revenue is calculated by applying appropriate tax rates to taxable profit, income, and purchases.
The second type of non-tribal fiscal benefits that may come about from Indian gaming operations are direct payments to state and local governments (i.e., revenue sharing). While federal law expressly prohibits states from imposing any tax, fee, charge, or other assessment upon a tribe, other than the reimbursement of the state’s regulatory costs, as a condition to operate gaming facilities,40 some tribes voluntarily contribute a portion of gaming revenue/profit to state and local governments. In exchange, tribes have been granted additional benefits beyond the right to operate gaming facilities, such as exclusivity in a region and/or an expansion of gaming.
In this study, revenue-sharing payments are estimated based upon the terms of the Tribes’ gaming compacts with the State and prospective mitigation agreements with local governments. Included in the estimates of revenue-sharing payments to local governments are one-time infrastructure costs.
In addition to fiscal benefits, there may be some fiscal costs incurred by non-tribal governments as a result of expanded gaming under the amended compacts. These costs 40 Indian Gaming Regulatory Act, 25 U.S.C. § 2710(d)(4).

The Potential Economic and Fiscal Benefits of New Gaming Agreements
Report Submitted to the Coalition to Protect California’s Budget & Economy
18
may be related to local public services (e.g., fire; police; prosecutorial/public defender; sewer services; utilities; and solid waste disposal) and infrastructure (e.g., fire and police structures and equipment; roads; traffic mitigation; and sewer disposal). It is my understanding that the amended compacts require the Tribes to enter into binding and enforceable agreements with impacted local governments to compensate for such impacts. Therefore the fiscal costs to local governments have not been analyzed in this report.
GROSS BENEFITS VERSUS NET BENEFITS
The total effects of all dollars generated by the initial economic activity (e.g., patron expenditures during casino visits) are referred to as the gross benefits. However, some of these dollars may not be “new” to an economy. Some dollars may merely replace existing spending on other activities in the economy. This phenomenon is commonly referred to as the substitution effect. On the other hand, if dollars previously spent outside the economy would now be spent within the economy, then these dollars are considered “new” to that economy. This phenomenon is commonly referred to as the recapture effect. Both the substitution effect and recapture effect should be examined in light of each unique circumstance.
The net effects of all dollars spent by casino patrons, after accounting for any substitution and recapture effects, are the net benefits. In this study, the net benefits were measured.
IMPLAN
For this report, the economic benefits analysis and the tax revenue component of the fiscal benefits analysis were conducted using the IMPLAN economic modeling system.41 IMPLAN was originally developed by the USDA Forest Service in cooperation with the Federal Emergency Management Agency and the USDI Bureau of Land Management.42 The IMPLAN system has been in use since 1979 and continues to be widely used by universities, government agencies, corporations, and private consultants to conduct economic impact analyses involving a wide range of issues and industries.
The IMPLAN data and accounts closely follow the accounting conventions used in the “Input-Output Study of the U.S. Economy” by the U.S. Bureau of Economic Analysis and the format recommended by the United Nations. IMPLAN is largely based upon data from the U.S. Bureau of Economic Analysis and U.S. Bureau of Labor Statistics.
The region data used in the input-output models are for 2006, which is the most current year available. The economic and fiscal benefits are reported in current dollars (2008).
41 Minnesota IMPLAN Group, Inc. (MIG), IMPLAN system 2.0 (region data and software). 42 Olson, Doug and Scott Lindall, "IMPLAN Professional Software, Analysis, and Data Guide"; Minnesota IMPLAN Group, Inc.

The Potential Economic and Fiscal Benefits of New Gaming Agreements
Report Submitted to the Coalition to Protect California’s Budget & Economy
19
4. Data
Given that the amended compacts are not yet in effect, the economic and fiscal benefits analyses are based upon projections of the performance of expanded gaming. Projections were based upon casino/tribal financials and business plans confidentially provided by each Tribe to Analysis Group. This information included gaming revenue, non-gaming revenue, revenue sharing, gaming machine counts, employee counts, wages paid to employees, tribal government revenue from the casinos, and construction costs. Due to the highly sensitive nature of this information, and the fact that some of the Tribes are competitors, individual Tribe data was not shared across Tribes. Furthermore, all data and results presented in this report are aggregated across all four Tribes.
Gaming market information comes from a variety of sources. Commercial casino data were gathered from state gaming regulatory agencies. Indian gaming data were drawn from independent research and analysis conducted by Analysis Group outside the scope of this assignment, including the information set forth in and underlying the Indian Gaming Industry Report.43 Casino visitor data were primarily gathered from third-party studies, including those by the Las Vegas Convention and Visitors Authority, the Reno-Sparks Convention & Visitors Authority, the Lake Tahoe Visitors Authority, the Travel Industry Association of America, GLS Research, and Harrah’s Entertainment.
While Analysis Group has gathered and reviewed information from what it believes to be reliable sources, third-party data were not independently audited.
43 Meister, Alan, Indian Gaming Industry Report, 2007-2008 Edition, Newton: Casino City Press.

The Potential Economic and Fiscal Benefits of New Gaming Agreements
Report Submitted to the Coalition to Protect California’s Budget & Economy
20
5. Analysis and Results
This section sets forth the results of the economic and fiscal benefits analyses for the amended compacts. There are two general phases of benefits:
1) Construction – the benefits of expanding existing gaming facilities and/or constructing new gaming facilities in order to accommodate the increase in the number of gaming machines allowed by the amended compacts; and
2) Operations – the benefits of the operation of additional gaming allowed by the amended compacts.
The construction-related economic and fiscal benefits are one-time impacts. In other words, each specific construction expenditure occurs at a single point in time. On the other hand, the operations-related economic and fiscal benefits are recurring annual impacts. They occur every year that the additional gaming allowed by the amended compacts is operated by the Tribes. And given that the operations-related economic and fiscal benefits will change over the life of the amended compacts as the Tribes move forward with implementing their gaming expansion plans, they are measured as the average annual benefits. Thus, when total economic and fiscal benefits are computed over the life of the amended compacts, the construction-related economic and fiscal benefits are only counted once, while the operations-related economic and fiscal benefits are counted once per year.
CONSTRUCTION-RELATED ECONOMIC AND FISCAL BENEFITS
Construction Costs
As noted earlier in this report, the Tribes will have to expand their existing casinos and/or construct new gaming facilities in order to accommodate the total number of gaming machines allowed under the amended compacts. The construction costs associated with these gaming expansions were projected on a tribe-by-tribe basis using data and business plans confidentially provided by the Tribes. There were several steps to projecting construction costs for each Tribe:
1) Estimation of the number of additional gaming machines that could be added to existing gaming facilities – This entailed determining excess capacity at a Tribe’s existing facilities, as well as the number of Class II machines that would be replaced by the additional Class III machines allowed under the amended compact.
2) Computation of the remaining number of gaming machines allowed under the Tribe’s amended compact – This was simply calculated as the total number of additional machines allowed minus the number of machines that could be added to existing gaming facilities, as estimated in step 1 of this analysis.

The Potential Economic and Fiscal Benefits of New Gaming Agreements
Report Submitted to the Coalition to
3) Determination of the size and scope of expansions of existing gaming facilities and/or construction of a new gaming facility – In order to ascertain the construction needed to accommodate the remaining number of gaming machines calculated in step 2 of this analysis, we reviewed each Tribe’s business plans and specifications for comparable facilities, particularly for each Tribe’s existing gaming facilities. Included in the scope of the facilities were non-gaming amenities located at the gaming facilities.
4) Estimation of construction costs – The costs of the expansions of existing gaming facilities and/or construction of a new gaming facility were estimated based upon the size and scope of facilities determined in step 3 of this analysis, as well costs for comparable gaming facilities, including the Tribe’s existing gaming facilities. Construction costs included all hard costs, soft costs, and furniture, fixtures, and equipment (FFE) costs.
5) Determination of construction start dates – Expansions of existing gaming facilities and/or construction of a new gaming facility were projected to begin based upon current market demand and the Tribe’s business plans.
6) Estimation of the duration of construction periods – For simplicity, the construction periods for expansions of existing gaming facilities and/or construction of a new gaming facility were assumed to be two years from the construction start dates determined in step 5 of this analysis.
7) Allocation of construction costs across construction periods – To keep things simple, total construction costs for expansions of existing gaming facilities and/or construction of a new gaming facility were assumed to be equally distributed across the total number of years in the construction period, as determined in step 6 of this analysis.
Once each Tribe’s construction costs were estimated per year, they were aggregated across the Tribes to protect the confidentiality of the data. As shown in Table 3, given the size and scope of the gaming facilities necessary to accommodate all of the additional gaming machines allowed under the amended compacts, it is projected that total construction costs for all four Tribes over the life of the amended compacts would be roughly $2.4 billion.
Table 3. Construction Costs ($ Millions)
Year Cost2009 $3252010 $3252011 $4002012 $4002013 $1002014 $1002016 $3752017 $375Total $2,400
Sources: Tribes' construction plans.These costs are estimated to begin in 2009 and continue in stages through 2017, when the Tribes are expected to have sufficient facility capacity to accommodate all of the additional gaming machines allowed under the amended compacts.
Protect California’s Budget & Economy 21

The Potential Economic and Fiscal Benefits of New Gaming Agreements
Report Submitted to the Coalition to
Construction-Related Economic Benefits – Life of the Amended Compacts
As shown in Table 4, casino expansion and construction would yield significant positive benefits on California’s economy. Over the life of the amended compacts (22 years and 10 months), construction expenditures would directly and indirectly generate approximately:
$4.0 billion in output (i.e., value of sales);
29,200 jobs (i.e., person-years of employment); and
$1.3 billion in wages.
Con r enefits – Life of the Amended Compacts
irectly generate approximately $193 million in tax revenue over the life of the amended compacts. Generally,
that
lowed under the amended compacts was estimated on a tribe-by-tribe basis using confidential tribal casino data and business plans, as well as market
Type of Effect Output Jobs Wages Taxes Direct $2,172 16,427 $757 - Indirect $733 4,692 $221 - Induced $1,131 8,122 $318 - Total Impact $4,036 29,242 $1,296 $193
Output, Wages, and Taxes are in millions of current dollars.Detail may not equate to total due to rounding.
Jobs are measured in person-years of employment.
Table 4. Total Construction Impact2008-2030
st uction-Related Fiscal B
Table 4 also shows that casino expansion and construction would also ind
tax revenue would come from taxable secondary economic activity resulting from the construction expenditures by the Tribes (i.e., construction employee wages and spending; the iteration of businesses purchasing from other businesses as a result of construction expenditures and employee spending; and wages and spending by employees at indirectlyimpacted businesses). For the purposes of this analysis, it was conservatively assumed the Tribes would have all construction-related materials delivered to the reservation and ownership transferred on their reservation, and thus they would not pay any state sales tax on the purchase of construction-related materials. If this assumption fails to materialize, then the fiscal benefits of the amended compacts would be greater than those stated above.
OPERATIONS-RELATED ECONOMIC AND FISCAL BENEFITS
Incremental Gaming Revenue
The increased gaming activity al
information. There were several steps to estimating incremental gaming revenue for eachTribe:
Protect California’s Budget & Economy 22

The Potential Economic and Fiscal Benefits of New Gaming Agreements
Report Submitted to the Coalition to Protect California’s Budget & Economy
23
1) Determination of the start date for the expansion of gaming under the amended compacts – As noted earlier in this report, we were asked to assume that the amended compacts will be approved by California voters on February 5, 2008 and the Tribes would be able to begin expanding their gaming operations on March 1, 2008.
2) Development of a gaming expansion plan – Based upon existing and projected market demand, as well as a Tribe’s business plans, we developed a projected timetable for the rollout of additional Class III gaming machines allowed under the amended compact. This entailed estimating the number of new gaming machines that would be operated each year. Due to capacity constraints at existing gaming facilities, each Tribe would only initially introduce a portion of the additional Class III machines allowed by their amended compact. The remaining gaming machines would be added incrementally as expansions of existing gaming facilities and/or construction of a new gaming facility were completed.
3) Estimation of the increase in gaming revenue from additional Class III machines – For each additional Class III machine added under its amended compact, a Tribe will generate a stream of revenue. On an annual basis, the increase in gaming revenue was calculated as the number of added gaming machines multiplied by the expected gaming revenue per Class III machine per day multiplied by the number of days in the year. The number of added gaming machines was determined in step 2 of this analysis and expected gaming revenue per Class III machine per day was estimated based upon current levels, the number of existing and new gaming machines, and market demand.
4) Estimation of the decrease in gaming revenue from existing Class III machines – The introduction of additional gaming machines is projected to decrease the expected gaming revenue per machine per day on existing gaming machines. Generally, this is referred to as the dilution effect because patron spending is spread across a greater number of machines. However, given excess demand for Class III machines at each Tribe’s existing gaming facilities (e.g., during peak periods, casino patrons are waiting in line to play Class III gaming machines or they are playing Class II machines, if offered, because Class III machines are unavailable), revenue per machine is not expected to significantly decrease. Moreover, revenue per machine is expected to rebound to a large degree as a result of continued growth in the market (from capturing business from Nevada casinos, growth stimulated by the increase in supply, and/or natural growth). On an annual basis, the decrease in gaming revenue from existing Class III machines was calculated as the decrease in the expected gaming revenue per machine per day multiplied by the number of existing Class III machines (2,000) multiplied by the number of days in the year. Expected gaming revenue per machine per day for existing Class III machines was estimated based upon current levels, the number of existing and new gaming machines, and market demand.

The Potential Economic and Fiscal Benefits of New Gaming Agreements
Report Submitted to the Coalition to Protect California’s Budget & Economy
24
5) Estimation of the decrease in gaming revenue from removed Class II machines – In order to try to meet customer demand over the past few years, three of the four Tribes have been supplementing their Class III machines with Class II machines, which are not restricted by gaming compacts. Unfortunately, these Class II devices are not as appealing to customers as Class III machines and they generate less revenue. Thus, each Tribe plans to replace all of its Class II machines with Class III machines when the amended compacts become effective. As a result, each Tribe will lose all Class II machine revenue. On an annual basis, the decrease in Class II machine revenue was calculated as the number of removed Class II gaming machines multiplied by the expected gaming revenue per Class II machine per day multiplied by the number of days in the year. The expected gaming revenue per Class II machine per day was estimated based upon current levels, the number of Class II and Class III gaming machines, and market demand.
6) Estimation of the increase in other gaming revenue – As additional Class III machines are added by each Tribe, there is likely to be an increase in other existing gaming (e.g., table games, poker, and bingo) at their gaming facilities. This increase was estimated per year by multiplying the increase in gaming revenue from additional Class III machines by the expected ratio of other gaming revenue to Class III machine revenue. The expected ratio of other gaming revenue to Class III revenue was based upon the actual ratio for the Tribe’s existing gaming facilities.
7) Calculation of the incremental gaming revenue under the amended compacts – On an annual basis, incremental gaming revenue is equal to the net effect of the increase in gaming revenue from additional Class III machines under the amended compact, the decrease in gaming revenue from existing Class III machines, the decrease in gaming revenue from removed Class II machines, and the increase in other gaming revenue.
Once each Tribe’s incremental gaming revenue was estimated per year, they were aggregated across the Tribes to protect the confidentiality of the data. Then, in order to measure the average annual incremental gaming revenue, we summed up the aggregate incremental gaming revenue for all years of the amended compacts and divided that total by the term of the amended compacts. Given that the amended compacts are assumed to be effective on March 1, 2008 and run through December 2030, the term of the compacts is 22 years and 10 months (22.83 years).
As shown in Table 5, the aggregate incremental gaming revenue from the amended compacts is approximately $2.3 billion per year. This is calculated as the net effect of a $2.2 billion increase in gaming revenue from additional Class III machines, a $229 million decrease in gaming revenue from existing Class III machines, a $47 million decrease in gaming revenue from removed Class II machines, and a $455 million increase in other gaming revenue.

The Potential Economic and Fiscal Benefits of New Gaming Agreements
Report Submitted to the Coalition to
Table 5. Aggregate Incremental Gaming Revenue
Number of New Class III Machines 14,079Expected Gaming Revenue Per Class III Machine Per Day $421Number of Days in Year 365Gaming Revenue from New Class III Machines ($ Millions) $2,167
Gaming Revenue Per Class III Machine Per Day with Amended Compacts $411Gaming Revenue Per Class III Machine Per Day without Amended Compacts $489Decrease in Gaming Revenue Per Class III Machine Per Day with Amended Compacts -$79Number of Existing Class III Machines 8,000Number of Days in Year 365Change in Gaming Revenue from Existing Class III Machines ($ Millions) -$229
Change in Number of Class II Machines -2,604Expected Gaming Revenue Per Class II Machine Per Day $49Number of Days in Year $365Change in Gaming Revenue From Removal of Class II Machines ($ Millions) -$47
Ratio of Other Gaming Revenue to Class III Machine Revenue 21.0%Gaming Revenue from New Class III Machines ($ Millions) $2,167Change in Other Gaming Revenue ($ Millions) $455
Total Change in Gaming Revenue ($ Millions) $2,345Sources: Tribes' financial data; market analyses.
Average Year
It is important to note that gaming revenue equals amounts wagered minus payouts. Thus, it is not equal to profit.
Incremental Non-Gaming Revenue
In addition to incremental gaming revenue, the amended compacts would lead to incremental non-gaming revenue.44 This would result from the fact that patrons playing the newly added gaming machines are likely to also spend money on other non-gaming amenities, such as lodging, food and beverages, entertainment, and shopping, while at the Tribes’ gaming facilities. While incremental non-gaming revenue would also likely accrue to complementary businesses outside of the casinos, data on this type of patron spending were not available. Thus, the exclusion of off-site incremental non-gaming revenue has the effect of underestimating total incremental non-gaming revenue and the total economic and fiscal benefits of the amended compacts.
44 For the purposes of the economic and fiscal benefits analyses set forth in this report, promotional allowances (i.e., comps), to the extent they would exist, have not been deducted from revenue estimates. While promotional allowances are not actual revenue, the casinos still incur the costs associated with them (e.g., labor and materials) and those costs generate multiplier effects.
Protect California’s Budget & Economy 25
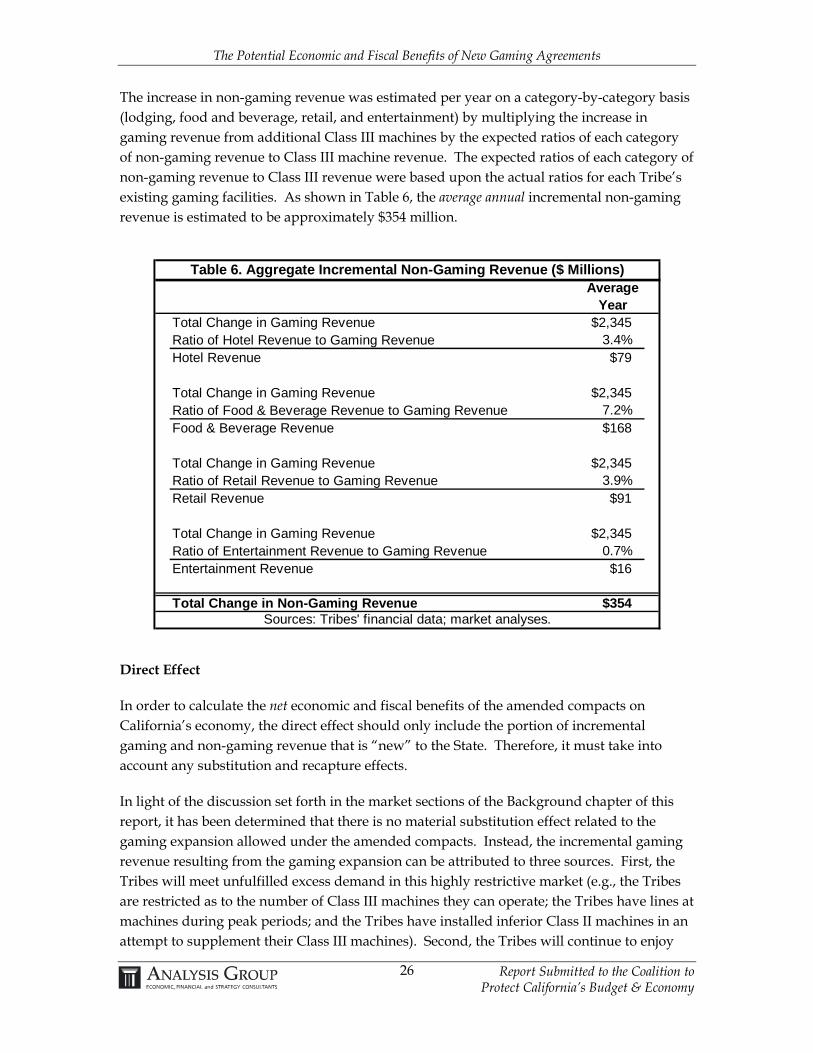
The Potential Economic and Fiscal Benefits of New Gaming Agreements
Report Submitted to the Coalition to
The increase in non-gaming revenue was estimated per year on a category-by-category basis (lodging, food and beverage, retail, and entertainment) by multiplying the increase in gaming revenue from additional Class III machines by the expected ratios of each category of non-gaming revenue to Class III machine revenue. The expected ratios of each category of non-gaming revenue to Class III revenue were based upon the actual ratios for each Tribe’s existing gaming facilities. As shown in Table 6, the average annual incremental non-gaming revenue is estimated to be approximately $354 million.
Table 6. Aggregate Incremental Non-Gaming Revenue ($ Millions)
Total Change in Gaming Revenue $2,345Ratio of Hotel Revenue to Gaming Revenue 3.4%Hotel Revenue $79
Total Change in Gaming Revenue $2,345Ratio of Food & Beverage Revenue to Gaming Revenue 7.2%Food & Beverage Revenue $168
Total Change in Gaming Revenue $2,345Ratio of Retail Revenue to Gaming Revenue 3.9%Retail Revenue $91
Total Change in Gaming Revenue $2,345Ratio of Entertainment Revenue to Gaming Revenue 0.7%Entertainment Revenue $16
Total Change in Non-Gaming Revenue $354Sources: Tribes' financial data; market analyses.
Average Year
Direct Effect
In order to calculate the net economic and fiscal benefits of the amended compacts on California’s economy, the direct effect should only include the portion of incremental gaming and non-gaming revenue that is “new” to the State. Therefore, it must take into account any substitution and recapture effects.
In light of the discussion set forth in the market sections of the Background chapter of this report, it has been determined that there is no material substitution effect related to the gaming expansion allowed under the amended compacts. Instead, the incremental gaming revenue resulting from the gaming expansion can be attributed to three sources. First, the Tribes will meet unfulfilled excess demand in this highly restrictive market (e.g., the Tribes are restricted as to the number of Class III machines they can operate; the Tribes have lines at machines during peak periods; and the Tribes have installed inferior Class II machines in an attempt to supplement their Class III machines). Second, the Tribes will continue to enjoy
Protect California’s Budget & Economy 26

The Potential Economic and Fiscal Benefits of New Gaming Agreements
Report Submitted to the Coalition to Protect California’s Budget & Economy
27
the natural growth of the casino gaming market. Third, given historical trends, California Indian gaming facilities should be able to continue recapturing Californians’ casino spending that goes to Nevada. In fact, a greater amount of recapture may occur if the Tribes are able to further develop their gaming facilities as gaming and entertainment destinations by adding more gaming machines, more high quality non-gaming amenities, and additional facilities – thus creating somewhat of a cluster effect.
There is no existing evidence that California Indian gaming is taking away business from other segments of the gaming industry in California or other forms of entertainment. In fact, the existing literature has generally indicated that there is no substitution effect between Indian gaming and other sectors of the economy:
A nationwide study forthcoming in the Public Finance Review and contained in a new gaming textbook found that increases in Indian gaming did not have a negative impact on casino gambling revenue, horse racing handle, or dog racing handle.45
A 2004 nationwide study by the University of Massachusetts, Dartmouth for the State of Rhode Island showed that the introduction of commercial casinos has had a negligible impact on lottery revenue and that there is minimal substitution between state lotteries and casinos.46
A 1999 study by a University of Massachusetts, Dartmouth professor indicated the absence of a substitution effect between lotteries and casinos and concluded that state lotteries and casinos are not substitutable.47
A Harvard study found that there were no statistically significant negative effects of the introduction of Indian casinos on earnings at restaurants, bars, recreation, retail trade, and general merchandise sectors of the economy.48
In terms of substitution away from existing Indian gaming, historical increases in gaming machines have merely served to expand the gaming market in California. As shown in Figure 2, while the total number of gaming machines at California Indian gaming facilities increased roughly 50 percent from about 41,700 in 2001 to 62,700 in 2006, gaming revenue at California Indian gaming facilities more than doubled from $2.9 billion in 2001 to $7.7 billion in 2006. So gaming revenue growth has been outpacing the growth in the number of gaming machines. And as shown in Figure 3, revenue per gaming machine also grew sharply over the same time period. On the whole, these charts indicate that there is no sign of market saturation or significant substitution away from some Indian gaming facilities.
45 Walker, Douglas M. and John D. Jackson, "Do U.S. Gambling Industries Cannibalize Each Other?" forthcoming in Public Finance Review; Walker, Douglas M., 2007, The Economic of Casino Gambling, New York: Springer-Verlag Berlin Heidelberg, Chapter 5. 46 Center for Policy Analysis, University of Massachusetts Dartmouth, “Comparative Lottery Analysis: The Impact of Casinos on Lottery Revenues and Total Gaming Revenues,” prepared for the State of Rhode Island, May 2004. 47 Dense, Jeff, "State Lotteries, Commercial Casinos, and Public Finance: An Uneasy Relationship?" Gaming Law Review 3(5/6), 1999: 317-328. 48 Taylor, Jonathan, Matthew B. Krepps, and Patrick Wang, “The National Evidence on the Socioeconomic Impacts of American Indian Gaming on Non-Indian Communities,” submitted to the Journal of Gambling Studies.

The Potential Economic and Fiscal Benefits of New Gaming Agreements
Report Submitted to the Coalition to
Figure 2. Gaming Revenue and Number of Gaming Machinesat California Indian Gaming Facilities
$0.0
$1.0
$2.0
$3.0
$4.0
$5.0
$6.0
$7.0
$8.0
$9.0
2001 2002 2003 2004 2005 2006
Gam
ing
Rev
enue
($ B
illio
ns)
0
10,000
20,000
30,000
40,000
50,000
60,000
70,000
Num
ber o
f Mac
hine
s
Gaming Revenue
Number of Machines
Source: Meister, Alan, Indian Gaming Industry Report, 2007-2008 Edition.
Figure 3. Gaming Revenue Per Machine Per Day at California Indian Gaming Facilities
$150
$170
$190
$210
$230
$250
$270
$290
$310
$330
$350
2001 2002 2003 2004 2005 2006
Gam
ing
Rev
enue
Per
Mac
hine
Per
Day
Source: Meister, Alan, Indian Gaming Industry Report, 2007-2008 Edition.
Protect California’s Budget & Economy 28

The Potential Economic and Fiscal Benefits of New Gaming Agreements
Report Submitted to the Coalition to Protect California’s Budget & Economy
29
Given the lack of a substitution effect and a rather significant recapture effect, the direct effect that is the input into the input-output analysis is equal to the sum of incremental gaming and non-gaming revenue, which is $2.7 billion per year.
Tribe and Casino Expenditures
As noted previously, IGRA intended Indian gaming to benefit tribes. Thus, aside from providing assistance to local governments and charities, tribes are restricted to using gaming profit to fund tribal government operations or programs, provide for the general welfare of their members, and promote tribal economic development. In large part, these uses typically occur on tribal reservations. But there are typically positive spillover effects into surrounding communities. In computing the economic and fiscal benefits of the amended compacts, only economic activity that occurs within the State of California was included. This includes expenditures by the casinos and Tribes, as well as revenue-sharing payments with the State, local governments, and non-gaming tribes.
Revenue Sharing
Per the amended compacts, the Tribes would make a couple payments to the State. First, annual lump sum payments to the State General Fund would total approximately $123 million per year. In addition, the Tribes would pay to the State General Fund 15 percent of the net win generated from the operation of up to 3,000 additional gaming machines over their existing 2,000 machines, and 25 percent of the net win generated from the operation of up to an additional 2,500 gaming machines over the first 3,000 gaming machines added (if a tribe is able to have over 5,000 total machines).49 As shown in Table 7, the average annual total of the percentage payments to the State are estimated to be $382 million. Adding in the lump sum payments yields total state revenue-sharing payments of $505 million per year. After netting out the $60 million in Special Distribution Fund (SDF) payments that goes to the State,50 incremental revenue-sharing payments to the State total $445 million per year.
The amended compacts require the Tribes to enter into intergovernmental agreements with local governments if the Tribes wish to expand their existing gaming facilities or construct new ones. As shown in Table 7, the average annual total of prospective local revenue-sharing payments, including one-time infrastructure payments spread over the life of the amended compacts, are estimated to be $27 million. After netting out the $15 million in direct
49 First Amendment to the Tribal-State Compact between the State of California and the Agua Caliente Band of Cahuilla Indians, August 8, 2006; Amendment to the Tribal-State Compact between the State of California and the Morongo Band of Mission Indians, August 29, 2006; Amendment to the Tribal-State Compact between the State of California and the Pechanga Band of Luiseño Indians, August 28, 2006; and Amendment to the Tribal-State Compact between the State of California and the Sycuan Band of the Kumeyaay Nation, August 30, 2006. Note that only the Morongo Band and Pechanga Band would be able to operate 7,500 gaming machines under the amended compacts. The Agua Caliente Band and Sycuan Band would be able to operate 5,000 gaming machines. 50 The amount of SDF payments to the State includes SDF payments redistributed to the RSTF due to uncertainties regarding future shortfalls, if any, in the RSTF. However, SDF payments to the State exclude the portion of SDF payments that are redistributed to local governments.

The Potential Economic and Fiscal Benefits of New Gaming Agreements
Report Submitted to the Coalition to Protect California’s Budget & Economy
30
payments to the local governments and SDF payments redistributed to local governments, incremental revenue-sharing payments to the State total $12 million per year.
Under the amended compacts, the Tribes will continue to make payments to non-gaming tribal governments via RSTF contributions. As shown in Table 7, the annual amounts to be directly paid to the RSTF would total $9 million. After netting out the $3 million in current direct RSTF payments, incremental revenue-sharing payments to non-gaming tribes would total $6 million per year.
The total amount of revenue sharing by the Tribes is the sum of the incremental revenue-sharing payments made to the State, local governments, and non-gaming tribes. As shown in Table 7, the average annual total of these payments is approximately $463 million.
Over the life of amended compacts (22 years and 10 months), total revenue sharing by the Tribes would equal $10.6 billion.51
51 Total revenue sharing over the life of the amended compacts equals the average annual revenue sharing amount ($463 million) multiplied by the number of years the compact would be effective (22 years and 10 months ≈ 22.83 years).
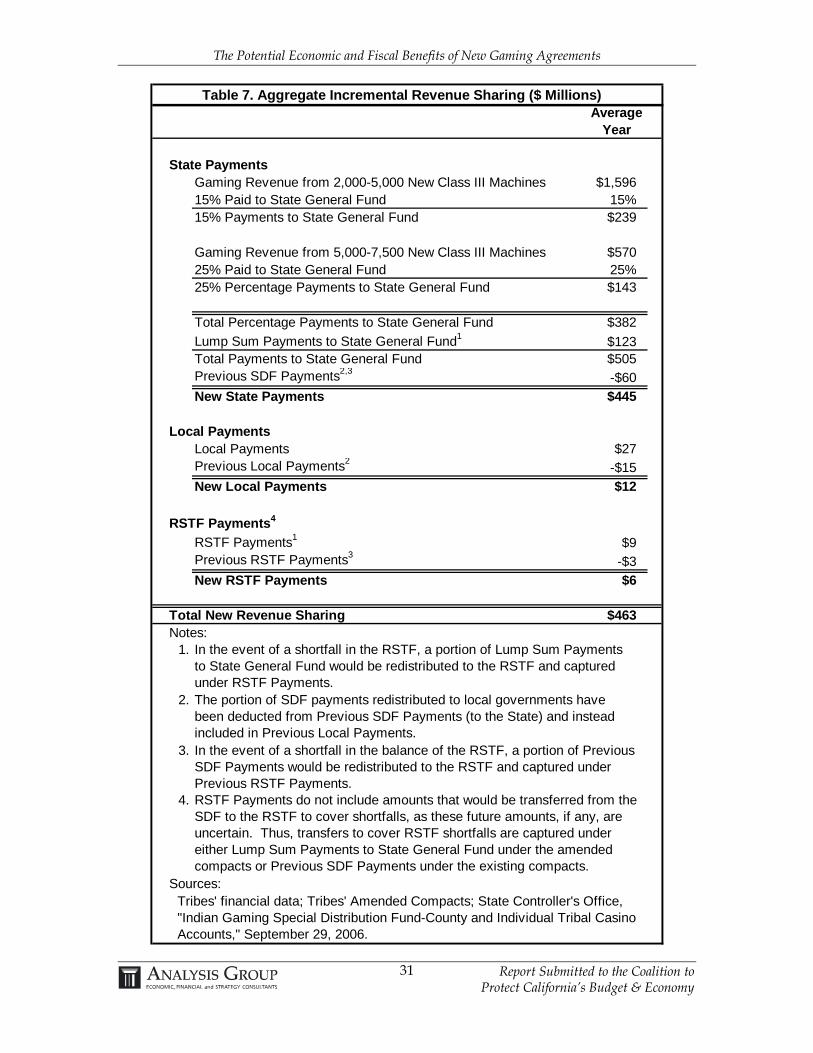
The Potential Economic and Fiscal Benefits of New Gaming Agreements
Report Submitted to the Coalition to
Table 7. Aggregate Incremental Revenue Sharing ($ Millions)
State PaymentsGaming Revenue from 2,000-5,000 New Class III Machines $1,59615% Paid to State General Fund 15%15% Payments to State General Fund $239
Gaming Revenue from 5,000-7,500 New Class III Machines $57025% Paid to State General Fund 25%25% Percentage Payments to State General Fund $143
Total Percentage Payments to State General Fund $382Lump Sum Payments to State General Fund1 $123Total Payments to State General Fund $505Previous SDF Payments2,3 -$60New State Payments $445
Local PaymentsLocal Payments $27Previous Local Payments2 -$15New Local Payments $12
RSTF Payments4
RSTF Payments1 $9Previous RSTF Payments3 -$3New RSTF Payments $6
Total New Revenue Sharing $463Notes:
1.
2.
3.
4.
Sources:
Average Year
The portion of SDF payments redistributed to local governments have been deducted from Previous SDF Payments (to the State) and instead included in Previous Local Payments.
Tribes' financial data; Tribes' Amended Compacts; State Controller's Office, "Indian Gaming Special Distribution Fund-County and Individual Tribal Casino Accounts," September 29, 2006.
In the event of a shortfall in the balance of the RSTF, a portion of Previous SDF Payments would be redistributed to the RSTF and captured under Previous RSTF Payments.
In the event of a shortfall in the RSTF, a portion of Lump Sum Payments to State General Fund would be redistributed to the RSTF and captured under RSTF Payments.
RSTF Payments do not include amounts that would be transferred from the SDF to the RSTF to cover shortfalls, as these future amounts, if any, are uncertain. Thus, transfers to cover RSTF shortfalls are captured under either Lump Sum Payments to State General Fund under the amended compacts or Previous SDF Payments under the existing compacts.
Protect California’s Budget & Economy 31

The Potential Economic and Fiscal Benefits of New Gaming Agreements
Report Submitted to the Coalition to
Operations-Related Economic Benefits – Average Annual Benefits
Using the direct effect, the economic and fiscal benefits analyses for the operation of expanded gaming were conducted.52 As shown in Table 8, the amended compacts would yield significant positive annual economic benefits on California’s economy. The average annual economic benefits are estimated to be approximately:
$4.9 billion in output (i.e., value of sales);
37,000 jobs (i.e., person-years of employment); and
$1.9 billion in wages.
Type of Effect Output Jobs Wages Taxes Direct $2,618 20,931 $1,236 Indirect $943 6,326 $274 Induced $1,365 9,804 $384 Total Impact $4,926 37,060 $1,894 $230
Output, Wages, and Taxes are in millions of current dollars.
Table 8. Average Annual Operations Impact2008-2030
Detail may not equate to total due to rounding.
Jobs are measured in person-years of employment.
Operations-Related Fiscal Benefits – Average Annual Benefits
The amended compacts would also result in substantial fiscal benefits to the State, local governments, and non-gaming tribes. The benefits are two-fold: 1) tax revenues from taxable economic activity generated by the operation of expanded gaming under the amended compacts; and 2) revenue sharing with the State, local governments, and non-gaming tribes under the terms of amended compacts and prospective local agreements required under the amended compacts.
Tax revenue would come from taxable economic activity generated as a result of the operation of the expanded gaming (i.e., casino employee wages and spending; the iteration of businesses purchasing from other businesses as a result of casino operations and employee spending; and wages and spending by employees at indirectly impacted businesses). As shown in Table 8, direct and indirect tax revenue is projected to be approximately $230 million.
As previously noted, the average annual amount of revenue-sharing payments to the State, local governments, and non-gaming tribes would be approximately $463 million.
52 For the purposes of the benefits analyses, the direct effect was broken down by category of expenditure.
Protect California’s Budget & Economy 32

The Potential Economic and Fiscal Benefits of New Gaming Agreements
Report Submitted to the Coalition to
Total statewide fiscal benefits of the amended compacts are the sum of tax revenue and revenue-sharing payments. Thus, the average annual statewide fiscal benefits are approximately $693 million.
Operations-Related Economic Benefits – Life of the Amended Compacts
As shown in Table 9, it is estimated that expanded gaming by the Tribes would directly and indirectly generate the following total economic benefits over the entire life of the amended compacts:
$112.5 billion in output;
846,300 jobs (i.e., person-years of employment); and
$43.2 billion in wages.
Type of Effect Output Jobs Wages Taxes Direct $59,777 477,975 $28,215 - Indirect $21,538 144,456 $6,265 - Induced $31,169 223,876 $8,766 - Total Impact $112,485 846,305 $43,247 $5,248
Output, Wages, and Taxes are in millions of current dollars.Detail may not equate to total due to rounding.
Jobs are measured in person-years of employment.
Table 9. Total Operations Impact2008-2030
Operations-Related Fiscal Benefits – Life of the Amended Compacts
As shown in Table 9, direct and indirect tax revenue to state and local governments is estimated to be approximately $5.2 billion over the life of the amended compacts. And as previously noted, revenue-sharing payments to the State, local governments, and non-gaming tribes over the life of the amended compacts would be approximately $10.6 billion.
Therefore, total statewide fiscal benefits over the life of the amended compacts are approximately $15.8 billion.
TOTAL ECONOMIC AND FISCAL BENEFITS
The total economic and fiscal benefits of the amended compacts are the sum of the construction-related economic and fiscal benefits and the operations-related economic and fiscal benefits over the life of the amended compacts. As shown in Table 10, in consideration of the one-time construction costs and the recurring annual expenditures, it is estimated that expanded gaming over the life of the amended compacts would directly and indirectly generate the following total economic and fiscal benefits:
Protect California’s Budget & Economy 33

The Potential Economic and Fiscal Benefits of New Gaming Agreements
Report Submitted to the Coalition to
$116.5 billion in output;
875,500 jobs (i.e., person-years of employment);
$44.5 billion in wages;
$5.4 billion in state and local taxes; and
$10.6 billion in revenue-sharing payments to the State, local governments, and non-gaming tribes.
And total statewide fiscal benefits, which are the sum of tax revenue and revenue-sharing
payments, are approximately $16 billion over the life of the amended compacts.
Type of Effect Output Jobs Wages Taxes Direct $61,950 494,402 $28,972 - Indirect $22,271 149,149 $6,486 - Induced $32,300 231,998 $9,084 - Total Impact $116,521 875,547 $44,543 $5,441
Output, Wages, and Taxes are in millions of current dollars.Detail may not equate to total due to rounding.
Jobs are measured in person-years of employment.
Table 10. Total Construction and Operations Impact2008-2030
Protect California’s Budget & Economy 34

The Potential Economic and Fiscal Benefits of New Gaming Agreements
Report Submitted to the Coalition to Protect California’s Budget & Economy
35
Appendix A: About the Author
Dr. Meister is an economist specializing in the application of economics to complex business issues, commercial litigation, and regulatory matters. His areas of expertise include economic issues related to Indian gaming, public policy analysis, strategic planning, statistics, antitrust and regulation, and the calculation of economic damages.
Dr. Meister has extensive experience analyzing economic issues related to Indian gaming. His work has included economic impact analyses, industry and market analyses, assessments of regulatory policies, analyses of Tribal-State gaming compacts and revenue sharing, feasibility studies, surveys, and expert testimony in litigation and regulatory matters. He has also conducted years of independent, academic research on Indian gaming and authored a number of publications on the subject. Most notable has been his annual Indian gaming study, the Indian Gaming Industry Report, which has received national recognition. His Indian gaming work is regularly cited by the press and relied upon by the gaming industry, governments, and the investment community. Dr. Meister’s research and analyses have also been relied upon before the United States Supreme Court and a panel of the World Trade Organization. He has also presented his work at various academic, professional, and industry conferences, and testified before the California State Senate.
In his public policy and strategic planning work, Dr. Meister has used economic impact studies, industry and market analyses, feasibility studies, and surveys to identify and measure the effects of changes in economic activity, such as introductions, expansions, and closures of businesses and industries; the infusion of capital into a region; the occurrence of events; and changes in regulations, public policies, and laws. His projects have involved casinos, hotels, resorts, sporting and entertainment events, retail establishments, medical research, publicly funded projects, low-income mixed use real estate developments, and ballot initiatives.
With regard to his statistics work, Dr. Meister has developed and implemented statistical analyses in a wide range of contexts. He has served as an expert regarding the use of statistics in the study of racial profiling, forensic analysis, and skill versus chance game assessments. Dr. Meister also has designed and implemented surveys. Prior to joining Analysis Group, Dr. Meister worked for a market research firm that implemented surveys for the motion picture industry. In addition, he was a teaching assistant for five years at the University of California, Irvine, where he taught courses on statistics, probability, econometrics, and survey design.
Dr. Meister has broad experience providing litigation consulting services. Specifically, he has provided assistance to attorneys on all phases of pretrial and trial practice, including assistance with discovery, development of economic, financial, and statistical models, expert testimony, and critique of analyses by opposing experts. Dr. Meister has conducted damages assessments in a wide variety of cases, including anticompetitive conduct, patent, trademark, and trade dress infringement, misappropriation of trade secrets, breach of contract, labor disputes, fraud, and business interruption.

The Potential Economic and Fiscal Benefits of New Gaming Agreements
Report Submitted to the Coalition to Protect California’s Budget & Economy
36
Appendix B: About Analysis Group, Inc.
Analysis Group provides economic, financial, and business strategy consulting to corporations, law firms, and government entities. We advise corporate and government clients on a range of business issues that require expert interpretation of economic and financial data. We help organizations create strategies for growth by analyzing market dynamics and organizational capabilities, enhancing innovation in current products and services, and identifying new market opportunities. We also assist law firms with all aspects of litigation.
Analysis Group, which was founded in 1981, has over 400 professional staff members, most with degrees in economics, finance, statistics, accounting, and business. We also work closely with an extensive network of experts at leading universities who help us develop state-of-the-art analyses and compelling insights for our clients. The academic rigor imposed by these relationships, coupled with our commitment to teamwork, ensures that our clients receive the highest caliber work product and service. Furthermore, Analysis Group is committed to the long-term satisfaction and success of our clients. We focus on developing long-term relationships based on mutual trust and dynamic collaboration.
Analysis Group's practice areas include accounting litigation services, antitrust, commercial litigation and damages, economic impact studies, energy, entertainment and media, environmental economics, financial institutions, growth and innovation, health care economics, intellectual property, labor and employment economics, mergers and acquisitions, real estate, securities & financial instruments, telecommunications, transfer pricing, and valuation.
Analysis Group has offices in Boston, Chicago, Dallas, Denver, Los Angeles, Menlo Park, Montreal, New York, San Francisco, and Washington, DC.
ECONOMIC IMPACT STUDIES
Analysis Group has extensive experience with economic impact studies. In conducting these studies, we draw upon our expertise with impact analyses, economics, finance, planning, market analyses, statistics, and survey analyses. Our approach is defined by precision and academic rigor, and enhanced by our knowledge of industry dynamics and economic forces. We use economic modeling, state-of-the-art software, and surveys to develop custom models of an economy and how it reacts to changes in economic activity.
Our economic impact studies capture not only the initial effect of a change in economic activity, but also secondary effects that result from the initial change (i.e., “multiplier effects”). Our work has involved analyzing existing and proposed businesses, industries, and events. Our professionals have conducted economic impact studies involving a wide range of industries and supporting multiple applications, including:

The Potential Economic and Fiscal Benefits of New Gaming Agreements
Report Submitted to the Coalition to Protect California’s Budget & Economy
37
Ballot initiatives; Casinos/gaming; Hotels and resorts; Medical research; Publicly funded projects; Real estate developments; Retail establishments; Natural resource generation; Sporting and entertainment events; and Entire industries.
Our clients have used our analyses in internal business decision-making, public policy settings, and regulatory proceedings, confident they can demonstrate that they have fully considered the scope and impact of potential projects or events.
INDIAN GAMING
Analysis Group has a particular expertise with economic issues involving Indian gaming. Our consultants have conducted a wide range of analyses involving this rapidly growing segment of the gaming industry, including economic impact studies, market analyses, feasibility studies, surveys, analyses of gaming compacts and revenue sharing, assessments of regulatory policies, and expert testimony in litigation matters.
Our Indian gaming work is founded upon our unmatched, cutting-edge, academic research and analysis of this rapidly evolving segment of the gaming industry. Our nationally recognized experts in this field have published numerous articles and studies on the industry and have also presented their work at various academic, professional, and industry conferences. One of our most notable pieces of work continues to be the Indian Gaming Industry Report, an annual study of the Indian gaming industry.
Analysis Group’s Indian gaming work is nationally recognized, well accepted, and relied upon by the gaming industry, the investment community, government/regulatory agencies, and the public. Our work is frequently cited by the press and trade associations. In addition, our consultants have testified before governmental agencies, including the National Gaming Impact Study Commission, select subcommittees of the U.S. Senate, and the California State Senate.

The Potential Economic and Fiscal Benefits of New Gaming Agreements
Report Submitted to the Coalition to
Appendix C: Casino Gaming Spending by Californians
Appendix C.Casino Gaming Spending by Californians2001 2002 2003 2004 2005 2006
Las VegasGaming Revenue ($ Billions) $5.6 $5.5 $5.7 $6.3 $7.0 $7.6Percentage of Visitors from California1 30% 34% 34% 31% 33% 32%Gaming Revenue from California Visitors ($ Billions) $1.7 $1.9 $1.9 $1.9 $2.3 $2.4
LaughlinGaming Revenue ($ Billions) $0.5 $0.6 $0.6 $0.6 $0.6 $0.6Percentage of Visitors from California1 42% 41% 40% 41% 36% 33%Gaming Revenue from California Visitors ($ Billions) $0.2 $0.2 $0.2 $0.2 $0.2 $0.2
MesquiteGaming Revenue ($ Billions) $0.1 $0.1 $0.1 $0.1 $0.1 $0.2Percentage of Visitors from California1 10% 9% 10% 10% 9% 8%Gaming Revenue from California Visitors ($ Billions) $0.0 $0.0 $0.0 $0.0 $0.0 $0.0
Douglas CountyGaming Revenue ($ Billions) $0.3 $0.3 $0.3 $0.3 $0.3 $0.3Percentage of Visitors from California2 54% 54% 54% 54% 54% 54%Gaming Revenue from California Visitors ($ Billions) $0.2 $0.2 $0.2 $0.2 $0.2 $0.2
Washoe County (Reno/Sparks/North Lake Tahoe)Gaming Revenue ($ Billions) $1.1 $1.0 $1.0 $1.0 $1.0 $0.8Percentage of Visitors from California3 59% 59% 48% 47% 51% 49%Gaming Revenue from California Visitors ($ Billions) $0.6 $0.6 $0.5 $0.5 $0.5 $0.4
Nevada Gaming Revenue from California Visitors ($ Billions) $2.7 $2.9 $2.8 $2.9 $3.3 $3.2Gaming Revenue at California Indian Gaming Facilities ($ Billions) $2.9 $3.7 $4.8 $5.9 $7.0 $7.7Other Casino Gaming Revenue from California Visitors ($ Billions)4 $0.3 $0.3 $0.4 $0.5 $0.5 $0.6Total Casino Gaming Spending by Californians $6.0 $7.0 $8.0 $9.2 $10.8 $11.5
Nevada as a Percent of Total 46% 42% 35% 31% 30% 28%California Indian Gaming as a Percent of Total 49% 53% 60% 64% 65% 67%Other Casino Gaming as a Percent of Total 5% 5% 5% 5% 5% 5%Notes:
1.
2.
3.
4.Sources:
Nevada Gaming Control Board, Gaming Revenue Report, Calendar Years 2002, 2003, 2005, and 2006; GLS Research, Las Vegas Visitor Profile, Fiscal Year 2002 and Calendar Year 2006; GLS Research, Laughlin Visitor Profile , Fiscal Year 2002 and Calendar Year 2006; GLS Research, Mesquite Visitor Profile, Fiscal Year 2002 and Calendar Year 2006; Reno-Sparks Convention & Visitors Authority, Marketing Statistics Report, 2003-2006; Lake Tahoe Visitors Authority, South Shore Intercept Survey , Winter 2004 and Summer 2004; Meister, Alan, Indian Gaming Industry Report , 2007-2008 Edition; confidental industry survey, 2006-2007 (results used with permission).
Percentage of Visitors from California for 2001-2002 represents fiscal year figures, while 2003-2006 represents calendar year figures.
Percentage of Visitors from California for 2001 is set equal to 2002 figures due to lack of data. Percentage of Visitors from California for 2002 may be slightly underestimated as the survey for that year used a different methodology.
Percentage of Visitors from California is assumed to be 53.5% based on the average of Winter 2004 and Summer 2004 survey data. These were the only publicly-available data for Douglas County.
Spending by California visitors in states other than California and Nevada.
Protect California’s Budget & Economy 38