The Potential Air Quality Impacts from Biomass … QUALITY EXPERT GROUP The Potential Air Quality...
80
AIR QUALITY EXPERT GROUP The Potential Air Quality Impacts from Biomass Combustion Prepared for: Department for Environment, Food and Rural Affairs; Scottish Government; Welsh Government; and Department of the Environment in Northern Ireland
Transcript of The Potential Air Quality Impacts from Biomass … QUALITY EXPERT GROUP The Potential Air Quality...

AIR QUALITY EXPERT GROUP
The Potential Air Quality Impacts from Biomass Combustion
Prepared for:
Department for Environment, Food and Rural Affairs;
Scottish Government; Welsh Government; and
Department of the Environment in Northern Ireland


AIR QUALITY EXPERT GROUP
The Potential Air Quality Impacts from Biomass Combustion
Prepared for:
Department for Environment, Food and Rural Affairs;
Scottish Government; Welsh Government; and
Department of the Environment in Northern Ireland

This is a report from the Air Quality Expert Group to the Department for Environment,
Food and Rural Affairs; Scottish Government; Welsh Government; and Department of
the Environment in Northern Ireland, on the potential air quality impacts from biomass
combustion. The information contained within this report represents a review of the
understanding and evidence available at the time of writing.
© Crown copyright 2017
Front cover image credit: left – Jamie Hamel-Smith, middle – Katie Chase, right – Tom
Rickhuss on Stocksnap.io. Used under Creative Commons.
United Kingdom air quality information received from the automatic monitoring sites and
forecasts may be accessed via the following media:
Freephone Air Pollution Information 0800 556677
Service
Internet http://uk-air.defra.gov.uk
PB14465

i
Terms of reference
The Air Quality Expert Group (AQEG) is an expert committee of the Department for
Environment, Food and Rural Affairs (Defra) and considers current knowledge on air pollution
and provides advice on such things as the levels, sources and characteristics of air pollutants in
the UK. AQEG reports to Defra’s Chief Scientific Adviser, Defra Ministers, Scottish Ministers,
the Welsh Government and the Department of the Environment in Northern Ireland (the
Government and devolved administrations). Members of the Group are drawn from those with a
proven track record in the fields of air pollution research and practice.
AQEG’s functions are to:
Provide advice to, and work collaboratively with, officials and key office holders in Defra
and the devolved administrations, other delivery partners and public bodies, and EU and
international technical expert groups;
Report to Defra’s Chief Scientific Adviser (CSA): Chairs of expert committees will meet
annually with the CSA, and will provide an annual summary of the work of the
Committee to the Science Advisory Council (SAC) for Defra’s Annual Report. In
exception, matters can be escalated to Ministers;
Support the CSA as appropriate during emergencies;
Contribute to developing the air quality evidence base by analysing, interpreting and
synthesising evidence;
Provide judgements on the quality and relevance of the evidence base;
Suggest priority areas for future work, and advise on Defra’s implementation of the air
quality evidence plan (or equivalent);
Give advice on current and future levels, trends, sources and characteristics of air
pollutants in the UK;
Provide independent advice and operate in line with the Government’s Principles for
Scientific Advice and the Code of Practice for Scientific Advisory Committees
(CoPSAC).
Expert Committee Members are independent appointments made through open competition, in
line with the Office of the Commissioner for Public Appointments (OCPA) guidelines on best
practice for making public appointments. Members are expected to act in accord with the
principles of public life.
Further information on AQEG can be found on the Group’s website at:
https://www.gov.uk/government/policy-advisory-groups/air-quality-expert-group

ii
Membership
Chair
Professor Paul Monks
University of Leicester
Members
Dr David Carruthers
Cambridge Environmental Research Consultants (CERC)
Dr David Carslaw
King's College London (now at Ricardo Energy and Environment and University of York)
Dr Chris Dore
Aether Ltd
Professor Roy Harrison OBE
University of Birmingham
Dr Mat Heal
University of Edinburgh
Dr Mike Jenkin
Atmospheric Chemistry Services
Professor Alastair Lewis
National Centre for Atmospheric Science, University of York
John Stedman
Ricardo Energy and Environment
Professor Alison Tomlin
University of Leeds
Professor Martin Williams
King's College London

iii
Ex officio members
Central Management and Control Unit of the automatic urban and rural networks: Dr Richard
Maggs, Bureau Veritas
National Atmospheric Emissions Inventory: Dr Tim Murrells, Ricardo Energy and Environment
Non-automatic hydrocarbon monitoring networks and metals monitoring network: Dr Paul
Quincey, National Physical Laboratory
Quality Assurance and Quality Control of the automatic urban network and the non-automatic
monitoring networks: Dr Paul Willis, Ricardo Energy and Environment
Professor David Fowler CBE, Centre for Ecology and Hydrology
Assessors and observers
Simon Baldwin
Welsh Government
Barry McCauley
Department of the Environment in Northern Ireland
Andrew Taylor
Scottish Government
Alison Gowers
Public Health England
Secretariat
Dr Sarah Moller
Department for Environment, Food and Rural Affairs and National Centre for Atmospheric
Science
Dr Charlotte Jones
Department for Environment, Food and Rural Affairs
Previously:
Peter Coleman
Department for Environment, Food and Rural Affairs

iv

v
Acknowledgements
The Air Quality Expert Group would like to acknowledge the following individuals and
organisations for their help in the preparation of this report:
Rob Stewart - Ricardo Energy and Environment
vi
Contents
Executive Summary 1
1 Overarching issues, policy and research questions 3
2 Definition of biomass emission sources 4
3 Characteristics and health relevance of emissions from wood burning. 5
4 Policy context and emissions limits 7
4.1 Power generation and large scale heat 7
4.2 Community and domestic scale boilers 8
4.3 Domestic stoves and fireplaces 10
4.3.1 Implications of the Clean Air Act 10
4.3.2 The Eco-design Directive 10
5 Summary of emissions limits and comparisons across different sizes of
combustion plant 12
6 Estimating Emissions from Biomass 23
6.1 Introduction 23
6.2 Biomass fuels 24
6.3 Large and Medium Point Sources 25
6.4 Domestic and Small-scale Combustion 25
6.4.1 Estimating Fuel Consumption 25
6.5 Combustion Technologies 27
6.6 Emission measurement issues 27
6.6.1 Emission factors for inventories 28
6.6.2 Sources of information used in the NAEI and their uncertainties 29
6.6.3 European studies of potential inventory uncertainties 30
7 Trends in Emissions from Biomass Combustion According to the NAEI 31
7.1 Trends in Historic Emissions 31
7.2 The Potential Influence of Fuel Switching 35
7.3 Future Emission Projections 38
8 Measurements of particulate matter from wood and wood product burning 40
8.1 Measurement techniques 40
8.2 Ambient measurements 42
8.3 Future outlook 49
9 The Potential Impact of Biomass Boilers and Combined Heat and Power (CHP) 49
9.1 Mitigation Strategies 50
9.2 Air Quality Impact Studies of Proposed Biomass Plant 52

vii
9.3 Future Projections 56
10 Summary and Recommendations 59
11 References 63

1
Executive Summary
The Issue
Biomass features within several pathways to a low carbon economy and is an
increasing source of secondary domestic heat.
Measurements and inventories suggest that particulate matter (PM) from biomass
burning is on the increase.
A range of incentives that encourage the use of biomass burning for power and heat
generation could have adverse air quality impacts in particular around PM and
nitrogen dioxide (NO2).
Assessment of evidence base
National energy statistics as used within the National Atmospheric Emission
Inventory (NAEI) show an increasing trend in the combustion of wood. The 2012
version of the NAEI estimates that the contribution of biomass burning to UK PM10
(particulate matter with a diameter less than 10 µm) emissions rose from less than
5% in 1990 to over 17% in 2012, with the largest increases occurring in the domestic
sector.
The NAEI suggests a far lower contribution of biomass burning to UK total NOx
emissions (~1%), although the increasing use of solid biomass boilers for primary
heat or combined heat and power applications may influence NOx concentrations at a
local scale. The installed capacity of solid biomass boilers registered in England
under the non-domestic Renewable Heat Incentive (RHI) increased by a factor of 4
between April 2014 and Feb 2016 to a total of 1651 MW. The non-domestic scheme
is currently dominating the output from biomass combustion under the RHI when
compared to the domestic scheme. Over half the output comes from small
commercial boilers of less than 200 kWth capacity, but when summed across the
whole of the UK, the total capacity of 2347 MW registered under the non-domestic
scheme, exceeds the typical capacity of a large power station of around 2000 MW.
Atmospheric measurement datasets for wood smoke are currently of insufficient
duration to allow the establishment of long term trends in airborne concentrations.
However, available ambient measurements from recent research campaigns show
considerable (6-25%) contributions of wood burning to PM in urban areas during
winter. The majority of the PM (>90%) is likely to be within the PM2.5 (particulate
matter with a diameter less than 2.5 µm ) fraction.
Much of the potential impact on air quality comes from small-scale domestic burning
which is the most uncertain source sector in terms of emissions estimates.
The implementation of the Eco-design Directive will provide lower PM emission limits
than the UK Clean Air Act by approximately a factor of 2 for domestic stoves and a
factor of 6 for domestic scale boilers. These new limits still suggest that domestic
stoves will have higher PM emissions factors per unit energy compared to larger
scale combustion devices burning biomass. In addition, the limits will apply only to

2
new stoves and hence their impact on UK total emissions from the domestic sector
will depend on the turnover of appliance stock and what the stoves are replacing.
Without incentives the replacement of existing stoves is likely to be slow since
domestic stoves have a long operational life time. In addition, research studies have
shown that real world emissions can be higher than legislated limits due to a number
of factors including fuel quality and operator behaviour.
Domestic emissions of wood smoke have an especially high impact on ground-level
concentrations relative to those from elevated sources, and if current trends in
domestic emissions continue upwards, it is inevitable that there will be an increase in
airborne concentrations of wood smoke which will consequently lead to increased
population exposures.
Wood smoke is already a significant contributor to population weighted PM2.5
exposures and is likely to make an increasing contribution into the future for the
above reasons, and as emissions from some other sources decline.
The regulatory framework for the control of biomass burning emissions is complex.
This presents a significant challenge in pulling together, in a coherent and self-
consistent way, the current regulatory controls and emission outcomes over the
range of biomass burning emitters.
Overall recommendations
Assessing the impacts of biomass burning on UK air quality requires action to:
o improve long term ambient measurements of biomass combustion tracers;
o reduce uncertainties in inventory estimates particularly around small-scale
burning, including the assessment of real world emissions.
Furthermore, there is a requirement for action on:
o assessing the developing impact of biomass combustion on air quality and
public health;
o assessing the effectiveness of current and future emission controls and
legislation;
o further research into the development of suitable cost effective PM control
methods for the domestic sector, particularly those which could be retro-fitted;
o assessing whether providing public information and guidance on solid fuel
stove operation could help to reduce real world emissions from small-scale
devices.
3
1 Overarching issues, policy and research questions
Based on the 2013 annual submission of the GHG inventory of the European Union (EEA,
2013a), a recent European Environment Agency (EEA) report suggested that burning
biomass for home heating increased by 56% within the EU between 1990 and 2011, raising
serious concerns for impacts on human health due to the resulting emissions of pollutants
such as particulates and nitrogen oxides (EEA, 2013b). This increase may be for several
reasons. The use of biomass can potentially lower fuel costs where the wood/biomass is
recovered locally, and may be increasing in response to fuel poverty issues. Domestic wood
burning for the provision of secondary heating within urban areas is also increasingly
becoming part of a lifestyle choice (EPUK, 2013).
The lack of particulate filters or other controls on domestic burners, coupled with increasing
usage, means that households are now estimated to be the main source of fine particulate
matter emissions in the EU (EEA, 2013b, 2014). In addition, in response to the Climate
Change Act of 2008, the UK is committed to reducing greenhouse gas (GHG) emissions by
at least 80% in 2050 from 1990 levels. Achieving such targets will require large shifts to
lower carbon energy supplies across the UK, with sustainable bioenergy featuring within
several of the proposed pathways to a low carbon economy set out by the Department for
Energy and Climate Change (DECC, 2010). A range of government incentives to encourage
the use of renewable low carbon fuels for power and heat generation are therefore also
leading to increases in biomass combustion at the larger scale. Increases in wood and waste
material combustion across a variety of scales from domestic to large scale power
generation are therefore likely to have an impact on air quality which may grow with time and
currently is uncertain. A number of questions will be addressed within this report:
Is there is a well-developed position with respect to the current range of, and likely
changes in, source distributions from biomass burning?
Are biomass sources well represented within current UK inventories and is there any
evidence for a future inventory problem?
Will the impact of future levels of biomass burning, with proposed policy measures in
place, lead to a significant change in ambient concentrations of major pollutants and
further in population weighted mean exposure? The major pollutants of concern to be
addressed within the report will include nitrogen oxides (NOx = NO + NO2) and
particulate mass concentrations PM10 and PM2.5.
How strong is measurement evidence in relationship to pollution from biomass
burning?
Does measurement evidence currently suggest an increasing trend in the
contribution of biomass burning to PM?
Will the current set up of the monitoring networks allow us to assess future trends in
the impact of biomass burning on air quality?

4
Are the risks well assessed with respect to the introduction of biomass-based heat
provision and combined heat and power (CHP) systems into the urban environment
within UK?
2 Definition of biomass emission sources
Emissions from biomass combustion from human activities can cover a wide variety of
sources. Assessing the air quality impacts will be mainly driven by the definitions of biomass
sources used in the National Atmospheric Emissions Inventory (NAEI)1. The definitions are
mainly dictated by the definitions of sectors used in the reporting of national emission
inventories to the United Nations Economic Commission for Europe (UNECE) under the
Convention on Long-Range Transboundary Air Pollution (CLRTAP)2.
Emissions sources which are considered to be included within the definition of biomass
burning are listed in Table 1. The NAEI provides the emissions inventory for all biomass
sources necessary to fulfil the UK’s obligation for reporting to the CLRTAP, and is also able
to estimate emissions for some sources for information purposes, but which are not included
in the total inventory. Table 1 gives an indication as to whether emission estimates for
different biomass sources are made by the NAEI and whether the emissions are included in
the national inventories compiled for national and international reporting.
Table 1: Sources of emissions from biomass combustion
Source Emissions
estimates
available
Included/Excluded in
national inventories
Electricity generation
Co-firing of wood, straw and poultry litter in
power stations
Yes
Included
Commercial and Domestic Combustion
Wood stoves, boilers, cookers and open
fires
Yes
Included
Agriculture
Field burning of agricultural residues1
Muir burn2
Yes1
No
Included
1 http://naei.defra.gov.uk/ 2 http://www.ceip.at/ms/ceip_home1/ceip_home/ceip_topnavi/home_emep/

5
Waste
Burning of contaminated waste wood
Municipal green waste combustion
Bonfires
Yes
Yes
Yes
Included
Included
Included
Natural Emissions
Forest & heathland fires etc.
(accidental/arson)
Yes
Excluded
1 The practise of agricultural field burning was banned during 1993. Emission estimates are included in the NAEI for historic
years. 2 This is a form of heathland management associated with the raising/farming of grouse.
In this report, we focus on those sources which are included in the NAEI. A further note on
terminology: biomass is referred to as a 'renewable' fuel or 'renewable' energy source; that
is, a source of energy that can, in principle, be renewed, for example by replanting or
regrowth of the tree or other vegetation from which the biomass was obtained. It is important
to note that the terminology 'renewable' fuel is distinct from 'sustainable' fuel or 'carbon-
neutral' fuel; evaluation of these latter terms must also take into account the extent to which
the renewable fuel source is renewed (e.g. by replanting) and the input of non-renewable
energy sources in the life cycle of production and usage of the renewable energy source.
This report will not focus on the wider sustainability issues related to biomass use, but rather
on air quality impacts.
3 Characteristics and health relevance of emissions from wood
burning.
Emissions from the combustion of wood both within power generation processes and
residential heating appliances will comprise both gases and particles. These include
particulate matter (PM) and gases such as carbon monoxide (CO), carbon dioxide (CO2),
oxides of nitrogen (NOx), volatile organic compounds (VOCs), sulphur oxides (SOx) and a
range of trace species including polyaromatic hydrocarbons. The sulphur content of wood is
low and SOx is not likely to pose a particular problem from wood combustion. A
comprehensive review of combustion processes and the main formation routes for
combustion products is given in Williams et al. (2012). Particulate matter emissions are
perhaps of the greatest concern since, particularly for domestic appliances, wood may have
replaced gas as a heating fuel leading to a net dis-benefit to air quality in terms of PM. Of the
PM produced during wood combustion in an enclosed residential wood burner, 96% was
suggested to be in the PM10 size fraction and 93% in PM2.5 by Houck and Tiegs (1998). This
puts the majority of emissions into the respirable fraction of PM and is also of significance in
terms of meeting air quality standards.

6
The size distribution and chemical characteristics of the emissions are likely to vary
depending on the type of appliance, burn rates, fuel moisture content, and the type of wood
used. Fine et al. (2002) for example, suggested that as much as 74% of the PM2.5
discharged from domestic fireplaces burning wood was organic carbon and 1-18% was
elemental carbon. Depending on the wood species burned, salts and minerals present within
PM could include sodium, magnesium, potassium, calcium, zinc, ammonium, sulphate,
chloride, carbonate and nitrate (Houck and Crouch, 2002). The organic compounds present
in wood smoke will also vary depending on combustion conditions and wood characteristics
such as lignin and resin content. McDonald et al. (2000) in their study of emissions from a
range of wood burning stoves and fireplaces, suggested that most of the aliphatic and olefin
hydrocarbon VOC content is made up of the C1-C6 compounds (where C1 represents
organic compounds with one carbon and C6 compounds with six carbons). Dienes,
especially 1,3-butadiene and 1,3-cyclopentadiene, were also found to be enriched in wood
combustion emissions and were suggested to derive from the decomposition of terpenoids,
although these compounds have been suggested to be unstable in motor vehicle and
hydrocarbon combustion exhaust samples (Lipari, 1990; Pelz et al., 1990; Kaiser et al.,
1992; Hoekman, 1993). Similar behaviour in samples from biomass emissions may impact
on their quantification as well as affecting the measured VOC speciation more broadly.
Significant concentrations of dicarboxylic and diterpenoid acids were found in wood smoke in
a study by Rogge et al. (1998), particularly from the burning of pine woods. Furans, formed
from the decomposition of wood cellulose upon heating, were found in significant quantities
from softwood and hardwood emissions in the study of McDonald et al. (2000).
Of particular concern from a human health perspective is emissions of polyaromatic
hydrocarbons (PAHs) which may arise via pyrosynthesis during wood burning. McDonald et
al. (2000) derived emissions estimates for total PAH emission rates from fireplace/softwood
and fireplace/hardwood combustion as 79.8 and 167.4 mg/kg fuel, respectively. The average
emission rate for total PAH compounds from wood stoves was 74.7 mg/kg. Predominant
species were found to be acenapthylene, naphthalene, anthracene, phenanthrene,
benzo(a)pyrene and benzo(e)pyrene. Rogge et al. (1998) found that the smoke from the
burning of synthetic logs had the highest total PAH emission rate and the most diverse range
of PAHs present when compared to burning pine and oak.
Dioxins (polychlorinated dibenzo-p-dioxins (PCDDs) and polychlorinated dibenzofurans
(PCDFs)) are also present in emissions from wood burning with a comprehensive review
provided in Lavric et al. (2004). They could be a particular problem from the combustion of
treated, varnished or PVC-coated wood. Nestrick and Lamparski (1983) analysed soot
scrapings from the chimneys of wood-burning stoves operating in the eastern, central, and
western regions of the United States. The average total PCDD/F levels in the chimney
deposits were 8.3 ng/kg in the eastern region, 42.1 ng/kg in the central region, and 10 ng/kg
in the west. There is obviously significant variability in the levels of dioxins found, which they
attributed to the wide variability in the design of the different units, affecting sampling points
and/or possible contamination of the fuel wood. The burning of waste wood found in urban
areas was highlighted in the review of Lavric et al. (2004) as leading to significantly higher
levels of dioxins in the fly ash from a range of combustors.
Other compounds include a variety of aldehydes, phenols, alcohols, ketones, carboxylic
acids, methane, ethane, ethanol, formaldehyde, acetaldehyde, acrolein, phenol, cresol,
formic acid and acetic acid (McDonald, 2000; Houck and Crouch, 2002).

7
Mixing between fuel and oxygen within the combustion chamber has a strong role to play in
the level of emissions of carbonaceous pollutants, since the formation of soot and PAH may
be enhanced in fuel rich zones where incomplete combustion occurs. The conclusion of an
extensive review of Williams et al. (2012) was that increased biomass use in small units
such as for space heating or cooking could lead to ineffective mixing and potential problems
arising from emissions of particulates, particularly carbonaceous smoke. They suggest that
biomass burned in larger combustion units leads to better mixing thus reducing
carbonaceous emissions which can be additionally removed from the flue gases using a
range of different pollution control options. They do however conclude that there remains a
potential health problem from submicron inorganic particles. The conclusion of their report
was that large combustion units may offer the best route to clean combustion of biomass
due to the advantages of large scale efficient flue gas treatment plant.
4 Policy context and emissions limits
4.1 Power generation and large scale heat
A number of policies and initiatives originating both from the EU and UK government may
influence the use of biomass as a power generation source within the UK in the near future.
As part of a range of European 2020 targets seeking to address climate change, the UK is
legally committed to meeting 15% of its energy demand from renewable sources by 2020
and to reducing its Greenhouse gas emissions by 20% compared to 1990 levels. For large
scale power generation this is currently incentivised through the Renewables Obligation
(RO) which is a trading scheme managed by Ofgem via Renewables Obligation Certificates
(ROCs). Electricity suppliers who do not present enough ROCs to meet their obligation must
pay a penalty known as the ‘buy-out price’ and hence there are financial incentives to supply
electricity from renewable sources, which may include biomass derived fuels. It should be
noted that this scheme is set to close to new generators in 2017 and there is currently a cap
of 400 MW on the total new build dedicated biomass capacity that can expect grandfathered
(i.e. free certificate allocation) support under the RO. The UK Renewable Energy Roadmap
(DECC & DfT, 2013) sets out plans for accelerating the use of renewables including biomass
electricity and heat. In addition, power generation facilities which use biomass exclusively as
a fuel are excluded from the EU Emissions Trading System (EU ETS) and therefore do not
require carbon permits, thus further incentivising the use of biomass as a fuel source.
The Fourth Carbon Budget Review (Committee on Climate Change, 2013) gives a brief
evaluation of the potential impacts of replacing fossil fuels as a source of power generation
and heat as part of the UK’s carbon reduction plans, and predicts an overall benefit of low
carbon technologies to air quality at a national level, but does highlight the fact that biomass
and biofuel burning gives rise to air pollution. The review points out that the net cost of
increasing bioenergy use will depend on the technology it replaces. For example, the use of
biomass for heat within buildings and in industry could cause a net dis-benefit to air quality if
it were to replace gas a fuel source, whereas the displacement of coal by biomass in power
stations such as Drax may have no overall dis-benefit. The review suggests that ways of
limiting this potential cost could include emissions standards for boilers, and targeting rural
off-grid coal and oil-burning buildings rather than on-grid, densely-populated locations. The

8
review however, focusses on larger scale heat and power generation rather than the
domestic sector.
The more detailed report available from ApSimon and Oxley (2013) provides an assessment
of the air quality impacts of various carbon reduction plans provided by the Committee on
Climate Change using the UK integrated assessment model, UKIAM. Particular concerns
are expressed over the use of biomass within the heat sector and in particular related to
particulate matter. Scenario projections show contrasting adverse impacts from the use of
bio-energy, set against potential benefits from savings in fossil fuel use. The report suggests
that large uncertainties exist in the prediction of both, and hence in the overall net effect,
depending on assumptions made.
The Energy White paper (DECC, 2011a) sets emissions performance standards (EPSs) for
power generation with a suggested initial level equivalent to 450 g CO2/kWh (at base-load)
for all new fossil fuel plant, except Carbon Capture and Storage (CCS) demonstration plants.
This could provide further incentive for increased use of biomass fuel sources since biomass
will be zero rated under the EPS system.
For existing plants using biomass, the control of emissions depends on the size of the
installation. The regulatory regimes that apply to solid non-waste biomass appliances are:
a) For large scale installations (over 50 MWth capacity): Regulation through the
Industrial Emissions Directive (IED, 2010/75/EU) administered by the Environment
Agency (covering England), Natural Resources Wales, the Scottish Environment
Protection Agency and the Northern Ireland Department of the Environment.
b) For large installations (of 20 to 50 MWth capacity): Individual units are regulated by
the Scottish Environment Protection Agency or local authorities in England and
Wales.
The EU is also proposing a new “Medium Combustion Plant Directive” or MCPD which is
likely to come into force by the turn of the decade and will propose emissions limits for all
combustion plants with a rated thermal input (RTI) of between 1 and 50 MW. The MCPD will
not cover larger plant that is already covered by the IED or smaller devices which will be
addressed via the “Eco-design” Directive to be discussed below. It should be stressed
however, that the MCPD is still under negotiation.
4.2 Community and domestic scale boilers
At the community/domestic scale the Renewable Heat Incentive (RHI, DECC, 2013a), the
Renewable Heat Premium Payment (RHPP) and the Green Deal system are designed to
encourage the uptake of renewable heat installations including biomass boilers as part of
climate change mitigation strategies. Whilst initially aimed at the commercial sectors the RHI
was extended to domestic systems in April 2014. In addition, the “Merton Rule”, so called
because it started in the London borough of Merton, is being more widely adopted within
national planning guidance and requires 10% onsite renewable energy in large new
developments (Merton Council, 2009).
The domestic RHI is a financial support scheme for renewable heat, paid at a set rate per
unit of renewable heat produced (kilowatt hour or kWh), for a period of seven years to the
9
owner of the heating system. Biomass systems are supported attracting a tariff payment
which was 12.2 p/kWh of renewable heat in Nov 2014 but for new applications in 2016 will
be 5.2 p/kWh. In order to attract the RHI, tariff installations must be certified under the
Microgeneration Certification Scheme (MCS) and therefore biomass systems will be subject
to emissions limits. Fuel also needs to be sourced from an approved supplier which should
in theory provide some consistency in fuel quality. The systems currently included are
a) Biomass-only boilers (covering all solid biomass, including logs and chips)
b) Biomass pellet stoves with back boilers
Condensing biomass boilers may be included at a later date depending on the results of
tests being currently undertaken on behalf of Defra. Emissions limits required for
accreditation are 30 g/GJ net thermal input for PM and 150 g/GJ for NOx (DECC, 2013b).
These have been based on an impact and cost benefit study by DECC which considers the
external costs of using biomass within the RHI. The study points out that where biomass
displaces electricity or gas fired heat, the air quality impacts will be negative and that if the
RHI tariff payments are to compensate for the costs of emissions abatement technologies,
that the use of these should be enforced through emissions limits (DECC, 2013b). These
emissions limits apply to new installations however, and it may be the case that current
installations below 20 MWth do not meet these proposed limits. DECC has set the level of
subsidy such that it is only efficient for those currently using solid and oil fuelled boilers to
convert. In practice, there is some concern that users will choose to use the RHI in other
circumstances. The burning of waste related fuels under the RHI still is required to meet the
Environmental Permitting requirements. ApSimon and Oxley (2013) suggest that even when
using conservative assumptions, based on the strict compliance of boilers with emission
factors defined for the RHI, annual emissions of PM2.5 from biomass heating in 2030 are
estimated at ~7 kt. This is excluding domestic stoves and can be compared to UK total PM2.5
emissions of 77 kt for 2012 as estimated within the NAEI (see section 7.1).
In February 2016 the number of solid biomass boilers registered with Ofgem in England
under the non-domestic RHI stood at 9,110, representing a total installed capacity of 1,651
MW and a 4 fold increase since April 2014. For the whole of the UK (i.e. including Scotland
and Wales) the total number of accredited new installations in February 2016 numbered
12,927 (Ofgem, 2016a) and 8,061 (Ofgem, 2016b) for the non-domestic and the domestic
RHI respectively. In terms of payments to date however, the non-domestic scheme
dominates, making almost 90% of payments by February 2016. The non-domestic sector is
therefore currently dominating output from biomass burning for schemes registered under
the RHI and just over half of this output is from small commercial boilers of less than 200
kWth capacity. Data from the Home Energy Efficiency (HEED) database from the Energy
Saving Trust, suggests in excess of 18,000 homes (reported in Feb, 2014) using biomass as
a main heating fuel, which suggests that many systems are not registered under the RHI. It
should be pointed out that the data from HEED covers only 60% of UK domestic properties.
The number of new installations from both these schemes is growing each quarter, and
unfortunately, data on the fuel or heat source that the biomass system is replacing is not
captured. Therefore it is difficult to assess whether the installations will lead to net positive or
negative impacts on emissions of relevance to air quality.

10
DECC are also encouraging householders installing biomass-only boilers (but not pellet
stoves with back boilers) through an optional additional payment of £200 per year to
purchase an approved Metering and Monitoring Service Package from the installer. The
householder and installer would then be able to view data from their system over the internet
related to, for example, efficiency. This could help to improve the performance of the system,
but could also be useful in terms of estimating real world emissions from these types of
installations.
4.3 Domestic stoves and fireplaces
Outside of the RHI, perceived uncertainties in future gas and oil prices may encourage
householders to use biomass combustion as a source of domestic heat through the use of,
for example, multi-fuel stoves. Whilst emissions from large scale power generation sources
and biomass boilers covered under the RHPP are (or are soon to be) controlled through
emissions limits, emissions from multi-fuel stoves are currently only controlled for approved
installations in smokeless zones under the Clean Air Act 1993. Fuller et. al. (2013, 2014)
suggests that for many, wood burning within urban areas is a lifestyle choice; either for
decoration or secondary heating. This suggestion is supported by the increased
contributions of wood burning smoke to PM10 measured by Fuller et al. (2014) during
weekends over a 6 week measurement campaign across London during the winter of 2010.
Domestic stoves are also marketed as green, low carbon technologies because they can
use renewable fuels. A summary of data in Fuller et al. (2013) from studies undertaken in the
cities of London, Paris and Berlin suggests that at times of peak activity, up to 3 μm-3 of
urban PM10 could be currently due to local domestic wood burning with suggestions of ever
increasing uptake of domestic solid fuel burners. Fuller et al. (2013) conclude that there is a
clear need to fully consider domestic wood burning within the remit of air quality
management for major urban areas in order to ensure that increases in wood burning activity
“do not off-set substantial investment in schemes to abate traffic pollution”. It is therefore of
interest to compare policy, and in particular current and planned emissions limits for small-
scale biomass installations, to those for vehicular sources (see section 5).
4.3.1 Implications of the Clean Air Act
Currently, under the Clean Air Act 1993, Defra provides a list of exempted appliances for use
in smokeless zones within the devolved regions of the UK. Applications for exemption are
handled by Ricardo-AEA. The permitted smoke emissions depend on the thermal output of
the stove but vary from 6.7 g/h for a 5 kW appliance to 458 g/h for a 225kW appliance
(Ricardo-AEA, 2012). For appliances between 44 kW and 240 kW, a concentration limit of
150 mg/m3 (dry gas at 0°C, 101.3 kPa and at stack O2) is also included since emissions in
excess of this may be visible and give rise to complaints. Prescribed test protocols are used
but there have been recent studies performed in New Zealand that suggest that real world
emissions can vary substantially from those achieved during testing; a situation that is
analogous to the problem of real world emissions from transport sources (see discussion in
section 5).
4.3.2 The Eco-design Directive
The EU Eco-design Directive (2009/125/EC), will require the European Commission to set
eco-design requirements for high sales volume energy-related products with significant

11
environmental impacts, and that present significant potential for improvement in terms of
their environmental impact without entailing excessive costs. Subsequently developed
regulations will impose limits for a variety of local space heaters (LSH) and small boilers for
both energy efficiency and emissions of pollutants PM, CO, organic gaseous carbon (OGC)
and NOx. These are likely to come into force on the 1st Jan 2018. As an example, the
proposed emission limits for local space heaters (LSH) are shown in Table 2. For PM the
different forms of the limit values reflect different test procedures currently in use by member
states (MS) as part of national legislation. The values quoted are at rated outputs and
therefore do not reflect the influence of device efficiency. A discussion of the influence of
combustion device scale on emissions limits in terms of energy inputs is given in section 5.
Table 2: Proposed Emissions Limits for PM, NOx, OGC in the Eco-design Directive
(2009/125/EC1)
Appliance
type
Test
methodology
for PM
measurement
Fuel type Proposed
Limits (PM)
Proposed
Limits (OGC)
Proposed
limits (NOx)
Closed
fronted
LSH
Heated filter Any other
than
compressed
wood pellets
40 mg/m3
measured at
13% O2
80 mg/m3
measured at
13% O2
200 mg/m3
measured at
rated output
and 13% O2
Dilution tunnel Any other
than
compressed
wood pellets
5 g/kg (dry
matter)
Closed
fronted
LSH
Heated filter Compressed
wood pellets
20 mg/m3
measured at
13% O2
40 mg/m3
measured at
13% O2
Dilution tunnel Compressed
wood pellets
2.5 g/kg (dry
matter)
Open
fronted
LSH
Heated filter Any 40 mg/m3
measured at
13% O2
80 mg/m3
measured at
13% O2
Dilution tunnel Any 5 g/kg (dry
matter) 1Based on the working draft of the Eco-design Directive Draft number: WDCF14Oct2014,
accessed from:
http://www.eceee.org/ecodesign/products/Lot_20_local__room_heating__products/WDCF14
Oct2014 No longer available, final documents published at:
http://www.eceee.org/ecodesign/products/lot-20-local-room-heating-products/)

12
5 Summary of emissions limits and comparisons across
different sizes of combustion plant
Several different sources of emissions limits for biomass combustion apply at different
scales of technology. It is useful to try to compare these on an equivalent energy basis in
order to assess the impact of device scale on likely emissions scenarios. The different limit
values often use different units and hence certain assumptions have to be made in
converting the limits to comparative units. An attempt to make this comparison in terms of
g/GJ for PM emissions has been made in Table 3, and for NOx in Table 4 on an equivalent
energy input basis. An overall summary is presented in Figure 1.
ED for comparison
ED for comparison
0 50 100 150 200 250 300
>50MWth
New 1-5 MWth
New 5<>50 MWth
Domestic stove (5 kW output)
Domestic boiler (25 kW output)
<20MWth
Domestic LSH any fuel (heated filter)
Domestic LSH wood pellets (heated filter)
Domestic LSH any fuel (dilution tunnel)
Domestic LSH wood pellets (dilution tunnel)
Domestic LSH any fuel (ESP/Dilution tunnel)
Domestic LSH wood pellets (ESP/Dilution tunnel)
<500 kW output boiler
IED
MC
PD
Cle
an A
irA
ct 1
99
3R
HI
Eco
-des
ign
dire
ctiv
e (E
DD
) 20
14
Estimated limits on equivalent energy basis g/GJ net heat input
NOx
PM
Figure 1: Comparison of PM and NOx emissions limits for different scales of combustion
devices based on an equivalent energy basis (g/GJ) net heat input. The relevant test method
within the EDD for the UK is the ESP/Dilution tunnel method and for ease of comparison
these limits for domestic stoves and boilers are shown again directly above those based on
the UK Clean Air Act. IED = Industrial Emissions Directive, MCPD = Medium Combustion
Plant Directive, RHI = Renewable Heat Incentive, EDD = Eco-Design Directive.
For PM Table 3 and Figure 1 show that notwithstanding differences between test methods,
emission limits are generally higher for small appliances compared with larger plant. Whilst
efficiencies would also play a role in comparing emissions on an energy out basis, similar
conclusions about the effects of scale could be drawn.
A straight comparison of the PM limits for local space heaters within the proposed Eco-
design Directive (EDD) with those specified by the current exemption criteria for smoke
controlled zones within the UK Clean Air Act is not possible since they are based on different
units. However, emissions have been calculated for a 5 kW stove and 25 kW boiler based on

13
the exemption criteria (Ricardo-AEA, 2012), and on an “energy in” basis assuming appliance
efficiencies of 80 and 90% respectively (net basis). For domestic scale boilers the Eco-
design Directive will lead to quite a large reduction in emissions limits of approximately a
factor of 6 in comparison to the Clean Air Act, and in fact the EDD is slightly more stringent
for small boilers than the limits imposed in the RHI.
For stoves, neglecting issues around real world emissions, and taking the limit based on the
ESP/Dilution tunnel method as the EC interpretation of the UK methodology, Table 3
suggests that lower limits (equivalent to 139 g/GJ) will be imposed by the Eco-design
Directive than currently used for appliance exemption within the UK (equivalent to 296 g/GJ).
This factor of 2 is not as significant as the reduction for domestic boilers and again highlights
the issue of scale of combustion device. Many existing appliances are likely not to meet the
new criteria and hence the turnover of stock will be a key issue in whether overall emissions
factors will reduce following the implementation of the Directive which will apply to new
sales. Several studies of the impacts of stove exchange programmes have shown
improvements in indoor quality following the replacement of older technologies with newer
ones that meet more stringent emissions criteria (WHO, 2015). However, some caution was
suggested from this WHO report in terms of the likely success of such intervention strategies
due to overall costs and the long service life of appliances once they have been installed.
Early implementation of the emissions limits driven by the Eco-design Directive could
however, provide some benefits in terms of emissions from new stove sales.
Table 3: Comparison of PM emissions limits for different scales of combustion devices
Size of plant Source of emissions limits
Limit concentration
Units Reference O2 %
Estimated limits on equivalent energy basis g/GJ net heat input1,2,6
Comments
>50MWth Industrial Emissions Directive
20 mg/m3 6 7.1 IED Chapter 3 (Annex V) minimum requirement for LCP. Chapter 2 BAT AEA for new LCP is 5-20 mg/Nm3.
1-50MWth
Proposed Medium Combustion Plant Directive Draft version (Oct 2014) circulated to member states and industry groups (not finalised).
New 1-5 MWth
50 mg/m3 6 17.7
New >5 MWth 20 mg/m3 6 7.1
Domestic stove (5 kW output)
Clean Air Act 1993
6.7 g/hr - 296 Applies for appliances used in smoke control areas
Domestic boiler (25 kW output)
Clean Air Act 1993
13.3 g/hr - 133 Applies for appliances used in smoke control areas

14
<20MWth Renewable Heat Incentive
30 g/GJ (net
input)
n/a 30 Incentive scheme - not a regulatory emission limit.
domestic stove (typical size
range 3-12 kW)
Eco-design draft regulation (local space heaters) Agreed 14/10/14. New products from 1/1/2022. PM limits reflect different measurement techniques and test protocols in national standards and legislation.
Heated filter3 40 mg/m3 13 26.6 Heated filter method known to understate PM emissions from batch fed, manually controlled natural draught appliances. Limit 20 mg/m3 for pellet stoves.
Dilution tunnel 4
5 g/kg (dry matter)
n/a 289 2.5 g/kg for pellet stoves
ESP/Dilution tunnel 5
2.4 g/kg (dry matter)
n/a 139 1.2 g/kg for pellet stoves
<500 kW output boiler
Eco-design draft Regulation (boiler)
40 mg/m3 10 19.3 Agreed 13/10/14. New products from 1/1/2018.
1Conversion based on assumed stoichiometric dry flue gas volume of 253 m/GJ net heat input
adjusted for reference oxygen content (AEA, 2012) 2Conversion assumes fuel CV for dry wood of 17.3 GJ/tonne (dry basis) from Digest of UK energy
statistics (DECC, 2014) 3German regulatory method, average of 3 tests on undiluted flue gases at rated output -
underestimates PM emission compared to dilution and other techniques as does not collect
condensable fraction 4Norwegian regulatory method, based on USEPA method, weighted average of single test results at 3
-4 burn rates. 5EC interpretation of UK regulatory method, assessed based on average of five results at rated output
and five results at part load. 6Clean Air Act limit conversions assume efficiency of stove as 80% (net basis) and boiler efficiency
90% (net basis).

15
Table 4: Comparison of NOx emissions limits for different scales of combustion devices
Size of plant Source of emissions limits
NOx Limit concentration, mg/m3
Units Reference O2, %
Estimated NOx limits on equivalent energy basis g/GJ net heat input1,2
Comments
>50MWth Industrial Emissions Directive (>300 MWth)
150 mg/m3 6 53.1 IED Chapter 3 (Annex V) minimum requirement for LCP >300 MW thermal input. Chapter 2 BAT AEA for new LCP >300 MWth is 50-150 mg/Nm3.
1-50MWth Proposed Medium Combustion Plant Directive Draft version (Oct 2014) circulated to MS and industry groups (not finalised).
New 1-5 MWth
500 mg/m3 6 177.1
New >5 MWth
300 mg/m3 6 106.3
<20MWth Renewable Heat Incentive
150 g/GJ (net
input)
n/a 150 Incentive scheme - not a regulatory emission limit.
3-12 kW domestic stove
Eco Design draft Regulation (closed LSH - stove)
200 mg/m3 13 132.8 Agreed 14/10/14. New products from 1/1/2022.
<500 kW output boiler
Eco Design draft Regulation, automatic boiler
200 mg/m3 10 96.6 Agreed 13/10/14. New products from 1/1/2018.
1Conversion based on assumed stoichiometric dry flue gas volume of 253 m/GJ net heat input
adjusted for reference oxygen content available at: http://uk-
air.defra.gov.uk/assets/documents/reports/cat07/1205310837_Conversion_of_biomass_boiler_emissi
on_data_rep_Issue1.pdf 2Conversion assumes fuel CV for dry wood of 17.3 GJ/tonne (dry basis) from Digest of UK energy
statistics (DUKES, 2014):
https://www.gov.uk/government/uploads/system/uploads/attachment_data/file/338752/Annex_A.pdf

16
In a report prepared as part of the International Energy Agency’s project IEA Bioenergy (Bios
Bioenergiesysteme, 2011), the difficulties of controlling PM from domestic scale biomass
combustors are highlighted. The report compares efficiencies of particle collection devices
for residential biomass systems (<50 kW) including electrostatic precipitators (ESPs),
catalytic converters, ceramic filters and condensing heat exchangers. ESPs were found to
be the most promising technologies for boilers within this report, with collection efficiencies
of up to 85%. However, an important conclusion of the study is the lack of available PM
control systems for domestic stoves, particularly those with retro-fit options. Table 3
indicates that despite the proposed Eco-design Directive, domestic stoves will continue to
make a substantial contribution to particulate emissions across Europe and that research
into cost effective retro-fit PM control systems is greatly needed.
Table 4 shows the equivalent comparison across scales for NOx emissions limits. The
differences between small and large plant are much lower for NOx than for PM, indicating
that a move to decentralised provision of energy and heat through smaller combustion
devices is less likely to impact on UK-wide NOx emissions than for PM. However, localised
sources of NOx could still have implications for air quality in cases where emissions sources
shift substantially from large power generation sources (usually situated away from
populated areas and with tall chimneys) to smaller boilers and stoves (likely to be sited close
to demand). We will return to this issue in Section 9.
In order to compare possible impacts to air quality across different pollution sources it is also
of interest to compare emission limits for biomass combustion to those from typical traffic
sources. In Table 5, estimated PM emissions factors based on the UK relevant limits for
local space heaters within the Eco-design Directive (EDD) for domestic stoves (~3.1 g/h
assumed for a 5 kW stove), and those based on the current exemption criteria for UK
smokeless zones (UKSZ) (6.7 g/h) are compared with vehicle emission rates corresponding
to the different Euro standards for diesel road vehicles. The vehicle emission rates for diesel
cars are based on the PM emission limit values in g/km for the average speed of the NECD
test cycle of 33 km/h. For heavy duty diesel vehicles, the limits are expressed in g/kWh of
useful energy from the engine. Using typical fuel consumption rates of around 390 g fuel/km
for a >40 tonne HGV at an urban speed of 33 km/hr and a brake-specific fuel consumption
rate for a diesel engine of 250 g fuel/kWh, the PM emission limits correspond to the vehicle
emission rates for HGVs in g/h shown in Table 5.
Table 5: Comparison of PM estimated emission rates in g/h based on standards within the
Eco-design Directive and UK smokeless zone exemption criteria for a 5 kW stove compared
to those based on Euro standards for diesel vehicles
Diesel Passenger Cars Heavy Goods Vehicles
Euro 3 Euro 4 Euro 5/6 Euro
III Euro IV/V Euro
VI
(2000) (2005) (2009/2015) (2000) ('2005/2008) (2014)
Euro standards (g/km) 0.05 0.025 0.005
Euro standards (g/kWh) 0.1 0.02 0.01

17
Vehicle emission rate (VER) (g/h) based on Euro standard emission limit at 33 km/h speed
1.65 0.83 0.17
VER (g/h) for >40t HGV based on Euro standard limit value and Brake-specific diesel fuel consumption at 33 km/h speed
5.2 1.0 0.5
EDD PM emission limit (g/h) – wood log stove by dilution tunnel – 2.4g/kg dry matter1
3.1
3.1
UK Clean Air Act emission limit (g/h)2
6.7
6.7
EDD/VER 1.9 3.7 18.2 0.6 3.1 6.2
UKCAA2/VER 4.1 8.1 40.6 1.3 6.5 13.0
1EDD - Eco-design Directive. There are two dilution tunnel limits in the Eco-design Directive, with
2.4g/kg being the UK method but at a more stringent standard than the CAA Smoke Control Area
limit. 5 g/kg is the NS3058/9 Norwegian test method limit which corresponds to 6.5 g/h, 2UKCAA - UK
Smoke Control Area limits based on appliance exemption criteria in the Clean Air Act.
Table 5 compares emission limits for stoves and diesel vehicle that are expressed in
different ways, but it is important to recognise that neither the regulatory limits for stoves or
diesel vehicles reflect ‘real world’ operational emission rates; these are highly variable.
Under real world driving conditions, emission rates for vehicles may be higher or lower than
shown in Table 5 and real world emission rates for stoves will also vary with mode of
operation. It is also the case that emissions only occur from stoves and vehicles when ‘under
operation’ and stoves are not run all year round or over the same period that a vehicle is
used. Nevertheless, it is clear that proposed emission factors for domestic local space
heathers are not keeping pace with the standards introduced for diesel vehicles. Table 5
shows the ratio of g/hr emission limits for domestic stoves to limits for diesel vehicles on a
comparative basis. On an equivalent hourly operational basis, a domestic stove is likely to
emit a much higher mass of PM than a diesel vehicle meeting Euro 4/IV standards or above
and greater than 50% of the PM emissions from a large Euro III HGV as shown in Figure 2.
Furthermore, emissions from domestic space heaters will be seasonal. Within winter
months, it might be expected that a stove will operate over several hours each day
compared with much shorter commuter journeys by cars. A recent survey on domestic wood
use carried out by DECC (2016) suggests a UK average of 22 hours per week usage rate for
domestic wood burning appliances during the winter of 2013-14 compared to 10 hours per
week in the summer.

18
Without further action, increased uptake of domestic stoves within cities could lead to a
rising contribution of biomass burning to urban particulate concentrations within winter
months, particularly during evening hours (EPUK, 2013).
0 1 2 3 4 5 6 7 8
Stove (Clean Air Act)
Euro III HGV
Stove (Eco-design directive)
Euro 3 Diesel Passenger Car
Euro IV/V HGV
Euro 4 Diesel Passenger Car
Euro VI HGV
Euro 5/6 Diesel Passenger Car
Estimated PM emission rates (g/h) based on emissions limits
Figure 2: Comparison of estimated PM emission rates from a 5 kW stove (g/h) compared to
typical exhaust PM emissions (g/h) from vehicles based on emissions limits as described in
Table 5.
Dispersion of course also plays a role in determining ground level concentrations that result
from emissions sources and the height of the emission source will depend on the scale of
the combustion device. Larger plants are likely to emit from taller chimney stacks than
domestic devices. On an equivalent energy basis therefore, the impact of domestic devices
on ground level pollution is likely to be larger than for larger plant.
In general, ambient concentrations of pollutants resulting from emissions from domestic
wood stoves, large plant or a road vehicle will depend on the location of the sources and
subsequent dispersion in addition to the corresponding rates of emission. When compared
to exhaust emissions, those from domestic stoves are likely to be higher in the atmosphere,
with flue design controlled by Building Regulations (2010). They are however, likely to be
emitted from roof top chimney flues and therefore dispersion may be affected by downwash
resulting from the presence of the building. Differences in PM emissions between different
sources were discussed above. In this section, differences in ground level concentrations
due to the source location and dispersion are discussed. In order to investigate the effects of
dispersion features alone, we focus on an illustrative example using dispersion modelling
with a constant unit (1 g/s) emission rate for all sources; more detailed calculations would be
required to assess the impact of the variation in emissions during the day or with season.
We consider the following scenarios:
Emissions from a wood stove. The chimney is represented as a point source at 5.6 m above
ground for a single storey house of height 5 m, and at 10.6 m for a two storey house of
height 10 m. Cases with and without the impact of the building on flow and dispersion are
modelled in order to highlight the influence of downwash. The chimney exit is 0.6 m above
the building, consistent with guidance from the Building Regulations (2010) for the required

19
minimum chimney height. Other chimney parameters are used as follows: source diameter
20 cm, exit velocity 10.3 cm/s and flue gas temperature 100 0C. The building dimensions are
assumed to be 5 m or 10 m high, 5 m wide and 10 m long (east-west direction). The
chimney is located at the west end of the building.
Emissions for a road vehicle. An exhaust emission source of PM is assumed for a single
vehicle with speed 20 km/hr (so that the emission is spread along the road) as a volume
source with height 1 m and width 3 m to represent a single carriageway.
Emissions from a large power plant. For comparative purposes, a stack similar to that found
at Drax power station has also been modelled. The stack has height 259 m, diameter 9.1 m,
and effluent gases have an exit velocity of 27 m/s and flue gas temperature of 100 0C.
The dispersion model used was ADMS 5. Each scenario used one year of meteorological
data from Heathrow airport for 2012 and a surface roughness length of 0.1 m. In each case
the emission rate was assumed to be constant and the annual average concentration was
calculated. In the case of the road source, receptor points within the road were not
considered; the closest receptors to the road were at a distance of 1 m. The resolution of the
modelling output points for the point sources is 5 m (with the nearest grid point 5 m from the
stack), except for the power station modelling which used a 400 m resolution (with the
nearest grid point 400 m from the stack). For the road source the resolution perpendicular to
the road is 1 m; the concentration is constant parallel to the road. Ground level
concentrations (glc) were modelled in all cases.
Table 6 shows the maximum annual mean glc for each scenario and also the ratio of that
maximum to the maximum for the 10.6 m domestic stove source with building (10 m) whilst
Figure 3 and Figure 4 show contours of annual mean glc. For identical emission rates, we
see that the domestic stoves for the 5 m and 10 m houses result in much greater impact
than a single car. However it should be noted that this effect would in reality be offset by the
greater density of vehicles on roads compared with the density of houses with domestic
stoves. Also of note is the impact of buildings on flow and dispersion; where buildings are
present, the downwash of the plume causes much higher maximum ground level
concentrations compared to the cases without buildings. For the 10 m house with the effect
of building downwash included, Figure 5 shows the dependence of the maximum hourly
average concentration on wind speed and atmospheric stability. The maximum glc is highly
dependent on wind speed, increasing with decreasing wind speed but less dependent on
stability; this is in contrast to the case without building effects where the maximum glc from
an elevated source is highly dependent on stability typically occurring in unstable convective
conditions.
We also see the comparatively very small impact of a power station with a tall stack on
maximum glc. This suggests that the large stack height is sufficient to lead to substantial
dispersion of the emitted plume before it reaches ground level when considered on an
annual average basis. When considered alongside the relative emissions limits for PM for
different scales of plant in Table 3, these results show that the use of biomass stoves within
domestic properties is likely to have orders of magnitude larger effects on maximum local
ground level PM concentrations than large scale power generation from biomass sources on
an equivalent energy input basis. Considering emissions rates for a typical stack at a large
power station based on data provided by regulators to be 20 g/s, and that for a 5 kW stove to
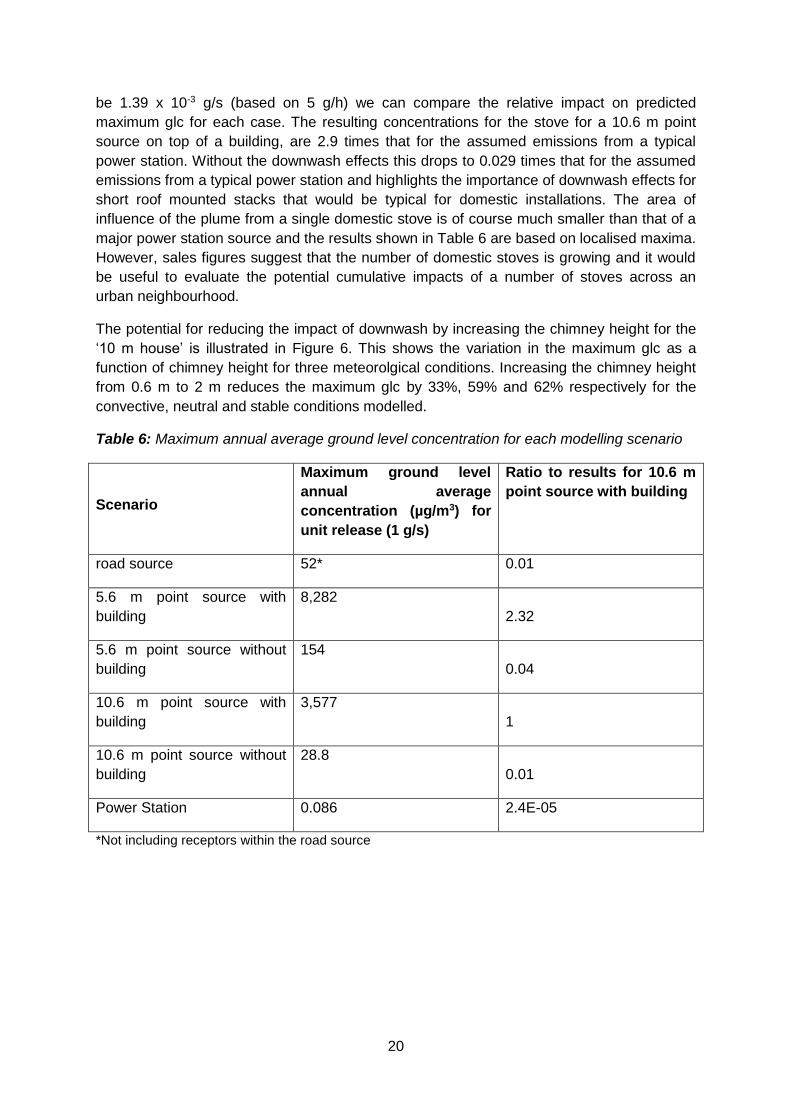
20
be 1.39 x 10⁻³ g/s (based on 5 g/h) we can compare the relative impact on predicted
maximum glc for each case. The resulting concentrations for the stove for a 10.6 m point
source on top of a building, are 2.9 times that for the assumed emissions from a typical
power station. Without the downwash effects this drops to 0.029 times that for the assumed
emissions from a typical power station and highlights the importance of downwash effects for
short roof mounted stacks that would be typical for domestic installations. The area of
influence of the plume from a single domestic stove is of course much smaller than that of a
major power station source and the results shown in Table 6 are based on localised maxima.
However, sales figures suggest that the number of domestic stoves is growing and it would
be useful to evaluate the potential cumulative impacts of a number of stoves across an
urban neighbourhood.
The potential for reducing the impact of downwash by increasing the chimney height for the
‘10 m house’ is illustrated in Figure 6. This shows the variation in the maximum glc as a
function of chimney height for three meteorolgical conditions. Increasing the chimney height
from 0.6 m to 2 m reduces the maximum glc by 33%, 59% and 62% respectively for the
convective, neutral and stable conditions modelled.
Table 6: Maximum annual average ground level concentration for each modelling scenario
Scenario
Maximum ground level
annual average
concentration (µg/m3) for
unit release (1 g/s)
Ratio to results for 10.6 m
point source with building
road source 52* 0.01
5.6 m point source with
building
8,282
2.32
5.6 m point source without
building
154
0.04
10.6 m point source with
building
3,577
1
10.6 m point source without
building
28.8
0.01
Power Station 0.086 2.4E-05
*Not including receptors within the road source
21
a) 3 m wide Road source
b) 5.6 m point source with building
c) 5.6 m point source without building
d) 10.6 m point source with building
e) 10.6 m point source without building
Figure 3: Annual average ground level concentrations calculated for a release rate of 1 g/s
for the different case study scenarios
Concentration
(µg/m3)

22
Figure 4: Annual average concentrations calculated for a release rate of 1g/s from a large
power station
Figure 5: Dependence of maximum ground level hourly average concentrations on stability
and wind speed for a 0.6 m chimney above a 10 m building for 2012 meteorology (January,
April, July and October). The stability is represented by h/LMO where h is the boundary layer
height and LMO the Monin-Obukhov length. Stability ranges from very convective (large
negative h/LMO) to neutral (h/LMO =0), through to stable (positive h/LMO).
Concentration
(µg/m3)

23
10
100
1000
10000
100000
0 2 4 6 8 10
Max
imu
m g
rou
nd
leve
l co
nce
ntr
atio
n (
µg/
m3)
Chimney height above the building (m)
Stability B: u=2 m/s, H=900 m
Stability D: u=5 m/s, H=800 m
Stability F: u= 2m/s, H= 100m
Height = 0.6m
Figure 6: Maximum ground level concentrations as a function of chimney height for three
meteorological conditions for the 10 m building modelled using ADMS 5. Stability categories
B, D and F represent unstable, neutral and stable conditions respectively. 0.6 m above the
building is the minimum height from the building regulations.
6 Estimating Emissions from Biomass
6.1 Introduction
Emission estimates for biomass combustion are the most uncertain of any major fuel type
covered in the UK inventory3. This is because the amount of different types of fuel used in
different sectors, especially the residential sector, is not well-known and is challenging to
estimate, and also because emissions of most pollutants are highly dependent on
combustion conditions, meaning that emission factors can vary greatly, even for similar
sources. It is also difficult to estimate the extent to which biomass is used in older equipment
rather than in modern equipment that is considerably more efficient and less polluting. The
recent survey by DECC (2016) suggest that >50% of closed domestic stoves are between 1-
5 years old, which contrasts with the age of open fires which tend to be much older and
linked to the age of the property.
This section discusses the challenges in estimating emissions from biomass combustion for
large point sources down to domestic and small-scale combustion sources, the basis for the
NAEI estimates and their uncertainties.
3http://naei.defra.gov.uk/

24
6.2 Biomass fuels
In recent years there has been a substantial increase in the use of biomass in larger plant for
electricity generation and in domestic and small-scale combustion appliances.
The term biomass is used to include a range of different fuels and forms. Whilst biomass is
typically the same as wood (in a range of different forms), there are other non-wood biomass
fuels. The following lists a range of fuels included in the NAEI under the heading of biomass:
Wood logs
Wood chips
Wood pellets
Sawdust/fines
Waste woods
Non-woody biomass (e.g. miscanthus, straw)
Food wastes
Bioliquids
Biogases
The EN 14961 suite of standards provide specifications for non-industrial fuel (eg EN14961-
2 A1 or A2 wood pellets) but there are also internationally-traded specifications for industrial
wood pellets (as used in power stations for example). EN 14961-1 lists the following different
types of solid biofuel:
Woody biomass
Herbaceous biomass
Fruit biomass and blends and mixtures
Fuels can also be transformed (e.g. gasification) or treated (physical treatment, liquefaction,
torrefaction). It is also possible that fuels require further sub-division when estimating
emissions. For example, waste wood needs to be divided into ‘clean’ and chemically-treated
wood when estimating emissions of some metals and Persistent Organic Pollutants (POPs).
Estimating emissions requires estimates of amounts of these fuels used by different sources
(activity data) and emission factors, taking account of the types of combustion technologies
and emission controls.
The primary source of activity data used in the UK inventory is the “Digest of UK Energy
Statistics” (DUKES) published annually by DECC (2014). For example, this source provides
a time-series in total UK domestic and industrial wood combustion, energy from waste
combustion and animal- and plant-based biomass combustion for generating heat or
electricity each year.
25
6.3 Large and Medium Point Sources
Information on biomass consumption in the electricity generating sector and other large point
sources are sourced from EU-ETS data.
Larger combustion plant are required to comply with both national and international
legislation that imposes limits on emissions. As a result, such plant are expected to be well-
managed, often utilising various emissions control technologies. Similarly a number of
smaller combustion plant are captured under UK ‘Part B’ regulation, and therefore are
required to comply with emission standards. The proposed EU Medium Combustion Plant
Directive is expected to result in future controls for combustion plant of 1-50 MWth (for PM,
NOx and SO2).
There are requirements for large point sources to report emissions estimates to the
regulators. The NAEI compiles estimates of emissions from power stations burning wood,
poultry litter, straw and waste using operators’ data reported to the Environment Agency’s
Pollution Inventory (PI), the Scottish Pollutant Release Inventory (SPRI) or Northern
Ireland’s Pollution Inventory (NIPI). These may be used in combination with literature
emission factors. Comprehensive data on the amounts of biomass co-fired in power stations
are readily available and emission factors are considered to be relatively more accurate than
many other biomass sources because emissions are typically directly measured.
The procedures for reporting emissions data for large point sources to regulators are well
established, with strong QA/QC systems in place, and both the reported biomass
consumption and emissions data are therefore considered to be robust and of a good
quality. Due to the lack of detailed source data available prior to the mid-1990s, the emission
factors and UK emission estimates for that early period in the inventory time-series are
associated with higher uncertainty than the factors and estimates for later years.
In future, the availability of RHI data for boilers burning wood may help to reduce
uncertainties in emissions estimates for sub-ETS installations. In addition, operator and
national reporting required by the proposed EU Medium Combustion Plant Directive is
expected to provide improved emissions estimates for 1-50 MW thermal input plant (EU
2015). Article 11 of the Medium Combustion Plant Directive (MCPD) will require operators to
monitor emissions, except as allowed for in MCPD exemptions – principally about plant with
low operating hours. Furthermore, by 1 October 2026 Member States will be required to
provide “an estimate of the total annual emissions of SO2, NOx and dust from medium
combustion plants, grouped by plant type, fuel type and capacity class.”
6.4 Domestic and Small-scale Combustion
6.4.1 Estimating Fuel Consumption
The use of wood in the domestic sector has traditionally been a challenge for emission
inventories in general, because there is no simple method for collecting data that allows the
determination of the annual consumption of wood among different types of combustion
devices. Whilst UK census data provides information on a household’s main central heating
system it does not currently collect information on sources of fuel for secondary heating. In
addition, solid fuel is treated as a single category and there is currently no differentiation
between coal and wood. Indirect indicators of activity trends in the UK (for example Clean Air

26
Act exemption applications and stove industry sales figures) suggest that growth in the use
of residential wood burning stoves is large and ongoing4.
Other European countries undertake extensive surveys to estimate the annual quantities of
wood burned in the residential sector. Studies in Scandinavian countries have shown that
more extensive surveys do provide better results (TFEIP, 2010). New Zealand gathers
census data on fuel type used for heating in all houses (Scott, 2005). An older UK survey
study by the Forestry Commission (1997) showed that 36% of homes with wood heating
used it regularly but only 8% used wood as the main household fuel. Of the responders 50%
gathered wood themselves and hence this usage would not be not well captured by national
sales statistics. Wood consumption data for the UK domestic sector that is robust and more
up to date could be obtained by investing in data collection/surveying. This investment is
needed if the current levels of uncertainty are to be addressed. In designing such a survey, it
would be helpful to understand the relationship between the level of investment required in
terms of data collection compared to the level of detail and quality of the data returned. Such
a survey on domestic wood use was recently carried out by DECC (2016) for around 1000
households in the UK. It provides useful data on temporal and geographical usage patterns,
age of devices, and to a certain extent fuel type. The survey was a one off and would need
to be repeated regularly to capture information on trends5. As an alternative, census data, for
example, might in principle be used in the future to gather information on specific fuels used
for both primary and secondary heating but is unlikely to be able to provide information on
fuel usage rates.
Methods for estimating the national domestic consumption of wood for heating also include
direct energy modelling or a gap analysis. In the latter, the total domestic energy
requirement is estimated based on temperature data. The shortfall between the modelled
total domestic energy requirement and the known supplies of fossil fuels and electricity to
the domestic sector provide an estimate of the energy provided by combustion of wood and
other biomass.
Separate to government subsidies through the RHI, it is understood that sales of wood
burning stoves have been running at a high level in recent years. The Stove Industry
Alliance estimated that around 150,000 units were installed in the UK in 2009, with single
room direct heating units accounting for 90% of 2009-10 sales of wood stoves (HHWT,
2010). The study from the Heating and Hot Water Taskforce (HHWT, 2010) suggests a
strong market for wood stoves that that grew between 2007 and 2010 by around 40% per
annum. However, as discussed above, the 1997 Forestry Commission survey indicates that
it is likely that these together with the existing fleet of stoves and open fires are widely used
sporadically for secondary rather than primary heating. This can lead to characteristic air
pollution signals in housing estates on cold Friday and Sunday nights as well as on special
occasions (see Section 8.2). Such intermittent use is also a source of uncertainty in
emissions estimates. Whether these units replace gas or higher pollution fuels such as oil or
coal is also unclear. HHWT (2010) report anecdotal evidence that large numbers of
consumers displace some high carbon fuel use by wood burning in homes with gas and oil
4 Information gathered from https://www.nomisweb.co.uk/census/2011/qs415ew 5 Note that the one off survey carried out by DECC (2016) has led to a significant increase in the domestic wood consumption figures used in the latest version of the NAEI published in 2016. See section 7.1

27
fired central heating, possibly shortening their gas/oil heating season by displacing use over
the winter. Further data on fuel displacement/replacement would be helpful in assessing
current and future emissions trends.
6.5 Combustion Technologies
There is a wide range of technologies from domestic room heaters (which covers basic fire
baskets, open fires to fully-automatic pellet stoves), small boilers, medium and large boilers
(incorporating all sizes of automatic boiler technologies and sizes), as well as gasification
units which can theoretically be coupled to engine technology. Liquid and gaseous biofuels
can also be burned in engines or boilers.
The range of appliance types in the domestic sector and small commercial sectors is
extensive:
Traditional open fires are no longer an option for new buildings as they are
inconsistent with energy efficiency targets, but remain an option for the majority of
the existing building stock.
Modern ‘open’ fireplace replacements are covered by a harmonised EN Standard
(hEN) but are not realistic in a new build for the reasons given above.
Closed inserts, stoves and a range of other appliance types which also have hEN
Standards.
Pellet stoves offer a modern, high combustion efficiency room heater but at higher
prices, and require an electricity supply and a manufactured fuel.
Obtaining quantitative information on the range of domestic and small-scale biomass boilers
and stoves is a major challenge to reducing the uncertainty in emission inventories for these
sources. The issues, approaches and uncertainties specific to the UK inventory are
discussed in Section 6.6.2.
For the domestic sector, the EC has proposed Eco-design regulations for solid fuel boilers <
1MWth and solid fuel room heaters as discussed above. However there have been problems
with the Eco-design process, arising from the fact that different emission measurement
methodologies give very different emission results.
The RHI has set emission requirements (for PM and NOx) for biomass boilers. The product
standard EN 303-5 sets other non-mandatory emission classes for solid fuel boilers <500
kW output at rated output.
6.6 Emission measurement issues
One key issue for domestic scale appliances is the variability in emissions recorded by
different measurement techniques. Across Europe there are a range of test methods (for PM
emissions) which have been established for room heaters and in particular batch-fired,
manually-controlled, natural draught appliances. There are significant differences between
the German ‘DIN’, Norwegian ‘dilution tunnel’ and UK ‘Clean Air Act’ test regimes (as well as
differences with test regimes in Australia and the USA). Issues are also apparent for pellet
stoves and small (EN303-5) automatic boilers, although considered to be less important.

28
Furthermore, emission ‘type-tests’ at rated output for all of these equipment types are
unlikely to reflect real-life emissions.
The Scandinavian states have made strong suggestions that proposed test procedures
within the Eco-design Directive be as realistic as possible since real world emissions will
depend on a large number of factors such as stove type, fuel type and quality, dilution
conditions, operator know-how, ambient weather conditions etc. A report from the US EPA
(http://www.epa.gov/ttnchie1/conference/ei10/pm/houck.pdf) suggests emissions factors for
open fires burning wood to be on average 11.6 g/dry kg i.e. more than twice the final
proposed Eco-design limit. A study in New Zealand (Scott, 2005) compared emissions from
the same appliances under “real world” conditions as simulated within a laboratory and
under real world conditions where the wood burners were operated normally by the
householder, using their own firewood supply. The results suggested that real world
emissions may be up to 4-5 times those achieved within legislated test cycles and laboratory
“real world” studies. Even burners with authorisation particulate test emissions below 1.5
g/kg, could achieve real world emissions factors of up to 13.0 g/kg. Coulson et al. (2013)
suggest that in situ studies which take account of the “operator” variable are essential for
understanding real world emissions. They present a review of such in situ studies for New
Zealand which highlights the variability. Overall only 22% of stoves met their legislated limits
in the real world. Wood moisture, flue temperature and oxygen supply were the major factors
affecting emissions rate variability. In the UK context, a report from EPUK (2013) based on
work undertaken by Brighton and Hove City Council, highlights an increasing number of
gross pollution and nuisance cases based on solid fuel appliances being dealt with by Local
Authorities. These are commonly linked to appliances which are poorly installed, being
misused, or burning inappropriate fuels. The report also suggests evidence of poor public
knowledge of Smoke Control Area compliance and safety awareness of solid fuel
combustion leading to DIY installations. The need for public information and guidance on
solid fuel stove operation is highlighted in the EPUK (2013) report.
6.6.1 Emission factors for inventories
Recent years have seen a substantial increase in the measurements conducted on a range
of different domestic wood burning appliances to determine emission factors for different
pollutants. As a result, many of the old emission factors published in emission inventory
guidebooks6 have been superseded.
However, emission test methods used in the literature often tend to be non-standard test
methods and with poor or unknown uncertainty. Test protocols on domestic appliances
which seek to reflect real-life activity may be extremely variable and will be difficult to
compare with EN or other standard protocols which may only test a limited range of
operation. Furthermore, emission factors that are now available often relate to equipment
found in Scandinavian countries and the alpine regions of Europe. These are not necessarily
applicable to equipment used in the UK.
6 EMEP/EEA Emissions Inventory Guidebook

29
It is challenging to obtain reliable information on the age profile of the UK stock of domestic
wood burners in the UK. As a result it is difficult to estimate the percentage of modern
equipment in the UK stock that is considerably more energy efficient and less polluting.
In practise, there are many factors which will impact on the emissions from each individual
unit. These include: installation, user behaviour, the way in which fuel is introduced/stacked,
whether the unit is started/stopped frequently, the choice of fuel and the quality of the fuel.
6.6.2 Sources of information used in the NAEI and their uncertainties
For smaller scale wood combustion, in the commercial and domestic sectors, the availability
of wood consumption data is mixed and higher in uncertainty than consumption data for
power stations. Emissions from boilers in the commercial, domestic and public sectors are
estimated by the NAEI using emission factors mostly taken from literature sources such as
the US EPA Compilation of Air Emission Factors (US EPA, 2009), the EMEP/EEA Emission
Inventory Guidebook (EMEP/EEA, 2013) and UK emission factor surveys (Walker et al,
1985) or derived from data for certain plant in the Pollution Inventory.
The NAEI does not currently use information on combustion technologies when estimating
emissions from biomass consumption in the domestic sector. The NAEI methodology is
simplistic and ideally would reflect the range of technology (including open fires) in use for all
domestic solid fuels, but the approach is limited by a lack of detailed activity data on use of
wood and (to a lesser extent) a lack of emission factors. UK energy statistics provide the
total consumption of wood, but robust data on how the fuel is used or the appliance stock is
extremely limited. There is also an issue regarding the impact of the type and quality of wood
burned on emissions, for example the extent to which the wood has been dried or seasoned,
whether it is hardwood or softwood, or whether it has been collected locally etc.
Estimating the uncertainties in emissions from domestic and small-scale biomass
combustion is itself highly uncertain and difficult to quantify. However, inventory uncertainties
are higher for these sources than for biomass emissions from power stations and other large
point sources. Moreover, the uncertainties in inventory estimates for 20-50 MW boilers are
likely to be better than for the residential, the commercial/public and small industrial sectors.
This is due to improving activity data from EU-ETS (Emission Trading Scheme).
Uncertainties in estimates for <20 MW boiler plant using biomass fuels will also improve in
time with data from the RHI.
For domestic biomass combustion, the NAEI considers (based only on expert judgement)
that the uncertainty range in emission estimates could be an order of magnitude, with
substantial uncertainties in both the emission factors for appliances and the activity data
(number of appliances, usage and fuel used) contributing to this uncertainty range estimate.
However, the NAEI generally makes conservative assumptions so that, if anything, the
actual emissions are more likely to be lower than the inventory estimates. This is because
the NAEI is largely adopting emission factors for uncontrolled, older appliances for all
domestic sources. The NAEI is aware of the current issues and is working with other
inventory experts in Europe to reduce the levels of uncertainty, for example by including
estimates of the mix of appliances including more modern stoves.
30
Estimates are made of emissions from stationary combustion of straw in agriculture using
DECC energy statistics and default emission factors from the USEPA and EMEP/EEA
Emissions Inventory Guidebook.
Emission estimates in the UK inventory for small-scale waste burning comprise emissions
from combustion of agricultural and domestic waste, and also from burning of treated wood
(i.e. treated with fungicides and used in construction). For all sources, the activity data are
not routinely collected as annual statistics across the time series, and the NAEI generates
time series estimates of activity based on available survey data and published statistics,
together with proxy data to extrapolate across years where data are missing. Activity
estimates were recently refined in the light of a national waste burning habits survey of a
thousand UK households completed on behalf of Defra in 2010 (Whiting et al 2011). This
survey provided the frequency of domestic waste burning in households with and without
allotments. From this, an overall figure for the number of waste burning fires per household
per year was derived. This figure was then combined with statistics on the number of
households in the UK in each year to derive a consistent emission trend from this source
over the inventory time-series.
Emissions of NOx, PM10, VOCs, dioxins and furans from all the small-scale burning sources
are based on composite emission factors derived from estimates of the individual waste
types burnt and factors for specific waste types from UK and US research (US EPA, 2009,
Coleman et al., 2001 and Perry, 2002). The uncertainty in emission estimates for waste
burning sources is particularly high because the type and amount of wood being disposed of
by combustion is not well characterised.
The celebration of bonfire night in the UK (5th November) is treated as a separate source
from other domestic burning events due to the large scale organised nature of the event and
potential air quality impact over a short period of time. Emission estimates for bonfire night
are based on estimates of the quantity of material burnt in bonfires. Emission factors for
domestic wood fires (in the case of PM10 and PAH) and disposal of wood waste through
open burning (in the case of PCDD/PCDF) are used to generate emission estimates.
Field burning of agricultural residues as a general management practice was banned in
1993. However estimates for earlier years are based on UK farm surveys and fertiliser sales
data. Muir burn is practised in Scotland, but emissions estimates are not currently made.
Emissions from wildfires are included in the inventory (whether these are identified as arson
or otherwise). Statistics are available from the Fire Services on the number of fires attended
each year, and an indication on the size of the fire is also provided. This allows an estimate
to be made of the amount of biomass that is burned, and hence the emissions determined.
6.6.3 European studies of potential inventory uncertainties
Denier van der Gon et al. (2015) report a new high resolution anthropogenic carbonaceous
aerosol emission inventory for Europe which indicates that about half of the total PM2.5
emission in Europe is carbonaceous aerosol. Residential wood combustion was identified as
the largest source of organic aerosol in Europe. The inventory was used as input for two
chemical transport models (CTMs) which revealed major under-estimations of organic
aerosol in winter time especially for regions dominated by residential wood combustion when

31
compared with ambient measurement data. The discrepancies were not universal but
appeared to differ by country. Further development of a revised bottom-up inventory for
residential wood combustion accounting for the semi-volatile components of the emissions
led to emissions estimates higher by a factor of 2-3 than in the earlier inventory. When this
was used as input for the CTMs, a substantially improved agreement between measured
and predicted organic aerosol was found. These findings suggest that many national
inventories substantially under-estimate emissions of primary organic aerosol from
residential wood combustion because they fail to include the semi-volatile organic aerosol
that forms during the dilution and cooling of the flue gases. Unfortunately, the UK was not
one of the countries studied in this research but the paper highlights the need for national
studies to test inventories through comparison of modelled predictions with measurements.
7 Trends in Emissions from Biomass Combustion According to
the NAEI
7.1 Trends in Historic Emissions
The NAEI has currently estimated the trend in UK emissions from biomass and other
sources up to 2012 (Passant et al, 2014).
Figure 7-Figure 11 show trends in emissions of NOx, PM10, PM2.5, benzo(a)pyrene (BaP) and
dioxins from 1990-2012 for biomass sources in the UK. Whilst the NAEI estimates emissions
from 16 different PAHs, BaP is suggested as a suitable indicator for the carcinogenic fraction
of total PAH in ambient air by the World Health Organisation (WHO, 2000). BaP also has a
target value set as a National Air Quality Objective (Defra, 2007) and hence we focus on it
here. Biomass emissions of NOx, PM10 and PM2.5 show an increasing trend over this time
period as levels of activities have increased against a backdrop of decreasing emissions in
the total UK inventory due to reductions from other sources. As a consequence, the share of
biomass emissions has been increasing significantly.
Emissions of PM10 and PM2.5 from these sources increased by over 100% over the period
from 2002-2012, mainly due to increases in domestic wood combustion and stationary
combustion of straw in agriculture. This reflects the increase in activities for these sources
over this period as shown in Figure 12 for domestic combustion of wood. Figure 9 indicates
that the share in total PM2.5 emissions from these biomass sources increased from 9% in
2002 to almost 25% in 2012. To put this in context, road transport (including exhaust and
non-exhaust sources) contributed 26% of total UK PM2.5 emissions in 2002 and 21% of total
UK PM2.5 emissions in 2012. For PM10 emissions, the share of biomass sources increased
from 7% in 2002 to 17% in 2012 compared with the road transport share of 23% in 2002 and
20% in 2012. Emissions of NOx from biomass combustion are also rising, mainly due to the
increase in wood combustion in power stations, but overall, biomass still makes a much
smaller contribution to UK emissions of NOx (<1%) than PM.
Note that post drafting of the main body of this report, DECC has significantly revised its
statistics on UK domestic wood fuel consumption for recent years (DECC, 2015). The figures
have been increased substantially and this in turn has led to a significant increase in the
NAEI estimates of emissions from this source in the latest version of the inventory covering
years up to 2014, and published in early 2016, compared with the version referred to

32
elsewhere in this report (covering years up to 2012). The increase in DECC’s estimates of
domestic wood fuel consumption in DUKES followed a one-off large-scale survey
commissioned in 2014, the purpose of which was to provide a new baseline for domestic
wood fuel use in the UK (DECC, 2016). The new baseline puts the quantity of wood used for
domestic fuel consumption in 2012 at 3.9 million tonnes, nearly a factor of 3 increase on the
previous figure in DUKES for 2012. As a consequence, the latest NAEI estimate of PM2.5
emissions from domestic wood consumption in 2012 is 31.0 ktonnes compared with the
previous figure of 10.6 ktonnes from the 2012 version of the NAEI which forms the basis of
all the figures discussed elsewhere in this report.
This change was the main cause of the significant revision to the overall PM2.5 inventory in
the latest version of the NAEI and means that domestic wood consumption is now estimated
to be responsible for 30% of all UK PM2.5 emissions in 2012 compared with our previous
estimate indicated by figures elsewhere in this report of 14% (see Figure 9).
To further put these revised consumption figures from DECC into context, about 4.4 million
tonnes of wood was used in 2014 for domestic combustion compared with 22 million tonnes
of diesel fuel consumed by road transport.
0
0.1
0.2
0.3
0.4
0.5
0.6
0.7
0.8
0.9
0
2
4
6
8
10
12
14
16
% o
f U
K t
ota
l fro
m b
iom
ass
Tota
l NO
x e
mis
sio
ns
(kto
nn
e p
er
ann
um
)
Waste
Straw Agric Stat
Wood Domestic
Wood Other Ind
Biomass Other Ind
Wood Power St
Straw Power St
Poultry Power St
UK total/200
% of UK total from biomass
Figure 7: Trends in annual UK NOx emissions from biomass sources according to the NAEI
(Passant et al, 2014)

33
0
2
4
6
8
10
12
14
16
18
20
0
5
10
15
20
25
% o
f U
K t
ota
l fro
m b
iom
ass
Tota
l PM
10
em
issi
on
s (
kto
nn
e p
er
ann
um
)
Waste
Straw Agric Stat
Wood Domestic
Wood Other Ind
Biomass Other Ind
Wood Power St
Straw Power St
Poultry Power St
UK total/10
% of UK total from biomass
Figure 8: Trends in annual UK PM10 emissions from biomass sources according to the NAEI
(Passant et al, 2014)
0
5
10
15
20
25
30
0
5
10
15
20
% o
f U
K t
ota
l fro
m b
iom
ass
Tota
l PM
2.5
em
issi
on
s (
kto
nn
e p
er
ann
um
)
Waste
Straw Agric Stat
Wood domestic
Wood Other Ind
Biomass Other Ind
Wood Power St
Straw Power St
Poultry Power St
UK total/10
% of UK total from biomass
Figure 9: Trends in annual UK PM2.5 emissions from biomass sources according to the NAEI
(Passant et al, 2014)
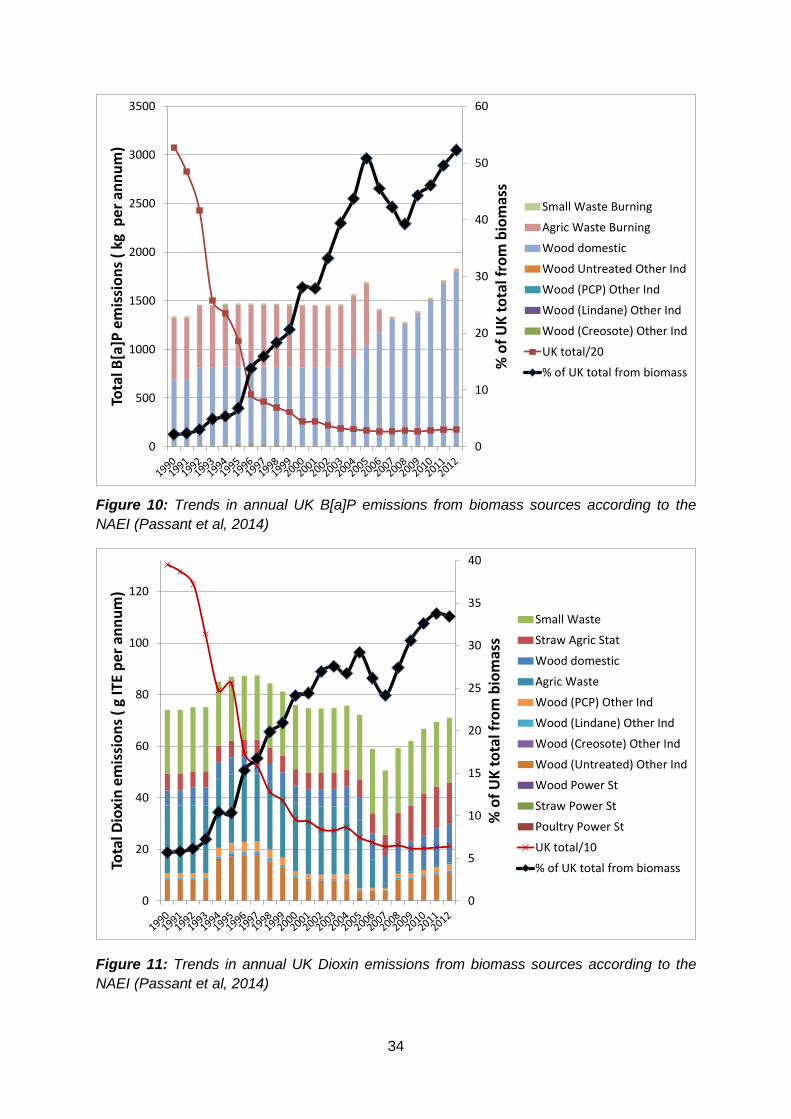
34
0
10
20
30
40
50
60
0
500
1000
1500
2000
2500
3000
3500
% o
f U
K t
ota
l fro
m b
iom
ass
Tota
l B[a
]P e
mis
sio
ns
( kg
pe
r an
nu
m)
Small Waste Burning
Agric Waste Burning
Wood domestic
Wood Untreated Other Ind
Wood (PCP) Other Ind
Wood (Lindane) Other Ind
Wood (Creosote) Other Ind
UK total/20
% of UK total from biomass
Figure 10: Trends in annual UK B[a]P emissions from biomass sources according to the
NAEI (Passant et al, 2014)
0
5
10
15
20
25
30
35
40
0
20
40
60
80
100
120
% o
f U
K t
ota
l fro
m b
iom
ass
Tota
l Dio
xin
em
issi
on
s (
g IT
E p
er
ann
um
)
Small Waste
Straw Agric Stat
Wood domestic
Agric Waste
Wood (PCP) Other Ind
Wood (Lindane) Other Ind
Wood (Creosote) Other Ind
Wood (Untreated) Other Ind
Wood Power St
Straw Power St
Poultry Power St
UK total/10
% of UK total from biomass
Figure 11: Trends in annual UK Dioxin emissions from biomass sources according to the
NAEI (Passant et al, 2014)
35
Domestic wood combustion is the dominant source of BaP emissions from all biomass
sources. Although overall biomass emissions of BaP have not increased so significantly
since the 1990s as the increase in domestic wood combustion emissions has been partly
offset by a reduction in emissions from agricultural waste burning. However, the percentage
of total UK BaP emissions has grown from 2% in 1990 to over 50% in 2012 due to the
decline in emissions from other sources.
Emission factors for BaP are around a factor of two higher for domestic wood burning
relative to coal on a comparative energy-basis and since there are virtually no BaP
emissions from natural gas combustion, switching from gas to wood burning for domestic
heating will lead to a large increase in BaP emissions. Emissions of metals and other
persistent organic pollutants are also likely to increase.
Biomass combustion is a major source of dioxin emissions according to the NAEI. Overall
biomass emissions of dioxins decreased until 2007 due to reductions in emissions from
agricultural waste burning, but have since increased with increase in emissions from
stationary combustion of straw and domestic combustion of wood. The percentage of total
UK dioxin emissions has grown from 6% in 1990 to 33% in 2012 due to the decline in
emissions from other sources.
Figure 12: UK consumption of wood for domestic combustion: 2002-2012. Source: Digest of
UK Energy Statistics (DECC, 2014)
7.2 The Potential Influence of Fuel Switching
The biomass emissions are not entirely additional emissions as they will have offset the
emissions that would have occurred from other fuels which biomass has displaced.
However, since domestic combustion of wood is for a variety of purposes, some aesthetic as
well as functional (to produce heat), it is not possible to estimate the quantity of other
domestic fuel (e.g. gas) this may have displaced.

36
To gain some insight on how emissions can change with fuel switching to biomass, data
from the NAEI have been used to estimate comparative emission factors on an energy
content basis for domestic consumption of wood, coal, oil and gas. These are shown in
Table 7 for NOx and PM2.5 in units of grammes of emission per gigajoule energy content of
fuel.
Table 7: Comparative emission factors for domestic consumption of fuels implied by energy
content of fuel
NOx
(g/GJ) PM2.5
(g/GJ)
Wood 56.5 625
Coal 81.5 387
Burning oil 73.7 3.2
Gas 21.6 0.5
These factors are derived by dividing total emissions from domestic consumption of each
fuel by the total quantity of fuel used in the inventory calculations converted to energy units
using net calorific values for each fuel reported in DECC’s Digest of UK Energy Statistics
(DECC, 2014). For domestic wood, according to DECC, the net calorific value is based on
seasoned logs at 25% moisture content used as received. The calorific value for coal refers
to domestic house coal, oil refers to burning oil and for natural gas DECC provides a
weighted average calorific value for gas entering the national transmission system.
Some caution should be applied in drawing quantitative conclusions from these factors. As
stated earlier, the NAEI estimate for emissions from domestic biomass consumption is
based on total emissions from all wood burned and using conservative emission factors for
mainly old uncontrolled appliances. Lower factors may be expected for more modern,
efficient appliances currently in use or to be installed in the future. The trends in Figure 7-
Figure 11 therefore reflect these conservative emissions factors and it is likely that emissions
per device are likely to reduce in the future, particularly in the light of the Eco-design
directory. Nevertheless, the much higher comparative PM emission factors for wood
combustion compared with natural gas does illustrate the potential negative impact (an
increase) on PM emissions that would result if there was a switch from domestic use of
natural gas to biomass. It also reinforces the need for effective regulation on emissions from
modern domestic biomass appliances.
The EMEP/EEA Emissions Inventory Guidebook (2013 edition7) is a further source of
information on typical emission rates from all sources of emissions to air drawing on
information from the literature. It is considered to be the central reference manual for the
compilation of national emissions inventories of air quality pollutants.
The “Guidebook” includes detailed information on the emission rates from different types of
residential appliances, including biomass boilers and stoves utilising different technologies.
Data from the Guidebook are presented below, and whilst these are not UK specific
emissions data, they do provide a good overview of the impacts that arise from fuel
switching.
7 http://www.eea.europa.eu//publications/emep-eea-guidebook-2013

37
Figure 13 below illustrates the emissions from open fireplaces. Emissions of NOx, PM10 and
PM2.5 per unit of energy generated are presented for the use of different fuel types in open
fireplaces. Emissions of NOx are broadly comparable across the different fuel types, with
wood giving lower emissions of NOx than both coal and gas. However, wood burning in open
fireplaces produces more PM10 and PM2.5 than any other fuel type by a considerable margin
(emissions from gas oil and gas are too small to be easily seen on the graph). The figure
clearly illustrates that switching from coal to wood in open fireplaces gives rise to more than
twice the emission of PM10 and PM2.5.
0
100
200
300
400
500
600
700
800
900
NOx PM10 PM2.5
Emis
sio
ns
(g/G
J)
Open Fireplaces (Residential)
Coal Gas Oil Natural Gas Wood
Figure 13: Emissions of NOx, PM10 and PM2.5 from open fire places utilising different fuel
types
A similar result is observed when residential boilers/stoves are considered. Figure 14 shows
the emissions of NOx, PM10 and PM2.5 from a range of different residential boilers and
stoves, utilising different types of fuel. The figure includes different types of boilers and
stoves using wood as the fuel.
Boilers and stoves using wood emit less NOx than coal fired boilers/stoves on an equivalent
energy output basis. Gas appliances are lower emitters by more than an order of magnitude.

38
0
100
200
300
400
500
600
NOx PM10 PM2.5
Emis
sio
ns
(g/G
J)Boilers and Stoves (Residential)
Coal Gas Oil
Gas Conventional Wood boiler
Energy efficient wood stove Advanced/eco-label wood stove/boiler
Wood pellet stove/boiler
Figure 14: Emissions of NOx, PM10 and PM2.5 from residential boilers and stoves utilising
different fuel types
For emissions of PM10 and PM2.5 the technologies of the wood fired boiler/stove are
particularly important in determining the level of emissions. Conventional boilers and even
energy efficient wood stoves emit nearly twice as much PM as coal appliances. Whereas
advanced or eco-labelled appliances and wood pellet stoves/boilers emit less than half of the
PM10 or PM2.5 compared to coal. However, even the lowest emitting wood burning appliance
emits an order of magnitude more PM than a gas oil appliance, and two orders of magnitude
more than a gas appliance (PM emissions from oil and gas appliances are small, and difficult
to see on Figure 14). The impact of fuel switching to wood is therefore substantial, even
when the most modern equipment is utilised.
For NOx, the dis-benefit of switching from gas to biomass is smaller than for PM and the
comparative factors are actually lower than for oil and coal. This may partly reflect the poor
combustion conditions and low temperatures implied by the biomass emission factors used
by the NAEI. For NOx, there may be the possibility of emission factors on an energy basis
increasing with more efficient combustion unless other steps in the design of the modern
appliance are taken to control NOx.
7.3 Future Emission Projections
The NAEI makes estimates of future emissions from all sources using DECC’s projections
on UK energy and fuel consumption for different sectors and assumptions on future emission
factors taking account of future emission regulations and changes in technologies.

39
DECC usually revise their energy projections annually. However, the projections cover
sources at a fairly coarse level of detail so that emissions cannot be forecast at the same
level of sector detail as the historic emission trends. The energy projections do not split
biomass from other forms of renewable energy, except for those incentivised through the
RHI (DECC, 2011b).
Based on the latest projections from DECC, the NAEI has estimated significant increases in
the quantity of biomass used for power stations and industrial/commercial combustion and
smaller increases in wood used for domestic combustion from 2012 to 2030. This is
expected to lead to an increase in future biomass emissions of NOx, PM and BaP over this
time-period while emissions from other sources are generally expected to decline. This
means that the biomass share of total UK PM2.5 emissions is estimated to increase from
25% in 2012 to 31% in 2030 and for NOx from 0.8% in 2012 to 4.5% in 2030.
There is, however, very high uncertainty in these emission projections, partly due to
uncertainties of future biomass consumption for different sources and uncertainties in future
emission factors, particularly the type and performance of biomass burners and stoves. The
levels of uncertainties cannot be quantified, but will be significantly higher than the
uncertainty estimates for current inventory years. Predicting future emissions is inherently
more uncertain than estimating current emissions, but the uncertainties could be reduced if
the switch to biomass could be predicted at higher levels of sector detail, if the types of
domestic and small-scale industrial burners and boilers could be predicted with greater
confidence and their emission performance better characterised. Clearly, getting better,
more robust information on current and near-term trends in sales and usage of different
types of domestic and small-scale wood burners would help provide a stronger basis for
predicting future emissions. Predicting the impacts on current and future air quality would
also benefit from knowing the spatial distribution of current and future biomass consumption.
Other studies have also considered future emissions from biomass combustion and the
impacts on air quality. The Renewable Heat Incentive impact assessments (DECC 2011b,
DECC 2013c) project a total RHI incentivised biomass uptake in 2020 of 30 TWh from the
non-domestic scheme and around 1.8 TWh from the domestic scheme. Assessments of the
non-domestic scheme, based on the emissions limits in Tables 3 and 4, demonstrate fairly
modest lifetime social costs to air quality (DECC, 2011b). However, were the emissions
limits to be relaxed, or not to be achieved in a real world setting, then the costs would be
substantially higher. The domestic RHI scheme has been modelled as having a net lifetime
air quality benefit, although it should be pointed out that this is balanced across all
technologies included in the RHI and not just biomass combustion devices. In the latest
assessments, negative air quality impacts associated with biomass uptake are counteracted
by the assumption that more coal and oil heated households will take up renewable
technologies than those using gas or electricity (DECC, 2013c).
It is worth pointing out that the NAEI estimated PM2.5 emissions from domestic wood burning
for 2012 of 10.6 kt are already quite close to the estimated projections of Apsimon and Oxley
(2013) for total PM2.5 emissions from biomass heating measures by 2030 of 13 kt. Even at
estimates of 13 kt, the report of Apsimon and Oxley (2013) raises concerns with respect to
the impact of increasing use of biomass for domestic heating on compliance with the
national ceiling for total UK emissions for 2020. Based on the revisions to the Gothenburg
Protocol, which specifies a 30% reduction in UK PM2.5 emissions relative to 2005 levels by

40
2020, this equates to a ceiling for 2020 emissions of 65kt when applied to the most recent
NAEI estimate for 2005.
8 Measurements of particulate matter from wood and wood
product burning
8.1 Measurement techniques
Smoke arising primarily from the domestic combustion of wood and wood products is likely
to be a significant contributor to atmospheric concentrations of PM2.5, and as such there is a
strong imperative to devise reliable measurement methods. There are no absolutely specific
chemical tracers for the burning of wood, but concentrations may be estimated
approximately from chemical tracers, or by using other methods.
The main products of combustion of wood and wood products are elemental (black) carbon
and organic matter. As both these components arise from all combustion sources, and
organic matter is emitted also from non-combustion sources, these are not reliable tracers
for woodsmoke. Consequently, most research has been based upon the analysis of
relatively minor constituents characteristic of woodsmoke, the most commonly measured
being the organic compound levoglucosan and the element potassium in the fine fraction of
particles. Levoglucosan is a product of the decomposition of cellulose and consequently
arises from not only the burning of wood but also of grass, straw, garden bonfires etc.
Potassium also has sources in sea spray and soil making estimation of the woodsmoke-
generated potassium typically rather imprecise. Other organic compounds arising from wood
burning have also been used as tracers but are typically most useful for differentiating
between the burning of hardwood and softwood rather than being used as alternatives to
levoglucosan.
The ratio of woodsmoke mass to that of the tracer compound or element is also variable
depending upon the nature of the wood and the combustion conditions. Based upon the data
presented by Puxbaum et al. (2007), Harrison et al. (2012) suggest that the relationship
between biomass smoke mass and levoglucosan lies typically within a range of 4.51 to 24.6,
with a mean value of 11.2. The literature presents a wide range of data on the relationship
between potassium and biomass smoke mass. This is because the potassium content of
biomass smoke depends critically upon the combustion conditions. Under conditions of high
burn-out, potassium can make up around 50% of the mass of smoke particles in the PM2.5
size range. Puxbaum et al. (2007) report values ranging from ratios of levoglucosan/K in
PM2.5 of 33.3 for soft wood in a wood stove (Fine et al., 2004) to 6.25 for soft wood in a
fireplace (Fine et al., 2001). A much cited paper by Schmidl et al. (2008a) reported
levoglucosan/K ratios ranging from 19.5 to 216 for various wood types burned in an old type
of domestic stove.
There is a substantial literature which shows that the combustion of biomass, and wood in
particular, is a rich source of polycyclic aromatic compounds in the gas phase and bound to
PM. PAHs are of particular concern because of the known carcinogenicity of the mixture.
The PAH comprise a large number of compounds which are structurally related but cover a
wide range of volatilities. A particularly comprehensive review of the emissions of various
PAH from a range of different wood-types is given in Fine et al. (2001). What this and other

41
studies show is that certain PAH, such as retene, can be good markers for the combustion of
specific wood-types. Retene is specific to resinous soft woods and was proposed by
Ramdahl (1983) as a suitable biomass PM marker, with confirmation by Simoneit et al.
(1999) of it being a fairly specific tracer of combustion of wood from resinous conifer species.
The sensitivity of emitted PAH speciation to the feedstock fuel however, creates difficulties in
using these chemicals as indicators for biomass PM in a more complex urban setting where
in practice an ensemble of wood-types are burned. Recent work in Birmingham has
compared concentrations of 21 PAH compounds measured in the Queensway Road Tunnel
in central Birmingham with concentrations measured simultaneously at a background site
within the city. All compounds except retene showed an appreciable enhancement of
concentration in the road tunnel, indicative of a road traffic source, while retene showed
lower concentrations in the tunnel indicative of a non-traffic source outside of the road
tunnel. When outdoor concentrations measured in 2012-2013 were compared with data from
an earlier study using the same sampling sites in 1999-2001, the majority of PAH showed
concentrations in 2012/13 around 50% lower than those in 1999-2001. Whilst the sampling
periods were not extensive, this is suggestive of a reduction in emissions over that period.
However, there were a few exceptions to this reduction, and by far the greatest was that of
retene which had increased in concentration by 125% and 175% respectively at the two
sampling sites between 1999-2001 and 2012/13. This seems likely to reflect a substantial
increase in smoke from biomass combustion over this period.
PAH arise from a wide range of combustion sources, each of which emits a characteristic
profile of individual PAH compounds (termed congeners). Receptor modelling methods
based upon Positive Matrix Factorisation are able to disaggregate profiles of PAH
compounds measured in the atmosphere such that they can be attributed to the sources
responsible. In a study of UK national network data collected between 2002 and 2006 at 14
non-industrial sites, Jang et al. (2013) attributed PAH in UK cities to four different sources,
i.e. diesel exhaust, unburnt petroleum, coal combustion and wood combustion. The
contribution of wood burning to the total measured concentration of PAH congeners (particle
plus vapour forms) ranged from 2.1 ng m-3 to 5.6 ng m-3 which represented between 7 and
23% of the sum of measured PAH. The contributions to the concentrations of the compound
benzo(a)pyrene for which there is a European Union target value of 1 ng m-3 and a UK
national ambient air quality objective of 0.25 ng m-3 ranged from 0.014 to 0.052 ng m-3
representing between 9 and 46% of the total concentration of benzo(a)pyrene at the 14
sites.
Such approaches estimate of course only the biomass contribution to airborne PAH, not PM
more generally, and can be constrained by a lack of a representative ensemble woodsmoke
fingerprints. On occasions where woodsmoke overwhelmingly dominates ambient PAH,
better quantified apportionment can be made. A published example is in Lewis et al. (2002),
where the ensemble woodsmoke PAH signature observed during Bonfire night is used to
constrain a chemical mass balance model.
Other techniques used for inferring woodsmoke concentrations are also worthy of mention.
Analysis of the carbon-14 isotope in atmospheric particles provides a measure of
“contemporary” carbon, as opposed to fossil carbon in which all carbon-14 has decayed.
Measurements of carbon-14 in the organic carbon and elemental carbon fraction of airborne
particles can be used to infer an atmospheric concentration of particulate matter containing

42
carbon derived from contemporary sources. In some locations, this may well be comprised
mainly of woodsmoke but considerable caution is needed in interpreting such measurements
as there are other sources of contemporary carbon in the atmosphere such as plant detritus,
bioaerosol and cooking aerosol, the latter being of considerable interest as a possibly
significant source of PM2.5. The only UK study to report estimated concentrations of biomass
smoke based upon carbon-14 analysis is that of Heal et al. (2011). From measurements in
Birmingham they inferred contemporary elemental carbon to represent about 0.1 µg m-3 of
PM2.5, and assuming that woodsmoke has a 20% EC content, this equates to a smoke
concentration of around 0.5 µg m-3.
An instrumental technique which is being widely used to characterise non-refractory
components of airborne particulate matter is aerosol mass spectrometry. The Aerodyne
Aerosol Mass Spectrometer (AMS) measures mass spectra of sub-micrometre aerosol
particles and application of Positive Matrix Factorisation (PMF) to the mass spectral data
allows apportionment of particulate mass to different sources. One source which has been
widely reported is wood smoke, although the method may have problems in distinguishing
wood smoke from other solid fuel combustion emissions (Allan et al., 2010). The drawbacks
of this method are the high capital cost of instrumentation, the uncertainties over attribution
to specific sources, limitation to sub-micrometre particles and the difficulties that would be
posed by future composition changes to wood smoke particles.
The other method which has received application involves the deployment of an
aethalometer to measure the light absorption of particles collected on a filter tape at
wavelengths in the visible and ultraviolet regions. Elemental carbon emissions from road
traffic dominate the absorption at visible wavelengths while in the ultraviolet, woodsmoke is
an additional important contributor and the method was developed to distinguish between
the two sources in Swiss mountain valleys with few other sources of carbonaceous particles
(Sandradewi et al., 2008a,b). A systematic study of the performance of the aethalometer in
the UK atmosphere (Harrison et al., 2013) found a number of anomalous aspects to the data
generated and it was recommended that great caution should be exercised in the
deployment of aethalometer methods to estimate woodsmoke concentrations.
8.2 Ambient measurements
In estimating woodsmoke concentrations within the UK atmosphere, Harrison et al. (2012)
used a ratio of woodsmoke mass to levoglucosan of 11.2 inferring concentrations in the UK
atmosphere averaging across seasons of the order of 0.2 to 0.4 µg m-3 in PM2.5. Fuller et al.
(2014) used a conversion factor of 11 from levoglucosan to PM10 mass, and estimated an
annual mean contribution of woodsmoke to PM10 of 1.1 µg m-3 in London. Both studies found
strong correlations between sites across London and Crilley et al. (2014) also found
correlations with rural sites outside of London. They concluded that local emissions of
woodsmoke were superimposed upon a widespread regional background from many diffuse
sources. By comparison with other pollutants, and examining the dependence upon wind
speed, Fuller et al. (2014) concluded that the source is local to London, rather than deriving
from long-range transport of emissions.
Air sampling took place in London in January and February 2012 as part of the winter
campaign of the ClearfLo project (http://www.clearflo.ac.uk/). Air samples were collected for
the analysis of woodsmoke tracers at the London North Kensington site and at the rural sites

43
of Harwell to the west of London and Detling to the east of London. Concentrations of
woodsmoke were estimated on the basis of measurements of levoglucosan, potassium and
through the analysis of multiple wavelength data from aethalometers. Measurements of the
carbon-14 content of the airborne particles which reflects the non-fossil carbon was used as
a check on the estimates. Average concentrations of woodsmoke estimated for this period
were 0.78 µg m-3, 0.87 µg m-3 and 1.0 µg m-3 at Detling, North Kensington and Harwell
respectively. Estimates of traffic exhaust PM2.5 mass measured in ClearfLo over the same
period were 1.26 µg m-3 and 0.61 µg m-3 at North Kensington and Harwell respectively (Yin
et al., 2014). This suggests that woodsmoke contributes as much as half as traffic exhaust
emissions to PM2.5 in central London during winter, and more than the traffic exhaust
component of PM2.5 at Harwell. The annual mean concentrations for woodsmoke are likely to
be around 50% of these values and to be primarily within the PM2.5 size fraction. Since the
annual mean for the traffic aerosol is likely to be reduced by less than 50% compared to the
winter average, woodsmoke would be expected to be less dominant when considered on an
annual basis. Nevertheless the data demonstrates a significant influence of wood burning on
ambient PM2.5 (Yin et al., 2014)
Complementary measurements of black and brown carbon were also made over a longer
period at a height of 160 metres on the BT Tower. By comparison of periods when the
atmosphere was well mixed with those when the sampling site was above the surface
boundary layer top, it was possible to compare the absorptive properties of the carbon
(which depend upon the relative amounts of black carbon from traffic and brown carbon from
woodsmoke) in air originating from lower levels in London with regional air transported from
other locations in southern England. The broad similarities between the two and the
directionality associated with the woodsmoke concentrations was strongly suggestive of a
widespread source of woodsmoke across southern England caused by emissions both
within London itself and in the surrounding countryside. For this reason, broadly similar
concentrations were seen at all three ground-level sampling locations (Harwell, North
Kensington and Detling) and woodsmoke tracer concentrations at all three locations showed
a strong temporal correlation (Crilley et al., 2014).
Source apportionment information derived from Pollution Climate Mapping (PCM) model
results compiled for the 2012 compliance assessment for PM2.5 can be used to calculate an
estimate of the contribution to ambient concentrations from domestic wood (biomass)
combustion for comparison with the estimates derived from ClearfLo. The modelled
population-weighted annual mean PM2.5 concentration in 2012 from domestic wood
combustion is 0.114 µg m-3. This has been derived from an estimate of emissions of 8.7
ktonnes per year, which has been derived from the 2011 NAEI by the application of a degree
day scaling factor to take account of the difference in temperatures between 2011 and 2012.
Rescaling this result to be consistent with the UK total emissions from domestic wood of
10.6 ktonnes per year from the 2012 NAEI shown in Figure 9 results in a population-
weighted annual mean PM2.5 contribution of 0.139 µg m-3, which is lower than the estimate
derived from the ClearfLo measurements by a factor of about 3.5. Figure 15 shows the
spatial distribution of emissions from domestic wood assumed by the NAEI, which is the
same as the spatial distribution assumed for domestic coal. This distribution shows zero
emissions in many large urban areas for which natural gas is assumed to be the dominant
fuel for domestic heating. Given the large population in these areas, this will have an
important influence on the population-weighted mean. This highlights the uncertainties

44
associated with the spatial distribution of emissions from domestic wood combustion which
are in addition to the uncertainties associated with emission factors and levels of activity.
The published woodsmoke measurements referred to above, such as the ClearfLo data
(Crilley et al., 2014) show woodsmoke concentrations in London which are of a similar
magnitude to those at rural sites (Harwell and Detling) outside of London. This suggests an
emission per unit area within London broadly similar to those in the rural areas, but a much
reduced emission per head of population. Nonetheless, the urban emissions are likely to be
substantially greater than those assumed by the NAEI, and consequently the population-
weighted UK concentrations will similarly be higher than the estimate above.

45
Figure 15: Spatial distribution of PM2.5 emissions from domestic wood combustion in 2012,
derived from the 2011 NAEI (tonnes per km2 per year)
As part of the JOAQUIN project (www.joaquin.eu) daily samples of PM10 were collected
using a Leckel onto aerosol filters over the period April 2013 to May 2014. Daily samples
from Leicester (UK) and every six day samples from Amsterdam, Wijk-an-Zee (Netherlands),
Antwerp (Belgium) and Lille (France). The filters were analysed by GC-MS for levoglucosan

46
and its two isomers mannosan and galactosan. The analysis method has been validated in
Cordell et al. (2014).
Figure 16: Daily (24 h) mass concentration of levoglucosan as measured at the Leicester
AURN, UK
Figure 16 shows a time series of mass concentrations of levoglucosan as measured at the
Leicester Automatic Urban and Rural Network (AURN) station. A clear seasonal cycle is
observed with a winter burning period. Monthly means range from 10.5 ng m-3 in the summer
months to an excess of 126 ng m-3 during the winter. Time variation analysis shows an
enhancement of around 10-20% on Saturday and Sunday over the rest of the weekday
concentrations indicative of domestic and in particular pleasure sources in line with the
results of Fuller et al. (2014). The year mean levoglucosan concentration from April 1st 2013
to March 31st 2014 is 49.2 ng m-3. Using a conversion factor of 10.7 (Schmidl et al., 2008b)
to estimate the contribution of levoglucosan to PM10, this leads to an estimated annual
average contribution of woodsmoke to PM10 of 0.53 µg m-3 i.e. around half that estimated for
London. Whilst this conversion factor is slightly different from that of 11.2 adopted by
Harrison et al. (2012), it lies within the range of uncertainty suggested in that study.

47
Figure 17: Time series of the percentage contribution from wood burning to the total PM10
and temperature variations at Leicester from April 2013 to May 2014
Using the Schmidl et al. conversion factor (2008b) contributions of woodsmoke to PM10 vary
between less than 1% during the summer to typically around 8% in the winter (Figure 17).
Particular peaks in contribution are observed on Christmas Day (> 30%). The type of wood
burning can be assessed by the Levoglucosan (L) to Mannosan (M) ratio and also the
Levoglucosan to Mannosoan and Galactosan (G) ratio (Fabbri et al., 2009). For Leicester,
yearly averages of (L/M) = 3.10.3 and (L/(M+G)) = 2.30.1 which is typical of soft wood
burning.
Retene measurements from selected sites across the UK PAH network are shown in Figure
18 and Figure 19 and represent monthly averages from June 2010 to December 2013. The
sampling method used is a Digitel DHA-80 high volume PM10 aerosol sampler in order to
comply with the requirements of the EU 4th Air Quality Daughter Directive. At all sites,
particle bound PAHs are captured onto glass fibre filters. The measurements show a clear
seasonal trend with significantly higher concentrations in the winter months which is
indicative of emissions due to the use of solid fuel combustion for heating. The highest
concentrations are found at sites in Northern Ireland (Figure 19) and in South Yorkshire and
Derbyshire (Royston and Bolsover, Figure 18), although the winter peak concentrations at
these sites appear to have reduced since 2010. Peak winter concentrations for other cities
(Figure 18) show an increasing trend which may be indicative of increasing emissions from
biomass burning. Unfortunately retene measurements from the PAH network are not
available from April 2014 onwards, since a range of low mass PAHs were cut from the
network. This will exclude the future use of retene as a possible tracer for wood burning from
the UK PAH network as things currently stand.

48
0
0.5
1
1.5
2
2.5
May-10 Aug-10 Nov-10 Feb-11 Jun-11 Sep-11 Dec-11 Apr-12 Jul-12 Oct-12 Jan-13 May-13 Aug-13 Nov-13
Ret
en
e c
on
cen
trat
ion
ng
/m3
Birmingham Tyburn
London Brent
Salford Eccles
Leeds
Middlesbrough
Scunthorpe Low Santon
Edinburgh
Royston
Bolsover
Figure 18: Retene concentration measurements from the PAH network for selected sites
around the UK (excluding Northern Ireland)
0
0.5
1
1.5
2
May-10 Aug-10 Nov-10 Feb-11 Jun-11 Sep-11 Dec-11 Apr-12 Jul-12 Oct-12 Jan-13 May-13 Aug-13 Nov-13
Ret
en
e c
on
cen
trat
ion
ng
/m3
Derry Brandywell
Lisburn
Ballymena
Figure 19: Retene concentration measurements from the PAH network for selected sites in
Northern Ireland

49
8.3 Future outlook
Data and samples from the compliance network could potentially be used to evaluate
proposed emissions factors for domestic biomass burning although there may be some
concerns as to whether the location of current monitors (often close to traffic sources) would
be ideal to assess trends in emissions from domestic sources. Also, the lack of future retene
measurements will limit the use of the PAH network to assess wood burning tracers. So far
levoglucosan measurements have been mainly obtained on a short term campaign basis.
Longer term trends in levoglucosan concentrations at a wider range of sites would be
extremely useful in assessing the impact of biomass burning on UK PM10 and PM2.5
concentrations.
Since large uncertainties attach to emissions inventories for wood smoke, there is value in
measuring temporal trends in airborne concentrations. This could most straightforwardly be
achieved through measurement of either levoglucosan, or of potassium in the PM2.5 size
fraction in which interference from other sources such as sea spray and soil is minimal.
There are, however, problems associated with this approach which arise from possible
changes in the composition of wood smoke aerosol with time. Both the levoglucosan and
potassium content of wood smoke depend critically upon the combustion conditions, with
levoglucosan to potassium ratios high under conditions of poor burn-out and low under
conditions of efficient combustion. Consequently, any trend towards cleaner domestic wood
stoves or a change in the ratio of emissions from large utility boilers using wood pellets to
those from domestic combustion in wood stoves or open fires would substantially change
both the levoglucosan to potassium ratio and also the ratio of each tracer to the mass of
particulate matter. Consequently, a prudent approach would be to measure both
levoglucosan and potassium with a view to evaluating whether the ratio changes with time,
which would then warrant further research into the specific sources and the ratio of tracer to
particulate matter mass concentration. The other techniques are not considered suitable.
The carbon-14 method is expensive, indirect and involves many assumptions. The
aethalometer method is subject to interferences from traffic emissions and some secondary
aerosol components, and the AMS method requires expensive equipment, is limited to sub-
micrometre particles and requires a subjective expert data analysis.
9 The Potential Impact of Biomass Boilers and Combined Heat
and Power (CHP)
In an attempt to reduce their overall carbon dioxide emissions and in response to incentives
such as the RHI many local authorities (LAs) are considering proposals for the installation of
biomass boilers either for heat provision within their own estate or for CHP (EPUK, 2013).
They also control the planning process for large developments within their authorities which
may be considering the provision of district heat or CHP from biomass plant. The air quality
implications of such developments are a concern for many LAs who may have currently
declared Air Quality Management Areas (AQMAs). Environmental Protection UK have
produced guidance documents and a set of accompanying tools available for Local
Authorities in England and Wales (EPUK, 2009, 2013) and Scotland (EPUK, 2010a), to
assist with assessing individual planning applications for biomass and CHP (EPUK, 2012)
installations and to help shape policy decisions with the aim of minimising impacts on local

50
air quality. The documents give guidance on the regulatory regimes that apply to plant of
different sizes as well as on mitigation measures and the potential advantages and
disadvantages of different biomass fuel types. The reports conclude that potential conflicts
between goals driven by climate change impacts and air quality can be avoided through the
use of high quality, low emission plant. They suggest that the encouragement of larger plant,
for example in conjunction with the development of heat networks, rather than a larger
number of small plant is likely to result in systems which are easier to control from an air
quality perspective. One reason for this is that abatement technologies become more cost
effective for larger plant sizes and are currently more highly developed for larger systems
than for smaller community and domestic scale boilers.
The overall impact of CHP on air quality may be complex. Since CHP provides overall
efficiencies greater than those of conventional power generation through combustion, and
would replace domestic scale heat provision (e.g. through domestic boilers), the expansion
of CHP could potentially lead to lower overall emissions of pollutants. However, this could be
combined with local increases in key pollutants such as NOx and PM. CHP is also more
likely to be located in regions of high population compared to conventional power plant. The
overall uncertainties in providing projections in potential air quality benefits or dis-benefits
are large, as pointed out by Apsimon and Oxley (2013).
9.1 Mitigation Strategies
The restrictions imposed by the RHI and MCPD will go some way to control potential
emissions of NOx and PM as indicated in Tables 3 and 4, but LAs also have some planning
powers at their disposal which may be used to add further restrictions. However, it is worth
pointing out that biomass boilers themselves do not require planning permission, except
where additional building work is required e.g. for a fuel store or a completely new
installation. The conversion of small boilers from gas to biomass are less likely to be
captured through the planning process than larger or new installations (EPUK, 2013). The
Mayor of London commissioned a report (AMEC, 2013) which investigated the impact and
cost implications of a range of control measures for biomass boilers ranging from selective
catalytic reduction (SCR) of NOx to cyclones and ceramic filters for PM reduction. The report
concluded that all of the additional control measures were likely to lead to a reduction in CO2
savings (of the order of a few percent) due to overall energy costs associated with their
operation, efficiency losses or direct CO2 emissions. However, several technologies were
able to provide substantial reductions in NOx and PM which would help to mitigate local air
quality impacts. These are briefly summarised in Table 8 along with a comparison of their
equivalent annualised costs expressed as a percentage of the full installation cost for the
unit based on 6,000 hours of operation of 10 years (AMEC, 2013). The most effective
methods for control, ceramic filtration and SCR for PM and NOx respectively, are not
surprisingly also the most expensive.

51
Table 8: Effectiveness of post combustion emissions reduction strategies for solid biomass
boilers (AMEC, 2013)
Proposed post
combustion
control
technology
Reduction
Efficiency %
Indicative
Emissions
Factor g/GJ
Equivalent
limit in RHI
g/GJ
Equivalent
annualised
costs as % of
initial
investment
Selective Non
Catalytic
Reduction
(SNCR) for NOx
40 70 150
Selective
Catalytic
Reduction (SCR)
for NOx (>1
MWth)
80 23 150
Multi-cyclone 50 17 30 1-2%
Ceramic filter 99 2 30 <10%
In order to find a balance between cost, potential CO2 savings and mitigation of air quality
impacts, the report suggests a tiered approach to proposed emissions limits for biomass
boilers in London. The required limits are suggested to be based on Air Pollution Exposure
Criteria (APEC) bands which specify how close current air pollution levels are with respect to
annual air quality standards. Hence if an area is currently exceeding or close to failing
standards then more stringent controls would be required. The proposed emissions limit for
PM for areas within 5% or exceeding the annual limit for PM10 is 6 g/GJ which is 5 times
lower than the limit proposed in the RHI and would necessitate the use of controls which are
more effective than commonly used cyclones such as filtration or electrostatic precipitation
methods. Note that concentrations close to or exceeding the annual mean limit value for
PM10 are not expected across locations in the UK and hence the 24 hour limit is likely to be
more relevant here (Defra, 2014). For NOx, a value of 70 g/GJ is suggested for such areas,
which is likely to require the use of staged combustion and or SCR. Note that concentrations
exceeding the annual mean limit value for NO2 are more likely than for PM10, especially
close to busy roads (Defra, 2014).
AEA (2010) also produced a detailed review of potential abatement technologies for
particulate emissions from wood-burning boilers including their cost effectiveness. They
concluded that a large range of boilers are expected to meet the requirements of the RHI
without the need for more expensive add on particle abatement technologies. A range of
emissions factors for different boilers are provided in the report which vary from 3 g/GJ to 29
g/GJ, and hence within the limits set by the RHI (30 g/GJ) there could be a wide range of
impacts depending on technology choice. The report suggests that more expensive particle
abatement techniques, such as high efficiency ceramic or fabric filters, are only likely to be

52
considered by Local Authorities in cases where Local Air Quality Management Areas or
sensitive receptors exist, in line with the proposals by AMEC (2013) for the Greater London
Authority. The AEA report suggests that current regulatory development is focussing
research on small-scale abatement measures which may result in a lowering of the size
range of application for technologies such as electrostatic precipitation and high efficiency
particle filtration. This could improve the impacts of <50 kW devices but may require support
from appropriate emissions limits since these technologies carry a significant capital cost
(e.g. around 15% of the installation cost for a ceramic filter (AEA, 2010)).
The AEA report also suggests that gasification and pyrolysis techniques offer the best
potential to lower particulate emissions since they are based on converting solid fuels into
more uniform gaseous (or liquid) fuels, thus improving mixing and lowering the potential for
particle formation. However, the report concludes that whilst small-scale gasification has a
long history, current technologies are largely used in plant that is larger than 2 MW. Further
information on small scale gasification boilers and comparative PM emissions factors relative
to direct biomass combustion boilers would be useful.
9.2 Air Quality Impact Studies of Proposed Biomass Plant
As part of planning application procedures for proposed biomass heating and CHP plant, a
number of air quality impact studies have recently been performed. It should be pointed out
that the requirement for such studies is dependent on the particular planning authority and
not all planning applications for biomass boilers have been accompanied by detailed impact
studies. The guidance given by EPUK (2013) is that neither the HMIP technical guidance
note D1 (HMIP 1993) nor the third edition of the 1956 Clean Air Act Memorandum are
suitable for estimating stack heights for biomass boilers and that detailed dispersion studies
should be undertaken. One such example is the assessment for a proposed biomass boiler
for energy provision for Greenfaulds Secondary School in Cumbernauld, North Lanarkshire
carried out by Ricardo-AEA (2014) on behalf of Morrison Construction. The proposed boiler
would have a maximum output of 450 kW and would be fuelled using woodchip. Air quality
impacts in the surrounding area were calculated using ADMS 5.0, incorporating 5 years of
meteorological data (2008-2012), with chimney heights varied between 6.85 and 9.85 m
above ground level. A “worst-case” approach was adopted with emission rates assumed to
be close to the limit imposed by the RHI.
With a stack height of 7.85 m, the maximum stack contribution to the annual mean predicted
NO2 concentrations at any point model domain was 14.2 μg m-3. For PM10, the maximum
stack contribution to the annual mean predicted at any point model domain was 3.0 μg m-3. A
number of sensitive receptor points were also included but as expected, their modelled
concentrations were lower than the maximum grid values. The contributions of the boiler
emissions at the worst case receptor point represent 19% and 9% of the annual mean
objective concentrations of 40 μg m-3 and 18 μg m-3 for NO2 and PM10 respectively (note that
the location is in Scotland). For short-term objectives, the equivalent figures represent 25%
and 18% respectively of the hourly objective concentration of 200 μg m-3 for NO2 and daily
objective of 50 μg m-3 for PM10. When combined with local background concentrations, 64%
and 76% of the annual objectives, and 42% and 66% of the short-term air quality objectives,
are reached for NO2 and PM10 respectively at this stack height. The highest contributions at

53
any point on the receptor grid to the annual mean objectives for NO2 and PM10 were 36%
and 17% respectively, and 26% and 19% respectively of the hourly/daily objective
concentrations for NO2 and PM10. When combined with local background concentrations,
this represents 80% and 83% of the annual objectives and 44% and 67% of the short-term
air quality objectives for NO2 and PM10.
The effect of stack height was investigated within the study and increasing the stack height
from 6.85 to 9.85 m was found to reduce the predicted annual mean contributions of stack
emissions to PM10 and NO2 by almost a factor of 2. A similar factor of 2 reduction was also
shown for the percentage modelled contribution of the stack emissions to 1 hr average
objectives for NO2. For PM10, at the lowest stack height, the modelled concentrations at the
worst case receptor, when combined with background levels, led to concentrations that were
98% of the annual mean objective, and thus could lead to cause for concern from the
perspective of compliance with the Scottish air quality objective. Hence, for the proposed
biomass plant, designing the installation with an appropriate stack height was clearly critical.
Using EPUK guidance (EPUK, 2010b) the change in modelled NO2 annual mean
concentrations using a stack height of 7.85 m was described as ‘slight adverse’ at several
receptor locations and ‘negligible’ at most others. For PM10, the change in modelled annual
mean concentrations was described as ‘negligible’ at all modelled receptors and ‘slight
adverse’ at the point of maximum impact. On this basis, a stack height of 7.85 metres was
adopted.
Overall this particular study demonstrated that the proposed boiler should not lead to
exceedances of the air quality standards in the local area under worst case scenarios. This
finding is very dependent on the background air quality at the particular site as well as the
size and nature of the plant and the stack height chosen, and therefore the outcomes cannot
easily be generalised. Such studies are non-trivial to undertake, but would be necessary in
areas where the existing air quality is close to or above current legislative limits.
A similar study was undertaken for a proposed biomass boiler installation in the area of
Wortley, Leeds (Conibear, 2014). The application is to supply a district heating system at
residential flats: the Clydes, and will replace the current electrical storage method with a
biomass boiler (170 kW), in addition to three back-up gas boilers to be used for peak
demand situations (3 x 500 kW in total). In terms of emissions, the system will add a local
source of PM and NOx, since electrical heating has no local emissions but rather would be
associated with emissions from a distant power generation source.
A similar approach to air quality assessment was used to that of Ricardo-AEA (2014)
described above; namely that emissions limits equivalent to those stipulated by the RHI were
used, and a worst case approach was adopted. ADMS 5.0 was used for the dispersion
assessment based on hourly meteorological data from 2011-2013. 2013 was the worst case
year for annual average assessments and is used in the presentation of results. Downwash
from buildings within 5 stack heights of the boiler flue were modelled in ADMS using
idealised building shapes based on data from Landmap (2014). Background air quality was
estimated using maps provided by the Defra Local Air Quality Management System
(http://uk-air.defra.gov.uk/data/laqm-background-maps?year=2011).

54
The main difference between the Clydes system and that of Greenfaulds Secondary School
is the proposed height of the emissions source. At the Clydes, the proposal is to integrate
the flue into one of the high rise buildings, terminating 2 m above the roof height which is 53
m above ground. For comparison, a case study assessment was also performed assuming
that the flue was to terminate 2 m above the proposed boiler housing i.e. 6 m above ground.
The study therefore serves to highlight the importance of chimney height on the resulting
local air quality impacts. Figure 20a,c shows that for the 53 m chimney, changes in both
annual average and maximum hourly average NO2 concentrations are classified as either
small or imperceptible according to the EPUK Air Quality Impact Assessment Magnitude of
Change criteria (EPUK, 2010b). However, had the design used a short chimney attached to
the boiler housing, the impact would have been raised to large in some regions close to the
stack where downwash played a significant role (Figure 20b,d). Incorporating the flue within
a high rise building therefore presents a low impact application of energy from biomass in
Leeds. However, as biomass fuelled district heating systems are rolled out to other areas of
the city in response to the RHI, it will be essential to perform air quality impact studies to
determine appropriate chimney heights or required mitigation measures.
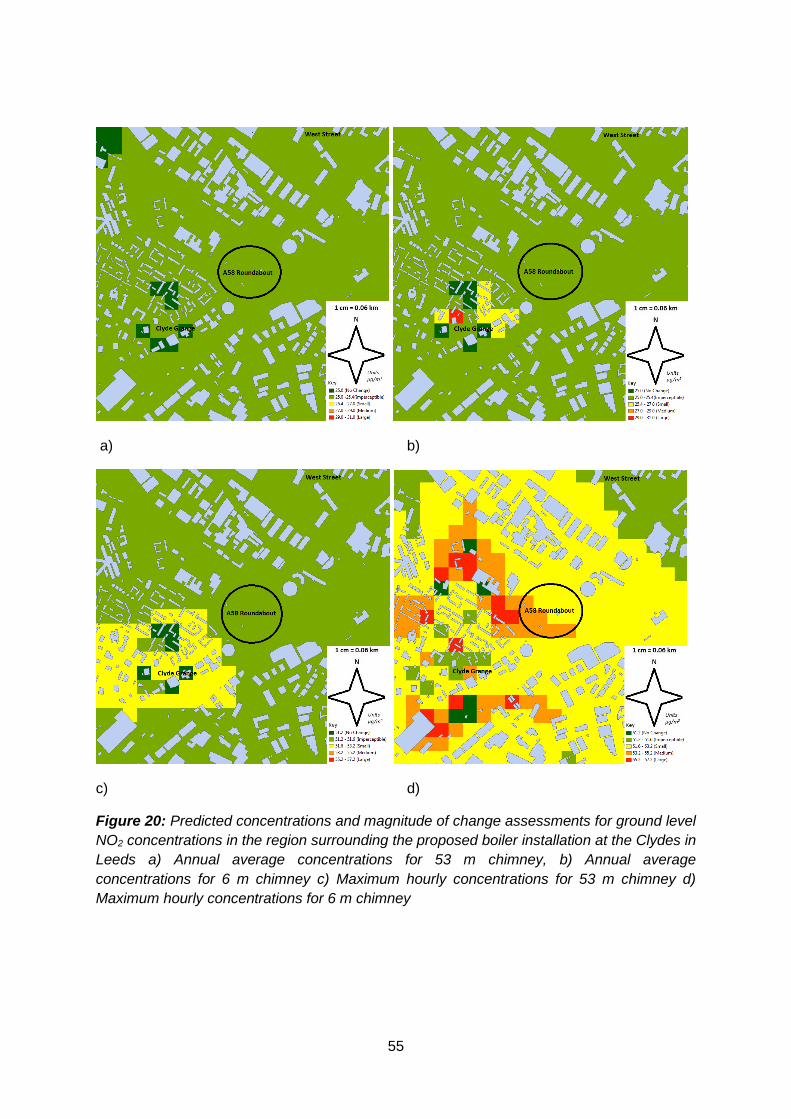
55
a) b)
c) d)
Figure 20: Predicted concentrations and magnitude of change assessments for ground level
NO2 concentrations in the region surrounding the proposed boiler installation at the Clydes in
Leeds a) Annual average concentrations for 53 m chimney, b) Annual average
concentrations for 6 m chimney c) Maximum hourly concentrations for 53 m chimney d)
Maximum hourly concentrations for 6 m chimney

56
9.3 Future Projections
A collaborative project between Imperial College and Ricardo-AEA examined the possible
impact on air quality of a future energy scenario for London with extensive deployment of
CHP and district heating networks. This work, which was part of the APRIL network
(http://www.april-network.org/emissions/) included the compilation of an emission inventory
and air dispersion modelling for a “coordinated energy scenario” developed in a GLA study
towards achievement of the Mayor’s objectives of 25% of London’s energy from
decentralised energy (DE) sources by 2025. This DE scenario gives an estimated saving of
0.8 Mt CO2 per year, but involves siting combustion plants in highly populated areas of
London. The focus of this study was on NOx emissions. Biomass CHP and Biomass district
heating plants were included in this scenario, along with several other technologies.
Table 9 shows a summary of the key emission assumptions for this study. Ambient
concentration results calculated using the PCM model are shown in Table 10, with the
results expressed as population-weighted mean annual mean NOx increments for London for
the different technologies. The modelled NOx concentration increments for biomass CHP
and biomass district heating for this scenario are shown in Figure 21.
Table 9: Emission assumptions for London distributed energy scenario in 2025
Technology GWh/y gNOx/kWh Number of units
CCGT 16954 0.17 30
Anaerobic digester 249 0.94 6
Waste gasification 2972 0.73 60
Small gas engine 964 1.75 60
Biomass CHP 1308 0.38 17
Biomass district
heating
1596 0.55 305
Sum 24043

57
Table 10: NOx concentration results for London distributed energy scenario in 2025
Technology London population-weighted
annual mean NOx
concentration (µgm-3)
1000 *
concentration/GWh/y
CCGT 0.957 0.056
Anaerobic digester 0.152 0.609
Waste gasification 1.704 0.573
Small gas engine 2.215 2.298
Biomass CHP 0.454 0.347
Biomass district
heating
1.070 0.671
Sum 6.552
The largest contribution to ambient NOx concentrations per unit of energy generated was
predicted to be for small gas engines. The lowest contribution was predicted to be for the
technology with the largest plant: Combined Cycle Gas Turbine (CCGT). Biomass CHP and
Biomass district heating were predicted to have an impact intermediate between these two
extremes. These findings are consistent with many of the other conclusions within this report
that the impact on ambient concentrations per unit of activity is generally lower for larger
plant.

58
a)
b)
Figure 21: Modelled NOx increment in London for 2025 distributed energy scenario. a)
Biomass CHP, b) Biomass district heating

59
10 Summary and Recommendations
A number of key questions were raised at the start of the report and the main findings in
relation to these questions will now be addressed along with recommendations.
Is there is a well-developed evidence-base with respect to the current range of, and
likely changes in, source distributions from biomass burning?
With respect to larger biomass burning technologies, there is a strong evidence base.
Domestic wood burning is a challenging issue owing to the difficultly of assessing the
numbers, trends, operational characteristics and performance of domestic wood burning
appliances across the UK.
Recommendations
1. Investment should be made in survey data, to provide substantially improved
information on trends in domestic stove installation numbers, geographical
distribution, usage and operational patterns. This is essential in allowing better
quantification of emissions.
2. Further research into the development of suitable cost effective PM control methods
for the domestic sector should be undertaken, and given a high priority. Particular
emphasis should be given to developing control methods which could be retro-fitted
to current stock.
Are biomass sources well represented within current UK inventories and is there any
evidence for significant inaccuracies?
The UK emission inventory is considered to have a high standard of completeness in
terms of source types and categories with respect to biomass burning sources. The
quantification of emissions from some of these sources is however subject to high
uncertainties in terms of real world emissions factors.
Emissions from large-scale sources such as from co-firing within power stations can be
estimated with significantly lower uncertainties than for smaller scale sources.
For biomass boilers below 1 MW, emissions factors and activity data are uncertain
because they are more variable and may differ under real world conditions compared to
regulatory tests.
Biomass consumption for domestic combustion is highly uncertain, as it is currently
informed by national scale data such as fuel supply rates and limited survey data.
Real world emission factors from small scale devices depend on a number of
operational factors which are highly variable between different appliances, users and
test regimes.
Currently, the spatial disaggregation of biomass related emissions is based on previous
estimates for coal combustion, and is therefore highly uncertain and neglects growing
domestic usage, particularly in urban locations.
Recommendations
3. Real world emissions data for biomass boilers and CHP units that fall under the
Renewable Heat Incentive over a range of operating conditions are needed. The
current availability of these data should be reviewed to determine whether additional

60
emissions measurement is required to deliver comprehensive information on
emissions from these sources.
4. A programme of real world emissions measurements from domestic wood stoves
should be undertaken, as these data are critical in establishing suitably accurate
emissions factors for use in the NAEI.
5. The spatial disaggregation of biomass combustion related emissions needs to be
improved within UK inventories to better reflect domestic and community scale
sources, particularly within urban areas. Predicting impacts in terms of population
weighted mean exposure would also benefit from knowledge of the spatial
distribution of current and future biomass consumption. The recent DECC survey
data could be used to provide information on the location and usage patterns of
different appliances but surveys of this type will need to be repeated in order to
provide information on trends.
Will the impact of future levels of biomass burning, with proposed policy measures in
place, lead to a significant change in ambient concentrations of major pollutants and
further in population weighted mean exposure?
Biomass burning activity data used in the NAEI suggests that there are increasing
emissions of PM10, PM2.5, NOx, BaP and dioxins from this source category at a range of
scales of combustion.
Domestic emissions of wood smoke have an especially high impact on ground-level
concentrations relative to those from elevated sources. If current trends in domestic
biomass burning continue upwards, it is inevitable that there will be an increase in
airborne concentrations of wood smoke which will consequently lead to increased
population exposures. Wood smoke is already a significant contributor to population
weighted PM2.5 exposures and is liable to make an increasingly important contribution in
the future for this reason, and as emissions from some other sources decline.
Based on estimated national emissions trends, the largest impact of biomass burning is
likely to be on national emission totals of PM, PAHs and dioxins, and less so for NOx,
particularly if increases in biomass burning observed in recent years represent a fuel
switching from gas. However, increasing the number of installations of biomass boilers
for CHP may lead to local increases in NOx within urban areas as emissions are
displaced from large power generation sources.
Recommendations
6. Emissions from newer appliances are likely to be lower than for legacy devices (e.g.
domestic stoves, boilers) due to developing legislation. Therefore capturing
information on device replacement and fuel switching is critical to assessing net
changes in emissions, and it is recommended that data are sourced on this, either
through surveys or collecting data via processes associated with the purchase or
installation of new appliances.
7. In general the turnover of domestic combustion devices is likely to be much slower
than for emissions sources in the domestic road transport sector. Incentives to
encourage the replacement of older devices with newer ones which meet required
regulatory constraints would be beneficial, as would improving guidance on solid fuel
61
stove operation. It is recommended that consideration is given to the feasibility of
supporting these actions.
How strong is measurement evidence in relationship to air pollution from biomass
burning?
a. Does measurement evidence currently suggest an increasing trend in
the contribution of biomass burning to PM?
b. Will the current set up of the monitoring networks allow us to assess
future trends in the impact of biomass burning on air quality?
The current measurement evidence is insufficient to suggest any long term trends.
Short term measurements suggest a significant contribution of biomass burning to
PM during winter in urban areas.
Current long term monitoring activity does not address the need for specific tracer
measurements for compounds such as levoglucosan. Retene analysis has also
recently ceased.
It is unclear whether the current location of monitoring stations is optimal for
capturing the impact of biomass sources since, particularly within urban areas, many
sites are located with the aim of assessing the influence of traffic emissions.
Biomass combustion also contributes to concentrations of organic compounds such
as PAH and dioxins which are currently monitored at very few locations.
Recommendation
8. Long term measurements (initially 5 years) of biomass burning tracers such as
levoglucosan and/or potassium should be established in order to provide a picture of
the changing contribution of biomass sources to atmospheric PM and for inventory
evaluation. The physical location of measurements should reflect the predominant
sources, which will include domestic heat provision or district heating systems and
CHP.
Are the air quality impacts well assessed with respect to the introduction of biomass-
based heat provision and combined heat and power (CHP) systems into the urban
environment within UK?
The number of biomass boilers registered under the Renewable Heat Incentive (RHI)
scheme is carefully monitored and reported by Ofgem each quarter. The number of
accredited installations and overall installed capacity is growing in both the domestic
and non-domestic sectors. What is not captured is the heating system that the new
biomass installations replace (i.e information on fuel switching) and therefore it is difficult
to assess whether the net impact on air quality will be positive or negative. There has
not to date, been a comprehensive study on the UK wide impact of the RHI on air
quality.
A range of abatement technologies are available which could substantially reduce the
impacts of biomass boilers at the district/community scale. The most effective measures
for abating NOx and PM are not explicitly required by the RHI.
Air quality impact studies based on dispersion modelling are emerging as planning
applications are made for district heat and CHP systems and are essential to ensuring

62
that air quality exceedances or substantial increases in population weighted mean
exposures do not occur.
For community scale boilers (e.g. used in CHP or district heat networks), Local
Authorities have some planning powers that allow them to impose stricter emissions
limits than those mandated in National or European policies. These are likely to be most
beneficial in regions whose current air quality is close to or exceeds current standards,
but will necessitate the use of abatement technologies such as SCR (for NOx) and
particle filtration or ESP for PM10 and PM2.5.
Recommendations
11. Where there is introduction of significant biomass into the local urban infrastructure,
impact case studies should be undertaken to determine the potential AQ impacts.
12. Information on fuel switching should be captured where relevant as part of the RHI
accreditation process.

63
11 References
AEA, 2010. The assessment of flue gas particulate abatement in wood burning boilers, ED56285- Issue Number 3, downloaded from: http://www.usewoodfuel.co.uk/media/234619/assessment-of-flue-gas-particulate-abatement-in-wood-burning-boilers-phase-1.pdf
AEA, 2012, Conversion of biomass boiler emission concentration data for comparison with Renewable Heat Incentive emission criteria, Report AEA/R/ED46626/AEA/R/3296 http://uk-air.defra.gov.uk/assets/documents/reports/cat07/1205310837_Conversion_of_biomass_boiler_emission_data_rep_Issue1.pdf
Allan, J.D., Williams, P.I., Morgan, W.T., Martin, C.L., Flynn, M. J., Lee, J., Nemitz, E., Phillips, G.J., Gallagher, M.W., Coe, H., Contributions from transport, solid fuel burning and cooking to primary organic aerosols in two UK cities, Atmos. Chem. Phys. 10, 647-668, 2010.
AMEC Environment & Infrastructure UK limited (2013) Biomass and CHP emissions standards, Greater London Air Quality Support: https://www.london.gov.uk/sites/default/files/AMEC%20Emissions%20Standards%20Final%20Report%2013103i1.pdf, accessed September 2014.
ApSimon, H., Oxley, T., 2013. Analysis of the air quality impacts of potential CCC scenarios, Final report Defra contract AQ0951, available from http://www.theccc.org.uk/wp-content/uploads/2013/12/Air-quality-impacts-of-potential-CCC-scenarios.pdf
Bios Bioenergiesysteme, 2011, Particle precipitation devices for residential biomass combustion, IEA Bioenergy TASK32 report, Institute for Process and Particle Engineering, Graz University of Technology, Austria, GmbH, Graz, Austria
Building Regulations, 2010, Document J: Combustion appliances and fuel storage systems, http://www.planningportal.gov.uk/uploads/br/BR_PDF_AD_J_2010_V2.pdf
Coleman, P., Conolly, C., Dyke, P. & Watterson, J., 2001, Toxic Organic Micropollutant Moitoring 1999 to 2000, AEA Technology, Report No AEAT/R/ENV/0301 Issue 1, March 2001
Committee on Climate Change, 2013. Fourth carbon budget review – part 2, available from http://www.theccc.org.uk/wp-content/uploads/2013/12/1785a-CC_AdviceRep_Singles_1.pdf
Cordell, R. L., White, I. R., and Monks, P. S., Validation of an assay for the determination of levoglucosan and associated monosaccharide anhydrides for the quantification of wood smoke in atmospheric aerosol. Anal. Bioanal. Chem., 406, 5283-5292, 2014.
Conibear, L., 2014. Urban bioenergy and air quality impacts individual report, Centre for Doctoral Training in Bioenergy, University of Leeds.
Coulson, G., Wilton, E., Somervell E. Longley, I., 2013. 10 years of research on woodstove emissions in New Zealand – a review, Proceedings of Environment and Health, Basel, Switzerland.
Crilley, L.R., Bloss, W.J., Yin, J., Beddows, D.C.S., Harrison, R.M., Allan, J.D., Young, D.E., Flynn, M., Williams, P., Zotter P., Prevot, A.S.H., Heal, M.R., Barlow, J.F., Halios, C.H., Lee, J.D., Szidat, S., Mohr C., Sources and contributions of wood smoke during winter in London:

64
Assessing Local and regional influences, Atmos. Chem. Phys., Atmos. Chem. Phys. Discuss., submitted, 2014.
DECC, 2010, 2050 Pathways Analysis, https://www.gov.uk/government/uploads/system/uploads/attachment_data/file/42562/216-2050-pathways-analysis-report.pdf
DECC, 2011a, Planning our electric future: a white paper for secure, affordable and low-carbon energy, Ref: ISBN 9780101809924, 11D/823, Cm 8099.
DECC, 2011b Renewable Heat Incentive – Impact Assessment https://www.gov.uk/government/uploads/system/uploads/attachment_data/file/48241/3775-renewable-heat-incentive-impact-assessment-dec-20.pdf
DECC, 2013a, Domestic Renewable Heat Incentive, The first step to transforming the way we heat our homes, https://www.gov.uk/government/uploads/system/uploads/attachment_data/file/212089/Domestic_RHI_policy_statement.pdf, accessed Jan, 2014.
DECC, 2013b Introduction of air quality requirements into the Renewable Heat Incentive (RHI), IA No: DECC0092, https://www.gov.uk/government/uploads/system/uploads/attachment_data/file/93847/RHI_Air_Quality_Impact_Assessment__2_.pdf
DECC, 2013c Renewable Heat Incentive – Impact Assessment, https://www.gov.uk/government/uploads/system/uploads/attachment_data/file/211978/Domestic_RHI_Impact_Assessment.pdf
DECC, 2014. Digest of United Kingdom Energy Statistics 2014, London, The Stationery Office. https://www.gov.uk/government/collections/digest-of-uk-energy-statistics-dukes
DECC, 2015. Digest of United Kingdom Energy Statistics 2015, London, The Stationery Office. Chapter 6, Renewable Sources of Energy, https://www.gov.uk/government/uploads/system/uploads/attachment_data/file/450298/DUKES_2015_Chapter_6.pdf
DECC, 2016. Summary results of the domestic wood use survey, https://www.gov.uk/government/uploads/system/uploads/attachment_data/file/512088/domestic_wood.pdf
DECC and DfT, 2013, Increasing the use of low-carbon technologies, accessed Dec 2013, https://www.gov.uk/government/policies/increasing-the-use-of-low-carbon-technologies/supporting-pages/bioenergy
Defra, 2007, The Air Quality Strategy for England, Scotland, Wales and Northern Ireland, Cm 7169 NIA 61/0607
Defra, 2014, Air Pollution in the UK 2013, Report for The Department for Environment, Food and Rural Affairs, Welsh Government, the Scottish Government and the Department of the Environment for Northern Ireland. http://uk-air.defra.gov.uk/library/annualreport/index
Denier van der Gon, H. A. C., Bergström, R., Fountoukis, R., Johansson, C., Pandis, S. N., Simpson, D. and Visschedijk, A. J. H. , Particulate emissions from residential wood combustion in Europe – Revised estimates and an evaluation, Atmos. Chem. Phys., 15, 6503-6519, 2015.

65
EEA, 2014, http://www.eea.europa.eu/highlights/competing-demands-on-europe2019s-environment, accessed November 2014.
EEA, 2013a, Annual European Union greenhouse gas inventory 1990–2011 and inventory report 2013, Technical report No 8/2013, European Environment Agency, Copenhagen, Denmark.
EEA, 2013b, Environmental Indicator Report 2013, Natural Resources and Human Well-Being in a Green Economy, European Environment Agency, Copenhagen, Denmark.
EMEP/EEA, 2013, EMEP/EEA air pollutant emission inventory guidebook 2013; Technical Report Number 12/2013, http://www.eea.europa.eu/publications/emep-eea-guidebook-2013
EPUK, 2009, Biomass and air quality guidance for Local Authorities, England and Wales, http://www.lacors.gov.uk/lacors/upload/22062.pdf
EPUK, 2010a, Biomass and air quality guidance for local authorities, for Scottish Local Authorities, http://www.iaqm.co.uk/text/guidance/epuk/biomass_guidance_scotland.pdf
EPUK, 2010b, Development Control: Planning for Air Quality (2010 update) http://www.iaqm.co.uk/text/guidance/epuk/aq_guidance.pdf
EPUK, 2012, Combined heat and power: air quality guidance for Local Authorities, http://www.iaqm.co.uk/text/guidance/epuk/chp_guidance.pdf
EPUK, 2013, Solid fuel and air quality, an update for Local Authorities, http://www.environmental-protection.org.uk/wp-content/uploads/2013/07/Solid-Fuel-and-Air-Quality-Update-for-LAs-final-060413.pdf
EU, 2015, European Parliament legislative resolution of 7 October 2015 on the proposal for a directive of the European Parliament and of the Council on the limitation of emissions of certain pollutants into the air from medium combustion plants (COM(2013)0919 – C7-0003/2014 – 2013/0442(COD)) (Ordinary legislative procedure: first reading). Available from: http://www.europarl.europa.eu/sides/getDoc.do?pubRef=-%2f%2fEP%2f%2fTEXT%2bTA%2b20151007%2bTOC%2bDOC%2bXML%2bV0%2f%2fEN&language=EN
Fabbri, D., Torri, C., Simonei, B.R.T., Marynowski, L., Rushdi, A.I., and Fabianska, M.J., Levoglucosan and other cellulose and lignin markers in emissions from burning of Miocene lignites, Atmos. Environ. 43, 2286-2295, 2009.
Fine, P., Cass, G., Simoneit, B.R.T., Chemical characterization of fine particle emissions from fireplace combustion of woods grown in the northeastern United States, Environ. Sci. Technol., 35, 2665–2675, 2001.
Fine, P.M., Cass, G.R., Simoneit, B.R.T., Chemical characterisation of fine particle emissions from the fireplace combustion of woods grown in the Southern United States, Environ. Sci. Technol., 36, 1442-1451, 2002.
Fine, P., Cass, G. Simoneit, B. R. T., Chemical characterization of fine particle emissions from the wood stove combustion of prevalent United States tree species. Environ. Eng. Sci., 21, 705– 721, 2004.
Forestry Commission, 1997. Use of Firewood Study: Fieldwork 12-16th March 1997. Forestry Commission Report. Available at:

66
http://www.forestry.gov.uk/pdf/Useoffirewood97.pdf/$file/Useoffirewood97.pdf.
Fuller, G.W., Sciare, J., Lutz, M., Moukhtar, S., Wagener, S., New Directions: Time to tackle urban wood burning? Atmos. Environ. 68, 295–296, 2013.
Fuller, G.W., Tremper, A.H., Baker, T.D., Yttri, K.E., Butterfield, D., Contribution of wood burning to PM10 in London. Atmos. Environ. 87, 87–94, 2014.
Harrison, R.M., Beddows, D.C.S., Hu, L., Yin, J., Comparison of methods for evaluation of wood smoke and estimation of UK ambient concentrations. Atmos. Chem. Phys., 12, 8271–8283, 2012.
Harrison, R.M., Beddows, D.C.S., Jones, A.M., Calvo, A., Alves, C., Pio, C., An evaluation of some issues regarding the use of aethalometers to measure woodsmoke concentrations. Atmos. Environ., 80, 540–548, 2013.
Heal, M. R., Naysmith, P., Cook, G. T., Xu, S., Raventos Duran, T. and Harrison, R. M., Application of 14C analyses to source apportionment of carbonaceous PM2.5 in the UK. Atmos. Environ., 45, 2341–2348, 2011.
HHWT, 2010. Heating and Hot Water, Pathways to 2020. Report by the Heating and Hot Water Taskforce, http://idhee.org.uk/HHTF.pdf
HMIP 1993. ‘Guidelines on Discharge Stack Heights for Polluting Emission. Technical Guidance Note D1 (Dispersion)’ ISBN 0 11 752794 7
Hoekman, S. K., Improved gas chromatography procedure for speciated hydrocarbon measurements of vehicle emissions, J. Chromatography, 639, 239-253, 1993.
Houck, J.E., Crouch, J., 2002. Updated emission data for revision of AP-42 Section 1.9, residential fireplaces”, Prepared for the Emission Factor and Inventory Group, USEPA.
Houck, J.E., Tiegs, P.E., 1998. Residential wood combustion technology review – Volume 1: Technical report”, Prepared for the United States Environmental Protection Agency, Office of Research and Development.
Jang, E., Alam, M.S. and Harrison, R.M., Source apportionment of polycyclic aromatic hydrocarbons in urban air using Positive Matrix Factorization and spatial distribution analysis, Atmos. Environ., 79, 271-285, 2013.
Kaiser, E. W., Siegl, W. O., Cotton, D. F. and Anderson, R. W., Effect of fuel structure on emissions from a spark-ignited engine. 2. Naphthene and aromatic fuels, Environ. Sci. Technol., 26, 1581, 1992.
Landmap; The GeoInformation Group, 2014. UK building heights. NERC Earth Observation Data Centre, accessed Nov. 2014: http://catalogue.ceda.ac.uk/uuid/e1449eac35108b49d3a0af26bb6d2060
Lavric E.D., Konnov, A.A., De Ruyck, J., Dioxin levels in wood combustion—a review, Biomass and Bioenergy, 26, 115–145, 2004.
Lewis, A.C. Bartle, K.D., Pilling, M.J., Formation and lifetime of polycyclic aromatic compounds during a national scale transient pollution episode, Polycyclic Aromatic Compounds, 22, 175-196, 2002.

67
Lipari, F., Determination of individual hydrocarbons in automobile exhaust from gasoline-, ethanol- and variable-fueled vehicles, J. Chromatography, 503, 51-68, 1990.
McDonald, J.D., Zielinska, B., Fujita, E.M., Sagebiel, J.C., Chow, J.C., Watson, J.G., Fine particle and gaseous emission rates from residential wood combustion, Environ. Sci. Technol., 34, 2080-2091, 2000.
Merton Council, 2009, The Merton Rule, http://www.merton.gov.uk/environment/planning/planningpolicy/mertonrule.htm, accessed April, 2014.
Nestrick, T.J., Lamparski, L.L., Assessment of chlorinated dibenzo-p-dioxin formation and potential emission to the environment from wood combustion. Chemosphere 12, 617–26, 1983.
Ofgem, 2016a, Non-Domestic Renewable Heat Incentive, Public report, run date 23/02/2016, https://rhi.ofgem.gov.uk/Public/
Ofgem, 2016b, Domestic Renewable Heat Incentive Quarterly Report, Issue 7, Update Feb 2016, https://www.ofgem.gov.uk/system/files/docs/2016/02/es922_drhi_quarterly_report_issue_7_web_2.pdf
Passant, N.R., Murrells, T.P., Pang, Y., Thistlethwaite, G., Walker, C., Watterson, J., Webb, N., Broomfield, M., Mitchell, R., Webb, J., Hunter, R., Bailey, R., Buckland, T., Hobson, M., Dore C.J., Misselbrook, T., 2014. UK Informative Inventory Report (1970 to 2012). 'Annual Report for submission under the UNECE Convention on Long-Range Transboundary Air Pollution.' Ricardo-AEA Report, March 2014. http://uk-air.defra.gov.uk/assets/documents/reports/cat19/1405130812_UK_IIR_2014_Final.pdf
Pelz, N., Dempster, N. M. and Shore, P. R., Analysis of low molecular weight hydrocarbons including 1,3-butadiene in engine exhaust gases using an aluminum oxide porous-layer open-tubular fused-silica column, J. Chromatogr. Sci., 28, 230-235, 1990.
Perry, R.E., 2002, Report on a project to measure emissions and calculate emission factors for a range of pollutants released to air during the combustion of solid fuels on an open fire, CPL Ltd, Report Reference 02/aeat/1, January 2002
Puxbaum, H., Caseiro, A., Sanchez-Ochoa, A., Kasper-Giebl, A., Claeys, M., Gelencser, A., Legrand, M., Preunkert, S. and Pio, C., Levoglucosan levels at background sites in Europe for assessing the impact of biomass combustion on the European aerosol background. J. Geophys. Res., 112, D23S05, doi:10.1029/2006JD008114, 2007.
Ramdahl, T., Retene - a molecular marker of wood combustion in ambient air, Nature, 306, 580-582, 1983.
Ricardo-AEA, 2012. Appliance Exemption from section 21 of the Clean Air Act 1993, (http://smokecontrol.defra.gov.uk/Application_Pack_Issue_3_FINAL.pdf), accessed, April 2014.
Ricardo-AEA, 2014. Greenfaulds School Biomass plant air quality impact assessment, Ricardo-AEA/R/ED59736.

68
Rogge, W.F.; Hildemann, L.M.; Mazurek, M.A.; Cass, G.R.; Simoneit, B.R.T. Sources of fine organic aerosol. 9. Pine, oak and synthetic log combustion in residential fireplaces, Environ. Sci. Technol., 32, 13-22, 1998.
Sandradewi, J., Prevot, A. S. H., Weingartner, E., Schmidhauser, R., Gysel, M. and Baltensperger, U., A Study of wood burning and traffic aerosols in an Alpine valley using a multi-wavelength aethalometer. Atmos. Environ., 42, 101–112, 2008a.
Sandradewi, J., Prevot, A. S. H., Szidat, S., Perron, N., Rami Alfarra, M., Lanz, V. A., Weingartner, E. and Baltensperger, U., Using aerosol light absorption measurements for the quantitative determination of wood burning and traffic emission contributions to particulate matter. Environ. Sci. Technol., 42, 3316–3323, 2008b.
Schmidl, C., Marr, L. I., Caseiro, A., Kotianova, P., Berner, A., Bauer, H., Kasper-Giebl, A. and Puxbaum, H., Chemical characterisation of fine particle emissions from wood stove combustion of common woods growing in mid-European Alpine regions, Atmos. Environ., 43, 126–141, 2008a.
Schmidl, C., Bauer, H., Dattler, A., Hitzenberger, R., Weissenboeck, G., Marr, I. L., and Puxbaum, H., Chemical characterisation of particle emissions from burning leaves, Atmos. Environ. 42, 9070-9079, 2008b.
Scott, A.J., 2005, Real-life emissions from residential wood burning appliances in New Zealand, Ministry for the Environment, Sustainable Management Fund. Available from: http://ecan.govt.nz/publications/Reports/air-report-emissions-residential-wood-burning-appliances-nz-000805.pdf
Simoneit, B.R.T., Schauer, J.J., Nolte, C.G., Oros, D.R., Elias, V.O., Fraser, M.P., Rogge, W.F., Cass, G.R., Levoglucosan, a tracer for cellulose in biomass burning and atmospheric particles, Atmos. Environ., 33, 173-182, 1999.
TFEIP, 2010. Report by the Co-Chairs of the Task Force on Emission Inventories and Projections to the 34th session of the EMEP Steering Body, 2010, Annex: Conclusions of the Joint Technical Workshop of the TFEIP and the TFMM, ECE/EB.AIR/GE.1/2010/5.
US EPA, 2008, Average In-Use Emissions from Heavy-Duty Trucks, EPA420-F-08-027, downloaded from: http://www.epa.gov/otaq/consumer/420f08027.pdf
USEPA (2009). Compilation of Air Pollutant Emission Factors, AP42. US Environmental protection Agency. http://www.epa.gov/ttnchie1/ap42/
Walker, D.S., Galbraith, R., Galbraith, J.M., 1985, Survey of nitrogen oxides, carbon monoxide and hydrocarbon emissions from industrial and commercial boilers in Scotland. Warren Spring Laboratory, Report LR 524.
Whiting et al., 2011, A further update of the UK source inventories for emissions to air, land and water of dioxins, dioxin-like PCBs, PCBs and HCB, incorporating multimedia emission inventories for nine new POPs under the Stockholm Convention, AEA Report to Defra AEAT/ENV/R2767/ED47664
Williams, A., Jones, J.M., Ma, L., Pourkashanian, M., Pollutants from the combustion of solid biomass fuels, Prog. Energy Combust. Sci., 38, 113-137, 2012.
WHO, 2000. Air Quality Guidelines for Europe, Second Edition, WHO Regional Office for Europe, Copenhagen.

69
WHO, 2015. Residential heating with wood and coal: hea lth impacts and policy options in Europe and North America, WHO Regional Office for Europe, Copenhagen.
Yin, J., Cumberland, S.A., Harrison, R.M., Allan, J., Young, D., Williams, P., Coe, H. Receptor modelling of fine particles in southern England using CMB including comparison with AMS-PMF Factors, Atmos. Chem. Phys. Discuss., 14, 24523-24572, 2014.