
The possibilities of reducing food choice to improve the ...
116
The possibilities of reducing food choice to improve the economical (profits), nutritional/psychological (people) and environmental (planet) performance of university residential college foodservices Joanne Ci En Loh A thesis submitted in partial fulfillment of the requirements for the degree of Master of Dietetics At the University of Otago, Dunedin, New Zealand November 2014
Transcript of The possibilities of reducing food choice to improve the ...

The possibilities of reducing food choice to improve the economical (profits), nutritional/psychological (people) and
environmental (planet) performance of university residential college foodservices
Joanne Ci En Loh
A thesis submitted in partial fulfillment of the requirements for the degree of
Master of Dietetics
At the University of Otago, Dunedin, New Zealand
November 2014

ii
Abstract
In the contestable field of choice reduction, this research developed an understanding about
the dominant attitudes towards the potential of menu choice reduction initiatives in a
residential college foodservice case study setting. More specifically, it explored the
attitudes and perceptions of stakeholders based on a residential college at the University of
Otago in Dunedin, New Zealand (i.e. warden, foodservice staff and residents). Given that
choice reduction is likely to be hugely controversial as individuals are inherently attracted
to choice, it is important to find out firstly what choice means to stakeholders before
developing and implementing practical recommendations.
Q-methodology was identified as an appropriate method for exploring attitudes to such a
contentious topic as this. This method incorporated the benefits of both qualitative and
quantitative research. It provided a foundation for the study of subjectivity, individuals’
viewpoints, opinions, beliefs and attitudes. Overall, 35 participants, 29 residents and six
staff completed the Q-sort activity and post Q-sort interview. Three factors emerged from
the Q-study’s inverted factor analysis, representing three dominant viewpoints. These
were: the “Believers” (believers in the benefits of choice reduction – environmentally,
nutritionally and socially aware); the “Resisters” (meat loving, hungry, choice reduction
resisters); and the “Emotives” (choice reduction opponents). Interestingly, there was
consensus across the factors that decreasing choice would not necessarily mean that the
quality of the foodservice would be decreased. Rather, study participants thought that the
quality might actually increase as chefs could focus less on quantity and more on quality.

iii
The majority of the participants agreed that they do not need everything that is currently
offered in the buffet menu and indicated that they usually take more than what they need.
Participants could see a number of benefits of choice reduction such as reduction in food
waste, healthier eating and easier decision making. However, there was still reluctance
towards choice reduction. There were attitudinal barriers to adopting choice reduction
initiatives that needed to be overcome to avoid dissatisfaction with the foodservice.
Based on the current stakeholder attitudes revealed by this study, the case study residential
college could immediately consider implementing less controversial choice reduction
initiatives such as smaller trays (or better still no trays), education on portion size in
relation to health and “Meatless Mondays”. As residential college foodservice managers
come under increasing pressure to improve their foodservices’ Triple Bottom Line
performance (3Ps: Profit, People and Planet), more radical choice reduction measures, such
as moving away from a large buffet offering may be an option, although staff would have
to tread carefully with how any such move would be “sold” to its customers (i.e. the
students). The innovative research approach adopted in this research study, in what has to
date been a very new and unexplored area, has provided a solid foundation on which to
build further research investigating choice reduction within the wider foodservice sector.

iv
Preface
Joint academic supervision of this research was kindly accepted by Dr. Miranda Mirosa
from the Department of Food Science and Dr. Heather Spence from the Department of
Human Nutrition at the University of Otago. Susan Stockwell, the Foodservice Manager of
the supporting residential college foodservice operation, took on the role of Professional
Advisor. A shared passion for foodservice, environmental sustainability and pursuit of
knowledge initiated this research.
The candidate was responsible for the following:
• Research proposal
• Submission of ethical approval
• Application for funding
• Communication with the Professional Advisor
• Development of data collection tools
• Recruitment of interview participants
• Conducting data analysis and interviews
• Transcribing verbal data
• Development of recommendations
• Thesis write up
This research was undertaken from June 2013 to December 2014.

v
Acknowledgements
Many people contributed to this research and to them I owe a big thank you.
To my fantastic supervisors, Dr. Miranda Mirosa and Dr. Heather Spence, thank you for all
of your advice and encouragement over the past year. Your thoughts and ideas have been
invaluable.
To the warden, foodservice staff and residents, thank you for participating in my research.
My research would not have been possible without you.
To my family, thank you for all of your love, encouragement and support throughout my
Master of Dietetics. Thank you for teaching me the value of education.
To Khoo Teck Puat Hospital (Singapore), thank you for sponsoring my Masters education.
Lastly, I dedicate this thesis to God. Thank you for guiding me the whole way through.
This thesis is entirely for you.
vi
Table of Contents
Abstract ................................................................................................................................ ii!Preface ................................................................................................................................. iv!Acknowledgements .............................................................................................................. v!Table of Contents ................................................................................................................ vi!List of Tables ....................................................................................................................... ix!List of Figures ...................................................................................................................... x!1. Introduction ..................................................................................................................... 1!
1.1 Background to research ......................................................................................................... 1!1.2 Overview to research .............................................................................................................. 2!
2. Literature Review ............................................................................................................ 4!2.1 Benefits of choice .................................................................................................................... 4!
2.1.1 Economical benefits of choice .......................................................................................... 4!2.1.2 Psychological benefits of choice ....................................................................................... 5!2.1.3 Benefits of having increased choice .................................................................................. 5!
2.2 Negative effects of choice ....................................................................................................... 6!2.3 Choice reduction to improve Foodservices’ Triple Bottom Line ....................................... 7!
2.3.1 Profits: choice reduction for economical benefits ............................................................. 7!2.3.2 People: choice reduction for social benefits ...................................................................... 8!2.3.3 Planet: choice reduction for environmental sustainability benefits ................................ 13!2.3.4 Potential additional positive effects of choice reduction ................................................ 16!2.3.5 Potential negative effects of choice reduction ................................................................. 17!
2.4 Exploring attitudes ............................................................................................................... 18!2.5 Q-methodology ...................................................................................................................... 19!2.6 Concluding comments: defining and refining the research question .............................. 21!
3. Objective Statement ...................................................................................................... 23!4. Participants and Methods ............................................................................................. 24!
4.1 Ethical considerations .......................................................................................................... 25!4.2 Identifying the concourse ..................................................................................................... 25!
4.2.1 Recruitment method for semi-structured interviews ....................................................... 26!4.3 Development of Q-sort materials ........................................................................................ 28!
4.3.1 Q-set ................................................................................................................................ 28!4.3.2 Range and slope of distribution ....................................................................................... 29!
4.4 P-set participant recruitment method for Q-sort activity ................................................. 30!4.5 Q-sorts activities ................................................................................................................... 31!
4.5.1 Q-sorts ............................................................................................................................. 31!4.5.2 Post Q-sort interview ....................................................................................................... 32!
vii
4.5.3 Short survey ..................................................................................................................... 32!4.6 Factor analysis ...................................................................................................................... 33!
4.6.1 Data analysis programme ................................................................................................ 33!4.6.2 Coding procedures ........................................................................................................... 33!4.6.3 Correlation matrix ........................................................................................................... 34!4.6.4 Centroid factor analysis over principal component analysis ........................................... 34!4.6.5 Varimax rotation ............................................................................................................. 35!
4.7 Factor interpretation and communication ......................................................................... 36!4.7.1 Shared viewpoints ........................................................................................................... 36!4.7.2 Distinguishing statements ............................................................................................... 37!4.7.3 Addition of qualitative comments from Q-sort activities ................................................ 37!
5. Results ............................................................................................................................. 38!5.1 Shared viewpoints (consensus) ............................................................................................ 41!5.2 Factor number 1: The “Believers” (believers in the benefits of choice reduction – environmentally, nutritionally and socially aware) ................................................................. 43!5.3 Factor number 2: The “Resisters” (meat loving, hungry, choice reduction resisters) ... 50!5.4 Factor number 3: The “Emotives” (choice reduction opponents) ................................... 54!5.5 Feedback about Q-methodology .......................................................................................... 56!
6. Discussion and Conclusion ........................................................................................... 58!6.1 Profits: choice reduction for economical benefits .............................................................. 59!6.2 People: choice reduction for social benefits ....................................................................... 60!6.3 Planet: choice reduction for environmental sustainability benefits ................................. 62!6.4 Potential barriers towards choice reduction ...................................................................... 63!6.5 Conclusion ............................................................................................................................. 64!
6.5.1 Strengths of this research ................................................................................................ 64!6.5.2 Limitations of this research and possibilities of future research ..................................... 64!
7. Application to Foodservice ........................................................................................... 66!8. References ...................................................................................................................... 70!9. Appendices ..................................................................................................................... 79!
Appendix 1: University of Otago ethics approval .................................................................... 80!Appendix 2: Semi-structured interview – information sheet for participants ...................... 81!Appendix 3: Semi-structured interview – interview information for participants .............. 83!Appendix 4: Semi-structured interview – consent form for participants ............................. 84!Appendix 5: Semi-structured interview protocol and interview guide .................................. 85!Appendix 6: Vouchers received sheet ....................................................................................... 88!Appendix 7: Preliminary Q-set (74 statements) ....................................................................... 89!Appendix 8: Final Q-set (42 statements) .................................................................................. 92!Appendix 9: Poster advertisement for Q-sort activity ............................................................ 94!Appendix 10: Q-sort activity – information sheet for participants ........................................ 95!Appendix 11: Q-sort activity protocol ...................................................................................... 98!Appendix 12: Q-sort activity – consent form for participants ............................................... 99!Appendix 13: Q-sort activity – instruction sheet for participants ....................................... 100!Appendix 14: Example of completed Q-sort .......................................................................... 101!Appendix 15: Post Q-sort interview guide for college staff/residents .................................. 102!Appendix 16: Short demographic survey ............................................................................... 103!

viii
Appendix 17: Statements sorted by shared viewpoints (consensus) .................................... 104!Appendix 18: Distinguishing statements for factor 1 (Believers) ......................................... 105!Appendix 19: Distinguishing statements for factor 2 (Resisters) ......................................... 105!Appendix 20: Distinguishing statements for factor 3 (Emotives) ......................................... 106!

ix
List of Tables Table 1: Selection criteria for college staff and residents ................................................... 27!Table 2: Coding for Q-sort participants ............................................................................... 34!Table 3: Statistical and theoretical guidelines followed in this study for factor extraction 35!Table 4: Demographic data of the participants involved in Q-sort ..................................... 38!Table 5: Factor Q-sort values for statements sorted by shared viewpoints (consensus) ..... 43!Table 6: Distinguishing statements for factor 1 .................................................................. 44!Table 7: Distinguishing statements for factor 2 .................................................................. 50!Table 8: Distinguishing statements for factor 3 .................................................................. 55!

x
List of Figures Figure 1: Inverted U-shape relationship between variety and positiveness of consumption
experience (48) ............................................................................................................ 12!Figure 2: Practical steps used in Q-methodology ................................................................ 24!Figure 3: Q-sort table for rank ordering Q-set statements ................................................... 29!Figure 4: Factor matrix with an X indicating a defining sort .............................................. 40!Figure 5: Typifying the descriptions for the 3 factors ......................................................... 41!
1
1. Introduction
1.1 Background to research
Consumer choice is generally viewed as being desirable (1). It is therefore surprising to
witness a trend towards “no-choice” menus in the restaurant foodservice industry. Media
coverage of this trend indicates that its driving forces are primarily quality-related (i.e. by
offering a set menu at a set price, the restaurant’s chefs can focus their energy on a limited
offering of finely executed dishes) (2-5). Another trend that restaurants are now opting to
do is downsize their menus. Reducing menus options could be a way for restaurants to cut
cost (financial benefits). Restaurants could more easily standardise food quality, avoid food
waste and probably boost their profit margins – either by charging more or spending less
(6). Other papers have concluded that “more isn’t always better, too many choices could be
a problem” (7, 8).
While there is currently no academic discussion about the benefits or limitations of choice
reduction in the areas of dietetics or foodservice, there is a growing body of literature in the
psychology discipline. For example, there is increasing evidence that more choice does not
automatically contribute to more satisfaction (9, 10). Experimental studies show that when
individuals have to make a choice from an extensive choice set, they tend to be less
motivated to choose, less willing to buy and feel less satisfied with their choice (9). In the
last few years, sustainability experts, especially in the area of food policy, have also started

2
to promote the benefits of choice reduction from an environmental point of view (e.g. less
choice results in less wasted food) and they have espoused the need for more choice editing
to rid the market of environmentally damaging products (11-13). Health experts are also
well aware that more choice can lead to overeating, which is concerning given the
abundance of buffet offerings (14) and the current obesity crisis (15).
Given that foodservices are increasingly looking for ways to improve customer satisfaction
and improve their Triple Bottom Line performance (3Ps: Profits, People and the Planet)
(16), menu choice reduction looks promising as a strategy for foodservice managers to
achieve these goals. Since universities have a responsibility (in both curricular and extra
curricula activities) to foster a wide range of graduate attributes such as environmental
literacy and ethics, university college foodservices are a good place to start investigating
the possibilities of, and potential challenges associated with, menu choice reduction.
Individuals that rely on college foodservices are mainly first year university students. It is
their first year moving away from home to being in a new environment with changing
peers and support systems (17-19). Therefore, it is important that they are in an
environment that allows them to make healthy and environmentally sound food decisions.
1.2 Overview to research
This research aims to explore stakeholders’ attitudes and perceptions around menu choice
reduction and the possible circumstances under which less food choice is acceptable. The
research question is “What does choice mean to you at the residential college’s meal
times?” The wider choice literature indicates that there are three potential benefits of

3
reducing menu choice in a residential college foodservice operation: Profits (economical),
People (nutritional/ psychological) and Planet (environmental sustainability). However, it
is a hugely controversial as individuals are inherently attracted to choice (20). Therefore, it
is important to understand the attitudes and perceptions of stakeholders to choice reduction
and their limits to reducing choice.
In the context of this study’s residential college foodservice, ‘choice’ refers to hot and cold
options on the main menu, a variety of salads on the salad bar and a range of drinks at
beverage stations. In addition, ‘choice’ refers to whether or not to use a tray. The study
focuses on which types of food offered at meal times (for example, sandwich fillings,
salads, beverages and food trays) could potentially be reduced. Although there are
possibilities to reduce choice in other aspects of the foodservice operation for example, to
source foods from only local farms, this is not the focus of this research. There is room for
further research in this area.
The outline of the thesis is as follows:
• Chapter 2: Literature Review
• Chapter 3: Objective Statement
• Chapter 4: Participants and Methods
• Chapter 5: Results
• Chapter 6: Discussion and Conclusion
• Chapter 7: Application to Foodservice

4
2. Literature Review
This chapter reviews the positive (2.1) and negative (2.2) effects of having choice, explores
choice reduction as a means to improve the foodservice’s Triple Bottom Line performance
(3Ps: Profit, People and Planet) (2.3) and identifies Q-methodology as an appropriate
method for exploring attitudes (2.4-2.5).
2.1 Benefits of choice
Supermarket chains claim that they offer the largest variety of products for shopping. Ice
cream vendors race with each other by having the widest range of flavours. Major fast-food
chains urge customers to “have it their way”. In addition, with the rise of internet dealers
with their unrestricted capacity and reach, consumer choice expands even further (20). The
benefits of choice have also been widely documented in the academic literatures in
domains such as economics and psychology.
2.1.1 Economical benefits of choice
Rational choice theory portrays humans as rational agents in an economic system. They act
within specific, given constraints and on the basis of the information that they have about
the conditions under which they are acting. A rational individual chooses the alternative
that is likely to give them the greatest satisfaction (21). This implies that when an
individual goes through a purchase process, he/she would always choose the product that
best matches his/her preference. With more items available, the chance of finding the ideal
solution increases.

5
2.1.2 Psychological benefits of choice
The link between provision of choice and increases in intrinsic motivation, perceived
control, task performance and life satisfactions have been well supported by decades of
psychological theory and research (9, 22-24). Botti and Iyengar (2006) also found support
in psychological models, which implied that more choice leads to improved individual
welfare (25). Furthermore, Deci and Ryan (2000) claimed that choice is associated with
desirable consequences such as greater satisfaction (22). Individuals are motivated when
they are given the opportunity to make their own choices as they feel in control. They feel
better as they would be able to positively evaluate the decision outcomes of their own
choices. This contributes to an increased psychological well-being and a link between
attitude and behaviour (20).
2.1.3 Benefits of having increased choice
Current psychological theory and research affirm the positive effects and motivational
consequences of having personal choice. These findings have led to a popular notion that
the more choices, the better (9). Having more choices could benefit individuals in at least
two ways. Firstly, when individuals have highly differentiated needs, choices available
would enable them to satisfy their own particular wants. An example is that different
people have different tastes in food preferences and the same person may like different
foods at different times. Restaurants that offer multiple choices about food would satisfy
these diverse wants and needs (26). Another benefit is when individuals have similar needs,
more choice could be beneficial if it promotes competition among providers that leads to

6
lower prices or improved quality (9, 27). For the benefits of competition to be noticed,
consumers must be well informed about the difference in price and quality.
2.2 Negative effects of choice
A study by Iyengar and Lepper’s (2000) challenged the assumption that more options have
a positive effect on choice satisfaction. Their study showed that more choice could lead to
negative consequences for both retailers and consumers. More choices available led to
more complex decisions as consumers might be overloaded by all the information. For the
first time, three experimental studies demonstrated the possibility that, although having
more choices might appear desirable, it may sometimes have detrimental consequences for
human motivation. The first part of the study showed that although more consumers were
attracted to a tasting booth with 24 flavours of jam rather than six, consumers were much
more likely to purchase jam if they had encountered the display of only six jams. The
second part found that students wrote higher quality essays when they picked a subject
from a limited list than a more elaborate list. The last part revealed that participants were
more dissatisfied and experienced more regret after choosing a chocolate candy from a
large assortment (9). These three studies showed that although initially, extensive choice
appealed to participants, they experienced feelings of demotivation before choosing and
dissatisfaction after choosing. Similarly, a recent study conducted by Ackerman and
colleagues (2014) found that when students are asked to engage in the course choice and
make an actual decision, students preferred to have more choice. However, when they were
required to make a choice, students responded more positively to having fewer choices

7
(28). The results from the study were aligned with findings from past research showing that
more choice could produce negative effects.
2.3 Choice reduction to improve Foodservices’ Triple Bottom Line
Menu choice reduction could be the strategy for college foodservices to adopt as its
potential benefits fit the Triple Bottom Line framework. During the mid-1990s, John
Elkington strove to measure sustainability by encompassing a new framework called the
Triple Bottom Line. This framework went beyond the traditional measures of financial
profits, returns on investment and shareholder value to incorporate environmental and
social dimensions. It focused on the investment results along with interrelated dimensions
of 3Ps: Profits, People and the Planet. Therefore, this framework could be an important
tool to support sustainability goals (16). This framework is used to structure the literature
review and discussion chapters of this thesis. Three potential categories of benefits for
reducing food choice in a residential college are 3Ps: Profits − economical (streamlined
service resulting in reduced cost to foodservice provider), People − nutritional (preventing
individuals from overconsumption of food) and psychological (less choice resulting in
more satisfaction with the chosen option), and Planet − environmental sustainability (less
food waste).
2.3.1 Profits: choice reduction for economical benefits
Choice reduction could lead to financial savings. Universities and colleges are recognising
how much food waste they are producing and the impact it is having on the environment
and economy (29). Worldwide, it has been estimated that one-third of all food produced

8
gets lost or wasted in the production and consumption system. Almost half is the result of
retailers and consumers in industrialised regions removing food that is fit for consumption.
This contributes to over 1.3 billion tonnes of food, worth approximately US$1 trillion,
which is enough to feed an estimated 870 million people who are hungry each day (29).
Furthermore, Dr. Tim Fox, Head of Energy and Environment from the Institution of
Mechanical Engineers, commented that it is estimated that 30 to 50% (or 1.2-2 billion
tonnes) of all food produced on earth is lost before reaching a human stomach (30).
2.3.2 People: choice reduction for social benefits
Nutritional benefits of reducing choice
In the area of health and nutrition, countries like the United States have banned sugary
drinks in public schools and researchers have founded that after the policy change took
place, overall, students cut back on sugary drinks (31). This is an example of a choice
reduction initiative. “All you can eat” one-price buffets influence the way individuals eat.
It is an incentive for individuals to over-consume as there is a wide availability of food and
there is no set portion size. To address the relevance of obesity control, default portion
sizes could be applied to all foods or education on the appropriate serving sizes could be
given (32). A study conducted by Kolodinsky and colleagues (2007) stated that college
students are better eaters if they have a higher knowledge and understanding of nutrition
education (33).
Portion size influences how much is consumed; research examining the effects of portion
sizes has shown that when individuals are presented with more food, they consume more.

9
A study conducted among young adults by Levitsky and Youn (2004) stated that when
larger amounts of food were served, there was a significantly greater amount of food
consumed (14). This data was consistent with previous results in adults (34-37) and older
children (38) that serving a larger portion contributes to eating more food. In addition,
larger portion sizes could increase the total amount of food consumed over the day as
individuals do not compensate by eating lesser portions at other times (39, 40). According
to a recent systematic analysis published in The Lancet: “Global, regional, and national
prevalence of overweight and obesity in children and adults during 1980-2013”, the rates
of being either overweight or obese have climbed among New Zealanders since 1980.
Currently, the adult overweight and obesity rate in the country is 66%, up from 50% during
the past 33 years (15). In New Zealand, the home economics curriculum exposes
individuals to evaluate current issues and theories of nutrition (41). However, these lessons
appear to be overlooked.
The trend of larger portions consumed in a single session is described as “portion distortion”
and appears to affect the portion sizes that young adults selected for some foods (42).
Internationally, links between portion size and energy intake have led to calls for action
and greater control over the food industry around portion sizes. As part of the Public
Health Responsibility Deal, the Department of Health in England has issued a challenge to
reduce the total energy intake of the population by 5 billion calories a day (43).

10
Psychological benefits of reducing choice
There are various reasons why more choice does not lead to more satisfaction. Choice
overload could produce the following: paralysis, information overload and demotivation,
time costs, regret, lack of well-determined preferences and increased expectations (20).
Paralysis: According to Schwartz (2004), choice produces paralysis rather than happiness.
Adding more options could make it hard for consumers to make a decision. Consumers
may not look forward to having to decide from a large and varied assortment (44, 45).
Information overload and demotivation: Decision researchers have identified that there are
a number of common errors in decision making that are exacerbated by decision-overload.
As the choice increases, consumers are overloaded with the available options, which could
have a demotivating effect on the purchase intention (9). Individuals may try to avoid
having to make a decision by procrastinating or choosing the default options (26).
Consumers with more options to consider may take more time and effort to make the
decision. It requires more effort to compare and match preferences (25). Huffman and
Wansink (1999) had also reported a negative effect of a large assortment on information
overload (45).
Time cost: Time is a limited commodity for most individuals. Therefore, the more time one
spends on decision-making, the less one has for other pursuits. This could also impose
psychic costs as when the demand on their time increases, individuals become increasingly
11
anxious about whether they are making the best use of their hours and minutes (26). They
could feel regretful about other tasks that are left undone and guilty about the relationships
that they neglect (20). This may result in a general decline in enjoyment of the activities
that they find time for (26).
Regret: When consumers finally made a decision, they could regret the option that they
have decided on. Individuals dislike losing and they feel worse when they feel individually
responsible, especially when they could have done better if they had made a different
decision (46). These feelings of regret are explained by what Fischhoff (1975) referred to
as “hindsight bias” which is the inclination to view outcomes as having to be more
predictable than they actually were when the decision was made (47). Several studies have
shown that two factors affecting regret are how much one feels personally responsible for
the results and how easy it is to imagine a better alternative (9, 25). Desmeules (2002)
proposed an inverted U-shape relationship (see Figure 1) between the variety of an
assortment and positiveness of the consumption experience. According to this study, a
moderate assortment would lead to the highest consumer satisfaction and also positive
consumption experience (48).

12
Figure 1: Inverted U-shape relationship between variety and positiveness of consumption
experience (48)
Other than experiencing regret, individuals also experience anxiety at the time that they
make decisions. Researchers have found that anxiety induced by decision making tends to
be in situations such as when decision makers feel that they lack expertise in that particular
area (49).
Lack of well-determined preferences: According to the rational choice theory (sub section
2.1.1), individuals have well-stated, stable and ordered preferences. However, experts in
the economics field have concluded that people might not know their preferences before
the actual decision process. Rather, consumers choose their preference during the decision
process and can be affected by contextual influences (25). Individuals tend to be
shortsighted when they face choices between immediate gratification and long-term gains.
In principle, individuals want their lives to improve over time; they want increasing

13
income over their life-course (27). However, in practice, it is the opposite: individuals are
often driven by short-term temptations and costs (26).
High expectations: The amount of choice that individuals have in most situations
contribute to high expectations. Schwartz (2000) states that the larger the assortment, the
higher the expectations (10). The amount of choice leads the consumer to think that one of
the options would meet their preference (50). If choices were limited, the consumer would
have limited preference.
2.3.3 Planet: choice reduction for environmental sustainability benefits
There is increasing acknowledgement that the current food system is not sustainable
indefinitely into the future and that additional efforts are needed to reverse its damaging
ecological impacts (51, 52). Some environmental advocates argue that not only major
changes are needed in the food system but that individuals should be modifying their food
choices to make them more ecologically conscious to support a sustainable food supply (52,
53). A study conducted by Bissonnette and Contento (2001) found that adolescents did not
have strong or consistent beliefs of attitudes about the environmental impact of food
production practices (52).
According to a joint document released by the Danish Ministry of the Environmental and
Copenhagen Resource Institute, choice reduction for sustainability describes how retailers
could eliminate the option of buying products with a poor environmental or social record.
Retailers participate by not supplying products that are considered to have an unacceptable

14
environmental impact (12). It is more than simply deleting what does not work. The UK
Sustainable Development Council states that it is about shifting the field of choice for
mainstream consumers: removing unnecessarily damaging products and getting sustainable
choices on the shelves (13). This is important to achieve overall environmental
improvements (12). By reducing choice, the burden of responsibility is shifted from
consumers further upstream (e.g. to retailers or to foodservice managers) (12).
If the goal is to move consumers towards less environmentally damaging patterns of
consumption, choice reduction delivers. Across the United States, there are a growing
number of colleges and universities that have fair-trade coffee on the menu and use
renewably generated electricity. These options are often the only choice available on
campus (13). There has been an increase in social consciousness and environmental
stewardship on college campuses. One of the creative initiatives that have gained attention
over the past few years is trayless dining. An ARAMARK (leading United States
foodservice company) study of 186,000 meals at 25 colleges and universities found a 25 to
30 percent reduction in food waste per person on trayless days (54). Jonathan Bloom, an
author of American Wasteland and an independent food waste consultant, commented the
tray-free cafeterias “saves us from our own eyes being too big for our stomachs and forces
us to only take what we can carry” (55).
“Meatless Monday” is an international campaign that encourages individuals to eliminate
meat on Mondays to improve their health and health of the planet. It was introduced as a

15
public health awareness campaign that addresses the prevalence of preventable illness
associated with excessive meat consumption (56). Out of all colleges that have
implemented “Meatless Mondays”, University of California (UC) Davis’ “Meatless
Mondays” is regarded as one of the premiere pioneering programmes. The university’s
sustainable foodservice progress report 2012 stated that 680 UC Davis students pledged to
participate in this campaign. Meat was never entirely pulled off the menu but more
vegetarian options are offered on meatless days. At the end of each week, pledges were
tallied and a poster was created for the dining room that displayed the new total and how
much water, fossil fuels and carbon have been saved. According to the Sustainability
Manager of UC Davis, peer-to-peer education with students in dining halls is the most
successful method to spark debate and long-term change. She suggested framing the
language of meatless advertisements more as a celebration of food variety than as a
limitation on meat (57).
Each Monday provides a weekly chance to start fresh, making it an ideal day to begin new
initiatives. Two literature reviews led by colleagues at the Johns Hopkins Center for a
Livable Future demonstrated that the effectiveness of public health promotion could be
improved by leveraging on Monday as a day to begin healthy behaviour (58). A recent
study in the American Journal of Preventive Medicine showed a consistent surge in health-
related Google searches on Mondays over an eight-year period (59). This research has
added to a growing body of literature that Monday could be a powerful leverage point for
the promotion of healthy behaviour. This initiative acts as a public education effort that

16
seeks to overcome consumers’ “attitude-behaviour gap” with regards to environmental
behaviour (60, 61).
2.3.4 Potential additional positive effects of choice reduction
Recently, Lombardini and Lankoski (2013) conducted a study that discussed food choice
restriction as a food policy instrument, using a mandatory Helsinki School District weekly
vegetarian day. The research focused on whether restriction of food choice could
effectively change food consumption patterns. As pointed out by Botti and colleagues
(2008), individuals’ reactions to choice restriction could differ from compliance to
rebellion (62). Thogersen and Crompton (2009) suggested that if the intended behaviour is
maintained even when and where choice is not restricted, choice restriction produces
positive spillovers (63).
Social psychologists describe “positive spillover” as the effect of simple painless steps
leading to the adoption of more ambitious behaviour (63). This occurs when the adoption
of a particular behaviour increases the motivation for an individual to adopt other
behaviour. Individuals can be ushered onto a “virtuous escalator” as one pro-environmental
behavioural choice leads to another potentially more significant choice. This approach of
“hooking” individuals with a small simple request by encouraging them to consequently
accept a more difficult request is called the “foot-in-the-door” technique.
Choice restriction could also help individuals learn about their preferences by forcing them
to try different options when the preferred choice is restricted. In addition, the behaviour
17
could develop an individual’s positive attitude towards it and activate other pro-
environmental goals associated with the behaviour (64). Restriction could also make pro-
environmental goals more noticeable even in the absence of any communication campaign.
2.3.5 Potential negative effects of choice reduction
Choice restriction could produce unintended effects such as non-compliance (64) in the
restricted choice environment as well as boomerang effects (65), both in the restricted and
unrestricted environments.
Non-compliance occurs when individuals do not adopt the behaviour that the restriction
encourages. In the case of bans on soft drink vending machines in schools, students could
bring sodas from home, or in the case of a vegetarian school day, they may skip lunch.
When individuals do not comply, the intended effect would not be achieved and
undesirable adverse effects may emerge. Another scenario would be if students skip lunch,
they may not meet their nutritional requirements or they might eat more elsewhere during
the day (64). Other than non-compliance, choice restriction could produce boomerang
effects, which is a reaction opposite to the intended response of persuasion messages (65,
66).
Boomerang effects could be noticed in both restricted and unrestricted environments.
Instead of producing positive spillovers, negative spillovers could occur (64). For example,
it is possible that choice restriction could make individuals start to value restricted
behaviour more, or alternatively, given them the liberty to eat whatever they please

18
(psychological reactance) (66). According to the psychological reactance theory, if
individuals’ freedom were being reduced or threatened with reduction, individuals could
become motivationally aroused. This would presumably be directed against any further
loss of freedom towards the re-establishment of whatever freedom that they had already
lost or the ones that are being threatened (67). For example, in the case of the vegetarian
day, individuals could eat more fish and meat (64).
Other possible reasons for the boomerang effect or non-compliance could be that some
individuals disagree with the motivation for choice restriction or do not believe in the
ability of the intervention to achieve other benefits, such as reduce environmental impacts.
There are many potential benefits to reducing choice. However, there are attitudinal
barriers as individuals inherently enjoy having choice. To begin this discussion on the
possibility of menu choice reduction, current attitudes regarding choice reduction need to
be explored and understood in order to understand the barriers that individuals may have.
2.4 Exploring attitudes
Attitudes are challenging to define. Attitudes may influence behaviour and also possibly be
influenced by it (68). Even though attitude has been a difficult concept to define, research
on attitudes remain popular in many disciplines, not the least in the dietetics and
foodservice fields. Attitudes could also imply evaluation and are concerned with how
individuals feel about a certain topic (69). Measuring attitudes has an extensive history in
social psychology dating back to 1928 when Thurston published a paper titled “Attitudes
can be measured” (70).

19
At present the most common used methods are self-report measures such as the Likert and
Semantic Differential scales. The Likert scale requires individuals to rate the extent of their
agreement or disagreement with a set of statements about the attitude object (71).
Manstead and Semin (2001) argued that the strength of this scale is the capability to
capture different traits of attitude, ranging from beliefs to behaviour (72). However, there
are disagreements in the literature about the strengths and weaknesses of this scale (72, 73).
The Semantic Differential scale asks individuals to rate the attitude object on a set of
bipolar adjective scales (72). This is done by placing a tick or cross in one of the seven
spaces on each rating scale. The ratings are scored and scale scores are summed or
averaged to find out the overall index of attitude. These self-report measures have several
advantages such as their ability to assess psychological constructs in a relatively
economical way (72). However, they also have disadvantages. It is not always feasible to
collect self-report data discreetly as participants are always aware that they are under
investigation and as a result potentially modifying their responses. Q-methodology is a
more robust technique for measuring subjective opinions. It is also an appropriate and
relevant means of exploring and studying attitudes (68).
2.5 Q-methodology
Q-methodology incorporates the benefits of both qualitative and quantitative research (74,
75). It provides a foundation for the study of subjectivity, individuals’ viewpoints, opinions,
beliefs and attitudes (76). The method is designed to identify groups of participants who
have similar overall attitudes. It also assesses the differences of participants who have
other views (74, 77). By Q-sorting, individuals give their meaning to a set of stated

20
attitudes towards the research topic (76). It is often a pleasant task for respondents who
enjoy re-arranging attitude descriptors on the agree/disagree matrix until they are fully
satisfied (78). After the Q-sort, interviews focusing on the reasons why participants put
certain cards in the extreme positions are carried out (75). These serve as additional
qualitative information that would provide explanations for differences in the Q-sorts
between factor groups. A free programme (PQMethod version 2.35) is used for the factor
analysis (79). This shows similarities between participants’ sorting of the statements.
Participants with similar rankings of statements would load significantly on the same factor
as each other, revealing a pattern of statements that defines their subjective views (80, 81).
The results of Q-methodology are used to describe a population of viewpoints.
Q-methodology has become a popular method of investigating attitudes (68). In a time
when individuals’ willingness to participate in questionnaire-based research decreases, Q-
methodology could be a welcome alternative data collection approach (75). However, it
has been stated that the method may be time-consuming to participants (82). Q-
methodology has been applied in various disciplines such as medical and nursing, where it
is used to measure patients’ or professionals’ attitudes toward health-related issues (78, 83,
84). However, it has not yet been applied in dietetics and foodservice research.
There are a number of controversies surrounding Q-methodology. As Q-methodology is a
small sample investigation of human subjectivity based on sorting items of unknown
reliability, results from Q-studies have often been criticised for their reliability and the

21
possibility for generalisation (85). Given that the purpose of Q-methodology is to evaluate
an individual’s perspective, there is currently no external criterion to assess validity (86).
Q-methodology is not intended for large non-randomized participant samples (87) and
therefore the results from studies cannot be claimed to be generalisable (85, 88). However,
a representative survey could later be conducted to try and generalise the results to a wider
population, providing stronger external validity to the Q-study finding (89, 90). The
growing number of Q-researchers is accompanied by growth in Q-publications. In a recent
database search of Q articles, it was found that in the last 20 years there were 335
publications of which 196 were in the last five years (58%). One hundred and sixty-one of
these were peer-reviewed articles and 65 had been cited (80).
2.6 Concluding comments: defining and refining the research question
A good Q-methodological research question should take into account the nature of the
method. The research question should allow participants to tell the researcher what a topic
means to them in a particular scenario. It has been recommended that the Q-
methodological question should focus on either the (a) representation of a subject matter;
(b) understanding of it; or (c) conduct in relation to it (91). The research question for this
study focused on the understanding of the topic/subject matter. The study’s aims are to
explore the attitudes and perceptions around menu choice reduction and the possible
circumstances under which less food choice is acceptable. It is important to find out what
choice means to stakeholders of the case study residential college before making any
recommendations about the amount of choice on the college menus.

22
The research question guiding this study was:
“What does choice mean to you at the college’s meal times?”
This chapter reviewed the positive and negative effects of having choice, discussed choice
reduction as a means to improve the foodservice’s Triple Bottom Line performance (3Ps:
Profit, People and Planet). Q-methodology was also identified as an appropriate method for
exploring attitudes. The next chapter, Chapter 3, states the research objectives.

23
3. Objective Statement
A gap in existing literature provides grounding for this research. The majority of choice-
based studies have been structured in the psychology, economics and sustainability
literatures. There is no academic literature about choice reduction in the areas of dietetics
and foodservice. Internationally and locally (New Zealand), the majority of the university
residential college foodservices provide a wide variety of choices to university students.
However, there is increasing evidence that more choice does not automatically contribute
to more satisfaction. In addition, more choice is known to be contributing to the obesity
crisis and be economically and environmentally wasteful.
The current study seeks to develop an understanding of the dominant attitudes about the
potential of menu choice reduction initiatives in a college foodservice setting. It aims to
explore the attitudes and perceptions around menu choice reduction and the possible
circumstances under which less food choice is acceptable. It is important to find out what
choice means to stakeholders of the case study residential college before developing any
practical recommendations to improve the economical (profits), nutritional/psychological
(people) and environmental (planet) impacts of residential college foodservices.

24
4. Participants and Methods
The structure of a typical Q-methodology study was overviewed in Chapter 2. Key steps
are summarised in Figure 2 and include:
• identifying the concourse;
• developing Q-sort materials;
• identifying participants (known as the P-set) whose viewpoints/perceptions the
research aims to elicit;
• completing of the Q-sort activity by the P-set;
• factor analysis;
• factor interpretation of the data.
Figure 2: Practical steps used in Q-methodology
25
This chapter describes how each step of the process was carried out and why
methodological decisions were made at each step. Before doing this, the ethical
considerations within the research are discussed.
4.1 Ethical considerations
This study was carried out in accordance with the requirements of the University of Otago
Human Ethics Committee (D13/392) (see Appendix 1 for confirmation of ethical approval).
These ethical principles were the minimum requirement when designing the study and
liaising with participants, and were integral to all decisions. Participants were asked to
discuss their perceptions and attitudes around choice reduction. The interview sessions
were audio-recorded to allow the researcher to remember and accurately transcribe what
was said during the session. Participants were advised that neither the audio recordings, nor
the transcripts from the interviews would be shared with anyone outside the study. The
transcribed audio file was not labeled with the participant’s name for confidentiality
purposes. Throughout the research process, participants were reminded of their right to
withdraw from the research at any time without any disadvantage.
4.2 Identifying the concourse
The first step in Q-methodology was the collection of relevant ideas, beliefs and opinions
that relate to the research question (84). This collection was also referred to as “identifying
the concourse”. For the purpose for this study a variety of resources which included
academic literature, interviews, editorials and commentaries, internet sites and personal
web logs were accessed to identify the ‘concourse’. This procedure is a common practice

26
in Q-methodology literature (75, 81). The main aim was to provide a representative and
balanced coverage of statements in relation to the research question.
One-to-one semi-structured interviews (n=9) were conducted with college staff and
residents with the purpose of gathering a wide range of opinions on the possibility of menu
choice reduction. Sub section 4.2.1 states the recruitment method for these interviews.
Each interview was audio-recorded to allow the researcher to remember and accurately
transcribe what was said. After these interviews, a list of general statements that represent
the spectrum of attitudes surrounding choice reduction was generated. This list of
statements was combined with other statements gathered from the literature search.
4.2.1 Recruitment method for semi-structured interviews
Purposeful recruitment using a convenience sampling technique was used to recruit both
college staff and residents. The Foodservice Manager was the main contact for recruitment
of college staff. Residential Assistants were asked if they would make recommendations on
which residents to approach. The selection criteria are stated in Table 1.

27
Table 1: Selection criteria for college staff and residents
Selection criteria
• Age > 18 years
• Individuals likely to offer a broad range of opinions on choice reduction
(for example: different political affiliations, different activities such as
sport and environmental interests)
• Even proportion of males and females
• Diverse ethnic groups (New Zealand European, Maori, Pacific Islanders, Asian)
• Various job positions within the college (staff)
o College warden
o Foodservice manager / head chef / staff
• A range of disciplines of study (residents)
Nominated potential participants were given the researcher’s contact details to follow up if
they were interested in further information. Individuals who expressed interest were
emailed an information sheet (Appendix 2), after which the interview date and time
(Appendix 3) were agreed upon. All interviews took place at the residential college. At the
start of the session participants were asked to sign the consent form (Appendix 4). The
researcher’s interview protocol (Appendix 5) guided each session. The protocol contained
questions such as, “What does choice and choice reduction mean to you?” and “When do
you think choice would be demotivating”. Nine participants were interviewed: 65% were
female, 34% were male. Upon completion of the semi-structured interviews, participants
were offered a coffee and chocolate voucher. They were asked to sign a form to state they
28
had received the voucher (Appendix 6). Once the researcher was confident with the
resulting concourse, development of the Q-set began.
4.3 Development of Q-sort materials
4.3.1 Q-set
Selection and formulation of a set of meaningful statements resulted in a Q-set. A Q-set of
between 40-80 items is the accepted standard (91). A smaller Q-set tends to threaten claims
of adequate/comprehensive coverage whilst a large Q-set can make the sorting process
very demanding (91). Q-methodologists recommend that the initial Q-set contain a large
number of statements, which can be refined and reduced through pilot testing (92). In the
current study, 74 statements were generated in total (Appendix 7).
The aim of pilot testing was to achieve optimum balance, clarity, appropriateness,
simplicity and applicability (93). Five individuals pilot tested the 74 statements to ensure
clarity and general comparability. They were asked during each Q-sort to explain their
understanding of the statements and describe their thought processes as they ranked the
cards. This helped to clarify the wording of individual statements, reduce statements that
were duplicated, generate new ideas and make sure that the Q-set was balanced. It
highlighted the importance of valuing participants’ interpretation of each statement rather
than being confined by literature search (83). After pilot testing the number of statements
was reduced to 42 items. The researcher also considered a Q-set of 42 items as ideal in

29
order not to make the Q-sorting process too time-consuming. The final statements were
randomly numbered and printed on separate cards (Appendix 8).
4.3.2 Range and slope of distribution
It is important to get the range and slope of the distribution right as it helps the participants
to feel comfortable. Brown (1980) suggested an 11-point (-5 to +5) distribution for Q-sets
numbering 40-60 items. For this study with a Q-set of 42 items, an 11-point distribution (-5
to +5) was used (Figure 3). A Likert scale measure was used as fixed choice response
formats to allow participants to express how much they agree or disagree with the
statements in the Q-set: -5 represented strongly disagree while +5 strongly agree (71, 94).
Figure 3: Q-sort table for rank ordering Q-set statements
A shallower or more flattened distribution (Figure 3) was chosen over the steeper
distribution as it offers a greater opportunity to make fine-grained discriminations at the
extremes of the distribution. This strategy allowed for maximising the advantages of the
participants’ topic knowledge (93). This is important for the present study, as the aim is to
explore attitudes and perceptions of choice reduction strategies and find out what is
acceptable in such a residential college foodservice.

30
4.4 P-set participant recruitment method for Q-sort activity
All participants interviewed for the semi-structured interviews (Section 4.2.) were invited
to continue in the Q-sort activity. Similar selection criteria to the first part of the study
(Table 1, sub section 4.2.1) were applied in this step. Additional recruitment strategies
were advertisements (Appendix 9) on college notice boards, personal approaches from the
researcher to residents at meal times, and a supportive email from the warden to all
residents. Residents who emailed the researcher for further information received an
information sheet (Appendix 10) via email, and those contacted at meal times were handed
an information sheet. Throughout the recruitment process, the researcher attempted to
recruit participants of different genders and ethnic groups. Purposive sampling typically
relies on the concept of “saturation”, or the point at which no new information or themes
are observed in the data (95). Data saturation was reached in this study after 35
respondents had completed the Q-sort activity. At this stage, the researcher observed that
participants were not sorting the Q-set in significantly different ways, nor was new
information emerging in the post-sort interviews about why participants had sorted the
cards in the way that they did. Thus, the decision was made to cease data collection. Of
these 35 participants, 65% were female and 35% male. This smaller number of male
participants typifies what other studies have found; that men are less likely than women to
participate in research (96).
A practical advantage of Q-methodology is that it requires a relatively small sample of
participants (75). Q-methodological studies are designed to sample from a universe of

31
perspectives rather than from a population of people (97). Therefore representativeness
does not depend on a large number of participants. It is about finding participants who
have a defined viewpoint to express and more importantly those whose viewpoint matters
in relation to the subject at hand (98).
4.5 Q-sorts activities
Participants recruited for the Q-sort activities were involved in a one-to-one session with
three activities (a) Q-sort, (b) post Q-sort interview and (c) short survey. Sessions took
place in the residential college’s tutorial rooms and lasted 30 to 45 minutes. The
researcher’s interview protocol (Appendix 11) guided each session. The activity consisted
of three key steps as the following subsections describe in turn.
4.5.1 Q-sorts
At the start of the session, participants were asked to read the information sheet (Appendix
10) and sign the consent form (Appendix 12). Q-methodology was defined and instructions
(Appendix 13) were provided on how to perform a Q-sort. The Q-set (Appendix 8) was
presented in a random order. Participants were asked to read cards and divide them into
three piles: one pile for the statements with which they agreed, one with which they
disagreed and one that they felt neutral about. They then placed cards from the “agree” pile
at the right-hand end of the distribution with highest rankings given to the statements with
which they most strongly agreed. The same procedure was followed for both “disagree”
and “neutral” piles. Participants were encouraged to move cards within the distribution
until all positions were filled and they were fully satisfied with their final placements (75).

32
Once the participant was satisfied with the final distribution, the completed Q-sort was
photographed (Appendix 14).
4.5.2 Post Q-sort interview
Following the completion of the Q-sorting process, a post Q-sort interview was conducted
to increase the richness and quality of the data (99). The interview allowed the researcher
to explore each participant’s wider understanding of the issue, to understand why they
sorted the items as they had and get them to focus on the meaning and significance of the
items (93). The researcher followed the “post Q-sort interview guide” (Appendix 15),
which contained questions such as “[with reference to the statements ranked at the
extremes] What do these statements mean to you?”, “Why do you feel so strongly about
these statements?” and “Could you tell me about why you placed them here?”. After
discussing the statements at the ends of the distribution, the focus shifted to the other items
more central in the distribution. Participants were also asked about their experience of
participating in the Q-study. Each interview was audio recorded to allow the researcher to
remember and accurately transcribe what was said.
4.5.3 Short survey
Participants provided demographic information such as gender, age, ethnicity, discipline of
study and dietary requirements (Appendix 16). Upon completion of Q-sort activities
participants were offered a coffee and chocolate voucher. They were asked to sign a form
to state they had received the voucher (Appendix 6).
33
4.6 Factor analysis
The inverted factor analysis considers the holistic picture of how the statements were
sorted (ranked). Participants with similar ranking of statements loaded significantly on the
same factor. This revealed a pattern of statements that expressed their subjective views
(80).
4.6.1 Data analysis programme
The programme used for this study is an established computer software package called
PQMethod 2.35. It is a free programme that is available from the Q-methodology page (79).
All the instructions needed for the programme are available in the manual (available from
the Q-methodology page). This package standardises and automates data analysis, thereby
enhancing the method’s feasibility for researchers.
4.6.2 Coding procedures
Table 2 contains the information used to code participants. For example a participant coded
R05F1NZG: R05 stands for participant 5 is a resident of the college, F stands for gender:
female, 1 stands for age group: 15-20 years, ethnicity: New Zealand European and she is
on a special diet: Gluten Free.

34
Table 2: Coding for Q-sort participants
Stakeholder Gender Age Group Ethnicity Special Diets
Resident R Female F 15 – 20 years
1 Asian A Allergies A
Foodservice Staff
FS Male M 21-25 years
2 Maori M Gluten free
G
Others (e.g. warden)
O 26-30 years
3 New Zealand European
NZ Normal -
31 years and older
4 Others O Vegetarian V
4.6.3 Correlation matrix
Firstly, a correlation matrix of all the Q-sorts was calculated. It is a by-person factor
analysis to explore attitudinal groupings. It includes all the Q-sorts that had been gathered
and therefore all the viewpoints the participants had produced. It represents 100% of the
meaning and variability present in the study (98). The correlation matrix was subjected to
factor analysis with the purpose of identifying the number of Q-sort groupings that are
similar or dissimilar to one another. It examined the number of different Q-sorts (100).
Participants with similar views shared the same factor.
4.6.4 Centroid factor analysis over principal component analysis
Two different types of factor analysis that are often used in Q-studies are centroid factor
analysis and principal component analysis (98). The main difference between these
techniques is the way that variance is dealt with (101). Centroid analysis was chosen as it is
considered the most favoured method of factor extraction among experienced Q-
methodologists (83) because of the permissiveness that it allows for data exploration (102).

35
It leaves all possible solutions open and allowed the researcher to explore possibilities
through rotation. A factor loading was determined for each Q-sort showing the extent to
which each was associated with each factor (76). Watts and Stenner (2012) proposed that
seven factors is the default number for factor extraction in PQ method (98). Table 3 shows
states the statistical and theoretical guidelines followed in this study for factor extraction.
Table 3: Statistical and theoretical guidelines followed in this study for factor extraction
• Eigenvalue is indicative of a factor’s statistical strength and explanatory power(98). Only factors with an eigenvalue greater than 1.00 should be retained (100) as eigenvalue of less than 1.00 are classified as insignificant to warrant further investigation.
• Factors should have at least two Q-sorts that load upon it alone (87). • A Q-sort should be considered significant in terms of loading upon a factor based on the
statistical calculation of p<0.01 = 2.58 X (1 / √number of statements) (100, 102). o According to Watts (2012) and Brown (1980), for the purpose of this study, the level
of significance was calculated as 2.58 X (1/√42) = 0.3981 rounded up to 0.40 (100, 102).
o Confounded Q-sorts (which load significantly on two or more factors) were excluded (87).
• Factors with a combined variance of over 40% across all factors are considered to be a sound solution (87).
4.6.5 Varimax rotation
After the factor extraction, a factor rotation was carried out to simplify the findings and
enhance interpretability of the results (90). The varimax rotation was chosen with the
purpose to maximise “the purity of saturation” (90). It is an objective and reliable approach
that can be used easily and effectively with larger data sets (102). It is also a preferable
choice if the majority of the viewpoints are of major concern. After conducting the rotation,
PQMethod ran a new PQROT program (79). This brought up a screen with all of the Q-
sorts’ loading. For each factor, Q-sorts that loaded positively or negatively on one factor

36
were flagged (this was done by using an algorithm in PQ method software). It was
important to flag the Q-sorts, as the final description of each factor would be based on a
weighted average of those flagged Q-sorts (103). After flagging the values, three factors
emerged. The endpoint of the quantitative analysis was reached when each of the selected
factors is represented by a “factor array”. This represents a statistical best estimate of the
views of all the Q-sorts clustered on the factor. These factors arrays were then interpreted
(87).
4.7 Factor interpretation and communication
The aim of Q-methodology is to understand and explain the view of attitudes and
perceptions represented by each factor (91). The order and structure of a factor
interpretation is a vital element to communicate the information analysed from the factor
extraction. As a means of communicating the factor interpretations, factors were given
names, as it helped capture the main essence of the viewpoint for the factor (104). A
narrative style was adopted to present the factors. Factors were interpreted by (a) shared
viewpoints, (b) distinguishing statements, and (c) through transcribed interviews.
4.7.1 Shared viewpoints
Q-methodology considers statements that have shared viewpoints (consensus amongst the
different factors). These consensus statements are useful as they indicate to the researcher
that there are areas in the topic that participants agreed and disagreed on. They may
agree/disagree positively, negatively or be neutral about the topic (80).

37
4.7.2 Distinguishing statements
Other than looking at the statements that have consensus, Q-methodology considers
statements that distinguish one factor from another. Each factor’s distinguishing statements
with significance of p <0.01 were considered. The definition for distinguishing statement is
one that contributed to a factor by its placement in a “most agreed” position for that factor,
and its position/loading was significantly different to its placement in other factors (80).
4.7.3 Addition of qualitative comments from Q-sort activities
Factor interpretation was further enhanced through the addition of qualitative comments
made by significantly loading participants during the Q-sort activity. Information gathered
from Q-sorts and post Q-sort interviews were transcribed (104). Transcribed interviews
were grouped according to the participants that loaded onto each factors. Including the
participant’s own words was a simple and effective way of strengthening the first-person
nature. It was also a useful way of reinforcing the accuracy and efficacy of the researcher’s
own interpretation of specific item ranking. Interviews increased validity of the Q-
methodological study by providing the participant’s rationale for the analysis of the factor
array (99, 103). It was important to note that the interpretation would have to express what
was impressed into the array. The final product would not be perfect but every effort was
made to produce a fair and faithful representation of the various factor’s viewpoint (104).
Detailed results about the factor interpretation are now described in the following results
chapter, Chapter 5.

38
5. Results
The previous chapter outlined the processes of factor extraction employed in this study.
This chapter firstly details overviews the factors extracted, before moving on to discuss the
consensus statements (5.1). Detailed factor interpretation and results, including the
additional qualitative data gathered through participants’ comments from the Q-sort
activity, are then presented for each of the three factors in turn (5.2, 5.3 and 5.4). The
chapter concludes (5.5) with a short section on participant feedback of their experience of
participating in the Q-sort activity. Overall, 35 participants, of which 12 were male and 23
female (Table 4), completed the Q-sort activity and the demographic questionnaire.
Table 4: Demographic data of the participants involved in Q-sort
Number of participants Percentage Gender Male Female
0 12 23
(34%) (66%)
Age group 15 - 20 years 21 – 25 years 26 – 30 years 31 years and above
24 5 2 4
(69%) (14%) (6%) (11%)
Ethnicity New Zealand European Asian Maori Others
29 1 3 2
(83%) (3%) (9%) (5%)
Role in the college Resident Foodservice staff Others (i.e. College warden)
29 4 2
(83%) (11%) (6%)
Dietary Requirements Normal Vegetarian Others (i.e. Allergies, Gluten Free)
23 5 7
(65%) (15%) (20%)
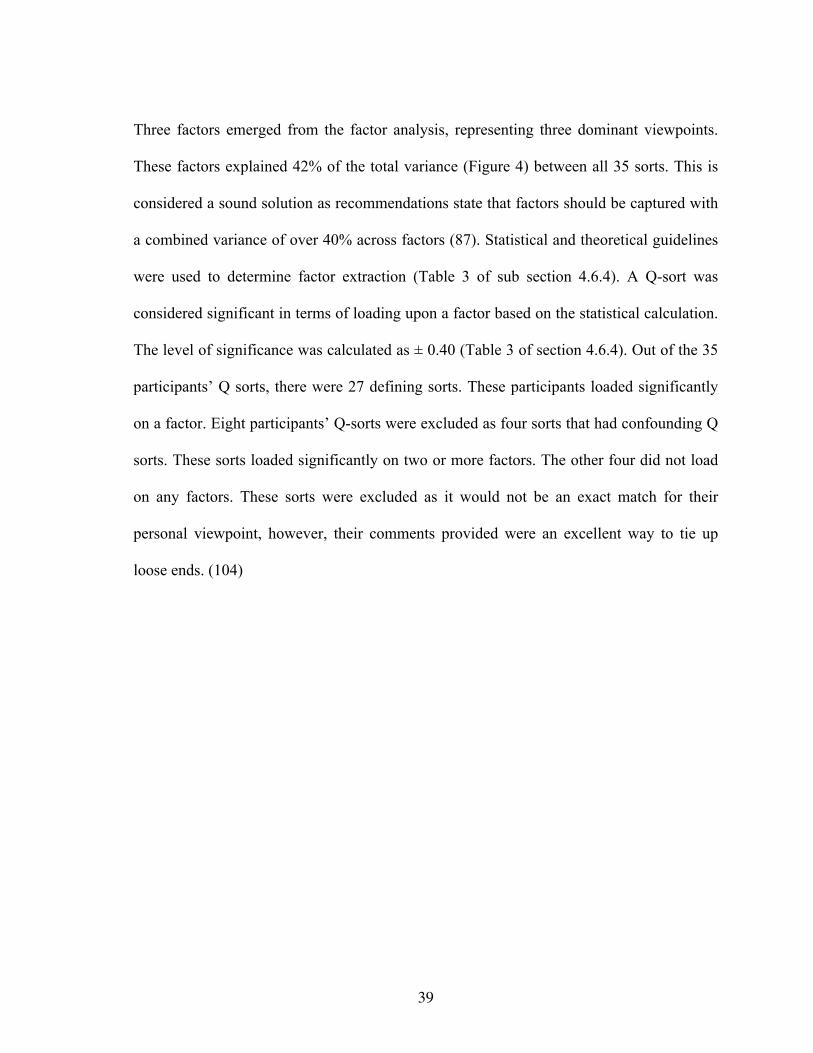
39
Three factors emerged from the factor analysis, representing three dominant viewpoints.
These factors explained 42% of the total variance (Figure 4) between all 35 sorts. This is
considered a sound solution as recommendations state that factors should be captured with
a combined variance of over 40% across factors (87). Statistical and theoretical guidelines
were used to determine factor extraction (Table 3 of sub section 4.6.4). A Q-sort was
considered significant in terms of loading upon a factor based on the statistical calculation.
The level of significance was calculated as ± 0.40 (Table 3 of section 4.6.4). Out of the 35
participants’ Q sorts, there were 27 defining sorts. These participants loaded significantly
on a factor. Eight participants’ Q-sorts were excluded as four sorts that had confounding Q
sorts. These sorts loaded significantly on two or more factors. The other four did not load
on any factors. These sorts were excluded as it would not be an exact match for their
personal viewpoint, however, their comments provided were an excellent way to tie up
loose ends. (104)
40
Figure 4: Factor matrix with an X indicating a defining sort
Each factor was named based on a thematic summary of the distinguishing statements
(Figure 5). A summary of the shared viewpoints was presented in Table 5 (section 5.1)
followed by distinguishing statements in Table 6 (section 5.2), Table 7 (section 5.3) and
Table 8 (section 5.4). The full list of statements sorted by consensus (Appendix 17),
distinguishing statements for factor 1 (Appendix 18), factor 2 (Appendix 19) and factor 3
(Appendix 20) can be retrieved from the appendix.

41
Figure 5: Typifying the descriptions for the 3 factors
5.1 Shared viewpoints (consensus) !
Shared viewpoints informed the researcher that there were common areas in which
participants did and did not agree (section 4.7.1). Table 5 presents statements that had
approximate consensus across two or all three factors. There were several statements that
all three groups agreed or disagreed with. The items in the Q-sort on which the factors have
agreed most have stimulated the greatest consensus. An example on how data in Table 5
was interpreted is: Statement 5 “The more choices I have, the more satisfied I am”,
participants that loaded to both factors 2 and 3 marginally agreed with this statement.

42
However, participants that loaded to factor 1 had an opposite view to this statement. They
marginally disagreed with this statement.
All 3 factors had neutral views with the statement that “Reducing choice contributes to
environmental sustainability”. Both factors 2 and 3 strongly agreed with the statements “I
don’t need everything that’s offered” and “Having a wide variety of choice builds
expectations that there will always be a wide variety of choice”. These factors marginally
agreed that “The more choices I have, the more satisfied I am”. However, these factors
strongly disagreed with the statements “I feel overwhelmed when there’s more than one
choice”, “There are too many choices on the menu” and “I prefer not to have a choice, I’d
rather there was just one dish on the menu”. Both factors 1 and 2 disagreed that “Having a
wide choice doesn’t make any difference to my enjoyment of a meal”. However, these
factors strongly agreed with the statement “Because of the huge variety of choice available,
I tend to take more than I need”. Both factors 1 and 3 strongly disagreed that “Making
choices is hard, so I choose what my friends have”.

43
Table 5: Factor Q-sort values for statements sorted by shared viewpoints (consensus)
Stat no.
Statement Factor 1 Factor 2 Factor 3
28. Reducing choices contributes to environmental sustainability
0 0 0
4. I don’t need everything that’s offered 3 4 4
2. Having a wide variety of choice builds expectations that there will always be a wide variety of choice
2 3 3
3. I feel overwhelmed when there’s more than one choice
-3 -4 -4
19. Having a wide choice doesn’t make any difference to my enjoyment of a meal
-2 -2 -1
29. Making choices is hard, so I choose what my friends have
-5 -3 -5
7. There are too many choices on the menu -3 -4 -4
37. I prefer not to have a choice, I’d rather there was just one dish on the menu
-3 -5 -5
5. The more choices I have, the more satisfied I am -2 1 1
24. Because of the huge variety of choice available, I tend to take more than I need
5 5 0
Note: Shaded boxes are statements that had consensus across two or all three factors
5.2 Factor number 1: The “Believers” (believers in the benefits of choice
reduction – environmentally, nutritionally and socially aware)
Factor 1 had an eigenvalue of 11.75 and explains 16% of the study variance. Ten
participants (participants R02M2NZ, R03F2NZV, R04F2NZ, R05F1NZG, R06F1NZ,
R07F1NZA, R08F1NZV, R09F1NZ, R10F1NZ, R12F1NZG) (Table 2 of section 4.6.2 for
coding procedures) were significantly associated with this factor: nine females and one
male. All the participants were residents of the colleges. Five of the female participants

44
were on special diets: two of which were vegetarian, two were gluten free diet and one had
allergy to fish. The rest of the participants were on normal diets.
Table 6: Distinguishing statements for factor 1
Statements Factor 1 Factor 2 Factor 3 34. The choices I make depend on the healthiness of the meal
5 -1 -2
36. I would not mind having the vegetarian option once a week
4 -1 1
39. I am willing to try different dishes based on vegetable protein
4 -2 2
22. Reducing choice could reduce food waste 4 2 -2 23. Reducing choice reduces my food consumption 1 0 -1 26. Reducing choice could create negative perceptions about the college
1 2 3
25. Reducing choice would make my meal decisions easier
1 0 -3
1. Too much choice makes it hard to decide what to have
0 -1 -4
27. Reducing choice would be disappointing -1 3 4 8. I don’t have a choice when I am living at home so I really enjoy the wide choice here
-2 4 2
5. The more choices I have, the more satisfied I am -2 1 1 7. There are too many choices on the menu -3 -4 -4 37. I prefer not to have a choice, I’d rather there was just one dish on the menu
-3 -5 -5
Note: “-5” represents strongly disagree and “+5” strongly agree Distinguishing statements had a significance level of p<0.01 For statement 34, participants who loaded on factor 1 strongly agree (+5) that they made
choices that depended on the healthiness of the meal. The other two factors had a
completely different view. Both factors 2 and 3 (-1 and -2 respectively) disagreed with this.
Participants that loaded on factor 1 commented “I am concerned about my health; therefore,
I make healthy food choices.”. Some participants knew the benefits of healthy eating.
“Being healthy is important to me as I would be able to function better mentally. This

45
would contribute to my academic/sport performance.”. They commented that with the
college foodservice environment that they are in, they are able to make a healthy choice. “I
am able to make a healthy choice with the food choices provided to me.”. However,
sometimes when offered an unhealthy choice, for example foods that are high in fat, they
commented that they would choose not to have that. “If the meal choice presented looks
quite fatty or greasy, I would not choose that.” Nonetheless participants commented that
they feel supported to make healthy choices, as a healthy option is always available.
For statement 36, participants who loaded on factor 1 agreed (+4) that they would not mind
having the vegetarian option once a week. The other two factors had different views.
Factor 2 marginally disagreed (-1) while factor 3 marginally agreed with this statement.
The male participant commented, “I would not mind having the vegetarian option once a
week, as I understand how meat production can be harmful to the environment.”. This
participant is enrolled in an environmental science programme at the University. The
majority of the participants that loaded on this factor were females. The participants
commented that they are willing to have the vegetarian option once a week based on the
following reasons:
• “Meat can be really expensive”;
• “Having more vegetables could be more beneficial to your health”;
• “I don’t need to have red meat every single day”;
• “My family often have vegetarian meals once or twice a week”;
• “Meat portion given are usually huge and I end up throwing it away. The portion

46
size of the vegetarian meals would be sufficient for me”;
• “I enjoy having vegetarian meals such as lentils, vegetarian quiches and lasagna”;
• “I don’t think people realise that you can make very delicious vegetarian dishes”.
There were also many females who were on normal diets who opted for the vegetarian
rather than meat option. Foodservice staff accommodated this request if there was
sufficient food for residents who were registered as vegetarians. Some of them commented
that sometimes the portion sizes of the meat given could be too large. This is further
supported when participants who loaded on factor 1 agreed (+4) that they were willing to
try different dishes based on vegetable protein. Factor 3 had similar views (+2) as factor 1.
However, factor 2 had a different view. Participants that loaded onto factor 2 disagreed (-2)
with this statement.
For statement 22, participants who loaded on factor 1 agreed (+4) that reducing choice
could reduce food waste. Factor 2 had similar views (+2) as factor 1. However, factor 3
disagreed (-2) with this statement. The participants that loaded onto factor 1 agreed with
this statement as many of them quite often take more than what they need due to the appeal
of different meal options and the large portions served. This resulted in having to throw
away what they could not finish. “I know that I quite often take more than what I need and
in reality I am not that hungry. I would not finish what I have taken.” Participants shared
that they could see the benefits of choice reduction. “I think that if there is a reduction in
the number of choices, people would think twice if they really need it or if they are hungry.
They wouldn’t be able to overeat.”

47
For statement 23, participants who loaded on factor 1 marginally agreed (+1) that reducing
choice reduces their food consumption. Both factors 2 and 3 had similar views (0 and -1
respectively). Participants that loaded onto factor 1 commented that “Because of the wide
variety of choices available, I tend to desire to try a little of everything. Therefore, with
less choice available, I would not have the opportunity to do that.”.
For statement 26, participants who loaded on factor 1 marginally agreed (+1) that reducing
choice could create negative perceptions about the college. Factors 2 and 3 had slightly
stronger opinions (+2 and +3 respectively) with the statement. Despite having participants
that agree with this statement, some participants stated that this statement might not be true.
“I believe that the foodservice staff will have the expertise to reducing choice but yet
maintain the quality of the meals” and “I am sure that the foodservice staff are trained to be
diverse with their cooking ability. I am confident with their skills.” This comment was
further supported when participants marginally disagreed (-1) that reducing choice would
be disappointing. Participants commented that reducing choice might not be disappointing
as resources such as time and money can be put towards making better quality meals.
Participants commented, “I don’t think reducing choice is a bad thing especially around the
amount of carbohydrates options” and “We have so much choice available here. I didn’t
expect to have so many choices when I first chose this college.”.
For statement 1, participants who loaded on factor 1 had neutral (0) views that too much
choice makes it hard to decide what to have. However, they marginally agreed (+1) that

48
reducing choice would make their meal decisions easier. The other two factors had
different views on this. Factor 2 had neutral views (0) while factor 3 disagreed (-3) with
this statement. Factor 1 participants commented, “I treat meal times like a buffet. Therefore
with lesser choice available I would not able the pile up my plates by taking more than
what I actually need.”. Another participant also recognized the benefits of choice reduction
as she commented, “I don’t need everything that is offered. I would say that I know
rightfully that I don’t need it. But when there are a wide variety of choices sitting in front
of me, I will maximise the choices and just take it anyway.”.
For statement 8, participants who loaded on factor 1 disagreed (-2) that they do not have a
choice when they were living at home so they really enjoy the wide choice here. The other
two factors had different views on this. Both factors 2 and 3 agreed (+4 and +2
respectively) otherwise. The majority of the female participants that loaded onto this factor
disagreed with this statement. This is because when these participants lived at home, they
helped out with meal preparation and therefore had the opportunity to choose what they
would like to have. Participants who were on a special diet commented that sometimes it
would be easy to prepare their own meals as they would be able to prepare something that
they feel like having. The male participant view was similar to factors 2 and 3. The
participant commented, “When I am at home I would not have as much choice and even if
I had the choice I would not be bothered to prepare the meal.”.

49
For statement 5, participants who loaded on factor 1 disagreed (-2) that the more choices
they have, the more satisfied they are. The other two factors had different views on this.
Both factors 2 and 3 marginally agreed (+1 for both factors). Factor 1 participants
commented that “The more choices I have, the more satisfied I am. Well, I would not be. I
will only be satisfied with what I take and it has nothing to do with choice. It can be one
choice and I will feel satisfied.”.
For statement 7, participants who loaded on factor 1 disagreed (-3) that there are too many
choices on the menu. The other two factors had similar views on this. Both factors 2 and 3
disagreed (-4 for both factors) with the statement. Most participants who were on a special
diet disagreed with this statement as they would only have one main meal item provided
for them. However, they commented, “Sometimes it is easier having one choice as I would
just have what I am given.”. They did not seem to mind as long as the food tasted good.
Rather than complaining that they are only provided with one choice, they are grateful to
the foodservice staff for preparing a special meal for them. However, during the interviews
there were some participants that agreed that there are too many choices on the menu. This
caused them to take more food than what they usually have. The male participant that
loaded onto the factor 1 strongly commented, “Because of the huge variety of choice
available, I tend to take more than what I need.”. Therefore they felt that they do not need
everything that is offered.

50
For statement 37, participants who loaded on factor 1 disagreed (-3) that they prefer not to
have a choice but rather have just one dish on the menu. The other two factors had similar
views on this. Both factors 2 and 3 strongly disagreed (-5 for both factors) with the
statement. This statement was not applicable to participants who were on a special diet as
currently they were only provided with one main meal item.
5.3 Factor number 2: The “Resisters” (meat loving, hungry, choice
reduction resisters)
Factor 2 had an eigenvalue of 2.76 and explains 15% of the study variance. Ten
participants (participants FS04M3NZ, FS05F4NZ, R13M1NZ, R16F1NZ, R20F1AA,
R25M1M, R26M1NZ, R27M3NZ, R28M1NZ, R29M1NZ) (Table 2 of section 4.6.2 for
coding procedures) were significantly associated with this factor: three female and seven
males. Two of the participants were foodservice staff while the other eight were residents.
One participant was on a special diet.
Table 7: Distinguishing statements for factor 2
Statement Factor 1 Factor 2 Factor 3 41. I enjoy having the choice of toast and fruit throughout the day
3 5 2
12. I’m making the most of the wide variety in menu choice before going flatting
0 4 1
22. Reducing choice could reduce food waste 4 2 -2 38. I like a meal tray because I can take more food -4 1 -2 25. Reducing choice could make my meal decision easier
1 0 -3
39. I’m willing to try different dishes based on vegetable protein
4 -4 2
Note: “-5” represents strongly disagree and “+5” strongly agree Distinguishing statements had a significance level of p<0.01

51
For statement 41, participants that loaded onto factor 2 strongly agreed (+5) that they enjoy
having the choice of toast and fruit throughout the day. The participants loaded on the
other factors 1 and 3 had slightly similar views (+3 and +2 respectively). Factor 2
participants valued being able to access toast and fruit throughout the day. “I really do
value this as I know that in other halls of residences, you are not allowed to bring any food
out of the dining room and that’s horrible.”. A majority of the male participants enjoyed
having this option, as they tended to feel hungry in between meals. Participants tended to
have fruit as a healthier snack option. “I use fruit as something I can have to perk me up
when I am feeling down” and “I like having fruit available all day so that I don’t have to
snack on chocolate”. However, some participants enjoyed having this option but do not
make use of this due to the following reasons:
• “I do enjoy this, but I don’t really use it a lot as my room is further away from the
dining hall and therefore I can’t be bothered to walk to the dining hall”;
• “I don’t feel hungry in between meals”;
• “I don’t feel the need to snack in between meals”.
For statement 12, participants that loaded onto factor 2 agreed (+4) that they are making
the most of the wide variety in menu choice before going flatting. The participants loaded
on the other factors 1 and 3 had different views. Factor 1 had neutral views (0) while factor
3 had marginally agreed (+1). Factor 2 participants commented, “ I am making the most of
the food here as I am going flatting next year. I know that healthy foods will be expensive
and as a result would be preparing meals which are less healthy, therefore I am making the

52
most right now.”. However, participants shared that because of this viewpoint, they are
taking more than what they need and as a result have gained weight. “I do take more than
what I need as I want to make the most out of the meals before going flatting. “I put on
weight as I actually eat so much because of the availability of it. There is always toast,
milk, fruit and coffee machine” and “Ever since I came to this college, I have definitely
gained weight. It is because of the wide variety of choice available.”
When compared with factor 1 participants, factor 2 participants had similar views about the
statement that reducing choice could reduce food waste. They also agreed with the benefits
of choice reduction. They commented “The more choice available, the more I experiment
and try out new foods. However, if it doesn’t taste good, I throw it away. There is a lot of
food waste that goes down the rubbish” and “With a lot of choice I tend to take more than
what I need and sometimes have to throw away what I can’t finish. With less choice I
wouldn’t be able to take them.”.
For statement 38, participants that loaded onto factor 2 marginally agreed (+1) that they
like a meal tray because they can take more food. Majority of the male participants agreed
with this statement. They commented that a meal tray allows them to carry additional
plates and bowls. “I usually fill up my plates till they are pretty full. The foodservice staffs
do give us extra plates and bowls to put more food. This is where trays are helpful.”.
However, there were some participants that had opposing views. Participants shared “I
often end up with more food than I would want because I know that I can carry additional

53
bowls with the meal tray. Therefore I don’t particularly like it” and “I prefer not to have a
meal tray so that I would not overeat.”.
For statement 25, participants that loaded onto factor 2 had neutral (0) views that reducing
choice could make their meal decision easier. Participants that loaded onto factor 1
marginally agreed (+1) with this statement while participants that loaded onto factor 3
disagreed (-3) with this statement. Factor 2 participants commented “There is so much
choice available and sometimes I feel overwhelmed with the number of choices” and
“There is so much choice available and I have to try one of everything.”. Hence there
might be an opportunity for choice reduction initiatives to make meal decisions easier. This
view was supported by the comments from one of the foodservice staff. He commented
“The guys normally take too much food at dinner time and that contributes to a lot of waste.
They fill up their plates and want another plate for their salad. It is like having two meals.
Therefore I do agree that at dinner, probably it could be reduced, as there are too many
choices.”.
For statement 39, participants that loaded onto factor 2 disagreed (-4) when asked if they
would be willing to try different dishes based on vegetable protein. Participants that loaded
onto factors 1 and 3 had opposing views. Both factors agreed (+4 and +2) respectively with
the statement. A factor 2 female participant of Asian ethnicity disagreed with statements as
she commented, “I think that vegetarian meals would not be as filling.”. The comments
made by the male foodservice staff were very similar to the other male participants. “I

54
would not be willing to try vegetarian meals and if vegetarian meals were served, I would
not choose to come to this college.”. He also commented that “I need meat otherwise it
does not feel like one is having a meal.”.
The other comments made by male participants were as follows:
• “I am not keen at all for vegetarian meals and I think most guys will agree. I feel
happier when I have meat – it is more satisfying”;
• “I am a meat man. I come off a farm and I am used to my meat. It is a personal
view”.
5.4 Factor number 3: The “Emotives” (choice reduction opponents)
Factor 3 had an eigenvalue of 1.90 and explains 11% of the study variance. Seven
participants (participants FS02F3NZ, O02F4NZ, R11M1NZA, R15F1NZV, R17F1NZ,
R23F1NZ, R24M1M) (Table 2 of section 4.6.2 for coding procedures) were significantly
associated with this factor: five female and two males. Five of the participants were
residents, one of which was a foodservice staff and the other was the college deputy
warden. Two participants were on a special diet.

55
Table 8: Distinguishing statements for factor 3
Statement Factor 1 Factor 2 Factor 3 18. Knowing I’ll be able to choose my meal gives me something to look forward to
-1 0 5
9. Choice gives me freedom to choose what I want
2 3 5
17. Being able to choose what I want at meals influences my subsequent mood
-1 -2 3
39. I’m willing to try different dishes based on vegetable protein
4 -4 2
36. I wouldn’t mind having the vegetarian option once a week
4 -4 2
Note: “-5” represents strongly disagree and “+5” strongly agree Distinguishing statements had a significance level of p<0.01 For statement 18, participants that loaded on factor 3 strongly agreed (+5) that when they
know that they will be able to choose their meal, it gives them something to look forward
to. Participants that loaded on both factor 1 and 2 had different views with factor 1
marginally disagreeing (-1) and factor 2 having neutral views (0). Majority of the female
participants that loaded on factor 3 commented that they have a strong love for food
therefore knowing that they will have the ability to choose their meal gives them
something to look forward to. A participant commented, “Sometimes if you know that you
are having a bad day, just knowing you have a nice meal, gives me something to look
forward too.”. They related food as a means of self-reward. Participants also related meal
times at the dining hall as an opportunity for social interaction. “I enjoy coming to the
dining hall at meal times as it is an opportunity for me to catch up with my friends.”. These
views were supported when participants that loaded on factor 3 agreed (+3) that being able
to choose what they want at meals influenced their subsequent mood.

56
For statement 9, participants that loaded on factor 3 strongly agreed (+5) that choice gives
them freedom to choose what they want. Participants that loaded on both factor 1 and 2 had
similar views (+2 and +3 respectively). Factor 3 participants mentioned that choice allows
them the freedom to choose what they want in various circumstances. “I love being able to
choose. When there are two options (i.e. red or white meat) available, I find it quite
exciting”, “When I don’t feel like having red meat at that time, I will be able to choose
another option” or “Especially when I am sick, I am not going to have a big meal. I will be
able to choose another option such as soup.”. However, participants recognised that
“Having a wide variety of choice brings about a mindset and sets a high expectation that
there is always going to be a wide variety of choice.”.
Statements 39 and 36 were not discussed as participants shared similar views with
participants in factor 1 (section 5.2). Participants were generally open to the idea of having
vegetarian option once a week and they are willing to try out various vegetarian proteins.
5.5 Feedback about Q-methodology
Given that it is a new methodology in the context of foodservice and dietetics, it was
deemed important to assess participants’ experiences in completing the tasks demanded of
them. A majority of the participants enjoyed Q-methodology. They did not find the Q-
sorting process time consuming. Initially, they felt overwhelmed with the number of cards
presented to them. However, upon reading the instruction provided (Appendix 13), they
did not have difficulty understanding the procedure. Since the Q-sort process was
57
conducted in the presence of the researcher, the researcher became more familiar with the
participants’ feelings about the topic. The participants commented the following:
• “I enjoy being able to sort out the cards. I can relate with many of the statements.”
• “It is an interesting exercise to look at the statements and categorise them.”
• “This method allowed me to sort the cards by my perception of what choices mean
and provide for us.”
However, there were several participants who had other emotions evoked.
• “I feel frustrated after sorting as I have some strong views that I agree with but I
can’t seem to sort them at just one side.”
• “I found it hard to sort out the statements as I am on a special diet and there were
statements that were not relevant to me.”
In conclusion, this chapter has clearly listed the three factors that emerged from the factor
analysis, representing three dominant viewpoints (Believers, Resisters and Emotives). The
next chapter, Chapter 6, discusses the relationship between the study’s results and the
extant literature.

58
6. Discussion and Conclusion
This chapter critically discusses results and states the research conclusions. The Triple
Bottom Line framework (3Ps) introduced in the literature review (section 2.3) is used to
critically discuss the results in Chapter 5.0. The conclusion section (section 6.5) includes
the strengths (sub section 6.5.1) and limitations of the research and outlines areas for
further research (sub section 6.5.2).
Choice reduction is not a new phenomenon and residential halls’ foodservices have already
introduced a range of choice reduction initiatives (though they have not until now been
referred to using this specific terminology). Colleges focus on the best interests of their
residents by planning menus to meet their health and social needs. Food choices are based
on food availability and cost, food safety and nutritional value (105). Examples of choice
reduction initiatives that had already been made at the case study college prior to the start
of this research project included reducing the number of days dessert is served each week
and pre-portioning chicken into eight instead of four portions so residents can choose one
or two pieces. Another example of an already established forced choice initiative was the
introduction of smaller dinner plates. These changes have reportedly contributed to both
financial savings for the college and have had nutritional benefits for the students. A
somewhat unconventional, but equally valid, example of choice reduction in the college
setting is that individuals who are on a special diet are already on a choice reduced menu as
they only receive one main meal item.

59
6.1 Profits: choice reduction for economical benefits
The case study college foodservice has a good reputation so some participants were
concerned that reducing choice could create negative perceptions about the college.
Interestingly, participants in factor 1 (Believers) commented that this statement might not
be true. Decreasing choice would not mean that the quality is decreased. Rather, quality
might increase as chefs could focus less on quantity and more on quality. Money saved
from producing fewer options could contribute to increased quality. Meals that are of
higher quality could also contribute in a decrease in food waste.
Participants in factors 1 (Believers) and 2 (Resisters) could relate to the benefits of choice
reduction as it could possibly reduce food waste. Reducing food waste is beneficial for not
only the environment but it brings about financial savings. Again, factor 2 (Resisters) could
potentially see this benefit. The current choice allows them to experiment and try out new
foods. However, they agreed that they have the tendency to throw out more food. Botti
(2006) mentioned that when consumers go through the decision process of choosing their
preferences, they could be affected by contextual influences. In this study, for example,
this could be being influenced by how much individuals around them take. Food waste data
was not collected in this study as it fell outside the scope of the project. Residents in the
case study college pay college fees at the beginning of the year so they do not know how
much the food is costing. Therefore, they have the reason that they can take how much
they want. If residents take huge quantities of food, this may encourage the kitchen to
supply more food, which would cost the residents more (for example increased college

60
fees). With choice reduction, it may be possible to reduce the cost of the service.
Participants in factor 2 (Resisters) enjoy having a meal tray as it enables them to take more
food. This could potentially contribute to an increase in food waste that results in wasted
money. Worldwide, it has been estimated that over 1.3 billion tonnes of food, worth
approximately US$1 trillion is contributed by food wasted in production and consumption
system (29). Some participants within factor 2 (Resisters) commented that they preferred
not to have a tray as it allows them to take more food than what they realistically need.
Therefore, removal of meal trays could potentially contribute to a reduction in food waste.
6.2 People: choice reduction for social benefits
Nutritional benefits of reducing choice
Participants who loaded onto factor 2 (Resisters) experienced the consequences of having
too much choice made available to them. Some of them gained weight, although this could
be caused by other factors such as changes in eating and exercise behaviours (18) and
psychological stress (106). According to Loewenstein (1991), individuals tend to be
shortsighted when they face choices between immediate gratification (e.g. being greedy
and experiencing possible weight gain) verses long-term gains (e.g. healthy lifestyle habits)
(27).
A wide range of choices available could possibly lead to individuals loading up their plates
(32) which could in turn lead to an increase in their food consumption. Home economics in
the New Zealand education curriculum exposes individuals to evaluate current issues and

61
theories of nutrition (41). Although this is in New Zealand’s education system, the issues
and nutrition lessons appear to be forgotten or overlooked when an individual is faced with
wide choice and unlimited quantity. Individuals constantly succumb to the temptation of
wide availability and accessibility to food. Results from this study showed that with the
wide availability of choice, individuals treat meal times like a buffet. They tend to pile up
their plates by taking more than what they actually need. These results reflect Levitsky and
colleagues’ research that states when larger amounts were served, there was significantly
greater amount of food consumed (107). Participants who loaded onto factor 1 marginally
agreed that reducing choice reduces their food consumption.
Choice reduction could help to rectify New Zealand’s problem of oversized portions.
Results from the study did show that with increased choice individuals tend to over-
consume and the foodservice would be partly responsible. These individuals know that
they do not need to have everything that is offered. However, due to the wide variety of
choice, they want to maximise the choices. They enjoyed having a large variety as most of
them pointed out that they would be flatting in the following year. Increase in choice and
buffet service could be a contributing factor to obesity in New Zealand (15). Environments
of wide choice and buffet service could potentially be difficult for individuals who lack the
self-control to make reasonable choices and take sensible portions. Choice reduction would
create an environment where there are fewer options to choose from. Individuals would not
be exposed to a wide food choice hence may not take more than they need.

62
Psychological benefits of reducing choice
According to Iyengar and Lepper (2000), as choice increases, consumers are overloaded
with the options and this could ultimately decrease the motivation to choose and the
satisfaction with the chosen option (9). However, some participants from this study
strongly agreed that they do not need everything that is offered and that more choice does
not mean that they are more satisfied. Participants who loaded onto factor 1 (Believers)
marginally agreed that reducing choice would make their meal decision easier. Participants
in factor 2 (Resisters), however, had neutral views on this statement. It was interesting that
the Resisters could see benefits of this, as sometimes they too feel overwhelmed.
6.3 Planet: choice reduction for environmental sustainability benefits
Based on the results, all the factors shared a neutral view that reducing choice could
contribute to environmental sustainability. Participants felt that they did not have enough
knowledge about how choice reduction may contribute to benefiting the environment. This
supports Bissonnette’s finding that adolescents did not have strong or consistent beliefs or
attitudes about the environmental impact of food production practices (52).
Secondly, participants who loaded onto factors 1 (Believers) and 3 (Emotives) would not
mind having the vegetarian option once a week and they were willing to try different
dishes based on vegetable protein. Reduction in meat once a week would contribute to the
environmental by reducing individuals’ carbon footprints (108). However, participants who
loaded onto factor 2 (Resisters) had strongly views on why they need their meat. Further,
choice reduction could potentially contribute to increased plate waste as if residents do not
63
enjoy the choices selected for them, they could potentially throw the food away. And
although plate waste may increase, the overall food waste generated from a reduced choice
menu is likely to decrease. Further research such as a comparison of waste analysis
between current and reduced choice menus could be conducted.
6.4 Potential barriers towards choice reduction
One benefit of having choice highlighted by Deci and Ryan (2000) was that choice is
associated with greater satisfaction (22). A barrier to choice reduction was identified when
participants who loaded onto factor 3 (Emotives), strongly agreed that choice gives them
freedom to choose what they want. According to Mooyman and Visser (2007), individuals
feel better when they have choices, as they would be able to positivity evaluate the
decision outcome of their choices (20).
Another benefit that increased choice offers was that individuals that have highly
differentiated needs; choices available would allow them to satisfy their own particular
wants (26). The amount of choice contributes to an individual’s thinking that one of the
options would meet their preference (50). Interestingly, participants who loaded onto all 3
factors disagreed with statements “There are too many choices on the menu” and “I prefer
not to have a choice, I’d rather there was just one dish on the menu”. These disagreements
from the participants showed the barriers to choice reduction. Participants in this study
included those who are on a special diet; therefore some strongly disagreed with this
statement, as they would only have one main meal item provided for them. Choice
reduction in this situation may not be relevant as choice is not offered to these individuals.

64
6.5 Conclusion
The previous sections have reviewed the benefits of choice reduction using the Triple
Bottom Line framework (3Ps: Profits, People and Planet) and identified the barriers
towards choice reduction. This is important to strategically position possible interventions.
6.5.1 Strengths of this research
Choice reduction is a hugely controversial topic as individuals enjoy having the freedom of
choice. There is no literature around menu choice reduction among college foodservice
making this exploratory study groundbreaking in this sense. This research acts as a
stepping-stone towards long-term benefits to improve profits (economical), people
(nutritional / psychological) and the planet (environmental).
Using Q-methodology as a research tool allowed the researcher to investigate the dominant
attitudes and perceptions around menu choice reduction and the possible circumstances
under which less food choice would be acceptable. Most of the participants enjoyed Q-
methodology and did not have difficulty understanding the procedure. Introduction of Q-
methodology to foodservice research is a novel methodological contribution.
6.5.2 Limitations of this research and possibilities of future research
This study questioned “What does choice mean to you at the college’s meal times?”
However, stakeholders were asked these questions outside of their mealtimes. Results
might differ if the researcher asked participants at the point of decision-making.
Participants may offer a different option if they were interviewed before or after a meal. If

65
participants were interviewed after a meal, they could experience fullness, disappointment
with their choice or guilt for leaving food on their plate. Therefore, the timing of the
interviews might have influenced the results. Acherman and colleagues (2014) supported
this as they found that students preferred to have more choice before having to make a
decision. However, when they were asked to make a choice, they responded more
positively to having fewer choices (28). Further research could be conducted at the
beginning of the year to investigate individuals’ attitudes surrounding choice reduction
during meal times.
It is also important to note that the three factors found in this study (Believers, Resisters
and Emotives) cannot be generalised to the wider population with any statistical certainly
because the focus of the research is in the content of the factor (the range of views about
choice reduction) and not the characteristics of the participants. For data to the
generalisable, further research such as conducting a representative survey could be carried
out at the beginning of the year (89).
In conclusion, the introduction of choice reduction initiatives could potentially contribute
to improving residential college foodservices’ Triple Bottom Line performance (3Ps –
Profits: economical, People: nutritional/psychological and Planet: environmental
sustainability). This research has provided a foundation to lead further research on choice
reduction within the wider foodservice sector.

66
7. Application to Foodservice
Choice reduction initiatives require comprehensive communications that educate and
inform college stakeholders (i.e. warden, foodservice manager and residents). Initiatives
could be made known to the residents through the yearly college handbook and Facebook,
which are given to all residents before arriving at the college. The warden could also
include in the welcome talk that the foodservice would provide residents with meals that
adhere to the New Zealand’s Ministry of Health Nutrition Guidelines for Healthy Young
People. It would be realistic to roll out new initiatives at the start of the year before
residents experience anything else, especially when coming from home where they may
not have expectations of a wide availability of foods on the menu. It is crucial to anticipate
that, based on the results of this study, there is likely going to be some individuals (i.e. the
Resisters) who may not be pleased with the reduced choice.
In 2015, the college could consider the following choice reduction initiatives: smaller trays,
no trays, education on portion size in relation to health and “Meatless Monday”. An
initiative that could bring forth economic (Profits) and health (People) benefits would be to
have smaller trays so that residents are able to take less food or for the foodservice to go
trayless. Residents who participate in trayless dining would receive some form of
recognition. In the United States some colleges and universities are going trayless because
of the economic, social and environmental social benefits attached to this initiative. This
initiative supports the Triple Bottom Line framework (109).

67
More/better education on appropriate serving sizes would be an added nutritional benefit
(People) of choice reduction. Findings by Kolodinsky and colleagues (2007) stated that an
increased knowledge of dietary education among college students appears to be positively
related to more healthful eating patterns (33). The New Zealand’s Ministry of Health has
produced Nutrition Guideline pamphlets titled “Healthy Eating for Young People” (110).
These could be made available in the dining hall. These pamphlets describe meal pattern
and healthy portion sizes.
The introduction of “Meatless Monday” could contribute to the environmental benefits
(Planet) for choice reduction. Various stakeholders of the colleges (i.e. warden and
foodservice manager) could first find out about the environmental and nutritional benefits
of this initiative. Factors 1 (Believers) and 3 (Emotives) could champion this initiative by
working with the Residential Assistants or Environmental Science students to create
awareness by framing the wordings used on Meatless advertisements more as a celebration
of food variety than as a limitation on meat. Peer-to-peer education with students in the
dining hall have been the most successful method described by the Sustainability Manager
of University of California, to spark debate and long-term change (57). This initiative
should be introduced on a Monday as researchers from the Johns Hopkins Center
demonstrated the effectiveness of leveraging Monday as a day to begin healthy behaviours
(58). This initiative not only encourages residents to participate in a “green” initiative that
has both a personal and community impact but also supports education and awareness of
environment issues.

68
Choice reduction could be a strategy that college foodservice could adopt to improve the
Triple Bottom Line (3Ps: Profits, People and Planet) performance of any college
foodservice operation. It has been demonstrated that business decisions made by
foodservice managers across the US have a significant impact on both the environment and
the economy (111). Training foodservice staff to be more conservative and sustainably
conscious could be a real asset. This is because staff members are the ones “who make
things happen in an foodservice operation”. It is essential to include them in every facet of
the planning and implementation of a sustainability program. The most important element
in this type of training is to explain outcomes, as this is essential in motivating staff
members (111).
Choice reduction could also serve as a public health initiative that improves the health of
the community. Foodservice operations should take the lead role in reversing the obesity
epidemic by offering less choice. This could reduce individual’s total food consumption.
Registered dietitians need to ensure the key participants are engaged in the sustainability
plan. This includes the warden, foodservice manager, chefs and the kitchen team. It is
crucial to engage the employees who would be the implementers of the plan.
The research results showed that there is reluctance amongst stakeholders to reduce choice.
There are attitudinal barriers to adopting choice reduction initiatives that need to be
overcome to avoid dissatisfaction with the foodservice. However, due to the many
potential benefits that choice reduction brings, it makes sense for college foodservice staff

69
to not be deterred in their choice reduction initiatives because of these attitudinal barriers.
As choice reduction is a controversial topic, it is important to think strategically on how
choice reduction initiatives can be framed to ensure their successful adoption in the future.
The results of this study have proved guidance here. Given that many of the attitudinal
barriers appeared to be from a lack of understanding of the potential benefits of reducing
choice, an educational campaign that firstly informed foodservice staff and then the
residents about the need for, and benefits of a choice reduction programme would be a
beneficial place for the college to start.

70
8. References 1. Schwartz B. How we choose - Deciding and choosing The paradox of choice: Why
more is less. New York Harper Colins 2004. p. 47-77.
2. English A. Rise of the single dish restaurant The Guardian 2012 Available from:
http://www.theguardian.com/lifeandstyle/wordofmouth/2012/may/15/rise-of-the-single-
dish-restaurant.
3. Forbes. The rise of the no-choice restaurant 2012 Available from:
http://www.forbes.com/sites/forbestravelguide/2012/09/26/the-rise-of-the-no-choice-
restaurant/.
4. Top Ten Food Trends for 2013 - Food channel's predictions for the coming year
The Food Channel 2013 Available from: http://www.foodchannel.com/articles/article/top-
ten-food-trends-2013/ - ixzz3EIDlHbOX.
5. Independent. First zero-waste restaurant to open in UK The New Zealand Herald
2014 Available from:
http://www.nzherald.co.nz/lifestyle/news/article.cfm?c_id=6&objectid=11293160.
6. Ferdman R. Americans are tired of long restaurant menus The Washington Post
2014 Available from:
http://www.washingtonpost.com/blogs/wonkblog/wp/2014/09/18/americans-are-tired-of-
long-restaurant-menus/.
7. Tugend A. Too many choices: A problem that can paralyze The New York Times
2010 Available from:
http://www.washingtonpost.com/blogs/wonkblog/wp/2014/09/18/americans-are-tired-of-
long-restaurant-menus/
8. The tyranny of choice: You choose Paris The Economist 2010 Available from:
http://www.economist.com/node/17723028.
9. Iyengar SS, Lepper MR. When choice is demotivating: Can one desire too much of
a good thing? Journal of Personality and Social Psychology. 2000;79(6):995-1006.
10. Schwartz B. The Tyranny of Freedom American Psychologist 2000;55(1):79-88.

71
11. Food matters towards a strategy for the 21st century In: Unit TS, editor.: Cabinet
Office 2008. p. 46.
12. UPSTREAM: Choice Editing. In: Nordic Council of Ministers, Danish Ministry of
the Environment, Institute. CR, editors. 2006.
13. Maniates M. State of the World - Transforming Cultures - From Consumerism to
Sustainability In: Science PSaE, editor. Pennsylvania2010
14. Levitsky D, Youn T. The more food young adults are served, the more they overeat
The Journal of Nutrition 2004;134:2546-9.
15. Ng M, Fleming T, Robinson M, Thomson B, Graetz N, Margono C, et al. Global,
regional, and national prevalence of overweight and obesity in children and adults during
1980–2013: a systematic analysis for the Global Burden of Disease Study 2013. The
Lancet. 2014;384(9945):766-81.
16. Slaper T. The Triple Bottom Line: What is it and how does it work? 2011 [4-8 pp.].
17. Greaney ML, Less FD, White AA, Dayton SF, Riebe D, Blissmer B, et al. College
students' barriers and enablers for healthful weight management: a qualitative study.
Journal of Nutrition Education and Behavior. 2009;41(4):281-6.
18. Hoffman DJ, Policastro P, Quick V, Lee SK. Changes in body weight and fat mass
of men and women in the first year of college: A study of the "freshman 15". Journal of
American College Health. 2006;55(1):41-5.
19. Edwards JS, Meiselman HL. Changes in dietary habits during the first year at
university British Nutrition Foundation Nutrition Bulletin 2003 (28):21-34.
20. Mooyman C, Visser J. More or Less? The impact of assortment size and variety on
consumer satisfaction [Masters ]. Rotterdam Eramus School of Economics 2007.
21. Browning G, Halcli A, Webster F. Rational choice theory Understanding
contemporary society: Theories of the present Sage Publications 2000. p. 126-36.
22. Ryan R, Deci E. Self-determination theory and the facilitation of intrinsic
motivation, social development, and well-being American Psychologist 2000;55:68-78.
23. Deci E, Ryan R. Intrinsic motivation and self-determination in human behaviour
New York Plenum Press 1985.
72
24. Taylor S, Brown J. Illusion and well-being: A social-psychological perspective on
mental health Psychological Bulletin 1988;103:193-210.
25. Botti S, Iyengar S. The dark side of choice: When choice impairs social welfare.
American Marketing Association. 2006;25(1):24-38.
26. Loewenstein G. Is more choice always better? . National Academy of Social
Insurance's 11 annual conference Carnegie Mellon University 2000. p. 1-15.
27. Loewenstein G, Sicherman N. Do workers prefer increasing wage profiles? Journal
of Labor Economics 1991 9:67-84.
28. Ackerman DS, Gross BL, Sawhney Celly K. Having Many Choice Options Seems
Like a Great Idea, But...: Student Perceptions About the Level of Choice for a Project
Topic in a Marketing Course. Journal of Marketing Education. 2014;36(3):221-32.
29. Lettington N. United Nations Environment Programme launches school food waste
competition 2014 Available from:
http://www.unep.org/newscentre/Default.aspx?DocumentID=2796&ArticleID=10982 -
sthash.BS2TH83T.dpuf.
30. Fox T. Global food: Waste not, want not London Institution of Mechanical
Engineers 2013
31. Cradock A, McHugh A, Mont-Feguson H, Grant L, Barrett J, Wang Y, et al. Effect
of school district policy change on consumption of sugar-sweetened beverages among high
schol students, Boston, Massachusetts, 2004-2006. Preventing Chronic Diseases. 2011;8.
32. Cohen D, Rabinovich L. Addressing the proximal causes of obesity: The revealance
of alcohol control policies Preventing Chronic Diseases 2012;9.
33. Kolodinsky J, Harvey-Berino JR, Berlin L, Johnson RK, Reynolds TW. Knowledge
of current dietary guidelines and food choice by college students: better eaters have higher
knowledge of dietary guidance. Journal of the American Dietetic Association.
2007;107(8):1409-13.
34. Booth D, Julier J, Lewis V. Human control of body weight: cognitive or
physiological? Some energy- related perceptions and misperceptions. The Body Weight

73
Regulatory System: Normal and Disturbed Mechanisms New York Raven Press 1981 p.
305-14
35. Rolls B, Morris E, Roe L. Portion size of food affects energy intake in normal-
weight and overweight men and women American Journal of Clinical Nutrition
2002;76:1207-13
36. Kral T, Roe L, Rolls B. Combined effects of energy density and portion size on
energy intake in women. American Journal of Clinical Nutrition. 2004;79:962-8.
37. Rolls B, Roe L, Meengs J, Wall D. Increasing the portion size of a sandwich
increases energy intake Journal of American Dietetic Association 2004 104:367-72.
38. Rolls B, Engell D, Birch L. Serving portion size influences 5 years old but not 3
years old children's food intake. Journal of American Dietetic Association. 2000;100:232-4.
39. Kral T, Roe L, Rolls B. Combined effects of energy density and portion size on
energy intake in women American Journal of Clinical Nutrition. 2004;79(6):962-8.
40. Young L, Nestle M. The contribution of expanding portion sizes to the U.S. obesity
epidemic. American Journal of Public Health 2002;92(2):246-9.
41. The New Zealand Curriculum for English-medium teaching and learning in years
1-13 In: Education Mo, editor. Wellington, New Zealand Learning Media Limited 2007. p.
1-44.
42. Schwartz J, C. B-B. Portion distortion: typical portion sizes selected by young
adults Journal of American Dietetic Association. 2006;106(9):1412-8.
43. Healthy lives, healthy people: A call to action on obesity in England. In: Health Do,
editor. England 2011.
44. Schwartz B. The Tyranny of Choice Swarthmore College 2004.
45. Huffman C, Wansink B. The variety of an assortment Marketing Science
1999;18(4):528-46.
46. Sugden R. Regret, recrimination and rationality Theory and Decision 1985;19:77-
99.

74
47. Fischhoff B. Hindsight and Foresight: the effect of outcome knowledge on
judgement under uncertainity Journal of Experimental Psychology: Human Perception and
Performance 1975;1:288-99.
48. Desmeules R. The impact of variety on consumer happiness Academy of Marketing
Science Review 2002;2002(12).
49. Heath C, Tversky A. Prefernce and belief: ambiguity and competence in choice
under uncertainity Journal of Risk and Uncertainity 1991;4:5-28.
50. Broniarczyk S. Product Assortment Handbook of Consumer Psychology United
States of America Taylor and Francis Group 2006.
51. Pimentel D, Pimentel M. Energy and Society Food, Energy and Society Third ed.
United States of America CRC Press Taylor and Frances Group 2008. p. 1-6
52. Bissonnette M, Contento I. Adolescents' Perspectives and Food Choice Behaviors
in Terms of the Environmental Impacts of Food Production Practices: Application of a
Psychosocial Model. Journal of Nutrition Education. 2001;33(2):72-82.
53. Gussow J, Clancy K. Dietary guidelines for sustainability Journal of Nutrition
Education. 1986;18:1-4.
54. Aramark. The business and cultural acceptance case for trayless dining 2008
55. Stokes T. Simple awareness reduces college food waste New York Reuters 2013
[cited 2014 29th October]. Available from: http://www.reuters.com/article/2013/01/11/us-
awareness-college-food-waste-idUSBRE90A0YY20130111.
56. Meatless Monday - About us The Monday Campaigns 2003-2014. Available from:
http://www.meatlessmonday.com/about-us/.
57. Adams L, Lee D, Kosoff S, Nazari J. UC Davis Dining Services: Sustainable
Foodservice Progress Report 2012 University of California 2012
58. Fry J, Neff R. Healthy Monday: Two Literature Reviews Baltimore John Hopkins
Center for a Livable Future 2010.
59. Ayers J, Althouse B, Johnson M, Dredze M, Cohen J. What's the Healthiest Day? .
American Journal of Preventive Medicine. 2014;47(1):73-6.

75
60. Kollmuss A. Mind the gap: why do people act environmentally and what are the
barriers to pro-environmental behaviour? . Environment Education Research 2002
8(3):239-60.
61. Ockwell D, Whitmarsh L, O'Neill S. Reorienting climate change communication
for effective mitigation: forcing people to be green or fostering grass-roots engagement? .
Science Communication 2009;30(3):305-27.
62. Botti S, Broniarczyk S, Häubl G, Hill R, Huang Y, Kahn B, et al. Choice under
restrictions. Marketing Letters. 2008;19(3-4):183-99.
63. Thogersen J, Crompton T. Simple and painless? The limitations of spillover in
environmental campaigning. Journal of Consumer Policy. 2009 32(2):141-63.
64. Lombardini C, Lankoski L. Forced choice restriction in promoting sustainable food
consumption: Intended and unintended effects of the mandatory vegetarian day in Helsinki
schools. Journal of Consumer Policy. 2013;36(2):159-78.
65. Cho H, Salmon C. Unintended effects of health communication campaigns. Journal
of Communication. 2007;57(2):293-317.
66. Byrne S, Hart P. The boomerang effect Communication Yearbook. 2009;33:2-37.
67. Brehm J. A theory of psychological reactance In: Burke W, Lake D, Paine J, editors.
Organization Change: A comprehensive reader. San Francisco Wiley 1966. p. 377-8.
68. Cross RM. Exploring attitudes: the case for Q methodology. Health Education
Research. 2005;20(2):206-13.
69. Simmons R. Questionnaires Researching Social Life 2nd ed. London Sage 2001 p.
85-104.
70. Thurstone L. Attitudes can be measured American Journal of Sociology 1928
33(4):529-54.
71. Likert R. A technique for the measurement of attitudes Archives of Psychology.
1932 140 1-55
72. Manstead A, Semin G. Methodology in social psychology: tools to test theories In:
Hewstone M, Stroebe W, editors. Introduction to Social Psychology 3rd ed. Oxford
Blackwell 2001

76
73. Mclver J, Carmines E. Uni-dimensional scaling Newbury Park, California: Sage
1981
74. Brown SR. Q-methodology and qualitative research. Qualitative Health Research.
1996;6(4):561-7.
75. ten Klooster PM, Visser M, de Jong MDT. Comparing two image research
instruments: The Q-sort method versus the Likert attitude questionnaire. Food Quality and
Preference. 2008;19(5):511-8.
76. van Exel J, de Graaf G. Q methodology- A sneak preview. In: Management HPa,
editor. 2005.
77. Lecouteur A, Delfabbro P. Repertoires of teaching and learning: A comparision of
unversity teachers and students using Q methodology. Higher Education 2001 42 205-35.
78. Prasad R. Development of the HIV/AIDS Q-sort Instrument to measure physician
attitudes. Family Medicine 2001 33(10):772-8.
79. Schmolck P AJ. The QMethod Page - PQMethod Software (Version 2.35) 2002.
80. Coogan J, Herrington N. Q methodology: an overview Research in Secondary
Teacher Education 2011;1(2):24-8.
81. Dziopa F, Ahern K. A systematic literature review of the applications of Q-
technique and its methodology. Methodology: European Journal of Research Methods for
the Behavioral and Social Sciences. 2011;7(2):39-55.
82. Wood R, Griffiths M, Derevensky J, Gupta R. Adolescent accounts of the UK
National Lottery and Scratchcards: An analysis using Q-sorts Journal of Gambling Studies
2002;18(2):161-83.
83. Dariel O, Wharrad H, Windle R. Developing Q-methodology to explore staff views
toward the use of technology in nurse education Nurse Researcher 2010;18(1):58-71.
84. Akhtar-Danesh N, Baumann A, Cordingley L. Q-methodology in nursing research:
a promising method for the study of subjectivity. Western Journal of Nursing Research.
2008;30(6):759-73.
85. Thomas D, Baas L. The issue of generalisation in Q methodology: "reliable
schematics" revisited Operant Subjectivity 1992 16(1):18-36.

77
86. Brown S. A primer of Q methodology Operant Subjectivity. 1993;16:91-138.
87. Watts S, Stenner P. Doing Q Methodology: theory, method and interpretation.
Qualitative Research in Psychology. 2005;2(1):67-91.
88. Amin Z. Q methodology - A journey into the subjectivity of human mind Singapore
Medical Journal 2000;41:410-4.
89. Davern M. Representative Sample In: Lavrakas P, editor. Encyclopedia of Survey
Research Methods Thousand Oaks Sage Publications, Inc. ; 2008. p. 721-3.
90. Mckeown B, Thomas D. Q methodology (Quantitative Applications in the Social
Sciences). 2 ed1988.
91. Watts S, Stenner P. Basic design issues: research questions and Q sets Doing Q
Methodological Research - Theory, Method and Interpretation SAGE Publication; 2012
92. Stenner P WS, Worrell M Q Methodology The Sage Handbook of Qualitative
Research in Psychology London SAGE Publications Ltd 2008. p. 215-39
93. Watts S, P. S. Doing the fieldwork: participants, materials and procedure Doing Q
Methodological Research - Theory, Method and Interpretation Sage Publications 2012. p.
69-89.
94. Bowling A. Research Methods in Health Buckingham Open University Press 1997.
95. Guest G. How many interviews are enough?: An experiment with data saturation
and variability. Field Methods. 2006;18(1):59-82.
96. Patel M, Doku V, Tennakoon L. Challenges in recruitment of research participants.
Advances in Psychiatric Treatment 2003 9:229-38.
97. Anderson C, Avery PG, Pederson PV, Smith ES, Sullivan JL. Divergent
perspectives on citizenship education: A Q-Method study and survey of social studies
teachers. American Educational Research Journal. 1997;34(2):333-64.
98. Watts S, Stenner P. Understanding the analytic process (1): factor extraction Doing
Q Methodological Research - Theory, Method and Interpretation SAGE Publishing 2012 p.
91-111.
99. Gallagher K, Porock D. The use of interviews in Q methodology: Card Content
Analysis Nursing Research 2010 59(4 ):295-300.

78
100. Brown S. Political Subjectivity: applications of Q methodology in political science:
Yale University Press 1980.
101. Tabachnick B, Fidell L. Using Multivariate Statistics Harper and Row
102. Watts S, Stenner P. Understanding the analytic process (2): factor rotation and the
preparation of factor arrays Doing Q Methodological Research - Theory, Method and
Interpretation 2012 p. 113-45.
103. Webler T DS, Tuler S Using Q Method to reveal social persepectives in
Environmental Research Social and Environmental Research Institute 2009 12-23.
104. Watts S, Stenner P. Factor interpretation Doing Q Methodological Research -
Theory, Method and Interpretation Sage Publishing; 2012 p. 147-67.
105. Duncan P, Jensen J. The Menu. In: Cloete D, editor. Profesional Foodservice
Second ed: Pearson New Zealand 2001.
106. Vella-Zarb R, Elgar F. The "Freshman 5": A meta-anaylsis of weight gain in the
freshman year of college Journal of American College Health 2009;58(2):161-6.
107. Levitsky DA, Halbmaier CA, Mrdjenovic G. The freshman weight gain: a model
for the study of the epidemic of obesity. International Journal of Obesity
2004;28(11):1435-42.
108. Weber C, Matthews H. Food-Miles and the relative climate impacts of food choices
in the United States Environmental Science and Technology 2008;42 (10 ):3508-13
109. Burgett C, Costello A, Dennis N, Felicetti A, Horgan J, Johnescu K. Exploring the
economic, environmental and social implications of trayless dining at Colgate University
Colgate University 2008.
110. Healthy eating for young people from 13 to 18 years old. In: Health Mo, editor.
New Zealand: Health Promotion Agency 2012.
111. Peregrin T. Sustainability in foodservice operations: an update. Journal of the
American Dietetic Association. 2011;111(9):1286-94.

79
9. Appendices

80
Appendix 1: University of Otago ethics approval
6 December 2013
Academic ServicesManager, Academic Committees, Mr Gary Witte
D13/392
Dr M Mirosa
Department of Human Nutrition
Division of Sciences
Dear Dr Mirosa,
I am writing to let you know that, at its recent meeting, the Ethics Committee received a copy
of the Reporting Sheet relating to your Category B ethics proposal entitled “The possibilitiesof reducing food choice to improve the quality of university residential college foodservices (working title)”.
For your future reference, the Ethics Committee’s reference code for this project is:- D13/392.
The Committee appreciates that Category B proposals may commence as soon as approval
has been obtained at departmental level and that, in some instances, the research or
teaching may be well advanced or even completed by the time the Reporting Sheet is
received by the Committee.
Nonetheless, in the case of this particular proposal (D13/392), the Ethics Committee has
recorded a status for it of Approved HOD at this stage, and has asked me to pass on it’s
views to you as follows:-
The Committee noted that you have included the Human Ethics Committee contact clause
twice in the Information Sheets. The preferred location of this clause is at the bottom of the
Information Sheet under the researcher contact information. Please remove the repeat
clause from the body of the Information Sheet, as it is not necessary to repeat this.
Yours sincerely,
Mr Gary Witte
Manager, Academic CommitteesTel: 479 8256
Email: [email protected]
c.c. Emeritus Professor L J Holloway Head Department of Human Nutrition

81
Appendix 2: Semi-structured interview – information sheet for participants
“The possibilities of reducing food choice to improve the economical (profits),
nutritional/psychological (people) and environmental (planet) performance of university residential college foodservices “
INFORMATION SHEET FOR INTERVIEW PARTICIPANTS
Thank you for your interest in this project. I am Joanne Loh, a Master of Dietetics student in the Department of Human Nutrition. My research interest is in foodservice. Please read this information sheet carefully before deciding whether or not to participate. If you decide to participate, I thank you. If you decide not to take part there will be no disadvantage to you and we thank you for considering our request. What is the Aim of the Project? The aim of this research is to explore the possibility reducing choice on menus and stakeholder attitudes to choice reduction, in order to identify circumstances under which less choice is acceptable. This project is being undertaken by as part of the requirements for my Master in Dietetics. What Type of Participants are being sought? Staff and residents of Carrington College, Dunedin, New Zealand What will Participants be asked to do? Should you agree to take part in this project, you will participate in an interview with the researcher in a meeting room that I will conduct my interview. This will take approximately 30-45 minutes of your time. Please be aware that you may decide not to take part in the project without any disadvantage to yourself of any kind.

82
What Data or Information will be Collected and What Use will be made of it? You will be asked to discuss your perceptions, attitudes and practices around choice reduction on Carrington’s menu. The interview sessions will be audio recorded to allow me to remember and accurately transcribe what was said during the session. Neither the audio recordings, nor the transcripts, will be shared with anyone outside the current research project. Nothing that you say during the course of the session will be disclosed to any person outside of the group session. After the interview, the audio file will be transcribed and your real name will be removed from the data and replaced with a pseudonym so that outsiders reading the final report cannot identify you. Any personal information that you provide will only be used only to assist in explaining the study results. Personal information will be published only as aggregate values. Responses will be collected and transferred onto a USB memory-stick that will be stored in a lockable filing cabinet in an office in the University of Otago Dunedin Centre. The data will only be accessible to Joanne Loh (researcher), Dr. Miranda Mirosa and Dr. Heather Spence (academic supervisors), as required by the University's research policy. Any raw data on which the results of the project depend will be retained in secure storage for five years, after which time they will be destroyed. The results of the project may be published in which case they will be available in the University of Otago Library (Dunedin, New Zealand). You are most welcome to request a summary of the study results.
Can Participants Change their Mind and Withdraw from the Project? You may withdraw from participation in the project at any time and without any disadvantage to yourself. What if Participants have any Questions? If you have any questions about our project, either now or in the future, please feel free to contact either: Joanne Loh and/or Dr. Miranda Mirosa Department of Human Nutrition Department of Food Science Email: [email protected] Email: [email protected] This study has been approved by the Department stated above. If you have any concerns about the ethical conduct of the research you may contact the Committee through the Human Ethics Committee Administrator (ph 03 479-8256). Any issues you raise will be treated in confidence and investigated and you will be informed of the outcome

83
Appendix 3: Semi-structured interview – interview information for participants
“The possibilities of reducing food choice to improve the economical (profits),
nutritional/psychological (people) and environmental (planet) performance of university residential college foodservices “
INTERVIEW INFORMATION FORM FOR PARTICIPANTS
Dear Interview Participant, Once again, I would like to thank you for participating in an interview to discuss your perceptions, attitudes and practices, in regards to menu choice reduction in Carrington Foodservices. Details of your interview session are outlined below. The interview will take approximately 30-45 minutes.
Session Date: Session Time: Session Location:
Following completion of the interview, you will be compensated with a coffee and chocolate voucher for reimbursement towards costs involved in travelling to the research project. If you have any questions about our project, either now or in the future, please feel free to contact either: Joanne Loh and/or Dr. Miranda Mirosa Department of Human Nutrition Department of Food Science Email: [email protected] Email: [email protected] I look forward to meeting with you, Joanne Loh Student Dietitian

84
Appendix 4: Semi-structured interview – consent form for participants
“The possibilities of reducing food choice to improve the economical (profits),
nutritional/psychological (people) and environmental (planet) performance of university residential college foodservices “
CONSENT FORM FOR PARTICIPANTS
I have read the Information Sheet concerning this project and understand what it is about. All my questions have been answered to my satisfaction. I understand that I am free to request further information at any step. I know that:
1. My participation in the project is entirely voluntary;
2. I am free to withdraw from the project at any time without any disadvantage;
3. The data will be destroyed at the conclusion of the project but any raw data on which the results of the project depend will be retained in secure storage for at least five years;
4. This project involves an open-questioning technique. The precise nature of the questions,
which will be asked have not been determined in advance, but will depend on the way in which the interview develops and that in the event that the line of questioning develops in such a way that I feel hesitant or uncomfortable I may decline to answer any particular question(s) and/or may withdraw from the project without any disadvantage of any kind.
5. Only once I have completed the session will I be compensated with a coffee and chocolate
voucher.
6. The results of the project may be published and available in the University of Otago Library (Dunedin, New Zealand) but every attempt will be made to preserve my anonymity.
I agree to take part in this project. ............................................................................ ............................... (Signature /name of participant) (Date)

85
Appendix 5: Semi-structured interview protocol and interview guide Semi-structured Interview Protocol
1. Set up recorder. 2. Ask participants to read the information sheet and if they agree to participant in the
study, to then sign the consent form. 3. Turn on the recorder. 4. Ask the opening question. 5. Follow the Semi-structure Interview Guide for College and Staff Residents. 6. Ask the closing question. 7. Hand out reimbursement voucher and ask participant to sign that they received this. 8. Ask if they are willing to take part in Step 2 of the research. 9. Recommend anyone who may be interested in this research.
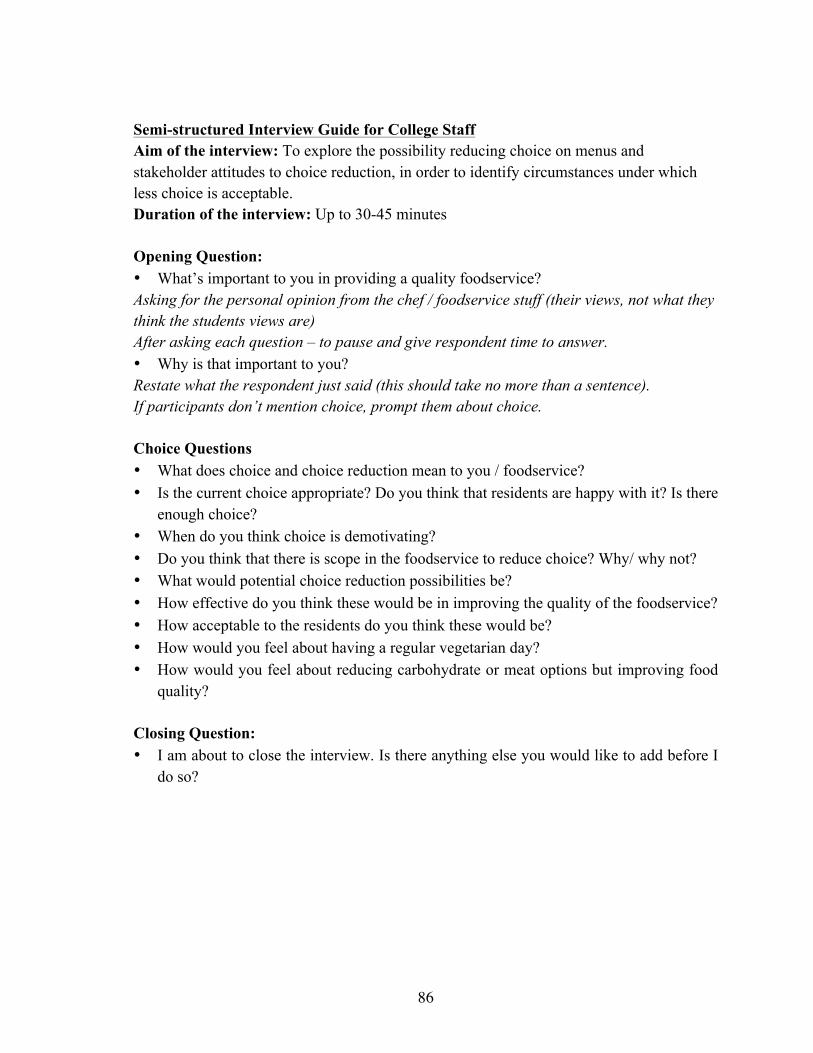
86
Semi-structured Interview Guide for College Staff Aim of the interview: To explore the possibility reducing choice on menus and stakeholder attitudes to choice reduction, in order to identify circumstances under which less choice is acceptable. Duration of the interview: Up to 30-45 minutes Opening Question: • What’s important to you in providing a quality foodservice? Asking for the personal opinion from the chef / foodservice stuff (their views, not what they think the students views are) After asking each question – to pause and give respondent time to answer. • Why is that important to you? Restate what the respondent just said (this should take no more than a sentence). If participants don’t mention choice, prompt them about choice. Choice Questions • What does choice and choice reduction mean to you / foodservice? • Is the current choice appropriate? Do you think that residents are happy with it? Is there
enough choice? • When do you think choice is demotivating? • Do you think that there is scope in the foodservice to reduce choice? Why/ why not? • What would potential choice reduction possibilities be? • How effective do you think these would be in improving the quality of the foodservice? • How acceptable to the residents do you think these would be? • How would you feel about having a regular vegetarian day? • How would you feel about reducing carbohydrate or meat options but improving food
quality? Closing Question: • I am about to close the interview. Is there anything else you would like to add before I
do so?

87
Semi-structured Interview Guide for Residents Aim of the interview: To explore the possibility reducing choice on menus and stakeholders’ attitudes to choice reduction, in order to identify circumstances under which less choice is acceptable. Duration of the interview: Up to 30-45 minutes Opening questions: • What’s important to you in the foodservice? (5 minutes) • List 5 most important areas about the foodservice • Why are these things important to you? After asking each question – to pause and give respondent time to answer Listen to all of their responses and go back to choice if they mention it Restate what the respondent just said (this should take no more than a sentence). If participants don’t mention choice, prompt them about choice. Choice questions: • Is choice/variety in food important to you? Why/why not? • Is the current choice appropriate? Are you happy with it? Is there enough choice? Too
much choice? • When do you think choice is demotivating? • Could the choice be reduced without compromising the quality of the foodservice? Any
ideas on how this could be done/why this might be done? • Do you see any benefits or advantages? • Do you think that there is scope in the foodservice to reduce choice? Why/ why • not? • What would potential choice reduction possibilities be? • How effective do you think these would be in improving the quality of the foodservice? • How acceptable do you think these would be? • How would you feel about having a regular vegetarian day? • How would you feel about reducing carbohydrate or meat options but improving food
quality? Closing Question: • I am about to close the interview. Is there anything else you would like to add before I
do so?

88
Appendix 6: Vouchers received sheet Date Participants name /
signature Amount
$5.00 “I have received a voucher to the value of $5 being reimbursement of costs involved in traveling to this research project. The University and the volunteer do not intend the participation in this research project to form an employment relationship”.
$5.00 “I have received a voucher to the value of $5 being reimbursement of costs involved in traveling to this research project. The University and the volunteer do not intend the participation in this research project to form an employment relationship”.
$5.00 “I have received a voucher to the value of $5 being reimbursement of costs involved in traveling to this research project. The University and the volunteer do not intend the participation in this research project to form an employment relationship”.
$5.00 “I have received a voucher to the value of $5 being reimbursement of costs involved in traveling to this research project. The University and the volunteer do not intend the participation in this research project to form an employment relationship”.
$5.00 “I have received a voucher to the value of $5 being reimbursement of costs involved in traveling to this research project. The University and the volunteer do not intend the participation in this research project to form an employment relationship”.
$5.00 “I have received a voucher to the value of $5 being reimbursement of costs involved in traveling to this research project. The University and the volunteer do not intend the participation in this research project to form an employment relationship”.

89
Appendix 7: Preliminary Q-set (74 statements) Research title: The possibilities of reducing food choice to improve the economical (profits), nutritional/psychological (people) and environmental (planet) performance of university residential college foodservices Research question for Q set What does choice mean to you at meal times at the college? Final outcome What are the different perceptions about choice in a university residential college setting? General choice
1. Choice stops me from getting bored 2. I feel overwhelmed when there’s more than one choice 3. I don’t care about whether there’s much choice 4. I need a lot of choice 5. Choice gives me freedom to choose what I want 6. I sometimes regret the meal choice I made 7. There are too few choices on the menu 8. There are too many choices on the menu 9. I prefer choice over no choice 10. I considered the quality of the meals before choosing this college 11. I choose seconds every day as I’ve paid college fees and want my money’s worth 12. I choose seconds so I don’t get hungry 13. Each choice reinforces my perception of control 14. I prefer to make my own choices rather than having someone else make them for
me 15. I’m “making the most” of the wide variety in menu choices before going flatting 16. I’m not used to having choices 17. I’m used to having choices when I live at home 18. I don’t have a choice when I am living at home/flat so I really enjoy the wide
choice here 19. I’m never satisfied with the choices given 20. I’m satisfied with the choices given 21. I’d be happier in another college as I’ve heard that they have a wide selection to
choose from at meal times 22. I feel helpless if I’m not given a choice 23. Offering a wide selection is important 24. Choice is rewarding 25. Choice is desirable 26. I choose what everyone else is eating

90
Choice and emotion 27. My choices are based on how I’m feeling at the time 28. Being able to choose what I want at meals influences my subsequent mood 29. Knowing I’ll able to choose my meal gives me something to look forward to 30. At the start of the year I thought there were too many choices but now I’m bored
with them 31. Having a wide choice doesn’t make any difference to my enjoyment of a meal
Choice and culture
32. My choices are based on my culture 33. Choices I make are based on my assumptions / background / cultural beliefs
Too much choice
34. Too many choices takes me a long time to decide what to have 35. Too much choice makes it hard to decide what to have 36. Too much choice leads me to make simple, snap judgements just to avoid the hassle
of wading through other options 37. There are too many choices 38. The more choices I have, the more satisfied I am 39. There is too much choice to make an easy decision 40. Having a wide choice builds expectations that there will always be a wide choice
Choice and others
41. Making choices is hard, so I choose what my friends have 42. The best way to choose is best is to ask staff what they’d recommend 43. The best way to choose is best is to ask friends what they’d recommend 44. I don’t need everything that’s offered 45. My friends influence me to have seconds
Increase in choice
46. More choice may contribute to an increase in food waste 47. More choices would satisfy my own particular wants 48. More choice results in quality improvement 49. More choice results in cost increases 50. More choice means more time’s required to decide what to have 51. More choice means I have to make difficult decisions 52. I expect to have many choices all the time 53. I have more choice than what I need 54. I believe more choice would increase satisfaction
Choice reduction
55. Reducing choice could reduce food waste 56. Reducing choice reduces my food consumption 57. Eliminating choice would make my meal decisions easier

91
58. Reducing choice would be disappointing 59. Reducing choice could create negative perceptions about the foodservice 60. Reducing choices contributes to environmental sustainability
Choice and Health
61. I feel confident in making the healthier choice with the food provided. 62. I feel the need for the foodservice to offer low energy choices. 63. I tend to eat more at the college than I would at home. 64. I believe that the wide variety of choice available contribute to weight gain. 65. Because of the huge variety of choice available, I tend to take more than what I
need. 66. The choices I make depend on the healthiness of the meal
Possible interventions
67. I expect to have a huge selection of salad ingredients even if it is not seasonal. 68. I wouldn’t mind having the vegetarian option once a week 69. I prefer not to have a choice, I’d rather there was just one dish on the menu 70. I choose whatever I like at meal times 71. I like a meal tray because I can take more food 72. I’ll try new dishes when my friends recommend them 73. I’m willing to try different dishes based on vegetable protein instead of meat 74. I enjoy having the choice of toast and fruit throughout the day

92
Appendix 8: Final Q-set (42 statements)
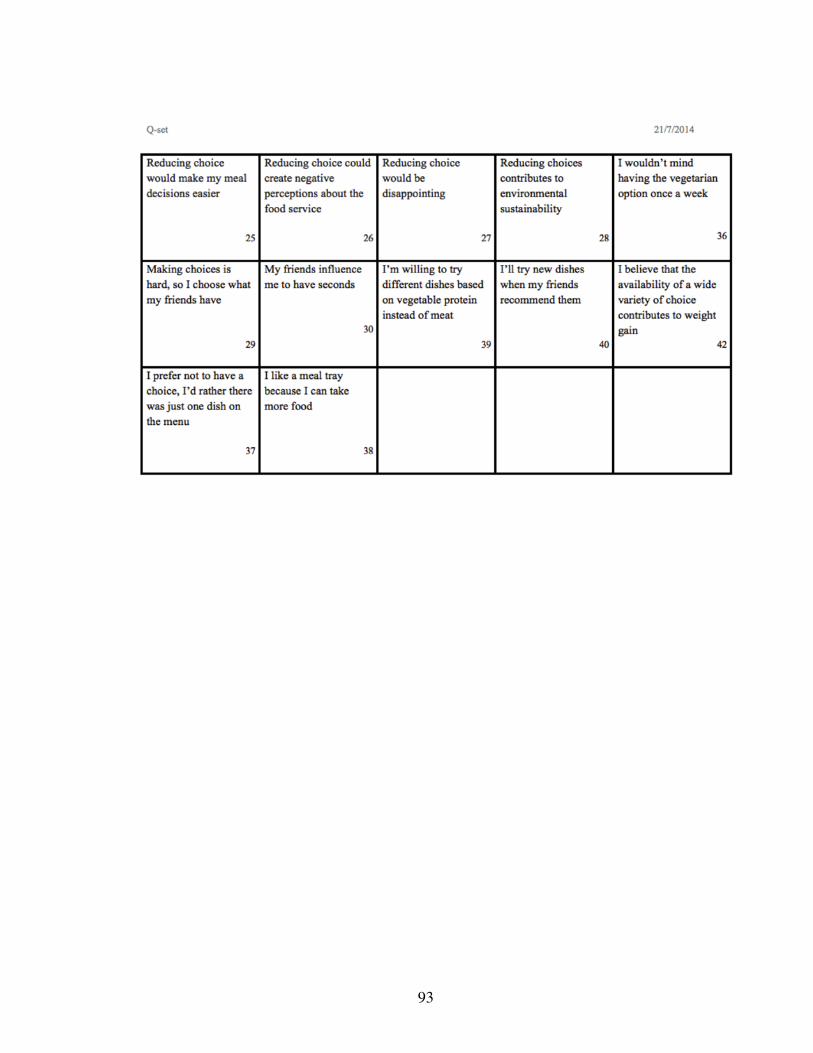
93

94
Appendix 9: Poster advertisement for Q-sort activity
“The possibilities of reducing food choice to improve the economical (profits), nutritional/psychological (people) and environmental (planet) performance of university residential college foodservices
“
Ethics Committee’s reference code: D13/392
I am Joanne Loh, a Master of Dietetics student at the University of Otago. For my study, I am interested in finding out what Carrington College residents think about reducing the choice in food options provided at mealtimes. To do this, I will be conducting:
• An attitudinal card sorting activity called a Q-sort lasting 30 minutes. • These will be conducted in the Heriot tutorial room, starting from 28st July 2014.
You will be given a coffee and chocolate voucher for your time. If you are interested in partaking in this activity and wish to hear more about the study, please email; [email protected] If you have questions or concerns about this project, please feel free to contact either:
• Joanne Loh, Department of Human Nutrition, [email protected] • Dr. Miranda Mirosa, Department of Food Science,
[email protected] , Phone: 03 479 7953
This proposal has been reviewed and approved by the Departments of Food Science and Human Nutrition, University of Otago.
The
poss
ibili
ties o
f red
ucin
g fo
od c
hoic
e to
im
prov
e th
e ec
onom
ical
, nut
ritio
nal/p
sych
olog
ical
an
d en
viro
nmen
tal p
erfo
rman
ce o
f uni
vers
ity
resid
entia
l col
lege
food
serv
ices
Joan
ne: l
ohjo
451@
stud
ent.o
tago
.ac.
nz
The
poss
ibili
ties o
f red
ucin
g fo
od c
hoic
e to
im
prov
e th
e ec
onom
ical
, nut
ritio
nal/p
sych
olog
ical
an
d en
viro
nmen
tal p
erfo
rman
ce o
f uni
vers
ity
resid
entia
l col
lege
food
serv
ices
Joan
ne: l
ohjo
451@
stude
nt.o
tago
.ac.
nz
The
poss
ibili
ties o
f red
ucin
g fo
od c
hoic
e to
im
prov
e th
e ec
onom
ical
, nut
ritio
nal/p
sych
olog
ical
an
d en
viro
nmen
tal p
erfo
rman
ce o
f uni
vers
ity
resid
entia
l col
lege
food
serv
ices
Joan
ne: l
ohjo
451@
stude
nt.o
tago
.ac.
nz
The
poss
ibili
ties o
f red
ucin
g fo
od c
hoic
e to
im
prov
e th
e ec
onom
ical
, nut
ritio
nal/p
sych
olog
ical
an
d en
viro
nmen
tal p
erfo
rman
ce o
f uni
vers
ity
resid
entia
l col
lege
food
serv
ices
Joan
ne: l
ohjo
451@
stude
nt.o
tago
.ac.
nz
The
poss
ibili
ties o
f red
ucin
g fo
od c
hoic
e to
im
prov
e th
e ec
onom
ical
, nut
ritio
nal/p
sych
olog
ical
an
d en
viro
nmen
tal p
erfo
rman
ce o
f uni
vers
ity
resid
entia
l col
lege
food
serv
ices
Joan
ne: l
ohjo
451@
stude
nt.o
tago
.ac.
nz
The
poss
ibili
ties o
f red
ucin
g fo
od c
hoic
e to
im
prov
e th
e ec
onom
ical
, nut
ritio
nal/p
sych
olog
ical
an
d en
viro
nmen
tal p
erfo
rman
ce o
f uni
vers
ity
resid
entia
l col
lege
food
serv
ices
Joan
ne: l
ohjo
451@
stude
nt.o
tago
.ac.
nz
The
poss
ibili
ties o
f red
ucin
g fo
od c
hoic
e to
im
prov
e th
e ec
onom
ical
, nut
ritio
nal/p
sych
olog
ical
an
d en
viro
nmen
tal p
erfo
rman
ce o
f uni
vers
ity
resid
entia
l col
lege
food
serv
ices
Joan
ne: l
ohjo
451@
stude
nt.o
tago
.ac.
nz

95
Appendix 10: Q-sort activity – information sheet for participants
“The possibilities of reducing food choice to improve the economical (profits),
nutritional/psychological (people) and environmental (planet) performance of university residential college foodservices “
INFORMATION SHEET FOR INTERVIEW PARTICIPANTS
Thank you for showing an interest in this project. I am Joanne Loh, a Master of Dietetics student in the Department of Human Nutrition. My research interest is in foodservice. Please read this information sheet carefully before deciding whether or not to participate. If you decide to participate, I thank you. If you decide not to take part there will be no disadvantage to you and we thank you for considering our request. What is the Aim of the Project? The aim of this research is to explore the possibility reducing choice on menus and stakeholder attitudes to choice reduction, in order to identify circumstances under which less choice is acceptable. This project is being undertaken by as part of the requirements for my Master in Dietetics. What Type of Participants is being sought? Staff and residents of Carrington College, Dunedin, New Zealand What will Participants be asked to do? Should you agree to take part in this project, you will participate in a Q-sort activity with the researcher. This will take approximately 30 minutes of your time. Please be aware that you may decide not to take part in the project without any disadvantage to yourself of any kind. In the activity you will be given a set of 42 cards with each card containing a statement about choice and choice reduction. You will then be asked to rank the statements according to your attitudes about choice reduction according to the pattern shown below.

96
Figure 2: Distribution for the Q-sort
What Data or Information will be Collected and What Use will be made of it? After you have sorted the cards according to the pattern above, you will be asked to explain why you sorted the cards as you did. The interview sessions will be audio recorded and the Q-sorts will be photographed to allow the researcher to remember and accurately transcribe what was said during the session. Neither the audio recordings, nor the photographs, will be shared with anyone outside the current research project. Nothing that you say during the course of the session will be disclosed to any person outside of the group session. After the interview, the audio file will be transcribed and your real name will be removed from the data and replaced with a pseudonym so that outsiders reading the final report cannot identify your real name. Any personal information that you provide will only be used to assist in explaining the study results. Personal information will be published only as aggregate values. Responses will be collected and transferred onto a USB memory-stick that will be stored in a lockable filing cabinet in an office in the University of Otago Dunedin Centre. The data will only be accessible to Joanne Loh (researcher), Dr Miranda Mirosa and Dr. Heather Spence (academic supervisors), as required by the University's research policy. Any raw data on which the results of the project depend will be retained in secure storage for five years, after which time they will be destroyed. The results of the project may be published in which case they will be available in the University of Otago Library (Dunedin, New Zealand). Every attempt will be made to preserve your anonymity. You are most welcome to request a summary of the study results.

97
Can Participants Change their Mind and Withdraw from the Project? You may withdraw from participation in the project at any time and without any disadvantage to yourself of any kind. What if Participants have any Questions? If you have any questions about our project, either now or in the future, please feel free to contact either: Joanne Loh and/or Dr. Miranda Mirosa Department of Human Nutrition Department of Food Science Email: [email protected] Email: [email protected]
Telephone: 03- 479 7953
This study has been approved by the Department stated above. If you have any concerns about the ethical conduct of the research you may contact the Committee through the Human Ethics Committee Administrator (ph 03 479-8256). Any issues you raise will be treated in confidence and investigated and you will be informed of the outcome.

98
Appendix 11: Q-sort activity protocol 1. Set up recorder. 2. Ask participants to read the information sheet and if they agree to participant in the
study, to then sign the consent form. 3. Explain what is Q-methodology
a. It is a method that provides a foundation for the study of an individual’s viewpoint, option, beliefs and attitudes.
4. Hand out “Participant Instruction Sheet” and “Q set” 5. Turn on the recorder. 6. Ask “Post Q sort interview guide” 7. Take a photo of grid with sorted cards 8. Ask participant to do the survey on “Possible interventions” and to fill up “Participants
demographics” ! via monkey survey a. Appreciate that you don’t discuss these interventions to avoid influencing
others on their opinion. b. These interventions are just suggestions and ideas on what might work.
9. Hand out reimbursement voucher and ask participant to sign that they received this.

99
Appendix 12: Q-sort activity – consent form for participants
“The possibilities of reducing food choice to improve the economical (profits),
nutritional/psychological (people) and environmental (planet) performance of university residential college foodservices “
CONSENT FORM FOR PARTICIPANTS
I have read the Information Sheet concerning this project and understand what it is about. All my questions have been answered to my satisfaction. I understand that I am free to request further information at any step. I know that:
1. My participation in the project is entirely voluntary;
2. I am free to withdraw from the project at any time without any disadvantage;
3. The data will be destroyed at the conclusion of the project but any raw data on which the results of the project depend will be retained in secure storage for at least five years;
4. This project involves Q-sorts and open-questioning technique. The general line of questioning
includes ‘Why did you sort the cards in the manner you did?”’ The precise nature of the questions which will be asked have not been determined in advance, but will depend on the way in which the interview develops and that in the event that the line of questioning develops in such a way that I feel hesitant or uncomfortable I may decline to answer any particular question(s) and/or may withdraw from the project without any disadvantage of any kind.
5. Only once I have completed the session will I be compensated with a coffee and chocolate voucher.
6. The results of the project may be published and available in the University of Otago Library
(Dunedin, New Zealand) but every attempt will be made to preserve my anonymity. I agree to take part in this project. ................................................................... ............................... (Signature of participant) (Date)

100
Appendix 13: Q-sort activity – instruction sheet for participants Research Question: What does choice mean to you at the college’s meal times? Instructions 1. Read the research question above. The 42 item cards all offer a different answer to the research
question. The Q-sorting task requires you to rank each of these items using the sorting distribution below. The more you agree with an item, the higher the ranking you are likely to award it. The more you disagree, the lower the ranking.
2. Please note, that the final pattern of item rankings you produce must be the same as the shape
of the sorting distribution provided. E.g. looking at the blank sorting distribution, you will see that only TWO items can be given a ranking of +5, THREE can be given a ranking of +4 and so on.
3. This system is being used because it is an effective means of capturing your viewpoint for purposes of our study.
4. To begin, take the pile of 42 cards. You now need to read each card, one at a time, and divide them into 3 ranking categories.
a. Category 1: responses to the research question with which you AGREE. Put these items in a single pile towards your right hand side
b. Category 2: responses with which you DISAGREE. Put these on your left. c. Category 3: should include items which you feel INDIFFERENT, UNSURE or which
otherwise leave you with MIXED FEELINGS. 5. Take the pile of items you AGREE with and spread them out so that you can see them all at
once. Your job is now to allocate each of these items a ranking position at the right-hand (or agree) end of the distribution provided. The highest rankings should be given to the items with which you agree most strongly. Keep going until ALL the AGREE items have been allocated. Don’t be concerned if for example positive statements end up in the neutral or negative column. We are looking at the statements in relation to one another.
6. To continue sorting, you now need to follow the same procedure, but this time focusing on the pile of items you DISAGREE with.
7. To complete the Q sort, use the same procedure to sort the pile about which you feel INDIFFERENT/UNSURE.
8. Congratulations! You have finished sorting. At this stage, have one final look at the whole thing and feel free to make any final adjustments you want to make.
9. I will now ask you to explain why you sorted the cards as you did. And I’ll photograph it.

101
Appendix 14: Example of completed Q-sort

102
Appendix 15: Post Q-sort interview guide for college staff/residents 1. Explore the meaning of the items placed at the extremes of the distributions.
About the statements/items ranked by sorter at the extremes: “What do these mean to you?” / Tell me more about why you placed items here What do they mean to the participants? Why do they feel so strongly about them? E.g. why did you decide to sort these items at +5? Because I think they are more important than the other items.
2. Focus shifts to other items in the distribution that participants or I want to talk about.
Again, get them to talk about personal meaning and significance of an item
3. Are there any items towards the middle of the distribution that play some sort of pivotal role for them? Does the statements evoke a strong response? Look for item placements that are unusual or that do not immediately make sense
4. Ask if there were any they did not understand or if they felt any obvious issues had been omitted from the Q set
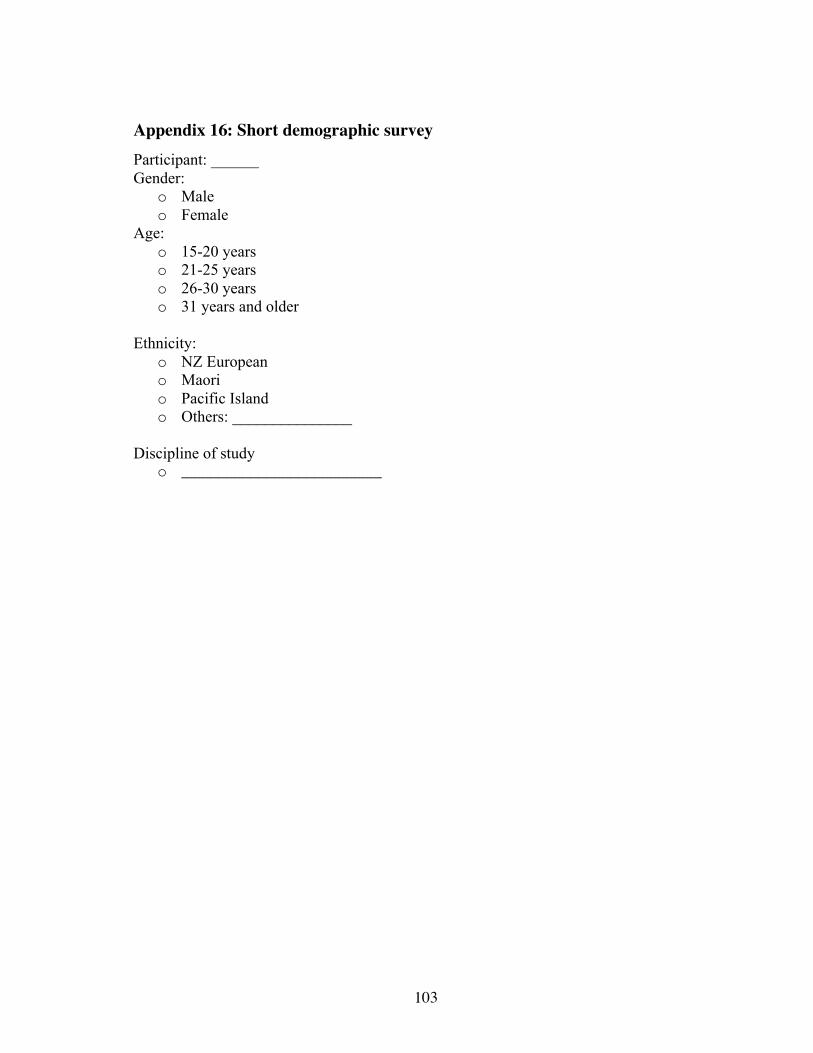
103
Appendix 16: Short demographic survey Participant: ______ Gender:
o Male o Female
Age: o 15-20 years o 21-25 years o 26-30 years o 31 years and older
Ethnicity:
o NZ European o Maori o Pacific Island o Others: _______________
Discipline of study
o _________________________

104
Appendix 17: Statements sorted by shared viewpoints (consensus)

105
Appendix 18: Distinguishing statements for factor 1 (Believers)
Appendix 19: Distinguishing statements for factor 2 (Resisters)

106
Appendix 20: Distinguishing statements for factor 3 (Emotives)