THE PORT AUGUSTA POWER STATIONS - WordPress.com
23
SUBMISSION to the SELECT COMMITTEE of the House of Assembly of South Australia on THE PORT AUGUSTA POWER STATIONS Contents 1 Introduction 1 2 Climate, oil and energy 1 3 What to do at Port Augusta 3 4 The 1970s oil crisis and nuclear expansion 3 5 Climate change responses and mountain climbing 6 6 The bigger picture 9 6.1 Getting back our recent climate ............................. 9 6.2 Per person emissions ................................... 10 7 Concluding remarks 11 A Fukushima fear mongering turns fatal 14 B Electricity generation by fuel 17 Version 1.3, 10th February 2013 (1 correction from Version 1.1 as submitted) (3 corrections of wrong units) Geoff Russell, B.Sc(Maths), B.A.(Hons) 6 Fifth Ave St Morris SA 5068 December 2012 Email: [email protected] Phone: 0418805184
Transcript of THE PORT AUGUSTA POWER STATIONS - WordPress.com
SUBMISSION
to the
SELECT COMMITTEE of the House of Assembly
of South Australia
on
THE PORT AUGUSTA POWER STATIONS
Contents
1 Introduction 1
2 Climate, oil and energy 1
3 What to do at Port Augusta 3
4 The 1970s oil crisis and nuclear expansion 3
5 Climate change responses and mountain climbing 6
6 The bigger picture 96.1 Getting back our recent climate . . . . . . . . . . . . . . . . . . . . . . . . . . . . . 96.2 Per person emissions . . . . . . . . . . . . . . . . . . . . . . . . . . . . . . . . . . . 10
7 Concluding remarks 11
A Fukushima fear mongering turns fatal 14
B Electricity generation by fuel 17
Version 1.3, 10th February 2013
(1 correction from Version 1.1 as submitted)
(3 corrections of wrong units)
Geoff Russell, B.Sc(Maths), B.A.(Hons)6 Fifth Ave
St Morris SA 5068December 2012
Email: [email protected]: 0418805184

1 Introduction
This submission relates to clause (e), “any other relevant matters”, on the list of things to beconsidered by the Select Committee on the Port Augusta Power Stations. The relevant matteris climate change and the place of wind and solar energy technologies in the battle to reduceAustralian and global emissions as required by physical climate change emission budget con-straints.
The 2009 paper: The Copenhagen Diagnosis[1]1 gives long term sustainable limits for greenhousegas emissions and work by NASA climate scientists led by James Hansen details more imme-diate requirements[2]2.
2 Climate, oil and energy
For the past 20 years, there has been a competitive cacophony about the urgency of climatechange by Governments and environmentalists around the world — but very little action. Theemission reductions supposedly generated by the 1997 Kyoto protocol have in fact been mea-surably less than the increase in imports of emission intensive products by countries in thefirst world from countries in the third world[3]. Many countries have simply out-sourced theiremissions. This comprehensive failure has accelerated the urgency of substantive action.
During virtually all of these two decades, the French have been generating electricity usingnuclear reactors at a CO2 emission rate of about 80 grams per kWh, compared to the globalaverage of over 500. Australia has a worst-in-class level of about 850 grams CO2 per kWh[4].The French completely transformed and grew their electricity generation infrastructure over atwo decade period in the 1970s and 80s. The spur was oil prices rather than climate change,but the lesson remains. A fast affordable move to low carbon electricity is possible. The Frenchdid it. The Swiss did it. The Swedes did it. It isn’t the total solution to our climate problems,but it would be a bloody good start.
In contrast, it’s been 12 years since the Germans introduced a feed in tariff to reward richGermans for electricity generated by putting solar panels on their roofs. We copied them.During this period the German Government has incurred a 100 billion Euro debt to be paidover the next 20 years to those same rich Germans for a miserable 19 TWh/yr (terawatt hoursper year) of day-time only electricity (about 3.3% of its total). And after all this expense and aforest of wind farms they are still generating 450 grams of CO2 per kWh as a result of one thebiggest white elephant projects in the history of cool technologies being promoted well beyondtheir tiny niche of applicability.
To admit the French are right about anything is clearly something everybody in general, andthe Germans in particular, would like to avoid, but we really need to get over this, to give themcredit and move on.
The French didn’t panic when a nuclear melt-down at Three Mile Island in 1979 resulted in no
1http://www.copenhagendiagnosis.com/2Publicly available here: http://arxiv.org/abs/0804.1126
1

deaths. After all the people who didn’t die weren’t French and the reactor wasn’t French either.The French also didn’t panic in 1986 when a steam explosion in Ukraine at Chernobyl blew thetop off a reactor without a containment building and killed less people than many a drunkenAustralian Easter holiday road toll. Again — not French.
In the 1980s, the French added 216 TWh/yr of nuclear electricity to the 100 or so they builtin the 1970s. By the time of the formation of the United Nations Framework Convention onClimate Change in 1992, their carbon dioxide cost per kilo-watt hour of electricity was downto about 100 grams and hit 80 soon after. Meanwhile the Germans and most of the rest of usjust continued to bugger up the climate big time.
Had we followed the French and gone nuclear in a big way, as they did in Switzerland andSweden, the world would be very different. It is ironic that sincere concern for the planet hasoften gone hand in hand with innumeracy, irrationality and frequently both. The 2010 floodsin Pakistan displaced 20 million people; cyclone Nargis in 2008 killed 140,000; These are thekinds of events which environmental and Green anti-nuclear activism has made more likely inthe future because of ill-informed fear-mongering. Had we all gone nuclear and decarbonisedour electricity, we’d still have work to do, but the urgency would be considerably reduced andsome of the key technologies would be cheaper and better.
The anti-nuclear movement has cost us all a couple of decades . . . and counting.
Let me say one last thing about Chernobyl before moving on. The accident at Chernobyl was ahorrid industrial accident which taught engineers valuable lessons and nobody builds reactorslike that anymore. The radioactive plume from the accident increased natural radiation levelsin large areas of what are now Russia, Ukraine and Belarus and they have been eating plentyof food with higher than normal radiation levels in those three countries for 25 years. Andthe result? . . . almost nothing. During this 25 years the three countries have had about 14million cases of cancer3 with about 6,000 likely due to Iodine-131 emitted in the first days ofthe accident[5]. It was a predicted problem and avoided elsewhere, but the Soviets stuffed up.Nevertheless, these extra cancers were treatable thyroid cancers with just a couple of dozendeaths.
It may seem to flippant to dismiss “just a couple of dozen deaths” and 6,000 cases of thyroidcancer. Not so. If these three countries had had Australian age standardised per-capita cancerrates during the past 25 years, they’d have had something in the order of 20 million cancers ...not 6,000 but 6 million extra cancers!
Australian’s are flippant about much bigger causes of cancer and other diseases than tinyamounts of radiation. They are happy to eat BBQ’d meat, get pissed, get fat, get unfit, feedthemselves and their children bacon and eggs, sausages and steak. And they still smokecigarettes. All of these are far more potent as causes of cancer than small amounts of extraradiation in food or soil. Australians are flippant about causes of vast oceans of cancer andterrified of things that don’t even cause detectable ripples. Anti-nuclear campaigners are con-veniently ignorant of comparative risks so it’s easy for them to tell cancer horror stories to thegeneral public because the general public has no idea about comparative risks.
It is far worse than flippant to risk the destabilisation of the unusually benign climate of the
3Rough estimate based on Globocan data.
2

past 10,000 years because of a few dozen deaths. That’s nutter stuff. When anti-nuclear elder“states person” Helen Caldicott told people at a press conference in Canada just a week after thedeathless Fukushima melt-downs in 2011 that they should stop eating Turkish apricots becausethe whole of Turkey was contaminated by the Chernobyl plume, she showed exactly what anutter she was and is4. Turkey has half the age standardised rate of cancer of Australia[6].What has all that contamination done in Turkey? Nothing. Bring on those apricots!
Happily, a growing number of environmentalists have realised they have been deluded by anti-nuclear fear mongering and are now pro-nuclear. Once you start checking information issuedby the likes of Caldicott, the result should be inevitable5. Most of us just find it hard to believethat a person can tell so many untruths with such sincerity and even harder to admit our owngullibility. It took me months to finally “come out” as pro-nuclear after I realised what a crockof rubbish I’d believed for so long. Even more unfortunately, while some environmentalistshave woken up, it’s looking like we will have to wait for the rest to die.
3 What to do at Port Augusta
So what are we to do at Port Augusta? And every where else in Australia?
A report, Zero Carbon Options from Ben Heard of ThinkClimate Consulting and James Pangof Pang and Brown tells us we can install a Canadian nuclear plant for about $4 billion dollars,or follow the German lead and install a combination of wind and solar for about $8 billion.Of course, the former risks a deathless nuclear meltdown if Port Augusta is ever hit by a 15metre Tsunami, and the latter risks continuing to bugger up the climate because we will have$4 billion less to deal with the remaining emission problems we still need to deal with.
At this point it is imperative to point out that while the reactor being considered in this reportis Canadian, it isn’t French Canadian.
At this point you could just go and read the aforementioned report. The rest of this documentwill just present a few more details about the comparative history of the nuclear growth inresponse to the 1970s oil crises compared with the wind and solar response to climate changeof the past decade.
4 The 1970s oil crisis and nuclear expansion
The oil crisis of 1973 provided an example of just how incredibly fast an energy infrastructurecan be rebuilt if you have the skills and the will.
The response to a rapid 5 fold increase in oil prices was that many countries rapidly rolledout substantial amounts of nuclear electricity capacity. Figure 1, using International EnergyAgency data6 illustrates the rates at which some small, medium and large countries added
4http://www.youtube.com/watch?v=SV7Rn06j_cY5http://www.monbiot.com/2011/04/04/correspondence-with-helen-caldicott/6http://www.iea.org — See Appendix A.
3

Belgium
10m
France
55m
Germany
80m
SouthKorea
45m
USA
226m
19710
1981
25
1971
10
1981
100
1991
315
1971
5.21981
65
1989
163
1997
77
2009
148
1981
277
1991
648
2000
7.82011
65
19
Nuclear
Solar+Wind
Solar
Populationc. 1980
How the anti-nuclear movementcost the climate two decades
France has been below100 grams CO2 per kilowatt hour
for 2 decades
Sources: IEA.org“Electricity generation by fuel”,
2011 German Wind+Solarfigures:Wikipedia,
Population: Google public data)[email protected] Dec 2012
0
100
200
300
400
500
600
700 TWh/yr
France
79
Germany
461
Australia
8472010: grams
CO2 per kWh
Figure 1: Comparative Growth of Nuclear and Renewable Energy
4

nuclear power during this period.
Many countries had small nuclear research programs at the beginning of the 1970s, but by 1981most had expanded these and were generating substantial amounts of electricity using nuclearreactors with a phase out of oil combustion for electricity. For example, Belgium, as shownin the Figure, despite a population below 10 million in 1975, added 25 TWh/yr in just sevenyears. They aren’t shown on the figure, but Switzerland and Sweden did much the same,adding nuclear to their predominantly hydro electricity systems. To put the Belgium figureinto context we can compare it to the German solar build. Between 2000, when it began itssolar feed in tariff policy, and 2011, Germany, with 80 million people, added just 19 TWh/yrof solar photovoltaic electricity The per capita rate of the Belgium nuclear roll out is about 10times faster than the German solar roll out. But what about the German wind roll out? TheBelgium nuclear roll out was 3 times faster than the combined wind + solar German roll out.Keep in mind that there was nothing new about solar photovoltaic technology in the year 2000.More than 10 years previously, in 1989, Australian Professor Martin Green of the Universityof NSW predicted that solar photovoltaic cells could replace coal in 10 to 15 years7. Indeedsolar photovoltaic power plants were a dismally ineffective part of the oil crisis response andquickly abandoned. Debris from these plants still pollutes some desert areas in the US.
After the initial startup phase in response to the oil crisis, additional nuclear growth duringthe 80s was huge. The figure shows France, with a population of just 50 million people in1980, adding 215 TWh/yr of electricity in a decade. This is about 6 times faster than the recentdecade’s combined German wind + solar growth. Germany’s nuclear growth during the 80swas well behind that of France but still almost double its combined wind and solar growthsince 2000. It also looks highly unlikely that solar and wind growth will accelerate as nucleargrowth did in its second decade. More on this below.
Figure 1 contains just a sample of countries, but it is fair to say that during that 1970s oil crisis,every country who tried to roll out significant amounts of nuclear power succeeded.
In contrast, it has been 15 years since the Kyoto protocol was signed and during that period nocountry has achieved anything like the oil-crisis nuclear growth using non-hydro renewableenergy technologies like wind and solar.
Germany, with over 80 million people, is often held up as a model of renewable energy deploy-ment, and it certainly has the best record in growth of wind and solar electricity technologies.But between the signing of Kyoto in 1997 and 2011, it has added just 19 TWh/yr of solar pho-tovoltaic electricity and another 46 TWh/yr of wind power. I’ve already mentioned the stag-gering cost, and poorer Germans are paying the price with high electricity bills and hundredsof thousands of disconnections annually8.
South Korea, with a population of 45 million when the Kyoto protocol was signed, has sinceadded 71 TWh/yr of nuclear electricity. She has recently begun work with the United ArabEmirates and will have 4x1400 mega watt nuclear reactors up and running by 2020 generatingsome 44 TWh/yr for the next 60 years at a capital cost of 20 billion dollars with another 20
7http://www.abc.net.au/catalyst/stories/3228140.htm8http://www.spiegel.de/international/germany/germany-s-nuclear-phase-out-brings-unexpected-costs-to-consumers-a-837007.
html
5

billion in running costs9. Compare this 40 billion dollars for 44 TWh/yr for 60 years withGermany’s 100 billion Euros for 19 TWh/yr Solar PV for about 25 years ... after which youhave to build everything all over again.
If Australia is to take climate change seriously and make steep reductions in our climate forc-ings10, then it is clear that it must consider nuclear options. The ThinkClimate Consulting andBrown and Pang report gives a concrete example of how a nuclear option might work at PortAugusta and should be considered by the committee. The report can be downloaded from theDecarbonise SA website11.
5 Climate change responses and mountain climbing
I now want to turn to more general issues which relate to our response to climate change.Because the climate science tells us that our response has to be much bigger than just electricity.
What would it do to Australia’s emissions profile if we added 3 kw of solar panels to all 7.6million Australian households? Not that this is even possible. Think of high density areas likeLane Cove in Sydney’s North Shore with its dense cluster of multi-story units. Even so, such amove would clean up just 3% of Australia’s energy consumption. That’s all.
In Australia, household electricity is about 25% of all electricity use and electricity use is about25% of all energy use. So household electricity is a quarter of a quarter ... i.e., 1/16 ... of theenergy component of our impact on the climate. And universal 3 kw panels would only dealwith about half of that. The knee jerk feeling that installing solar panels is a positive responseto climate change is short sighted and ill-informed. Such actions might bring incremental im-provement but at great cost and they wouldn’t get us to where we need to get.
To understand why incremental improvements don’t necessarily lead to the desired reductionswe need to make, you need to think about climbing mountains.
9http://www.world-nuclear.org/info/UAE_nuclear_power_inf123.html10A forcing is anything which has a climate impact, not just greenhouse gases. For example land clearing changes
how much sunlight is reflected back to space, so it is a forcing.11http://decarbonisesa.com
6

Will incremental ascents always get you to the main peak? The figure makes it obvious. If youhead to the left, you go up. Great. But you end up going in a direction that doesn’t lead youto the summit and it might not get you high enough to achieve what you need. Going rightlooks all wrong because you go down. We’ll give details of real world example shortly withthe totally useless switch by the British to natural gas.
The situation is the same when fighting climate change by setting emission reduction targetsor a tax on carbon. It’s assuming that all upward paths get you to the summit. They may not.
Industrial problem solvers in industries as diverse as bus scheduling or oil refinery planningdeal daily with these problems. They use vast computing power and sophisticated mathemat-ics to find pathways to solutions using either techniques proven to be optimal or, when thisisn’t possible, by surveying as much of the solution landscape as possible. The little pictureI’ve drawn is in two dimensions. In industrial and scientific applications, there may be thou-sands of dimensions to a problem. This means there are many more ways to head off in awrong direction.
Think about what can go wrong (and has been going wrong!) with the current short sightedresponse to tackling climate change:
• You can head into a dead end. This is one of the three problems with using natural gas(which is just methane ... CH4) to generate electricity.
– The UK has gradually substituted gas for coal over the past 20 years and its CO2 perkWh of electricity has fallen slowly from 672 grams to 470 grams. But we’ll see laterthat the real target that needs to be met is well under 100. All that capital invested ingas is dead end investment. It has been wasted, gas is just another fossil fuel whichcan never feature in any long term sustainable energy system. They’ll have to throwout that massive wasted investment and start all over again.In comparison, modern nuclear plants have a 60 year design life, and we know theymeet long term sustainable goals for emission levels.
– The second reason is even worse. CH4 burns cleaner than coal but extracting gasinevitably leads to leakages. Because CH4 is such a powerful greenhouse gas, evensmall amounts of leakage can easily offset the gains due to the cleaner burning[7].
– Last but not least. Burning coal produces sulphates which have a cooling impact onthe planet. They are a serious pollution problem but they have a short term coolingimpact which partly offsets some of the extra CO2 emissions[7, 8].
The bottom line is that gas actually makes things worse, it just substitutes things thataren’t easily measured and accounted for in agreements like Kyoto for things which are.Gas is a dangerous dead end.
• You can run out of money. This is the German solar photovoltaic feed in tariff problem.As of 2011, 100 billion Euros has cleaned up just 3.3% of German electricity.
• A similar but slightly different problem to running out of money is that you can run outof rich people.
7

Currently there is a global glut of solar panels which has been pushing down prices andsending solar panel companies bankrupt12. How can you have a global glut with solarpanels producing so little electricity?
Our Productivity Commission estimated that the Germans are paying $891 for each tonneof CO2 that solar panels reduce13. This is bizarre. The solar panel strategy in effect, relieson there being enough rich people who want to feel like they are doing “the right thing”or enough gullible Governments willing to subsidise it. The solar panel strategy globallyis simply running out of rich people.
• You can run out of alternative energy sites. This is part of the problem with wind power.It gets progressively harder to find good sites and a profit oriented company doesn’twant to build in less than optimal positions. The Germans have been busily buildingwind farms in the north of Germany, because it’s nice and windy there, but there’s noway to get that energy to the industrial heart land in the south. They need a massivegrid upgrade. Suddenly cheap wind power isn’t so cheap anymore. This ends up as arun-out-of-money problem again.
• You can simply blow the cumulative emissions budget. Climate scientists have got apretty good handle on how much CO2 you can add to the atmosphere in total. WithCO2 unlike other climate gases, it doesn’t much matter when you add it[9]. Most of itstays aloft for hundreds of years. So what matters isn’t when you emit CO2, but thecumulative emissions over the next 100 years of so. It’s fine to increase emissions for adecade if you can plunge to zero at the end of it. For example, the Chinese are lookingto build 400 huge nuclear reactors. That’s a lot of emissions from cement production, butit gets them to a very good place. In parallel, they are looking at mass produced smallmodular reactors (SMR). We, in contrast, don’t have either a plan A or a plan B, let aloneparallel plans. We just hope that a carbon tax will guide the inscrutable mechanism ofthe market to produce a solution and bumble along with emission targets. Our backup“plan” is to buy dodgy credits if we don’t meet our dodgy targets.
The carbon credit system is designed to complement shortsighted emission target think-ing14. It allows for example, a developing country to build a supercritical coal plant andget carbon credits because these plants are a slight improvement over other coal plants.This allows a dirty coal plant in Australia to offset some of its emissions by buying cred-its from the country with the new supercritical plant. Bingo. You have two coal plantspumping out CO2 and most of this CO2 is additional because the developing country hadnothing to start with.
• The obsession with targets obscures the fundamental need in in developing countries forfar more energy. They aren’t interested in targets because their current deprivations stilllook pretty serious compared to climate risks. They need technologies which simulta-neously solve both problems. Currently some 3 billion of the planet’s population stillcook with wood, or some other biomass like cattle dung. The smoke from this cooking
12http://www.nytimes.com/2012/10/05/business/global/glut-of-solar-panels-is-a-new-test-for-china.html
13http://www.pc.gov.au/projects/study/carbon-prices/report14http://thinkprogress.org/climate/2012/09/19/865471/in-the-crazy-world-of-carbon-finance-coal-now-qualifies-for-emission-reduction-credits
8

kills about 3.5 million people annually, including around a million children per year withpneumonia or acute lower respiratory tract infections15.
So while about 200,000 children die annually in India because of wood or dung smoke,Greenpeace in India is trying to stop the building of a massive nuclear complex at Jaitapurwhich would save many thousands of lives because Greenpeace think nuclear power isdangerous. Hell, there might be another meltdown and nobody would die. In the twoweeks that the world’s global media jackals waited to get pictures of 3 minor radiationburns at Fukushima, some 38,000 children died from infections caused by wood smoke.
But I guess they don’t matter because they were carbon neutral deaths and not thosescary radiation kind.
• Lastly, you can run out of time. We are busily trying one “promising” new beaut cooltechnology after another only to have them all fail for different reasons while we shyaway from a technology which we know works. We are rapidly running out of time.
6 The bigger picture
An effective response to climate change isn’t just about energy. It’s important when consideringPort Augusta to see whatever action is taken as part of a total response to climate change. Wecan’t simply invest huge sums of money at one or a few power plants and think that this isenough. It isn’t.
There are a couple of ways to view what is required for an effective response to climate change.In the following two short sections, we first present the broad requirements as determined byclimate scientists and secondly quantify the per person greenhouse gas emissions budget thatthis implies.
6.1 Getting back our recent climate
James Hansen’s NASA team has established[2] that there are three things necessary to returnthe climate to its unusual and relatively stable state. The last 10,000 years really is unusualin the climate record and may be the key to the development of crop farming[10], the criticalfeature needed to support large stable populations. It’s not quite clear if we are partly or whollyresponsible for this stability[11], or that we have merely exploited a lucky run to develop ourcivilisation. Certainly, our species and forerunners did nothing for at least a couple of hundredthousand years despite having ample mental and physical capacity. But the climate of the past10,000 years has been special and to preserve it in roughly its current form we need to do threethings:
1. Rebuild the energy infrastructure with close to carbon neutral methods. This is the En-ergyRebuild requirement. This is a natural focus in the context of decisions about PortAugusta. But there is more we must do.
15From the recently released Global Burden of Disease study. Lancet 2012; 380: 222460
9

2. Roll back 200 years of deforestation to draw down additional carbon. This is the Refor-estation requirement.
3. Slash non-carbon-dioxide contributions to climate change. This includes methane, blackcarbon and nitrous oxide and can be called the MethaneReduction requirement on the un-derstanding that it embodies a little more than simply methane.
None of these measures on their own will be sufficient to bring atmospheric CO2 back down to350 ppm (parts per million) by 2150. The last measure is particularly important because it canchange climate forcings quickly[12]. It’s methane reductions that might just help stop us fromcrossing climate tipping points from which there is no return[13].
But these measures will not be without substantial cost and disruption. Reforestation andmethane reduction will require rural restructuring which cannot be done humanely withoutadequate compensation. Australia has 70 million sheep now compared to 170 million in 1990.This is a major part of how we have been able to meet our Kyoto commitments. But reductionsin cattle are also essential. The Zero Carbon Britain 203016 report is making similar calls forsimilar reasons with plans for a 90% drop in the British beef herd and an 80% drop in the dairyherd.
Plans for Port Augusta must be seen in the light of a total climate change response plan and wemust not think that all our problems will vanish simply with an energy rebuild.
6.2 Per person emissions
The Copenhagen Diagnosis documents tell us that the sustainable level of annual COeq2 (carbon
dioxide equivalent) emissions per person for the estimated 2050 global population of some9 billion people is about one tonne each.
Australia’s current level of per person COeq2 emissions is about 25 tonnes.
Australia’s current greenhouse gas emissions are about 550 million tonnes COeq2 per annum,
with about 200 million of those coming from electricity generation. Clearly then, replacingall our electricity generation with clean sources would still leave us with 15 tonnes of GHGemissions per person. There are clearly many more sources of emissions than electricity. Someof these relate to energy and others to agriculture.
Australia’s livestock generate about 3 million tonnes of methane per annum which is consid-ered, under Kyoto rules, to be equivalent to 75 million tonnes of CO2. So even if we reducedall energy emissions to zero, our livestock emissions would still put us at 3 times the globalaverage sustainable level.
Is it even possible to get to 1 tonne per person?
Given that about 2/3 of our beef is exported, we could stop exporting that and get close to thatone tonne level, but this would still leave no room at all for any other emissions.
Globally also, meat consumption is a major problem. A 2010 paper[14] showed that FAO pro-
16http://zerocarbonbritain.com
10

jections of meat consumption growth globally would see greenhouse gas emissions due to meatproduction occupying 71% of that one tonne per person COeq
2 budget by 2050. If you spend700 kilograms of your 1000 kilo limit on meat, then there isn’t much room for everything else.
At the current French rate of 90 grams of CO2 per kWh of electricity then we can use about11,000 kWh per person per year for one tonne of CO2. The current Australian per capita elec-tricity use is just under this. This isn’t household use, but total electricity use divided by thepopulation.
Australian electricity use accounts for about a quarter of the energy we use and 95% of thatenergy comes from fossil fuels. So “simply” replacing current electrical energy with clean elec-tricity won’t come even close to meeting the one tonne target, not in Australia and not any-where. But with enough electricity, we can use it to replace most other forms of energy. We canmake synthetic aircraft fuel, we can make hydrogen for fuel cells. But we need plenty.
So the one tonne budget will be tough. To achieve it we will need to produce electricity forabout half the CO2 yield of the French. This is possible, the Swiss and the Swedes both managethis with a mix of hydro and nuclear, while the French still have some dirty fuels in theirsystem. We also must slash meat consumption and meet all our other energy needs, such aspetroleum, with electricity or other clean fuel technologies.
Unfortunately, there’s one last complication which highlights why the methane reduction plankis absolutely essential, along with reforestation in Hansen’s 3-pronged strategy. The complica-tion is that the concept COeq
2 . . . carbon dioxide equivalent, is poorly named. The factors used bythe Kyoto protocol to convert CH4 to COeq
2 understate the climate impact of methane duringthe 20 years after its release by a factor of about four[15]. So the impact on the climate of the3 million tonnes of Australian livestock methane isn’t 3 tonnes per capita, it’s more like about12.
The good news is the relationship of the livestock population to the Land Use plank of theclimate problem. Australians only live on a couple of million hectares of our 770 million hectareland mass. We have cleared about 100 million hectares since white arrival and crop about 25million. So we have 10s of millions of hectares cleared for sheep and cattle that will reforestand soak up CO2 if we remove the livestock. It’s similar globally.17. We have plenty that willreforest if we don’t use it to grow 12 million tonnes of feed for livestock. So slashing livestockpopulations simultaneously tackles two of Hansens’s three planks.
7 Concluding remarks
As you can see, the one tonne long term global greenhouse emission budget will be really toughand we can’t afford to stuff around with expensive feel good technologies. We don’t just needto replace Port Augusta with a clean electricity source, we need to either double its output sothat we can charge electric vehicles and/or make hydrogen for fuel cells.
Nuclear power is currently illegal in Australia. This is incompatible with an effective responseto climate change. Many countries, particularly Belgium, France, the US, Switzerland, and
17http://bravenewclimate.com/2010/01/05/boverty-blues-p1/
11
South Korea have shown us that low emission electricity can be obtained quickly with nuclearpower. Germany has demonstrated that even the biggest economic powerhouse in Europecan’t roll out renewables quickly, let alone affordably.
To resist nuclear because you are worried about safety issues is like standing on a railway trackbefore and oncoming train and not jumping out of the way because you may sprain an ankle.I’ve included an appendix discussing the stress and fatalities caused by anti-nuclear hysteriaat Fukushima. The only issue I haven’t dealt with is nuclear waste. Again this is irrelevantand trivial compared to climate related risks. The nuclear industry has had a solution to theso-called waste problem for decades. The solution is to use the waste as fuel in what are calledfast reactors.
The second appendix is some IEA graphs presenting the data used to build Figure 1 at thebeginning of this submission. They will repay careful examination.
I urge you to read the Decarbonise SA and Pang and Brown report and take the necessary stepswith the Federal Government to make nuclear power legal. I urge you to show leadership andconsider the United Arab Emirates path to fast tracking nuclear development so that Australiais no longer a luddite climate vandalising basket case.
Geoff RussellDecember 2012
References
[1] I. Allison, N.L. Bindoff, R.A. Bindschadler, P.M. Cox, N. de Noblet, M.H. England, J.E.Francis, N. Gruber, A.M. Haywood, D.J. Karoly, G. Kaser, C. Le Qur, T.M. Lenton, M.E.Mann, B.I. McNeil, A.J. Pitman, S. Rahmstorf, E. Rignot, H.J. Schellnhuber, S.H. Schneider,S.C. Sherwood, R.C.J. Somerville, K. Steffen, E.J. Steig, M. Visbeck, and A.J. Weaver. Thecopenhagen diagnosis. Technical report, The University of New South Wales ClimateChange Research Centre(CCRC), 2009.
[2] James Hansen, Makiko Sato, Pushker Kharecha, David Beerling, Valerie Masson-Delmotte, Mark Pagani, Maureen Raymo, Dana Royer, and James Zachos. Target At-mospheric CO2: Where should humanity aim? The Open Atmospheric Science Journal,2:271–231, 2008.
[3] Glen P. Peters, Jan C. Minx, Christopher L. Weber, and Ottmar Edenhofer. Growth inemission transfers via international trade from 1990 to 2008. Proceedings of the NationalAcademy of Sciences, 2011.
[4] IEA. Co2 emissions from fuel combustion: 2012. Technical report, The International En-ergy Agency, 2012.
[5] UNSCEAR 2008. Annex d: Health effects due to radiation from the chernobyl accident.Technical report, United Nations Scientific COmmittee on the Effects of Atomic radiation,2008.
12

[6] IARC. GLOBOCAN 2008: Cancer Incidence, Mortality and Prevalence Worldwide. IARCPressLyon, France, 2008. http://globocan.iarc.fr/.
[7] Tom Wigley. Coal to gas: the influence of methane leakage. Climatic Change, 108(3):601–608, October 2011.
[8] T. M. L. Wigley, Leon E. Clarke, James A. Edmonds, H. D. Jacoby, S. Paltsev, Hugh M.Pitcher, J. M. Reilly, Richard G. Richels, M. C. Sarofim, and Steven J. Smith. Uncertaintiesin climate stabilization. Climatic Change, 97:85–121, 2009.
[9] Myles R. Allen, David J. Frame, Chris Huntingford, Chris D. Jones, Jason A. Lowe, MalteMeinshausen, and Nicolai Meinshausen. Warming caused by cumulative carbon emis-sions towards the trillionth tonne. Nature, 458(7242):1163–1166, 2009.
[10] Peter J. Richerson, Robert Boyd, and Robert L. Bettinger. Was Agriculture Impossible dur-ing the Pleistocene but Mandatory during the Holocene? A Climate Change Hypothesis.American Antiquity, 66(3):387–411, 2001.
[11] William F. Ruddiman. Plows, plagues and petroleum. Princeton University Press, 2005.
[12] James Hansen and Makiko Sato. Greenhouse gas growth rates. Proc. Natl. Acad. Sci.,101(46):16109–16114, 2004.
[13] Drew Shindell, Johan C. I. Kuylenstierna, Elisabetta Vignati, Rita van Dingenen, MarkusAmann, Zbigniew Klimont, Susan C. Anenberg, Nicholas Muller, Greet Janssens-Maenhout, Frank Raes, Joel Schwartz, Greg Faluvegi, Luca Pozzoli, Kaarle Kupiainen,Lena Hglund-Isaksson, Lisa Emberson, David Streets, V. Ramanathan, Kevin Hicks,N. T. Kim Oanh, George Milly, Martin Williams, Volodymyr Demkine, and David Fowler.Simultaneously mitigating near-term climate change and improving human health andfood security. Science, 335(6065):183–189, 2012.
[14] Nathan Pelletier and Peter Tyedmers. Forecasting potential global environmental costs oflivestock production 2000-2050. PNAS, 104(12):4814–4819, 2010.
[15] Drew T. Shindell, Greg Faluvegi, Dorothy M. Koch, Gavin A. Schmidt, Nadine Unger,and Susanne E. Bauer. Improved attribution of climate forcing to emissions. Science,326(5953):716–718, 2009.
[16] John E. Ten Hoeve and Mark Z. Jacobson. Worldwide health effects of the fukushimadaiichi nuclear accident. Energy Environ. Sci., 5:8743–8757, 2012.
[17] The 2007 Recommendations of the International Commission on Radiological Protection.Technical report, ICRP, 2007. Edited by: J. Valentin.
[18] Kiyonori Kuriki and Kazuo Tajima. The increasing incidence of colorectal cancer and thepreventive strategy in japan. Asian Pac. J. Cancer Prev., 7(3):495–501, 2006.
[19] World Cancer Research Fund. Food, nutrition and the prevention of cancer: a globalperspective. Technical report, 2007. Available at WCRF website http://www.wcrf.org.
13
Appendices
A Fukushima fear mongering turns fatal
It is unfortunate that any recommendation for nuclear power in Australia needs to deal withdecades of nuclear fear mongering. Not only has the anti-nuclear movement delayed effectiveaction on climate change, recent events in Japan have shown exactly how deadly and destruc-tive such fear mongering can be.
In March 2011, Japan was hit by a quake and tsunami which killed some 19,000 people. Theseismic events killed along an extensive area of the north eastern coast of Japan. There were afew places along this coast where people didn’t die . . . the nuclear power plants. All but threeof the 1,000 or so workers at the 4 plants housing 10 reactors on the day of the tsunami owetheir lives to the simple fact that they were working in plants designed to cope with a sizabletsunami. Had these people been working as coastal roof top solar panel installers, or any otherkind of coastal business, many would be dead. But the tsunamis exceeded design specificationsand swamped backup generators and the end result was a deathless triple meltdown. So aftersaving lives by generating clean electricity for decades and saving more lives on the day of thetsunami, the reactor failures and subsequent events were portrayed as a disaster. The mediastaked out hospitals overflowing with victims of the actual disaster to eventually take picturesof three reactor workers with mild radiation burns in images that went global.
As the reactor failures unfolded the anti-nuclear movement went to work calculating the num-ber of cancers that the Fukushima radiation would cause over their lifetime to those involved.A paper was subsequently published[16]. Did anybody think to do this calculation when atoxic and carcinogenic plume blossomed over Adelaide with the huge Wingfield fuel fire inMarch 2012, or when the Chiba oil refinery burned for 12 days after the quake and tsunamiin Japan? How did the paper calculating the cancers due to Fukushima radiation control forthose due to the Chiba smoke? It didn’t and nobody bothered in Adelaide, because nobodyever bothers to calculate refinery fire cancers.
The method used in this paper by physicists Ten Hoeve and Mark Jacobson is explicitly warnedagainst as invalid by international radiation experts. Here’s an illustration of the method usingalcohol instead of radiation. Alcohol causes cancer. True enough. Let’s suppose that if 1000people drink a glass of wine a day then eventually 10 will get cancer due to that wine. I justmade those numbers up, they are to illustrate the method and are intended to be simple towork with rather than accurate, but it is definitely true that alcohol causes cancer and theCancer Council says there is no safe level so the situation is analogous to the situation withradiation. So how many people will get cancer if a million people drink 1/1000 of a glassper day? The anti-nuclear logic used by Hoeve and Jacobson estimates 10,000 cancers. Thepopulation is consuming 1000 times the alcohol that produced 10 cancers, therefore there willbe 10,000 cancers. That’s the logic behind the study and the anti-nuclear people have beenpulling this rubbish ever since Linus Pauling made it famous.
Radiation experts advise explicitly against the method of calculation used in the study[17]:
14

“Collective effective dose is not intended as a tool for epidemiological risk assessment,and it is inappropriate to use it in risk projections. The aggregation of very low individualdoses over extended time periods is inappropriate, and in particular, the calculation of thenumber of cancer deaths based on collective effective doses from trivial individual dosesshould be avoided.”
This is why the study appeared in an energy and environment journal and not a specialistradiological, medical or epidemiology journal. So the conclusions are ill-founded, but let’sconsider them anyway.
The study’s best estimate is that without any evacuation the Fukushima radiation would havecaused between 24 and 1800 cancers with the best estimate being 180. This is over the wholeof Japan. Given current cancer rates, Japan will have about 10 million cancers over the next30 years . . . plus 180. But of course cancer rates aren’t constant. They change according tolifestyle choices, pollution levels and so on. For example, Japan used to have what can what canreasonably be called background levels of bowel cancer. These are the low rates found aroundthe world in populations living on mainly plant based diets. The rates in men and women weresimilar and resulted in about 20,000 bowel cancers per year in the Japan of the early 1970s. Withthe Westernisation of the Japanese diet, the number of new cases of bowel cancer rose over acouple of decades to more than 101,000 annually[18], with the small increase in populationaccounting for perhaps 3,000 of these. Of all the changes to the diet, the only ones with a causalconnection to bowel cancer were the increases in red and processed meat[19]. Obesity can alsocause bowel cancer, but the Japanese rate of just 3.2 percent is one of the lowest in the world.
Over the next 30 years, Japan will have about 78, 000×30 = 2.3 million extra bowel cancers dueto dietary change and, if you trust anti-nuclear logic, about 180 due to Fukushima radiation.
The Hoeve Jacobson study is rather like some Hollywood films. The special effects are brilliantand the technical excellence is remarkable, but nothing can save a fundamentally silly plot-line.
But such was the fear mongering panic after the reactor failures that an extended evacuationwas decided upon. According to Hoeve and Jacobson, the panic and haste of the evacuationkilled some 600 people. It is amazing how much expertise they expend on estimating theirfigure of 180 cancers and how little they spend on checking the 600 figure on evacuation deaths.It’s a news report, it must be right. Nevertheless, Hoeve and Jacobson plough on, assumethe figure is accurate and apply their considerable skills to estimate the cancers saved by theevacuation at about 22% of the cancers. This is a savings of about 40 cancers over the next fewdecades.
So if we take the results at face value, then the result of anti-nuclear hysteria at Fukushima hasbeen to kill some 600 people to prevent 40 cancers.
The Fukushima reactors saved lives on the day of the tsunami and have been preventing allmanner of diseases for decades. The panic whipped up by the anti-nuclear movement com-pleted the devastation began by the tsunami and prompted an unnecessary evacuation thatkilled people. The evacuation also killed many animals. These were frequently left to starve,often locked in pens or let loose on deserted streets.
But it doesn’t stop there. On top of the deaths and stress induced by the anti-nuclear hysteria of
15
the evacuation, the Japanese are wasting billions of dollars and considerable scarce resourcesdealing with a miniscule problem while hundreds of thousands languish in evacuation centreswith much, much bigger problems than the odd mSv (milli Sievert) of radiation. The envi-ronmental destruction of decontamination is also considerable. Forests are being felled andprecious top soil removed18 to “decontaminate” areas whose raised radiation levels are lowerthan normal radiation levels in certain other parts of the world.
18For example:http://www.jaea.go.jp/fukushima/decon04/english/2-1-4\%20Two_Demonstration_Project.pdf While there are point sources requiring cleanup around Fukushima, thelinked document illustrates the bizarre activities being undertaken. Many areas being “decontaminated” haveradiation levels assessed at below 3 µSv (micro Sievert) per hour. If you live 24x7 in an area of 3 µSv per hour,at the end of a year you’d have, at most, 26 mSv, about as much as a full body CT scan. Being inside a house orvehicle or even on a bicycle reduces your exposure.
16

B Electricity generation by fuel
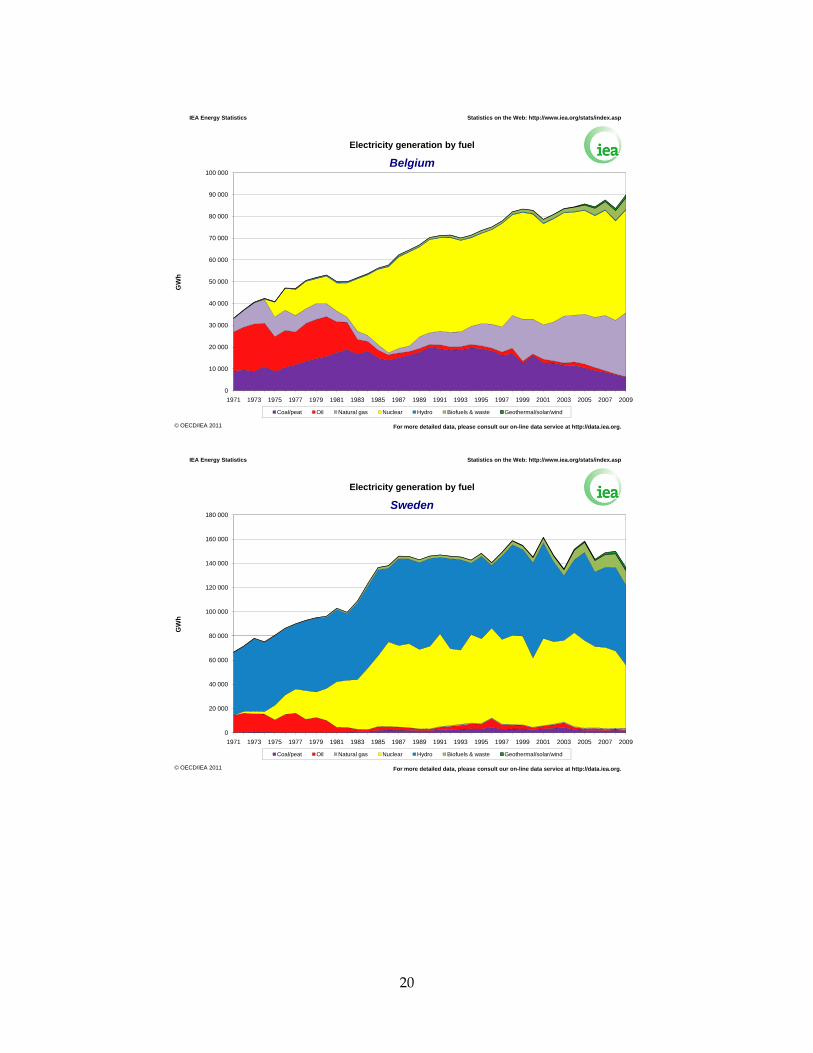
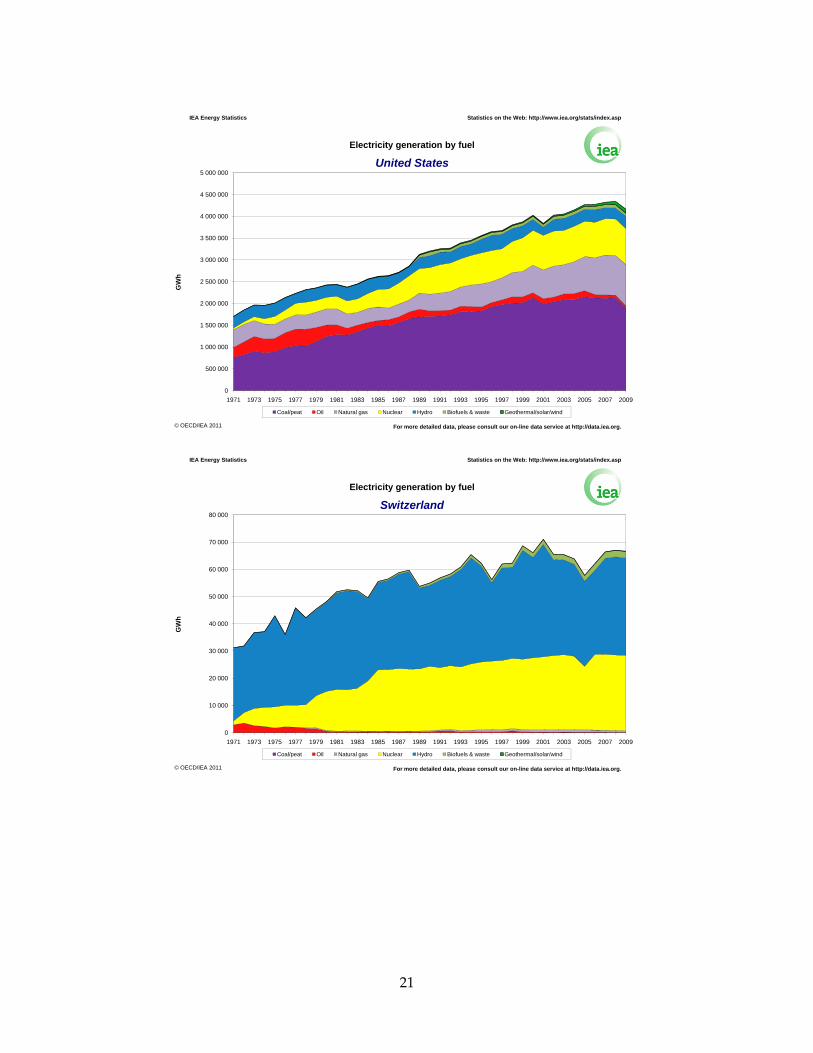
These graphs are from the International Energy Agency and show the breakdown of electricityproduction by fuel type to 2009. Note that the y-scales differ among the graphs, but that thegrowth of the yellow Nuclear slab within any single graph can be compared with the growth ofthe Other slab representing wind, solar and geothermal. It is useful to compare nuclear growthduring the end of the 1970s with renewable growth during the first 9 years of the 2000s.
Germany and Denmark are often held up as the leaders of the renewable revolution.
17

Compare Germany with France:
400 000
500 000
600 000
700 000
Electricity generation by fuel
IEA Energy Statistics
Germany
Statistics on the Web: http://www.iea.org/stats/index.asp
0
100 000
200 000
300 000
400 000
1971 1973 1975 1977 1979 1981 1983 1985 1987 1989 1991 1993 1995 1997 1999 2001 2003 2005 2007 2009
GW
h
Coal/peat Oil Natural gas Nuclear Hydro Biofuels & waste Geothermal/solar/wind
For more detailed data, please consult our on-line data service at http://data.iea.org.© OECD/IEA 2011 For more detailed data, please consult our on-line data service at http://data.iea.org.© OECD/IEA 2011
400 000
500 000
600 000
700 000
Electricity generation by fuel
IEA Energy Statistics
France
Statistics on the Web: http://www.iea.org/stats/index.asp
0
100 000
200 000
300 000
400 000
1971 1973 1975 1977 1979 1981 1983 1985 1987 1989 1991 1993 1995 1997 1999 2001 2003 2005 2007 2009
GW
h
Coal/peat Oil Natural gas Nuclear Hydro Biofuels & waste Geothermal/solar/wind
For more detailed data, please consult our on-line data service at http://data.iea.org.© OECD/IEA 2011 For more detailed data, please consult our on-line data service at http://data.iea.org.© OECD/IEA 2011
18
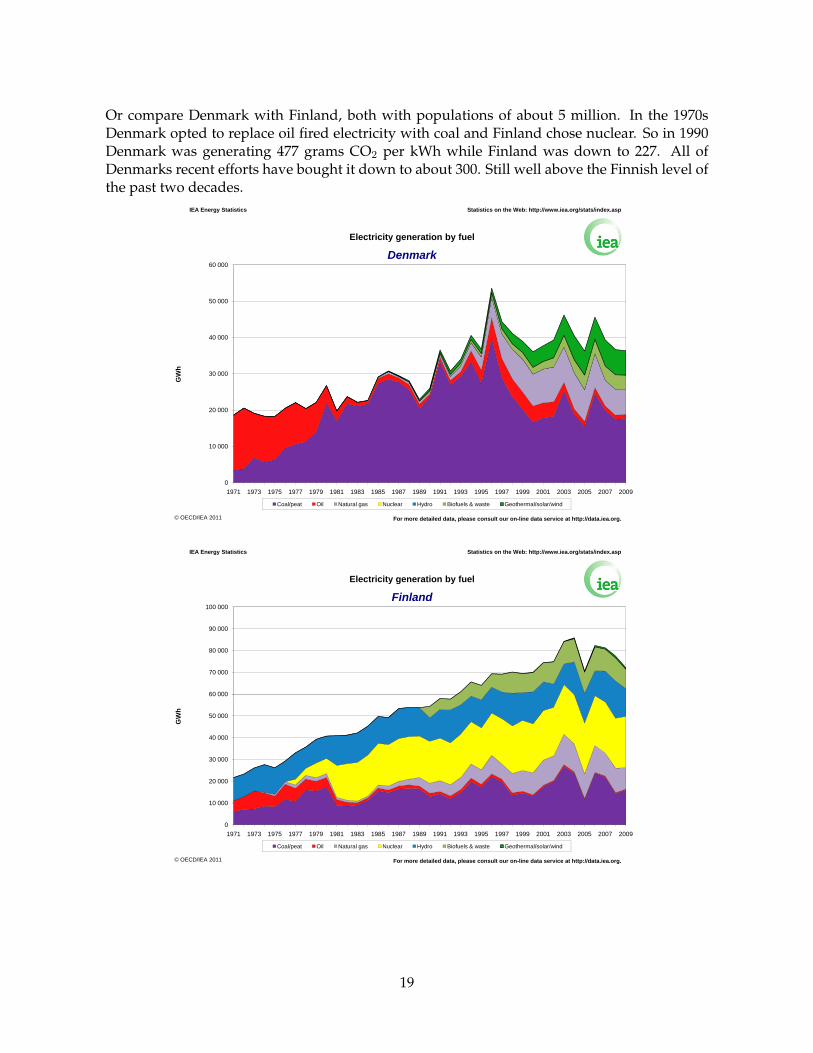
Or compare Denmark with Finland, both with populations of about 5 million. In the 1970sDenmark opted to replace oil fired electricity with coal and Finland chose nuclear. So in 1990Denmark was generating 477 grams CO2 per kWh while Finland was down to 227. All ofDenmarks recent efforts have bought it down to about 300. Still well above the Finnish level ofthe past two decades.
40 000
50 000
60 000
Electricity generation by fuel
IEA Energy Statistics
Denmark
Statistics on the Web: http://www.iea.org/stats/index.asp
0
10 000
20 000
30 000
1971 1973 1975 1977 1979 1981 1983 1985 1987 1989 1991 1993 1995 1997 1999 2001 2003 2005 2007 2009
GW
h
Coal/peat Oil Natural gas Nuclear Hydro Biofuels & waste Geothermal/solar/wind
For more detailed data, please consult our on-line data service at http://data.iea.org.© OECD/IEA 2011 For more detailed data, please consult our on-line data service at http://data.iea.org.© OECD/IEA 2011
60 000
70 000
80 000
90 000
100 000
Electricity generation by fuel
IEA Energy Statistics
Finland
Statistics on the Web: http://www.iea.org/stats/index.asp
0
10 000
20 000
30 000
40 000
50 000
1971 1973 1975 1977 1979 1981 1983 1985 1987 1989 1991 1993 1995 1997 1999 2001 2003 2005 2007 2009
GW
h
Coal/peat Oil Natural gas Nuclear Hydro Biofuels & waste Geothermal/solar/wind
For more detailed data, please consult our on-line data service at http://data.iea.org.© OECD/IEA 2011 For more detailed data, please consult our on-line data service at http://data.iea.org.© OECD/IEA 2011
19
60 000
70 000
80 000
90 000
100 000
Electricity generation by fuel
IEA Energy Statistics
Belgium
Statistics on the Web: http://www.iea.org/stats/index.asp
0
10 000
20 000
30 000
40 000
50 000
1971 1973 1975 1977 1979 1981 1983 1985 1987 1989 1991 1993 1995 1997 1999 2001 2003 2005 2007 2009
GW
h
Coal/peat Oil Natural gas Nuclear Hydro Biofuels & waste Geothermal/solar/wind
For more detailed data, please consult our on-line data service at http://data.iea.org.© OECD/IEA 2011 For more detailed data, please consult our on-line data service at http://data.iea.org.© OECD/IEA 2011
100 000
120 000
140 000
160 000
180 000
Electricity generation by fuel
IEA Energy Statistics
Sweden
Statistics on the Web: http://www.iea.org/stats/index.asp
0
20 000
40 000
60 000
80 000
100 000
1971 1973 1975 1977 1979 1981 1983 1985 1987 1989 1991 1993 1995 1997 1999 2001 2003 2005 2007 2009
GW
h
Coal/peat Oil Natural gas Nuclear Hydro Biofuels & waste Geothermal/solar/wind
For more detailed data, please consult our on-line data service at http://data.iea.org.© OECD/IEA 2011 For more detailed data, please consult our on-line data service at http://data.iea.org.© OECD/IEA 2011
20
3 000 000
3 500 000
4 000 000
4 500 000
5 000 000
Electricity generation by fuel
IEA Energy Statistics
United States
Statistics on the Web: http://www.iea.org/stats/index.asp
0
500 000
1 000 000
1 500 000
2 000 000
2 500 000
1971 1973 1975 1977 1979 1981 1983 1985 1987 1989 1991 1993 1995 1997 1999 2001 2003 2005 2007 2009
GW
h
Coal/peat Oil Natural gas Nuclear Hydro Biofuels & waste Geothermal/solar/wind
For more detailed data, please consult our on-line data service at http://data.iea.org.© OECD/IEA 2011 For more detailed data, please consult our on-line data service at http://data.iea.org.© OECD/IEA 2011
50 000
60 000
70 000
80 000
Electricity generation by fuel
IEA Energy Statistics
Switzerland
Statistics on the Web: http://www.iea.org/stats/index.asp
0
10 000
20 000
30 000
40 000
1971 1973 1975 1977 1979 1981 1983 1985 1987 1989 1991 1993 1995 1997 1999 2001 2003 2005 2007 2009
GW
h
Coal/peat Oil Natural gas Nuclear Hydro Biofuels & waste Geothermal/solar/wind
For more detailed data, please consult our on-line data service at http://data.iea.org.© OECD/IEA 2011 For more detailed data, please consult our on-line data service at http://data.iea.org.© OECD/IEA 2011
21

300 000
350 000
400 000
450 000
500 000
Electricity generation by fuel
IEA Energy Statistics
Korea
Statistics on the Web: http://www.iea.org/stats/index.asp
0
50 000
100 000
150 000
200 000
250 000
1971 1973 1975 1977 1979 1981 1983 1985 1987 1989 1991 1993 1995 1997 1999 2001 2003 2005 2007 2009
GW
h
Coal/peat Oil Natural gas Nuclear Hydro Biofuels & waste Geothermal/solar/wind
For more detailed data, please consult our on-line data service at http://data.iea.org.© OECD/IEA 2011 For more detailed data, please consult our on-line data service at http://data.iea.org.© OECD/IEA 2011
22