The polymeric glyco-linker controls the signal outputs for ...
12
Nanoscale PAPER Cite this: Nanoscale, 2021, 13, 10837 Received 10th March 2021, Accepted 3rd June 2021 DOI: 10.1039/d1nr01548f rsc.li/nanoscale The polymeric glyco-linker controls the signal outputs for plasmonic gold nanorod biosensors due to biocorona formation† Alessia Pancaro, a,b Michal Szymonik, a Panagiotis G. Georgiou, c Alexander N. Baker, c Marc Walker, d Peter Adriaensens, e Jelle Hendrix, b Matthew I. Gibson * c,f and Inge Nelissen * a Gold nanorods (GNRs) are a promising platform for nanoplasmonic biosensing. The localised surface plasmon resonance (LSPR) peak of GNRs is located in the near-infrared optical window and is sensitive to local binding events, enabling label-free detection of biomarkers in complex biological fluids. A key chal- lenge in the development of such sensors is achieving target affinity and selectivity, while both minimizing non-specific binding and maintaining colloidal stability. Herein, we reveal how GNRs decorated with galactosamine-terminated polymer ligands display significantly different binding responses in buffer com- pared to serum, due to biocorona formation, and how biocorona displacement due to lectin binding plays a key role in their optical responses. GNRs were coated with either poly(N-(2-hydroxypropyl)methacryl- amide) (PHPMA) or poly(N-hydroxyethyl acrylamide) (PHEA) prepared via reversible addition–fragmenta- tion chain-transfer (RAFT) polymerisation and end-functionalised with galactosamine (Gal) as the lectin- targeting unit. In buffer Gal-PHEA-coated GNRs aggregated upon soybean agglutinin (SBA) addition, whereas Gal-PHPMA-coated GNRs exhibited a red-shift of the LSPR spectrum without aggregation. In contrast, when incubated in serum Gal-PHPMA-coated nanorods showed no binding response, while Gal-PHEA GNRs exhibited a dose-dependent blue-shift of the LSPR peak, which is the opposite direction (red-shift) to what was observed in buffer. This differential behaviour was attributed to biocorona for- mation onto both polymer-coated GNRs, shown by differential centrifugal sedimentation and nano- particle tracking analysis. Upon addition of SBA to the Gal-PHEA coated nanorods, signal was generated due to displacement of weakly-bound biocorona components by lectin binding. However, in the case of Gal-PHPMA which had a thicker corona, attributed to lower polymer grafting densities, addition of SBA did not lead to biocorona displacement and there was no signal output. These results show that plasmo- nic optical responses in complex biological media can be significantly affected by biocorona formation, and that biocorona formation itself does not prevent sensing so long as its exact nature (e.g. ‘hard versus soft’) is tuned. Introduction Spherical gold nanoparticles (GNPs) are one of the most widely studied nanomaterials. Their established and versatile synthetic methods, biocompatibility, ease of surface functiona- lisation and unique optical properties 1,2 have facilitated a wide range of applications in diagnostics, therapeutics and drug delivery. 3–6 The optical properties of GNPs are dominated by the phenomenon of localised surface plasmon resonance (LSPR), a collective oscillation of electrons in resonance with incident light, strongly localised to the GNPs surface. 7,8 The wavelength of this oscillation is dependent on the size of the particle and the refractive index of the surrounding medium. This property has been exploited to produce biosensor devices, † Electronic supplementary information (ESI) available. See DOI: 10.1039/ d1nr01548f a Health Unit, Flemish Institute for Technological Research (VITO), Boeretang 200, Mol, BE-2400, Belgium. E-mail: [email protected] b Dynamic Bioimaging Lab, Advanced Optical Microscopy Centre and Biomedical Research Institute, Hasselt University, Agoralaan C, Diepenbeek, BE-3590, Belgium c Department of Chemistry, University of Warwick, Gibbet Hill Road, Coventry, CV4 7AL, UK. E-mail: [email protected] d Department of Physics, University of Warwick, Gibbet Hill Road, Coventry, CV4 7AL, UK e Applied and Analytical Chemistry, Institute for Materials Research, Hasselt University, Agoralaan D, Diepenbeek, BE-3590, Belgium f Warwick Medical School, University of Warwick, Gibbet Hill Road, Coventry, CV4 7AL, UK This journal is © The Royal Society of Chemistry 2021 Nanoscale, 2021, 13, 10837–10848 | 10837 Open Access Article. Published on 03 June 2021. Downloaded on 2/5/2022 11:42:17 PM. This article is licensed under a Creative Commons Attribution 3.0 Unported Licence. View Article Online View Journal | View Issue
Transcript of The polymeric glyco-linker controls the signal outputs for ...

Nanoscale
PAPER
Cite this: Nanoscale, 2021, 13, 10837
Received 10th March 2021,Accepted 3rd June 2021
DOI: 10.1039/d1nr01548f
rsc.li/nanoscale
The polymeric glyco-linker controls the signaloutputs for plasmonic gold nanorod biosensorsdue to biocorona formation†
Alessia Pancaro, a,b Michal Szymonik, a Panagiotis G. Georgiou, c
Alexander N. Baker,c Marc Walker,d Peter Adriaensens, e Jelle Hendrix, b
Matthew I. Gibson *c,f and Inge Nelissen *a
Gold nanorods (GNRs) are a promising platform for nanoplasmonic biosensing. The localised surface
plasmon resonance (LSPR) peak of GNRs is located in the near-infrared optical window and is sensitive to
local binding events, enabling label-free detection of biomarkers in complex biological fluids. A key chal-
lenge in the development of such sensors is achieving target affinity and selectivity, while both minimizing
non-specific binding and maintaining colloidal stability. Herein, we reveal how GNRs decorated with
galactosamine-terminated polymer ligands display significantly different binding responses in buffer com-
pared to serum, due to biocorona formation, and how biocorona displacement due to lectin binding plays
a key role in their optical responses. GNRs were coated with either poly(N-(2-hydroxypropyl)methacryl-
amide) (PHPMA) or poly(N-hydroxyethyl acrylamide) (PHEA) prepared via reversible addition–fragmenta-
tion chain-transfer (RAFT) polymerisation and end-functionalised with galactosamine (Gal) as the lectin-
targeting unit. In buffer Gal-PHEA-coated GNRs aggregated upon soybean agglutinin (SBA) addition,
whereas Gal-PHPMA-coated GNRs exhibited a red-shift of the LSPR spectrum without aggregation. In
contrast, when incubated in serum Gal-PHPMA-coated nanorods showed no binding response, while
Gal-PHEA GNRs exhibited a dose-dependent blue-shift of the LSPR peak, which is the opposite direction
(red-shift) to what was observed in buffer. This differential behaviour was attributed to biocorona for-
mation onto both polymer-coated GNRs, shown by differential centrifugal sedimentation and nano-
particle tracking analysis. Upon addition of SBA to the Gal-PHEA coated nanorods, signal was generated
due to displacement of weakly-bound biocorona components by lectin binding. However, in the case of
Gal-PHPMA which had a thicker corona, attributed to lower polymer grafting densities, addition of SBA
did not lead to biocorona displacement and there was no signal output. These results show that plasmo-
nic optical responses in complex biological media can be significantly affected by biocorona formation,
and that biocorona formation itself does not prevent sensing so long as its exact nature (e.g. ‘hard versus
soft’) is tuned.
Introduction
Spherical gold nanoparticles (GNPs) are one of the mostwidely studied nanomaterials. Their established and versatilesynthetic methods, biocompatibility, ease of surface functiona-lisation and unique optical properties1,2 have facilitated a widerange of applications in diagnostics, therapeutics and drugdelivery.3–6 The optical properties of GNPs are dominated bythe phenomenon of localised surface plasmon resonance(LSPR), a collective oscillation of electrons in resonance withincident light, strongly localised to the GNPs surface.7,8 Thewavelength of this oscillation is dependent on the size of theparticle and the refractive index of the surrounding medium.This property has been exploited to produce biosensor devices,
†Electronic supplementary information (ESI) available. See DOI: 10.1039/d1nr01548f
aHealth Unit, Flemish Institute for Technological Research (VITO), Boeretang 200,
Mol, BE-2400, Belgium. E-mail: [email protected] Bioimaging Lab, Advanced Optical Microscopy Centre and Biomedical
Research Institute, Hasselt University, Agoralaan C, Diepenbeek, BE-3590, BelgiumcDepartment of Chemistry, University of Warwick, Gibbet Hill Road, Coventry, CV4
7AL, UK. E-mail: [email protected] of Physics, University of Warwick, Gibbet Hill Road, Coventry, CV4 7AL,
UKeApplied and Analytical Chemistry, Institute for Materials Research, Hasselt
University, Agoralaan D, Diepenbeek, BE-3590, BelgiumfWarwick Medical School, University of Warwick, Gibbet Hill Road, Coventry, CV4
7AL, UK
This journal is © The Royal Society of Chemistry 2021 Nanoscale, 2021, 13, 10837–10848 | 10837
Ope
n A
cces
s A
rtic
le. P
ublis
hed
on 0
3 Ju
ne 2
021.
Dow
nloa
ded
on 2
/5/2
022
11:4
2:17
PM
. T
his
artic
le is
lice
nsed
und
er a
Cre
ativ
e C
omm
ons
Attr
ibut
ion
3.0
Unp
orte
d L
icen
ce.
View Article OnlineView Journal | View Issue
as the binding of biomolecules to the GNP’s surface leads tochanges in the LSPR peak, which are easily measured.9,10 Manycolorimetric assays, for chemical and biological sensing appli-cations, have been developed based on, for example, aggrega-tion, etching, growth and nanozymes.11 For example, a colori-metric assay using glyco-GNPs have been reported for the detec-tion of lectins, cholera toxin and influenza viruses.12–14
Changes in the nanoparticle shape affect a GNR’s plasmo-nic properties, which can be advantageous for biosensingapplications. The anisotropy of gold nanorods (GNRs) leads toa splitting of the optical absorption bands into two separateLSPR peaks corresponding to resonances along the short andlong axes of the rod, termed the transverse and longitudinalbands respectively. The longitudinal band is typically moresensitive to local refractive index changes than the transversepeak.15 Importantly, and in contrast to spherical GNPs, theabsorbance maximum of this peak is dependent on the rodaspect ratio and can be fine-tuned from visible to near-infrared(λ ∼ 600 to >1300 nm), where biological tissues exhibit thehighest optical transparency.10,16–18 This allows measurementdirectly in complex biological fluids such as blood, enabling abroad range of in vitro and in vivo applications.19 Therefore,GNR-based LSPR sensors represent an important advancementfor rapid, simple, label-free, and sensitive detection of lowtarget molecule concentrations.20–23 For example, lactose-func-tionalised GNRs have been fabricated as efficient biosensors todetect the cancer biomarker Galectin-1 at concentrationsbelow 10−13 M.24 Lipid-capped GNRs have been used for thelabel-free detection of a lipophilic drug in aqueous solutionand a lipopeptide in serum.25 GNRs can also provide signalenhancement in chip-based SPR detection. For example, Lawet al. have shown a 40-fold sensitivity enhancement for thedetection of tumour necrosis factor alpha (TNF-α) when usingantibody-conjugated GNRs as a plasmonic coupling partner.26
Compared to other plasmonic nanostructures, gold nanorodsshow high plasmonic surface sensitivity due to their highaspect ratio.27
To enable LSPR-based biosensing, the nanoparticles mustbe decorated with recognition units tethered to the surface bya ligand. In this work, we focused on the detection of lectins,which are glycan-binding proteins that play a key role in manybiological processes, including cell–cell adhesion, cell reco-gnition, cell differentiation, and infection by pathogens.28–30
Lectins interact only weakly (millimolar Kd values) with indi-vidual monosaccharides, however multivalent interactionsresult in Kd values in the nanomolar range towards theirglycan targets.31–35 The multivalent presentation of the sameglycan compensates for the low lectin–monosaccharideaffinity, leading to a non-linear increase in binding affinity,termed the “cluster glycoside effect”.32,36
A broad range of surface ligands including peptides,37 poly-mers,38 and cationic thiolated ligands39 among others,40 havebeen used to stabilize nanoparticles and anchor functionalgroups. Using polymeric ligands, Gibson and co-workers havedemonstrated the importance of tuning the polymer length toachieve the crucial balance between stability and aggregation
of glyco-nanoparticles upon lectin binding.41–44 In addition,ligands play a key role in controlling particle surface properties,such as charge and chemical reactivity, which drive a particle’sinteractions with bio(macro)molecules. Exposure of nano-particles to complex biological media leads to the formation ofa biomolecular corona, termed a “biocorona”.45–49 The biocoro-nas initially consist of the most abundant and fast-diffusingmolecules in solution, before being partially replaced over timeby proteins that have a higher affinity for the nanoparticlesurface. These higher affinity proteins can act to mask theligands displayed on the nanoparticles, an hence interfere withtheir recognition capability.50,51 For example, transferrin coatednanoparticles have been shown to loose their targetting capacitydue to protein corona formation.52 Understanding the dynamicexchange rates between bound and unbound proteins on nano-particles in biological systems is vital for the design of newnanoparticle-based biosensors capable of detecting target mole-cules directly in the physiological environment.53–56
Herein, we study the sensing performance of GNRs coatedwith galactosamine-modified polymeric linkers for the detec-tion of the lectin soybean agglutinin (SBA), used as a modelanalyte. We observe how the structure of surface tetheredglycopolymers controlled the magnitude and reversibility ofserum–biomolecule binding to the nanoparticles and explorethe impact of this on biosensing in serum, compared tosimple buffers. It is found that careful selection of the poly-meric linker promotes the formation of a reversible biocorona,which can be displaced upon lectin binding, generating signal.This shows that biocorona formation in complex media doesnot fundamentally prevent gold nanorod biosensing and thatmacromolecular engineering of the polymer tethers can beused to optimise device performance.
ExperimentalMaterials
All reagents were used as supplied, unless otherwise stated.Citrate-stabilised gold nanorods (GNRs) of 10 nm width and38 nm length (λmax = 780 nm) were purchased from Nanopartz.Human serum (H6914), D-(+)-galactosamine hydrochloride(99%), HEPES buffer, NaCl, CaCl2, triethylamine (>99%),2-(dodecylthiocarbonothioylthio)-2-methylpropionic acid penta-fluorophenyl ester (98%, PFP-DMP), and monomers N-(2-hydro-xypropyl)methacrylamide (99%, HPMA) and N-hydroxyethylacrylamide (97%, HEA) were all purchased from Sigma-Aldrich.MnCl2 was purchased from VWR. Soybean agglutinin (SBA)lectin was obtained from Vector Laboratories. Photo-polymeris-ation reactions were conducted using a blue LED strip light(3 meters with 180 LEDs, λ = 460–465 nm). All experiments wereconducted using Milli-Q grade water (resistivity of 18.2 mΩ cmat 25 °C, 4 ppb total organic carbon).
Methods
Polymer synthesis and glycan modification. The synthesisand characterisation of PFP-PHPMA (pentafluorophenyl ester-
Paper Nanoscale
10838 | Nanoscale, 2021, 13, 10837–10848 This journal is © The Royal Society of Chemistry 2021
Ope
n A
cces
s A
rtic
le. P
ublis
hed
on 0
3 Ju
ne 2
021.
Dow
nloa
ded
on 2
/5/2
022
11:4
2:17
PM
. T
his
artic
le is
lice
nsed
und
er a
Cre
ativ
e C
omm
ons
Attr
ibut
ion
3.0
Unp
orte
d L
icen
ce.
View Article Online

poly(N-(2-hydroxypropyl) methacrylamide)) and PFP-PHEA(pentafluorophenyl ester-poly(N-hydroxyethyl acrylamide))with a range of degrees of polymerisations (40, 50, 55, 68 forPFP-PHPMA and 26, 35, 50, 60 for PFP-PHEA), as well as end-group modification using galactosamine (Gal) were performedaccording to previously reported experimental protocols (seeESI† for detailed synthetic procedure).57
(Glyco)polymer conjugation onto gold nanorods surface.Approximately 2 mg of each (glyco)polymer was dissolved in200 µL of water and mixed by pipetting with 800 µL of GNRsuspension at 5 OD. After a 30 min incubation at room temp-erature in the dark, the particles were sonicated for 1 minusing an ultrasonic bath at 40 kHz (Branson CPX1800H), cen-trifuged at 12 000g and 20 °C for 10 min, and the supernatantremoved. This was followed by 3 cycles of re-suspension in1 mL water, centrifugation and decanting. A Sigma 3-30KS cen-trifuge was used with 1.5 mL volume tubes for all preparativecentrifugation. The particles were finally resuspended in 1 mLwater (OD = 4) and stored in polypropylene graduated tubes at4 °C until use.
Saline stability-induced aggregation studies. A solution of1 M NaCl was serially diluted down to 0.031 M in clear, flat-bottomed 384-well NUNC plates and used for all opticalmeasurements. 3 µL of citrate-GNRs and conjugated GNRswere added to each well, mixed and incubated at room temp-erature for 30 min, and then an absorbance spectrum wasrecorded from 400 nm to 1000 nm with 1 nm resolution.
Lectin binding studies by absorbance. A stock solution of1 mg mL−1 SBA was prepared in 10 mM HEPES buffer (pH 7.5)containing 50 mM NaCl, 0.1 mM CaCl2 and 0.01 mM MnCl2.Functionalised GNRs (3 µL, yielding ∼0.3 final OD) were addedto a series of different SBA concentrations (10–100 µg mL−1) inHEPES buffer for a final volume of 40 µL. The plate was gentlyagitated at room temperature for 30 min, and then absorbancespectra were recorded every 30 min over 2 hours from 400 to999 nm with 1 nm interval using a Biotek Synergy HT micro-plate reader.
For the assay carried out in serum, lyophilised SBA was dis-solved in human serum at 1 mg mL−1 and diluted in serum(10–100) µg mL−1. A CLARIOstar Plus plate reader (BMGLabtech) was used to record spectra every 5 min, with 30seconds of plate shaking prior to each measurement.
(Glyco)polymer-coated GNRs studies in serum. (Gal)-PHEA35
coated GNRs (300 µL) were added to 1.5 mL of human serumin a 2 mL Eppendorf Protein LoBind tube and incubated atroom temperature for 2 hours on a shaker at 40 rpm to allowformation of a biocorona on the particles’ surface. The GNRssuspension was centrifuged at 12 000g for 10 min at 20 °C, thesupernatant was removed and the pellet washed three times bypipetting in 1 mL of 10 mM HEPES buffer. The particles werefinally resuspended in 300 µL HEPES buffer and 40 µLvolumes transferred to the wells of a 384-well plate. UV-Visspectra were recorded every 5 min. After 1 hour, 4 µL of 1 mgmL−1 SBA was injected to a final concentration of 100 µg mL−1
and the response monitored for a further 3 hours. To quantifythe thickness of the biocorona, Gal-PHPMA40 and (Gal)-
PHEA35 coated GNRs were analysed directly in serum (withoutwashing) using differential centrifugal sedimentation (DCS) asdescribed below.
Characterisation techniques
NMR spectroscopy. Proton (1H-NMR) and fluorine(19F-NMR) nuclear magnetic resonance spectra were recordedat 300 MHz or 400 MHz on a Bruker DPX-300 or DPX-400spectrometer respectively, with methanol-d4 as the solvent.Chemical shifts of protons are reported as δ in parts permillion (ppm). Alternatively, NMR spectra were recorded atroom temperature on a Varian/Agilent Inova 400 MHz spectro-meter using a 5 mm four-nucleus pulsed field gradient (PFG)probe. For 1H-NMR, the chemical shift scale (δ) in ppm wascalibrated relative to methanol-d4 (3.31 ppm), while CFCl3(0 ppm) was used for 19F-NMR. For 1H-NMR (19F-NMR), freeinduction decays were collected with a 90° pulse of 6.8 (8.0) μs,a spectral width of 6.6 (21) kHz, an acquisition time of 3.5(0.5) s, a preparation delay of 12 (1) s and 32 (400) accumu-lations (scans). A line-broadening factor of 0.3 Hz (1H-spectra)or 5 Hz (19F-spectra) was applied before Fourier transformationto the frequency domain.
FT-IR spectroscopy. Fourier Transformed-Infrared (FT-IR)spectroscopy measurements were carried out in the range of650 to 4000 cm−1 using a Cary 630 FT-IR spectrometer(Agilent) or Nicolet iS10 spectrometer (Thermo FisherScientific) in the range of 4000 to 400 cm−1.
Size exclusion chromatography (SEC). SEC analysis was per-formed on an Infinity II MDS instrument (Agilent) equippedwith differential refractive index (DRI), viscometry (VS), dualangle light scatter (LS) and variable wavelength UV detectors.The system was equipped with 2 × PLgel Mixed D columns(300 × 7.5 mm) and a PLgel 5 µm guard column. The mobilephase used was dimethylformamide (DMF) HPLC grade con-taining 5 mM NH4BF4 at 50 °C at flow rate of 1.0 mL min−1.Poly(methyl methacrylate) (PMMA) standards (AgilentEasyVials) were used for calibration between 555–955 000 gmol−1. Analyte samples were filtered through a nylon mem-brane with 0.22 μm pore size before injection. Number averagemolecular weights (Mn), weight average molecular weights(Mw) and dispersities (ĐM = Mw/Mn) were determined by con-ventional calibration using Agilent SEC software.
UV-Visible spectroscopy. UV-Vis absorption spectra wereacquired at room temperature (25 °C) on a CLARIOstar Plusspectrophotometer. All absorbance spectra were recordedbetween λ = 400–1000 nm with 1 nm resolution and 30seconds of plate shaking at 100 RPM applied before eachmeasurement. Results were smoothed using a Savitzky–Golayfilter (order 4, window width 31). Peak maxima were deter-mined from the zero crossings of the derivative of thesmoothed data. All measurements were performed with atleast two replicates (n ≥ 2).
Differential centrifugal sedimentation (DCS) was performedto assess binding of glycopolymers, serum molecules and SBAon the GNR surface by measuring the particles’ size distri-bution. For this a CPS DC24000 disc centrifuge was used with
Nanoscale Paper
This journal is © The Royal Society of Chemistry 2021 Nanoscale, 2021, 13, 10837–10848 | 10839
Ope
n A
cces
s A
rtic
le. P
ublis
hed
on 0
3 Ju
ne 2
021.
Dow
nloa
ded
on 2
/5/2
022
11:4
2:17
PM
. T
his
artic
le is
lice
nsed
und
er a
Cre
ativ
e C
omm
ons
Attr
ibut
ion
3.0
Unp
orte
d L
icen
ce.
View Article Online

a 8–24% (w/w) sucrose gradient and a rotation speed of 24 000RPM. For measurements in serum, a fresh sucrose gradientwas prepared for each measurement. Before each run, poly-vinyl chloride latex beads (239 nm) with narrow size distributionare used as calibration standard to ensure accuracy of themeasurements. All the measurements were performed with atleast two replicates (n ≥ 2). As the settling of particles is shape-dependent, for GNRs a ‘non-sphericity factor’ (NSF) of 2.85was applied in the CPS software. The binding of biomoleculesonto the GNRs’ surface increases the particles’ size, but lowerstheir overall density. The CPS analysis assumes a constant par-ticle density, so over-estimating the particle density means anunder-estimate of the particle size.58,59 For this reason, thebinding of polymers or biomolecules to the GNRs results in anapparent decrease in the particle size reported by CPS. A core–shell mathematical model was used to analyse the coatingthickness of the GNRs as previously described.60,61
Nanoparticle tracking analysis (NTA) was performed tomeasure GNR sizes before and after functionalisation using aNanoSight NS500 instrument in scatter mode with a laseroutput of 75 mW at 532 nm (green) and sCMOS camera(camera level set at 15). All the samples were analysed in dupli-cate at 25 °C and 3 videos of 60 seconds were recorded (1499frames with 25 frames per second) for each sample. Thenumber of particles/frame ranged from 30 to 90 for the GNRsamples, and none were detected in the buffer control. Thesamples were diluted to 108–109 particles per mL in MilliQwater, or 0.22 µm (Millex-GV) filtered HEPES buffer for serum-incubated samples that were washed in buffer. For calibration,100 nm polystyrene (PS) microspheres were used. The modewas derived from a particle number concentration-based sizedistribution using the NTA software version 3.0.
ζ-Potential was measured on a ZetaView-Twin instrument(Particle Metrix). Alumina zeta potential standard was usedand all samples were measured in 11 positions at 22 °C intriplicate. Zeta potential was calculated from the corres-ponding electrophoretic mobilities (μE) by using Henry’s cor-rection of the Smoluchowski equation (μE = 4πε0εrζ(1 + κr)/6πμ), where ε0 is the dielectric permittivity of the vacuum, εr isthe relative permittivity of the liquid, ζ is the zeta potential, κis the Debye length, r is the particle radius and μ is themobility.
Dynamic light scattering (DLS) was measured on aZetasizer ZS (Malvern Panalytical). Measurements were carriedout using a 4 mW He–Ne 633 nm laser module operating at25 °C at an angle of 173° (back scattering), and results wereanalysed using Malvern DTS 7.03 software. All determinationswere repeated in duplicate with at least 5 measurementsrecorded for each run.
Transmission electron microscopy. Dry-state stained TEMimaging was performed on a JEOL JEM-2100Plus microscopeoperating at an acceleration voltage of 200 kV. All dry-statesamples were diluted with deionised water and then depositedonto formvar-coated copper grids.
X-ray photoelectron spectroscopy (XPS). The samples wereattached to electrically-conductive carbon tape, mounted onto
a sample bar and loaded into a Kratos Axis Ultra DLD spectro-meter which possesses a base pressure below 1 × 10⁻¹⁰ mbar.XPS measurements were performed in the main analysischamber, with the sample being illuminated using a mono-chromated Al Kα X-ray source. The measurements were con-ducted at room temperature and at a take-off angle of 90° withrespect to the surface parallel. The core level spectra wererecorded using a pass energy of 20 eV (resolution approx. 0.4eV), from an analysis area of 300 μm × 700 μm. The spectro-meter work function and binding energy scale were first cali-brated using the Fermi edge and 3d5/2 peak recorded from apolycrystalline Ag sample. In order to prevent surface charging,the surface was flooded with a beam of low energy electronsthroughout the experiment and this necessitated recalibrationof the binding energy scale. To achieve this, the C–C/C–H com-ponent of the C 1s spectrum was referenced to 285.0 eV. Thedata were analysed in the CasaXPS package, using Shirley back-grounds and mixed Gaussian–Lorentzian (Voigt) lineshapes.For compositional analysis, the analyser transmission functionhas been determined using clean metallic foils to determinethe detection efficiency across the full binding energy range.
Results and discussionPolymer synthesis
Two water soluble, non-ionic polymers, poly(N-(2-hydroxy-propyl) methacrylamide) (PHPMA) and poly(N-hydroxyethylacrylamide) (PHEA), were synthesised by photo-initiated RAFTpolymerisation to maximise end-group fidelity. These poly-mers have previously been used to functionalise spherical goldnanoparticles, where subtle structural differences were foundto produce large changes in grafting density and responses toanalyte binding.57 Each polymer was prepared with fourdifferent degrees of polymerisation (DP = 40, 50, 55, 68 forPHPMA and DP = 26, 35, 50, 60 for PHEA) by tuning the feedratio. Polymers were characterised using 1H-NMR and SEC(Fig. S1 and S2, ESI†). Narrow monomodal molecular weightdistributions were observed with low dispersity values (ĐM ≤1.3) in all cases indicating a controlled photo-polymerisation(Table 1). DP was also assessed by 1H NMR end-group analysisin methanol-d4 showing Mn values lower than that found fromSEC, as has been previously reported.57 Polymer DP (in sub-script) referred to from here is from 1H NMR. Retention of thepentafluoro phenyl (PFP) end-group during polymerisationwas confirmed via 19F NMR (Fig. S3, ESI†) and FT-IR analysis.Galactosamine was installed at the end-groups for both PHEA/PHPMA homopolymers displacement of the PFP end-group atthe α-terminus,62 and confirmed by 19F-NMR and FT-IR ana-lysis before and after modification (Fig. S3 and S4, ESI†).
Conjugation of glycopolymers onto gold nanorods
Citrate-stabilised GNRs were mixed with thiocarbonylthio-terminated polymers (PHPMAn and PHEAn) or thiocarbonylthio-terminated glycopolymers (Gal-PHPMAn and Gal-PHEAn,Scheme 1) of various lengths (n) to produce a library of (glyco)
Paper Nanoscale
10840 | Nanoscale, 2021, 13, 10837–10848 This journal is © The Royal Society of Chemistry 2021
Ope
n A
cces
s A
rtic
le. P
ublis
hed
on 0
3 Ju
ne 2
021.
Dow
nloa
ded
on 2
/5/2
022
11:4
2:17
PM
. T
his
artic
le is
lice
nsed
und
er a
Cre
ativ
e C
omm
ons
Attr
ibut
ion
3.0
Unp
orte
d L
icen
ce.
View Article Online

polymer-coated GNRs (termed (Gal)-PHPMA GNRs and (Gal)-PHEA GNRs). Excess of polymer was removed by multiple cen-trifugation and resuspension cycles.
The physico-chemical properties for the glycopolymer-coated GNRs and unmodified GNRs were analysed by UV-Vis,ζ-potential, XPS, TEM, DLS, DCS and NTA (Fig. 1, Tables S1and S2 and Fig. S5–S7, ESI†). All functionalised nanorods werecolloidally stable in aqueous solution apart from those conju-gated with the shortest PHEA26 (or Gal-PHEA26) which led tomacroscopic precipitation (data not shown) and were nottaken further in this study. UV-Vis spectroscopy revealed a red-shift of the longitudinal LSPR band (Fig. 1A) for the glycopoly-mer coated GNRs, while DLS (Fig. 1B) and ζ-potential(Table S1, ESI†) confirmed the successful attachment of theglycopolymers to the particle surface. An example TEM isshown in Fig. 1D showing the nanorod dimensions wereretained (i.e. no ripening of particles) during coating.Differential centrifugal sedimentation (DCS) and nanoparticletracking analysis (NTA) also supported an increase in particlesize following polymer addition (see Table S1, ESI†).
To further confirm the presence of glycopolymers on thesurface of the GNRs, X-ray photoelectron spectroscopy (XPS)analysis was performed on Gal-PHPMA40 and Gal-PHEA35coated GNRs (Fig. 1C and Fig. S5 and S6, ESI†). The presenceof N 1s peaks, which are not present on the naked particles(Fig. S7, ESI†) or found commonly in background contami-nants, confirmed successful binding of the polymers onto theparticle surface (Table S2, ESI†). The ratio of N 1s : Au 4f peakareas was higher for PHEA35-GNRs versus PHPMA40, indicatinga higher surface grafting density for the PHEA polymer.57
Note, the impact of grafting density is discussed later in thisarticle.
One prerequisite for any biomedical application of nano-particles is their colloidal stability under physiological con-ditions, and in particular due to saline which is present at∼0.150 M (NaCl). We tested the stability of the conjugated goldnanorod suspensions by titrating NaCl and using UV-Vis tomonitor aggregation. Citrate-GNRs aggregated above 0.125 MNaCl, while all Gal-PHPMA GNRs (DP 40, 50, 55, 68) and Gal-PHEA GNRs (DP 35, 50, 60) remained as stable dispersions upto 1 M NaCl (Fig. S8, ESI†). The increased colloidal stability isessential for sensing applications to avoid false-positive read-outs and also provides additional evidence for the polymercoating providing steric stabilisation.
Lectin binding studies in buffer
The plant lectin soybean agglutin (SBA) was employed as amodel system to study the lectin binding behaviour of variousglycopolymer-coated GNRs. SBA has high affinity forN-acetylgalactosamine (GalNAc).63–65 When conjugated to thepolymers via an amide bond, galactosamine acts as a struc-tural mimic of GalNAc.57 The particles were incubated withSBA concentrations between 0 and 100 µg mL−1 in 10 mMHEPES buffer and UV-Vis spectra recorded to observe changesin the LSPR peaks. Wheat germ agglutinin (WGA) which exhi-
Table 1 Polymers synthesised by photo-RAFT
Polymera
(—)[M] : [CTA]b
(—)Conversionc
(%)Mn, NMR
d
(g mol−1)
SEC analysis
Mn, SECe
(g mol−1) ĐMe
PHPMA40 40 100 6300 9600 1.17PHPMA50 60 83 7700 11 300 1.22PHPMA55 80 69 8400 12 500 1.19PHPMA68 100 68 10 300 15 500 1.25PHEA26 120 22 3500 8200 1.13PHEA35 140 25 4600 9800 1.12PHEA50 160 31 6300 14 500 1.13PHEA60 180 33 7400 16 500 1.11
a Polymer names are determined according to the average degree ofpolymerisation (DP) determined by 1H-NMR end-group analysis inmethanol-d4.
b [M] : [CTA] indicates the ratio between monomers (M)and the chain transfer agents (CTA). cMonomer conversion (%) calcu-lated by comparing the integration values of the monomer signalswith those of the corresponding signals of the polymer. d Mn, NMR wascalculated by end-group analysis by comparing the integrations of the–CH3 signals (δ 0.92 ppm) of dodecyl end-group with those of thecorresponding signals of the polymer backbone. e Mn and ĐM valuescalculated from PMMA standards using 5 mM NH4BF4 in DMF as theeluent.
Scheme 1 Schematic of end-group modification of PFP-PHPMA (left)and PFP-PHEA (right) telechelic homopolymers of different chainlengths (n) using galactosamine, followed by functionalisation of citrate-stabilised gold nanorods. Note, RAFT agent cleavage can occur duringfunctionalisation depending on excess used, but does not affect GNRimmobilisation.
Nanoscale Paper
This journal is © The Royal Society of Chemistry 2021 Nanoscale, 2021, 13, 10837–10848 | 10841
Ope
n A
cces
s A
rtic
le. P
ublis
hed
on 0
3 Ju
ne 2
021.
Dow
nloa
ded
on 2
/5/2
022
11:4
2:17
PM
. T
his
artic
le is
lice
nsed
und
er a
Cre
ativ
e C
omm
ons
Attr
ibut
ion
3.0
Unp
orte
d L
icen
ce.
View Article Online

bits low affinity towards GalNAc,66 and particles with non-gly-cosylated polymer were used as negative controls.
Despite only minor structural differences, the behaviour forthe two polymers upon analyte addition was markedlydifferent. Addition of SBA to Gal-PHEA GNRs (DP 35, 50, 60)led to cross-linking and aggregation with shorter linkerlengths as seen by broadening of the LSPR peak and adecrease in the overall absorbance (Fig. S9/S10, ESI†)67 – thiswas also visible to the naked eye. No change in the spectrumwas observed with WGA (wheat germ agglutinin, which has noaffinity to GalNAc) or using non-glycosylated polymers(Fig. S11/S12, ESI†). The same assay carried out with Gal-PHPMA GNRs (DP 40, 50, 55, 68) produced no aggregation, butinstead an SBA concentration-dependent red-shift of the LSPRpeak which is attributed to the local refractive index changesat the surface due to the binding interaction. Moreover,increasing the linker length led to a decrease in the assay sen-sitivity, as can be seen by the smaller LSPR peak shift (Fig. 2),which would be consistent with increasing distance of thebinding event from the rod surface.68,69 Again, negative con-
Fig. 1 Glyconanoparticle characterisation. (A) Representative example of UV-Vis absorption spectra of GNRs coated with Gal-PHPMA and Gal-PHEA of different lengths. Inset: zoomed view on the LSPR peak bands; (B) intensity-weighted DLS size distributions of Gal-PHEA35 GNRs comparedto pristine GNRs; (C) XPS C 1s characterisation of Gal-PHEA35 GNRs and (D) representative dry-state TEM image of Gal-PHEA35 GNRs.
Fig. 2 LSPR peak shift of Gal-PHPMA GNRs as a function of SBA con-centration in buffer. Y-Axis shows the LSPR wavelength red-shift asdetermined by UV-Vis spectroscopy after 2 hours of incubation.Different PHPMA polymer lengths (DP = 40, 50, 55, 68) were compared.
Paper Nanoscale
10842 | Nanoscale, 2021, 13, 10837–10848 This journal is © The Royal Society of Chemistry 2021
Ope
n A
cces
s A
rtic
le. P
ublis
hed
on 0
3 Ju
ne 2
021.
Dow
nloa
ded
on 2
/5/2
022
11:4
2:17
PM
. T
his
artic
le is
lice
nsed
und
er a
Cre
ativ
e C
omm
ons
Attr
ibut
ion
3.0
Unp
orte
d L
icen
ce.
View Article Online

trols of WGA and non-glycosylated particles showed nochanges, as would be expected (Fig. S12, ESI†).
GNRs incubated with 100 µg mL−1 SBA were further studiedby DLS. For Gal-PHEA35 GNR there was clear aggregation inagreement with the UV-Vis data (Fig. S13†) but there was noaggregation for Gal-PHPMA40 GNR, although a small sizeincrease was seen. The different responses can be attributed tothe PHPMA ligands having lower grafting densities (and hencefewer glycans) on the rod surface (as shown by XPS, above)compared to PHEA, and provides further evidence that anabsence of aggregation does not always indicate an absence ofbinding between different multivalent systems.57 Together,this data shows that by carefully tuning the polymer tether, theoutcome of plasmonic bioassays towards either aggregation orLSPR shifts can be fine-tuned, which is a valuable tool in thedesign of nanoparticle biosensors.
Lectin binding studies in serum
The ability to use glycosylated PHPMA coated GNRs to targetlectins, but without any unwanted aggregation could beappealing for in vivo or ex vivo biosensing, where aggregation
is undesirable. However, the behaviour predicted from buffer(above) ignores the contribution and impact of other compet-ing bio(macro)molecules which are present in many ‘real’samples such as liquid biopsies. For this reason we evaluatedSBA binding towards Gal-PHPMA GNRs and Gal-PHEA GNRsin serum. The stability of nanoparticles in such a complexenvironment is generally considered to be provided by the for-mation of the biomolecular corona.60
We monitored the LSPR peak following the addition ofglyco-GNRs to a dilution series of SBA in serum. The Gal-PHPMA GNRs (DP 40, 50, 55, 68) showed no LSPR shift in theconcentration range tested (Fig. 3A and C and control trialsS14A/B†), in contrast to the strong LSPR shift observed inbuffer alone. In comparison, Gal-PHEA nanorods showeddose-dependent LSPR shifts in serum plus SBA (Fig. 3B),which is the opposite to what is seen for PHPMA. While aggre-gation normally leads to a broadening of the LSPR peak, herethe shape of the LSPR peak of Gal-PHEA GNRs in serum didnot change significantly (Fig. 3D) and hence aggregation canbe excluded. This is in contrast to the aggregative behaviourobserved for the same assay performed in buffer, and confirms
Fig. 3 Response of nanoparticles to lectin in serum. LSPR peak shift of Gal-PHPMA GNRs (A) and Gal-PHEA GNRs (B) in serum as a function of SBAconcentration and measured after 2 hours of incubation. LSPR wavelength peak shift is expressed relative to the peak position at the start of theinjection (N = 3, mean ± SD). Representative UV-Vis spectra of Gal-PHPMA40 (C) and Gal-PHEA35 (D) coated GNRs in serum at time zero and 2 hoursafter addition of 100 µg mL−1 SBA are shown.
Nanoscale Paper
This journal is © The Royal Society of Chemistry 2021 Nanoscale, 2021, 13, 10837–10848 | 10843
Ope
n A
cces
s A
rtic
le. P
ublis
hed
on 0
3 Ju
ne 2
021.
Dow
nloa
ded
on 2
/5/2
022
11:4
2:17
PM
. T
his
artic
le is
lice
nsed
und
er a
Cre
ativ
e C
omm
ons
Attr
ibut
ion
3.0
Unp
orte
d L
icen
ce.
View Article Online
that initial screening in buffer is not be a reliable strategy foridentification of the best-performing surface modifications forbiosensing in blood/serum samples.
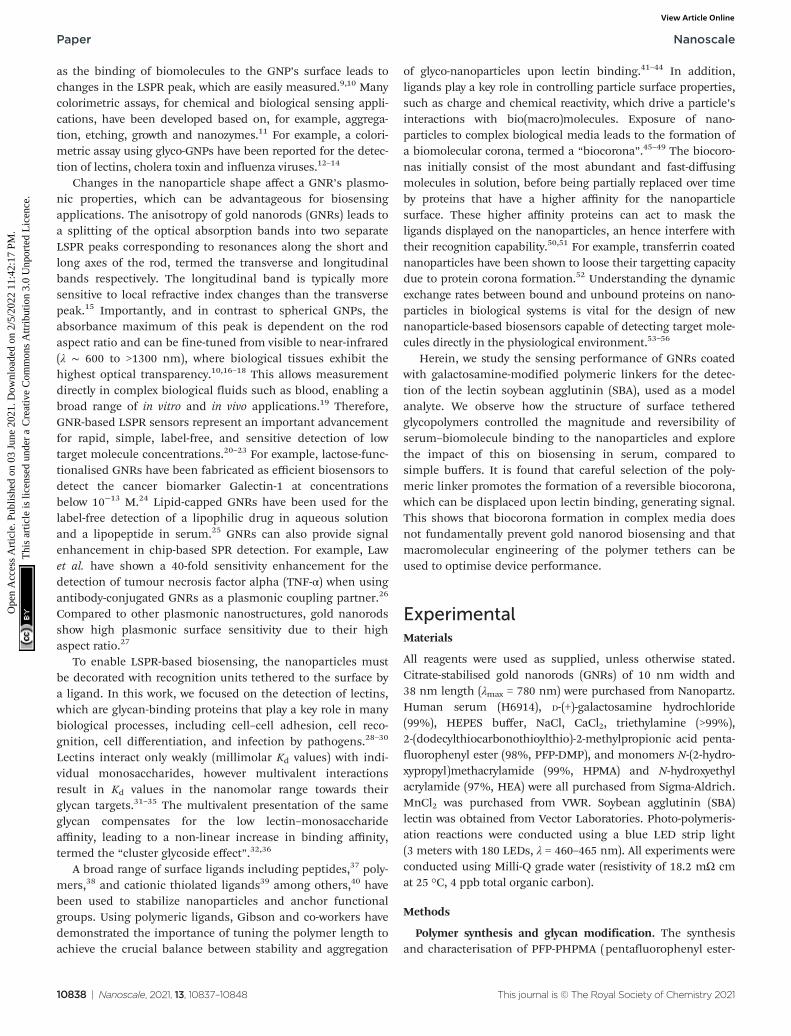
The response of Gal-PHEA35 GNR to SBA in serum wasfound to be reproducible between batches of GNRs andpolymer (Fig. 4A) confirming this conflicting behaviour (com-pared to what is seen in buffer alone) was a real effect. We alsoassayed the response kinetics of Gal-PHEA35 GNR over 5 hoursusing different SBA concentrations (Fig. 4B). In further controlexperiments, PHEA GNRs without glycan modification exhibi-ted excellent stability and minimal response to SBA injection(Fig. S14C†), while Gal-PHEA GNRs showed no response uponaddition of WGA (Fig. S14D†), confirming the selective SBArecognition of Gal-PHEA GNRs in complex serum conditions.
Impact of serum proteins on sensing performance
From the above studies, the most significant observation wasthat in the case of Gal-PHEA GNRs in serum, the LSPR peakwavelength decreases upon SBA addition, consistent with overallloss of mass from the particle surface, rather than a net massgain due to lectin binding, which would have been expected if alectin was being captured by the rods in buffer. Secondly, thePHPMA coated GNRs showed no response to SBA in serumdespite showing LSPR shifts in buffer. To explore the biocoronaformation and the impact this had during SBA biosensing, weused differential centrifugal sedimentation (DCS). To estimatethe biocorona thickness from the DCS data we used the core–shell model of Monopoli et al.60 where particles are treated as ahigh-density metallic core with a lower-density shell of bio-molecules. If the size and density of the core nanoparticle areknown and the density of the corona can be estimated, then theshell thickness can be calculated from the shift in particle mobi-lity before and after corona formation.
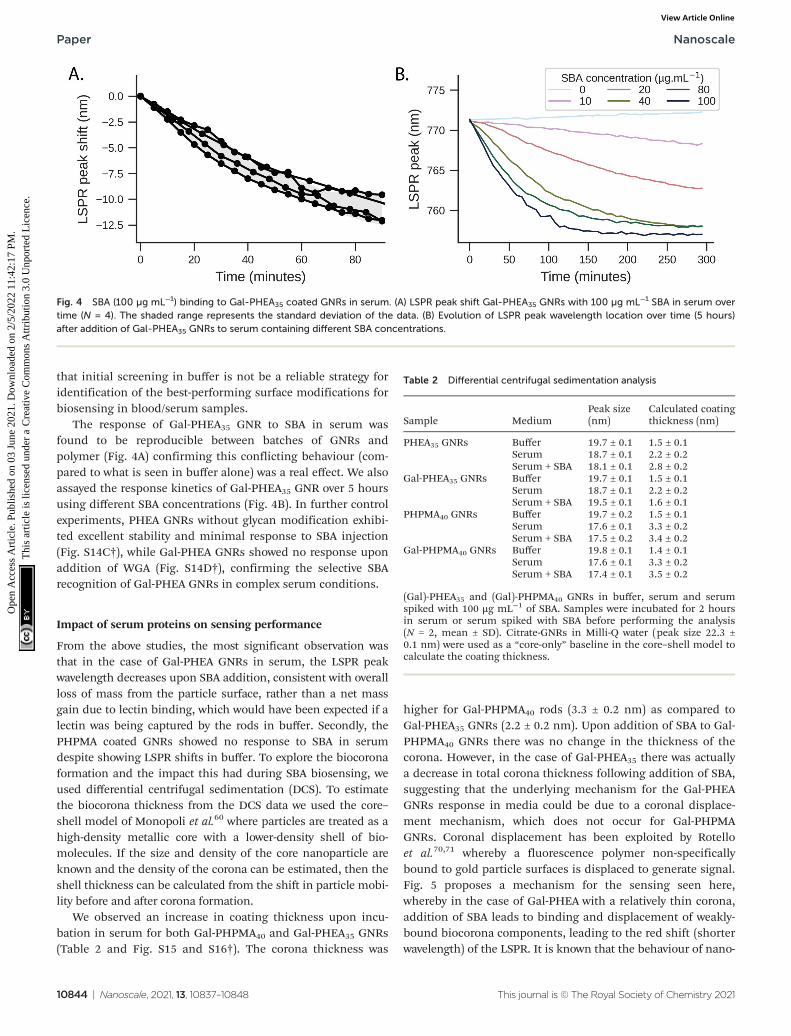
We observed an increase in coating thickness upon incu-bation in serum for both Gal-PHPMA40 and Gal-PHEA35 GNRs(Table 2 and Fig. S15 and S16†). The corona thickness was
higher for Gal-PHPMA40 rods (3.3 ± 0.2 nm) as compared toGal-PHEA35 GNRs (2.2 ± 0.2 nm). Upon addition of SBA to Gal-PHPMA40 GNRs there was no change in the thickness of thecorona. However, in the case of Gal-PHEA35 there was actuallya decrease in total corona thickness following addition of SBA,suggesting that the underlying mechanism for the Gal-PHEAGNRs response in media could be due to a coronal displace-ment mechanism, which does not occur for Gal-PHPMAGNRs. Coronal displacement has been exploited by Rotelloet al.70,71 whereby a fluorescence polymer non-specificallybound to gold particle surfaces is displaced to generate signal.Fig. 5 proposes a mechanism for the sensing seen here,whereby in the case of Gal-PHEA with a relatively thin corona,addition of SBA leads to binding and displacement of weakly-bound biocorona components, leading to the red shift (shorterwavelength) of the LSPR. It is known that the behaviour of nano-
Fig. 4 SBA (100 µg mL−1) binding to Gal-PHEA35 coated GNRs in serum. (A) LSPR peak shift Gal-PHEA35 GNRs with 100 µg mL−1 SBA in serum overtime (N = 4). The shaded range represents the standard deviation of the data. (B) Evolution of LSPR peak wavelength location over time (5 hours)after addition of Gal-PHEA35 GNRs to serum containing different SBA concentrations.
Table 2 Differential centrifugal sedimentation analysis
Sample MediumPeak size(nm)
Calculated coatingthickness (nm)
PHEA35 GNRs Buffer 19.7 ± 0.1 1.5 ± 0.1Serum 18.7 ± 0.1 2.2 ± 0.2Serum + SBA 18.1 ± 0.1 2.8 ± 0.2
Gal-PHEA35 GNRs Buffer 19.7 ± 0.1 1.5 ± 0.1Serum 18.7 ± 0.1 2.2 ± 0.2Serum + SBA 19.5 ± 0.1 1.6 ± 0.1
PHPMA40 GNRs Buffer 19.7 ± 0.2 1.5 ± 0.1Serum 17.6 ± 0.1 3.3 ± 0.2Serum + SBA 17.5 ± 0.2 3.4 ± 0.2
Gal-PHPMA40 GNRs Buffer 19.8 ± 0.1 1.4 ± 0.1Serum 17.6 ± 0.1 3.3 ± 0.2Serum + SBA 17.4 ± 0.1 3.5 ± 0.2
(Gal)-PHEA35 and (Gal)-PHPMA40 GNRs in buffer, serum and serumspiked with 100 µg mL−1 of SBA. Samples were incubated for 2 hoursin serum or serum spiked with SBA before performing the analysis(N = 2, mean ± SD). Citrate-GNRs in Milli-Q water (peak size 22.3 ±0.1 nm) were used as a “core-only” baseline in the core–shell model tocalculate the coating thickness.
Paper Nanoscale
10844 | Nanoscale, 2021, 13, 10837–10848 This journal is © The Royal Society of Chemistry 2021
Ope
n A
cces
s A
rtic
le. P
ublis
hed
on 0
3 Ju
ne 2
021.
Dow
nloa
ded
on 2
/5/2
022
11:4
2:17
PM
. T
his
artic
le is
lice
nsed
und
er a
Cre
ativ
e C
omm
ons
Attr
ibut
ion
3.0
Unp
orte
d L
icen
ce.
View Article Online

particles in complex biological matrices is a highly dynamicprocess and that the rates of exchange are governed by the nano-particle surface properties,53,72 supporting this hypothesis. Thedifferent response of PHPMA GNRs can be attributable to itslower grafting density (compared to PHEA) and hence morevacancies on the GNR for formation of a ‘hard’ non-reversiblecorona, supported by the DCS data. The PHPMA also has fewerGal residues and hence a likely decreased affinity for SBA mayalso contribute. It should be noted that these experiments donot rule out all SBA binding, just the lack of optical responsesor significant corona displacement.
To further explore the role of biocorona on the observedsensing outputs bare citrate-GNRs, PHEA35 GNRs and Gal-PHEA35 GNRs were incubated in human serum to allow coronaformation. After this, the rods were repeatedly washed withbuffer, to remove the most weakly bound coronal components.This treatment leaves behind a “hard” corona composed ofbiological molecules that have the highest affinity for the par-ticle surface.53,73 Gal-PHEA35 GNRs prepared in this wayexhibited a pronounced blue-shift of the LSPR peak upon the
addition of 100 µg mL−1 SBA in buffer (Fig. 6), which waslarger than seen without washing, (Fig. 4) presumably due tothe absence of competing serum proteins in solution andincreased glycan accessibility. Nanoparticle tracking analysisconfirmed a decrease of the apparent particle size (Table 3 andFig. S17†) upon addition of SBA and hence supported thehypothesis that SBA binding can displace some of the weakerbond serum proteins upon glycan binding. Non-glycosylatedPHEA GNRs treated in the same manner showed no change inparticle size using NTA upon SBA addition confirming that thedisplacement is due to specific lectin/glycan interactions. Thisdata also shows that the biocorona does not completely shieldthe glycans on the GNR surface and that there is a dynamicexchange between hard-corona proteins and SBA (see illus-tration of proposed scheme in Fig. S18†). Moreover, the aspectratio of the GNRs (3.8) employed in this study corresponds tothe long GNRs (3.7) studied by Ferhan et al., which wereobserved to show superior plasmonic surface sensitivity com-pared to short GNR and long GNRs deposited on sensorsubstrate.27
Fig. 5 SBA binding to Gal-PHEA GNRs in serum. Schematic illustrationof the formation of a biocorona surrounding Gal-PHEA coated GNR in acomplex biological environment. In serum spiked with SBA, we hypoth-esise a displacement of the serum-derived biocorona due to glycan–lectin binding.
Fig. 6 LSPR peak shift (nm) over time for citrate-GNRs, PHEA35 GNRsand Gal-PHEA35 GNRs. The samples were incubated in serum to allowthe formation of a biocorona, followed by washing the rods with buffer.Absorbance spectra were monitored for 1 hour in buffer, before spiking(time zero) with SBA at 100 µg mL−1 (N = 3, mean ± SD).
Table 3 Nanoparticle tracking analysis particles in buffer and serum
Sample Medium Mode (nm)
Citrate-GNRs Water 43 ± 1.6PHEA35 GNRs Buffer 54.5 ± 2.8
Serum, then buffer 98.5 ± 4.4Serum, then buffer + SBA 100.8 ± 1.5
Gal-PHEA35 GNRs Buffer 52.6 ± 1.5Serum, then buffer 106.1 ± 4.9Serum, then buffer + SBA 61.3 ± 5.7
Glycopolymer-coated GNRs were analysed in buffer, after incubation inserum followed by washing in buffer, and addition of 100 µg mL−1
SBA. The mode (nm) of a duplicate experiment (N = 2, mean ± SD) isshown.
Nanoscale Paper
This journal is © The Royal Society of Chemistry 2021 Nanoscale, 2021, 13, 10837–10848 | 10845
Ope
n A
cces
s A
rtic
le. P
ublis
hed
on 0
3 Ju
ne 2
021.
Dow
nloa
ded
on 2
/5/2
022
11:4
2:17
PM
. T
his
artic
le is
lice
nsed
und
er a
Cre
ativ
e C
omm
ons
Attr
ibut
ion
3.0
Unp
orte
d L
icen
ce.
View Article Online

Conclusions
Here we demonstrate how the nature of polymeric tethers,used to anchor glycans to gold nanorods, directs the for-mation of biocoronas in serum, and the impact this has onbiosensing of lectins. It is shown that prevention of biocor-ona formation may not be essential, and that a soft-corona isnot only tolerated, but its displacement upon lectin bindingactually leads to signal generation. In contrast a ‘hard’ irre-versible corona effectively prevented biosensing. In simplebuffer solutions, glycosylated poly(N-hydroxypropyl methacry-lamide)-coated nanorods, showed a dose-dependent LSPRred-shift upon addition of soybean agglutinin (SBA).However, in serum, which contains a large range of biologi-cal macromolecules, no signal was detected which is attribu-ted to biocorona formation. In contrast, glycosylated poly(N-hydroxyethyl acrylamide)-coated nanorods showed verydifferent behaviour including a lectin dose dependant blue-shift in serum. Using a combination of UV-Visible spec-troscopy, differential centrifugation sedimentation and nano-particle tracking analysis the underlying mechanism forthese behaviours was proposed and harnessed to enable bio-sensing of lectins in serum. Poly(N-hydroxypropyl methacryla-mide)-coated nanorods were observed to have lower polymergrafting densities, which upon incubation with serum led tothe formation of a thick and irreversibly bound ‘hard’protein corona and hence no lectin binding was observable.Changing the polymeric coating to poly(N-hydroxyethyl acryl-amide) also resulted in biocorona formation in serum, butthis was a ‘soft’ corona containing irreversibly bound com-ponents which could be displaced by addition of lectin. Thisdisplacement mechanism leads to the blue-shifted lectin bio-sensing outputs (overall loss of mass) in serum compared tored-shifted (gain in mass) which is seen in buffer. The roleof grafting density in biocorona formation, and lectinbinding responses, was supported by the use of differentpolymer chain-lengths on GNRs, with the shortest polymercoatings (whilst still being long enough to provide colloidalstability) giving the strongest responses, consistent with agrafting-density dependant process. These results illustratehow careful selection of the polymer coating on gold nano-rods is an accessible and powerful tool to control observablebiosensing responses. It also shows that preventing allbiocorona formation, which is incredibly challenging, onplasmonic nanoparticle sensors may not be essential, solong as the corona which does form is reversible and theunderlying targeting ligands remain exposed. Finally, thiswork clearly shows that the polymer coating, not just the tar-geting ligand, plays a critical role in tuning the biosensingoutputs and that the coating must be tuned for each appli-cation area.
Conflicts of interest
There are no conflicts to declare.
Acknowledgements
This project received funding from the European Commissionunder grant no. 814236 of the Marie-Curie European TrainingNetwork (MC-ETN) NanoCarb. This work is furthermore sup-ported by VITO as well as by Hasselt University and the ResearchFoundation Flanders (FWO Vlaanderen; Hercules project AUHL/15/2 - GOH3816N). MIG thanks the ERC for a Consolidator Grant(866056). The BBSRC-funded MIBTP program (BB/M01116X/1)and Iceni Diagnostics Ltd are also thanked for a studentship forAB. The Warwick Polymer Research Technology Platform isacknowledged for SEC analysis, and the Warwick ElectronMicroscopy Research Technology Platform is acknowledged forTEM. JH acknowledges the Hasselt University Special ResearchFund (BOF20TT06).
References
1 M. Soliman and W. Parak, Gold Nanoparticles: Synthesis,Surface Modification and Functionalization for BiomedicalApplications, Philipps-Universität Marburg, 2016.
2 D. Astruc and M.-C. Daniel, Chem. Rev., 2004, 104, 293–346.3 L. Dykman and N. Khlebtsov, Chem. Soc. Rev., 2012, 41,
2256–2282.4 Z. Yuan, C.-C. Hu, H.-T. Chang and C. Lu, Analyst, 2016,
141, 1611–1626.5 S. Anniebell and S. C. B. Gopinath, Curr. Med. Chem., 2018,
25, 1433–1445.6 C. J. Murphy, A. M. Gole, J. W. Stone, P. N. Sisco,
A. M. Alkilany, E. C. Goldsmith and S. C. Baxter, Acc. Chem.Res., 2008, 41, 1721–1730.
7 B. E. Hutter and J. H. Fendler, Adv. Mater., 2004, 16, 1685–1706.
8 K. Fong and L. Yung, Nanoscale, 2013, 5, 12043–12071.9 S. Wang, W. Li, K. Chang, J. Liu, Q. Guo, H. Sun, M. Jiang,
H. Zhang, J. Chen and J. Hu, PLoS One, 2017, 12, e0185530.10 H. Chen, L. Shao, Q. Li and J. Wang, Chem. Soc. Rev., 2013,
42, 2679–2724.11 C.-C. Chang, C.-P. Chen, T.-H. Wu, C.-H. Yang, C.-W. Lin
and C.-Y. Chen, Nanomaterials, 2019, 9, 861.12 C. L. Schofield, A. H. Haines, R. A. Field and D. A. Russell,
Langmuir, 2006, 22, 6707–6711.13 C. L. Schofield, R. A. Field and D. A. Russell, Anal. Chem.,
2007, 79, 1356–1361.14 M. J. Marín, A. Rashid, M. Rejzek, S. A. Fairhurst,
S. A. Wharton, S. R. Martin, J. W. McCauley, T. Wileman,R. A. Field and D. A. Russell, Org. Biomol. Chem., 2013, 11,7101.
15 H. Chen, X. Kou, Z. Yang, W. Ni and J. Wang, Langmuir,2008, 24, 5233–5237.
16 X. Huang, S. Neretina and M. A. El-Sayed, Adv. Mater.,2009, 21, 4880–4910.
17 L. Wang, Y. Zhu, L. Xu, W. Chen, H. Kuang, L. Liu,A. Agarwal, C. Xu and N. A. Kotov, Angew. Chem., Int. Ed.,2010, 49, 5472–5475.
Paper Nanoscale
10846 | Nanoscale, 2021, 13, 10837–10848 This journal is © The Royal Society of Chemistry 2021
Ope
n A
cces
s A
rtic
le. P
ublis
hed
on 0
3 Ju
ne 2
021.
Dow
nloa
ded
on 2
/5/2
022
11:4
2:17
PM
. T
his
artic
le is
lice
nsed
und
er a
Cre
ativ
e C
omm
ons
Attr
ibut
ion
3.0
Unp
orte
d L
icen
ce.
View Article Online

18 H. H. Chang and C. J. Murphy, Chem. Mater., 2018, 30,1427–1435.
19 A. T. Haine and T. Niidome, Chem. Pharm. Bull., 2017, 65,625–628.
20 E. T. Castellana, R. C. Gamez, M. E. Gómez andD. H. Russell, Langmuir, 2010, 26, 6066–6070.
21 G. J. Nusz, A. C. Curry, S. M. Marinakos, A. Wax andA. Chilkoti, ACS Nano, 2009, 3, 795–806.
22 J. Cao, E. K. Galbraith, T. Sun and K. T. V. Grattan, Sens.Actuators, B, 2012, 169, 360–367.
23 J. Cao, T. Sun and K. T. V. Grattan, Sens. Actuators, B, 2014,195, 332–351.
24 Y. Zhao, L. Tong, Y. Li, H. Pan, W. Zhang, M. Guan, W. Li,Y. Chen, Q. Li, Z. Li, H. Wang, X. F. Yu and P. K. Chu, ACSAppl. Mater. Interfaces, 2016, 8, 5813–5820.
25 E. T. Castellana, R. C. Gamez and D. H. Russell, J. Am.Chem. Soc., 2011, 133, 4182–4185.
26 W.-C. Law, K.-T. Yong, A. Baev and P. N. Prasad, ACS Nano,2011, 5, 4858–4864.
27 A. R. Ferhan, Y. Hwang, M. S. Bin Ibrahim, S. Anand,A. Kim, J. A. Jackman and N.-J. Cho, Appl. Mater. Today,2021, 23, 101046.
28 A. Bernardi, J. Jiménez-Barbero, A. Casnati, C. De Castro,T. Darbre, F. Fieschi, J. Finne, H. Funken, K.-E. Jaeger,M. Lahmann, T. K. Lindhorst, M. Marradi, P. Messner,A. Molinaro, P. V. Murphy, C. Nativi, S. Oscarson,S. Penadés, F. Peri, R. J. Pieters, O. Renaudet,J.-L. Reymond, B. Richichi, J. Rojo, F. Sansone, C. Schäffer,W. B. Turnbull, T. Velasco-Torrijos, S. Vidal, S. Vincent,T. Wennekes, H. Zuilhof and A. Imberty, Chem. Soc. Rev.,2013, 42, 4709–4727.
29 G. D. Brown, J. A. Willment and L. Whitehead, Nat. Rev.Immunol., 2018, 18, 374–389.
30 M. Ambrosi, N. R. Cameron and B. G. Davis, Org. Biomol.Chem., 2005, 3, 1593–1608.
31 R. Cummings, R. Schnaar, J. Esko, K. Drickamer andM. Taylor, Principles of Glycan Recognition, 2017.
32 J. J. Lundquist and E. J. Toone, Chem. Rev., 2002, 102, 555–578.
33 Y. Miura, Y. Hoshino and H. Seto, Chem. Rev., 2016, 116,1673–1692.
34 M. Donnier-Maréchal, S. Abdullayev, M. Bauduin, Y. Pascal,M. Q. Fu, X. P. He, E. Gillon, A. Imberty, E. Kipnis,R. Dessein and S. Vidal, Org. Biomol. Chem., 2018, 16,8804–8809.
35 A. Angeli, M. Li, L. Dupin, G. Vergoten, M. Noël,M. Madaoui, S. Wang, A. Meyer, T. Géhin, S. Vidal,J. J. Vasseur, Y. Chevolot and F. Morvan, ChemBioChem,2017, 18, 1036–1047.
36 C. Müller, G. Despras and T. K. Lindhorst, Chem. Soc. Rev.,2016, 45, 3275–3302.
37 A. K. Oyelere, P. C. Chen, X. Huang, I. H. El-Sayed andM. A. El-Sayed, Bioconjugate Chem., 2007, 18, 1490–1497.
38 Z. Nie, D. Fava, E. Kumacheva, S. Zou, G. C. Walker andM. Rubinstein, Nat. Mater., 2007, 6, 609–614.
39 L. Vigderman, P. Manna and E. R. Zubarev, Angew. Chem.,Int. Ed., 2012, 51, 636–641.
40 A. M. Alkilany, L. B. Thompson, S. P. Boulos, P. N. Siscoand C. J. Murphy, Adv. Drug Delivery Rev., 2012, 64, 190–199.
41 S.-J. Richards and M. I. Gibson, ACS Macro Lett., 2014, 3,1004–1008.
42 S.-J. Richards, E. Fullam, G. S. Besra and M. I. Gibson,J. Mater. Chem. B, 2014, 2, 1490–1498.
43 S.-J. Richards, L. Otten, G. S. Besra and M. I. Gibson,J. Mater. Chem. B, 2016, 4, 3046–3053.
44 L. Otten, D. Vlachou, S.-J. J. Richards and M. I. Gibson,Analyst, 2016, 141, 4305–4312.
45 L. Ding, C. Yao, X. Yin, C. Li, Y. Huang, M. Wu, B. Wang,X. Guo, Y. Wang and M. Wu, Small, 2018, 14, e1801451.
46 H. Moustaoui, J. Saber, I. Djeddi, Q. Liu, D. Movia,A. Prina-Mello, J. Spadavecchia, M. Lamy De La Chapelleand N. Djaker, Nanoscale, 2019, 11, 3665–3673.
47 D. Di Silvio, N. Rigby, B. Bajka, A. Mayes, A. Mackie andF. Baldelli Bombelli, Nanoscale, 2015, 7, 11980–11990.
48 O. Vilanova, J. J. Mittag, P. M. Kelly, S. Milani,K. A. Dawson, J. O. Rädler and G. Franzese, ACS Nano,2016, 10, 10842–10850.
49 S. Sheibani, K. Basu, A. Farnudi, A. Ashkarran,M. Ichikawa, J. F. Presley, K. H. Bui, M. R. Ejtehadi, H. Valiand M. Mahmoudi, Nat. Commun., 2021, 12, 573.
50 V. Mirshafiee, M. Mahmoudi, K. Lou, J. Cheng andM. L. Kraft, Chem. Commun., 2013, 49, 2557–2559.
51 M. Mahmoudi, S. Sheibani, A. S. Milani, F. Rezaee,M. Gauberti, R. Dinarvand and H. Vali, Nanomedicine,2015, 10, 215–226.
52 A. Salvati, A. S. Pitek, M. P. Monopoli, K. Prapainop,F. B. Bombelli, D. R. Hristov, P. M. Kelly, C. Åberg,E. Mahon and K. A. Dawson, Nat. Nanotechnol., 2013, 8,137–143.
53 E. Casals, T. Pfaller, A. Duschl, G. J. Oostingh andV. Puntes, ACS Nano, 2010, 4, 3623–3632.
54 M. Lundqvist, J. Stigler, T. Cedervall, T. Berggård,M. Flanagan, I. Lynch, G. Elia and K. Dawson, ACS Nano,2011, 5, 7503–7509.
55 G. Caracciolo, D. Pozzi, A. L. Capriotti, C. Cavaliere,P. Foglia, H. Amenitsch and A. Laganà, Langmuir, 2011, 27,15048–15053.
56 E. Casals, T. Pfaller, A. Duschl, G. J. Oostingh andV. F. Puntes, Small, 2011, 7, 3479–3486.
57 P. G. Georgiou, A. N. Baker, S. J. Richards, A. Laezza,M. Walker and M. I. Gibson, J. Mater. Chem. B, 2020, 8,136–145.
58 Ž. Krpetić, A. M. Davidson, M. Volk, R. Lévy, M. Brust andD. L. Cooper, ACS Nano, 2013, 7, 8881–8890.
59 J. A. Jamison, K. M. Krueger, C. T. Yavuz, J. T. Mayo,D. LeCrone, J. J. Redden and V. L. Colvin, ACS Nano, 2008,2, 311–319.
60 M. P. Monopoli, D. Walczyk, A. Campbell, G. Elia, I. Lynch,F. Baldelli Bombelli and K. A. Dawson, J. Am. Chem. Soc.,2011, 133, 2525–2534.
Nanoscale Paper
This journal is © The Royal Society of Chemistry 2021 Nanoscale, 2021, 13, 10837–10848 | 10847
Ope
n A
cces
s A
rtic
le. P
ublis
hed
on 0
3 Ju
ne 2
021.
Dow
nloa
ded
on 2
/5/2
022
11:4
2:17
PM
. T
his
artic
le is
lice
nsed
und
er a
Cre
ativ
e C
omm
ons
Attr
ibut
ion
3.0
Unp
orte
d L
icen
ce.
View Article Online

61 A. S. Pitek, D. O’Connell, E. Mahon, M. P. Monopoli,F. Francesca Baldelli and K. A. Dawson, PLoS One, 2012, 7,e40685.
62 J. Lawrence and T. Emrick, ACS Appl. Mater. Interfaces,2016, 8, 2393–2398.
63 Springer, in Lectins, 2007, pp. 63–103.64 S. Hammarstrom, L. A. M. Murphy, I. J. G. Goldstein and
M. E. Etzler, Biochemistry, 1977, 16, 2750–2755.65 T. K. Dam, T. A. Gerken, B. S. Cavada, K. S. Nascimento,
T. R. Moura and C. F. Brewer, J. Biol. Chem., 2007, 282,28256–28263.
66 I. J. Goldstein, H. C. Winter and R. D. Poretz, in NewComprehensive Biochemistry, Elsevier, 1997, vol. 29, pp.403–474.
67 A. M. Funston, C. Novo, T. J. Davis and P. Mulvaney, NanoLett., 2009, 9, 1651–1658.
68 L. Feuz, M. P. Jonsson and F. Höök, Nano Lett., 2012, 12,873–879.
69 S. R. Beeram and F. P. Zamborini, J. Phys. Chem. C, 2011,115, 7364–7371.
70 U. H. F. Bunz and V. M. Rotello, Angew. Chem., Int. Ed.,2010, 49, 3268–3279.
71 M. De, S. Rana, H. Akpinar, O. R. Miranda, R. R. Arvizo,U. H. F. Bunz and V. M. Rotello, Nat. Chem., 2009, 1, 461–465.
72 S. Tenzer, D. Docter, J. Kuharev, A. Musyanovych, V. Fetz,R. Hecht, F. Schlenk, D. Fischer, K. Kiouptsi, C. Reinhardt,K. Landfester, H. Schild, M. Maskos, S. K. Knauer andR. H. Stauber, Nat. Nanotechnol., 2013, 8, 772–781.
73 D. Walczyk, F. B. Bombelli, M. P. Monopoli, I. Lynch andK. A. Dawson, J. Am. Chem. Soc., 2010, 132, 5761–5768.
Paper Nanoscale
10848 | Nanoscale, 2021, 13, 10837–10848 This journal is © The Royal Society of Chemistry 2021
Ope
n A
cces
s A
rtic
le. P
ublis
hed
on 0
3 Ju
ne 2
021.
Dow
nloa
ded
on 2
/5/2
022
11:4
2:17
PM
. T
his
artic
le is
lice
nsed
und
er a
Cre
ativ
e C
omm
ons
Attr
ibut
ion
3.0
Unp
orte
d L
icen
ce.
View Article Online