The Polycystic Ovary Syndrome Evolutionary Paradox: … · E2414 Casarini and Brigante PCOS...
9
The Polycystic Ovary Syndrome Evolutionary Paradox: a Genome-Wide Association Studies–Based, in silico, Evolutionary Explanation Livio Casarini and Giulia Brigante Unit of Endocrinology, Department of Biomedical, Metabolic, and Neural Sciences (L.C., G.B.), and Center for Genomic Research (L.C.), University of Modena and Reggio Emilia, 41121 Modena, Italy Context: Polycystic ovary syndrome (PCOS) is a common female endocrine disorder characterized by phenotypes ranging from hyperandrogenism to metabolic disorders, more prevalent in people of African/Caucasian and Asian ancestry. Because PCOS impairs fertility without diminishing in prevalence, it was considered an evolutionary paradox. Genome-Wide Association Studies iden- tified 17 single nucleotide polymorphisms (SNPs) associated with PCOS, with different allele fre- quencies, ethnicity-related, in 11 susceptibility loci. Objective: In this study we analyze the PCOS phenotype-genotype relationship in silico, using SNPs of representative genes for analysis of genetic clustering and distance, to evaluate the degree of genetic similarity. Data Source: 1000 Genomes, HapMap, and Human Genome Diversity Project databases were used as source of allele frequencies of the SNPs, using data from male and female individuals grouped according to their geographical ancestry. Setting and Design: Genetic clustering was calculated from SNPs data by Bayesian inference. The inferred ancestry of individuals was matched with PCOS phenotype data, extracted from a previous meta-analysis. The measure of genetic distance was plotted against the geographic distance be- tween the populations. Results: The individuals were assigned to five genetic clusters, matching with different world regions (Kruskal-Wallis/Dunn’s post test; P .0001), and converging in two main PCOS phenotypes in different degrees of affinity. The overall genetic distance increased with the geographic distance among the populations (linear regression; R 2 0.21; P .0001), in a phenotype-unrelated manner. Conclusions: Phenotype-genotype correlations were demonstrated, suggesting that PCOS genetic gradient results from genetic drift due to a serial founder effect occurred during ancient human migrations. The overall prevalence of the disease supports intralocus sexual conflict as alternative to the natural selection of phenotypic traits in females. (J Clin Endocrinol Metab 99: E2412–E2420, 2014) P olycystic ovary syndrome (PCOS) is the most common endocrinopathy affecting 5–10% of women in re- productive age worldwide. It is a familial, polygenic con- dition associated with infertility, irregular menstrual cycles, anovulation, hyperandrogenism, as well as nonre- productive health problems depending on genetic back- ground and affected by lifestyle (1–3). PCOS phenotypic features Even if the disease displays a wide variety of charac- teristics, it is widely accepted that PCOS features decrease within two main phenotypes. According to the 2003 Rot- terdam criteria (4), the prevalent clinical symptoms define the hyperandrogenic or metabolic phenotype (5–10). The hyperandrogenic PCOS phenotype is defined mainly by ISSN Print 0021-972X ISSN Online 1945-7197 Printed in U.S.A. Copyright © 2014 by the Endocrine Society Received June 19, 2014. Accepted July 29, 2014. First Published Online August 5, 2014 Abbreviations: GWAS, Genome-Wide Association Studies; PCOS, polycystic ovary syn- drome; SNP, single nucleotide polymorphis. JCEM ONLINE Advances in Genetics—Endocrine Research E2412 jcem.endojournals.org J Clin Endocrinol Metab, November 2014, 99(11):E2412–E2420 doi: 10.1210/jc.2014-2703 The Endocrine Society. Downloaded from press.endocrine.org by [${individualUser.displayName}] on 10 November 2014. at 05:13 For personal use only. No other uses without permission. . All rights reserved.
Transcript of The Polycystic Ovary Syndrome Evolutionary Paradox: … · E2414 Casarini and Brigante PCOS...

The Polycystic Ovary Syndrome Evolutionary Paradox:a Genome-Wide Association Studies–Based, in silico,Evolutionary Explanation
Livio Casarini and Giulia Brigante
Unit of Endocrinology, Department of Biomedical, Metabolic, and Neural Sciences (L.C., G.B.), andCenter for Genomic Research (L.C.), University of Modena and Reggio Emilia, 41121 Modena, Italy
Context: Polycystic ovary syndrome (PCOS) is a common female endocrine disorder characterizedby phenotypes ranging from hyperandrogenism to metabolic disorders, more prevalent in peopleof African/Caucasian and Asian ancestry. Because PCOS impairs fertility without diminishing inprevalence, it was considered an evolutionary paradox. Genome-Wide Association Studies iden-tified 17 single nucleotide polymorphisms (SNPs) associated with PCOS, with different allele fre-quencies, ethnicity-related, in 11 susceptibility loci.
Objective: In this study we analyze the PCOS phenotype-genotype relationship in silico, using SNPsof representative genes for analysis of genetic clustering and distance, to evaluate the degree ofgenetic similarity.
Data Source: 1000 Genomes, HapMap, and Human Genome Diversity Project databases were usedas source of allele frequencies of the SNPs, using data from male and female individuals groupedaccording to their geographical ancestry.
Setting and Design: Genetic clustering was calculated from SNPs data by Bayesian inference. Theinferred ancestry of individuals was matched with PCOS phenotype data, extracted from a previousmeta-analysis. The measure of genetic distance was plotted against the geographic distance be-tween the populations.
Results: The individuals were assigned to five genetic clusters, matching with different worldregions (Kruskal-Wallis/Dunn’s post test; P � .0001), and converging in two main PCOS phenotypesin different degrees of affinity. The overall genetic distance increased with the geographic distanceamong the populations (linear regression; R2 � 0.21; P � .0001), in a phenotype-unrelated manner.
Conclusions: Phenotype-genotype correlations were demonstrated, suggesting that PCOS geneticgradient results from genetic drift due to a serial founder effect occurred during ancient humanmigrations.Theoverallprevalenceofthediseasesupports intralocussexualconflictasalternativetothenatural selection of phenotypic traits in females. (J Clin Endocrinol Metab 99: E2412–E2420, 2014)
Polycystic ovary syndrome (PCOS) is the most commonendocrinopathy affecting 5–10% of women in re-
productive age worldwide. It is a familial, polygenic con-dition associated with infertility, irregular menstrualcycles, anovulation, hyperandrogenism, as well as nonre-productive health problems depending on genetic back-ground and affected by lifestyle (1–3).
PCOS phenotypic featuresEven if the disease displays a wide variety of charac-
teristics, it is widely accepted that PCOS features decreasewithin two main phenotypes. According to the 2003 Rot-terdam criteria (4), the prevalent clinical symptoms definethe hyperandrogenic or metabolic phenotype (5–10). Thehyperandrogenic PCOS phenotype is defined mainly by
ISSN Print 0021-972X ISSN Online 1945-7197Printed in U.S.A.Copyright © 2014 by the Endocrine SocietyReceived June 19, 2014. Accepted July 29, 2014.First Published Online August 5, 2014
Abbreviations: GWAS, Genome-Wide Association Studies; PCOS, polycystic ovary syn-drome; SNP, single nucleotide polymorphis.
J C E M O N L I N E
A d v a n c e s i n G e n e t i c s — E n d o c r i n e R e s e a r c h
E2412 jcem.endojournals.org J Clin Endocrinol Metab, November 2014, 99(11):E2412–E2420 doi: 10.1210/jc.2014-2703
The Endocrine Society. Downloaded from press.endocrine.org by [${individualUser.displayName}] on 10 November 2014. at 05:13 For personal use only. No other uses without permission. . All rights reserved.
hirsutism, androgenic alopecia, and relatively high andro-gen levels, whereas the metabolic phenotype is character-ized by metabolic syndrome, insulin resistance, increasedrisk for type 2 diabetes, and high body mass index orcentral obesity (5–10). It can be approximately establishedthat the metabolic phenotype is prevalent in CentralAsians and Americans whereas the hyperandrogenic phe-notype is prevalent in the other world regions. However,the wide spectrum of secondary disorders results in anoverlap of PCOS characteristics among human popula-tions, reflecting the polygenic condition of the disease andgenetic admixture. Curiously, no clear differences in theprevalence of the disease among different ethnic groupshas been identified so far (10–15).
Evolutionary origin of PCOSGiven that the disease impairs fertility without dimin-
ishing its high global prevalence, it was extensively dis-cussed as an evolutionary paradox. Previous studies at-tempted to explain how a genetic pattern linked tometabolic or reproductive disadvantages spread acrosscontinents, generating a dozen theories suggesting differ-ent explanations for the evolutionary origin of PCOS (16).Most these hypotheses prompt a balancing mechanismbetween viability selection and metabolic thrift againstfertility disadvantages associated with this condition. Forexample, androgenisation and insulin resistance may con-fer survival benefit to females and improve the glucoseavailability for ovulatory functions in hunter-gatherer so-cieties (17). Moreover, metabolic thrift and increased fatstorage are advantages for mother and fetus under lowfood conditions (18). However, the effect on the individ-ual fitness of the PCOS phenotype during the evolution ofhumans is not understood, and no evolutionary advantagefor the PCOS genotype carriers has been proven. Surpris-ingly, all previous theories about PCOS consider evolu-tionary dynamics involving only females, not consideringthe contribution of the male in the genotype-phenotypeinheritance and evolution. All the genetic and evolution-ary analyses of PCOS were carried out on a sample offemale individuals, presumably resulting in biased evalu-ations and in an overall loss of genetic information.
Genetic markers of the diseasePrevious studies identified a hundred candidate genes
associated with PCOS and several genetic markers affect-ing the pathogenesis, phenotype, and prevalence of thedisease have been proposed (19). Recently, two Genome-Wide Association Studies (GWAS) performed in Han Chi-nese women identified 11 new risk loci for PCOS (20, 21),which count 17 single nucleotide polymorphisms (SNPs)leading to genetic variants strongly associated with the
disease. The gene sequences located within the PCOS sus-ceptibility loci are involved in the ovarian response to thegonadotropic hormones, in the metabolism of glucose andlipids, and in cell cycle regulation. This finding is corrob-orated by other studies showing the association betweenthese markers and the disease (22–27). The results of thesetwo statistically powerful analyses were confirmed byother works performed in populations of non-Chinese an-cestry (19, 28, 29), showing a common genetic risk profileacross human populations.
All the genes falling within the susceptibility loci iden-tified by GWAS may potentially be implicated in the mod-ulation of the PCOS phenotype and its severity. Thesegenes are FSHR, LHCGR, DENND1A, THADA,C9orf3, YAP1, HMGA2, RAB5B/SUOX, INSR, TOX3and SUMO1P1; their potential relation with PCOS wasdescribed separately (Supplemental Discussion).
Geography of PCOS genetic markersThe distribution of the allelic variants associated to
PCOS is different among the populations worldwide, asobservable by Human Genome Diversity Project (HGDP)selection browser (http://hgdp.uchicago.edu/cgi-bin/gbrowse/HGDP) (30–32), a web-based software, which calculatesthe geographic distributions of user-selected markers fromStanford SNP genotyping data (33, 34). A different geneticpattern distribution of PCOS markers could be reflected indifferent phenotypic features of the disease, resulting fromadaptive evolution (19, 28, 35) or from genetic drift gen-erated by a serial founder effect occurring during the an-cient human migrations out of Africa (36). Accordingly,the decay of expected heterozygosity as measure of geneticvariation accompanies the increase of genetic and geo-graphic distance from Africa (33, 34, 37). But the overallconstant prevalence of the disease remains unexplained.
The determination of the genetic background and itsrelationship with the phenotype may be relevant to opti-mize the pharmacological treatment of the disease andprotocols for assisted reproduction. To define the degreeof similarity of the PCOS genotypes, we show a popula-tion genetics analysis by Bayesian clustering and an eval-uation of pairwise genetic distance using SNPs data fromdifferent populations, available in online databases. Thegenotype-phenotype link and the correlation between ge-netic and geographic data are discussed from an evolu-tionary point of view.
Materials and Methods
A detailed description of the methods is available as Supple-mental Materials and Methods.
doi: 10.1210/jc.2014-2703 jcem.endojournals.org E2413
The Endocrine Society. Downloaded from press.endocrine.org by [${individualUser.displayName}] on 10 November 2014. at 05:13 For personal use only. No other uses without permission. . All rights reserved.

SNP selectionThe genetic analyses were performed using the frequencies
data of the 17 PCOS-related SNPs of individuals from humanpopulations sampled in different world regions. The SNP panel(Supplemental Materials and Methods) was taken from twoGWAS (20, 21), which found a strong association betweenPCOS and the 17 genetic markers. The SNP data were obtainedfrom the HGDP-CEPH (Centre d’Etude du Polymorphisme Hu-main) Stanford (33, 34), 1000 Genomes (The 1000 GenomesProject Consortium, 2010) (38) and in part from the HapMap(The International HapMap Consortium, 2003) (39) panels,which provide SNP frequencies and geographical coordinates ofa wide number of human populations worldwide, to ensure agood coverage in the territorial distribution among the conti-nents. Based on their geographic coordinates, the populationswere grouped by continent (Supplemental Table 1). All the ge-netic data are from both male and female individuals unselectedfor PCOS, ensuring that the analysis takes into account males ascarrier of a PCOS-linked genotype and avoiding the bias arisingfrom the use of only PCOS patients.
Selection of PCOS phenotypesIn order to evaluate the link between genotype and ethnicity,
the geographical distribution of the different PCOS phenotypeswas evaluated by analyzing the clinical data registered in thescientific literature (Supplemental Materials and Methods). Phe-notypic data are shown in a world map (Figure 1).
Human genetic clustering analysisGenetic clustering analysis assigns the individuals to the
group (cluster) that best represents their genetic background,calculated using the frequencies of PCOS markers. To this end,SNPs data from individuals were used and the genetic populationstratification was inferred by the Bayesian analysis implementedin STRUCTURE 2.3.4 software (Pritchard Lab) (40). The num-ber of subpopulations (K) in which the individuals were assignedwas selected using the �K method (41) (Supplemental Figure 1).The degree of affinity of the populations to the resulting geneticclusters is expressed as a numeric value (Q value) by the software.Thus, Q values define an estimation of ancestry, inferred by theSNP frequencies. Then, Q values were grouped for world area,and used for a graphical representation together with geograph-ical and clinical data.
The genotype-phenotype link was obtained from the analysisof geographical data and genetic clustering. It was confirmed byprincipal component analysis implemented in National Instituteon Aging (NIA) Array Analysis software (42) using the SNPfrequency data.
Evaluation of the genetic driftTo evaluate the contribution of the genetic drift in the estab-
lishment of the modern PCOS markers distribution, a linear re-gression of the expected/observed heterozygosity and geneticagainst geographic distance was performed (36). The SNPs panelwas used to obtain the heterozygosity data and to calculate the
Figure 1. World distribution of the affinity to the genetic clusters and PCOS phenotypes prevalence. A, Bar plots of individual Q values calculatedby the STRUCTURE software assign each individual to different subpopulations that matches the main world areas, with a certain degree ofadmixture. The analysis was performed differentially for the HGDP and the 1000 Genomes merged together with the HapMap samples. Each colorindicates the membership of individuals in a genetic cluster (K � 5); Af, African; CA, Central Asian; ME, Mediterranean/Middle Eastern; Eu,European; Am, American; Oc, Oceanian. B, Pie chart of cluster affinity among continents, indicating the frequencies of the PCOS susceptibilitymarkers. The charts were obtained as the means of the Q values by merging the HGDP, 1000 Genomes, and HapMap populations for eachgenetic cluster (colors of the pie charts do not refer to panel A). The overall prevalence of a genetic cluster is different between the geographicarea, suggesting a link with the corresponding PCOS phenotype and clinic features, which were obtained by a review of the literature; green,cluster 1; red, cluster 2; blue, cluster3; yellow, cluster 4; magenta, cluster 5; n.a., data not available or not assessed.
E2414 Casarini and Brigante PCOS Genotypes and Phenotypes J Clin Endocrinol Metab, November 2014, 99(11):E2412–E2420
The Endocrine Society. Downloaded from press.endocrine.org by [${individualUser.displayName}] on 10 November 2014. at 05:13 For personal use only. No other uses without permission. . All rights reserved.

fixation index (Fst) as a measure of pairwise genetic distance (43)resulting by comparing each world population vs Africans. Ascatter plot of Fst and heterozygosity against the geographic dis-tance was illustrated by the waypoints-method previously de-scribed (36, 44). Briefly, the geographic distance between pop-ulations was calculated using Addis Ababa in Ethiopia as thestarting point and taking into account the kilometers covered byhumans during their expansion worldwide through migratorywaypoints. The waypoints were chosen simulating the migratoryroutes (Supplemental Table 2), assuming that humans bypassedthe natural obstacles during migrations, such as oceans and highmountains. The radius of the Earth was also considered for thecalculation of the geographic distance.
Statistical analysis and image softwareANOVA, t tests, or linear regression analysis was applied as
appropriate and indicated in the figure legends. The statistical anal-ysis was performed by GraphPad Prism software (GraphPad).
Results
Geographical distribution of PCOS genotypes andphenotypes
Bayesian genetic clustering analysis assigned the indi-viduals to five subpopulations (K � 5) obtained from theestimation of the proportion of ancestry inferred by the
SNP frequencies. It can be defined by the Q value as thedegree of affinity of the population to each genetic clusterby the SNPs combination of the individuals within theindicated geographic area. Thus, the degree of prevalenceof each cluster is variable among the world continents,revealing that human populations could be divided intofive groups with geographically different, non-homoge-neous genetic background calculated using the frequencyof PCOS markers, though a degree of admixture exists(Figure 1A). The proportion of affinity of the populationsto each genetic cluster is also illustrated for each worldarea, which is represented by the prevalent PCOS geno-type and phenotype (Figures 1B and 2). The metabolicphenotype characterized by insulin resistance, metabolicsyndrome, type 2 diabetes, hypertension, and acanthosisnigricans is dominant in Asia, especially Central Asia, andin America. The hyperandrogenic phenotype predomi-nates in European, Mediterranean, and Middle Easternpatients, who show the most severe hirsutism. Consider-ing African and Oceanian PCOS–affected women, thephenotype is characterized by both hirsutism and insulinresistance with a predominant role of the latter feature.Indeed, a certain degree of mixed PCOS phenotypes co-
Figure 2. Box and whiskers plot of the overall continental membership in each genetic cluster. The continents are represented by the distributionof the Q values calculated by the STRUCTURE software. The charts, A, were obtained as the means of the Q values by merging the HGDP, 1000Genomes, and HapMap populations for each genetic cluster. Each cluster is peculiar for a specific geographic area because of thenonhomogeneous distribution of PCOS susceptibility marker frequencies. The acronym above the bars indicates a significant difference vs Africa,Af; America, Am; Central Asia, CA; Europe, Eu; East Asia, EA; Middle East/Mediterranean area, ME; and Oceania, Oc. Kruskal-Wallis and Dunn’spost-test (P � .0001). B, Relationship between genetic background and PCOS phenotype. The genetic clusters are represented by colored ovalsand located in the position of the corresponding phenotype (Figure 1). Prevalence of each cluster in each world area is proportional to the area ofthe oval, calculated using Q values; green, cluster 1; red, cluster 2; blue, cluster3; yellow, cluster 4; magenta, cluster 5. C, Clustering by principalcomponent (PC) analysis performed using SNP genotypes in relation to the metabolic and hyperandrogenic PCOS phenotypes (cumulativepercentage of data set coverage from PC1 and PC2 � 54.187%). The populations are represented by points colored depending on theirgeographical origin (left panel) or prevalent phenotype (right panel).
doi: 10.1210/jc.2014-2703 jcem.endojournals.org E2415
The Endocrine Society. Downloaded from press.endocrine.org by [${individualUser.displayName}] on 10 November 2014. at 05:13 For personal use only. No other uses without permission. . All rights reserved.
exists in each world population, as a result of genetic ad-mixture (Figure 1).
Genotype-phenotype linkThe analysis of the geographical distribution of the
merged Q values reveals that the affinity to a predominant,peculiar genetic cluster is typical for each continent (Figure2). Thus, the genetic background inferred by PCOS mark-ers is different and nonhomogeneous among the humanpopulations from diverse world areas (Figure 2A). Cluster1 is predominant in Africans. Cluster 2 is typical in CentralAsian, European, and Mediterranean/Middle Easternpeople, but with a lesser extent of membership to the clus-ter 1, revealing that these populations share a similar ge-netic background, calculated using PCOS markers. How-ever, Central Asians share a certain degree of membershipalso to Cluster 5 together with East Asians. Cluster 3 istypical of Americans and Eastern Asians. Cluster 4 is typ-ical of Oceanians and partly of Africans. The degree ofseverity of the two main PCOS phenotypes results from thecontribution of the genetic background. Each PCOS ge-notype is linked to its geographic area with a peculiarcombination of prevalent PCOS features. This is shown bycluster memberships, calculated as the Q value of the prev-alent clusters in each geographic area (Figure 2B). Indeed,cluster 1 is well represented in European, Mediterranean/
Middle Eastern, African, and American people, where hy-perandrogenic hirsutism is mid/severe. Independently ofthe PCOS features, cluster 2 is prevalent where the phe-notype is more severe. Clusters 3 and 5 are represented inassociation with the metabolic phenotype, which mainlydiffers for the overall severity and type of its features. Af-rican and Oceanian share a similar phenotype (cluster 4)characterized by mid degrees of metabolic risk and hy-perandrogenism, suggesting a genetic similarity for PCOSmarkers between these populations, according to the re-sult of genetic clustering at K � 4 (HGDP samples, Sup-plemental Figure 1). The link between PCOS genotype andphenotype was confirmed by principal component anal-ysis (Figure 2C), given that the population characterizedby the metabolic or hyperandrogenic phenotype sharespeculiar graph areas. However, all clusters are representedin each geographic area (Figures 1 and 2), probably con-tributing to the PCOS features and its severity (Figure 2).
Genetic diversity resulting from PCOS markersThe measure of the genetic distance, Fst, calculated for
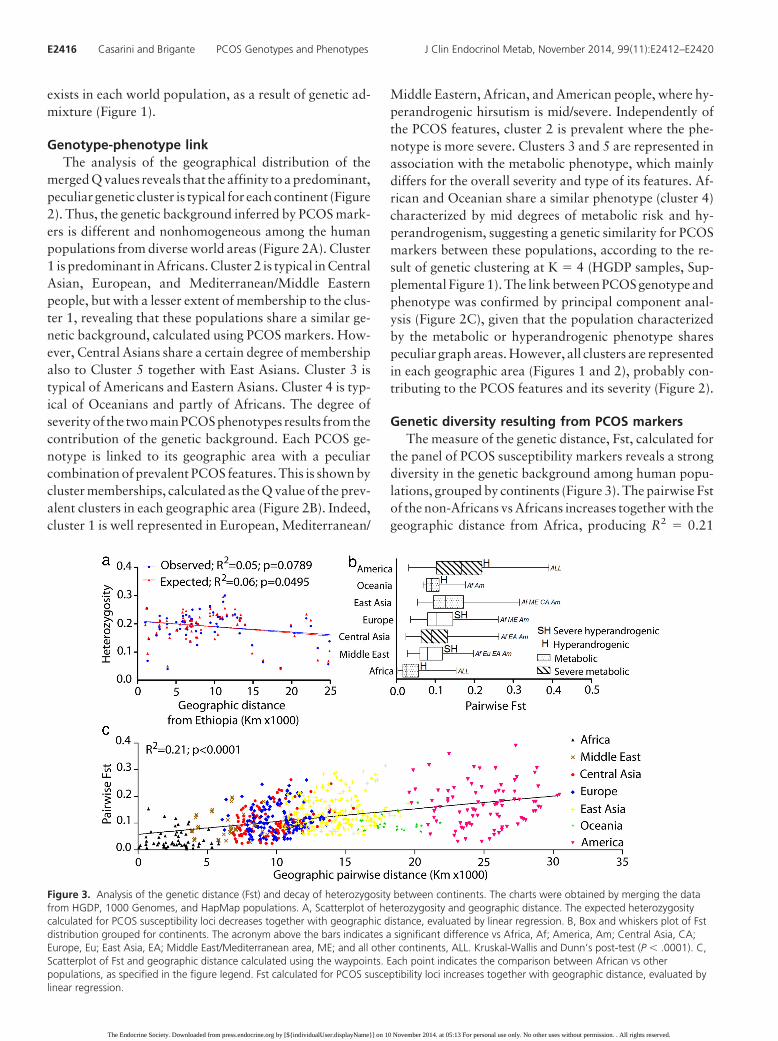
the panel of PCOS susceptibility markers reveals a strongdiversity in the genetic background among human popu-lations, grouped by continents (Figure 3). The pairwise Fstof the non-Africans vs Africans increases together with thegeographic distance from Africa, producing R2 � 0.21
Figure 3. Analysis of the genetic distance (Fst) and decay of heterozygosity between continents. The charts were obtained by merging the datafrom HGDP, 1000 Genomes, and HapMap populations. A, Scatterplot of heterozygosity and geographic distance. The expected heterozygositycalculated for PCOS susceptibility loci decreases together with geographic distance, evaluated by linear regression. B, Box and whiskers plot of Fstdistribution grouped for continents. The acronym above the bars indicates a significant difference vs Africa, Af; America, Am; Central Asia, CA;Europe, Eu; East Asia, EA; Middle East/Mediterranean area, ME; and all other continents, ALL. Kruskal-Wallis and Dunn’s post-test (P � .0001). C,Scatterplot of Fst and geographic distance calculated using the waypoints. Each point indicates the comparison between African vs otherpopulations, as specified in the figure legend. Fst calculated for PCOS susceptibility loci increases together with geographic distance, evaluated bylinear regression.
E2416 Casarini and Brigante PCOS Genotypes and Phenotypes J Clin Endocrinol Metab, November 2014, 99(11):E2412–E2420
The Endocrine Society. Downloaded from press.endocrine.org by [${individualUser.displayName}] on 10 November 2014. at 05:13 For personal use only. No other uses without permission. . All rights reserved.

(P � .0001) calculated by linear regression (Figure 3C)and indicating the strong contribution of genetic drift inthe establishment of PCOS markers distribution. The de-cay of the expected heterozygosity (Figure 3A) strengthensthis observation. The result is corroborated by the increaseof Fst and decay of heterozygosity, calculated for a widerrange of genetic markers in a previous study, when plottedagainst the distance from the putative starting point ofhuman migrations, in Ethiopia (36, 37). Differently fromwhat expected, the observed heterozygosity does not de-cay with distance, suggesting a relatively recent geneticadmixture. Moreover, the Fst distributions in Africans vsother populations (Figure 3A) is different among conti-nents, indicating strongly diverse, nonhomogeneous allelefrequencies in the distribution of PCOS markers world-wide (Figure 3).
Discussion
Previous stratification analyses using a wide number ofgenetic markers showed that the modern human popula-tion comprises six main genetic clusters depending on theethnic background, reflecting with surprising accuracy theethnicity and admixture degree of ancestry (45). Using thePCOS markers human population was stratified into fivedifferent genetic clusters falling within two main PCOSphenotypic groups. Thus, PCOS results in a hyperandro-genic and in a metabolic phenotype, reflecting the worlddistribution of the degree of affinity to genetic clusters.This analysis provides evidence that PCOS ethnic varia-tions are strongly determined by the genetic background inhumans (27, 34, 46–48), as already demonstrated by acomparative experiment between different PCOS mousestrains (49). Genetic cluster analysis relies on the simul-taneous combination of different SNPs, providing a higherlevel of accuracy than case-control studies, which, in fact,yielded conflicting results (50–53), not resulting in anyclear cause-effect indication related to ethnicity and pro-viding a hundred putative markers not independently con-firmed (19, 51). The study of ethnic variations of PCOSgenotype-phenotype link may be a useful approach for thepharmacological treatment of the disease and during in-fertility treatment.
PCOS phenotypesThe severity of the PCOS phenotypes may result from
different combinations of SNPs represented by the clusters(Figure 1 and Figure 2), eg, Americans and Asians with aprevalence of the metabolic phenotype, belonging to dif-ferent prevalent clusters (3 and 2, respectively; Figures 1Band 2). Conversely, European and Mediterranean/Middle
Eastern people share the hirsute-hyperandrogenic pheno-type and a high affinity to cluster 2, but also the affinity toclusters 1 and 4 is high among populations with a midhyperandrogenic phenotype, although characterized bymetabolic features rather than hirsutism. Thus, the ancienthumans’ migratory routes do not completely reflect thecurrent distribution of the PCOS phenotypes. Additionalconsiderations regarding the distribution of the genotypesand phenotypes are available separately (SupplementalDiscussion).
PCOS and genetic diversity among humansAlthough other alternatives were proposed and dis-
cussed (54, 55), Fst remains a widely used measure ofgenetic distance. The pairwise Fst calculated for the var-ious populations vs Africans increases together with thegeographic distance from Africa. This result is consistentwith previous data showing that genetic diversity is de-termined by a serial founder effect that occurred during theancient human migrations across the continents (36). Theincrease of Fst with the geographic distance calculated forPCOS markers in humans is the same of that previouslyobserved for a wider set of genetic markers from differentorganisms (36, 56–59), suggesting that its distribution isthe result of the random genetic drift. Nevertheless, thevariations of PCOS phenotypes among continents is dis-played through various characteristics and symptoms ap-parently incoherent with the geographic distance (Figure3), probably as a result of genetic admixture rather thannatural selection. In fact, each world population shares adifferent degree of affinity with the five genetic clusters,and therefore it may differently contribute to phenotypedetermination. Limitations due to genetic admixture werediscussed separately (Supplemental Discussion).
All things considered, the overall continental variabil-ity of the two main PCOS phenotypes is clearly linked toa peculiar genetic background, resulting from genetic driftand indicating that different genetic markers may reflectconvergent phenotypic features.
Natural selection or genetic drift?These data suggest that PCOS genotype and phenotype
may be not strongly affected by natural selection duringhuman evolution. Nevertheless, the reason why the prev-alence of PCOS is similar among the different world con-tinents remains to be demonstrated. A large number ofevolution-based theories were produced and extensivelydiscussed (16), providing rational evaluations for the evo-lution of different PCOS phenotypes in females, especiallythe metabolic phenotype, but not for the overall constantprevalence of the disease. Surprisingly, none of these the-ories considers the male as the carrier of an hyperandro-
doi: 10.1210/jc.2014-2703 jcem.endojournals.org E2417
The Endocrine Society. Downloaded from press.endocrine.org by [${individualUser.displayName}] on 10 November 2014. at 05:13 For personal use only. No other uses without permission. . All rights reserved.

genic trait, which may reasonably provide an improve-ment of his individual fitness, likely emphasizing the malesecondary sex characteristics. Indeed, both sexes sharemost of their genomes and express the same traits, how-ever resulting in antagonistic selection (60, 61). From thispoint of view, the prevalence of PCOS among differenthuman populations may be the result of the balance be-tween a positive selection in males against a negative se-lection in females. Our results are strengthened by thedemonstration that natural selection favors in similar pro-portions both protective and risk alleles for type 2 diabetes(62), suggesting that the phenotype linked to the diseaseresults in opposite effects on the fitness of both sexes. Pre-vious observations in other mammals support this hypoth-esis, since the selection for the sex hormone testosteroneleads to antagonistic reproductive fitness between parentsand their opposite-sex progeny (63). On the other hand, itis well known that evolution is often sex-dependent indifferent species (64–67), given that alleles can have pos-itive effects on fitness in one sex and negative in the other,resulting in intralocus sexual conflict (61, 68). Differentgenetic background for PCOS converging in two mainphenotypes together with overall constant prevalence ofthe disease support the presence of intralocus sexual con-flict, which may have affected the decay of observedheterozygosity. Even if speculative, in humans this mech-anism seems to be a “bug” inherited from admixture withdifferent hominids or from an ancient genome evolved inenvironmental and social conditions, strongly differentfrom those in which Homo sapiens lived in the last100 000 years (69, 70), but every hypothesis in this regardmust be demonstrated.
SummaryThe phenotypic expression of PCOS varies among hu-
man populations, depending on ethnicity. The distribu-tion of previously identified susceptibility disease markersresults in different, nonhomogeneous continental geneticbackgrounds by Bayesian clustering, reflecting the ethnicdistribution of the main PCOS phenotypes. Thus, a clearindication for PCOS ethnicity is shown, taking into ac-count a certain degree of genetic admixture between hu-man populations. The genetic distance increases togetherwith the distance from Africa, suggesting that the moderndistribution of PCOS susceptibility markers is the result ofgenetic drift likely due to a serial founder effect occurredduring the ancient human migrations as alternative to thenatural selection theory. Intralocus sexual conflict maycontribute to the maintenance of an overall constant prev-alence of PCOS measured in females. The analysis of thegenetic background may lead to important implicationsfor the pharmacological approach to the disease.
Acknowledgments
We thank Professor Manuela Simoni for her commitment, sup-port, and guidance in the field of endocrinology.
Address all correspondence and requests for reprints to: LivioCasarini, PhD, Unit of Endocrinology, Nuovo Ospedale CivileSant’Agostino Estense (NOCSAE), Via P. Giardini 1355, 41126Modena, Italy. E-mail: [email protected].
This work was supported by a grant of the Italian Ministry ofEducation, University and Research, No. PRIN 2010C8ERKX.
Disclosure Summary: The authors have nothing to disclose.
References
1. Domecq JP, Prutsky G, Mullan RJ, et al. Lifestyle modification pro-grams in polycystic ovary syndrome: Systematic review and meta-analysis. J Clin Endocrinol Metab. 2013;98:4655–4663.
2. Legro RS, Arslanian SA, Ehrmann DA, et al. Diagnosis and treat-ment of polycystic ovary syndrome: An Endocrine Society ClinicalPractice Guideline. J Clin Endocrinol Metab. 2013;98:4565–4592.
3. Moran LJ, Ranasinha S, Zoungas S, McNaughton SA, Brown WJ,Teede HJ. The contribution of diet, physical activity and sedentarybehaviour to body mass index in women with and without polycysticovary syndrome. Hum Reprod. 2013;28:2276–2283.
4. Rotterdam ESHRE/ASRM-Sponsored PCOS consensus workshopgroup. Revised 2003 consensus on diagnostic criteria and long-termhealth risks related to polycystic ovary syndrome (PCOS). HumReprod. 2004;19:41–47.
5. Kauffman RP, Baker TE, Baker VM, DiMarino P, Castracane VD.Endocrine and metabolic differences among phenotypic expressionsof polycystic ovary syndrome according to the 2003 Rotterdam con-sensus criteria. Am J Obstet Gynecol. 2008;198:670.e1–7.
6. Mojiminiyi OA, Safar FH, Al Rumaih H, Diejomaoh M. Variationsin alanine aminotransferase levels within the normal range predictmetabolic and androgenic phenotypes in women of reproductiveage. Scand J Clin Lab Invest. 2010;70:554–560.
7. Wijeyaratne CN, Seneviratne Rde A, Dahanayake S, et al. Phenotypeand metabolic profile of South Asian women with polycystic ovarysyndrome (PCOS): Results of a large database from a specialist En-docrine Clinic. Hum Reprod. 2011;26:202–213.
8. Dunaif A, Fauser BC. Renaming PCOS—a two-state solution. J ClinEndocrinol Metab. 2013;98:4325–4328.
9. Zhang HY, Guo CX, Zhu FF, Qu PP, Lin WJ, Xiong J. Clinicalcharacteristics, metabolic features, and phenotype of Chinesewomen with polycystic ovary syndrome: A large-scale case-controlstudy. Arch Gynecol Obstet. 2013;287:525–531.
10. Zhao Y, Qiao J. Ethnic differences in the phenotypic expression ofpolycystic ovary syndrome. Steroids. 2013;78:755–760.
11. Diamanti-Kandarakis E, Kouli CR, Bergiele AT, et al. A survey ofthe polycystic ovary syndrome in the Greek island of Lesbos: Hor-monal and metabolic profile. J Clin Endocrinol Metab. 1999;84:4006–4011.
12. Asunción M, Calvo RM, San Millán JL, Sancho J, Avila S, Escobar-Morreale HF. A prospective study of the prevalence of the polycysticovary syndrome in unselected Caucasian women from Spain. J ClinEndocrinol Metab. 2000;85:2434–2438.
13. Kumarapeli V, Seneviratne Rde A, Wijeyaratne CN, Yapa RM,Dodampahala SH. A simple screening approach for assessing com-munity prevalence and phenotype of polycystic ovary syndrome ina semi-urban population in Sri Lanka. Am J Epidemiol. 2008;168:321–328.
14. Azziz R, Woods KS, Reyna R, Key TJ, Knochenhauer ES, Yildiz BO.The prevalence and features of the polycystic ovary syndrome in an
E2418 Casarini and Brigante PCOS Genotypes and Phenotypes J Clin Endocrinol Metab, November 2014, 99(11):E2412–E2420
The Endocrine Society. Downloaded from press.endocrine.org by [${individualUser.displayName}] on 10 November 2014. at 05:13 For personal use only. No other uses without permission. . All rights reserved.

unselected population. J Clin Endocrinol Metab. 2004;89:2745–2749.
15. Wang S, Alvero R. Racial and ethnic differences in physiology andclinical symptoms of polycystic ovary syndrome. Semin ReprodMed. 2013;31:365–369.
16. Corbett S, Morin-Papunen L. The polycystic ovary syndrome andrecent human evolution. Mol Cell Endocrinol. 2013;373:39–50.
17. Azziz R, Dumesic DA, Goodarzi MO. Polycystic ovary syndrome:An ancient disorder? Fertil Steril. 2011;95:1544–1548.
18. Holte J, Bergh T, Berne C, Berglund L, Lithell H. Enhanced earlyinsulin response to glucose in relation to insulin resistance in womenwith polycystic ovary syndrome and normal glucose tolerance. J ClinEndocrinol Metab. 1994;79:1052–1058.
19. Louwers YV, Stolk L, Uitterlinden AG, Laven JS. Cross-ethnic meta-analysis of genetic variants for polycystic ovary syndrome. J ClinEndocrinol Metab. 2013;98:E2006–12.
20. Chen ZJ, Zhao H, He L, et al. Genome-wide association study iden-tifies susceptibility loci for polycystic ovary syndrome on chromo-some 2p16.3, 2p21 and 9q33.3. Nat Genet. 2011;43:55–59.
21. Shi Y, Zhao H, Shi Y, et al. Genome-wide association study identifieseight new risk loci for polycystic ovary syndrome. Nat Genet. 2012;44:1020–1025.
22. Simoni M, Tempfer CB, Destenaves B, Fauser BC. Functional ge-netic polymorphisms and female reproductive disorders: Part I:Polycystic ovary syndrome and ovarian response. Hum Reprod Up-date. 2008;14:459–484.
23. Unsal T, Konac E, Yesilkaya E, et al. Genetic polymorphisms ofFSHR, CYP17, CYP1A1, CAPN10, INSR, SERPINE1 genes in ad-olescent girls with polycystic ovary syndrome. J Assist ReprodGenet. 2009;26:205–216.
24. Gu BH, Park JM, Baek KH. Genetic variations of follicle stimulatinghormone receptor are associated with polycystic ovary syndrome.Int J Mol Med. 2010;26:107–112.
25. Eriksen MB, Brusgaard K, Andersen M, et al. Association of poly-cystic ovary syndrome susceptibility single nucleotide polymor-phism rs2479106 and PCOS in Caucasian patients with PCOS orhirsutism as referral diagnosis. Eur J Obstet Gynecol Reprod Biol.2012;163:39–42.
26. Goodarzi MO, Jones MR, Li X, et al. Replication of association ofDENND1A and THADA variants with polycystic ovary syndromein European cohorts. J Med Genet. 2012;49:90–95.
27. Li T, Zhao H, Zhao X, et al. Identification of YAP1 as a novelsusceptibility gene for polycystic ovary syndrome. J Med Genet.2012;49:254–257.
28. Welt CK, Styrkarsdottir U, Ehrmann DA, et al. Variants inDENND1A are associated with polycystic ovary syndrome inwomen of European ancestry. J Clin Endocrinol Metab. 2012;97:E1342–1347.
29. Mutharasan P, Galdones E, Peñalver Bernabé B, et al. Evidence forchromosome 2p16.3 polycystic ovary syndrome susceptibility locusin affected women of European ancestry. J Clin Endocrinol Metab.2013;98:E185–190.
30. Coop G, Pickrell JK, Novembre J, et al. The role of geography inhuman adaptation. PLoS Genet. 2009; 5:e1000500.
31. Pickrell JK, Coop G, Novembre J, et al. Signals of recent positiveselection in a worldwide sample of human populations. GenomeResearch. 2009;19:826–837.
32. Pritchard JK, Pickrell JK, Coop G. The genetics of human adapta-tion: Hard sweeps, soft sweeps, and polygenic adaptation. Curr Biol.2010;20:R208–215.
33. Cann HM, de Toma C, Cazes L, et al. A human genome diversity cellline panel. Science. 2002;296:261–262.
34. Cavalli-Sforza LL. The human genome diversity project: Past, pres-ent and future. Nat Rev Genet. 2005;6:333–340.
35. Cui L, Zhao H, Zhang B, et al. Genotype-phenotype correlations ofPCOS susceptibility SNPs identified by GWAS in a large cohort ofHan Chinese women. Hum Reprod. 2013;28:538–544.
36. Ramachandran S, Deshpande O, Roseman CC, Rosenberg NA,
Feldman MW, Cavalli-Sforza LL. Support from the relationship ofgenetic and geographic distance in human populations for a serialfounder effect originating in Africa. Proc Natl Acad Sci U S A. 2005;102:15942–15947.
37. Li JZ, Absher DM, Tang H, et al. Worldwide human relationshipsinferred from genome-wide patterns of variation. Science. 2008;319:1100–1104.
38. Abecasis GR, Altshuler D, Auton A, et al. A map of human genomevariation from population-scale sequencing. Nature. 2010;467:1061–1073.
39. The International HapMap Consortium. The International Hap-Map Project. Nature. 2003;426:789–796.
40. Pritchard JK, Stephens M, Donnelly P. Inference of population struc-ture using multilocus genotype data. Genetics. 2000;155:945–959.
41. Evanno G, Regnaut S, Goudet J. Detecting the number of clusters ofindividuals using the software STRUCTURE: a simulation study.Mol Ecol. 2005;14:2611–2620.
42. Sharov AA, Dudekula DB, Ko MS. A web-based tool for principalcomponent and significance analysis of microarray data. Bioinfor-matics. 2005;21:2548–2549.
43. Wright S. Isolation by distance. Genetics. 1943;28:114–138.44. Henn BM, Cavalli-Sforza LL, Feldman MW. The great human ex-
pansion. Proc Natl Acad Sci U S A. 2012;109:17758–17764.45. Rosenberg NA, Pritchard JK, Weber JL, et al. Genetic structure of
human populations. Science. 2002;298:2381–2385.46. Valkenburg O, Uitterlinden AG, Piersma D, et al. Genetic polymor-
phisms of GnRH and gonadotrophic hormone receptors affect thephenotype of polycystic ovary syndrome. Hum Reprod. 2009;24:2014–2022.
47. Hwang JY, Lee EJ, Jin Go M, et al. Genome-wide association studyidentifies GYS2 as a novel genetic factor for polycystic ovary syn-drome through obesity-related condition. J Hum Genet. 2012;57:660–664.
48. Zadeh-Vakili A, Ramezani Tehrani F, Daneshpour MS, Zarkesh M,Saadat N, Azizi F. Genetic polymorphism of vitamin D receptor geneaffects the phenotype of PCOS. Gene. 2013;515:193–196.
49. Dowling AR, Nedorezov LB, Qiu X, Marino JS, Hill JW. Geneticfactors modulate the impact of pubertal androgen excess on insulinsensitivity and fertility. PLoS One. 2013;8:e79849.
50. Fu L, Zhang Z, Zhang A, et al. Association study between FSHRAla307Thr and Ser680Asn variants and polycystic ovary syndrome(PCOS) in Northern Chinese Han women. J Assist Reprod Genet.2013;30:717–721.
51. Pau C, Saxena R, Welt CK. Evaluating reported candidate geneassociations with polycystic ovary syndrome. Fertil Steril. 2013;99:1774–1778.
52. Skrgati L, Baldani DP, Gersak K, Cerne JZ, Ferk P, Cori M. Geneticpolymorphisms of INS, INSR and IRS-1 genes are not associatedwith polycystic ovary syndrome in Croatian women. Coll Antropol.2013;37:141–146.
53. Xu P, Shen SM, Zhang XL, et al. Haplotype analysis of single nu-cleotide polymorphisms in anti-Müllerian hormone gene in ChinesePCOS women. Arch Gynecol Obstet. 2013;288:125–130.
54. Nei M. Analysis of gene diversity in subdivided populations. ProcNatl Acad Sci U S A. 1973;70:3321–3323.
55. Excoffier L, Smouse PE, Quattro JM. Analysis of molecular varianceinferred from metric distances among DNA haplotypes: Applicationto human mitochondrial DNA restriction data. Genetics. 1992;131:479–491.
56. Linz B, Balloux F, Moodley Y, et al. An African origin for the in-timate association between humans and Helicobacter pylori. Na-ture. 2007;445:915–918.
57. Stewart JF, Liu Y, Tauer CG, Nelson CD. Microsatellite versusAFLP analyses of pre-management introgression levels in loblollypine (Pinus taeda L.) and shortleaf pine. (P. echinata Mill.). TreeGenetics, Genomes. 2010;6:853–862.
58. Legrand D, Vautrin D, Lachaise D, Cariou ML. Microsatellite vari-ation suggests a recent fine-scale population structure of Drosophila
doi: 10.1210/jc.2014-2703 jcem.endojournals.org E2419
The Endocrine Society. Downloaded from press.endocrine.org by [${individualUser.displayName}] on 10 November 2014. at 05:13 For personal use only. No other uses without permission. . All rights reserved.
sechellia, a species endemic of the Seychelles archipelago. Genetica.2011;139:909–919.
59. Taylor SM, Antonia AL, Parobek CM, et al. Plasmodium falciparumsulfadoxine resistance is geographically and genetically clusteredwithin the DR Congo. Sci Rep. 2013;3:1165.
60. Cox RM, Calsbeek R. Sexually antagonistic selection, sexual di-morphism, and the resolution of intralocus sexual conflict. Am Nat.2009;173:176–187.
61. Pennell TM, Morrow EH. Two sexes, one genome: The evolution-ary dynamics of intralocus sexual conflict. Ecol Evol. 2013;3:1819–1834.
62. Ayub Q, Moutsianas L, Chen Y, et al. Revisiting the thrifty genehypothesis via 65 loci associated with susceptibility to type 2 dia-betes. Am J Hum Genet. 2014;94:176–185.
63. Mills SC, Koskela E, Mappes T. Intralocus sexual conflict for fitness:Sexually antagonistic alleles for testosterone. Proc Biol Sci. 2012;279:1889–1895.
64. Mainguy J, Côté SD, Festa-Bianchet M, Coltman DW. Father-off-spring phenotypic correlations suggest intralocus sexual conflict for
a fitness-linked trait in a wild sexually dimorphic mammal. Proc BiolSci. 2009;276:4067–4075.
65. Delph LF, Andicoechea J, Steven JC, Herlihy CR, Scarpino SV, BellDL. Environment-dependent intralocus sexual conflict in a dioe-cious plant. New Phytol. 2011;192:542–552.
66. Lewis Z, Wedell N, Hunt J. Evidence for strong intralocus sexualconflict in the Indian meal moth, Plodia interpunctella. Evolution.2011;65:2085–2097.
67. Postma E, Spyrou N, Rollins LA, Brooks RC. Sex-dependent selec-tion differentially shapes genetic variation on and off the guppy Ychromosome. Evolution. 2011;65:2145–2156.
68. Stearns SC, Govindaraju DR, Ewbank D, Byars SG. Constraints onthe coevolution of contemporary human males and females. ProcBiol Sci. 2012;279:4836–4844.
69. Vasseur E, Quintana-Murci L. The impact of natural selection onhealth and disease: Uses of the population genetics approach in hu-mans. Evol Appl. 2013;6:596–607.
70. Wang S, Lachance J, Tishkoff SA, Hey J, Xing J. Apparent Variationin Neanderthal Admixture among African Populations is Consistentwith Gene Flow from non-African Populations. Genome Biol Evol.2013;5:2075–2081.
E2420 Casarini and Brigante PCOS Genotypes and Phenotypes J Clin Endocrinol Metab, November 2014, 99(11):E2412–E2420
The Endocrine Society. Downloaded from press.endocrine.org by [${individualUser.displayName}] on 10 November 2014. at 05:13 For personal use only. No other uses without permission. . All rights reserved.