The Politics of Austerity: Modeling British Attitudes ... · PDF fileThe Politics of...
41
The Politics of Austerity: Modeling British Attitudes Towards Public Spending Cuts Walt Borges University of North Texas | Dallas [email protected] Harold D. Clarke University of Texas at Dallas and University of Essex [email protected] Marianne C. Stewart University of Texas at Dallas [email protected] David Sanders University of Essex [email protected] Paul Whiteley University of Essex [email protected] Version: April 7, 2012
Transcript of The Politics of Austerity: Modeling British Attitudes ... · PDF fileThe Politics of...
The Politics of Austerity: Modeling British Attitudes Towards Public Spending Cuts
Walt Borges University of North Texas | Dallas
Harold D. Clarke University of Texas at Dallas and University of Essex
Marianne C. Stewart University of Texas at Dallas
David Sanders University of Essex
Paul Whiteley University of Essex
Version: April 7, 2012

1
The Politics of Austerity: Modeling British Attitudes
Towards Public Spending Cuts
Are there no prisons?....And the union workhouses, are they still in operation? Ebenezer Scrooge to Charity Collector, 1851
Beginning in 2008 financial crises and ensuing economic turbulence have prompted
acrimonious national debates in many Western democracies over the need for substantial
budget cuts and debt reductions. Among economic and political elites there is broad
agreement that substantial public sector budget cuts are necessary to address unsustainable
sovereign debt loads and establish long-term fiscal integrity. Many ordinary citizens see
things differently—proposed austerity measures threaten programs that aid the disadvantaged
while challenging longstanding public commitments to education, health and personal
security that constitute the foundation of the modern welfare state. Coming close on the
heels of massive, widely publicized bailouts of major banks, investment firms and
manufacturing companies, the proposed reductions in public sector spending threaten to
overturn the distributional policy consensus in contemporary mature democracies.
As of this writing, several countries—inter alia, Ireland, Italy, Greece, Portugal,
Spain, the United States and the United Kingdom—either have implemented or are seriously
contemplating large-scale budget cuts that will necessitate painful reductions in public
services and benefits. Perhaps the best known case is Greece where the European Union and
the International Monetary Fund have dictated draconian financial policies to remedy the
country's sovereign debt crisis. The result has been widespread, oftentimes violent, public
protests and ongoing political turmoil. In the United Kingdom, proposed public-sector cuts
have prompted civil unrest and charges that the Conservative-led Coalition government

2
accords higher priority to enacting a neo-Thatcherite ideological agenda of small government
and re-privatization than the provision of effective health care and education for its citizens.
This study focuses on the British experience. Confronted with a pernicious
combination of rising public debt and growing unemployment when his coalition government
of Conservatives and Liberal Democrats assumed power in May 2010, Prime Minister David
Cameron and his Chancellor of the Exchequer, George Osborne, proposed to cut an average
of 20 percent from government spending over the next four years (Burns 2010). The plan was
to reduce the budget by £83 billion by eliminating 490,000 government jobs, curtailing
benefits, and chopping a broad range of "unnecessary" programs (BBC 2011). Public
employee pay was frozen for two years, with the prospect of one percent annual raises
offered for the following two years. Reductions in the government workforce would be
mitigated by increased participation by civic-minded volunteers who would provide public
services pro bono—a devolution-of-power and responsibility that Cameron and his advisors
termed “the Big Society.”
Progress towards these goals has been slow—by the end of 2011, the UK inflation
rate was nearly five percent and unemployment exceeded eight percent (Burns). Economic
growth has been less than projected and Chancellor George Osborne now anticipates that the
public sector cuts will take seven years to clear the deficit (Weidiger 2012). The projected
level of spending reductions is now fully £123 billion. A sense that the cuts are “too far, too
fast” is increasingly widespread, being enunciated both in the news media (Bloomberg 2011)
and, as will be documented below, in public opinion surveys.
Nothing has prompted more resistance than the Coalition Government's attempt to
devolve management and ownership of the National Health Service, its hospitals and other
3
facilities to physicians and private investors. Public skepticism about the benefits of such
moves has been compounded by criticism by medical professionals. Fearing the political
repercussions of such negative reactions to his plans for the NHS, Cameron and his Health
Secretary, Andrew Lansley, have excluded professional groups representing physicians,
nurses and midwives from recent conferences on how to implement the reforms.
Models incorporating demographic, attitudinal and evaluative variables are staples in
analyses of public support for political parties and their leaders, and here we develop similar
models for policy preferences. We first investigate the nature of public attitudes towards the
budget cuts using cross-sectional data from the British Election Study’s 2011 Alternative Vote
(AV) Referendum Survey. Then, we specify a multivariate model of these attitudes. The model
incorporates demographics, attitudinal/policy beliefs and economic evaluations. We also use
data from the monthly BES Continuous Monitoring Surveys (CMS) to analyze the dynamics of
public opinion about the likelihood of economic recovery since the failure of Lehman Brothers
Bank in September 2008 dramatized the onset of the financial crisis.
The proposed budget cuts pose pressing political questions. Will citizens in modern
welfare states accept their leaders’ assertions that public spending reductions are necessary? If
the answer is "no," will governing parties and leaders that propose and try to implement such
cuts face major losses of electoral support? To answer these questions in the British context, we
examine public attitudes towards the proposed cuts and assess how these attitudes affect support
for the Conservatives and Prime Minister David Cameron. As part of this analysis, we estimate
rival vote intention models to determine the relative importance of attitudes towards the cuts as
an explanatory factor. Do voters place more weight on economic conditions, attitudes towards
the spending cuts, or do they focus more heavily on the overall performance of parties and their

4
leaders? We also investigate the dynamics public opinion about the likelihood of solving the
financial crisis. This analysis begins in October 2008, the month after the failure of Lehman
Brothers. Monthly survey data are used to track the dynamics of opinions about solving the
crisis and factors that account for these dynamics. .
Theoretical Perspectives
We distinguish our study from previous work that analyzes the formation and persistence
of values that undergird the modern welfare state. We investigate factors affecting policy
evaluations and policy preferences and the political impacts of those evaluations and preferences.
Borre and Viegas (1995) have observed that there is only a weak connection between attitudes
that support general government intervention in the national economy and the specifics of that
response. In this study, we focus on a specific response—attitudes towards cuts in government
spending on services and benefits—rather than on the general ideological and belief-system
framework that provides the political cultural context for responses to government intervention.
Earlier research has raised questions about whether an individual’s overall level of
support for the welfare state is determined by careful weighing of the benefits and services
provided and the tax burden that must be assumed to sustain those benefits and services. Over
50 years ago, Downs (1960) speculated that there may be a large gap between citizens'
evaluations of policy inputs and outputs because people cannot see direct relationships between
what they contribute and what they receive. In markets, there is a direct relationship between
cost and benefits; in governments, there is not. Downs suggested that this disconnect may
reduce support for government spending among ordinary citizens. Subsequent studies focused
not on the disconnect, but rather on the idea that the tax burdens of the welfare state are
recognized by citizens, but are underestimated. Survey questions that “price” the benefits by

5
reminding respondents of the connection between social spending and taxation often show lower
support for spending (Winter and Mouritzen 2001), even while general policy preferences
remain largely the same (Confalonieri and Newton 1995).
In a recent review, Kumlin (2007) suggests that responses to the individual-level
consequences of welfare state programs may affect political attitudes and behavior. He notes
that this runs counter to stylized facts in the economic voting literature, in which sociotropic
economic evaluations, i.e., retrospective, contemporaneous and prospective evaluations of the
national economy, have stronger effects on political attitudes and voting behavior than do
egocentric evaluations (e.g., Lewis-Beck, 1988; Clarke et al., 2004).
Moreover, it bears emphasis that we are studying support for spending cuts in a crisis
context. Over a decade ago Pierson (2001) pointed out that many countries are finding it
difficult to fund previous commitments to the social safety net and the welfare state, and were
entering a period of what he called “permanent austerity.” The current situation may accentuate
this long-term general condition, but this study addresses the imposition of crisis-induced
austerity measures through a specific policy approach—the "shock therapy" of immediate, large-
scale cuts in public spending.
Models of political support in mature and emerging democracies usually focus on
three phenomena—support for the political community as a whole, for the political regime
and its institutions, and for specific authorities embodied as individual officeholders or
incumbent governments (Easton 1965; Kornberg and Clarke, 1992). When analyzing public
reactions to budget cuts in the United Kingdom, we concentrate instead on attitudes towards
a set of government policies—the spending cuts instituted in 2010-11 by the Conservative-
led Coalition Government of Prime Minister David Cameron. Extending electorally oriented
6
models to analyze support for policies is appropriate because, as Kornberg and Clarke (1992)
have observed, governments and political systems in mature democracies are expected to
help improve the quality of citizens’ lives, provide a safety net to ensure basic needs are met,
while at the same time mitigating the impact of individual- and group-level variations in
economic conditions that can significantly affect personal well-being and life chances. This
is the essence of the political-economic settlement that has defined the contours of
mainstream political discourse in Western democracies since the Great Depression of the
1930s.
When delineating factors that affect public attitudes towards the spending cuts
proposed by Mr. Cameron's Government, it is plausible that economic evaluations will be
prime determinants of those attitudes. Circa early 2012, the British economy is on the verge
of a "double-dip" recession as are the economies of many of its trading partners. Citizens are
exercised that massive debt has been amassed and are unsure who to blame. For their part,
the Conservatives and their coalition partners, the Liberal Democrats, contend that the
problem is attributable to the profligate practices of the previous New Labour governments
of Tony Blair and Gordon Brown. Other, more radical, voices on the right blame an influx
foreign workers and growing numbers of immigrants and miscellaneous miscreants who
exploit the benefit system at the expense of hardworking Britons. Still others argue that,
despite its best intentions, no 21st century British government can afford the commitments
made over half a century ago for a comprehensive social safety net in an era when the
percentage of elderly people is rapidly expanding and attendant health care costs are
exploding. All of these arguments are being made in a context of simmering public anger
over the bailout of British banks that worsened the debt and the deficits.
7
Students of economic voting long have argued that the economy and related valence
issues typically dominate the electoral agenda in mature democracies. The economy is
fundamental; it provides a simple, extremely useful guide for deciding how to cast one's
ballot. A strong economy indicates that the government is performing well, whereas a weak
economy is a clear signal of incompetence. Voters make responsibility attributions and when
the economy is in trouble incumbent parties and their leaders are in trouble as well. Of
course, the economy is not of a piece, and there have been protracted debates about which
aspects of economic performance matter most for political support (see, e.g., Lewis-Beck,
1988; Clarke et al., 2004). In this regard, Lewis-Beck and Stegmaier (2000; see also Bartels,
2008), have contended that rising income equality and enhanced financial insecurity may
become increasingly important components of the "economic vote" in contemporary mature
democracies.
Conjectures about the impact of income inequality, financial insecurity and "fair
shares" on voting behavior hearken back to longstanding arguments concerning the
significance, indeed dominance, of social class in British electoral politics (e.g., Butler and
Stokes, 1969). Although the growing weakness of social class as a predictor of party support
in Britain is well established (Clarke et al., 2004, 2009), it is possible that the political
relevance of class divisions will be reinvigorated by the current economic crisis and the
austerity policies being pursued by the Coalition government. In this regard, Dalton (2004)
has argued that social class no longer matters much in most elections in most mature
democracies, but economics does. Increasingly, voters are focusing on economic issues to
satisfy individual interests, not to show solidarity with a social class to which they belong.

8
Cutler (2002) is among the more recent voices stating the case for including social
class and other demographic variables in party support models. In studies of Canadian
elections, he finds that even the best informed voters who might be expected to make
electoral choices on the basis of policy considerations instead fall back on simple, observable
similarities and differences among parties and their support coalitions. Cutler also argues
that demographic effects undercut models of voter choice that emphasize partisan and leader
image heuristics.
The latter argument is problematic since there is an enormous volume of research
testifying that party identification is one of the most powerful factors cuing electoral choice
and orientations towards candidates and issues (e.g., Campbell et al., 1960; Clarke et al.,
2004, 2009; Lewis-Beck et al., 2008). In the present study, the pertinent question is whether
partisan and leader heuristics provide meaningful explanations of people's attitudes towards
budget cuts. Other heuristics may be at work as well. In this regard, general risk
acceptance/aversion orientations may be relevant to attitudes towards government cuts that
are being justified as "short-term pain for long-term gain." Ceteris paribus, risk acceptant
people will be willing to bet that the cuts will have beneficial effects going forward, whereas
risk averse individuals will be unwilling to take the wager.
Long ago St. Thomas Aquinas warned to beware the man of one book. Political
economists also should beware the researcher of one model. Composite models
incorporating different explanations of political behavior are routinely used in major election
studies (e.g., Lewis-Beck et al. 2008) and in the British context the statistical justification for
such models has been demonstrated by Clarke et al. (2004, 2009). This is the approach we
take in this study, assembling variables from competing models of electoral choice to specify
9
a composite model of attitudes towards the spending cuts and voting intentions. We draw
from socio-demographic models rooted in the voting studies of Lazarsfeld, Berelson and the
Columbia school in the 1940s and 1950s (Lazarsfeld et al. 1944, Berelson et al. 1954), from
the models of The American Voter (Campbell et al. 1960) and from models that posit
economic evaluations (both cognitive and emotional) as the most important components of
political choice (e.g., Fiorina, 1980; Lewis-Beck, 1988).
In particular, we are interested in valence politics models of party support. The
model draws on Stokes’ concept of valence issues (1963, 1992). Unlike positional issues
such as taxation-social spending trade-offs, the desirability of participating in the Iraq War or
electoral system reform that divide public opinion, valence issues manifest a strong opinion
consensus—voters share a common ideal point. The canonical valence issue is the economy,
with overwhelming numbers of people preferring low rates of inflation and unemployment
coupled with vigorous, sustainable economic growth. However, there are other important
valence issues as well, with massive majorities favoring affordable, effective health care and
educational systems, a clean environment and policies that promote national and personal
security. Pace Downs (1957) and the many advocates of spatial models of party competition
whom he inspired (see Adams, Merrill and Grofman, 2005), Stokes' contended that valence,
not positional, issues typically dominate the issue agenda. Voter's assessments of parties'
demonstrated and expected performance on such issues do much to drive electoral choice.
The valence politics model as articulated by Clarke et al. (2004, 2009; see also
Clarke, Kornberg and Scotto, 2009; Lewis-Beck, Nadeau and Bélanger, 2011) adds two other
major explanatory variables—partisanship and party leader images. Unlike the venerable
Michigan model that stressed the stability of party identification (Campbell et al., 1960), in

10
the valence politics model partisanship has dynamic properties (Clarke et al., 2004; Clarke
and McCutcheon, 2009; see also Fiorina 1981; Achen 1992; Franklin 1992). However, like
its Ann Arbor ancestor, at any point in time valence partisanship provides a powerful and
accessible voting cue (Snider, Brody and Tetlock 1992). Leader images are similar in that
they serve as influential heuristic devices for voters who lack information about parties'
policy preferences and, more important, their ability to deliver desired policy outcomes
(Clarke et al., 2004; Clarke, Kornberg and Scotto 2009; Lupia and McCubbins 1998).
Together with assessments of party performance on valence issues, partisanship and leader
images provide a powerful and parsimonious explanation of electoral choice.
Data Sources: The British Election Study (BES)'s AV Ballot Referendum Survey was
conducted in April and May 2011, with fieldwork being carried out by YouGov. Two survey
waves were administered to a representative national internet panel, with 22,124 respondents
completing the pre-referendum wave and 18,556 completing the post-referendum wave. The
BES also conducts a regular monthly internet survey—the Continuous Monitoring Survey
(CMS)—measuring the political attitudes, beliefs and opinion of approximately 1,000
Britons. Both sources of data are used for the analyses presented below.
Model Specification
Public Support for the Cuts
The principal dependent variable for the analyses—attitudes towards the budget
cuts—was constructed using responses to five questions. In three of the questions, a five-
point agree-disagree scale was used to measure responses1. The fourth question asked
respondents to choose between two statements about the cuts, one stating that the cuts would
strengthen Britain economically, and one stating that the cuts would push the UK into
11
recession. A middle category allowed respondents to say they did not know which option to
choose. A fifth question asked respondents about whether they favored more or fewer
services from the government, with a “don’t know” option as well. Responses to the five
questions were rescaled to produce high scores when the respondent thought that cuts were
needed to solve the UK’s economic problems, whereas low scores indicated that the
respondent believed that the cuts would be harmful. A principal components exploratory
factor analysis indicated that a single factor structures answers to the five questions, and we
use factor scores produced by this analysis as the dependent variable. Given the continuous
nature of the dependent variable, our model of attitudes towards the cuts was estimated with
ordinary least squares regression.
Predictor variables included demographic measures for gender, age, ethnicity,
education and income bands. Gender was a 0-1 dummy variable and age was measured in
years. We expected that men, who traditionally have less responsibility for child and family
care, would be more likely to favor the cuts. For age, we entertained two possibilities; older
people might be more conservative and favor the cuts, or they might recognize the
vulnerability of old age and oppose them. We also computed a new variable, the square of a
respondent’s age, in an effort to capture possible curvilinear effects of age. Ethnicity was
dichotomized into "white British" and other ethnicity and race identifications, with minorities
scored as 1 and "white British" as 0. As a vulnerable social group, we expected non-whites
to be opposed to the cuts. Income was measured in 14 bands. As income increased, we
anticipated that support for the cuts to increase, but education proved to be a trickier
prediction. Education often correlates with income, but the more highly educated also might
be more sympathetic to the need for an extensive set of publicly funded social programs.

12
The model also included dummy variables for Scotland and Wales to determine if
regional differences emerged. Scotland in particular is considered to be considerably more
left in its ideological proclivities than is the UK as a whole, and we hypothesized that being a
resident of Scotland would produce a negative coefficient in the multivariate analysis. We
made no such prediction with Wales.
We also included a dummy variable to evaluate the effects of workforce status and
vulnerability, combining short- and long-term unemployed into a single category with the
permanently disabled and ill and those with long-term caregiver responsibilities. We
predicted that those who were unemployed would find the public spending cuts harsh, both
because benefits were reduced and because spending cuts meant fewer opportunities for job
seekers. Similarly we predicted that the sick, disabled and caregivers would manifest less
support for the cuts than would other people.
As elsewhere, the economy is a major concern for most citizens of the UK. Our
model of attitudes towards the cuts contains a predictor variable measuring cognitive
evaluations of national and personal economic evaluations, constructed via an exploratory
factor analysis. The BES routinely measures economic evaluations with four questions on
five-point Likert scales. The questions elicit sociotropic and egocentric evaluations both
retrospectively and prospectively. The factor analysis of these items indicates that a single
economic evaluation factor structures responses. Emotional reactions towards the economy
were also elicited, using a question in which respondents were asked to describe their
feelings about the general economic situation. Respondents could select up to four words
from a field of eight that was divided equally between positive and negative labels.
Respondent then were scored by computing the number of positive answers minus the
13
negative ones. The resulting index ranges from -4 to +4, with -4 representing a very negative
emotional response and 4 representing a very positive view of the economy. For both
economic variables we predicted that increasingly positive scores would be associated with
greater support for the cuts.
The model also includes several variables drawn from valence models of electoral
choice described above. We created dummy party identification variables for the coalition
leading Conservative Party, the coalition minority partner Liberal Democrats and the
principal opposition Labour Party. Identifiers with various minor parties were placed in a
single dummy variable. Non-identifiers served as the reference party identification category.
Because the coalition proposed and enacted the cuts, we predicted positive correlations
between the Conservative and Liberal Democrat identification and support for the cuts and a
negative coefficient for the Labour Party. We did not predict the direction of the other party
identification effects. We did not include the party leader images in this model since feelings
about leaders are likely both cause and consequence of major policy initiatives such as public
sector spending cuts.
Risk acceptance/aversion, left-right ideology, attitudes towards EU membership and
attitudes towards political reform also were included in the model. The risk variable was
measured on an 11-point scale where 0 indicated a person really disliked taking risks and 10
indicated a person really liked taking them. The data indicated that Britons on the average are
slightly risk adverse, with a mean of 4.3 on the scale. Left-right ideology often is measured
on an 11-point scale using increased taxation and spending and tax cuts as the opposing
anchors, but this variable incorporated policy preferences intertwined with other attitude
variables, which led us to opt for alternative measures of ideology. In this regard, the BES

14
surveys ask respondents to choose placement on a similar 11-point scale that contrasts giving
priority to fighting crime as opposed to protecting the rights of the accused, and this was
employed as a proxy measure of general ideological conservatism. We also included a
variable that measured a respondent's approval or disapproval of membership in the
European Union, with the expectation that those opposing EU membership are conservative
individuals who would be more likely to support the cuts. Attitudes towards reform were
measured using seven questions in the AV referendum post-wave survey and one in the pre-
wave2. Factor analysis indicated three factors were in play, which we designated as support
for electoral reforms, support for traditional British institutions, and general support for the
devolution of government power away from Westminster. We anticipated that support for
traditional institutions and devolution of power would correlate with support for the cuts,
whereas support for electoral reforms proxied a progressive "left" orientation which would be
associated with diminished support for the cuts.
Voting Intentions and Feelings About David Cameron
For the Conservative voting intentions model, the dependent variable was
dichotomized in terms of a respondent’s intention to vote for the Conservatives or another
party. Feelings about Conservative Leader David Cameron were measured using an 11-point
scale ranging from 0 "really dislike" to 10 "really like." We also included another predictor
variable from the valence politics model, evaluations of which party was best on the most
important issue facing the country. This variable was measured as four 0-1 dummies for the
Conservatives, Labour, Liberal Democrats and miscellaneous other parties. Persons saying
"no party" was best or that they "didn't know which party was best" constituted the reference
category. The Cameron affect model was estimated with OLS regression.
15
We also estimated a series of rival models of voting intention for the Conservatives,
Labour, Liberal Democrats and other parties. Our purpose here was to determine which
models best explain voting intentions. The sociodemographic model included the age,
education ethnicity, gender, income, region and vulnerability variables described above. The
economic conditions model comprised variables measuring cognitive evaluations of and
emotional reactions to the economy. The political beliefs model included attitudes towards
political reform, as well as the variables measuring left-right ideology and support/opposition
to EU membership. Attitudes towards the cuts—the dependent variable in the spending cuts
regression analysis described above—becomes an explanatory variable in a separate model in
the voting intention models. Given its pro-con quality, it constitutes a concrete manifestation
of more abstract issue-proximity variables typically employed in Downsian-type spatial
models (e.g., Adams, Merrill and Grofman, 2005). Finally, as per the discussion above, the
valence politics model incorporates variables measuring feelings about the leaders of the
three major parties (David Cameron, Ed Miliband and Nick Clegg) as well as the several
dummy variables measuring party identification and party deemed best on the most important
issue facing the country.
The Conservative versus all other parties voting intention models were estimated
using binomial logit procedures. Voting intentions for Labour, Liberal Democrats and “other
parties” were estimated using multinomial logit models with Conservative voting intentions
serving as the base category. Since we were interested in the explanatory power of various
competing model specifications described above, we calculated McFadden and McKelvey
R2's, Akaike Information Criteria (AIC) and the percentage of voting intentions correctly
predicted by each model.
16
Of particular interest in the model comparisons is whether attitudes towards the cuts
largely account for the political preferences of voters, or whether the valence politics model
provides greater explanatory power. Our hypothesis is that, even in times of economic crisis,
voters' reactions to policies designed to address such a crisis are a substantial, but secondary,
element in the calculus of electoral choice. Accordingly, we hypothesize that the valence
politics model incorporating party performance on a range of valence issues, partisan
identifications and leader images will outperform a pure 'cuts model' and other rivals. In
addition, based on previous research, we expect that a composite model incorporating the
predictor variables from all five individual models will perform better than any individual
model.
Public Reactions to the Budget Cuts
The May 2011 BES survey data shows that many Britons are not sanguine about the
conditions facing the country. They also are divided about the cause of the crisis and the
policy path to recovery. Specifically, as Figure 1 illustrates, almost half of the respondents
(49 percent) attribute the necessity for spending cuts to mismanagement by the Labour Party
during its tenure in office, with 32 percent disagreeing that Labour policies caused the cuts.
Almost as many (47 percent) agreed that cuts were essential to preserve the long-term health
of the economy. Forty-five percent believed that the policies of the Cameron Government
would cause difficulties for their households whereas only 20 percent disagreed. Thirty-five
percent said they did not know what the personal impact of the cuts would be.
(Figure 1 about here)
Regarding assessments of the cause of Britain’s public debt, there were lower levels
of agreement on whether public excessive spending was the cause. Specifically, 37 percent

17
agreed that public spending was the cause of the debt, but 36 percent disagreed, and 27 were
uncertain. A possible explanation for this division in opinion may be widespread anger over
massive bailouts provided by the government to stabilize British banks. News stories persist
about the anger of Britons towards their banks, as manifested in recent controversies over
bonuses for bank executives who presided over speculative investments and the credit crunch
that followed the meltdown of major financial institutions.
Figure 2 summarizes data on attitudes towards expenditure cuts and the philosophical
balance between government provision of services and personal responsibility. Thirty-six
percent of Britons believe the spending cuts will strengthen the economy and 43 percent
believe the cuts will damage it. But a majority of respondents were skeptical of the
proposition that the government should provide fewer services and rely on individuals to
fend for themselves—55 percent said only the government can provide good public services,
compared to 29 percent who would opt for fewer government services.
(Figure 2 about here)
Tracing the dynamics of these opinions over time was accomplished using identical
questions contained in the monthly Continuous Monitoring Study surveys conducted between
June 2010 and January 2012. During this time frame, the percentage agreeing that the cuts
are essential to Britain’s economic health has fallen from 68 percent to the high 50s (see
Figure 3). In contrast, agreement that the cuts are likely to cause serious personal difficulties
has risen from 41 to 54 percent, while disagreement has fallen from 26 to 19 percent.
Whether excessive public spending was the cause of Britain’s debt produces is a contentious
proposition; public agreement and disagreement has fluctuated across a 10 point range for

18
agreement and a seven-point range for disagreement, but more people continue to agree that
excessive spending is the main cause of the British debt than disagree.
(Figure 3 about here)
Analyzing Attitudes Towards the Budget Cuts
The multivariate model of attitudes towards the cuts specifies 21 predictor variables,
of which 18 are statistically significant (p < .05) (Table 1). The model accounts for 51
percent of the variation in the dependent variable. As expected, party identification proved to
be a powerful predictor of support, with the Conservative identifiers (beta = 0.58) supporting
the cuts. Identifiers with the Liberal Democrats, the Conservatives' occasionally balky
coalition partner, showed more modest support (beta = 0.17). Labour identifiers were
strongly against the cuts, with a coefficient of -0.52.
(Table 1 about here)
Most socio-demographic variables were statistically significant and correctly signed.
Higher income and education, and male gender, produced positive support for the cuts, but
vulnerability (i.e., unemployed, disabled, caregiver), residing in Scotland and advanced age
decreased support for the cuts. The negative coefficient for age suggests that the elderly do
indeed perceive threats to their security from the cuts.
Similarly, most attitudinal variables tapping 'left-right' political orientations of
various kinds performed as expected. Thus, people who support EU membership and those
who emphasize the rights of the accused were less likely to support the cuts than were those
calling for Britain to sever its EU ties and prioritize crime fighting. The three dimensions of
attitudes towards institutional reform also produced the hypothesized results. The greater is
one’s support for traditional institutions—the church, monarchy and Parliament—the greater
19
is the likelihood of supporting the public spending cuts. The same relationship obtains for
those who support devolving more government power to local governments and individuals,
a key component of Mr. Cameron's "Big Society" vision. Again, as also expected, support
for reform of the electoral system is associated with opposition to the cuts. Finally, there is
evidence that more general personality characteristics are relevant, with heightened risk
acceptance being correlated with increased support for the cuts.
Analyzing Support for the Conservatives and David Cameron
Table 2 reports the results of estimating composite models of Conservative vote
intentions and feelings about Prime Minister Cameron, the chief proponent (with Chancellor
George Osborne) of the public spending cuts. After party identification and the judgment
that a Conservatives are best on the most important issue, support for public spending cuts is
the strongest predictor of affect for Cameron. The composite model explains 62 percent in
the variance in feelings about the prime minister, and estimates of coefficients for 17 of 24
predictor variables are statistically significant. All party identification terms are significant
predictors, as are all of the judgments on which party is best able to handle the most
important issue.
As noted above, we estimate the effects of factors affecting Conservative vote
intentions using a binomial logit model. This composite model correctly classifies 93.4
percent of the vote intentions and generates a McKelvey R2 of .87. To provide intuition
about the strength of the effects of various independent variables, we also estimated changes
in probability of voting Conservative as statistically significant predictors were varied over
their range while holding other predictors at their mean values in the case of continuous
variables or zero in the case of dummy variables. This procedure showed that the predicted

20
probability of voting Conservative would increase by .44 as attitudes towards the cuts shifted
from their lowest to their highest value (see Figure 4). Other powerful predictors are feelings
about Cameron (.79 increase in probability of voting Conservative) and Conservative Party
identification (.38 increase). Support for electoral reform produces a -.45 decrease in the
probability of voting Conservative. Other strong predictors include judgments that Liberal
Democrats (-.33 decrease) or Labour (-.31 decrease) are best on the most important issue.
(Figure 4 about here)
The analysis of the performance of rival models for voting intentions is summarized
in Table 3. Among the five competing specific models, the valence politics model best
predicts voting intention for Conservatives and for various opposition parties. By every
diagnostic measure, the valence politics model does significantly better than its competitors.
The other model of interest here, the "pure cuts model," outperforms all of the remaining
rivals. Echoing earlier research, Table 3 also documents that the composite model does
better than any of the specific models. However, as measured by the various summary
statistics presented in the table, its performance is only marginally better than the valence
politics model. This finding underscores the point that valence politics considerations are the
principal proximate drivers of vote intentions.
(Table 3 about here)
Why Are There So Many Bears in Britain?
The failure of Lehman Brothers on September 15th 2008 symbolized the growing
financial crisis and signaled the onset of the most serious global economic downturn since the
great depression of the 1930s. Starting in October 2008, the BES team began asking respondents
in monthly Continuous Monitoring Surveys (CMS) to use a 0-10 scale with 0 meaning '"very
21
unlikely" and 10 meaning "very likely" to forecast the likelihood that the crisis would be
resolved over the year ahead. From the outset, CMS respondents were quite bearish, with their
average score being 4.0 on the scale. Moreover, as illustrated in Figure 5, their pessimism has
grown over time, such that the average score in January 2012, is only 2.1. Since the
Conservative-Liberal Democrat Coalition took office, the average score has never exceeded 3.0.
(Figure 5 about here)
What are the sources of this pessimism? A simple answer to this question is: "It's
reality!—people are bearish because the economy is in terrible shape and shows little, if any,
sign of reviving." Given a continuing barrage of bad news about economic conditions, it is not
surprising that many people are less than sanguine about that the crisis will be resolved anytime
soon. In this regard, perhaps no single indicator carries as much weight in the public mind as the
unemployment rate—it is effectively an operational definition of how hard times are. In this
regard, Figure 5 documents that UK unemployment has risen from 5.8 percent in October 2008
to 8.4 percent in January 2012, with modest decreases in the run-up to the 2010 election being
followed by upward movements throughout much of 2011. The correlation between
expectations of solving the crisis and the unemployment rate is strongly negative ( r = -.67).
If, in fact, people typically use unemployment as the "big heuristic" for assessing the
present state and future prospects of the economy, then we should be able to model the
relationship between forecasts for solving the crisis and the jobless rate as an error correction
process. Other factors may have transient relevance for explaining variation in these forecasts,
but over the long run, they should evolve in dynamic equilibrium with movements in the length
of lines at Jobs Centers. Here, we specify three such factors. The first is Chancellor George
Osborne's annual budget speeches in 2009, 2010 and 2011 which have delivered a largely

22
unrelieved litany of bad news about the need for varying mixtures of spending cuts and tax hikes.
Second is the March 2009 announcement by the former Labour government of a massive and
unprecedented quantitative easing program to jump start the faltering economy. Third is the
presence since May 2010 of the Conservative-Liberal Democrat Coalition Government. Prime
Minister Cameron and Chancellor the Exchequer, George Osborne, have made the ailing
economy and an attendant need for austerity the touchstone of virtually every policy proposal
advanced by the Coalition Government. As a result, most of what passes for daily political news
includes a reminder that times are indeed tough. And, for their part, Labour Leader, Ed
Miliband, and his Shadow Chancellor, Ed Balls, have countered by claiming that the hard times
are worse than need be because their opposite numbers insist on pursuing an ill-advised neo-
Thatcherite economic agenda. In their view, privileging Hayek over Keynes is a recipe risks
rehearsing the 1930s.
The resulting model of public forecasts for whether the economic crisis will be resolved
over the forthcoming year is:
(1-L)RESOLVE(t) = b0 + b1*(1-L)UN(t-i) - α1*(RESOLVE(t-1) - λ1*UN(t-1)) +
b2*BUDGET(t-i) + b3*QE(t-i) + b4*COAL(t-i) + ε(t) (1)
where: RESOLVE = forecast for resolving the economic crisis; UN = unemployment rate;
BUDGET = annual budgets; QE = quantitative easing; COAL = Coalition government; εt =
stochastic error term (N (0,σ2), t is time, and α, b and λ are parameters to be estimated. Given
the structure of the model, its parameters are estimated using nonlinear least squares.
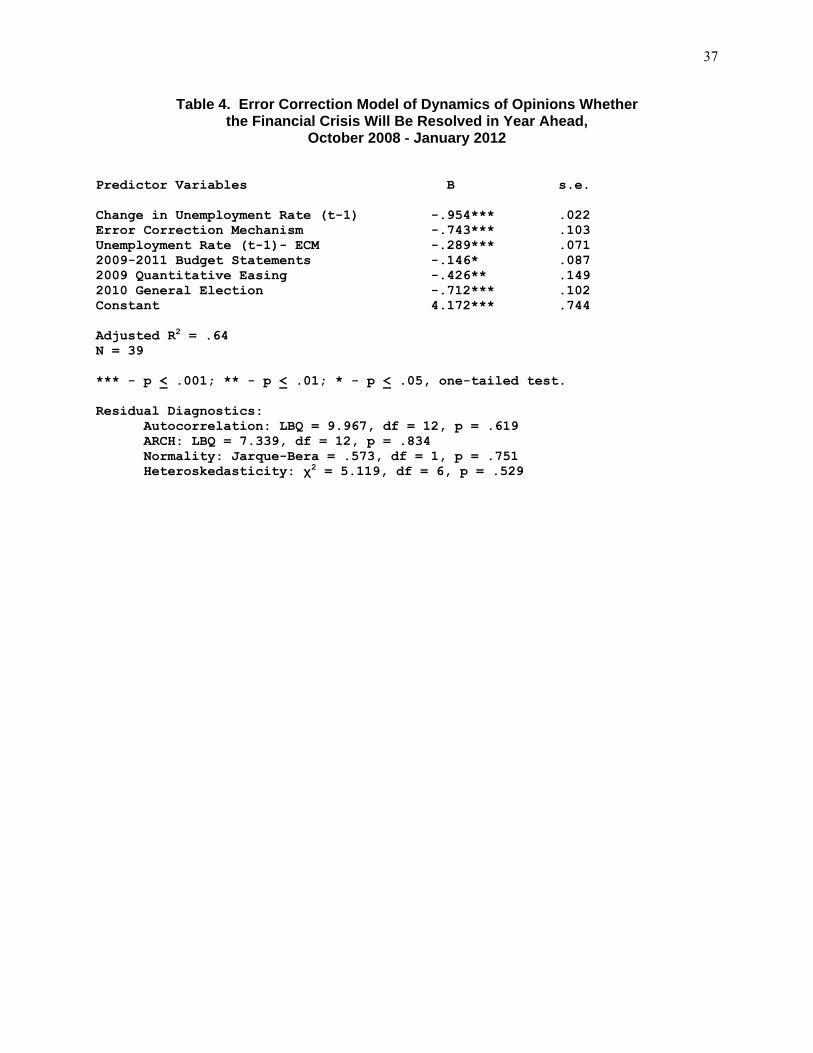
Results of analyzing the model using data for the October 2008 - January 2012 period are
displayed in Table 4. As shown, the model can account for a large percentage of the variation in
public forecasts for resolving the economic crisis (adjusted R2 = .64) and all parameters are
23
statistically significant and properly signed. Indicative of the power of the error correction
mechanism between these forecasts and monthly unemployment, the adjustment parameter is
-.74, p < .001. This signifies that a shock to the system, from whatever source, is eroded at a rate
of nearly 75 percent in each subsequent month by the error correction relationship between
forecasts for resolving the crisis and the unemployment rate. Unemployment also has large
short-term effects, with a one per cent increase in joblessness being sufficient to lower forecasts
by nearly one full point (-.95) on the 0-10 scale.
(Table 4 about here)
Other factors are in play as well. As expected, annual budgets, the March 2009 round of
quantitative easing, and the replacement of Labour by the Coalition all worked to lower public
forecasts of the likelihood that the economic crisis would be resolved over the next year. The
impact of the presence of the Coalition government is especially noteworthy. Specified as a
(thus far) permanent effect, the presence of the Coalition has worked (ceteris paribus) to reduce
economic forecasts by -.71 points each month. Effects of annual budget statements and
quantitative easing are smaller, .-15 and -.43, respectively, but statistically significant (p < .001).
Overall, the model provides a parsimonious account of public forecasts about the future
course of the economic crisis. As hypothesized, unemployment is the key heuristic, with
forecasts and joblessness defining a powerful error correction process. Since the autumn of
2008, that process has adjusted the effects of various political economic shocks, the largest being
the replacement of Labour by the Conservative-Liberal Democrat coalition at Westminster.
Conclusion: Economic Crisis and Performance Politics
David Cameron and his Coalition colleagues have chosen to ride the tiger of the poor
economic times while attempting to enact public spending cuts that trade pain today with the

24
promise of gain tomorrow. As the anti-Wimpy (Popeye’s sidekick sought a hamburger today for
payment tomorrow), the prime minister demands payment today and promises a hamburger
tomorrow. To date, Cameron has successfully tapped British public opinion that acknowledges
the seriousness of budgetary and sovereign debt difficulties and the need to address endemic
fiscal problems. Support for the Coalition's budget cuts is tied to party identification, economic
evaluations and reactions, and demographic factors that indicate self-sufficiency. But factors
that suggest economic vulnerability—unemployment, aging and lack of education and income—
mitigate the willingness to jump head first into schemes to shrink government.
Although there is a strong partisan divide in attitudes toward the cuts, Mr. Cameron and
his friends on the government benches face mounting skepticism on several fronts. First, there is
substantial fear that the cuts could damage the economy instead of curing it, and that the cuts
could cripple government infrastructure required to provide public services effectively. Second,
the uncertainty of policy outcomes and a changing economic environment means the cuts,
however well conceived in 2010 and 2011, may not be seen as effective policy going forward
and will prove to be a political liability in the run-up to the next general election. Open-ended
responses to the question in the BES AV referendum survey about the most important issue
facing the country are suggestive with regard to the latter possibility. Many of these responses
acknowledge the need of fiscal restraint, but others reject the present program as “too far, too
fast.” Still others raise equity-fairness concerns which could gain traction in the face of
disappearing benefits and services and continuing economic malaise.
A third, more pointed, element of skepticism recently has been enunciated as medical
professionals, interest groups and concerned patients attempt to rein in government plans to
restructure the cherished National Health Service. Since the Conservative-Liberal Democrat

25
Coalition came to power, commentators in the British press have asked whether a single-minded
pursuit of deep spending cuts is the right policy at the right time. Now they are asking if Prime
Minister Cameron and his much maligned Health Secretary Andrew Lansley are privileging a
Thatcherite ideological agenda at the expense of effective health care delivery.
Analyses of CMS time series data suggest that public support for the cuts eventually may
be undermined by a lack of visible results in the real economy. Although cuts currently are
widely perceived as essential for Britain's long-term economic health, an upward trending view
that slashing public services will cause serious difficulties for families may lead many people to
say enough is enough. Sustained high levels of unemployment propelled by public sector job
cuts put mounting pressure on relief programs and are unlikely to be regarded kindly by either
frustrated job seekers or those who used to be served by the fired employees. Furthermore,
confidence in the nation’s ability to solve the economic crisis has been falling as unemployment
continues to rise. At some point, public spending cuts may seem an inappropriate, unjust and
harsh response to a problem that is increasingly viewed as intractable to short-term solutions.
Finally, the fact that valence politics variables do much to drive the composite vote
intention model indicates that attitudes toward the spending cuts will not be the sole drivers of
party support in the next general election. Rather than respond directly and reflexively to the
conditions around them, British voters place economic hardships and policy in broader context
with images of party leaders, partisan attachments and more global assessments of party
performance. Differing attitudes about the harsh austerity measures are exerting substantial
effects on party support, but these attitudes have not negated the force of valence politics
considerations. Rather, reactions to the evolving state of the economy coupled with mutable
partisan attachments and the more general evaluations of party and leader performance that

26
voters are making can be expected to animate the model in predictable ways in the years ahead.
Performance politics remains important for understanding electoral choice in Britain and other
mature democracies as the present era of economic hardship and austerity policies unfolds.

27
ENDNOTES
1. The question format for the first three components of the dependent variable was as follows: Please indicate how far you agree or disagree with each of the following statements: - The Government’s cuts in public expenditure are essential for the long-term
health of the UK economy. - The cuts in public expenditure that the Government proposes are likely to
cause serious financial difficulties for me and my family. - Excessive public spending is the main cause of Britain’s debt.
Respondents could choose between Strongly approve, Approve, Neither approve nor disapprove, Disapprove, Strongly disapprove or Don’t know. The fourth question stated: Which of the following statements come closest to your view about the overall impact of the proposed public expenditure cuts?
- The public expenditure cuts will strengthen Britain’s economic growth and international competitiveness.
- The public expenditure cuts will damage Britain’s economy by pushing it further into recession.
- Don’t know. The fifth question was worded thus: Which of the following statements comes closest to your view?
- The government should do less to provide publicly funded services and do more to encourage people to provide services for themselves.
- Good public services can be provided only by the government. - Don’t know.
2. Respondents were asked to evaluate seven statement on five-point Likert scales: - The House of Commons should be reduced to 600 members. - The electoral system should be changed to proportional representation. - Local governments should have more authority. - The Monarchy should be abolished. - The Church of England should keep its status. - The United Kingdom needs more referendums to decide important issues. - MPs who vote against the party manifesto should resign and run again for their seats. The pre-wave question asked the respondents to designate which statement was more important:
- That one party get more than half the vote so it can govern on its own. - That every party’s percentage of seats in Parliament is the same as their
percentage of the vote. - Don’t know.

28
.

29
Figure 1
Source: 2010 BES-CMS AV referendum survey
.
Opinions About Cuts in Public Expenditure
47
49
45
37
23
19
35
27
30
32
20
36
0% 10% 20% 30% 40% 50% 60% 70% 80% 90% 100%
Cuts Essential forLong-Term Health of
Economy
Cuts Due to LabourMismanagement
Cuts Cause PersonalDifficulty
Excessive PublicSpending CausedGovernment Debt
Agree Neither/DK Disagree

30
Figure 2
Opinions About Budget Cuts and Public Services
3643
2129
55
16
0
20
40
60
80
100
CutsStrengthenEconomy
CutsDamage
Economy
Don't Know GovernmentShouldProvide
Fewer PublicServices
OnlyGovernmentCan ProvideGood Public
Services
Don't Know
Per
cen
t
Source: 2010 BES-CMS AV referendum survey .

31
Figure 3
Dynamics of Public Opinion About Cuts in Public Expenditure October 2008 - January 2012
10
20
30
40
50
60
06 07 08 09 10 11 12 01 02 03 04 05 06 07 08 09 10 11 12 012010 2011 2012
Per
cen
t
Date
Agree
Disagree
41
25
54
19
Percentages Agreeing or Disagreeing that Cuts are LikelyCause Serious Difficulties for Themselves and Their Families
10
20
30
40
50
60
70
06 07 08 09 10 11 12 01 02 03 04 05 06 07 08 09 10 11 12 012010 2011 2012
Per
cen
t
Date
Agree
Disagree
68
12
56
22
Percentages Agreeing or Disagreeing that Cuts are Essentialfor Long-Term Health of the UK Economy
25
30
35
40
45
50
06 07 08 09 10 11 12 01 02 03 04 05 06 07 08 09 10 11 12 012010 2011 2012
Per
cen
t
Date
Agree
Disagree
45
31
40
33
Percentages Agreeing or Disagreeing that Excessive Public SectorSpending is Main Cause ofBritain's Debt
Source: June 2006 - January 2012 BES-CMS surveys.

32
Figure 4
Change in Probability of Intending to Vote Conservative Associated With
Statistically Significant Predictors in Binomial Logit Model

33
Figure 5
2.0
2.4
2.8
3.2
3.6
4.0
4.4
5.5
6.0
6.5
7.0
7.5
8.0
8.5
08 10 01 04 07 10 01 04 07 10 01 04 07 10 01
2008 2009 2010 2011 2012
UnemploymentRate
Solve FinancialCrisis Next Year
Like
lihoo
d So
lve
Fina
ncia
lC
risis
Nex
t Yea
r (0-
10 S
cale
)U
nemploym
entRate
r = -.67
4.0
5.8
8.4
2.1
Date
2010 General Election-->
Likelihood of Solving Financial Crisis Next Yearand Unemployment Rate, August 2008 - January 2012
Source: October 2008 - January 2012 BES-CMS surveys and ONS unemployment data. .

34
Table 1. Multivariate Model of Opinions About Cuts in Public Expenditure,
May 2010 BES-AV Survey (OLS Estimates)
Predictor Variable B s.e. Party Identification: Labour -.518*** .015 Conservative .581*** .016 Liberal Democrat .174*** .021 Other Party -.007 .020 Economic Evaluations .264*** .007 Emotional Reactions Economic Conditions .074*** .004 Ideological/Policy Beliefs: Attitudes Towards Reform: Electoral System -.986*** .006 Devolution of Power .063*** .006 Traditional Institutions .091*** .006 Crime v. Rights of Accused -.023*** .002 EU Membership -.073*** .005 Risk Orientation .012*** .002 Vulnerability Status† -.061** .019 Age -.004* .002 Age Squared 9.334E-05*** 2.406E-05 Education .018*** .004 Ethnicity .009 .024 Gender .067*** .011 Income .022*** .002 Scotland -.032* .019 Wales -.009 .238 Constant .045 .061 Adjusted R2 = .51 N = 18,556 *** - p < .001; ** - p < .01; * - p < .05, one-tailed test. † - Unemployed, disabled, care-giver

35
Table 2. Multivariate Models of Conservative Vote Intentions and Feelings About Prime Minister David Cameron, May 2010 BES-AV Survey
Conservative Feelings About Vote Intentions† David Cameron‡ Predictor Variables B s.e. B s.e. Opinions About Public Expenditure Cuts .604*** .059 .974*** .021 Feelings About: David Cameron .516*** .025 -- -- Ed Miliband -.152*** .021 -- -- Nick Clegg -.140*** .022 -- -- Party Identification: Labour -1.776*** .134 -.573*** .046 Conservative 2.065*** .110 1.351*** .050 Liberal Democrat -1.774*** .140 .356*** .061 Other Party -1.628*** .129 -.222*** .057 Party Best Most Important Issue: Labour -1.867*** .255 -.709*** .046 Conservative .887*** .099 1.204*** .046 Liberal Democrat -2.098*** .412 .216* .093 Other Party -1.088*** .129 -.287*** .052 Economic Evaluations .079 .051 .166*** .019 Emotional Reactions to Economic Conditions .022 .030 .206*** .011 Ideological/Policy Beliefs: Attitudes Towards Reform: Electoral System -.479*** .044 -.089*** .016 Devolution of Power -.053 .045 .005 .015 Traditional Institutions .115** .047 .309*** .016 Crime v. Rights of Accused -.020 .019 -.003 .007 EU Membership -.091* .040 .027* .014 Vulnerability Status -.004 .152 -.067 .051 Age -.012*** .003 .006*** .001 Education -.080** .032 -.007 .011 Ethnicity .235 .183 .033 .064 Gender -.358*** .083 -.187*** .029 Income .027* .017 .003 .005 Scotland -.704*** .157 -.010 .051 Wales -.685*** .191 .153** .065 Constant -.968*** .310 4.161*** .097 McKelvey R2 = .87 Percentage Correctly Classified = 93.4 Adjusted R2 = .62 N = 18,556 -- - variable not included in model. † - binomial logit model. ‡ - OLS regression model.

36
Table 3. Rival Models of Voting Intentions, May 2011 CMS Survey Panel A. Conservative Voting Intentions (Binomial Logit Model) Percent Correctly Model McFadden R2 McKelvey R2 Classified AIC†
Socio-demographics .04 .06 64.6 19052.93 Economic Conditions .10 .17 69.0 17708.06 Political Beliefs .17 .29 72.3 16479.42 Attitudes-Cuts .38 .54 80.9 12309.00 Valence Politics‡ .76 .86 93.8 4829.82 Composite .77 .87 94.4 4506.15 Panel B. Labour, Liberal Democrat and Other Party Voting Intentions (Multinomial Logit Model) Percent Correctly Model McFadden R2 McKelvey R2 Classified AIC†
Socio-demographics .04 -- 44.7 36445.06 Economic Conditions .07 -- 51.6 35014.82 Political Beliefs .14 -- 53.8 32513.98 Attitudes-Cuts .25 -- 66.7 28238.60 Valence Politics‡ .70 -- 87.2 11344.86 Composite .72 -- 88.2 10634.37 † - Akaike Information Criterion; smaller values indicate better model performance (Burnham and Anderson, 2002). ‡ - leader images, party identification, party best on most important issue. -- - not defined for multinomial logit model.
37
Table 4. Error Correction Model of Dynamics of Opinions Whether the Financial Crisis Will Be Resolved in Year Ahead,
October 2008 - January 2012 Predictor Variables B s.e. Change in Unemployment Rate (t-1) -.954*** .022 Error Correction Mechanism -.743*** .103 Unemployment Rate (t-1)- ECM -.289*** .071 2009-2011 Budget Statements -.146* .087 2009 Quantitative Easing -.426** .149 2010 General Election -.712*** .102 Constant 4.172*** .744 Adjusted R2 = .64 N = 39 *** - p < .001; ** - p < .01; * - p < .05, one-tailed test. Residual Diagnostics: Autocorrelation: LBQ = 9.967, df = 12, p = .619 ARCH: LBQ = 7.339, df = 12, p = .834 Normality: Jarque-Bera = .573, df = 1, p = .751 Heteroskedasticity: χ2 = 5.119, df = 6, p = .529
38
REFERENCES Achen, Christopher H. 1992. Social Psychology, Demographic variables, and Linear Regression: Breaking the Iron Triangle in Voting Research. Political Behavior 14 (3): 195-211. Adams, James, Samuel Merrill III and Bernard Grofman. 2005. A Unified Theory of Party Competition. Cambridge: Cambridge University Press. Bartels, Larry. 2008. Unequal Democracy: The Political Economy of the New Gilded Age. Princeton: Princeton University Press. Berelson, Bernard R., Paul F. Lazarsfeld and William N. McPhee. 1954. Voting. Chicago: The University of Chicago Press. Bloomberg.com. 2011. U.K. Needs Cameron’s Austerity, but Perhaps Not So Quickly: View. Dec. 11: http://www.bloomberg.com/news/2011-12-07/u-k-needs-cameron-s-austerity- program-but-perhaps-not-so-quickly-view.html. Accessed Feb. 24, 2012. Borre, Ole. and Jose Manuel Viegas. 1995. Government Intervention in the Economy, pp. 234- 280 in The Scope of Government, ed. Ole Borre and Elinor Scarbrough. Oxford: Oxford University Press. British Broadcasting Corp. 2011. EU Austerity Drive Country by Country. Nov. 11: http://www.bbc.co.uk/news/10162176. Accessed Feb. 24, 2012. British Election Study. 2011. AV Ballot Referendum Study. Colchester: University of Essex. British Election Study. 2012. Continuous Monitoring Surveys, June 2010 - January 2012. Colchester: University of Essex. Burns, John F. 2011. British Leader Pushes for ‘Can-Do Optimism’ and Faith in Austerity Path. New York Times. Oct. 6: A10. Butler, David and Donald E. Stokes. 1969. Political Change in Britain. New York: St. Martin's Press. Campbell, Angus, Philip E. Converse, Warren E. Miller, and Donald E. Stokes. 1960. The American Voter. New York: Wiley. Clarke, Harold D., Allan Kornberg, and Thomas J. Scotto. 2009. Making Political Choices: Canada and the United States. Toronto: University of Toronto Press. Clarke, Harold D. and Allan McCutcheon). 2009. "The Dynamics of Party Identification Revisited." Public Opinion Quarterly 73: 704-28.
39
Clarke, Harold D., David Sanders, Marianne C. Stewart and Paul Whiteley. 2004. Political Choice in Britain. Oxford: Oxford University Press. Clarke, Harold D., David Sanders, Marianne C. Stewart and Paul Whiteley. 2009. Performance Politics and the British Voter. Cambridge: Cambridge University Press. Confalonieri, Maria A., and Kenneth Newton. 1995. Taxing and Spending: Tax Revolt or Tax Protest. pp 121-14, in The Scope of Government, ed. Ole Borre and Elinor Scarbrough. Oxford: Oxford University Press. Cutler, Fred. 2002. The Simplest Shortcut of All: Sociodemographic Characteristics and Electoral Choice. The Journal of Politics. 64: 466-90. Dalton, Russell J. 2006. Citizen Politics, 4th ed. Washington: CQ Press. Downs, Anthony. 1957. An Economic Theory of Democracy. New York: Harper and Row. Downs, Anthony. 1960. Why the Government Budget is Too Small in a Democracy. World Politics. 12(4): 541-63. Easton, David. 1965. A Systems Analysis of Political Life. New York: Wiley. Fiorina, Morris P. 1981. Retrospective Voting in American National Elections. New Haven: Yale University Press. Kornberg, Allan, and Harold D. Clarke. 1992. Citizens and Community: Political Support in a Representative Democracy. Cambridge: Cambridge University Press. Kumlin, Staffan. 2007. The Welfare State: Values, Policy Preferences, and Performance Evaluations, in The Oxford Handbook of Political Behavior. Oxford: Oxford University Press. Lazarsfeld, Paul F., Bernard Berelson and Hazel Gaudet. 1944. The People’s Choice. New York: Duell, Sloan and Pearce. Lewis-Beck, Michael S. 1988. Economics and Elections: The Major Western Democracies. Ann Arbor: University of Michigan Press. Lewis-Beck, Michael S., Richard Nadeau and Eric Bélanger. French Presidential Elections. London: Palgrave Macmillan, 2011. Lewis-Beck, Michael S., and Mary Stegmaier. 2000. Economic Determinants of Electoral Outcomes. Annual Review of Political Science. 3: 183-219.

40
Lewis-Beck, Michael S., William G. Jacoby, Helmut Norpoth and Herbert F. Weisberg. 2008. The American Voter Revisited. Ann Arbor: The University of Michigan Press. Lupia, Arthur, and Mathew D. McCubbins. 1998. The Democratic Dilemma: Can Citizens Learn What They Need to Know? New York: Cambridge University Press. Pierson, Paul, ed. 1993. The New Politics of the Welfare State. Oxford: Oxford University Press. Sniderman, Paul M., Richard A. Brody, and Philip Tetlock. 1991. Reasoning and Choice: Explorations in Political Psychology. Cambridge: Cambridge University Press. Stokes, Donald E. 1963. Spatial Models of Party Competition. American Political Science Review 57(2): 368-377. Stokes, Donald E. 1992. Valence Politics. In Electoral Politics, edited by D. Kavanagh. Oxford: Clarendon Press. Werdigier, Julia. 2011. Its Growth Slowing, Britain Extends Austerity Measures. New York Times. Nov. 30: B8. Winter, Soren, and Poul Erik Mouritzen, PE. 2001 Why people Want Something for Nothing: The Role of Asymmetrical Illusions. European Journal of Political Research. 39: 109- 43.