The Political Economy of Infrastructure Development in Post-Independence India
36
The Political Economy of Infrastructure Development in Post-Independence India Rajiv Lall and Anupam Rastogi* * Rajiv Lall is MD and CEO of IDFC. Anupam Rastogi is Principal in the Policy Group of IDFC. The views expressed in this paper are their own. This paper was written to mark the Golden Jubilee of National Council of Applied Economic Research, New Delhi and forthcoming in the NCAER’s “Golden Jubilee” volume by Sage Publishing House. IDFC Occasional Paper Series 2007/1 April 2007
Transcript of The Political Economy of Infrastructure Development in Post-Independence India

M4 - D:\Booklet\IDFC-PEID-Report\IDFC-PEIDPII-Report.p65
The PoliticalEconomy ofInfrastructureDevelopment inPost-IndependenceIndiaRajiv Lall and Anupam Rastogi*
* Rajiv Lall is MD and CEO of IDFC.
Anupam Rastogi is Principal in the
Policy Group of IDFC. The views
expressed in this paper are their own.
This paper was written to mark the
Golden Jubilee of National Council of
Applied Economic Research, New Delhi
and forthcoming in the NCAER’s
“Golden Jubilee” volume by Sage
Publishing House.
Cover - 1
IDFC Occasional Paper Series 2007/1
April 2007

Blank M4 - D:\Booklet\IDFC-PEID-Report\IDFC-PEIDPII-Report.p65Cover-2
CONTENTS
Introduction .............................................................................................................................................................. i
I. Infrastructure Sector since Independence .................................................................................................................... 1
Figure 1 – Infrastructure spending 1951-2005 (per cent GDP) ..................................................................................... 1
Figure 2 – GDP growth and Growth in Infrastructure Spending 1951-2005 (Ten year Moving Average) ..................... 3
Table 1 – Economic growth and infrastructure spending in post-Independent India 1951-2004 ................................. 4
II. Phases of post-Independence Political Economy in India ............................................................................................. 4
Table 2 – Eras of political economy in post-Independent India 1951-2004 .................................................................. 4
Nehru Era .............................................................................................................................................................. 5
Indira Gandhi Era ......................................................................................................................................................... 6
Rajiv Gandhi Era .......................................................................................................................................................... 8
Figure 3 – Expenditure on Subsidies, Debt Servicing and Administrative Services (1970-2004) .................................... 8
The Era of Decentralized Politics .................................................................................................................................. 9
Figure 4 – Electoral Position of Indian National Congress in Lok Sabha (1951-2004) ................................................... 9
Figure 5 – Electoral Position of Indian National Congress in State Legislatures (1951-2004) ........................................ 10
III. The Three Waves of Infrastructure Build-out ................................................................................................................ 10
The First Wave and the Nehru Era ............................................................................................................................... 10
Figure 6 – Plan-wise sector-wise Expenditure (Rs ‘000 crore) ....................................................................................... 11
The Second Wave and the Indira Gandhi Era ............................................................................................................... 11
Figure 7 – Built up of Minor Irrigation in the Indira Gandhi Era ................................................................................... 12
Figure 8 – Pace of Rural Electrification 1947-2004 ...................................................................................................... 13
Figure 9 – Consumption of Commercial Energy by Agriculture Sector ......................................................................... 13
Figure 10 – Growth of Installed Electricity Generation Capacity in MW ....................................................................... 14
Table 3 – Progress of Road Network ............................................................................................................................ 14
Figure 11 – Construction of Rural roads 1951–2001 ................................................................................................... 15
The Third Wave and the Rajiv Gandhi Era .................................................................................................................... 16
Figure 12 – Planned Expenditure on Telecommunication 1951-2002 .......................................................................... 16
Box 1 – Development of Telecom Sector in India ......................................................................................................... 17
IV. Infrastructure in the Era of Decentralized Politics ......................................................................................................... 17
Figure 13 – Infrastructure spending and votes to INC .................................................................................................. 18
Figure 14 – Trends in Government Expenditure and Public Sector Fixed Capital Formation ......................................... 18
Table 4 – Evidence of shortages ................................................................................................................................... 19
Figure 15 – Telecom Growth – The Changing Scenario ............................................................................................... 19
Box 2 – Task Force on Infrastructure ............................................................................................................................ 20
What Next: The Era of Middle Class Politics? ............................................................................................................... 21
Table 5 – Consumer goods ownership in India ............................................................................................................ 21
Figure 16 – Mobile Growth and Effective Charge per minute ...................................................................................... 22
Figure 17 – Growth of the Global Middle Class ........................................................................................................... 23
Bibliography .............................................................................................................................................................. 24
Annex 1 – Development of Indian Road Network ........................................................................................................ 26
Table A1 – Targets and Achievements under 20-Year Road Plans ................................................................................ 26
Table A2 – Electoral Results of Indian National Congress (INC) in Lok Sabha (1951-2004) .......................................... 27
Table A3 – Electoral Results of Indian National Congress in State Legislatures (1951-2004) ........................................ 28
M4 - D:\Booklet\IDFC-PEID-Report\IDFC-PEIDPII-Report.p65

Blank M4 - D:\Booklet\IDFC-PEID-Report\IDFC-PEIDPII-Report.p65

INTRODUCTION
Infrastructure services, defined broadly to include roads, ports, airports, communication networks, water supply, irrigation
systems, and electric power, have unique characteristics that invariably generate special interest among governments of
all kinds, be they monarchical, authoritarian, republican or otherwise. While it is true that infrastructure in the 19th century
was largely owned and managed by private entities in many countries including the US and the UK, with the increasing
scale of infrastructure provisioning to an expanding consumer set over the years, governments, as guardians of public
interest, were compelled to intervene if not as owners, then certainly in a regulatory role. Indeed, over the 20th century,
infrastructure development and service delivery reverted in varying degrees across different countries to the state preserve.
In fact, by the second half of the 20th century, infrastructure came largely within the state domain in emerging market
economies. Since the 1990s, however, endeavours to invite private interest in the infrastructure sector have been renewed.
Given the strategic importance of infrastructure services, their role as public goods and their natural monopoly characteristics
and associated externalities, and often large and lumpy nature of investments involved, the state can never fully relinquish
its role as the key player in this space.
Be it power utilities or the Interstate Highway system of the United States; mass-transit systems or the water utilities of
modern day Europe; airports or the high speed rail system in Japan, the story of infrastructure development in these
countries is closely linked to their political histories and the changing roles of governments (federal, state and local) in
their economic development. India is no exception. Therefore, in seeking to shed light on the post-Independence evolution
of India’s infrastructure sector, the primary objective of this paper, we must place our analysis in the wider context of the
evolution of the country’s political-economy.
This paper is accordingly divided into four sections. The first is descriptive in nature and attempts, notwithstanding
certain obligatory definitional challenges and data constraints, to capture the broad trends in infrastructure development
over the past five and a half decades. It seeks also to explore the relationship between infrastructure development and
GDP growth in the Indian context.
The second is more schematic – it seeks to present a political economy framework to understand the different phases of
policy making in post-Independent India.
Sections III and IV are interpretative (as opposed to rigorously analytical). They rely on the political economy framework
laid out, to shed light on the distinct phases of post-Independence infrastructure policy, implementation and service
delivery. They try to explain why and how infrastructure development took place; why such an acute shortage of just
about any kind of infrastructure service prevails today (with the notable exception of telecommunications services); and
why we may have reasons, notwithstanding our current predicament, to be optimistic about our ability to meet the
significant challenge of building the infrastructure that this country so desperately needs.
M4 - D:\Booklet\IDFC-PEID-Report\IDFC-PEIDPII-Report.p65
i

M4 - D:\Booklet\IDFC-PEID-Report\IDFC-PEIDPII-Report.p65Blank
The Pol i t i ca l Economy of Infrastructure Development in Post - Independence India
1
M4 - D:\Booklet\IDFC-PEID-Report\IDFC-PEIDPII-Report.p65
I. Infrastructure Sector Since Independence
The definition of ‘infrastructure’ is nebulous and a temporally moving target changing with technological innovation.
Thus, what is regarded as infrastructure today (such as optical fiber networks) could not have been envisioned as
such fifty years ago. Official definitions of what comprises infrastructure also change over time. Specifically in the
Indian context, up until the Fourth Five Year Plan, irrigation was considered part of infrastructure and all data
pertaining to investments therein were recorded as part of infrastructure. But since then, irrigation was included in
the agriculture sector, making inter-temporal comparisons more challenging. Moreover, there is no uniform definition
of infrastructure across different record keeping agencies of government. Thus what is infrastructure for the Ministry
of Finance (MoF) is not so for the Reserve Bank of India (RBI). And in general, what is considered to be part of
infrastructure in the Indian context is not regarded as such elsewhere in the world. The Indian definition of the
term, like the pantheon of Hindu Gods, is somewhat more expansive than what the term signifies in literature
elsewhere. In this paper, unless otherwise mentioned, we include within the purview of infrastructure, power,
irrigation, roads, rail, airports, ports and telecom only. Getting consistent time series data for even this definition of
infrastructure is challenging. We have, therefore, made use of two different time series to give us a bird’s eye view
of the broad trends in the sector.
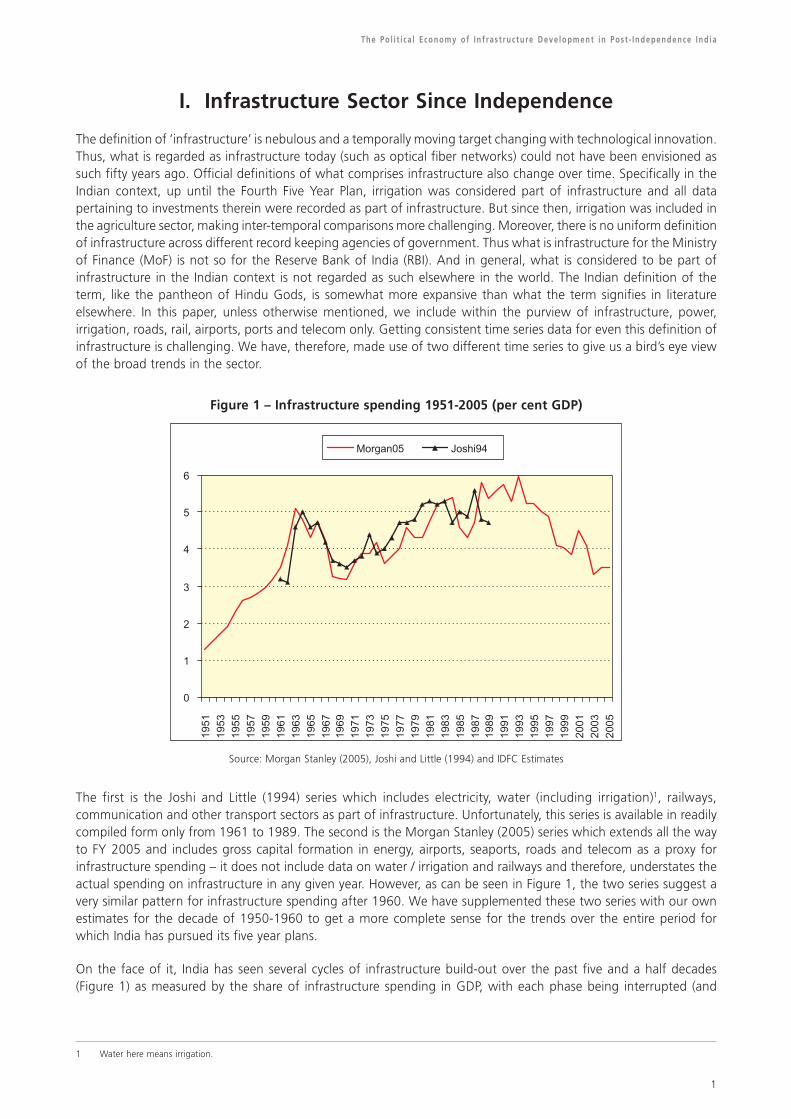
Figure 1 – Infrastructure spending 1951-2005 (per cent GDP)
Source: Morgan Stanley (2005), Joshi and Little (1994) and IDFC Estimates
The first is the Joshi and Little (1994) series which includes electricity, water (including irrigation)1, railways,
communication and other transport sectors as part of infrastructure. Unfortunately, this series is available in readily
compiled form only from 1961 to 1989. The second is the Morgan Stanley (2005) series which extends all the way
to FY 2005 and includes gross capital formation in energy, airports, seaports, roads and telecom as a proxy for
infrastructure spending – it does not include data on water / irrigation and railways and therefore, understates the
actual spending on infrastructure in any given year. However, as can be seen in Figure 1, the two series suggest a
very similar pattern for infrastructure spending after 1960. We have supplemented these two series with our own
estimates for the decade of 1950-1960 to get a more complete sense for the trends over the entire period for
which India has pursued its five year plans.
On the face of it, India has seen several cycles of infrastructure build-out over the past five and a half decades
(Figure 1) as measured by the share of infrastructure spending in GDP, with each phase being interrupted (and
1 Water here means irrigation.

Lal l and Rastogi
2
M4 - D:\Booklet\IDFC-PEID-Report\IDFC-PEIDPII-Report.p65
partly, albeit temporarily, reversed) by exogenous shocks of different kinds. Thus, after a smart run up in the
infrastructure spending to GDP ratio for the first 7 years of the decade of the 1950, we saw a severe reduction in
the same for 3 years following the foreign exchange crisis of 1957-58.
The second cycle of infrastructure spending growth spanned roughly the first half of the 1960s and was cut short
upon the death of Nehru in 1964. The ensuing decline in infrastructure spend as a share of GDP was prolonged by
subsequent events including the 1965 war with Pakistan, the drought of 1967/68, and the Bangladesh war of 1971
when infrastructure spend hit a post-independence low of 3.3 per cent of GDP.
Over the decade of the 1970 we saw two more growth cycles in infrastructure spending. The first was cut short by
the oil shock of 1973-74 and the political crisis associated with the Emergency of 1975-76. The second was
interrupted by the oil shock of 1979-80.
The decade of 1980 was likewise punctuated with a fourth and fifth cycle of growth in infrastructure spending. The
fourth cycle peaked at an infrastructure to GDP ratio of 5.3 per cent in 1984-85, the year of a failed monsoon and
the death of Indira Gandhi. The fifth cycle saw an extraordinarily sharp ramp up in ratio of infrastructure spending
to GDP ratio which rose to a new post Independence peak of 5.7 per cent in 1991, the year of Rajiv Gandhi’s
assassination and the IMF crisis.
Since then, the experience of the past decade and a half has been tangibly different from previous decades. There
has been no growth cycle or sustained recovery in infrastructure spending from the post-IMF crisis trough. On the
contrary, we have witnessed an unprecedented and sustained decline in infrastructure spending, punctuated only
by two very short lived growth spurts: one in 1994-95, corresponding to a significant one time flow of
telecommunications related FDI, and a second in 2001-02 corresponding to government support for the 4-laning
of the national highway network. In fact, by 2003-04, infrastructure spending as a share of GDP dipped to its
previous post-Independence low of 3.3 per cent.
It is beyond the scope of this paper to undertake comprehensive empirical analysis of the links between infrastructure
spending and GDP growth. Indeed, much of the sophisticated research using cross section and time series data for
other countries has failed to establish the direction of casualty in the relationship between infrastructure spending
and growth. No such attempt, that we are aware of, has been made to analyze the Indian experience at a macro
level. While deferring a more rigorous analysis of this question, we can, based on the available data, make a few
observations and posit some plausible hypotheses about the Indian experience.
First, there is a broad positive correlation between GDP growth and infrastructure spending (as measured by the
annual share of infrastructure spending in GDP) in India in the post-independence period up to 1994. As to the
causality of this relationship, what is evident is that each time growth has faltered on account of drought, foreign
exchange crisis or political upheaval, infrastructure spending, as a share of GDP, has invariably suffered as a
consequence.
Second, the underpinnings of reverse causality are likely to be more complex. But prima facie it would appear that
growth in infrastructure spending does contribute to the GDP growth performance of the country at least up to the
decade of the 1990. Figure 2 plots the 10 year moving averages (in view of the long gestation and pay back periods
for infrastructure projects) of growth in real infrastructure spending versus the moving average of real GDP growth
(smoothened out to take account of distorting impact of crisis-driven outlier figures). What it suggests is that as
growth in infrastructure spending slowed down quite sharply over the decade of 1960 and early 1970s, the real
GDP growth rates showed a more modest albeit perceptible trend decline over the same period. Following the mid
1970s, as the annual growth rates in real infrastructure spending accelerated again right up to 1990/91, so was
there a less marked but steady rise in real GDP growth rates over the same period.

The Pol i t i ca l Economy of Infrastructure Development in Post - Independence India
3
M4 - D:\Booklet\IDFC-PEID-Report\IDFC-PEIDPII-Report.p65
Figure 2 – GDP growth and Growth in Infrastructure Spending 1951-2005 (Ten year Moving Average)
Source: IDFC Estimates
Third, the above relationship between infrastructure spending and GDP growth clearly breaks down post-1990. In
fact, what is remarkable about the past fifteen years is that even as growth rates in real infrastructure spending
have sharply declined, real GDP growth rates have tended to accelerate. There are two possible explanations to this
puzzle:
(a) That the build up in the infrastructure stock up to 1990-91 was sufficient to support the momentum of GDP
growth through the decade;
(b) That the last 15 years are fundamentally different from previous years in that the positive impact on GDP
growth of structural reforms pursued, starting in 1991, is much more significant than the presumably negative
impact from the sharp deceleration in real infrastructure spending.
We would hypothesize that the 1990s did see a fundamental shift in the drivers of growth in the Indian economy.
Until then, growth in the Indian economy (adjusted for terms of trade or weather related shocks) was led primarily
by public sector investment2 (albeit with declining efficiency as is well documented in the literature), the 1990s saw
an important shift to private consumption and private investment led growth. Table 1 calculates for each of the four
distinct phases of India’s post-Independence political economy (these are defined and explained in detail in the next
section): the average investment to GDP ratio, the average share of Gross Domestic Fixed Capital Formation in GDP,
the average share of the public sector in GDFCF, and the share of infrastructure spend in GDP. What the data
suggest is that: trend GDP growth rates rose over each successive period spanning 1951 to 2004; the rise in this
average growth rate over the period up to 1991 was indeed accompanied by (i) a rise in the overall investment to
GDP ratio; (ii) a rising share of the public sector in that ratio; and also (iii) a rising share of infrastructure spending in
GDP. In the period from 1991 to 2004, however, the rise in the average GDP growth rate is accompanied by (i) a rise
in the overall investment to GDP ratio, but (ii) a significant fall in the share of the public sector, as well as (iii) a fall
in the average infrastructure spending to GDP ratio. While this does seem to support our hypothesis on the changing
drivers of growth and the role of infrastructure spending, we cannot come to any definitive conclusion. Suffice to
say that the question merits further in-depth research.
2 Bagchi (1975) writing on industrial growth in India suggests that growth of capacities through public investments, especially in basic and intermediate goods
sectors, indeed spurred economic growth during what we call the Nehru era.

Lal l and Rastogi
4
M4 - D:\Booklet\IDFC-PEID-Report\IDFC-PEIDPII-Report.p65
Table 1 – Economic growth and infrastructure spending in post-Independent India 1951-2004
Period* Growth Average Spending GDFCF PSGFCF Pub. Sect. GDP
of GDP on infrastructure (per cent GDP) (per cent GDFCF) (per cent GDP)
(per cent GDP)
1950-67 3.6 4.4 17.4 na 10.6
1967-84 4.2 4.1 20.9 45.4 17.1
1984-91 5.9 5.2 22.6 43.5 23.0
Post 1991-2004 6.03 4.5 25.5 30.8 23.6
* See next section for logic of time span chosen for each period
Source : RBI Handbook on Indian Economy and Morgan & Stanley (2005).
Note : Series for spending on infrastructure, GDFCF and Public sector GDP are from 1961-2004, GDP is from 1950-2006 and PSGFCF isfrom 1970-2005.
II. Phases of Post-independence Political Economy in India
As outlined in the previous section, India has seen several cycles of infrastructure build-up, each interrupted by a
crisis. It is however, useful to step back and reflect on broader trends. Doing so suggests that the story of infrastructure
development in post-Independence India is essentially the story of economic planning4 under four distinct political
eras. We define these as the eras of Nehru (1950-67), Indira Gandhi (1967-84), Rajiv Gandhi (1984-91), and the era
of Decentralized Politics (1991-2004).
The time spans corresponding the first three eras, as we have defined them, overlap very largely with the periods
over which each of the three politicians was in power, but are not exactly co-terminus with their tenure. Each era
represents a distinct political tone, and hence, a different emphasis in the corresponding Five Year Plans and more
generally, a different approach to economic policy. Over the Nehru, Indira and Rajiv eras, the Congress Party was
the dominant force in the realm of national politics, even though its primacy at the state level was progressively
eroding. The post-1991 era is characterized by a marked increase in decentralization of political power at all levels
of government. Hence, it has been described as the era of Decentralized Politics.
Table 2 attempts to capture the essential differences in the political posture, policy focus and approach to
macroeconomic management over the four political economy eras post-independence.
Table 2 – Eras of political economy in post-Independent India 1951-2004
Era Political Orientation Policy Focus Macroeconomic
Management
Nehru Fabian Socialist Industrialization, pro-public sector Fiscal conservatism
(1950-67) and Central Government bias
Indira Gandhi Rhetorical Socialist with anti Food security, anti-private sector, Fiscal conservatism
(1967-84) -urban bias trending to populist import substitution
Rajiv Gandhi Populist Industrial de-licensing and Fiscal profligacy and
(1984-91) deregulation, technological debt monetization
modernization
Decentralized Neo-populist Structural economic reforms, Fiscal consolidation
Politics (Coalition based) globalization
(Post-1991)
3 This average would be 6.3 if 1991-92 GDP growth (0.9 per cent) is ignored.
4 Until the breakthrough participation of private players in the telecommunications space in the 1990s, the bulk of infrastructure spending in India came from
government, and that too primarily from Central Government

The Pol i t i ca l Economy of Infrastructure Development in Post - Independence India
5
M4 - D:\Booklet\IDFC-PEID-Report\IDFC-PEIDPII-Report.p65
We have effectively witnessed three successive waves of infrastructure build-out in the country since Independence,
each corresponding to the Nehru, Indira and Rajiv eras respectively. The growth in infrastructure spending in each
era was temporarily interrupted / partly reversed by exogenous events, but the infrastructure spending to GDP ratio
climbed successively higher peaks from one era to the next. The era of Decentralized Politics marks a significant
reversal of this pattern, for it is in this period that we have seen an almost secular decline in spending on infrastructure
relative to GDP.
The first wave of infrastructure build-out corresponding to the Nehru era covers the period of the first three five
year plans, the formulation of each of which was presided over by Nehru. The second wave corresponds to the
period of the next three plans, formulated under the leadership of Indira Gandhi. And the third wave of build-out
covers the period of the 7th Five Year Plan which was guided by Rajiv Gandhi. The 8th, 9th and 10th Plans were
formulated in the era of Decentralized Politics.
Nehru Era
As is well-established, the guiding political philosophy of Nehru was Fabian Socialism, which envisaged a very
significant role for the state in economic policy. While there was universal consensus that coalesced during the
Independence movement around the premise that “poverty and stagnation in India were the consequence of
colonial rule”, there were different views about how active the State ought to be in the process of economic
development (Marathe 1986). Most notably, Gandhi did not share Nehru’s vision for the role of the State, nor did
Sardar Patel and others such as Purushottam Das Tandon from within the Congress party itself (Wadia and Merchant
1952). There was healthy debate on these issues for many years even before independence but Nehru had been
working on forging consensus around the concept of centralized planning.5 It is interesting that even before Nehru
got the Planning Commission established in March 1950, the pre-Independence Industrial Policy Statement of
1945 had noted the objective of exercising Central Government control over certain industries, including key
infrastructure sectors such as power. The debate notwithstanding, the economic policy, articulated immediately
after Independence, (in the Industrial Policy Statement of 1948, for example) hardly represented a radically new
policy direction – it was more of an evolutionary step in a policy of Central Government participation in economic
activity.
It was in this context that the First Five Year Plan was formulated and implemented. It has been said that “there is
nothing in the Indian economy that does not find a reflection in the [First] Plan and there is nothing in the Plan that
is also not found in the Indian reality” (Patel 2002). The Plan was essentially a programme of public expenditures
that reflected the priorities of the time: (a) food production, a concern born from “the memory of the Bengal
Famine, the dislocation of the Punjab peasantry and the early shortages of food” in the immediate aftermath of the
Partition; and (b) rehabilitation of strategic assets such as railways and ports that also suffered on account of the
Partition.
By the time the Second Plan was being formulated in 1955-56, Nehru had cemented his position as the undisputed
head of the Congress Party.6 And his vision of planned economic development and Fabian Socialism7 had taken
concrete hold on the whole policy making apparatus through the acceptance by Parliament in 1954 of the “socialist
pattern of society” as the key objective of social and economic policy, and the passage also in Parliament of the
Industrial Policy Resolution and the Industries Act in 1956. By then the Planning Commission’s prestige was
considerably enhanced through the appointment of senior ministers as Members and elevation of the Deputy
Chairman’s position to the rank of Cabinet Minister (Frankel 1978) – in effect, the Commission had become an
extension of the prime minister’s authority in the area of economic policy.
The accent in the Second Plan was very much on industrial development on an ambitious scale, especially, basic and
heavy industries. As the private sector was not deemed to be in a position to cope with the envisioned scale of
infrastructural build-out, a strong pro-public sector policy bias emerged. Moreover, compared to previous years,
there was a definite shift in favour of Central (as distinct from state or local) Government control and regulation
over industry. The notion of reserving the so called “commanding heights” of the economy for the Central
Government thus took hold and so did the regime of industrial licensing begin to take shape (Kochaneck 1985).
5 The need for national planning was acknowledged for example, by National Planning Committee, comprising leaders of all political hues but also representatives
of business and chaired by Nehru in as early as 1938-9.
6 Having expended, it seems, some political capital in getting to that point (Breacher,1959)
7 Fabian Society is a British Socialist movement best known for its initial ground breaking work beginning in the late 19th century and upto the World War I
leading to formation of the Labour Party in England. Nehru had a long association with the Labour party MPs. He even stayed with Stafford Cripps when he
visited England in 1937 (Frank 2001).

Lal l and Rastogi
6
M4 - D:\Booklet\IDFC-PEID-Report\IDFC-PEIDPII-Report.p65
In any event, the Second Plan was nearly aborted when the foreign exchange crisis engulfed the country in 1957
and forced a severe cut back in the public expenditure programme envisioned under the Plan. This ushered in the
cumbersome machinery of foreign exchange controls that survived for several decades after. It should be noted
that foreign exchange controls were not the result of ideology - they were born out of necessity as a pragmatic
response of the bureaucracy to a crisis, which itself was induced in part by a liberal import regime intended to spur
the domestic economy.8
By the Third Plan (1961–6) there was a growing realization that though the goals of planning were laudable, there
was disconnect between “targets and performance, requirements and resources” and between the goal of rapid
industrialization on the one hand and the gradual pace of agrarian reforms (especially land reforms) on the other.
Although there was an awareness of the need to speed up implementation in general and focus especially on the
development of ancillary infrastructure in power and transport during this period, the Indo-China war and other
adverse developments came in the way of the successful pursuit of these objectives.
As to macro-economic management through the Nehru era, the Ministry of Finance was dominated by formidable
figures. Deshmukh gave priority to economists and economic advice. He believed that dominance of economists in
the Finance Ministry led to better coordination of economic policy. He nurtured experts and established a powerful
economic analysis division within the Ministry of Finance and an economic research wing at the RBI. A dedicated
team, which built up this division, led to the annual publication of the Economic Survey a few days before the
Budget (Patel 2002). T. T. Krishnamachari, who took over the MoF just around the first foreign exchange crisis, built
the economic analysis capabilities of the Ministry further. Despite his mercurial temper he was open to advice and
brought vigour, debate and discussion into the working of the Ministry (Patel 2002). Under both Deshmukh as well
as TTK, the MoF developed as a powerful and independent custodian of macroeconomic policy whose tone was
anything but profligate.9
Indira Gandhi Era
After Nehru’s demise in 1964, (and Shastri’s untimely death), a power struggle within the Congress party ensued
(Brecher 1969). The business community tried to take advantage of this to re-assert its influence through the old
guard of the Party that had aligned itself against an embattled Indira Gandhi. Although the business community did
continue to support the Congress party during the 1967 election, leanings towards certain opposition parties were
apparent. These parties were more sympathetic to their agenda and included the Swatantra Party and the Jan
Sangh, the latter representing the urban middle class and the trading community (Kochanek 1970).
The precarious economic situation did nothing to help. During the Third Plan (1961–6), per capita income did not
increase at all while signs of stagnation multiplied prominently. The food crisis continued to worsen in 1965–6 and
the specter of food security loomed large once again in the wake of the refusal of the US Congress to renew Public
Law 480, a vital scheme that allowed India to import surplus wheat from the U.S. against payment in rupees.10 No
progress was made in solving the problem of unemployment (Minhas 1971, Raj 1976). On the contrary, the backlog
of unemployment was estimated at 12 million at the end of the Third Plan and was then projected to increase to 15
million persons by 1971. Accumulating problems culminated in a drastic devaluation of the rupee under an IMF
rescue plan in June 1966.11
Indira Gandhi’s response to these economic challenges and the growing opposition to her leadership both from
within the Congress Party as well as from other parties, largely supported by big businesses, was to appeal directly
to the voting public. She did this by wrapping herself in the ideological cocoon of socialist rhetoric and adopting a
harshly anti-big business and anti-urban stance. This populist cocktail ultimately underpinned her triumphant “Garibi
Hatao” campaign immediately after the 1971 Bangladesh War and set the political tone for the rest of her tenure.
The direction of economic policy initiatives in the early years of the Indira era is easily explained against this political
backdrop. The Monopolies and Restrictive Trade Practices Act (MRTP) was passed in 1969 ostensibly to safeguard
8 I.G. Patel argues in his memoirs that the crisis of 1956-57 was caused by import liberalization that preceded the industrialization push of the Second Plan. The
point being that despite being committed to development of domestic industry, the Nehru era policy makers were not, at least in the early years, committed
to import substitution.
9 The MoF acquired a reputation for being wary of the private sector and was criticized for high tax regimes and for squeezing the corporate sector (Frankel 1978).
10 The law expired on June 30, 1966. Instead, the Johnson administration proposed a Food for Peace programme, which over five years envisaged that all U.S.
shipments of food would be financed by long-term credits, repayable only in dollars (Frankel 1978).
11 “…A combination of circumstances, aggravated by war and drought, has temporarily slowed down, and almost halted economic growth.”…(Indira Gandhi’s
broadcast to the nation on All India Radio, 12th June, 1966, after receiving IMF approval for devaluing the rupee by 57.5 per cent on 6th June)

The Pol i t i ca l Economy of Infrastructure Development in Post - Independence India
7
M4 - D:\Booklet\IDFC-PEID-Report\IDFC-PEIDPII-Report.p65
the interests of consumers from potential abuse of monopoly power in the industrial sector. But, in practice, it was
used to curb the growth of certain big-business interests or more cynically, as Marathe (1986) argues, it was used
as a device by which “the money power of the large business houses could be kept on a short leash so that it could
be utilized to the benefit of the ruling party”. Similarly, all banks were nationalized in the same year with the
advertised intention of taking banking to the poor, but with the immediate objective of curtailing the power of
private banks.
What is interesting about the Indira era is the emergence of a growing contradiction between imperatives of
industrial growth on the one hand and the “environment of socialist postures” on the other. Even though the
Fourth Plan document acknowledges the need for reviewing and “improving the administrative machinery of
existing systems and controls” in industrial policy, no such review actually took place. This was despite the growing
empirical evidence on the distortions caused by the increasingly cumbersome machinery of regulatory control such
as those provided by Bhagwati and Desai (1970) and Bhagwati and Srinivasan (1974). In practice, it suited the
government to continue with the centralized regulatory and licensing machinery, for this system led to a considerable
accretion of its discretionary power and hence, of its ability to confer or deny favours. The political system, over
time, became more adept at using these levers of power to further its own objectives and the business community,
in fact, adjusted itself to this reality and evolved its own ways of dealing with the system. Thus the “license Raj”, the
apparatus of which had been created under Nehru, took on a life of its own.
Meanwhile, the health of the economy, through the first half of the 1970s remaining fragile, became all the more
vulnerable with the oil shock of 1973. As a result the political tone set in the early years of this era persisted through
the formulation of the Fifth Plan. Therefore, not only was the framework of the Industries Act of 1956 preserved,
but in response to continuing pressures to embrace a populist agenda, it was, in fact, considerably extended
beyond its original scope to add a vast list of sectors reserved as the exclusive domain of small scale industries in the
mid-1970s and an array of protectionist tariff and non-tariff barriers.
The Sixth Five Year Plan (1978–83) was launched under conditions that remained difficult, thanks to the second oil
shock of 1979 and the ensuing domestic inflationary pressures. Although politically the position of the Indira
Gandhi government at the time of the Sixth Plan was more secure on account of a convincing victory over the
Janata Party, there was no compelling change in the direction of economic policy.
Despite difficult economic circumstances the Indira era did deliver successful policy initiatives for rural India. On the
one hand, the food crisis she inherited forced Indira Gandhi to make food security an overwhelming priority; on the
other hand, her political survival hinged on her appealing directly to the rural vote bank. A lot of resources were
thus poured into rural India over the decade of 1970 and early 1980s. Kotwal and Ramaswami (1999) have argued
that what made the Green Revolution a big success in the 1970s was that the introduction of the new technology
package (seeds and fertilizers), was supplemented very effectively by massive public investment in rural roads,
ground water irrigation, and a system of procurement prices that greatly reduced uncertainty for farmers, motivating
them to grow more food.12 The Indira era marked a major and most successful change from the Nehru era in the
area of irrigation. Whereas the focus in earlier years was on massive and multi-purpose irrigation projects having
very long gestation, the focus during Indira Gandhi years shifted to ground water irrigation through pumps powered
by massive rural electrification schemes.
While this strategy was clearly successful in helping India attain self sufficiency in food, from a macro-management
point of view it set the tone for much greater politicization of fiscal policy. This was the era of much bigger
government and public (including defence) spending and “loan melas”.13 The quality of public spending also began
to deteriorate. The massive programme of rural support created the now ubiquitous and fiscally expensive practice
of delivering free power and subsidized fertilizer to farmers and food subsidies to consumers. These are today the
three largest components of the government’s very substantial subsidies bill.
Notwithstanding the tendency towards big (politically induced) spending, the government remained resolutely
hawkish on inflation, not only because of the discipline of senior officials such as L. K. Jha and I. G. Patel,14 but
because it made equally good political sense to keep inflation under control - price increases was one thing that the
rural poor, Mrs. Gandhi’s main political constituency, were very sensitive to.
12 Deshmukh (2004) records that the bitter memories of how grain-surplus countries had treated India when it urgently needed food supplies propelled Indira
Gandhi to take imaginative and bold steps in the area of food security.
13 The practice of periodically writing off debts of farmers.
14 I. G. Patel was appointed Governor of the Reserve Bank by Morarji Desai’s short-lived Janata Government.

Lal l and Rastogi
8
M4 - D:\Booklet\IDFC-PEID-Report\IDFC-PEIDPII-Report.p65
Rajiv Gandhi Era
The Rajiv Gandhi era (1984-91), the third distinct political-economy phase of post-Independence India, marked a
decisive change in the direction from the previous seventeen odd years, despite being the most short-lived of the
four eras we discuss in this paper. Buoyed by a landslide victory in December 1984 following his mother’s assassination,
Rajiv Gandhi was finally able to ease some of the stifling regulatory controls that had become entrenched.
Rajiv Gandhi emphasized industrial de-licensing and deregulation. Deshmukh (2004) recalled in his memoir that the
functioning and performance of the PSUs was causing acute anxiety and the Prime Minister was not at all happy.
The first wave of dismantling of the “license Raj” came within the 12–18 months of his taking office through the
announcement of the new Industrial Policy. The GOI also constituted many government committees during this era
to conduct a long overdue review of the system of price controls and of the licensing regime. These committees
recommended a “shift from physical to financial-levers’ controls” — in effect, deregulation of the industrial sector.
The government implemented many of these recommendations resulting in industrial growth of more than 8 per
cent on average for the period 1985–90. The capital market was also buoyant in this period as loosening of direct
controls, particularly in the field of industrial licensing, signalled higher profitability.
Second, Rajiv Gandhi was keen that India catch up technologically with the rest of the world. His political orientation
was pro-modernization and he left a very clear imprint on the 7th Five Year Plan, the only one whose formulation
he chaired, by committing serious resources to the development of the telecommunications sector.
However, Rajiv Gandhi did not have the political muscle to tackle the legacy of direct and indirect subsidies he
inherited from his mother’s regime, nor the fortitude to make the necessarily difficult decisions. To be fair, the scale
of the underlying fiscal problems he had inherited from his mother (thanks in part to the power of compounding
and its impact on the government’s debt servicing obligations) was such that he could not have reasonably addressed
the issues in the short time that he was at the helm (Figure 3). The political posture of this era thus remained
populist, with a pro-modernization bias.
Figure 3 – Expenditure on Subsidies, Debt Servicing and Administrative Services (1970-2004)
Source – RBI Handbook on Indian Economy and Economic Surveys (Various Issues)
The casualty in this process was macroeconomic management and fiscal discipline - the era of big spending gave
way to a period of even bigger (and less productive) spending. Though GDP growth rate trended upward during his
tenure and spending on infrastructure increased on account of his commitment to the telecommunications sector,
government final consumption also rose sharply during this period contributing to a ballooning fiscal deficit that
was eventually financed through money creation, fanning domestic inflation, widening the current account deficit,
and sowing the seeds of the 1991 economic crisis (Jalan 1991, World Bank 1991).

The Pol i t i ca l Economy of Infrastructure Development in Post - Independence India
9
M4 - D:\Booklet\IDFC-PEID-Report\IDFC-PEIDPII-Report.p65
The Era of Decentralized Politics
The crisis of 1991 is recorded as a watershed in the evolution of the Indian political economy. The ensuing decade
and a half spanning the Eighth, Ninth and Tenth Plans, has seen meaningful progress on structural economic
reforms, despite several changes of government and the demise of single party domination of national politics.
Several explanations for this evolution have been offered. Analysing the types of reforms that have been pursued as
opposed to those that have not been attempted, Varshney (1999) for one argues that elite politics is what is at
work. It is politically easier to liberalize the trade regime, simplify investment rules, devalue the currency and lift
restrictions on capital markets. These are all decisions made by the Central Government that affect elite politics
(that is, politics discussed in the English press). It is a political challenge to revise labour laws, reduce subsidies and
privatize state-run enterprises as these reflect concerns of mass politics and generally require action at the state
level. Gurucharan Das (2000), however, suggests that the information technology revolution and the deep penetration
of electronic media has connected a much wider swathe of the electorate to the rest of the world raising their
expectations and aspirations, thereby creating space for the pursuit of structural reforms.
Figure 4 – Electoral Position of Indian National Congress in Lok Sabha (1951-2004)
Source – Table A2
Whatever the underlying explanation for the broader trends post-1991 (and we return to this question in Section
IV), the reality is that the crisis forced some basic structural reforms upon decision makers. Trade liberalization and
deregulation (the latter having already been initiated during the time of Rajiv Gandhi) helped create the conditions
for the IT boom, and allowed India to take unprecedented advantage of the process of globalization. This contributed
to significant productivity gains and facilitated a substantial reduction in real interest rates.
Lal l and Rastogi
10
M4 - D:\Booklet\IDFC-PEID-Report\IDFC-PEIDPII-Report.p65
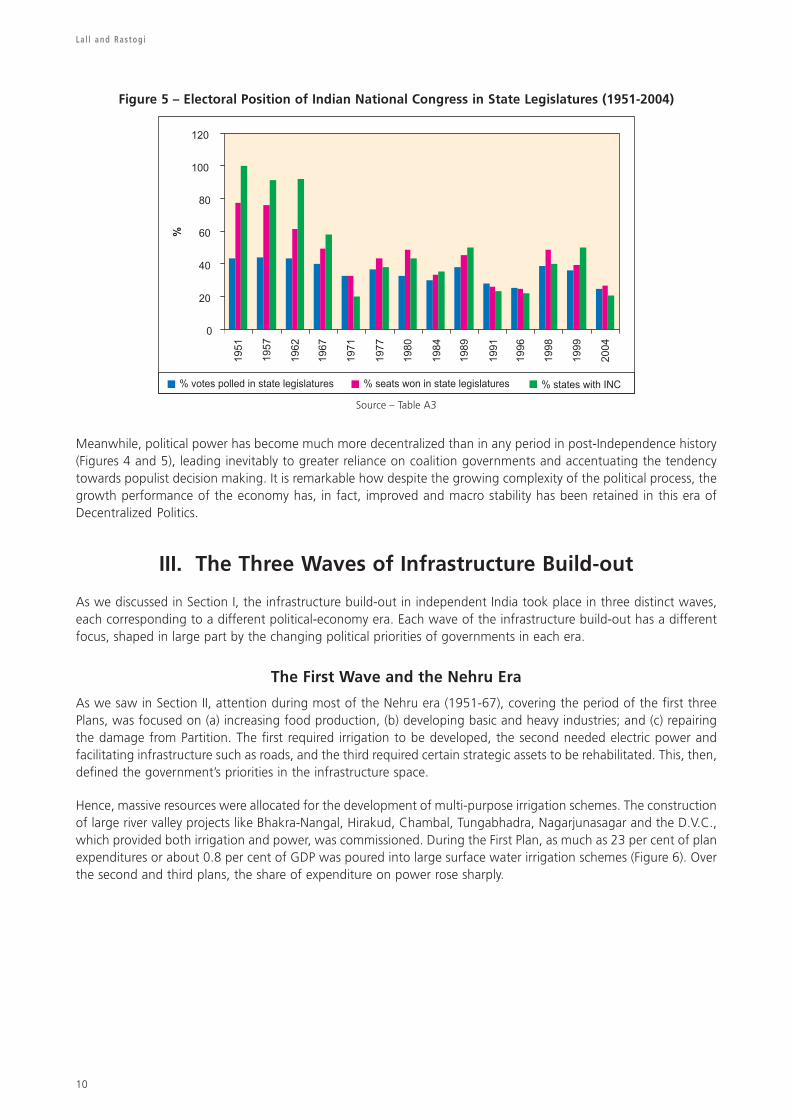
Figure 5 – Electoral Position of Indian National Congress in State Legislatures (1951-2004)
Source – Table A3
Meanwhile, political power has become much more decentralized than in any period in post-Independence history
(Figures 4 and 5), leading inevitably to greater reliance on coalition governments and accentuating the tendency
towards populist decision making. It is remarkable how despite the growing complexity of the political process, the
growth performance of the economy has, in fact, improved and macro stability has been retained in this era of
Decentralized Politics.
III. The Three Waves of Infrastructure Build-out
As we discussed in Section I, the infrastructure build-out in independent India took place in three distinct waves,
each corresponding to a different political-economy era. Each wave of the infrastructure build-out has a different
focus, shaped in large part by the changing political priorities of governments in each era.
The First Wave and the Nehru Era
As we saw in Section II, attention during most of the Nehru era (1951-67), covering the period of the first three
Plans, was focused on (a) increasing food production, (b) developing basic and heavy industries; and (c) repairing
the damage from Partition. The first required irrigation to be developed, the second needed electric power and
facilitating infrastructure such as roads, and the third required certain strategic assets to be rehabilitated. This, then,
defined the government’s priorities in the infrastructure space.
Hence, massive resources were allocated for the development of multi-purpose irrigation schemes. The construction
of large river valley projects like Bhakra-Nangal, Hirakud, Chambal, Tungabhadra, Nagarjunasagar and the D.V.C.,
which provided both irrigation and power, was commissioned. During the First Plan, as much as 23 per cent of plan
expenditures or about 0.8 per cent of GDP was poured into large surface water irrigation schemes (Figure 6). Over
the second and third plans, the share of expenditure on power rose sharply.

The Pol i t i ca l Economy of Infrastructure Development in Post - Independence India
11
M4 - D:\Booklet\IDFC-PEID-Report\IDFC-PEIDPII-Report.p65
Figure 6 – Plan-wise sector-wise Expenditure (Rs. ‘000 crore)
Source : Planning Commission (2001) and Economic Survey 2006
There was also some investment into railways and maritime transport, the primary objective being to rehabilitate
assets which had been ignored for a long time due to the Second World War and separation of Pakistan from India.
Thus Kandla port was developed to compensate for the loss of Karachi port. A 20 year plan was drawn up by the
Chief Engineers of the State and the Central Governments to develop the road network. Capacity enhancement
outlined in the Nagpur Plan (1943–61) could not be carried out due to shortage of materials, scarcity of trained
men and above all, financial stringency (see Annex. 1 – Development of Indian Road Network). However, roads
which provided vital links to agricultural centres were given priority. New bridges and missing links on national
highways were slated to be built during this era. In the Nehru era an average of 0.3 per cent of GDP per annum was
spent on road development.
Despite the elaborate machinery of state planning, a strategic approach to building national infrastructure was
missing at the time of the Second Plan. In fact, Mahalanobis’ involvement notwithstanding, and despite the work
done at the Indian Statistical Institute (ISI), the analytical foundations of the Second Plan were weak. There was, it
seems, more consensus than dissent over the objectives and general orientation of the Plan, which devoted central
attention to developing heavy and basic industries. Such differences of opinion did exist in the community of
eminent economists comprising the likes of Gadgil, Vakil, Brahmananda and Sen, but were not fully discussed, not
because of any ideological zeal on the part of the Planning Commission, but merely because of Nehru’s overwhelming
stature (Patel 2002). In this context, infrastructure was developed almost on a piecemeal basis as an activity ancillary
to the development of large industrial projects, many of which were constructed in remote green field sites.
On the whole then, the first wave of infrastructure development in the country is essentially about the build-out of
large multi-purpose and irrigation schemes. For the rest, the attention to general infrastructure development during
the Nehru era was surprisingly modest given the machinery of state planning that had been put into place.
The Second Wave and the Indira Gandhi Era
As our previous analysis suggests, this era saw the intense politicization of all economic policy decisions. Since it
was critically important for Mrs. Gandhi to win the rural vote, infrastructure during this era was village-oriented and
projects with long gestation were substituted with shorter gestation initiatives.
The droughts of 1965–6 and 1966–7 highlighted the need for adequate irrigation facilities to ensure food security,
an urgent concern in the early years of Mrs. Gandhi’s tenure. The possibilities offered by the new seed varieties,
both, for increasing yields of cereal crops and for intensifying cultivation, were contingent on availability of water at
the right time. The large multi-purpose irrigation schemes launched during Nehru’s time were complex, long-gestation

Lal l and Rastogi
12
M4 - D:\Booklet\IDFC-PEID-Report\IDFC-PEIDPII-Report.p65
projects. Some of them took 20–25 years to be built with numerous time over-runs exacerbated by poor
implementation capacity. Neither the economy, nor Mrs. Gandhi could afford the time commitment this canal-
based approach to irrigation infrastructure entailed. The only immediate solution was to have ground water based
irrigation using tube wells.15 Thus, the emphasis in irrigation sector shifted to minor irrigation on a massive scale
when Mrs. Gandhi took over (Figure 7).
Figure 7 – Built up of Minor Irrigation in the Indira Gandhi Era
Source : Planning Commission (2001)
Tube well based irrigation required pump sets to be powered and hence, the delivery of electric power to the
farming sector was critical to this strategy. The origins of rural electrification and the associated power sector
infrastructure therefore, lie in the political and perceived economic importance of food security in the early years of
the Indira Gandhi era.
To provide financial support to this effort, the Rural Electrification Corporation (REC), with a plan outlay of Rs. 150
crores, was established in the public sector. REC provided loans to the State Electricity Boards for rural electrification.
Additional funds for rural electrification came from other financing institutions, such as the Agricultural Refinance
Corporation, Land Development Banks and commercial banks. It was estimated that 1.25 million pump sets and
tube wells were required to be energized between 1966–9. Similarly, the setting up of the National Thermal Power
Corporation (NTPC) in 1975 can also be understood in this context-its initial mandate was to accelerate power
generation by mobilizing the vast coal reserves available in the country to meet the electricity demand for irrigation.
Village electrification, in this context, did not mean electrification of rural households—grid extensions were provided
to farms, not to village habitations.16 The genesis of the financial problems that plague the power sector to this day
are to be found in the political compulsions of this era. Electricity to the agriculture sector was not metered in the
1970s and not surprisingly, therefore, the financial burden on states started creeping up.17 The poor governance of
State Electricity Boards in general and the highly distortionary tariff structures, intended to provide cross-subsidies
15 Minor irrigation schemes include all ground water development projects as well as surface water projects. Most deep tube well schemes are community-based
and tube-wells are usually constructed and owned by individuals. In either case, ground water provides the farmer with just the type of ‘instant’ and controlled
irrigation which the new high-yielding varieties of seed demand. Minor irrigation schemes further enable farmers to grow more than one crop on an assured
basis.
16 Interestingly, the definition of village electrification was changed in 2005 (MOP 2005). Now at least 10 per cent households in an un-electrified village have to
be electrified for a village to be declared electrified and any public place or institution like schools, panchayat offices, health centres, dispensaries, community
centres etc. should be able to avail power supply on demand. Apart from this, a distribution transformer should be made available in the inhabited locality
within the revenue boundary of the village including at least one hamlet/Dalit Basti as applicable. Quite clearly, central to village electrification now is the
availability of power to villagers. The earlier definition of village electrification has been criticized by many. But then, circumstances have changed drastically in
the last forty years.
17 The losses in transmission and distribution were estimated to be 12-26 per cent, plants used to operate at an average of less than 50 per cent load factor with
and 40-60 per cent of the energy produced going to drive irrigation pumps (Financial Times Survey : India, May 24, 1982)
The Pol i t i ca l Economy of Infrastructure Development in Post - Independence India
13
M4 - D:\Booklet\IDFC-PEID-Report\IDFC-PEIDPII-Report.p65
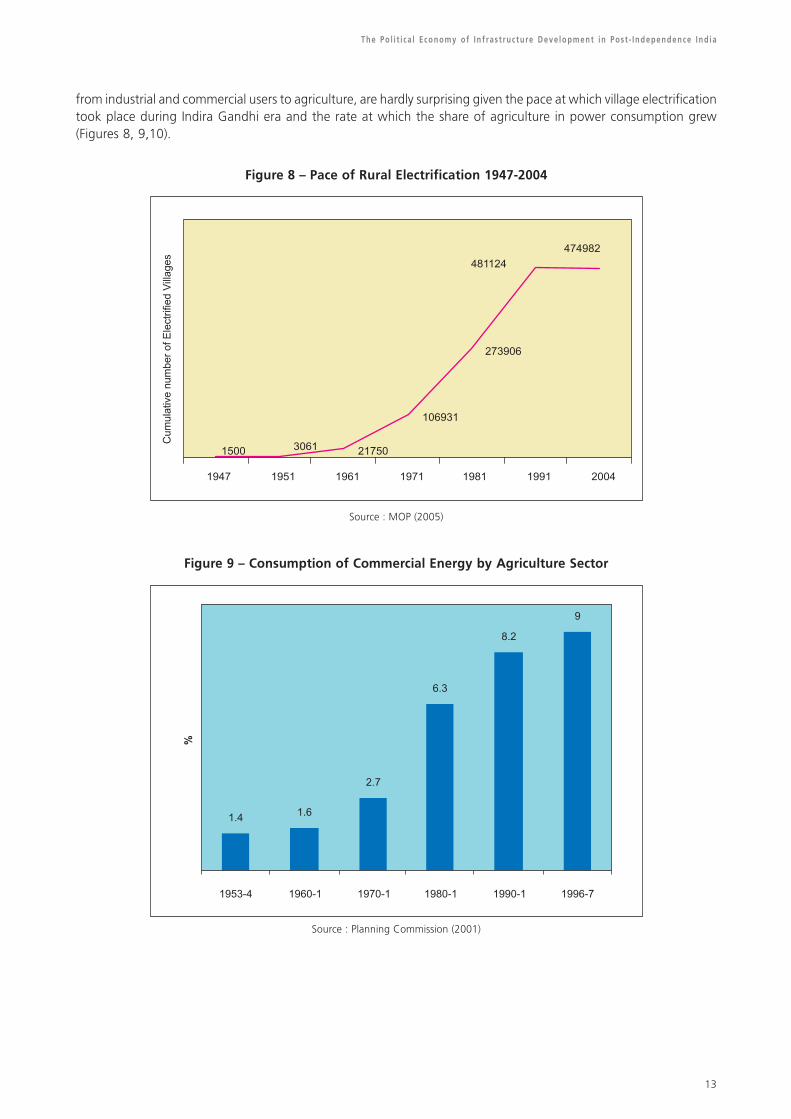
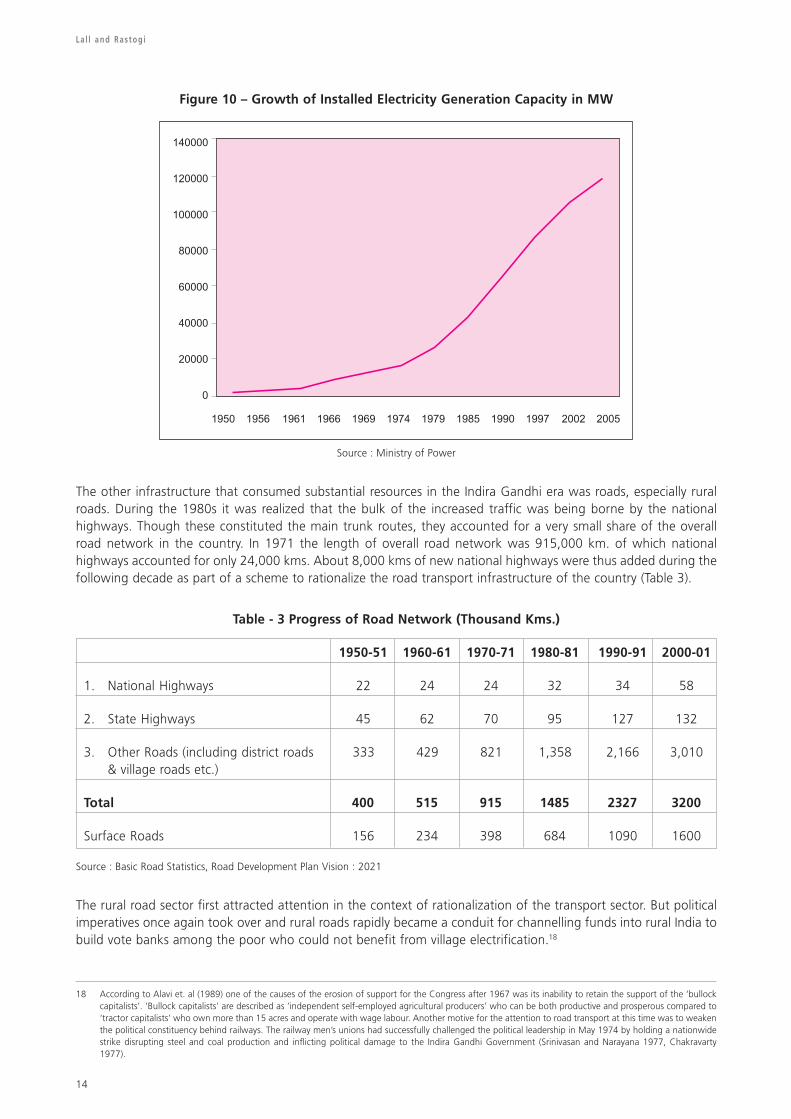
from industrial and commercial users to agriculture, are hardly surprising given the pace at which village electrification
took place during Indira Gandhi era and the rate at which the share of agriculture in power consumption grew
(Figures 8, 9,10).
Figure 8 – Pace of Rural Electrification 1947-2004
Source : MOP (2005)
Figure 9 – Consumption of Commercial Energy by Agriculture Sector
Source : Planning Commission (2001)
Lal l and Rastogi
14
M4 - D:\Booklet\IDFC-PEID-Report\IDFC-PEIDPII-Report.p65
Figure 10 – Growth of Installed Electricity Generation Capacity in MW
Source : Ministry of Power
The other infrastructure that consumed substantial resources in the Indira Gandhi era was roads, especially rural
roads. During the 1980s it was realized that the bulk of the increased traffic was being borne by the national
highways. Though these constituted the main trunk routes, they accounted for a very small share of the overall
road network in the country. In 1971 the length of overall road network was 915,000 km. of which national
highways accounted for only 24,000 kms. About 8,000 kms of new national highways were thus added during the
following decade as part of a scheme to rationalize the road transport infrastructure of the country (Table 3).
Table - 3 Progress of Road Network (Thousand Kms.)
1950-51 1960-61 1970-71 1980-81 1990-91 2000-01
1. National Highways 22 24 24 32 34 58
2. State Highways 45 62 70 95 127 132
3. Other Roads (including district roads 333 429 821 1,358 2,166 3,010
& village roads etc.)
Total 400 515 915 1485 2327 3200
Surface Roads 156 234 398 684 1090 1600
Source : Basic Road Statistics, Road Development Plan Vision : 2021
The rural road sector first attracted attention in the context of rationalization of the transport sector. But political
imperatives once again took over and rural roads rapidly became a conduit for channelling funds into rural India to
build vote banks among the poor who could not benefit from village electrification.18
18 According to Alavi et. al (1989) one of the causes of the erosion of support for the Congress after 1967 was its inability to retain the support of the ‘bullock
capitalists’. ‘Bullock capitalists’ are described as ‘independent self-employed agricultural producers’ who can be both productive and prosperous compared to
‘tractor capitalists’ who own more than 15 acres and operate with wage labour. Another motive for the attention to road transport at this time was to weaken
the political constituency behind railways. The railway men’s unions had successfully challenged the political leadership in May 1974 by holding a nationwide
strike disrupting steel and coal production and inflicting political damage to the Indira Gandhi Government (Srinivasan and Narayana 1977, Chakravarty
1977).

The Pol i t i ca l Economy of Infrastructure Development in Post - Independence India
15
M4 - D:\Booklet\IDFC-PEID-Report\IDFC-PEIDPII-Report.p65
The bulk of funds to rural roads were allocated through special poverty alleviation schemes of successive budgets.
The Minimum Needs Programme at the beginning of the 5th Five Year Plan in 1974 proposed to link all villages with
a population of 1500 and 50 per cent of villages with a population of between 1000 and 1500 by all-weather
roads. As acknowledged in the Ninth Five Year Plan, implementation of these schemes was poor and wasteful.
Often earthen tracks and gravel roads did not conform to technical norms of compaction, drainage and geometrics,
so the roads that were built were hardly all-weather roads. In reality, the quality of the physical network of rural
roads that was built (Figure 11), was hardly commensurate with the resources that were allocated to the effort
during the 1970s and 1980s.
Figure 11 – Construction of Rural roads 1951–2001
Source: Basic Road Statistics, Road Development Plan Vision : 2021
Other sectors of infrastructure remained largely stagnant in the Indira Gandhi era with a bare minimum effort
devoted to enhancing port capacity in the 1970s for handling bulk cargo, including iron ore and petroleum, oil and
lubricants. In fact, shortages of capacity were experienced in handling fertilizer and general cargo from time to time
at most of the major ports and there was hardly any head-room in port capacity. No addition was made to the fixed
infrastructure of the railways. Some improvements to runway, terminal and communications facilities were carried
out at the four international airports of Bombay, Calcutta, Delhi and Madras essentially to make them suitable for
operation of heavier and larger capacity aircraft like Boeing 747 jets. After that, only in the 1980s were investments
made (a) to provide additional capacity at the international airports to relieve the heavy congestion at peak hours,
(b) to provide additional workshop and maintenance facilities, and (c) to provide additional safety-oriented equipment.
The telecommunications sector was ignored on the grounds that telephones were a luxury good. Little attention
was paid to the development of our cities during this period, and in fact some of the seeds of their degradation
were sown in the Indira Gandhi era with the introduction of the Urban Land Ceiling and Rent Control Acts.19
Unlike in the Nehru era, infrastructure development per se did not form part of the strategic thinking on economic
policy during the Indira Gandhi era, which as we have argued, was in any case very heavily politicized. There is no
empirical research of note that focuses generally on infrastructure development during this period, although there
was a lot of preparatory work that was done to pave the way for the shift from canal based irrigation to tube well
based irrigation (NCAER 1973). Research on infrastructure-related issues appears to have been limited to concerns
about managing the country’s energy requirements and reducing dependence on imported energy (not surprising,
given the impact of the oil shocks). A lot of critical research was devoted to agriculture related issues during this
time – research on the Green Revolution, for example, was helpful in understanding the distributional consequences
19 Arguably measures calculated to contain Mrs. Gandhi’s political opposition, such as the Jan Sangh, for example.

Lal l and Rastogi
16
M4 - D:\Booklet\IDFC-PEID-Report\IDFC-PEIDPII-Report.p65
of the same (Griffin 1974). Similarly, a lot of attention was devoted to the design of subsidies to agriculture.
Otherwise, the pre-occupation of the academic and intellectual community was more with the increasingly
dysfunctional and all pervasive regulatory apparatus.
The Third Wave and the Rajiv Gandhi Era
There are two noteworthy features with respect to the third wave of infrastructure build-out. First, given Rajiv
Gandhi’s pre-occupation with modernization and technology, significant investment was made in the country’s
telecommunications infrastructure. Telecommunications technology and services assumed high national priority in
the Seventh Economic Development Plan (1985-90) during which expenditure on this sector grew very substantially
(Figure 12). A key initiative of this period, and in hind sight a most prescient one, was Rajiv Gandhi’s drive for
“technology missions” intended to help India catch up with the rest of the world.20 The Centre for Development of
Telematics was established in 1987 by Sam Pitroda to revolutionize the telecommunications sector in India. Under
his leadership, significant initiative was taken to improve the efficiency of the telecommunications sector. Although
all investments in this era remained in the public sector, the growing use of digital technology in telecommunications
facilities, its interface with computers and the advent of satellites reduced the costs of long haul telecommunication.
These developments enabled the country to move into a new era of communications and set the stage for substantial
improvements in productivity as well as the take-off of the Indian IT industry during the 1990s. Moreover, the
debate on the restructuring of the telecommunications sector was seeded at this critical time and paved the way for
radical reforms of the sector a few years later (Box 1).
Figure 12 – Planned Expenditure on Telecommunication 1951-2002 (Rs. Crore)
Source: Planning Commission (2001)
20 Financial Times Survey : India (November 25, 1987)

The Pol i t i ca l Economy of Infrastructure Development in Post - Independence India
17
M4 - D:\Booklet\IDFC-PEID-Report\IDFC-PEIDPII-Report.p65
Box 1 – Development of Telecom Sector in India
National investment in the telecom sector in the first six five-year Plans since 1950 hovered between 1.4 and 2.7
per cent of the planned expenditure. Only after 1985 did investment in this sector jump to 3.6 per cent of
planned expenditure in the Seventh Plan (1985-90) and 5.8 per cent in the Eighth Plan (1992-97). The telecom
services were seen by policy makers up until the early 1980s as luxury services not essential to economic growth
(McDowell 1997).
Though reforms had been underway for five years by 1990, and terms like privatization and liberalization were
used in public debates during the 1980s, the meaning of those terms was different than those used by telecom
sector analysts in the west. In India, “privatization” did not refer to selling government enterprises then, but
rather meant the licensing of private manufacturers to produce telecommunications equipment. “Liberalization”,
similarly, a term used to describe telecom policies of the mid-1980s, involved merely expanding the number of
manufacturing licenses available and easing the rules for importing electronic equipment. Neither term was used
with reference to telecom service provision in the 1980s.
With the opening up of the economy in 1991 requirements for telecommunications services changed suddenly
and plans were redrafted accordingly in 1994 through the National Telecommunications Policy (NTP). The aim of
the new NTP announced was to achieve an average density of at least 2.5 lines per 100 people by the year 2000.
The telecom sector was recognized as a crucial component of infrastructure in the mid-1990s reflecting the
needs of a rapidly globalizing economy. Until 1994, telecommunication services were a government monopoly.
NTP 1994, followed by liberalization in NTP 1999, has provided the Indian IT and related sectors a world class
facility at reasonable rates and telephone on demand anywhere in the country. Among developing nations, India
has faired well in attracting FDI to this sector. The spike in infrastructure spending in 2000-01 is due to FDI of
Rs. 15,498 crores (0.82 per cent of GDP) in the telecom sector (Figure 1).
Second, the build-out of physical infrastructure for ground water irrigation and electricity supply that was needed
to power the irrigation pumps continued during this wave, even as the financial situation of SEBs continued to
deteriorate and chronic shortages of power appeared for commercial and urban use. The political imperative that
underpinned the momentum of (mostly inefficient and distortionary) initiatives in these sectors during his mother’s
time was still very much intact during Rajiv’s tenure as well. As a result (for fiscal constraints were more severe), the
development of critical transportation and urban infrastructure continued to be neglected.
As far as the role of the research community is concerned, it began to turn its attention to shortages in infrastructure
capacity. Until then, the widely held view was that the country’s physical infrastructure capacity was enough to
cope with a sustained GDP growth rate of 5 per cent. The shortage of infrastructure services did not begin to be
understood until the 1980s (Mody, Ahluwalia 1983). It was also during this time that research attention was
devoted to the growing problems of urban India (Mohan 1985).
The Rajiv Gandhi era also ushered in intellectual debate about the direction administrative and organizational
reforms needed to take in order to improve the efficiency of infrastructure service delivery in the country. Some of
this work was led by multi-lateral and lending agencies (S&P 2005, Rudolph 1987), but some was conducted by
government bodies such as the Railway Reforms Committee (1984). Unfortunately, these issues remained in the
realm of debate, but the research work done during this time eventually speeded up the reform initiatives of the
post-1991 crisis era.
IV. Infrastructure in the Era of Decentralized Politics
The post-1991 period has witnessed fiscal consolidation in an increasingly complex decision making environment
caused by the atomization of political power. Investment in infrastructure has been a major casualty in this political
economy dynamic (Figures 13 and 14).

Lal l and Rastogi
18
M4 - D:\Booklet\IDFC-PEID-Report\IDFC-PEIDPII-Report.p65
Figure 13 – Infrastructure spending and votes to INC
Source: Table A2 and Morgan Stanley (2005)
The key objective of economic policy in the wake of the crisis and negotiations with the IMF was to reduce the
Central Government fiscal deficit from 8.4 per cent of GDP in 1990-1 to 6.5 per cent in 1991-2, and further to 5
per cent in 1992-3. The process of fiscal consolidation continued in 1993-4 with the fiscal deficit targeted at 4.7 per
cent of GDP (GOI, 1993). The only way such reductions could be achieved was by putting on hold almost all
spending on infrastructure projects even though shortages in infrastructure sector were acute.
On the face of it, the sharp decline in infrastructure spend witnessed since 1991 should have spelled disaster for
economic growth. However, telecom-related reforms in particular, and reform initiatives in general, had a deep
impact on productivity across the board. Further, the impact of a general decline in overall spending on infrastructure,
was mitigated by better targeting of that spending.
Figure 14 – Trends in Government Expenditure and Public Sector Fixed Capital Formation
Source – RBI Handbook on Indian Economy

The Pol i t i ca l Economy of Infrastructure Development in Post - Independence India
19
M4 - D:\Booklet\IDFC-PEID-Report\IDFC-PEIDPII-Report.p65
Table 4 - Evidence of shortages
Peak power shortage (1991) 23 per cent
Turn-around time at major ports (1997-98) 8 days
Time taken for a truck to travel from Delhi to Kolkata 5 days
Waiting list for a telephone connection (1991) 1.7 million
Without the telecom sector initiatives of the Rajiv Gandhi years, the government post the 1991 crisis would have
reacted even much more slowly to the need for radical reform in the sector than they did. By placing it on the
agenda, it became possible to use structural reform to induce private investment into the sector, and thereby
circumvent the severe constraint on government resources. And the rest, as they say, is history (Figure 15)! The
success of the IT industry is indicative of the impact of telecom sector reforms on productivity. The explosive growth
in IT service exports provided critical foreign exchange earnings for the economy without using up too much
capital, foreign or domestic, for so doing (Kelkar 1994).
Figure 15 – Telecom Growth – The Changing Scenario
Source: TRAI (2005c) and TRAI (2006c)
In the era of Decentralized Politics while the financing constraint became the most severe in decades, shortages in
the infrastructure sector intensified, and therefore, the sector began to attract unprecedented attention. Moreover,
given the atomized nature of political power during this era, the space for debate expanded and consensus building
in policy making became a complex exercise creating greater demand for relevant empirical research.
The India Infrastructure Report (NCAER 1995), under the chairmanship of Rakesh Mohan, emerged as a seminal
piece of work in the area with many of its recommendations finding their way into the several budgets spanning
the Eighth Plan.21 The Ninth Plan identified the management of the infrastructure deficit as a key objective which,
given the binding nature of fiscal constraints, was to be achieved through organizational, management, structural,
or in some cases, legislative reforms designed to improve operational efficiency, cost recovery and financial viability
in key infrastructure sectors, and attract private capital into them (GOI 1993, Jalan 1993).22 Many of these objectives
were underpinned by a high-powered Task Force on Infrastructure (Box 2).
21 The World Development Report (World Bank 1994) was also quite influential and brought to the attention of policy makers the range of initiatives being
pursued globally to induce greater private sector participation in infrastructure development.
22 The populist policies of previous decades meant that user charges on many publicly provided utilities such as irrigation, electricity and water, were much below
their costs of provision. A new body of research, spawned in the wake of the 1991 crisis, indicates that the unrecovered costs were as high as 5 per cent of GDP
for the Central Government alone (World Bank 1991, Gulati et. al. 1990, Morris 1996, 2003).

Lal l and Rastogi
20
M4 - D:\Booklet\IDFC-PEID-Report\IDFC-PEIDPII-Report.p65
Box 2 – Task Force on Infrastructure
A Task Force on Infrastructure comprising both Government and industry representatives was constituted
under the Chairmanship of Shri Jaswant Singh, Dy. Chairman, Planning Commission, with the aim of attracting
investment to specific projects of national and regional importance, and ensure their timely completion.
Initially, the Task Force dealt with the following projects focusing on innovative methods for financing them.
• Six lane expressway of 7,000 km. length, having North-South and East-West corridors,
• Four-laning of National Highways, and
• Five world-class international airports.
The terms of reference of the Task Force included
• determining the routes for the expressways and National Highway, and establishing technical parameters
thereof;
• identifying and recommending locations for the airports;
• establishing benchmarks and criteria for the airports;
• recommending financing options for expressway, highways and airports;
• recommending criteria for competitive bidding and selection of (EPC) contractors;
• recommending measures as necessary for timely completion of the identified projects, including
governmental clearances; and
• over-seeing and monitoring timely implementation of the projects.
The Task Force also formulated the Integrated National Transport Policy to strengthen the transport
infrastructure in the country.
Source: The Ninth Five Year Plan
More specifically, the Ninth Plan kicked off the debate on privatization of distribution in the power sector23 and
paved the way for the passage of the Electricity Act of 2003 (which although not yet successful in driving open
access, has at least served to attract more private participation in captive generation capacity).
The case of transportation infrastructure is a good example of more effective targeting of public spending and
initiative in the post-1991 period. The Ninth Plan clearly identified the unbalanced modal mix in the transport
sector—that is, a disproportionate reliance on congested national highways vis-a-vis rail, with the former carrying
over 60 per cent of all freight traffic and 80 per cent of passenger traffic. This awareness did have some impact on
the operational efficiency of the Indian Railways, which has since shown signs of improvement. More importantly,
it led to targeted spending on the national highway network and the build-out of the Golden Quadrilateral and the
related North-South and East-West road corridors under the Tenth Five Year Plan. Likewise, the port sector, which
saw an 11-fold increase in traffic from 19 million tonnes to 227 million tonnes from 1950-51 to 1996-97 and an
average turn-around time reaching 8 days in 1997/98, was opened up to private investment. This helped add some
4 million TEU of container handling capacity, helping reduce congestion in our major ports. Similarly, the work of
the Committee on Civil Aviation facilitated the entry of low-cost private carriers and led to enormous private sector
investment into the civil aviation infrastructure, including airlines and, now also airports.
In sum, the post-1991 period has been one in which, forced by binding fiscal constraints on the one hand, and the
pressures of “neo-populist” coalition politics on the other, we have seen a sharp reduction in government spending
on infrastructure. In a tough fiscal environment, the easier thing for weak governments to do is to favour existing
vote banks over future voters by cutting capital expenditures in favour of spending on subsidies and other current
consumption. Notwithstanding the fact that infrastructure spending dipped back to post-Independence lows during
this period, we have seen a marked improvement in the targeting of that spending, and much greater application
to the pursuit of structural reforms to improve the sector’s efficiency and induce private investment into the space.
We have at last, also seen the emergence of a strategic focus to infrastructure policy, as well as an unprecedented
23 Having learnt the lesson from the failure of early IPPs that it is hard to get private financing for power generation in the absence of credit worthy off-takers.
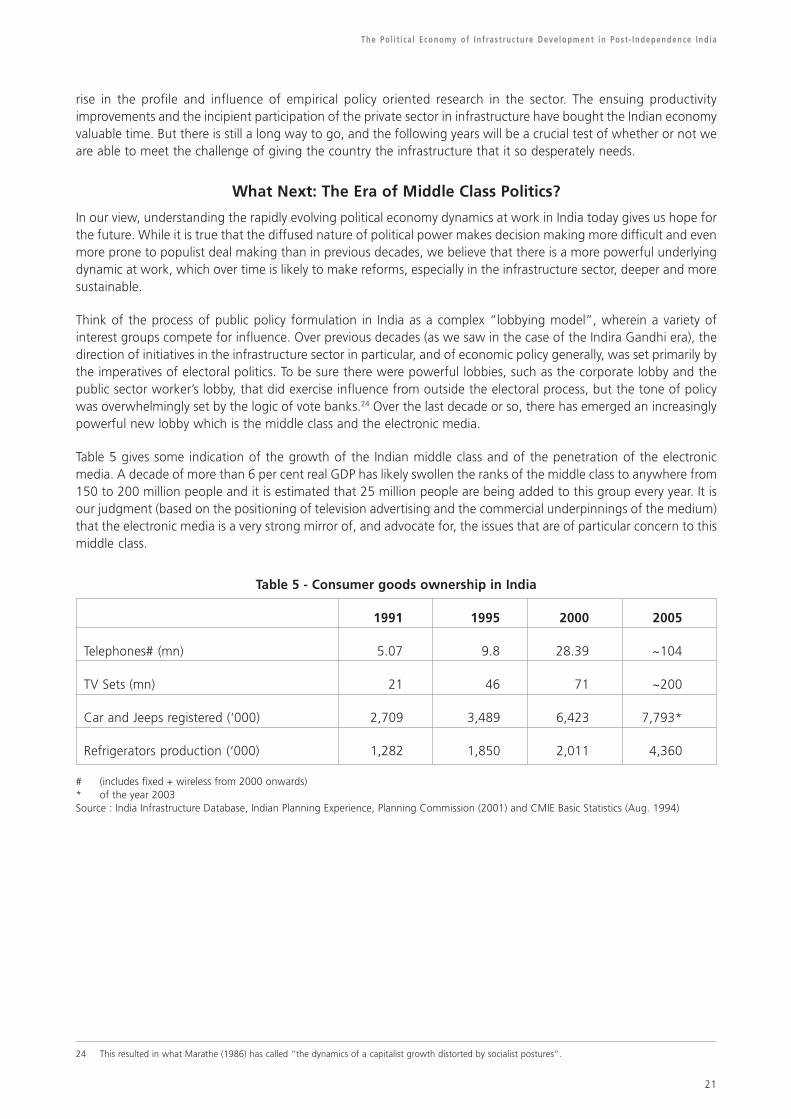
The Pol i t i ca l Economy of Infrastructure Development in Post - Independence India
21
M4 - D:\Booklet\IDFC-PEID-Report\IDFC-PEIDPII-Report.p65
rise in the profile and influence of empirical policy oriented research in the sector. The ensuing productivity
improvements and the incipient participation of the private sector in infrastructure have bought the Indian economy
valuable time. But there is still a long way to go, and the following years will be a crucial test of whether or not we
are able to meet the challenge of giving the country the infrastructure that it so desperately needs.
What Next: The Era of Middle Class Politics?
In our view, understanding the rapidly evolving political economy dynamics at work in India today gives us hope for
the future. While it is true that the diffused nature of political power makes decision making more difficult and even
more prone to populist deal making than in previous decades, we believe that there is a more powerful underlying
dynamic at work, which over time is likely to make reforms, especially in the infrastructure sector, deeper and more
sustainable.
Think of the process of public policy formulation in India as a complex “lobbying model”, wherein a variety of
interest groups compete for influence. Over previous decades (as we saw in the case of the Indira Gandhi era), the
direction of initiatives in the infrastructure sector in particular, and of economic policy generally, was set primarily by
the imperatives of electoral politics. To be sure there were powerful lobbies, such as the corporate lobby and the
public sector worker’s lobby, that did exercise influence from outside the electoral process, but the tone of policy
was overwhelmingly set by the logic of vote banks.24 Over the last decade or so, there has emerged an increasingly
powerful new lobby which is the middle class and the electronic media.
Table 5 gives some indication of the growth of the Indian middle class and of the penetration of the electronic
media. A decade of more than 6 per cent real GDP has likely swollen the ranks of the middle class to anywhere from
150 to 200 million people and it is estimated that 25 million people are being added to this group every year. It is
our judgment (based on the positioning of television advertising and the commercial underpinnings of the medium)
that the electronic media is a very strong mirror of, and advocate for, the issues that are of particular concern to this
middle class.
Table 5 - Consumer goods ownership in India
1991 1995 2000 2005
Telephones# (mn) 5.07 9.8 28.39 ~104
TV Sets (mn) 21 46 71 ~200
Car and Jeeps registered (‘000) 2,709 3,489 6,423 7,793*
Refrigerators production (‘000) 1,282 1,850 2,011 4,360
# (includes fixed + wireless from 2000 onwards)
* of the year 2003
Source : India Infrastructure Database, Indian Planning Experience, Planning Commission (2001) and CMIE Basic Statistics (Aug. 1994)
24 This resulted in what Marathe (1986) has called “the dynamics of a capitalist growth distorted by socialist postures”.

Lal l and Rastogi
22
M4 - D:\Booklet\IDFC-PEID-Report\IDFC-PEIDPII-Report.p65
Figure 16 - Mobile Growth and Effective Charge per minute
Source: TRAI (2005C and 2006C)
The impact of the now very substantial purchasing power of this segment of the population is readily seen in the
rapid and accelerating pace of consumer goods penetration. This group of people is also much more willing and
able to pay for essential infrastructure services than they were a decade ago. In view of this, our hypothesis with
respect to the emerging political economy of reform, especially in the infrastructure sector, is that a reform initiative
becomes sustainable and irreversible the moment the middle class gets a taste of the benefits from that initiative.
That is the moment that the “dam of resistance” from other political constituencies (corporate or public sector
incumbents, trade unions or even rural vote banks) gives way to the inescapable influence of a burgeoning middle
class, made stronger by the representation of their interests by electronic media.
An illustration helps make the point. The telecom sector reforms remained sluggish and vulnerable to push back
until 1998-99 when competition from a new generation of private providers of mobile telecom services triggered a
decline in tariffs. From that point onwards we saw an exponential subscriber growth (Figure 16) as a result of which
telecom sector reforms gained political legitimacy and became irreversible.
We can trace a similar trajectory for civil aviation sector reforms. Once the entry of low cost airlines forced air fares
lower, unprecedented growth in domestic air travel was unleashed creating a new constituency for reforms in this
sector.25 It is because of the power of this constituency (and the media that played up the story) that the strike by
airport workers against the privatization of the Delhi and Mumbai airports failed to take hold, whereas it might
have succeeded in setting back such an initiative a decade ago.
By exactly the same logic, power sector reforms are still vulnerable. Take the case of the privatization of Delhi
electricity distribution. In the minds of the consuming public, privatization has only been associated with higher
tariffs with no improvement in reliability of power supply (which is subject to shortages because of limited generating
capacity). The moment, however, the consuming public gains confidence about the availability of power, this
reform initiative too would become politically unassailable.
25 More than half of the passengers using Deccan Airways, for example, are first time air travellers.

The Pol i t i ca l Economy of Infrastructure Development in Post - Independence India
23
M4 - D:\Booklet\IDFC-PEID-Report\IDFC-PEIDPII-Report.p65
Figure 17 – Growth of the Global Middle Class
Source : World Bank (2007)
In conclusion, our perspective on the future is optimistic. As long as the middle class gains momentum, it is a matter
of time before public policy becomes more responsive to their concerns. According to the World Bank (2007), by
2030 a global middle class26 of 1.2 bn would emerge in the developing world, up from 400 m in 2000 (Figure 17).
A significant portion of this middle class will be in India. We can, therefore, expect that in the coming years, political
logic will drive decision makers to deliver improved infrastructure services. Much greater reliance on private sector
participation in the space along with a reversal in the trend of declining government spending on infrastructure can
also be envisaged. It is not surprising that the government today is extremely focused on launching ambitious PPP
programmes in roads, ports, airports, and even the railways. Innovative schemes have now been launched in
hitherto completely neglected segments such as urban water supply and sanitation.27 In this environment, the role
for empirical research is more fertile than it has ever been. Our suggestion is that such research should not only
focus on “what needs to be done”, but also on the political economy of “how it can be done” - the deeper our
insight is on harnessing the middle class dynamics to push reforms ahead, the sooner will we be able to deliver the
infrastructure that our country so desperately needs.
26 The middle class is defined as population earning $4,000 - $17,000 per capita on purchasing-power-parity basis.
27 The Prime Minister’s Committee on Infrastructure is a manifestation of the government’s seriousness, and the Jawahar Lal Nehru National Urban Renewal
Mission is an example of innovation.

Lal l and Rastogi
24
M4 - D:\Booklet\IDFC-PEID-Report\IDFC-PEIDPII-Report.p65
Bibliography
1. Ahluwalia, I. (1983), Industrial Performance in India: An Analysis of Deceleration in Growth 1956-57 to 1979-
80. publisher? Place?
2. Alavi, Hamza and John Harris (editors) (1989) –South Asia: Sociology of Developing Societies, Macmillan,
London
3. Alexander, P.C. (2004) – Through the Corridors of Power : An Insider’s Story, HarperCollins, London
4. Bagchi, A.K. (1975) – “Some characteristics of Industrial Growth in India”, EPW, Annual number, February
5. Bhagwati, Jagdish N., and Desai, Padma (1970) - India Planning for Industrialization: Industrialization and Trade
Policies Since 1951. London: Oxford University Press
6. Bhagwati, Jagdish N., and T.N. Srinivasan (1974) Foreign Trade Regimes and Economic Development, India.
National Bureau of Economic Research, Columbia University Press, New York
7. Brecher, Michael (1959) - Nehru, A Political Biography, Oxford University Press, London
8. Brecher, Michael (1969) - Political Leadership in India, an Analysis of Elite Attitudes. Frederick A. Praeger, New
York
9. Chakravarty, S. (1977), ‘Reflections on the Growth Process in the Indian Economy’, in C.D. Wadhva (ed.) Some
Problems of India’s Economic Policy, Tata McGraw Hill, New Delhi.
10. Das, Gurucharan (2000) - India Unbound (New Delhi: Penguin Books India
11. Deshmukh, B.G. (2004) – A Cabinet Secretary Looks Back, HarperCollins, London
12. Frank, Katherine (2001) – Indira : The Life of Indira Nehru Gandhi, HarperCollins, London
13. Frankel, Francine R. (1978) – India’s Political Economy 1947-1977 : The Gradual revolution, Princeton University
Press, Princeton
14. GOI (1993) – ‘Economic Reforms – Two Years After and the Task Ahead’, Discussion Paper, Department of
Economic Affairs, Ministry of Finance, New Delhi
15. Griffin, Keith (1974) – The Political Economy of Agrarian Change: An Essay on the Green Revolution. Cambridge:
Harvard University Press.
16. Gulati, Ashok and Pradeep K Sharma (1990) – “Fertilizer Pricing and Subsidy in India : An Alternative Perspective”
A Paper presented at the National Workshop of Agricultural Input Marketing, Ahmedabad, February 1990
17. Jalan, Bimal (1993) - “The India Economy: Problems and Prospects”, Penguins, New Delhi
18. Joshi, Vijay and Little I.M.D. (1994) – India : Macroeconomics and Political Economy 1964-91, Oxford University
Press, New Delhi
19. Kelkar, Vijay (2004) - “India: On the Growth Turnpike,” (2004 Narayanan Lecture, at Australian National University
delivered on 27 April 2004)
20. Kochanek, Stanley (1985) – The Politics of Regulation : Rajiv’s New Mantra, Journal of Commonwealth and
Comparative Politics, London volume 23 Issue no 3
21. Kochanek, Stanley A. (1970) - “Interest Groups and Interest Aggregation: Changing Patterns of Oligarchy in
the FICCI”. Economic and Political Weekly (Special Number July 1970): 1291-1308.

The Pol i t i ca l Economy of Infrastructure Development in Post - Independence India
25
M4 - D:\Booklet\IDFC-PEID-Report\IDFC-PEIDPII-Report.p65
22. Kotwal, Ashok and Bharat Ramaswami (1999) – Economic Reforms in Agriculture and Rural Growth in Sach et.
al. (1999), OUP, New Delhi
23. Marathe, S.S. (1986) – Regulation and Development, India’s Policy Experience of Controls over Industry, Sage
Publications, New Delhi
24. McDowell, Stephen D (1997) – Globalization, Liberalization and Policy Changes : A Political Economy of India’s
Communications Sector, McMillan’s Press, London
25. Mohan, Rakesh (1985) – Urbanization is India’s Future, Population and Development Review, 11 (4), New York,,
Population Council
26. MOP (2005) – Rajiv Gandhi Grameen Vidyutikaran Yojana,, Ministry of Power, New Delhi
27. Morgan, Stanley (2005)-India Economics,Infrastructure: Changing Gears. J.M. Morgan Stanley, Mumbai.
28. Morris, S. (1996) The Political Economy of Electric Power in India (Part I and II), Economic and Political Weekly,
Vol 31 (No. 20 and 21).
29. Morris, Sebastian (2003); “Efficacy of Government Expenditures”, in 3iNetwrok, India Infrastructure Report,
2003, Oxford University Press, New Delhi
30. NCAER (1973) – Impact of Mechanization in Agriculture on Employment Report by National Council of Applied
Economic Research, New Delhi.
31. NCAER (1996) – The India Infrastructure Report : Policy Imperatives for Growth and Welfare, National Council
for Applied Economic Research, New Delhi
32. Patel, I.G.(2002) - “Glimpses of Indian Economic Policy: An Insider’s View” New Delhi, Oxford University Press,
2002
33. Planning Commission (2001) - Indian Planning Experience: A Statistical Profile (2001), Planning Commission,
New Delhi
34. Planning Commission (2005) – Draft Report of the Expert Committee on Integrated Energy Policy, Planning
Commission, Government of India, New Delhi
35. Planning Commission (2006) – Towards Faster and More inclusive Growth, An Approach to the 11th Five Year
Plan, Planning Commission, Government of India, New Delhi
36. Srinivasan, T.N. and Narayana, N.S.S. (1977), ‘ Economic Performance since the Third Plan and its Implications
for Policy’, Economic and Political Weekly, annual number, February.
37. Varshney, Ashutosh (1999) – India’s Economic Reforms in Comparative Perspective in Sachs, J. D.; Varshney, A.
and Bajpai, N. (Editors). India in the Era of Economic Reforms. Oxford University Press, Delhi
38. Wadia, P.A. and K.T. Merchant (1952) – The Five Year Plan, A Criticism, Bombay
39. World Bank (1991) “INDIA 1991 Country Economic Memorandum Volume II: Agriculture: Challenges and
Opportunities”, The World Bank, Washington
40. World Bank (2007) - Global Economic Prospects 2007: Managing the Next Wave of Globalization, The World
Bank, Washington
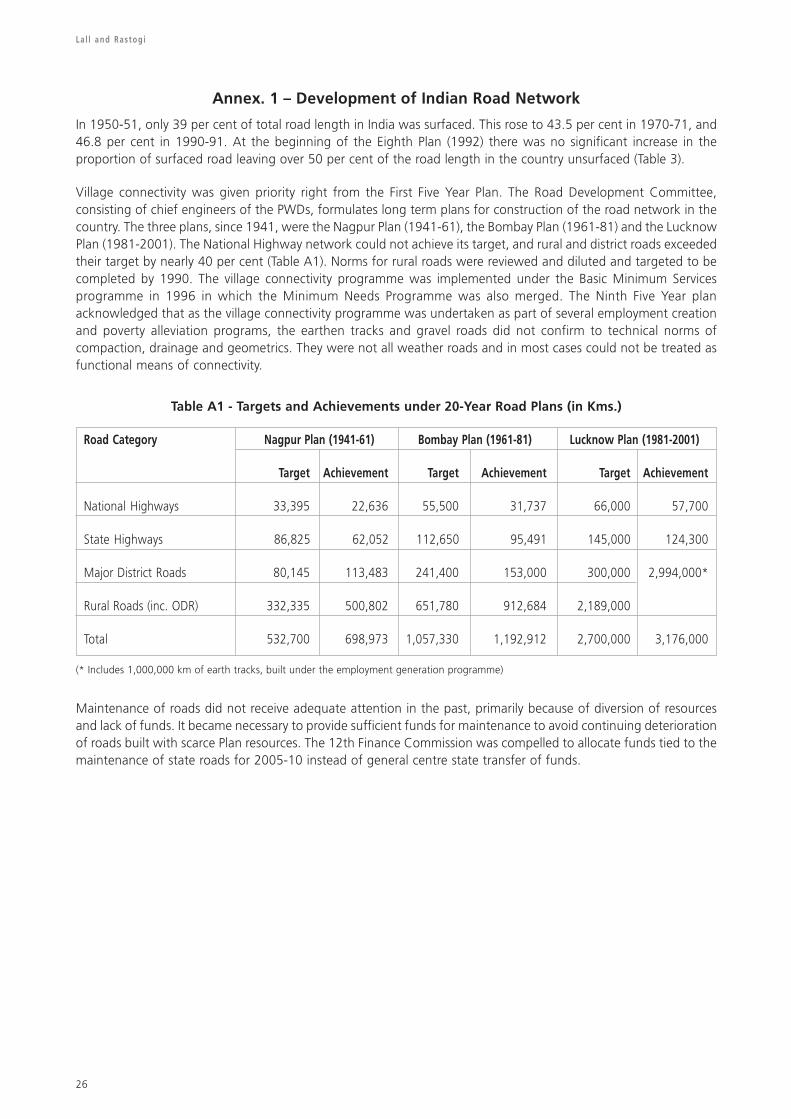
Lal l and Rastogi
26
M4 - D:\Booklet\IDFC-PEID-Report\IDFC-PEIDPII-Report.p65
Annex. 1 – Development of Indian Road Network
In 1950-51, only 39 per cent of total road length in India was surfaced. This rose to 43.5 per cent in 1970-71, and
46.8 per cent in 1990-91. At the beginning of the Eighth Plan (1992) there was no significant increase in the
proportion of surfaced road leaving over 50 per cent of the road length in the country unsurfaced (Table 3).
Village connectivity was given priority right from the First Five Year Plan. The Road Development Committee,
consisting of chief engineers of the PWDs, formulates long term plans for construction of the road network in the
country. The three plans, since 1941, were the Nagpur Plan (1941-61), the Bombay Plan (1961-81) and the Lucknow
Plan (1981-2001). The National Highway network could not achieve its target, and rural and district roads exceeded
their target by nearly 40 per cent (Table A1). Norms for rural roads were reviewed and diluted and targeted to be
completed by 1990. The village connectivity programme was implemented under the Basic Minimum Services
programme in 1996 in which the Minimum Needs Programme was also merged. The Ninth Five Year plan
acknowledged that as the village connectivity programme was undertaken as part of several employment creation
and poverty alleviation programs, the earthen tracks and gravel roads did not confirm to technical norms of
compaction, drainage and geometrics. They were not all weather roads and in most cases could not be treated as
functional means of connectivity.
Table A1 - Targets and Achievements under 20-Year Road Plans (in Kms.)
Road Category Nagpur Plan (1941-61) Bombay Plan (1961-81) Lucknow Plan (1981-2001)
Target Achievement Target Achievement Target Achievement
National Highways 33,395 22,636 55,500 31,737 66,000 57,700
State Highways 86,825 62,052 112,650 95,491 145,000 124,300
Major District Roads 80,145 113,483 241,400 153,000 300,000 2,994,000*
Rural Roads (inc. ODR) 332,335 500,802 651,780 912,684 2,189,000
Total 532,700 698,973 1,057,330 1,192,912 2,700,000 3,176,000
(* Includes 1,000,000 km of earth tracks, built under the employment generation programme)
Maintenance of roads did not receive adequate attention in the past, primarily because of diversion of resources
and lack of funds. It became necessary to provide sufficient funds for maintenance to avoid continuing deterioration
of roads built with scarce Plan resources. The 12th Finance Commission was compelled to allocate funds tied to the
maintenance of state roads for 2005-10 instead of general centre state transfer of funds.
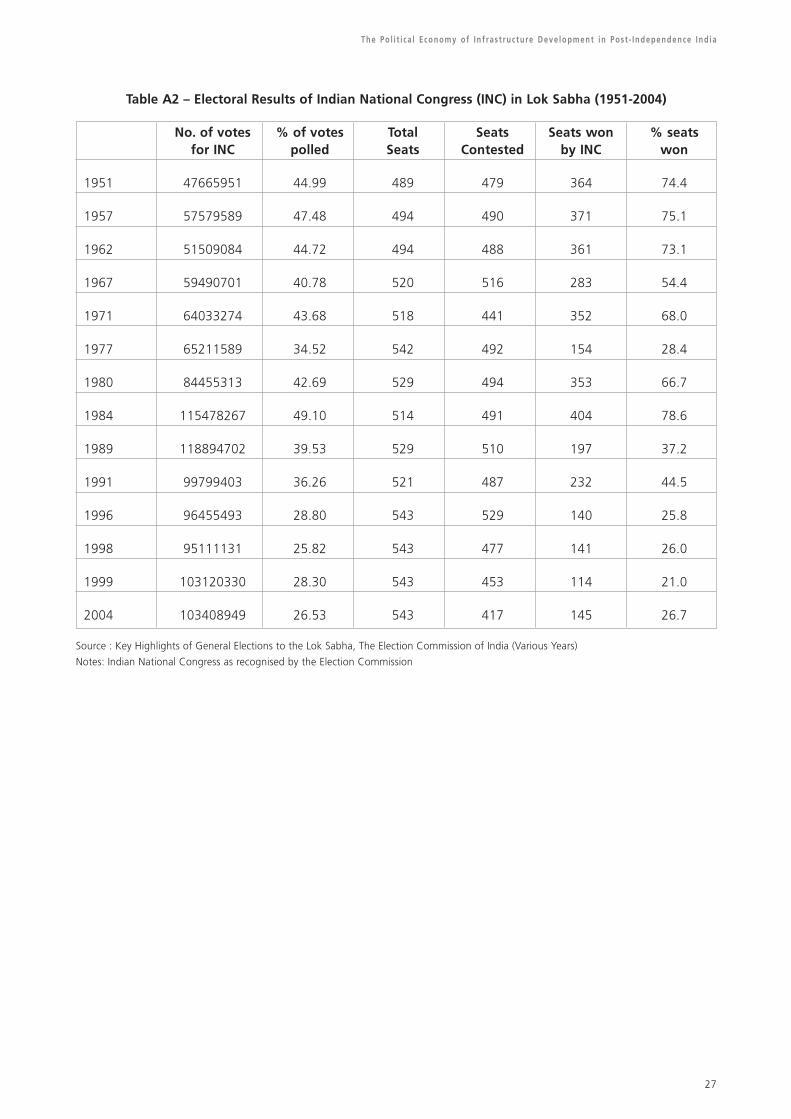
The Pol i t i ca l Economy of Infrastructure Development in Post - Independence India
27
M4 - D:\Booklet\IDFC-PEID-Report\IDFC-PEIDPII-Report.p65
Table A2 – Electoral Results of Indian National Congress (INC) in Lok Sabha (1951-2004)
No. of votes % of votes Total Seats Seats won % seats
for INC polled Seats Contested by INC won
1951 47665951 44.99 489 479 364 74.4
1957 57579589 47.48 494 490 371 75.1
1962 51509084 44.72 494 488 361 73.1
1967 59490701 40.78 520 516 283 54.4
1971 64033274 43.68 518 441 352 68.0
1977 65211589 34.52 542 492 154 28.4
1980 84455313 42.69 529 494 353 66.7
1984 115478267 49.10 514 491 404 78.6
1989 118894702 39.53 529 510 197 37.2
1991 99799403 36.26 521 487 232 44.5
1996 96455493 28.80 543 529 140 25.8
1998 95111131 25.82 543 477 141 26.0
1999 103120330 28.30 543 453 114 21.0
2004 103408949 26.53 543 417 145 26.7
Source : Key Highlights of General Elections to the Lok Sabha, The Election Commission of India (Various Years)
Notes: Indian National Congress as recognised by the Election Commission

Lal l and Rastogi
28
M4 - D:\Booklet\IDFC-PEID-Report\IDFC-PEIDPII-Report.p65
Table A3 – Electoral Results of Indian National Congress in State Legislatures (1951-2004)
% votes polled in % seats won in % states with INC
state legislatures state legislatures
1951 43 77 100
1957 44 76 92
1962 43 61 92
1967 40 49 58
1971 33 33 20
1977 36 43 38
1980 33 49 43
1984 30 33 35
1989 38 46 50
1991 28 26 24
1996 25 25 22
1998 39 49 40
1999 36 40 50
2004 25 27 21
Source : Key Highlights of General Elections to the Legislative Assemblies, The Election Commission (Various Years)
Notes : 1. For comparison purposes all the legislative election results in the intervening years have been clubbed with the later year.
2. Only that data for INC is taken which is provided in the reports of the Election Commission
3. If INC has not fielded its candidates, the result is counted as zero in that event.

The Pol i t i ca l Economy of Infrastructure Development in Post - Independence India
29
M4 - D:\Booklet\IDFC-PEID-Report\IDFC-PEIDPII-Report.p65 Cover-3

M4 - D:\Booklet\IDFC-PEID-Report\IDFC-PEIDPII-Report.p65
INFRASTRUCTURE DEVELOPMENT FINANCE COMPANY LIMITEDRegistered Office: ITC Centre, 3rd Floor, 760 Anna Salai, Chennai 600 002. Tel. : +91 44 28559440
Ramon House, H.T. Parekh Marg, 169, Backbay Reclamation, Mumbai 400 020. Tel. : +91 22 66339100
The Capital Court, 6th Floor, Olof Palme Marg, Munirka, New Delhi 110 067. Tel. : +91 11 46006100
No. 39, 5th Cross, 8th Main, RMV Extension, Sadashivnagar, Bangalore 560 080. Tel. : +91 80 23613014
Cover-4