THE POLICY OF INDONESIA’S ENERGY MIX - unescap.org · Energy and Mineral Resources for People’s...
19
Energy and Mineral Resources for People’s Welfare THE POLICY OF INDONESIA’S ENERGY MIX REPUBLIC OF INDONESIA Presented at ESCAP Policy Dialogue, December 17-19 th 2013 MINISTRY OF ENERGY AND MINERAL RESOURCES PROF. IGN WIRATMAJA PUJA EXPERT STAF TO MINISTER OF ENERGY AND MINERAL RESOURCES
Transcript of THE POLICY OF INDONESIA’S ENERGY MIX - unescap.org · Energy and Mineral Resources for People’s...
Energy and Mineral Resources for People’s Welfare
THE POLICY OF INDONESIA’S ENERGY MIX
REPUBLIC OF INDONESIA
Presented at ESCAP Policy Dialogue, December 17-19th 2013
MINISTRY OF ENERGY AND MINERAL RESOURCES
PROF. IGN WIRATMAJA PUJA
EXPERT STAF TO MINISTER OF ENERGY AND MINERAL RESOURCES
Energy and Mineral Resources for People’s Welfare
I. INTRODUCTION TO INDONESIA’S MACRO OUTLOOK
Energy and Mineral Resources for People’s Welfare
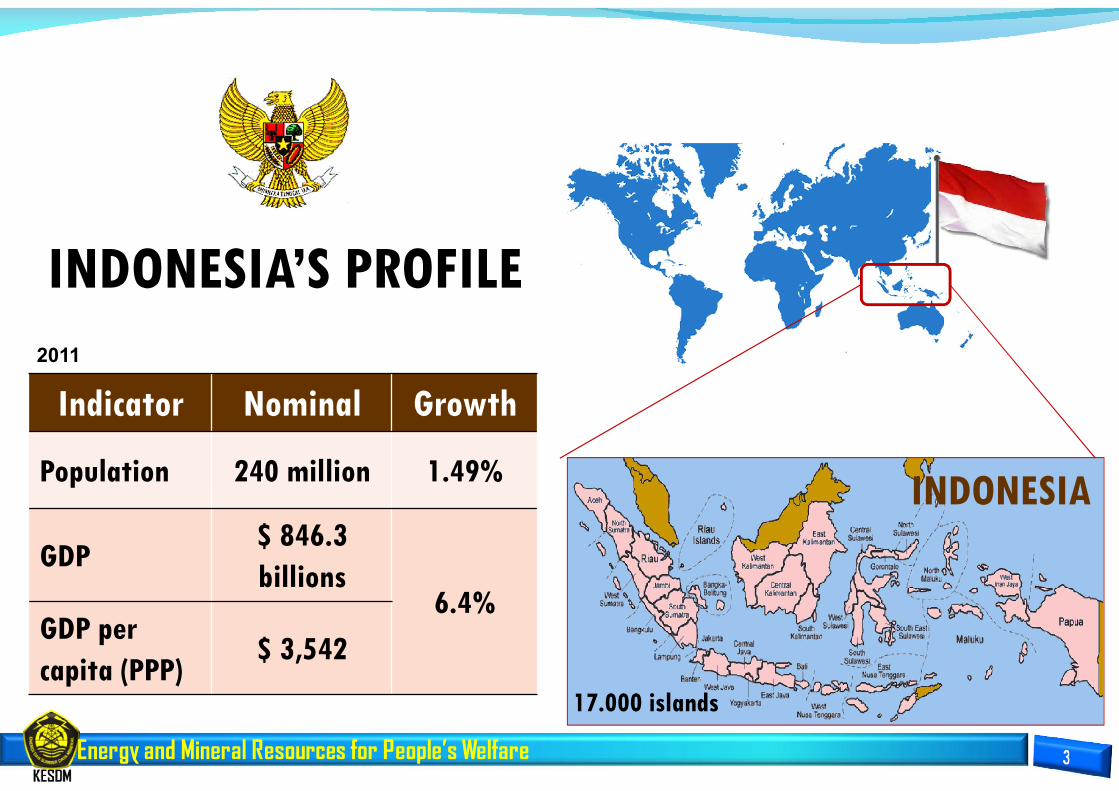
Indicator Nominal Growth
Population 240 million 1.49%
GDP$ 846.3billions
6.4%GDP per capita (PPP)
$ 3,542
INDONESIA
INDONESIA’S PROFILE
17.000 islands
2011
Energy and Mineral Resources for People’s Welfare
0.0
500.0
1,000.0
1,500.0
2010 2011 2012 2013 2014 2015 2016 2017 2018 2019
200
220
240
260
2009 2011 2013 2015 2017 2019
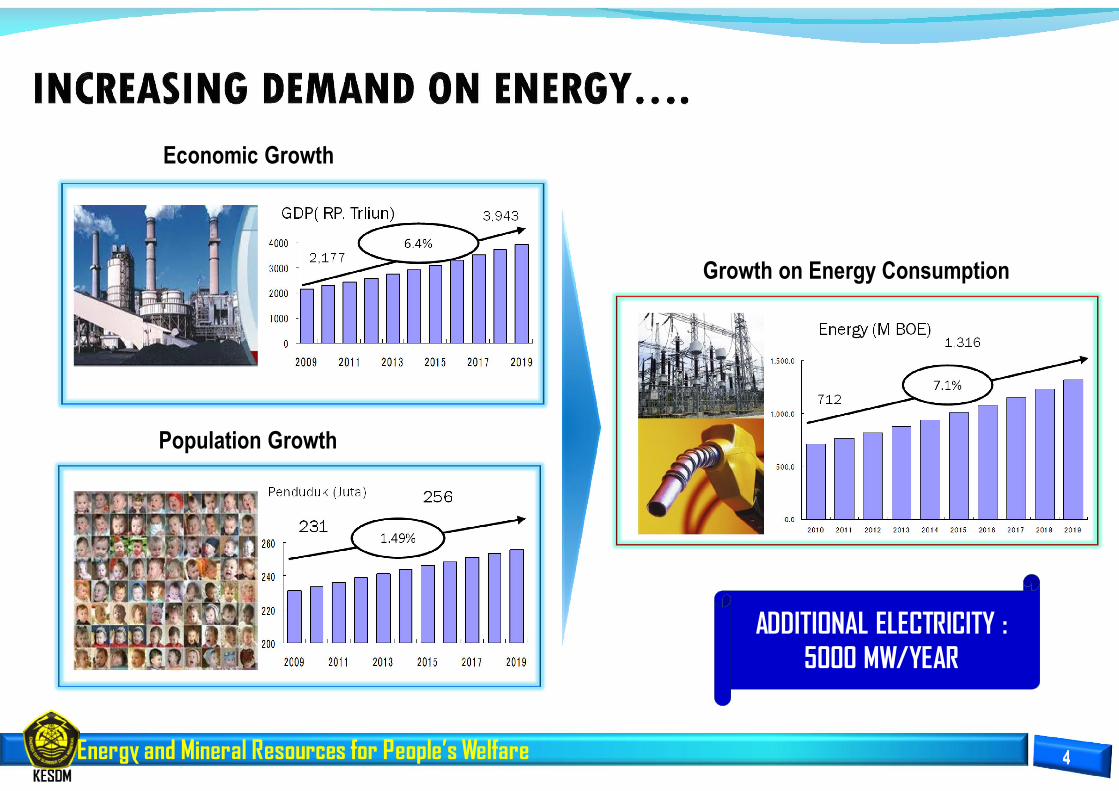
Economic Growth
Population Growth
Penduduk (Juta)
0
1000
2000
3000
4000
2009 2011 2013 2015 2017 2019
GDP( RP. Trliun)
2,177
3,943
6.4%
256
2311.49%
Energy (M BOE)
712
1,316
7.1%
Growth on Energy Consumption
ADDITIONAL ELECTRICITY : 5000 MW/YEAR
Energy and Mineral Resources for People’s Welfare
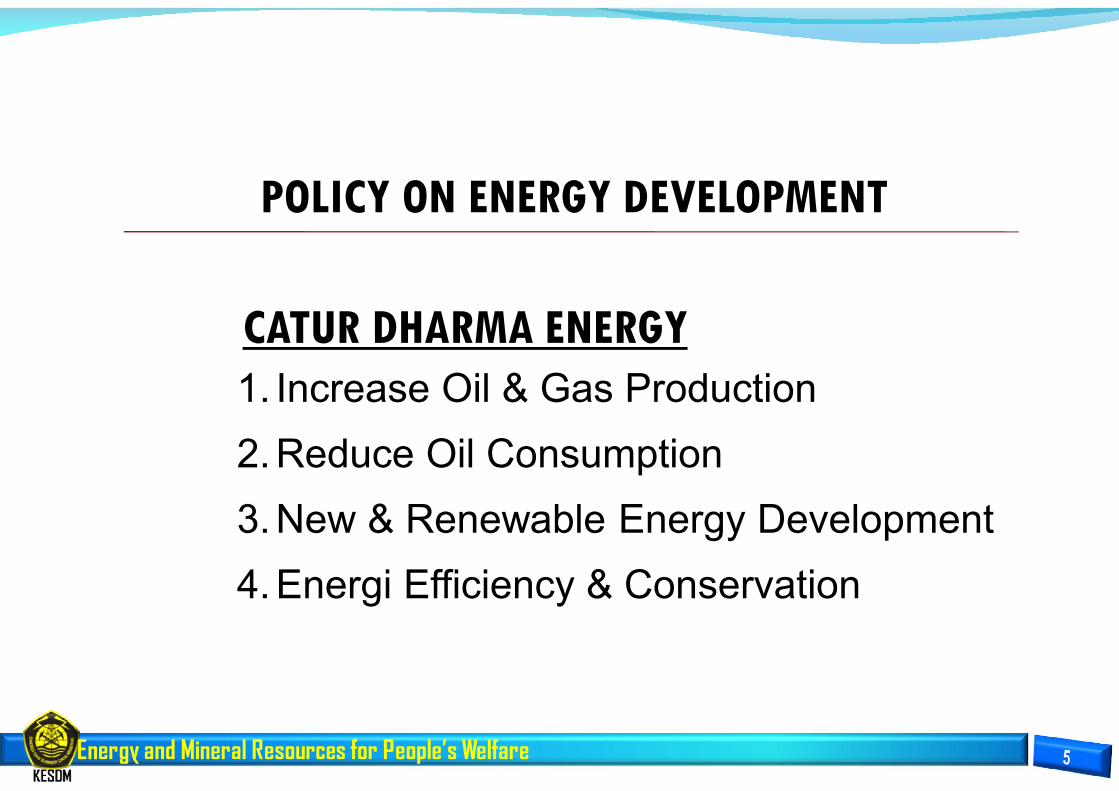
POLICY ON ENERGY DEVELOPMENT
1. Increase Oil & Gas Production
2.Reduce Oil Consumption
3.New & Renewable Energy Development
4.Energi Efficiency & Conservation
CATUR DHARMA ENERGY

Energy and Mineral Resources for People’s Welfare
CURRENT CONDITION2013
ENERGY ELASTICITY= 1,65NON FOSSIL ENERGY SHARE 5%
TARGET2025
ENERGY ELASTICITY LESS THAN 1 IN 2025OPTIMIZING NEW RENEWABLE ENERGY SOURCES
Biofuel5%
Geothermal 5%
Nuclear, Hydro, Solar, Wind,
and Other NRE 5%
LiquifiedCoal 2%
Energy and Mineral Resources for People’s Welfare
52 57 57 51 53 59 7491 99 109
153
266
401
488512
550 544585
744773
797
847
904
966
1056
1214
126413021302
1327
13971404
1316
1364
12671229
1366
15221501
14681462
13731408
1499
1586
14981496
1240
1375
146015001500
466
569601
742
853889
1082
13361373
1305
1506
1683
1631
158915871624
1288
1407
1519
13381362
1445
1303
1387
15391575
1491
1535
16121624
15741557
15371500
1415
1341
1252
1147
10961062
1006
954977
949 945
902861
830
900
100010101010
0
500
1000
1500
20001
96
6
19
67
19
68
19
69
19
70
19
71
19
72
19
73
19
74
19
75
19
76
19
77
19
78
19
79
19
80
19
81
19
82
19
83
19
84
19
85
19
86
19
87
19
88
19
89
19
90
19
91
19
92
19
93
19
94
19
95
19
96
19
97
19
98
19
99
20
00
20
01
20
02
20
03
20
04
20
05
20
06
20
07
20
08
20
09
20
10
20
11
20
12
20
13
20
14
20
15
20
16
20
17
MB
OEP
D
TAHUN Minyak Gas
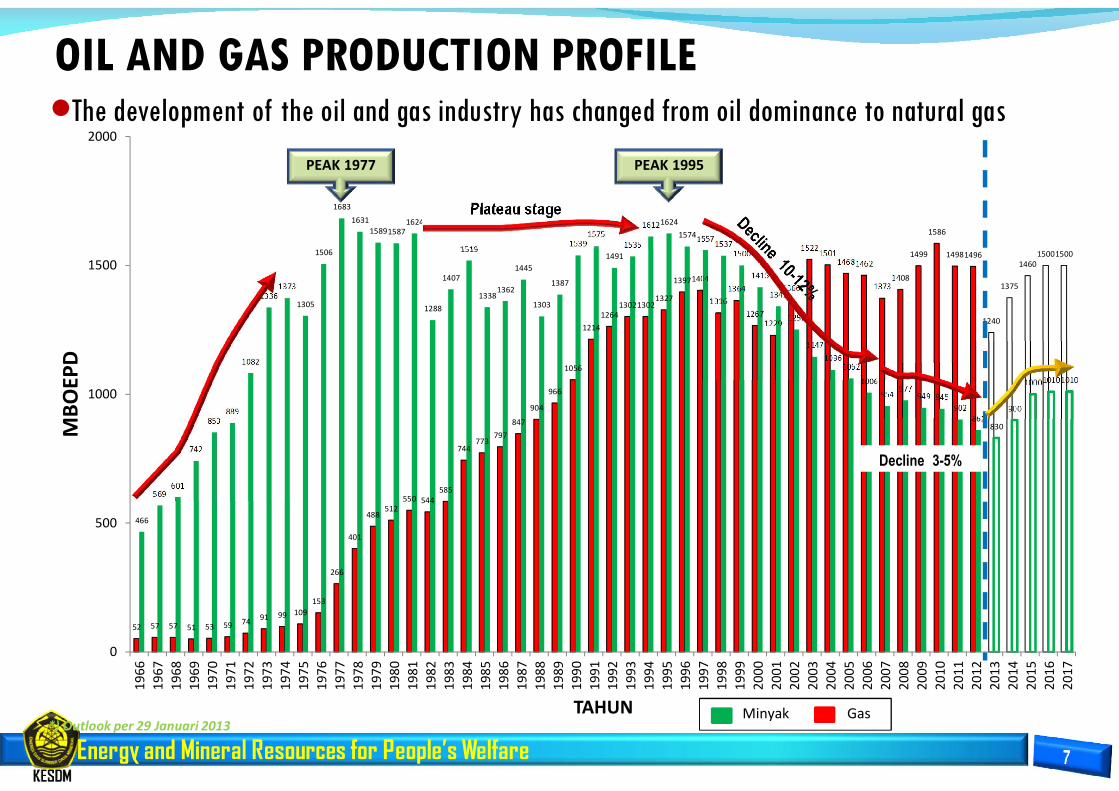
PEAK 1977
Plateau stage
Decline 3-5%
*) Outlook per 29 Januari 2013
PEAK 1995
The development of the oil and gas industry has changed from oil dominance to natural gas
OIL AND GAS PRODUCTION PROFILE
ESDM untuk Kesejahteraan Rakyat
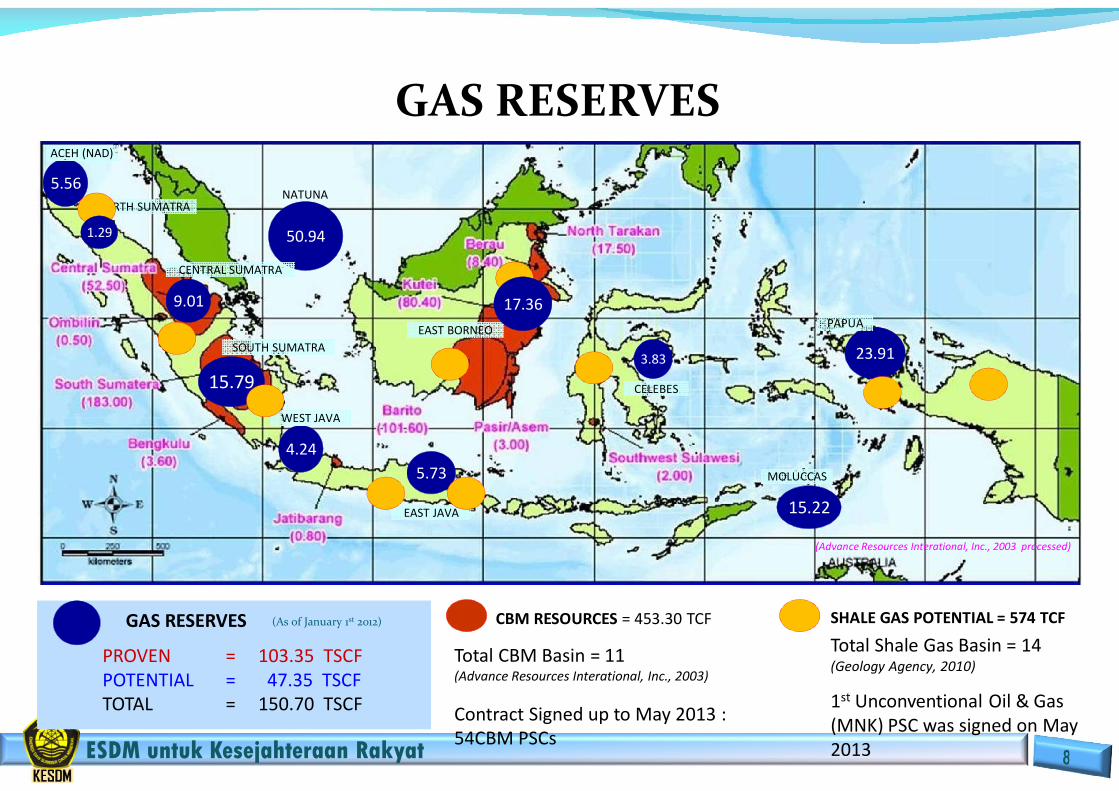
CBM RESOURCES = 453.30 TCF
PROVEN = 103.35 TSCFPOTENTIAL = 47.35 TSCFTOTAL = 150.70 TSCF
GAS RESERVES
GAS RESERVES
(As of January 1st 2012)
Total CBM Basin = 11(Advance Resources Interational, Inc., 2003)
Contract Signed up to May 2013 : 54CBM PSCs
SHALE GAS POTENTIAL = 574 TCF
Total Shale Gas Basin = 14(Geology Agency, 2010)
1st Unconventional Oil & Gas (MNK) PSC was signed on May 2013
3.83
9.01
4.24
50.94
23.91
NATUNA5.56
NORTH SUMATRA
15.22
15.79
CENTRAL SUMATRA
ACEH (NAD)
SOUTH SUMATRA
WEST JAVA
5.73
EAST JAVA
EAST BORNEO
CELEBES
MOLUCCAS
PAPUA
(Advance Resources Interational, Inc., 2003 processed)
1.29
17.36

Energy and Mineral Resources for People’s Welfare
Very High (anthrasit) ( > 7.100 cal/gr ) Medium (Sub Bituminus)( 5100 - 6100 cal/gr )High (Bituminus) ( 6.100 - 7.100 cal/gr ) Low (Lignite) ( < 5.100 cal/gr )
Source: Indonesian Geological Agency, 2012
COAL RESOURCES & RESERVE
28.9 billion ton
Reserves
119.4 billion ton(open pit resources)
Resources
Energy and Mineral Resources for People’s Welfare
MASSIVE DEVELOPMENT OF RENEWABLE ENERGY
Energy and Mineral Resources for People’s Welfare
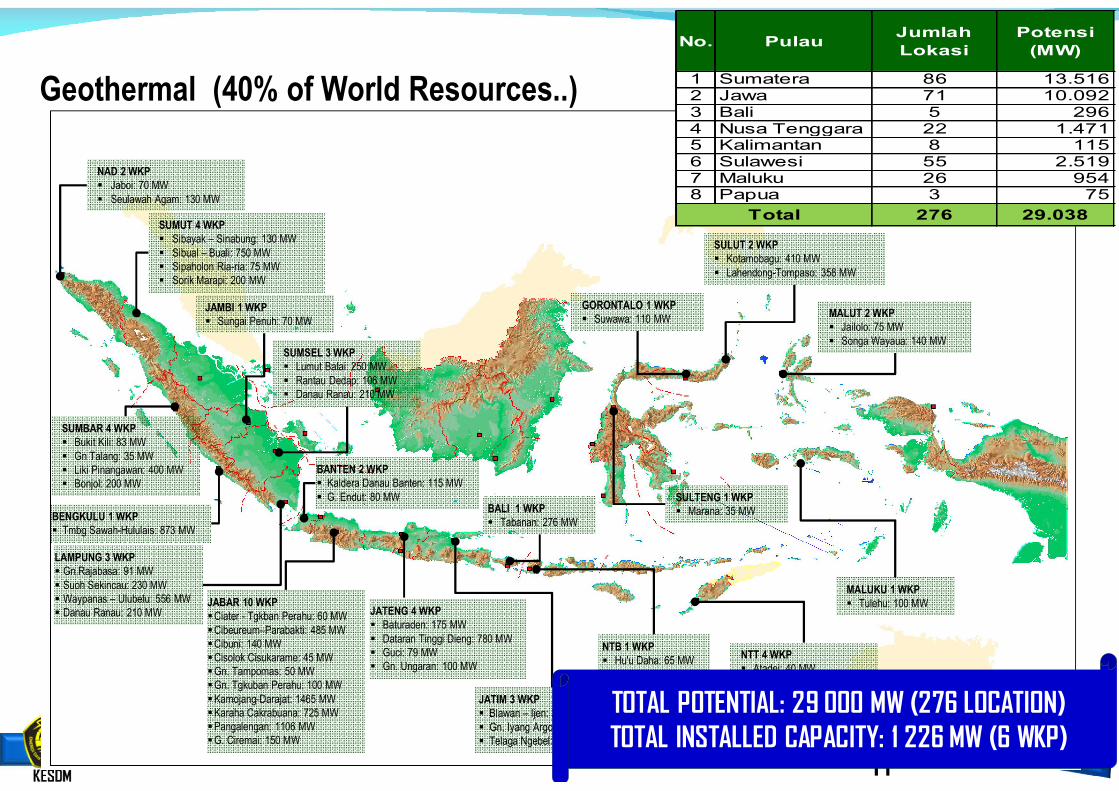
Geothermal (40% of World Resources..)
NAD 2 WKP Jaboi: 70 MW Seulawah Agam: 130 MW
SUMUT 4 WKP Sibayak – Sinabung: 130 MW Sibual – Buali: 750 MW Sipaholon Ria-ria: 75 MW Sorik Marapi: 200 MW
JAMBI 1 WKP Sungai Penuh: 70 MW
SUMSEL 3 WKP Lumut Balai: 250 MW Rantau Dedap: 106 MW Danau Ranau: 210 MW
BANTEN 2 WKP Kaldera Danau Banten: 115 MW G. Endut: 80 MW
SUMBAR 4 WKP Bukit Kili: 83 MW Gn Talang: 35 MW Liki Pinangawan: 400 MW Bonjol: 200 MW
BENGKULU 1 WKP Tmbg Sawah-Hululais: 873 MW
LAMPUNG 3 WKP Gn.Rajabasa: 91 MW Suoh Sekincau: 230 MW Waypanas – Ulubelu: 556 MW Danau Ranau: 210 MW
JABAR 10 WKPCiater - Tgkban Perahu: 60 MW Cibeureum–Parabakti: 485 MWCibuni: 140 MWCisolok Cisukarame: 45 MWGn. Tampomas: 50 MWGn. Tgkuban Perahu: 100 MWKamojang-Darajat: 1465 MWKaraha Cakrabuana: 725 MWPangalengan: 1106 MWG. Ciremai: 150 MW
JATENG 4 WKP Baturaden: 175 MW Dataran Tinggi Dieng: 780 MW Guci: 79 MW Gn. Ungaran: 100 MW
JATIM 3 WKP Blawan – Ijen: 270 MW Gn. Iyang Argopuro: 295 MW Telaga Ngebel: 120 MW
BALI 1 WKP Tabanan: 276 MW
NTB 1 WKP Hu'u Daha: 65 MW NTT 4 WKP
Atadei: 40 MW Sokoria: 30 MW Ulumbu: 199 MW Mataloko: 63 MW
MALUKU 1 WKP Tulehu: 100 MW
MALUT 2 WKP Jailolo: 75 MW Songa Wayaua: 140 MW
SULUT 2 WKP Kotamobagu: 410 MW Lahendong-Tompaso: 358 MW
GORONTALO 1 WKP Suwawa: 110 MW
SULTENG 1 WKP Marana: 35 MW
11
1 Sumatera 86 13.5162 Jawa 71 10.0923 Bali 5 2964 Nusa Tenggara 22 1.4715 Kalimantan 8 1156 Sulawesi 55 2.5197 Maluku 26 9548 Papua 3 75
29.038
Potensi
(MW)
Total 276
No. PulauJumlah
Lokasi
TOTAL POTENTIAL: 29 000 MW (276 LOCATION)TOTAL INSTALLED CAPACITY: 1 226 MW (6 WKP)

ESDM untuk Kesejahteraan Rakyat
Proses
Integrity
Pipeline
GEOTHERMAL

Energy and Mineral Resources for People’s Welfare
9%
28%
18%3%
42%
100%
50%
29%
5%
4%12%
Sumatera814,56 MW
Kalimantan260,66 MW
Sulawesi102,63 MW
Papua
Maluku
Jawa1.835,51 MW
Bali 18,43 MW
Sugar factory
Palm oil mill
Rice mill
Sawmill
Plywood factory8%
9%
29%
21%
5%
28%
1% 8%6%
85%
Municipal waste
Nusa Tenggara
TOTAL RESOURCES : 49 800 MW TOTAL INSTALLED CAPACITY: 1 618 MW
Energy and Mineral Resources for People’s Welfare
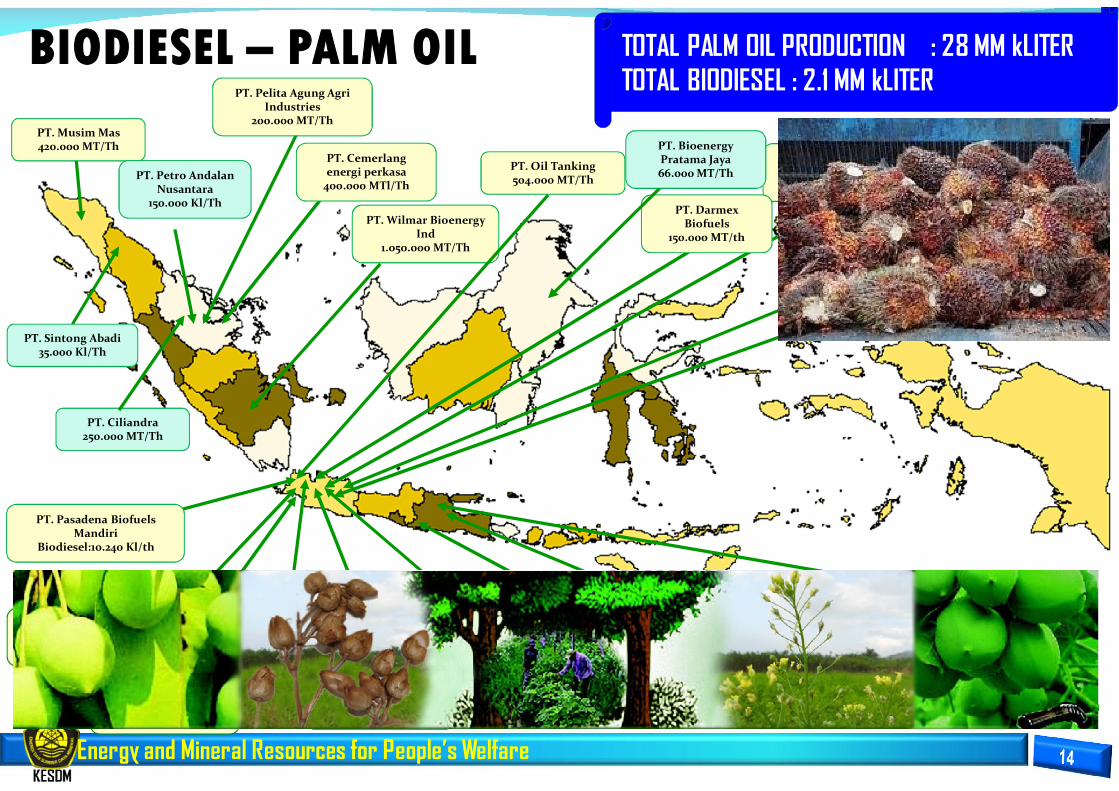
PT. Wilmar Bioenergy Ind
1.050.000 MT/Th
PT. anugerah inti gemanusa
40.000 MT/Th
PT. sumi asih Oleo Chem.
100.000 MT/th
PT. eterindo Nusa Graha
40.000 MT/Th
PT. Eternal Buana Chem, Ind
40.000 MT/Th
PT. Indo Biofuels Energy
60.000 MT/Th
PT. Darmex Biofuels
150.000 MT/th
PT. Pelita Agung Agri Industries
200.000 MT/ThPT. Musim Mas420.000 MT/Th
PT. Sintong Abadi35.000 Kl/Th
PT. Primanusa Palma Energi
24.000 Kl/Th
PT. Multikimia Inti Pelangi
14.000 Kl/Th
PT. Cemerlang energi perkasa
400.000 MTl/ThPT. Petro Andalan
Nusantara150.000 Kl/Th
PT. Bioenergy Pratama Jaya66.000 MT/Th
PT. Pasadena BiofuelsMandiri
Biodiesel:10.240 Kl/th
PT. Wahana Abdi tirta tehnika
13.200 KL/th
PT. Alia Mada Perkasa
11.000 KL/th
PT. Damai sejahtera sentosa
120.000MT/Th
PT. Oil Tanking504.000 MT/Th
PT. Ciliandra250.000 MT/Th
PT. Energi alternatif7.000 MT/Th
Production Capacity: 4,2 million KL
Non Asosiasi
Asosiasi/Aprobi
BIODIESEL – PALM OIL TOTAL PALM OIL PRODUCTION : 28 MM kLITERTOTAL BIODIESEL : 2.1 MM kLITER
Energy and Mineral Resources for People’s Welfare
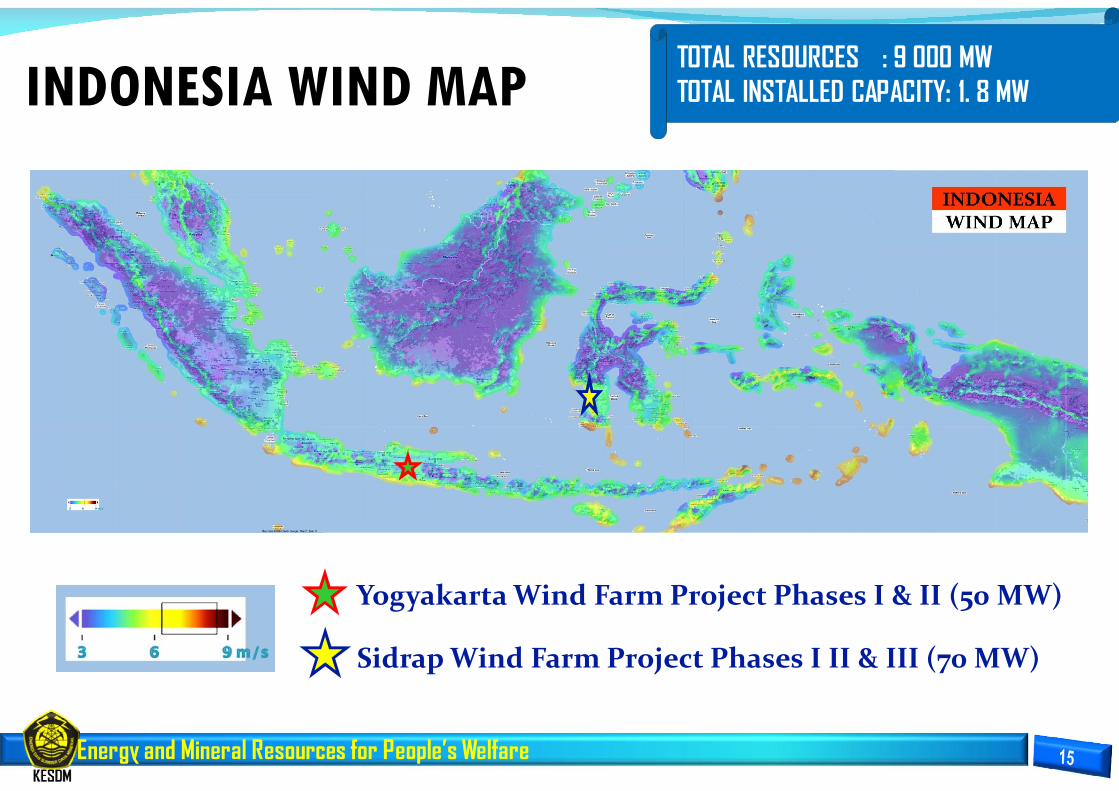
INDONESIA WIND MAP
Yogyakarta Wind Farm Project Phases I & II (50 MW)
Sidrap Wind Farm Project Phases I II & III (70 MW)
TOTAL RESOURCES : 9 000 MW TOTAL INSTALLED CAPACITY: 1. 8 MW
Energy and Mineral Resources for People’s Welfare
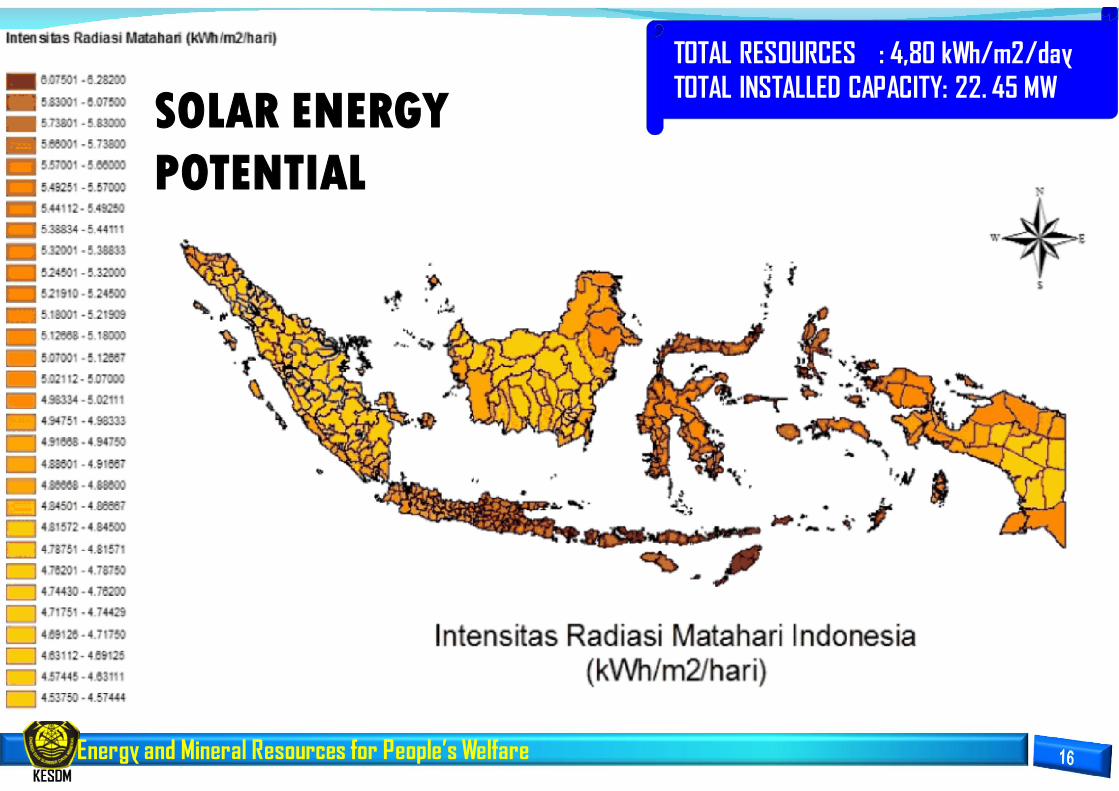
SOLAR ENERGY POTENTIAL
TOTAL RESOURCES : 4,80 kWh/m2/dayTOTAL INSTALLED CAPACITY: 22. 45 MW
Energy and Mineral Resources for People’s Welfare
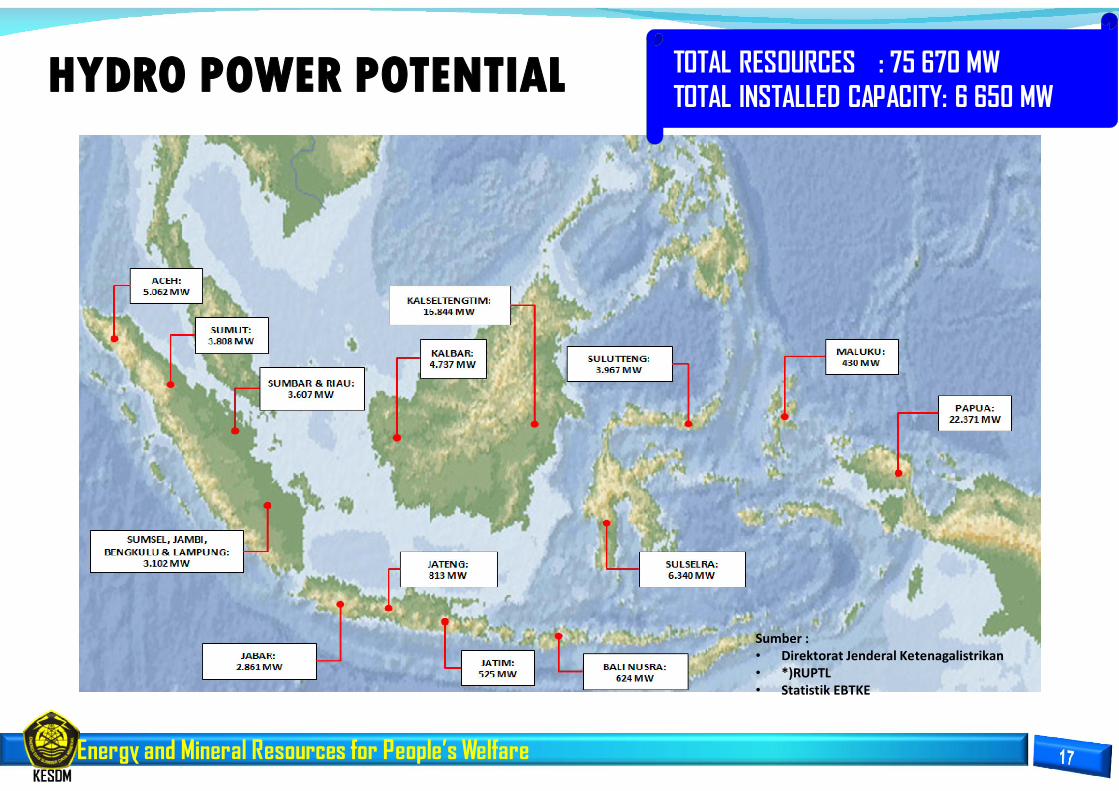
HYDRO POWER POTENTIAL
Sumber : • Direktorat Jenderal Ketenagalistrikan• *)RUPTL• Statistik EBTKE
TOTAL RESOURCES : 75 670 MW TOTAL INSTALLED CAPACITY: 6 650 MW

ESDM untuk Kesejahteraan Rakyat
1. Political supports…
2. Capital & technology….
3. Experiences…
4. Cultures...
5. ….
Energy and Mineral Resources for People’s Welfare
www.esdm.go.id