The Playoffs - NBA.com · The Playoffs 2004-05 Media Guide 187 1985 Playoff Results Eastern...
14
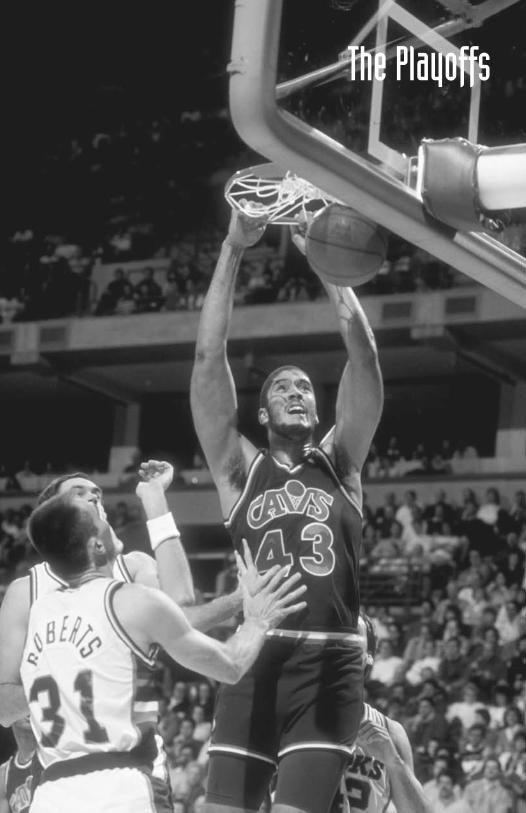
The Playoffs
Transcript of The Playoffs - NBA.com · The Playoffs 2004-05 Media Guide 187 1985 Playoff Results Eastern...
The Playoffs

186 Cleveland Cavaliers
1976 Playoff Results Eastern Conference Semifinals
Date Site W/L Cle Was Series AttendanceApril 13 Cleveland L 95 100 0-1 19,974 April 15 Washington W 80 79 1-1 17,988 April 17 Cleveland W 88 76 2-1 21,061 April 21 Washington L 98 109 2-2 17,542 April 22 Cleveland W 92 91 3-2 21,312 April 26 Washington L 98 102 (OT) 3-3 19,035 April 29 Cleveland W 87 85 4-3 21,564*
Eastern Conference Finals Date Site W/L Cle Bos Series AttendanceMay 6 Boston L 99 111 0-1 14,264 May 9 Boston L 89 94 0-2 12,098 May 11 Cleveland W 83 78 1-2 21,564* May 14 Cleveland W 106 87 2-2 21,564* May 16 Boston L 94 99 2-3 12,951 May 19 Cleveland L 87 94 2-4 21,564* * NBA Playoff Record at the time
Field Goals Free Throws Rebounds PLAYER G MIN FGM FGA PCT FTM FTA PCT OFF DEF REB AST PF DQ STL BLK PTS AVG HIChones 7 242 47 114 .412 11 18 .611 14 36 50 6 23 0 1 6 105 15.0 23Cleamons 13 503 73 184 .397 33 40 .825 23 48 71 61 34 0 8 3 179 13.8 18Russell 13 328 65 161 .404 47 55 .855 25 46 71 14 51 0 8 7 177 13.6 22B. Smith 13 379 71 164 .433 22 25 .880 11 32 43 30 41 1 11 3 164 12.6 27Snyder 13 364 69 153 .451 18 22 .818 10 19 29 31 35 1 11 6 156 12.0 26Carr 13 273 66 138 .478 22 36 .611 11 12 23 26 29 0 6 3 154 11.8 27Brewer 13 489 44 101 .436 26 48 .542 40 100 140 37 34 0 13 12 114 8.8 15Thurmond 13 375 37 79 .468 13 32 .406 38 79 117 28 52 2 6 29 87 6.7 13Walker 13 125 11 27 .407 8 10 .800 5 11 16 23 17 0 7 1 30 2.3 8Witte 7 28 6 11 .545 4 4 1.000 4 5 9 4 4 0 0 0 16 2.3 6Lambert 6 34 5 13 .385 2 2 1.000 2 9 11 1 7 0 1 2 12 2.0 4Garrett 4 5 0 0 --- 2 4 .500 0 0 0 0 0 0 0 0 2 0.5 2Cavaliers 13 3145 494 1145 .431 208 296 .703 183 397 580 261 327 4 72 72 1196 92.0 106Opponents 13 3145 467 1073 .435 271 368 .736 165 434 599 223 316 6 79 67 1205 92.7 111
1977 Playoff Results Eastern Conference First Round
Date Site W/L Cle Was Series AttendanceApril 13 Washington L 100 109 0-1 11,240 April 15 Cleveland W 91 83 1-1 19,545 April 17 Washington L 98 104 1-2 10,488
Field Goals Free Throws Rebounds PLAYER G MIN FGM FGA PCT FTM FTA PCT OFF DEF REB AST PF DQ STL BLK PTS AVG HIRussell 3 100 21 54 .389 11 15 .733 10 16 26 10 10 0 3 1 53 17.7 22Walker 3 95 18 37 .486 11 15 .733 4 8 12 20 12 0 4 1 47 15.7 20E. Smith 3 56 18 33 .545 5 8 .625 6 18 24 1 10 0 5 3 41 13.7 20Chones 3 99 16 27 .593 7 7 1.000 11 20 31 3 9 0 0 1 39 13.0 19Brewer 3 113 11 27 .407 1 1 1.000 11 25 36 5 11 0 4 4 23 7.7 13A. Carr 3 83 11 39 .282 1 3 .333 4 6 10 10 13 0 2 1 23 7.7 8B. Smith 3 57 9 39 .231 3 3 1.000 3 5 8 4 5 0 3 1 21 7.0 10Brokaw 3 44 9 19 .474 2 6 .333 3 1 4 12 7 0 2 1 20 6.7 12Snyder 3 53 8 27 .296 2 5 .400 2 3 5 4 6 0 1 2 18 6.0 9Lambert 3 19 2 4 .500 0 0 --- 2 1 3 0 4 0 2 0 4 1.3 2Thurmond 1 1 0 0 --- 0 0 --- 0 1 1 0 0 0 0 1 0 0.0 0Cavaliers 3 720 123 306 .402 43 63 .683 56 104 160 69 87 0 26 16 289 96.3 100Opponents 3 720 107 248 .431 82 106 .774 30 113 143 56 72 1 15 14 296 98.7 109
1978 Playoff Results Eastern Conference First Round
Date Site W/L Cle NY Series AttendanceApril 12 Cleveland L 114 132 0-1 19,739 April 14 New York L 107 109 0-2 18,965
Field Goals Free Throws Rebounds PLAYER G MIN FGM FGA PCT FTM FTA PCT OFF DEF REB AST PF DQ STL BLK PTS AVG HIRussell 2 88 19 39 .487 17 21 .810 7 8 15 11 9 0 3 1 55 27.5 32A. Carr 2 69 10 27 .370 15 16 .938 3 5 8 5 8 0 2 1 35 17.5 20Furlow 2 50 13 27 .481 6 6 1.000 3 2 5 5 1 0 0 0 32 16.0 20Chones 2 82 13 27 .481 4 8 .500 3 12 15 7 7 0 2 1 30 15.0 17E. Smith 2 56 11 24 .458 3 6 .500 6 13 19 0 9 0 3 3 25 12.5 17Walker 2 70 10 26 .385 5 5 1.000 5 2 7 10 7 0 3 2 25 12.5 16B. Smith 2 34 8 13 .615 0 0 --- 2 1 3 1 2 0 0 0 16 8.0 10Lambert 2 19 1 3 .333 1 2 .500 2 6 8 0 3 0 0 0 3 1.5 3Brewer 1 9 0 1 .000 0 2 .000 0 0 0 0 2 0 0 0 0 0.0 0Snyder 1 3 0 0 --- 0 0 --- 0 0 0 0 0 0 0 0 0 0.0 0Cavaliers 2 480 85 187 .455 51 66 .773 31 49 80 39 48 0 13 8 221 110.5 114Opponents 2 480 101 180 .561 39 50 .780 28 58 86 62 58 0 10 11 241 120.5 132
The Playoffs
2004-05 Media Guide 187
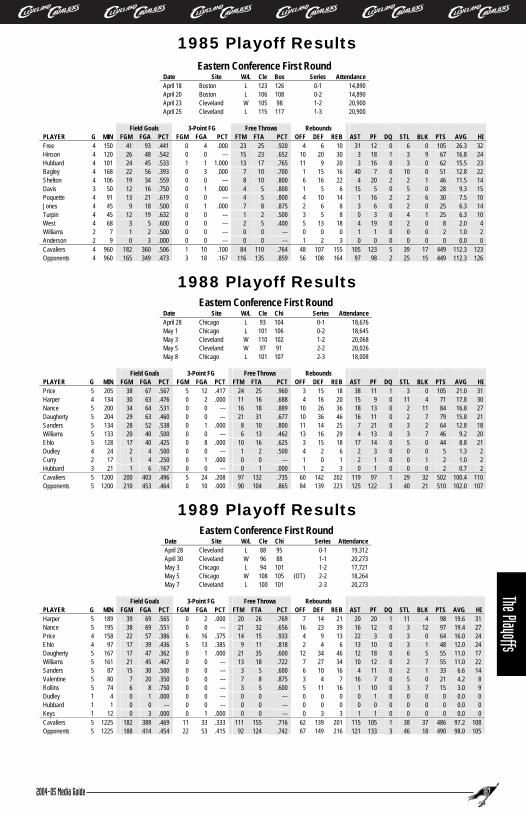
1985 Playoff Results Eastern Conference First Round
Date Site W/L Cle Bos Series Attendance April 18 Boston L 123 126 0-1 14,890 April 20 Boston L 106 108 0-2 14,890 April 23 Cleveland W 105 98 1-2 20,900 April 25 Cleveland L 115 117 1-3 20,900
Field Goals 3-Point FG Free Throws Rebounds PLAYER G MIN FGM FGA PCT FGM FGA PCT FTM FTA PCT OFF DEF REB AST PF DQ STL BLK PTS AVG HI Free 4 150 41 93 .441 0 4 .000 23 25 .920 4 6 10 31 12 0 6 0 105 26.3 32 Hinson 4 120 26 48 .542 0 0 --- 15 23 .652 10 20 30 3 18 1 3 9 67 16.8 24 Hubbard 4 101 24 45 .533 1 1 1.000 13 17 .765 11 9 20 3 16 0 3 0 62 15.5 23 Bagley 4 168 22 56 .393 0 3 .000 7 10 .700 1 15 16 40 7 0 10 0 51 12.8 22 Shelton 4 106 19 34 .559 0 0 --- 8 10 .800 6 16 22 4 20 2 2 1 46 11.5 14 Davis 3 50 12 16 .750 0 1 .000 4 5 .800 1 5 6 15 5 0 5 0 28 9.3 15 Poquette 4 91 13 21 .619 0 0 --- 4 5 .800 4 10 14 1 16 2 2 6 30 7.5 10 Jones 4 45 9 18 .500 0 1 .000 7 8 .875 2 6 8 3 6 0 2 0 25 6.3 14 Turpin 4 45 12 19 .632 0 0 --- 1 2 .500 3 5 8 0 3 0 4 1 25 6.3 10 West 4 68 3 5 .600 0 0 --- 2 5 .400 5 13 18 4 19 0 2 0 8 2.0 4 Williams 2 7 1 2 .500 0 0 --- 0 0 --- 0 0 0 1 1 0 0 0 2 1.0 2 Anderson 2 9 0 3 .000 0 0 --- 0 0 --- 1 2 3 0 0 0 0 0 0 0.0 0 Cavaliers 4 960 182 360 .506 1 10 .100 84 110 .764 48 107 155 105 123 5 39 17 449 112.3 123 Opponents 4 960 165 349 .473 3 18 .167 116 135 .859 56 108 164 97 98 2 25 15 449 112.3 126
1988 Playoff Results Eastern Conference First Round
Date Site W/L Cle Chi Series Attendance April 28 Chicago L 93 104 0-1 18,676 May 1 Chicago L 101 106 0-2 18,645 May 3 Cleveland W 110 102 1-2 20,068 May 5 Cleveland W 97 91 2-2 20,026 May 8 Chicago L 101 107 2-3 18,008
Field Goals 3-Point FG Free Throws Rebounds PLAYER G MIN FGM FGA PCT FGM FGA PCT FTM FTA PCT OFF DEF REB AST PF DQ STL BLK PTS AVG HI Price 5 205 38 67 .567 5 12 .417 24 25 .960 3 15 18 38 11 1 3 0 105 21.0 31 Harper 4 134 30 63 .476 0 2 .000 11 16 .688 4 16 20 15 9 0 11 4 71 17.8 30 Nance 5 200 34 64 .531 0 0 --- 16 18 .889 10 26 36 18 13 0 2 11 84 16.8 27 Daugherty 5 204 29 63 .460 0 0 --- 21 31 .677 10 36 46 16 11 0 2 7 79 15.8 21 Sanders 5 134 28 52 .538 0 1 .000 8 10 .800 11 14 25 7 21 0 3 2 64 12.8 18 Williams 5 133 20 40 .500 0 0 --- 6 13 .462 13 16 29 4 13 0 3 7 46 9.2 20 Ehlo 5 128 17 40 .425 0 8 .000 10 16 .625 3 15 18 17 14 0 5 0 44 8.8 21 Dudley 4 24 2 4 .500 0 0 --- 1 2 .500 4 2 6 2 3 0 0 0 5 1.3 2 Curry 2 17 1 4 .250 0 1 .000 0 0 --- 1 0 1 2 1 0 0 1 2 1.0 2 Hubbard 3 21 1 6 .167 0 0 --- 0 1 .000 1 2 3 0 1 0 0 0 2 0.7 2 Cavaliers 5 1200 200 403 .496 5 24 .208 97 132 .735 60 142 202 119 97 1 29 32 502 100.4 110 Opponents 5 1200 210 453 .464 0 10 .000 90 104 .865 84 139 223 125 122 3 40 21 510 102.0 107
1989 Playoff Results Eastern Conference First Round
Date Site W/L Cle Chi Series AttendanceApril 28 Cleveland L 88 95 0-1 19,312 April 30 Cleveland W 96 88 1-1 20,273 May 3 Chicago L 94 101 1-2 17,721 May 5 Chicago W 108 105 (OT) 2-2 18,264 May 7 Cleveland L 100 101 2-3 20,273
Field Goals 3-Point FG Free Throws Rebounds PLAYER G MIN FGM FGA PCT FGM FGA PCT FTM FTA PCT OFF DEF REB AST PF DQ STL BLK PTS AVG HI Harper 5 189 39 69 .565 0 2 .000 20 26 .769 7 14 21 20 20 1 11 4 98 19.6 31 Nance 5 195 38 69 .551 0 0 --- 21 32 .656 16 23 39 16 12 0 3 12 97 19.4 27 Price 4 158 22 57 .386 6 16 .375 14 15 .933 4 9 13 22 3 0 3 0 64 16.0 24 Ehlo 4 97 17 39 .436 5 13 .385 9 11 .818 2 4 6 13 10 0 3 1 48 12.0 24 Daugherty 5 167 17 47 .362 0 1 .000 21 35 .600 12 34 46 12 18 0 6 5 55 11.0 17 Williams 5 161 21 45 .467 0 0 --- 13 18 .722 7 27 34 10 12 0 2 7 55 11.0 22 Sanders 5 87 15 30 .500 0 0 --- 3 5 .600 6 10 16 4 11 0 2 1 33 6.6 14 Valentine 5 80 7 20 .350 0 0 --- 7 8 .875 3 4 7 16 7 0 5 0 21 4.2 8 Rollins 5 74 6 8 .750 0 0 --- 3 5 .600 5 11 16 1 10 0 3 7 15 3.0 9 Dudley 1 4 0 1 .000 0 0 --- 0 0 --- 0 0 0 0 1 0 0 0 0 0.0 0 Hubbard 1 1 0 0 --- 0 0 --- 0 0 --- 0 0 0 0 0 0 0 0 0 0.0 0 Keys 1 12 0 3 .000 0 1 .000 0 0 --- 0 3 3 1 1 0 0 0 0 0.0 0 Cavaliers 5 1225 182 388 .469 11 33 .333 111 155 .716 62 139 201 115 105 1 38 37 486 97.2 108 Opponents 5 1225 188 414 .454 22 53 .415 92 124 .742 67 149 216 121 133 3 46 18 490 98.0 105

188 Cleveland Cavaliers
1990 Playoff Results Eastern Conference First Round
Date Site W/L Cle Phi Series AttendanceApril 26 Philadelphia L 106 111 0-1 15,319 April 28 Philadelphia L 101 107 0-2 18,168 May 1 Cleveland W 122 95 1-2 16,317 May 3 Cleveland W 108 96 2-2 17,106 May 5 Philadelphia L 97 113 2-3 18,168
Field Goals 3-Point FG Free Throws Rebounds PLAYER G MIN FGM FGA PCT FGM FGA PCT FTM FTA PCT OFF DEF REB AST PF DQ STL BLK PTS AVG HI Daugherty 5 186 41 70 .586 0 0 --- 32 46 .696 4 44 48 20 12 0 2 4 114 22.8 34 Price 5 192 32 61 .525 6 17 .353 30 30 1.000 0 14 14 44 9 0 9 1 100 20.0 27 Williams 5 174 39 70 .557 0 0 --- 17 22 .773 14 32 46 11 23 1 2 5 95 19.0 23 Ehlo 5 196 26 62 .419 5 15 .333 12 19 .632 7 25 32 32 18 0 6 0 69 13.8 25 Nance 5 159 26 45 .578 0 0 --- 9 12 .750 4 20 24 12 20 0 3 10 61 12.2 20 Bennett 5 135 23 47 .489 0 0 --- 4 6 .667 14 7 21 5 11 0 3 1 50 10.0 22 Chievous 3 28 6 10 .600 0 0 --- 7 9 .778 2 1 3 2 2 0 1 0 19 6.3 13 Morton 2 9 2 5 .400 0 0 --- 2 2 1.000 0 0 0 0 1 0 0 0 6 3.0 6 Rollins 3 38 1 3 .333 0 0 --- 6 8 .750 0 8 8 1 7 0 2 1 8 2.7 4 Kerr 5 73 4 14 .286 0 3 .000 0 0 --- 1 5 6 10 6 0 4 0 8 1.6 4 Mokeski 3 10 1 2 .500 0 0 --- 2 2 1.000 0 2 2 0 2 0 1 1 4 1.3 2 Cavaliers 5 1200 201 389 .517 11 35 .314 121 156 .776 46 158 204 137 111 1 33 23 534 106.8 122 Opponents 5 1200 194 420 .462 15 41 .366 119 154 .773 69 137 206 108 111 0 38 28 522 104.4 113
1992 Playoff Results Eastern Conference First Round
Date Site W/L Cle NJ Series AttendanceApril 23 Cleveland W 120 113 1-0 16,512 April 25 Cleveland W 118 96 2-0 20,273 April 28 New Jersey L 104 109 2-1 15,258 April 30 New Jersey W 98 89 3-1 13,071
Eastern Conference Semifinals Date Site W/L Cle Bos Series AttendanceMay 2 Cleveland W 101 76 1-0 17,496 May 4 Cleveland L 98 104 1-1 20,273 May 8 Boston L 107 110 1-2 14,890 May 10 Boston W 114 112 (OT) 2-2 14,890 May 13 Cleveland W 114 98 3-2 20,273 May 15 Boston L 91 122 3-3 14,890 May 17 Cleveland W 122 104 4-3 20,273
Eastern Conference Finals Date Site W/L Cle Chi Series AttendanceMay 19 Chicago L 89 103 0-1 18,676 May 21 Chicago W 107 81 1-1 18,676 May 23 Cleveland L 96 105 1-2 20,273 May 25 Cleveland W 99 85 2-2 20,273 May 27 Chicago L 89 112 2-3 18,676 May 29 Cleveland L 94 99 2-4 20,273
Field Goals 3-Point FG Free Throws Rebounds PLAYER G MIN FGM FGA PCT FGM FGA PCT FTM FTA PCT OFF DEF REB AST PF DQ STL BLK PTS AVG HI Daugherty 17 687 124 235 .528 0 1 .000 118 145 .814 37 137 174 58 47 0 11 17 366 21.5 40 Price 17 603 118 238 .496 25 69 .362 66 73 .904 10 32 42 128 34 0 24 4 327 19.2 35 Nance 17 681 124 251 .494 0 1 .000 58 70 .829 45 112 157 43 56 1 14 46 306 18.0 32 Williams 17 567 84 154 .545 0 0 --- 87 109 .798 50 80 130 42 58 2 24 17 255 15.0 20 Ehlo 17 552 63 152 .414 21 51 .412 16 21 .762 22 55 77 77 40 0 21 5 163 9.6 21 Sanders 17 418 56 115 .487 1 3 .333 17 21 .810 20 35 55 37 62 0 15 12 130 7.6 17 Battle 15 202 34 82 .415 0 2 .000 21 23 .913 4 8 12 15 11 0 5 1 89 5.9 14 Brandon 12 157 22 55 .400 0 3 .000 3 4 .750 4 18 22 30 17 0 3 1 47 3.9 6 Kerr 12 149 18 41 .439 3 11 .273 5 5 1.000 1 5 6 10 12 0 5 0 44 3.7 9 Phills 5 12 4 9 .444 0 1 .000 3 4 --- 2 4 6 5 1 0 1 0 11 2.2 4 Ferry 9 55 7 15 .467 1 3 .333 4 4 --- 7 9 16 1 7 0 1 1 19 2.1 8 James 8 22 1 10 .100 0 3 .000 2 4 .500 1 1 2 2 2 0 1 0 4 0.5 4 Cavaliers 17 4105 655 1357 .483 51 148 .345 400 483 .828 203 496 699 448 347 3 125 104 1761 103.6 122 Opponents 17 4105 710 1496 .475 26 94 .277 272 361 .753 246 456 702 407 395 4 143 109 1718 101.1 122
1993 Playoff Results Eastern Conference First Round
Date Site W/L Cle NJ Series AttendanceApril 29 Cleveland W 114 98 1-0 18,339 May 1 Cleveland L 99 101 1-1 20,273 May 5 New Jersey W 93 84 2-1 16,453 May 7 New Jersey L 79 96 2-2 15,238 May 9 Cleveland W 99 89 3-2 17,388
Eastern Conference Semifinals Date Site W/L Cle Chi Series AttendanceMay 11 Chicago L 84 91 0-1 18,676 May 13 Chicago L 85 104 0-2 18,676 May 15 Cleveland L 90 96 0-3 20,273 May 17 Cleveland L 101 103 0-4 20,273
Field Goals 3-Point FG Free Throws Rebounds PLAYER G MIN FGM FGA PCT FGM FGA PCT FTM FTA PCT OFF DEF REB AST PF DQ STL BLK PTS AVG HI Daugherty 9 356 64 115 .557 0 0 --- 40 50 .800 26 79 105 31 25 1 6 7 168 18.7 29 Nance 9 329 61 108 .565 0 0 --- 23 30 .767 35 39 74 21 33 1 8 14 145 16.1 24 Price 9 288 43 97 .443 8 26 .308 23 24 .958 1 18 19 55 13 0 15 0 117 13.0 18 Ehlo 9 289 38 91 .418 10 26 .385 12 15 .800 10 21 31 25 19 0 12 4 98 10.9 22 Wilkins 9 236 38 87 .437 4 12 .333 13 17 .765 6 10 16 24 16 0 9 2 93 10.3 22 Williams 9 237 30 75 .400 0 0 --- 21 28 .750 12 29 41 17 26 1 5 14 81 9.0 16 Brandon 8 132 20 46 .435 2 5 .400 9 9 1.000 4 13 17 17 6 0 7 3 51 6.4 13 Sanders 8 145 20 48 .417 0 2 .000 6 10 .600 8 10 18 10 17 0 8 1 46 5.8 12 Ferry 8 118 13 34 .382 4 9 .444 9 10 .900 4 21 25 14 14 0 4 3 39 4.9 10 Phills 2 9 1 3 .333 0 0 --- 2 2 1.000 0 0 0 0 0 0 0 0 4 2.0 4 Guidinger 4 15 1 3 .333 0 0 --- 0 2 .000 1 0 1 0 1 0 0 1 2 0.5 2 Battle 1 6 0 1 .000 0 0 --- 0 0 --- 0 1 1 1 2 0 0 0 0 0.0 0 Cavaliers 9 2160 329 708 .465 28 80 .350 158 197 .802 107 241 348 215 172 3 74 49 844 93.8 114 Opponents 9 2160 349 717 .487 22 65 .338 142 184 .772 107 247 354 200 193 0 78 46 862 95.8 104
1994 Playoff Results Eastern Conference First Round
Date Site W/L Cle Chi Series AttendanceApril 29 Chicago L 96 104 0-1 18,676 May 1 Chicago L 96 105 0-2 18,676 May 3 Cleveland L 92 95 (OT) 0-3 17,778
Field Goals 3-Point FG Free Throws Rebounds PLAYER G MIN FGM FGA PCT FGM FGA PCT FTM FTA PCT OFF DEF REB AST PF DQ STL BLK PTS AVG HI Wilkins 3 126 20 45 .444 7 16 .438 14 16 .875 3 10 13 10 6 0 3 0 61 20.3 28 Mills 3 112 19 38 .500 4 5 .800 9 11 .818 10 13 23 8 9 0 7 1 51 17.0 25 Price 3 102 15 43 .349 2 9 .222 13 14 .929 1 5 6 14 6 0 4 0 45 15.0 22 Hill 3 123 11 27 .407 0 0 --- 20 37 .541 14 17 31 4 14 1 1 1 42 14.0 16 Brandon 3 56 12 19 .632 0 0 --- 2 3 .667 1 3 4 5 1 0 1 0 26 8.7 11 Kempton 3 89 10 25 .400 0 0 --- 6 6 1.000 10 6 16 8 9 0 3 0 26 8.7 16 Phills 3 68 9 24 .375 1 1 1.000 1 2 .500 5 9 14 7 11 0 2 0 20 6.7 11 Higgins 3 57 4 11 .364 2 7 .286 1 2 .500 2 2 4 4 10 0 1 1 11 3.7 5 Battle 1 8 1 1 1.000 0 0 --- 0 0 --- 0 2 2 0 0 0 0 0 2 2.0 2 Ferry 1 4 0 0 --- 0 0 --- 0 0 --- 0 0 0 1 1 0 0 0 0 0.0 0 Cavaliers 3 745 101 233 .433 16 38 .421 66 91 .725 46 67 113 61 67 1 22 3 284 94.7 96 Opponents 3 745 115 228 .504 9 23 .391 65 86 .756 42 82 124 68 74 0 24 20 304 101.3 105
1995 Playoff Results Eastern Conference First Round
Date Site W/L Cle NY Series AttendanceApril 27 New York L 79 103 0-1 19,763 April 29 New York W 90 84 1-1 19,763 May 1 Cleveland L 81 83 1-2 19,352 May 4 Cleveland L 80 93 1-3 18,575
Field Goals 3-Point FG Free Throws Rebounds PLAYER G MIN FGM FGA PCT FGM FGA PCT FTM FTA PCT OFF DEF REB AST PF DQ STL BLK PTS AVG HI Price 4 143 12 40 .300 4 17 .235 32 33 .970 2 10 12 26 5 0 6 0 60 15.0 21 Phills 4 146 19 43 .442 4 7 .571 15 20 .750 3 9 12 6 8 0 9 0 57 14.3 21 Mills 4 139 20 37 .541 8 14 .571 5 5 1.000 2 14 16 11 18 1 3 2 53 13.3 21 Ferry 4 67 13 25 .520 8 15 .533 4 6 .667 0 3 3 6 9 0 2 0 38 9.5 20 Hill 4 139 9 29 .310 0 1 .000 16 25 .640 8 15 23 3 18 1 7 1 34 8.5 13 Williams 4 144 12 42 .286 0 1 .000 3 8 .375 3 22 25 11 11 0 9 3 27 6.8 10 Roberts 1 7 3 4 .750 0 0 --- 0 2 .000 1 1 2 0 0 0 0 0 6 6.0 6 Campbell 4 37 6 14 .429 1 2 .500 10 12 .833 1 1 2 1 3 0 1 1 23 5.8 13 Cage 4 81 8 18 .444 0 1 .000 0 2 .000 8 10 18 3 9 0 2 4 16 4.0 8 Colter 4 43 5 10 .500 0 1 .000 2 4 .500 1 0 1 2 2 0 1 0 12 3.0 5 Battle 2 7 2 3 .667 0 1 .000 0 0 --- 0 0 0 1 1 0 0 0 4 2.0 4 Dreiling 1 7 0 2 .000 0 0 --- 0 0 --- 0 1 1 0 2 0 0 0 0 0.0 0 Cavaliers 4 960 109 267 .408 25 60 .417 87 117 .744 29 86 115 70 86 2 40 11 330 82.5 90 Opponents 4 960 136 262 .519 26 67 .388 65 91 .714 35 121 156 95 105 0 27 27 363 90.8 103
The Playoffs
2004-05 Media Guide 189
190 Cleveland Cavaliers
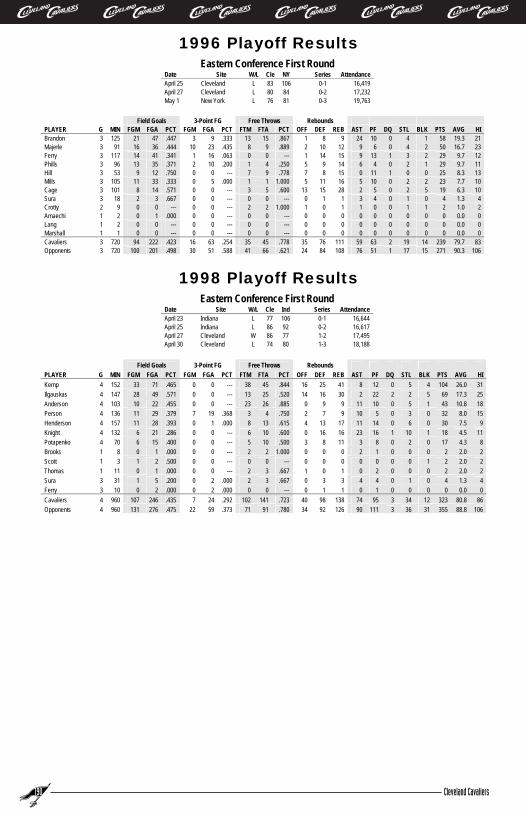
1996 Playoff Results Eastern Conference First Round
Date Site W/L Cle NY Series Attendance April 25 Cleveland L 83 106 0-1 16,419 April 27 Cleveland L 80 84 0-2 17,232 May 1 New York L 76 81 0-3 19,763
Field Goals 3-Point FG Free Throws Rebounds PLAYER G MIN FGM FGA PCT FGM FGA PCT FTM FTA PCT OFF DEF REB AST PF DQ STL BLK PTS AVG HI Brandon 3 125 21 47 .447 3 9 .333 13 15 .867 1 8 9 24 10 0 4 1 58 19.3 21 Majerle 3 91 16 36 .444 10 23 .435 8 9 .889 2 10 12 9 6 0 4 2 50 16.7 23 Ferry 3 117 14 41 .341 1 16 .063 0 0 --- 1 14 15 9 13 1 3 2 29 9.7 12 Phills 3 96 13 35 .371 2 10 .200 1 4 .250 5 9 14 6 4 0 2 1 29 9.7 11 Hill 3 53 9 12 .750 0 0 --- 7 9 .778 7 8 15 0 11 1 0 0 25 8.3 13 Mills 3 105 11 33 .333 0 5 .000 1 1 1.000 5 11 16 5 10 0 2 2 23 7.7 10 Cage 3 101 8 14 .571 0 0 --- 3 5 .600 13 15 28 2 5 0 2 5 19 6.3 10 Sura 3 18 2 3 .667 0 0 --- 0 0 --- 0 1 1 3 4 0 1 0 4 1.3 4 Crotty 2 9 0 0 --- 0 0 --- 2 2 1.000 1 0 1 1 0 0 1 1 2 1.0 2 Amaechi 1 2 0 1 .000 0 0 --- 0 0 --- 0 0 0 0 0 0 0 0 0 0.0 0 Lang 1 2 0 0 --- 0 0 --- 0 0 --- 0 0 0 0 0 0 0 0 0 0.0 0 Marshall 1 1 0 0 --- 0 0 --- 0 0 --- 0 0 0 0 0 0 0 0 0 0.0 0 Cavaliers 3 720 94 222 .423 16 63 .254 35 45 .778 35 76 111 59 63 2 19 14 239 79.7 83 Opponents 3 720 100 201 .498 30 51 .588 41 66 .621 24 84 108 76 51 1 17 15 271 90.3 106
1998 Playoff Results Eastern Conference First Round
Date Site W/L Cle Ind Series Attendance April 23 Indiana L 77 106 0-1 16,644 April 25 Indiana L 86 92 0-2 16,617 April 27 Cleveland W 86 77 1-2 17,495 April 30 Cleveland L 74 80 1-3 18,188
Field Goals 3-Point FG Free Throws Rebounds PLAYER G MIN FGM FGA PCT FGM FGA PCT FTM FTA PCT OFF DEF REB AST PF DQ STL BLK PTS AVG HI Kemp 4 152 33 71 .465 0 0 --- 38 45 .844 16 25 41 8 12 0 5 4 104 26.0 31 Ilgauskas 4 147 28 49 .571 0 0 --- 13 25 .520 14 16 30 2 22 2 2 5 69 17.3 25 Anderson 4 103 10 22 .455 0 0 --- 23 26 .885 0 9 9 11 10 0 5 1 43 10.8 18 Person 4 136 11 29 .379 7 19 .368 3 4 .750 2 7 9 10 5 0 3 0 32 8.0 15 Henderson 4 157 11 28 .393 0 1 .000 8 13 .615 4 13 17 11 14 0 6 0 30 7.5 9 Knight 4 132 6 21 .286 0 0 --- 6 10 .600 0 16 16 23 16 1 10 1 18 4.5 11 Potapenko 4 70 6 15 .400 0 0 --- 5 10 .500 3 8 11 3 8 0 2 0 17 4.3 8 Brooks 1 8 0 1 .000 0 0 --- 2 2 1.000 0 0 0 2 1 0 0 0 2 2.0 2 Scott 1 3 1 2 .500 0 0 --- 0 0 --- 0 0 0 0 0 0 0 1 2 2.0 2 Thomas 1 11 0 1 .000 0 0 --- 2 3 .667 1 0 1 0 2 0 0 0 2 2.0 2 Sura 3 31 1 5 .200 0 2 .000 2 3 .667 0 3 3 4 4 0 1 0 4 1.3 4 Ferry 3 10 0 2 .000 0 2 .000 0 0 --- 0 1 1 0 1 0 0 0 0 0.0 0 Cavaliers 4 960 107 246 .435 7 24 .292 102 141 .723 40 98 138 74 95 3 34 12 323 80.8 86 Opponents 4 960 131 276 .475 22 59 .373 71 91 .780 34 92 126 90 111 3 36 31 355 88.8 106

All-Time Cleveland Cavaliers Playoff Statistics Field Goals 3-Point FG Free Throws Rebounds
PLAYER G MIN FGM FGA PCT FGM FGA PCT FTM FTA PCT OFF DEF REB AST PF DQ STL TO BLK PTS AVG HI PRICE 47 1691 280 603 .464 56 166 .337 202 214 .944 21 103 124 327 81 1 64 158 5 818 17.4 35 DAUGHERTY 41 1600 275 530 .519 0 2 .000 232 307 .756 89 330 419 137 113 1 27 98 40 782 19.1 40 NANCE 41 1564 283 537 .527 0 1 .000 127 162 .784 110 220 330 110 134 2 30 59 93 693 16.9 32 J. WILLIAMS 45 1416 206 426 .484 0 1 .000 147 198 .742 99 206 305 95 143 4 45 74 53 559 12.4 23 EHLO 40 1262 161 384 .419 41 113 .363 59 82 .720 44 120 164 164 101 0 47 64 10 422 10.6 25 RUSSELL 18 516 105 254 .413 0 0 --- 75 91 .824 42 70 112 35 70 0 14 10 9 285 15.8 32 SANDERS 35 784 119 245 .486 1 6 .167 34 46 .739 45 69 114 58 111 0 28 47 16 273 7.8 18 A. CARR 18 425 87 204 .426 0 0 --- 38 55 .691 18 23 41 41 50 0 10 4 5 212 11.8 27 B. SMITH 18 470 88 216 .407 0 0 --- 25 28 .893 16 38 54 35 48 1 14 1 4 201 11.2 27 BRANDON 26 470 75 167 .449 5 17 .294 27 31 .871 10 42 52 76 34 0 15 37 5 182 7.0 21 CLEAMONS 13 503 73 184 .397 0 0 --- 33 40 .825 23 48 71 61 34 0 8 0 3 179 13.8 18 CHONES 12 423 76 168 .452 0 0 --- 22 33 .667 28 68 96 16 39 0 3 4 8 174 14.5 23 SNYDER 17 420 77 180 .428 0 0 --- 20 27 .741 12 22 34 35 41 1 12 1 8 174 10.2 26 HARPER 9 323 69 132 .523 0 4 .000 31 42 .738 11 30 41 35 29 1 22 18 8 169 18.8 31 WILKINS 12 362 58 132 .439 11 28 .393 27 33 .818 9 20 29 34 22 0 12 14 2 154 12.8 28 J. BREWER 17 611 55 129 .426 0 0 --- 27 51 .529 51 125 176 42 47 0 17 0 16 137 8.1 15 MILLS 10 356 50 108 .463 12 24 .500 15 17 .882 17 38 55 24 37 1 12 14 5 127 12.7 25 FERRY 28 371 47 117 .402 14 45 .311 17 20 .850 12 48 60 31 45 1 10 14 6 125 4.5 20 PHILLS 17 331 46 114 .404 7 19 .368 22 32 .688 15 31 46 24 24 0 14 22 1 121 7.1 21 FREE 4 150 41 93 .441 0 4 .000 23 25 .920 4 6 10 31 12 0 6 6 0 105 26.3 32 KEMP 4 152 33 71 .465 0 0 --- 38 45 .844 16 25 41 8 12 0 5 16 4 104 26.0 31 WALKER 18 290 39 90 .433 0 0 --- 24 30 .800 14 21 35 53 36 0 14 6 4 102 5.7 20 HILL 10 315 29 68 .426 0 1 .000 43 71 .606 29 40 69 7 43 3 8 21 2 101 10.1 16 BATTLE 19 223 37 87 .425 0 3 .000 21 23 .913 4 11 15 17 14 0 5 20 1 95 5.0 14 THURMOND 14 376 37 79 .468 0 0 --- 13 32 .406 38 80 118 28 52 2 6 0 30 87 6.2 13 ILGAUSKAS 4 147 28 49 .571 0 0 --- 13 25 .520 14 16 30 2 22 2 2 10 5 69 17.3 25 HINSON 4 120 26 48 .542 0 0 --- 15 23 .652 10 20 30 3 18 1 3 8 9 67 16.8 24 E. SMITH 5 112 29 57 .509 0 0 --- 8 14 .571 12 31 43 1 19 0 8 5 6 66 13.2 20 HUBBARD 8 123 25 51 .490 1 1 1.000 13 18 .722 12 11 23 3 17 0 3 8 0 64 8.0 23 KERR 17 222 22 55 .400 3 14 .214 5 5 1.000 2 10 12 20 18 0 9 6 0 52 3.1 9 BAGLEY 4 168 22 56 .393 0 3 .000 7 10 .700 1 15 16 40 7 0 10 17 0 51 12.8 22 MAJERLE 3 91 16 36 .444 10 23 .435 8 9 .889 2 10 12 9 6 0 4 3 2 50 16.7 23 W. BENNETT 5 135 23 47 .489 0 0 --- 4 6 .667 14 7 21 5 11 0 3 4 1 50 10.0 22 SHELTON 4 106 19 34 .559 0 0 --- 8 10 .800 6 16 22 4 20 2 2 6 1 46 11.5 14 D. ANDERSON 4 103 10 22 .455 0 0 --- 23 26 .885 0 9 9 11 10 0 5 12 1 43 10.8 18 CAGE 7 182 16 32 .500 0 1 .000 3 7 .429 21 25 46 5 14 0 4 1 9 35 5.0 10 FURLOW 2 50 13 27 .481 0 0 --- 6 6 1.000 3 2 5 5 1 0 0 3 0 32 16.0 20 PERSON 4 136 11 29 .379 7 19 .368 3 4 .750 2 7 9 10 5 0 3 1 0 32 8.0 15 HENDERSON 4 157 11 28 .393 0 1 .000 8 13 .615 4 13 17 11 14 0 6 13 0 30 7.5 9 POQUETTE 4 91 13 21 .619 0 0 --- 4 5 .800 4 10 14 1 16 2 2 4 6 30 7.5 10 J. DAVIS 3 50 12 16 .750 0 1 .000 4 5 .800 1 5 6 15 5 0 5 2 0 28 9.3 15 KEMPTON 3 89 10 25 .400 0 0 --- 6 6 1.000 10 6 16 8 9 0 3 4 0 26 8.7 16 E. JONES 4 45 9 18 .500 0 1 .000 7 8 .875 2 6 8 3 6 0 2 2 0 25 6.3 14 TURPIN 4 45 12 19 .632 0 0 --- 1 2 .500 3 5 8 0 3 0 4 5 1 25 6.3 10 CAMPBELL 4 37 6 14 .429 1 2 .500 10 12 .833 1 1 2 1 3 0 1 3 1 23 5.8 13 ROLLINS 8 112 7 11 .636 0 0 --- 9 13 .692 5 19 24 2 17 0 5 4 8 23 2.9 9 VALENTINE 5 80 7 20 .350 0 0 --- 7 8 .875 3 4 7 16 7 0 5 5 0 21 4.2 8 BROKAW 3 44 9 19 .474 0 0 --- 2 6 .333 3 1 4 12 7 0 2 0 1 20 6.7 12 CHIEVOUS 3 28 6 10 .600 0 0 --- 7 9 .778 2 1 3 2 2 0 1 3 0 19 6.3 13 LAMBERT 11 72 8 20 .400 0 0 --- 3 4 .750 6 16 22 1 14 0 3 0 2 19 1.7 4 KNIGHT 4 132 6 21 .286 0 0 --- 6 10 .600 0 16 16 23 16 1 10 8 1 18 4.5 11 POTAPENKO 4 70 6 15 .400 0 0 --- 5 10 .500 3 8 11 3 8 0 2 6 0 17 4.3 8 WITTE 7 28 6 11 .545 0 0 --- 4 4 1.000 4 5 9 4 4 0 0 0 0 16 2.3 6 COLTER 4 43 5 10 .500 0 1 .000 2 4 .500 1 0 1 2 2 0 1 0 0 12 3.0 5 HIGGINS 3 57 4 11 .364 2 7 .286 1 2 .500 2 2 4 4 10 0 1 3 1 11 3.7 5 WEST 4 68 3 5 .600 0 0 --- 2 5 .400 5 13 18 4 19 0 2 5 0 8 2.0 4 SURA 6 49 3 8 .375 0 2 .000 2 3 .667 0 4 4 7 8 0 2 6 0 8 1.3 4 ROBERTS 1 7 3 4 .750 0 0 --- 0 2 .00 1 1 2 0 0 0 0 1 0 6 6.0 6 MORTON 2 9 2 5 .400 0 0 --- 2 2 1.000 0 0 0 0 1 0 0 1 0 6 3.0 6 DUDLEY 5 28 2 5 .400 0 0 --- 1 2 .500 4 2 6 2 4 0 0 2 0 5 1.0 2 MOKESKI 3 10 1 2 .500 0 0 --- 2 2 1.000 0 2 2 0 2 0 1 0 1 4 1.3 2 JAMES 8 22 1 10 .100 0 3 .000 2 4 .500 1 1 2 2 2 0 1 1 0 4 0.5 4 BROOKS 1 8 0 1 .000 0 0 --- 2 2 1.000 0 0 0 2 1 0 0 0 0 2 2.0 2 SCOTT 1 3 1 2 .500 0 0 --- 0 0 --- 0 0 0 0 0 0 0 1 1 2 2.0 2 THOMAS 1 11 0 1 .000 0 0 --- 2 3 .667 1 0 1 0 2 0 0 0 0 2 2.0 2 CROTTY 2 9 0 0 --- 0 0 --- 2 2 1.000 1 0 1 1 0 0 1 1 1 2 1.0 2 CURRY 2 17 1 4 .250 0 1 .000 0 0 --- 1 0 1 2 1 0 0 0 1 2 1.0 2 K. WILLIAMS 2 7 1 2 .500 0 0 --- 0 0 --- 0 0 0 1 1 0 0 0 0 2 1.0 2 GARRETT 4 5 0 0 --- 0 0 --- 2 4 .500 0 0 0 0 0 0 0 0 0 2 0.5 2 GUIDINGER 4 15 1 3 .333 0 0 --- 0 2 .000 1 0 1 0 1 0 0 2 1 2 0.5 2 AMAECHI 1 2 0 1 .000 0 0 --- 0 0 --- 0 0 0 0 0 0 0 0 0 0 0.0 0 R. ANDERSON 2 9 0 3 .000 0 0 --- 0 0 --- 1 2 3 0 0 0 0 0 0 0 0.0 0 DREILING 1 7 0 2 .000 0 0 --- 0 0 --- 0 1 1 0 2 0 0 0 0 0 0.0 0 KEYS 1 12 0 3 .000 0 1 .000 0 0 --- 0 3 3 1 1 0 0 2 0 0 0.0 0 LANG 1 2 0 0 --- 0 0 --- 0 0 --- 0 0 0 0 0 0 0 0 0 0 0.0 0 MARSHALL 1 1 0 0 --- 0 0 --- 0 0 --- 0 0 0 0 0 0 0 0 0 0 0.0 0 TEAM TOTAL 77 16889 2582 5608 .460 115 349 .330 1361 1838 .740 925 2057 2982 1445 1647 25 500 903 393 6640 86.2 123 OPP. TOTAL 77 18580 2973 6319 .470 175 481 .364 1465 1920 .763 987 2220 3207 1728 1839 22 576 874 422 7586 98.5 132
The Playoffs
2004-05 Media Guide 191
192 Cleveland Cavaliers
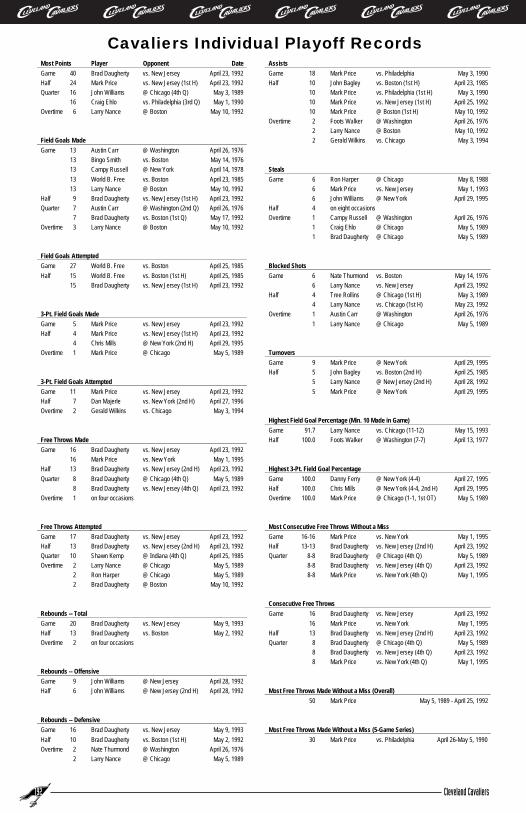
Cavaliers Individual Playoff Records Most Points Player Opponent Date Assists Game 40 Brad Daugherty vs. New Jersey April 23, 1992 Game 18 Mark Price vs. Philadelphia May 3, 1990 Half 24 Mark Price vs. New Jersey (1st H) April 23, 1992 Half 10 John Bagley vs. Boston (1st H) April 23, 1985 Quarter 16 John Williams @ Chicago (4th Q) May 3, 1989 10 Mark Price vs. Philadelphia (1st H) May 3, 1990
16 Craig Ehlo vs. Philadelphia (3rd Q) May 1, 1990 10 Mark Price vs. New Jersey (1st H) April 25, 1992 Overtime 6 Larry Nance @ Boston May 10, 1992 10 Mark Price @ Boston (1st H) May 10, 1992
Overtime 2 Foots Walker @ Washington April 26, 1976 2 Larry Nance @ Boston May 10, 1992
Field Goals Made 2 Gerald Wilkins vs. Chicago May 3, 1994 Game 13 Austin Carr @ Washington April 26, 1976
13 Bingo Smith vs. Boston May 14, 1976 13 Campy Russell @ New York April 14, 1978 Steals 13 World B. Free vs. Boston April 23, 1985 Game 6 Ron Harper @ Chicago May 8, 1988 13 Larry Nance @ Boston May 10, 1992 6 Mark Price vs. New Jersey May 1, 1993
Half 9 Brad Daugherty vs. New Jersey (1st H) April 23, 1992 6 John Williams @ New York April 29, 1995 Quarter 7 Austin Carr @ Washington (2nd Q) April 26, 1976 Half 4 on eight occasions
7 Brad Daugherty vs. Boston (1st Q) May 17, 1992 Overtime 1 Campy Russell @ Washington April 26, 1976 Overtime 3 Larry Nance @ Boston May 10, 1992 1 Craig Ehlo @ Chicago May 5, 1989
1 Brad Daugherty @ Chicago May 5, 1989
Field Goals Attempted Game 27 World B. Free vs. Boston April 25, 1985 Blocked ShotsHalf 15 World B. Free vs. Boston (1st H) April 25, 1985 Game 6 Nate Thurmond vs. Boston May 14, 1976
15 Brad Daugherty vs. New Jersey (1st H) April 23, 1992 6 Larry Nance vs. New Jersey April 23, 1992 Half 4 Tree Rollins @ Chicago (1st H) May 3, 1989
4 Larry Nance vs. Chicago (1st H) May 23, 1992 3-Pt. Field Goals Made Overtime 1 Austin Carr @ Washington April 26, 1976 Game 5 Mark Price vs. New Jersey April 23, 1992 1 Larry Nance @ Chicago May 5, 1989 Half 4 Mark Price vs. New Jersey (1st H) April 23, 1992
4 Chris Mills @ New York (2nd H) April 29, 1995 Overtime 1 Mark Price @ Chicago May 5, 1989 Turnovers
Game 9 Mark Price @ New York April 29, 1995 Half 5 John Bagley vs. Boston (2nd H) April 25, 1985
3-Pt. Field Goals Attempted 5 Larry Nance @ New Jersey (2nd H) April 28, 1992 Game 11 Mark Price vs. New Jersey April 23, 1992 5 Mark Price @ New York April 29, 1995 Half 7 Dan Majerle vs. New York (2nd H) April 27, 1996 Overtime 2 Gerald Wilkins vs. Chicago May 3, 1994
Highest Field Goal Percentage (Min. 10 Made in Game) Game 91.7 Larry Nance vs. Chicago (11-12) May 15, 1993
Free Throws Made Half 100.0 Foots Walker @ Washington (7-7) April 13, 1977 Game 16 Brad Daugherty vs. New Jersey April 23, 1992
16 Mark Price vs. New York May 1, 1995 Half 13 Brad Daugherty vs. New Jersey (2nd H) April 23, 1992 Highest 3-Pt. Field Goal Percentage Quarter 8 Brad Daugherty @ Chicago (4th Q) May 5, 1989 Game 100.0 Danny Ferry @ New York (4-4) April 27, 1995
8 Brad Daugherty vs. New Jersey (4th Q) April 23, 1992 Half 100.0 Chris Mills @ New York (4-4, 2nd H) April 29, 1995 Overtime 1 on four occasions Overtime 100.0 Mark Price @ Chicago (1-1, 1st OT) May 5, 1989
Free Throws Attempted Most Consecutive Free Throws Without a MissGame 17 Brad Daugherty vs. New Jersey April 23, 1992 Game 16-16 Mark Price vs. New York May 1, 1995 Half 13 Brad Daugherty vs. New Jersey (2nd H) April 23, 1992 Half 13-13 Brad Daugherty vs. New Jersey (2nd H) April 23, 1992Quarter 10 Shawn Kemp @ Indiana (4th Q) April 25, 1985 Quarter 8-8 Brad Daugherty @ Chicago (4th Q) May 5, 1989 Overtime 2 Larry Nance @ Chicago May 5, 1989 8-8 Brad Daugherty vs. New Jersey (4th Q) April 23, 1992
2 Ron Harper @ Chicago May 5, 1989 8-8 Mark Price vs. New York (4th Q) May 1, 1995 2 Brad Daugherty @ Boston May 10, 1992
Consecutive Free Throws Rebounds -- Total Game 16 Brad Daugherty vs. New Jersey April 23, 1992 Game 20 Brad Daugherty vs. New Jersey May 9, 1993 16 Mark Price vs. New York May 1, 1995 Half 13 Brad Daugherty vs. Boston May 2, 1992 Half 13 Brad Daugherty vs. New Jersey (2nd H) April 23, 1992 Overtime 2 on four occasions Quarter 8 Brad Daugherty @ Chicago (4th Q) May 5, 1989
8 Brad Daugherty vs. New Jersey (4th Q) April 23, 1992 8 Mark Price vs. New York (4th Q) May 1, 1995
Rebounds -- Offensive Game 9 John Williams @ New Jersey April 28, 1992 Half 6 John Williams @ New Jersey (2nd H) April 28, 1992 Most Free Throws Made Without a Miss (Overall)
50 Mark Price May 5, 1989 - April 25, 1992
Rebounds -- Defensive Game 16 Brad Daugherty vs. New Jersey May 9, 1993 Most Free Throws Made Without a Miss (5-Game Series) Half 10 Brad Daugherty vs. Boston (1st H) May 2, 1992 30 Mark Price vs. Philadelphia April 26-May 5, 1990 Overtime 2 Nate Thurmond @ Washington April 26, 1976
2 Larry Nance @ Chicago May 5, 1989

Opponents Individual Playoff Records Most Points Player Opponent Date Assists Player Opponent Date Game 55 Michael Jordan @ Chicago May 1, 1988 Game 17 Mark Jackson vs. Indiana April 27, 1998 Half 30 Michael Jordan @ Chicago (2nd H) May 3, 1989 Half 10 Johnny Dawkins @ Philadelphia (2nd H) May 5, 1990
30 Michael Jordan vs. Chicago (2nd H) May 7, 1989 10 Larry Bird @ Boston (1st H) May 15, 1992 Quarter 20 Michael Jordan @ Chicago (2nd Q) April 28, 1988 10 Toni Kukoc @ Chicago May 1, 1994 Overtime 4 Phil Chenier @ Washington April 26, 1976 Overtime 1 Scottie Pippen @ Chicago May 5, 1989
4 Elvin Hayes @ Washington April 26, 1976 1 Horace Grant @ Chicago May 5, 1989
Field Goals Made Steals Game 24 Michael Jordan @ Chicago May 1, 1988 Game 5 Michael Jordan @ Chicago May 3, 1989 Half 14 Michael Jordan @ Chicago (1st H) May 1, 1988 5 Mookie Blaylock @ New Jersey April 30, 1992 Quarter 9 Michael Jordan @ Chicago (3rd Q) May 5, 1989 5 Reggie Lewis @ Boston May 10, 1992 Overtime 1 on nine occasions Half 4 Jo Jo White @ Boston (2nd H) May 6, 1976
4 Michael Jordan vs. Chicago (1st H) April 28, 1989 4 Mookie Blaylock vs. New Jersey (2nd H) April 30, 1992
Overtime 1 on three occasions Field Goals Attempted Game 45 Michael Jordan @ Chicago May 1, 1988 Half 25 Michael Jordan @ Chicago (1st H) May 1, 1988
Blocked ShotsGame 9 Derrick Coleman @ New Jersey May 7, 1993 Half 8 Derrick Coleman @ New Jersey May 7, 1993
3-Pt. Field Goals Made Overtime 2 Luc Longley vs. Chicago May 3, 1994 Game 7 Derek Harper vs. New York May 4, 1995 Half 5 Hubert Davis vs. New York (2nd H) April 25, 1996
Turnovers Game 8 Scottie Pippen vs. Chicago May 3, 1994
3-Pt. Field Goals Attempted 8 Reggie Miller vs. Indiana April 30, 1998 Game 10 John Starks @ New York April 29, 1995 Half 6 Michael Jordan @ Chicago (2nd H) May 8, 1988
10 Derek Harper vs. New York May 4, 1995 6 Reggie Miller vs. Indiana (2nd H) April 30, 1998 Half 6 John Starks @ New York April 29, 1995
6 Derek Harper vs. New York May 4, 1995 6 Hubert Davis vs. New York April 25, 1996
Overtime 1 on three occasions Highest Field Goal Percentage (Min. 10 Made in Game) Game 85.7 Chris Morris @ New Jersey (12-14) April 28, 1992 Half 100.0 Chris Morris @ New Jersey (8-8, 1st H) April 28, 1992
Free Throws Made Game 22 Michael Jordan @ Chicago May 5, 1989 Half 13 Michael Jordan @ Chicago (1st H) May 5, 1989 Most Consecutive 3-Pointers Without a MissQuarter 8 Michael Jordan @ Chicago (2nd Q) May 8, 1988 Game 4-4 Scottie Pippen vs. Chicago April 28, 1989 Overtime 2 on five occasions Half 3-3 Scottie Pippen vs. Chicago (2nd H) April 28, 1989
Free Throws Attempted Most Consecutive Free Throws Without a MissGame 27 Michael Jordan @ Chicago May 5, 1989 Game 12-12 Michael Jordan @ Chicago April 28, 1988 Half 16 Michael Jordan @ Chicago (1st H) May 5, 1989 Half 9-9 Michael Jordan @ Chicago (2nd H) April 28, 1988 Quarter 10 Michael Jordan @ Chicago (2nd Q) May 8, 1988 9-9 Michael Jordan vs. Chicago (2nd H) May 29, 1992 Overtime 4 Horace Grant vs. Chicago May 3, 1994 Quarter 6-6 on six occasions
Overtime 2-2 Phil Chenier @ Washington April 26, 1976 2-2 Michael Jordan @ Chicago May 5, 1989
Rebounds -- Total Game 23 Elvin Hayes vs. Washington April 15, 1977 Half 14 Elvin Hayes vs. Washington April 15, 1977 Consecutive Free Throws Overtime 3 Scottie Pippen @ Chicago May 5, 1989 Game 12 Phil Chenier @ Washington April 13, 1977
12 Michael Jordan @ Chicago April 28, 1988 Half 9 Michael Jordan @ Chicago April 28, 1988
9 Michael Jordan vs. Chicago May 29, 1992 Rebounds -- Offensive Quarter 6 on six occasions Game 11 Dave Cowens vs. Boston May 14, 1976 Overtime 2 Phil Chenier @ Washington April 26, 1976
11 Charles Barkley @ Philadelphia April 26, 1990 2 Michael Jordan @ Chicago May 5, 1989 Half 8 Dave Cowens vs. Boston (2nd H) May 14, 1976
Rebounds -- Defensive Game 19 Elvin Hayes vs. Washington April 15, 1977 Half 14 Elvin Hayes vs. Washington April 15, 1977
The Playoffs
2004-05 Media Guide 193
194 Cleveland Cavaliers
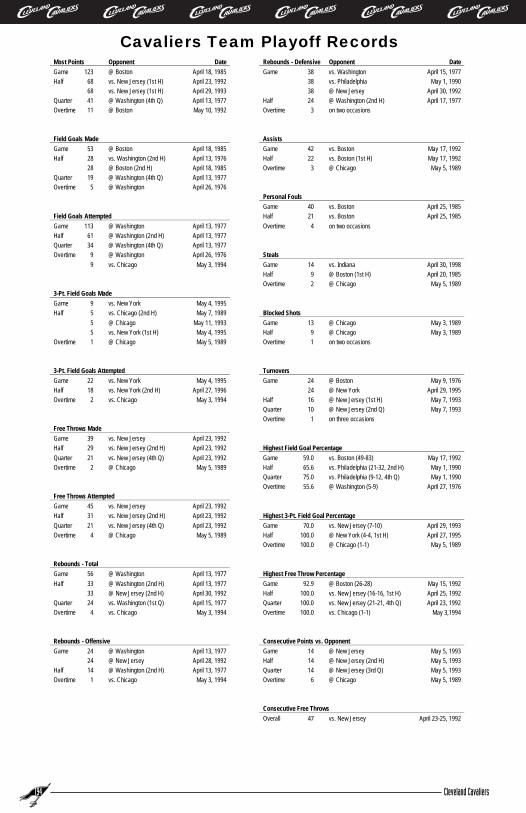
Cavaliers Team Playoff Records Most Points Opponent Date Rebounds - Defensive Opponent Date Game 123 @ Boston April 18, 1985 Game 38 vs. Washington April 15, 1977 Half 68 vs. New Jersey (1st H) April 23, 1992 38 vs. Philadelphia May 1, 1990
68 vs. New Jersey (1st H) April 29, 1993 38 @ New Jersey April 30, 1992 Quarter 41 @ Washington (4th Q) April 13, 1977 Half 24 @ Washington (2nd H) April 17, 1977 Overtime 11 @ Boston May 10, 1992 Overtime 3 on two occasions
Field Goals Made Assists Game 53 @ Boston April 18, 1985 Game 42 vs. Boston May 17, 1992 Half 28 vs. Washington (2nd H) April 13, 1976 Half 22 vs. Boston (1st H) May 17, 1992
28 @ Boston (2nd H) April 18, 1985 Overtime 3 @ Chicago May 5, 1989 Quarter 19 @ Washington (4th Q) April 13, 1977 Overtime 5 @ Washington April 26, 1976
Personal FoulsGame 40 vs. Boston April 25, 1985
Field Goals Attempted Half 21 vs. Boston April 25, 1985 Game 113 @ Washington April 13, 1977 Overtime 4 on two occasions Half 61 @ Washington (2nd H) April 13, 1977 Quarter 34 @ Washington (4th Q) April 13, 1977 Overtime 9 @ Washington April 26, 1976 Steals
9 vs. Chicago May 3, 1994 Game 14 vs. Indiana April 30, 1998 Half 9 @ Boston (1st H) April 20, 1985 Overtime 2 @ Chicago May 5, 1989
3-Pt. Field Goals Made Game 9 vs. New York May 4, 1995 Half 5 vs. Chicago (2nd H) May 7, 1989 Blocked Shots
5 @ Chicago May 11, 1993 Game 13 @ Chicago May 3, 1989 5 vs. New York (1st H) May 4, 1995 Half 9 @ Chicago May 3, 1989
Overtime 1 @ Chicago May 5, 1989 Overtime 1 on two occasions
3-Pt. Field Goals Attempted Turnovers Game 22 vs. New York May 4, 1995 Game 24 @ Boston May 9, 1976 Half 18 vs. New York (2nd H) April 27, 1996 24 @ New York April 29, 1995 Overtime 2 vs. Chicago May 3, 1994 Half 16 @ New Jersey (1st H) May 7, 1993
Quarter 10 @ New Jersey (2nd Q) May 7, 1993 Overtime 1 on three occasions
Free Throws Made Game 39 vs. New Jersey April 23, 1992 Half 29 vs. New Jersey (2nd H) April 23, 1992 Highest Field Goal PercentageQuarter 21 vs. New Jersey (4th Q) April 23, 1992 Game 59.0 vs. Boston (49-83) May 17, 1992 Overtime 2 @ Chicago May 5, 1989 Half 65.6 vs. Philadelphia (21-32, 2nd H) May 1, 1990
Quarter 75.0 vs. Philadelphia (9-12, 4th Q) May 1, 1990 Overtime 55.6 @ Washington (5-9) April 27, 1976
Free Throws Attempted Game 45 vs. New Jersey April 23, 1992 Half 31 vs. New Jersey (2nd H) April 23, 1992 Highest 3-Pt. Field Goal Percentage Quarter 21 vs. New Jersey (4th Q) April 23, 1992 Game 70.0 vs. New Jersey (7-10) April 29, 1993 Overtime 4 @ Chicago May 5, 1989 Half 100.0 @ New York (4-4, 1st H) April 27, 1995
Overtime 100.0 @ Chicago (1-1) May 5, 1989
Rebounds - Total Game 56 @ Washington April 13, 1977 Highest Free Throw Percentage Half 33 @ Washington (2nd H) April 13, 1977 Game 92.9 @ Boston (26-28) May 15, 1992
33 @ New Jersey (2nd H) April 30, 1992 Half 100.0 vs. New Jersey (16-16, 1st H) April 25, 1992 Quarter 24 vs. Washington (1st Q) April 15, 1977 Quarter 100.0 vs. New Jersey (21-21, 4th Q) April 23, 1992 Overtime 4 vs. Chicago May 3, 1994 Overtime 100.0 vs. Chicago (1-1) May 3,1994
Rebounds - Offensive Consecutive Points vs. Opponent Game 24 @ Washington April 13, 1977 Game 14 @ New Jersey May 5, 1993
24 @ New Jersey April 28, 1992 Half 14 @ New Jersey (2nd H) May 5, 1993 Half 14 @ Washington (2nd H) April 13, 1977 Quarter 14 @ New Jersey (3rd Q) May 5, 1993 Overtime 1 vs. Chicago May 3, 1994 Overtime 6 @ Chicago May 5, 1989
Consecutive Free Throws Overall 47 vs. New Jersey April 23-25, 1992

Opponents Team Playoff Records Most Points Opponent Date Rebounds - Defensive Opponent Date Game 132 New York April 12, 1978 Game 41 Washington April 21, 1976 Half 70 Boston (1st H) April 18, 1985 Half 23 Washington (1st H) April 13, 1976 Quarter 40 Philadelphia (3rd Q) April 26, 1990 23 Washington (2nd H) April 26, 1976 Overtime 14 Washington April 26, 1976 23 New Jersey (2nd H) May 7, 1993
Field Goals Made Assists Game 56 New York April 12, 1978 Game 41 Boston May 15, 1992 Half 30 New York April 12, 1978 Half 21 Boston May 15, 1992 Quarter 16 New York (1st & 3rd Q) April 12, 1978 Overtime 2 Chicago May 5, 1989
16 Chicago (1st Q) May 3, 1989 Overtime 5 Washington April 26, 1976
Personal FoulsGame 35 Indiana April 30, 1998
Field Goals Attempted Half 20 Indiana (2nd H) April 30, 1998 Game 106 Chicago May 1, 1988 Overtime 4 Chicago May 5, 1989 Half 53 Chicago (1st & 2nd H) May 1, 1988
53 New Jersey (1st H) April 23, 1992 Quarter 30 Chicago (3rd Q) May 1, 1988
30 New Jersey (2nd Q) April 23, 1992 Steals Overtime 7 on two occasions Game 13 New Jersey April 28, 1992
13 Chicago May 27, 1992 Half 8 on six occasions Overtime 1 on three occasions
3-Pt. Field Goals Made Game 17 New York April 25, 1996 Half 11 New York (2nd H) April 25, 1996
Blocked ShotsGame 14 New Jersey May 7, 1993 Half 11 New Jersey (2nd H) May 7, 1993
3-Pt. Field Goals Attempted Overtime 2 Chicago May 3, 1994 Game 22 New York May 4, 1995
22 New York April 25, 1996 Half 13 New York (2nd H) April 25, 1996 Overtime 3 Chicago May 5, 1989 Turnovers
Game 26 Washington April 15, 1976 26 New York April 29, 1995
Half 15 Washington (1st H) April 15, 1976 Free Throws Made 15 New York (1st H) April 29, 1995 Game 39 Boston April 25, 1985 Quarter 10 Washington (2nd Q) April 15, 1977 Half 21 Boston (1st H) April 25, 1985 Overtime 3 Chicago May 5, 1989 Quarter 15 Boston (2nd & 4th Q) April 25, 1985 Overtime 4 on two occasions
Highest Field Goal PercentageGame 63.0 New York (46-73) April 27, 1995
Free Throws Attempted Half 71.4 New York (25-35) April 27, 1995 Game 46 Boston April 25, 1985 Quarter 81.3 New York (13-16) April 27, 1995 Half 27 Boston (1st H) April 25, 1985 Overtime 71.4 Washington (5-7) April 26, 1976 Quarter 21 Boston (2nd Q) April 25, 1985 Overtime 7 Washington April 26, 1976
Highest 3-Pt. Field Goal Percentage Game 100.0 Chicago (3-3) May 23, 1992
Rebounds - Total Half 100.0 Chicago (4-4, 2nd H) April 28, 1989 Game 63 Boston May 11, 1976 Half 33 Washington (1st H) April 13, 1976
33 Boston (1st H) May 11, 1976 Quarter 20 Washington (2nd Q) April 13, 1976 Most Consecutive Free Throws Without a Miss
20 Boston (1st Q) May 11, 1976 Game 19-19 Chicago May 19, 1992 Overtime 8 Chicago May 5, 1989 Half 10-10 Chicago (1st H) May 3, 1988
Quarter 13-13 Boston (2nd Q) April 18, 1985
Rebounds - Offensive Game 23 Boston May 11, 1976 Half 13 Boston (1st H) May 11, 1976
13 Philadelphia (2nd H) April 26, 1990 13 Chicago (1st H) May 21, 1992
The Playoffs
2004-05 Media Guide 195

196 Cleveland Cavaliers
Cavaliers All-Time Playoff Leaders GAMES PLAYED POINTS SCORED SCORING AVERAGE ASSISTS
1 Mark Price 47 1 Mark Price 818 1 World B. Free 26.3 1 Mark Price 327 2 John Williams 45 2 Brad Daugherty 782 2 Shawn Kemp 26.0 2 Craig Ehlo 164 3 Brad Daugherty 41 3 Larry Nance 693 3 Brad Daugherty 19.1 3 Brad Daugherty 137
Larry Nance 41 4 John Williams 559 4 Ron Harper 18.8 4 Larry Nance 110 5 Craig Ehlo 40 5 Craig Ehlo 422 5 Mark Price 17.4 5 John Williams 95 6 Mike Sanders 35 6 Campy Russell 285 6 Zydrunas Ilgauskas 17.3 6 Terrell Brandon 76 7 Danny Ferry 28 7 Mike Sanders 273 7 Larry Nance 16.9 7 Jim Cleamons 61 8 Terrell Brandon 26 8 Austin Carr 212 8 Roy Hinson 16.8 8 Mike Sanders 58 9 John Battle 19 9 Bingo Smith 201 9 Dan Majerle 16.7 9 Foots Walker 53
10 Four players tied 18 10 Terrell Brandon 182 10 Terry Furlow 16.0 10 Jim Brewer 42
FIELD GOALS FIELD GOAL %FIELD GOALS MADE ATTEMPTED (Min. 10 FGM) STEALS
1 Larry Nance 283 1 Mark Price 603 1 Johnny Davis .750 1 Mark Price 64 2 Mark Price 280 2 Larry Nance 537 2 Melvin Turpin .632 2 Craig Ehlo 47 3 Brad Daugherty 275 3 Brad Daugherty 530 3 Ben Poquette .619 3 John Williams 45 4 John Williams 206 4 John Williams 426 4 Zydrunas Ilgauskas .571 4 Larry Nance 30 5 Craig Ehlo 161 5 Craig Ehlo 384 5 Lonnie Shelton .559 5 Mike Sanders 28 6 Mike Sanders 119 6 Campy Russell 254 6 Roy Hinson .542 6 Brad Daugherty 27 7 Campy Russell 105 7 Mike Sanders 245 7 Larry Nance .527 7 Ron Harper 22 8 Bingo Smith 88 8 Bingo Smith 216 8 Ron Harper .523 8 Jim Brewer 17 9 Austin Carr 87 9 Austin Carr 204 9 Brad Daugherty .519 9 Terrell Brandon 15
10 Dick Snyder 77 10 Jim Cleamons 184 10 Elmore Smith .509 10 four players tied 14
FREE THROWS FREE THROW % FREE THROWS MADE ATTEMPTED (Min. 10 FTM) BLOCKED SHOTS
1 Brad Daugherty 232 1 Brad Daugherty 307 1 Mark Price .944 1 Larry Nance 93 2 Mark Price 202 2 Mark Price 214 2 World B. Free .920 2 John Williams 53 3 John Williams 147 3 John Williams 198 3 John Battle .913 3 Brad Daugherty 40 4 Larry Nance 127 4 Larry Nance 162 4 Bingo Smith .893 4 Nate Thurmond 30 5 Campy Russell 75 5 Campy Russell 91 5 Chris Mills .882 5 Jim Brewer 16 6 Craig Ehlo 59 6 Craig Ehlo 82 6 Terrell Brandon .871 6 Mike Sanders 16 7 Tyrone Hill 43 7 Tyrone Hill 71 7 Derek Anderson .855 7 Craig Ehlo 10 8 Austin Carr 38 8 Austin Carr 55 8 Danny Ferry .850 8 Michael Cage 9
Shawn Kemp 38 9 Jim Brewer 51 9 Shawn Kemp .844 Roy Hinson 9 10 Mike Sanders 34 10 Mike Sanders 46 10 Tony Campbell .833 Campy Russell 9
3-PT. FIELD GOALS 3-PT. FIELD GOALS 3-PT. FIELD GOAL % MADE ATTEMPTED (Min. 50 3-Pt. FGM)
(Commencing w/79-80) (Commencing w/79-80) (Commencing w/79-80) MINUTES PLAYED 1 Mark Price 56 1 Mark Price 166 1 Chris Mills .500 1 Mark Price 1,691 2 Craig Ehlo 41 2 Craig Ehlo 113 2 Dan Majerle .435 2 Brad Daugherty 1,600 3 Danny Ferry 14 3 Danny Ferry 45 3 Gerald Wilkins .393 3 Larry Nance 1,564 4 Chris Mills 12 4 Gerald Wilkins 28 4 Wesley Person .368 4 John Williams 1,416 5 Gerald Wilkins 11 5 Chris Mills 24 Bobby Phills .368 5 Craig Ehlo 1,262 6 Dan Majerle 10 6 Dan Majerle 23 6 Craig Ehlo .363 6 Mike Sanders 784 7 Wesley Person 7 7 Wesley Person 19 7 Mark Price .337 7 Jim Brewer 611
Bobby Phills 7 Bobby Phills 19 8 Danny Ferry .311 8 Campy Russell 516 9 Terrell Brandon 5 9 Terrell Brandon 17 9 Terrell Brandon .294 9 Jim Cleamons 503
10 Steve Kerr 3 10 Steve Kerr 14 10 Steve Kerr .214 10 two players tied 470
TURNOVERS OFFENSIVE REBOUNDS DEFENSIVE REBOUNDS TOTAL REBOUNDS (Commencing w/77-78)
1 Larry Nance 110 1 Brad Daugherty 330 1 Brad Daugherty 419 1 Mark Price 158 2 John Williams 99 2 Larry Nance 220 2 Larry Nance 330 2 Brad Daugherty 98 3 Brad Daugherty 89 3 John Williams 206 3 John Williams 305 3 John Williams 74 4 Jim Brewer 51 4 Jim Brewer 125 4 Jim Brewer 176 4 Craig Ehlo 64 5 Mike Sanders 45 5 Craig Ehlo 120 5 Craig Ehlo 164 5 Larry Nance 59 6 Craig Ehlo 44 6 Mark Price 103 6 Mark Price 124 6 Mike Sanders 47 7 Campy Russell 42 7 Nate Thurmond 80 7 Nate Thurmond 118 7 Terrell Brandon 37 8 Nate Thurmond 38 8 Campy Russell 70 8 Mike Sanders 114 8 Bobby Phills 22 9 Tyrone Hill 29 9 Mike Sanders 69 9 Campy Russell 112 9 Tyrone Hill 21
10 Jim Chones 28 10 Jim Chones 68 10 Jim Chones 96 10 John Battle 20
PERSONAL FOULS DISQUALIFICATIONS 1 John Williams 143 1 John Williams 4 2 Larry Nance 134 2 Tyrone Hill 3 3 Brad Daugherty 113 3 Zydrunas Ilgauskas 2 4 Mike Sanders 111 Larry Nance 2 5 Craig Ehlo 101 Ben Poquette 2 6 Mark Price 81 Lonnie Shelton 2 7 Campy Russell 70 Nate Thurmond 2 8 Nate Thurmond 52 8 nine players tied 1 9 Austin Carr 50
10 Bingo Smith 48

All-Time Playoff Totals
Year Total Home Away OT 1976 6-7 5-2 1-5 0-1 1977 1-2 1-0 0-2 0-0 1978 0-2 0-1 0-1 0-0 1985 1-3 1-1 0-2 0-0 1988 2-3 2-0 0-3 0-0 1989 2-3 1-2 1-1 1-0 1990 2-3 2-0 0-3 0-0 1992 9-8 6-3 3-5 1-0 1993 3-6 2-3 1-3 0-0 1994 0-3 0-1 0-2 0-1 1995 1-3 0-2 1-1 0-0 1996 0-3 0-2 0-1 0-0 1998 1-3 1-1 0-2 0-0 13-Year Totals 28-49 21-18 7-31 2-2 Pct. .364 .538 .184 .500
All-Time Playoff Records
Team Year Home Away Total BOSTON 1976 2-1 0-3 2-4
1985 1-1 0-2 1-3 1992 3-1 1-2 4-3 Total 6-3 1-7 7-10 Pct. .667 .125 .412
CHICAGO 1988 2-0 0-3 2-3 1989 1-2 1-1 2-3 1992 1-2 1-2 2-4 1993 0-2 0-2 0-4 1994 0-1 0-2 0-3 Total 4-7 2-10 6-17 Pct. .364 .167 .261
INDIANA 1998 1-1 0-2 1-3 Pct. .500 .000 .250
NEW JERSEY 1992 2-0 1-1 3-1 1993 2-1 1-1 3-2 Total 4-1 2-2 6-3 Pct. .800 .500 .667
NEW YORK 1978 0-1 0-1 0-2 1995 0-2 1-1 1-3 1996 0-2 0-1 0-3 Total 0-5 1-3 1-8 Pct. .000 .250 .111
PHILADELPHIA 1990 2-0 0-3 2-3 Pct. 1.000 .000 .400
WASHINGTON 1976 3-1 1-2 4-3 1977 1-0 0-2 1-2 Total 4-1 1-4 5-5 Pct. .800 .200 .500
Playoff Overtime Games Team-By-Team Date vs. Site Cle Opp W/L 1992 EASTERN CONFERENCE SEMI FINALS – GAME 45/10/92 Boston Boston 114 112 W
1989 EASTERN CONFERENCE FIRST ROUND – GAME 45/5/89 Chicago Chicago 108 105 W
1994 EASTERN CONFERENCE FIRST ROUND – GAME 35/3/94 Chicago Cleveland 92 95 L
1976 EASTERN CONFERENCE SEMI FINALS – GAME 64/26/76 Washington Washington 98 102 L
The Playoffs
2004-05 Media Guide 197
Cavaliers Playoff Sundry Records
Biggest Win . . . . . . . . . . . . . . . . . . . . .122-95 (27) vs. Philadelphia 5/1/90Biggest Win (Road) . . . . . . . . . . . . . . .107-81 (26) at Chicago 5/21/92Biggest Loss . . . . . . . . . . . . . . . . . . . . .91-122 (31) at Boston 5/15/92Biggest Loss (Home) . . . . . . . . . . . . . .83-106 (23) vs. New York 4/25/96Most Games Won . . . . . . . . . . . . . . . . .9 1992Most Games Lost . . . . . . . . . . . . . . . . .8 1992Longest Game . . . . . . . . . . . . . . . . . . .1 OT on four occasionsLongest Winning Streak . . . . . . . . . . . .2 on seven occasionsLongest Losing Streak . . . . . . . . . . . . .8 Chicago-New York 5/11/93-4/27/95Longest Winning Streak (Home) . . . . .5 Washington-Boston 4/17/76-5/14/76 . . . . . . . . . . . . . . . . . . . . . . . . . . . . . . .5 Phil., N.J., Boston 5/1/90-5/2/92
Longest Losing Streak (Home) . . . . . .7 Chicago-New York 5/15/93-4/27/96Longest Winning Streak (Road) . . . . . .1 on seven occasionsLongest Losing Streak (Road) . . . . . . .14 Washington-Chicago 4/21/76-5/3/89Most Points in Winning Game . . . . . . .122 vs. Philadelphia 5/1/90 . . . . . . . . . . . . . . . . . . . . . . . . . . . . . . .122 vs. Boston 5/17/92
Most Points in Losing Game . . . . . . . .123 at Boston 4/18/85Least Points in Game . . . . . . . . . . . . . .74 vs. Indiana 4/30/98Most Points in Quarter . . . . . . . . . . . . .41 at Washington (4th Q) 4/13/77Least Points in Quarter . . . . . . . . . . . .12 at Washington (2nd Q) 4/15/76 . . . . . . . . . . . . . . . . . . . . . . . . . . . . . . .12 vs. Chicago (4th Q) 5/3/94
Most Points in Half . . . . . . . . . . . . . . . .68 vs. New Jersey (1st H) 4/23/92 . . . . . . . . . . . . . . . . . . . . . . . . . . . . . . .68 vs. New Jersey (1st H) 4/29/93
Least Points in Half . . . . . . . . . . . . . . .32 at New York (1st H) 5/1/96Most Points in OT . . . . . . . . . . . . . . . . .11 at Boston 5/10/92Least Points in OT . . . . . . . . . . . . . . . .5 vs. Chicago 5/3/94
OpponentsMost Points in Game . . . . . . . . . . . . . .132 vs. New York 4/12/78Most Points in Losing Game . . . . . . . .113 vs. New Jersey 4/23/92Least Points in Game . . . . . . . . . . . . . .76 vs. Washington 4/17/76 . . . . . . . . . . . . . . . . . . . . . . . . . . . . . . .76 vs. Boston 5/2/92
Most Points in Quarter . . . . . . . . . . . . .40 at Philadelphia (3rd Q) 4/26/90Least Points in Quarter . . . . . . . . . . . .8 at New Jersey (4th Q) 5/7/93Most Points in Half . . . . . . . . . . . . . . . .70 at Boston (1st H) 4/18/85Least Points in Half . . . . . . . . . . . . . . .31 at New York (2nd H) 5/1/96Most Points in OT . . . . . . . . . . . . . . . . .14 at Washington 4/26/76Least Points in OT . . . . . . . . . . . . . . . .6 at Chicago 5/5/89

MEETOURPOWERFORWARDS
APROUD SPONSOR OF THE CLEVELAND CAVALIERS


![2016 PLAYOFF MEDIA GUIDE - NHL.compredators.nhl.com/v2/ext/01_2015-16_Files/2016_Playoff... · 2016-04-11 · 2016 PLAYOFF GUIDE SECTION ONE: 2016 NHL STANLEY CUP PLAYOFFS [GOLD]](https://static.fdocuments.in/doc/165x107/5f1001777e708231d446f913/2016-playoff-media-guide-nhl-2016-04-11-2016-playoff-guide-section-one-2016.jpg)