THE PLATINUM STANDARD SEPTEMBER 2014 - SFA (Oxford) Ltd · THE PLATINUM STANDARD SEPTEMBER 2014 5...
72
THE PLATINUM STANDARD SEPTEMBER 2014
Transcript of THE PLATINUM STANDARD SEPTEMBER 2014 - SFA (Oxford) Ltd · THE PLATINUM STANDARD SEPTEMBER 2014 5...

THE PLATINUM STANDARDSEPTEMBER 2014


THE PLATINUM STANDARDSEPTEMBER 2014

Edition 02
© Published in September 2014 by SFA (Oxford) Ltd.
THE PLATINUM STANDARD SEPTEMBER 2014 3
ContentsForeword 5
Breaking new ground: The search for new sources of primary supply 7The supply landscape 9
Exploration trends 13
Filling the supply gap 16
The realities of physical platinum investment 19Platinum investment is a niche area 21
Liquidity is an issue for platinum investment 22
South Africa has become the driver of ETF investment 23
South African funds have loaded up on platinum ETFs 26
The platinum price does not always outperform the miners’ equities 27
ETF holdings can be pro-cyclical 29
Summary: Platinum investment needs a new impetus 31
Fuel cell vehicles: Coming to a car park near you. Eventually. 33Automotive companies’ fuel cell vehicle plans 35
Japan: Subsidy and an initial government offtaker 36
California: Leading the way in legislation 38
Fuel cell cars and platinum 39
What does the platinum industry need to do? 41
The PGM markets in 2014 43The platinum market 45
The palladium market 49
The rhodium market 51
The price outlook for the next six months 53
Appendix 55Platinum supply-demand balance 56
Palladium supply-demand balance 58
Rhodium supply-demand balance 60
Glossary of terms 63
Methodology notes 64
Acknowledgements 65


THE PLATINUM STANDARD SEPTEMBER 2014 5
Following on from the resounding success of the first issue of The Platinum Standard earlier this year, putting together the second, for release at New York Platinum Week, raised an interesting question: just how important is the US to the platinum market?
Back in 1975, the US kick-started automotive demand for platinum – now the PGM market’s biggest end-use – when the country promulgated tighter tailpipe emissions standards which required for the first time catalytic converters to be installed in automotive vehicles. In order to achieve this without poisoning the catalysts, the country led the way on removing lead from gasoline. At its peak in the early 2000s, the automotive industry in North America consumed close to 1 moz of platinum. However, that figure has since reduced to less than 400 koz, owing largely to substitution to the cheaper palladium.
Last year, North America consumed just 13% of global demand, supplying only 12% of the world’s platinum intake, including recycling.
In terms of dictating the price, however, the US continues to make the difference. While its ETFs now account for only 19% of global holdings, the NYMEX remains the centre of the world for the platinum futures market.
Below, precious metals expert Andy Smith offers his take on the link between the US and platinum prices against those of gold.
America decides… the platinum:gold ratioIn November 2014, some 36 Senate seats will be contested by US politicians. The Democrats currently enjoy a 55-45 majority, but recent polls [Realclearpolitics] show a swing to the Republican side, leaving the Senate race split down the middle, with Democrats holding 45 seats and Republicans 46 seats. It is likely, therefore, that the Senate, like the House, will soon be run by the party in opposition to the President – only the fourth such instance since 1968 (when the gold price was freed).
DC deadlock unlocks platinum:gold ratio
Foreword The importance of the US to platinum
1968 1972 1976 1980 1984 1988 1992 1996 2000 2004 2008 2012 2016
3.5
3.0
2.5
2.0
1.5
1.0
0.5
Platinum:gold ratio Senate party ratio* House party ratio*
* President's party/Opposition party
Reagan/Bushstalemated
Clintonstalemated
Obamastalemated?
Nixon/Ford stalemated
Reagan/Bushstalemated
Clintonstalemated
Obamastalemated?
Nixon/Ford stalemated
Source: Andy Smith
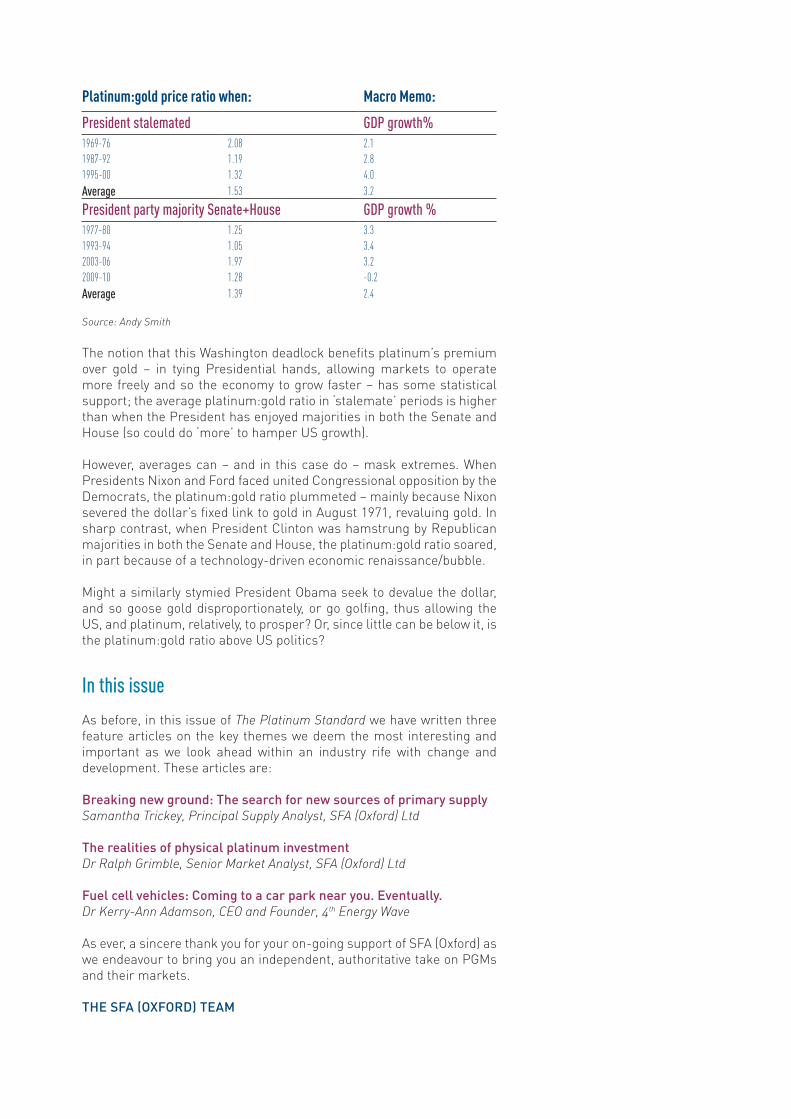
The notion that this Washington deadlock benefits platinum’s premium over gold – in tying Presidential hands, allowing markets to operate more freely and so the economy to grow faster – has some statistical support; the average platinum:gold ratio in ‘stalemate’ periods is higher than when the President has enjoyed majorities in both the Senate and House (so could do ‘more’ to hamper US growth).
However, averages can – and in this case do – mask extremes. When Presidents Nixon and Ford faced united Congressional opposition by the Democrats, the platinum:gold ratio plummeted – mainly because Nixon severed the dollar’s fixed link to gold in August 1971, revaluing gold. In sharp contrast, when President Clinton was hamstrung by Republican majorities in both the Senate and House, the platinum:gold ratio soared, in part because of a technology-driven economic renaissance/bubble.
Might a similarly stymied President Obama seek to devalue the dollar, and so goose gold disproportionately, or go golfing, thus allowing the US, and platinum, relatively, to prosper? Or, since little can be below it, is the platinum:gold ratio above US politics?
In this issue
As before, in this issue of The Platinum Standard we have written three feature articles on the key themes we deem the most interesting and important as we look ahead within an industry rife with change and development. These articles are:
Breaking new ground: The search for new sources of primary supplySamantha Trickey, Principal Supply Analyst, SFA (Oxford) Ltd
The realities of physical platinum investmentDr Ralph Grimble, Senior Market Analyst, SFA (Oxford) Ltd
Fuel cell vehicles: Coming to a car park near you. Eventually.Dr Kerry-Ann Adamson, CEO and Founder, 4th Energy Wave
As ever, a sincere thank you for your on-going support of SFA (Oxford) as we endeavour to bring you an independent, authoritative take on PGMs and their markets.
THE SFA (OXFORD) TEAM
Platinum:gold price ratio when: Macro Memo:
President stalemated GDP growth%1969-76 2.08 2.11987-92 1.19 2.81995-00 1.32 4.0Average 1.53 3.2
President party majority Senate+House GDP growth %1977-80 1.25 3.31993-94 1.05 3.42003-06 1.97 3.22009-10 1.28 -0.2Average 1.39 2.4
Source: Andy Smith

Breaking new ground: The search for new sources of primary supply

THE PLATINUM STANDARD SEPTEMBER 2014 9
Breaking new ground: The search for new sources of primary supplySamantha Trickey, Principal Supply Analyst, SFA (Oxford) Ltd
The supply landscape
Global primary PGM supply is in decline. South African platinum mine supply peaked at 5.3 moz in 2006, accounting for 78% of global output. Production is forecast to dip below 3 moz this year (62% of global supply), for the first time since 1992.
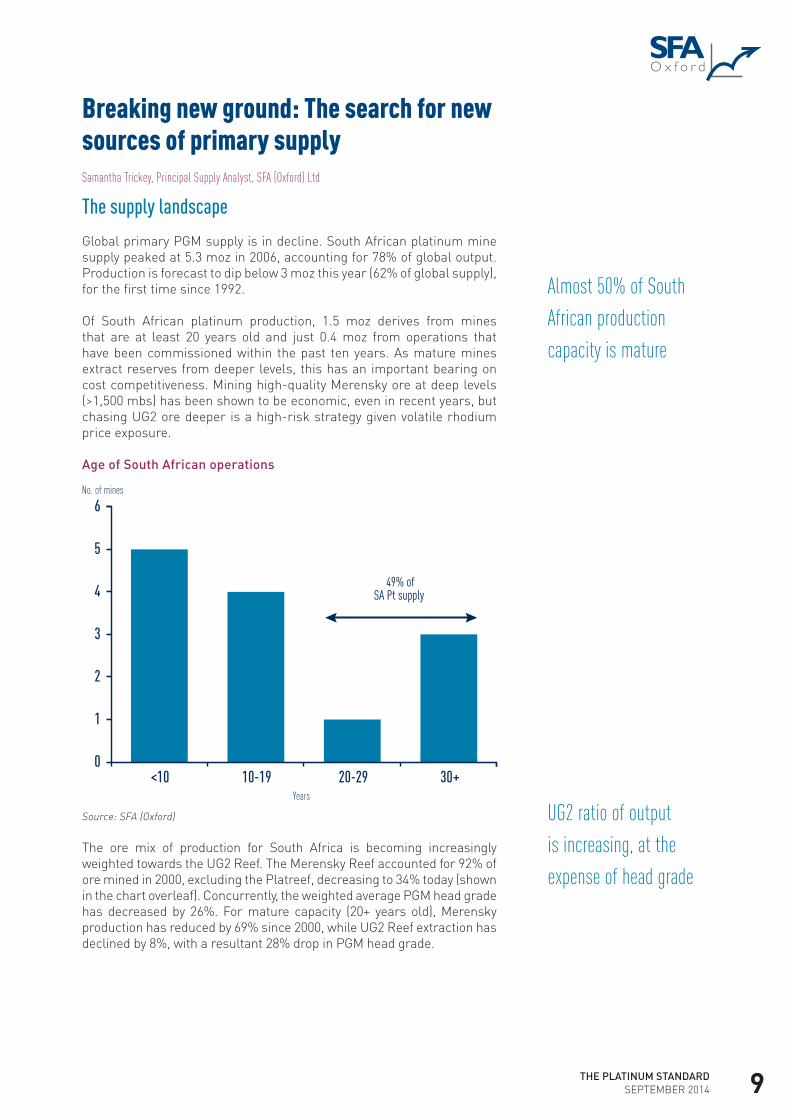
Of South African platinum production, 1.5 moz derives from mines that are at least 20 years old and just 0.4 moz from operations that have been commissioned within the past ten years. As mature mines extract reserves from deeper levels, this has an important bearing on cost competitiveness. Mining high-quality Merensky ore at deep levels (>1,500 mbs) has been shown to be economic, even in recent years, but chasing UG2 ore deeper is a high-risk strategy given volatile rhodium price exposure.
Age of South African operations
Source: SFA (Oxford)
The ore mix of production for South Africa is becoming increasingly weighted towards the UG2 Reef. The Merensky Reef accounted for 92% of ore mined in 2000, excluding the Platreef, decreasing to 34% today (shown in the chart overleaf). Concurrently, the weighted average PGM head grade has decreased by 26%. For mature capacity (20+ years old), Merensky production has reduced by 69% since 2000, while UG2 Reef extraction has declined by 8%, with a resultant 28% drop in PGM head grade.
0
1
2
3
4
5
6No. of mines
Years
49% ofSA Pt supply
<10 10-19 20-29 30+
Almost 50% of South African production capacity is mature
UG2 ratio of output is increasing, at the expense of head grade
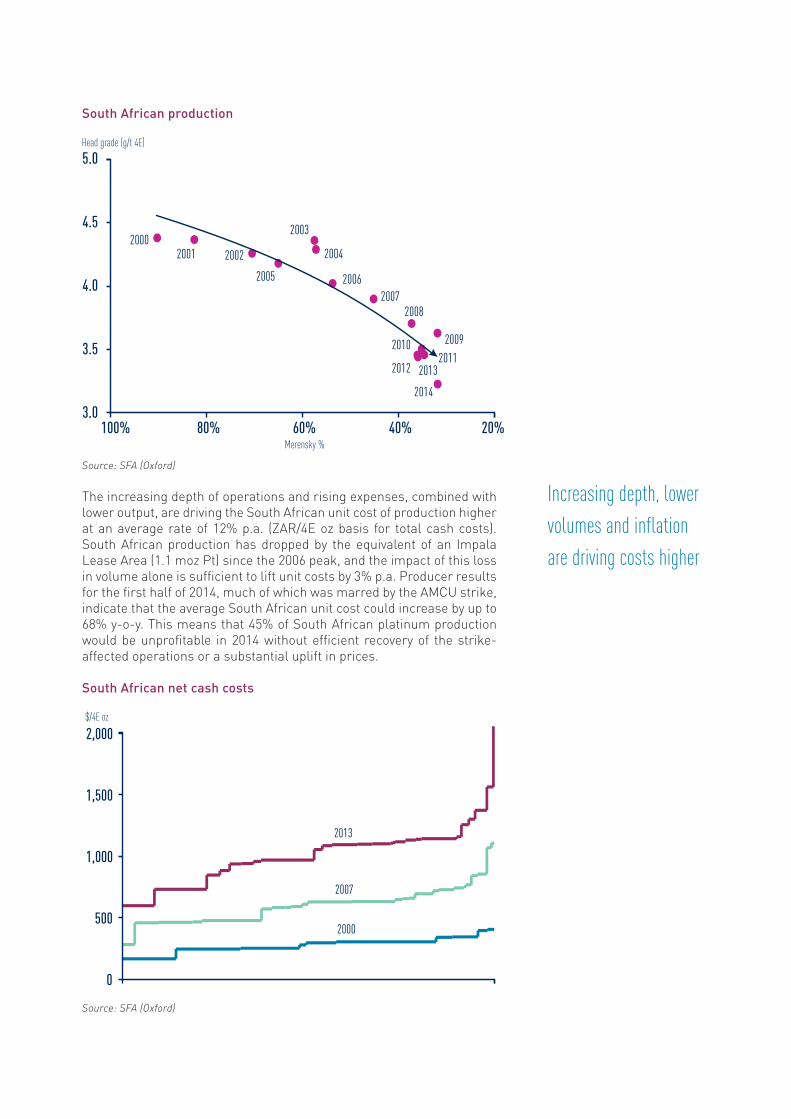
South African production
Source: SFA (Oxford)
The increasing depth of operations and rising expenses, combined with lower output, are driving the South African unit cost of production higher at an average rate of 12% p.a. (ZAR/4E oz basis for total cash costs). South African production has dropped by the equivalent of an Impala Lease Area (1.1 moz Pt) since the 2006 peak, and the impact of this loss in volume alone is sufficient to lift unit costs by 3% p.a. Producer results for the first half of 2014, much of which was marred by the AMCU strike, indicate that the average South African unit cost could increase by up to 68% y-o-y. This means that 45% of South African platinum production would be unprofitable in 2014 without efficient recovery of the strike-affected operations or a substantial uplift in prices.
South African net cash costs
Source: SFA (Oxford)
20002001 2002
2003
2004
2005 20062007
2008
20092010
2012
2014
3.0
3.5
4.0
4.5
5.0
100% 80% 60% 40% 20%
Head grade (g/t 4E)
Merensky %
20112013
0
500
1,000
1,500
2,000$/4E oz
2000
2007
2013
Increasing depth, lower volumes and inflation are driving costs higher
THE PLATINUM STANDARD SEPTEMBER 2014 11
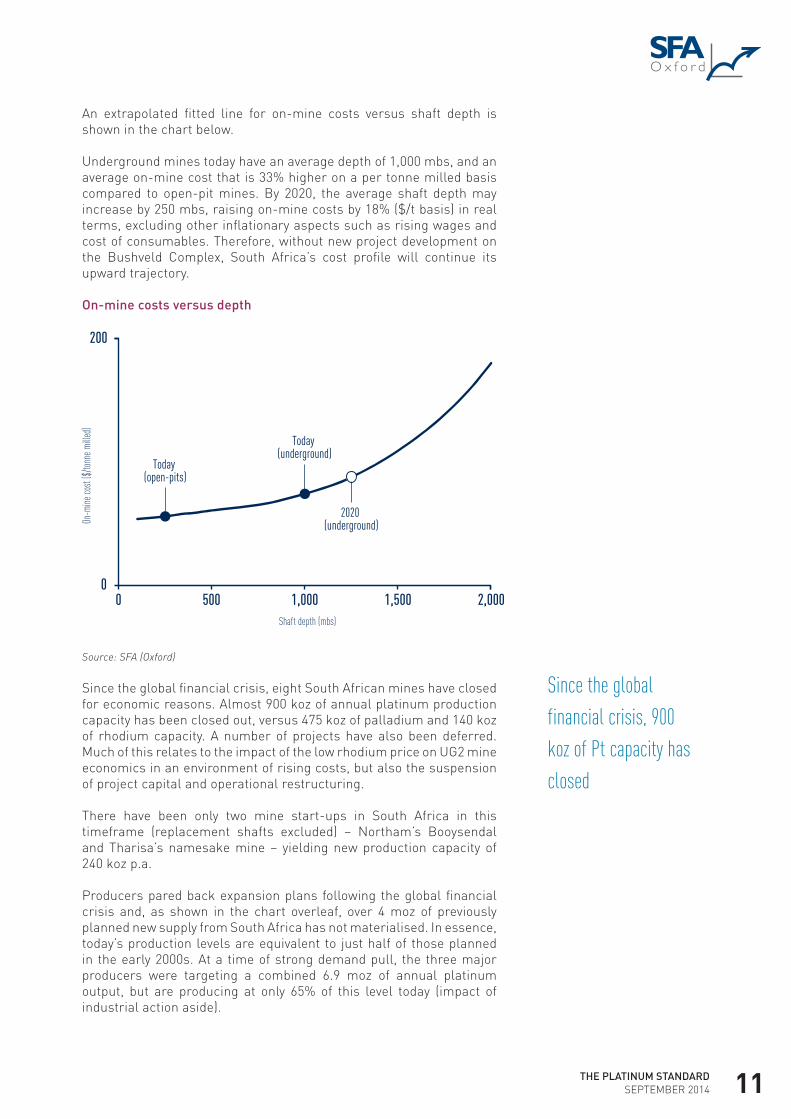
An extrapolated fitted line for on-mine costs versus shaft depth is shown in the chart below.
Underground mines today have an average depth of 1,000 mbs, and an average on-mine cost that is 33% higher on a per tonne milled basis compared to open-pit mines. By 2020, the average shaft depth may increase by 250 mbs, raising on-mine costs by 18% ($/t basis) in real terms, excluding other inflationary aspects such as rising wages and cost of consumables. Therefore, without new project development on the Bushveld Complex, South Africa’s cost profile will continue its upward trajectory.
On-mine costs versus depth
Source: SFA (Oxford)
Since the global financial crisis, eight South African mines have closed for economic reasons. Almost 900 koz of annual platinum production capacity has been closed out, versus 475 koz of palladium and 140 koz of rhodium capacity. A number of projects have also been deferred. Much of this relates to the impact of the low rhodium price on UG2 mine economics in an environment of rising costs, but also the suspension of project capital and operational restructuring.
There have been only two mine start-ups in South Africa in this timeframe (replacement shafts excluded) – Northam’s Booysendal and Tharisa’s namesake mine – yielding new production capacity of 240 koz p.a.
Producers pared back expansion plans following the global financial crisis and, as shown in the chart overleaf, over 4 moz of previously planned new supply from South Africa has not materialised. In essence, today’s production levels are equivalent to just half of those planned in the early 2000s. At a time of strong demand pull, the three major producers were targeting a combined 6.9 moz of annual platinum output, but are producing at only 65% of this level today (impact of industrial action aside).
Today (underground)
2020 (underground)
Today (open-pits)
0
200
0 500 1,000 1,500 2,000
On-m
ine co
st ($
/tonn
e mill
ed)
Shaft depth (mbs)
Since the global financial crisis, 900 koz of Pt capacity has closed

Planned South African platinum production
Source: SFA (Oxford)
In 2012 and 2013, the South African PGM industry recorded asset impairments of $2.1 billion (shown in the chart below). Of this, $1.2 billion is directly attributable to restructuring by major producers and UG2 mine closures.
PGM asset impairments
Source: SFA (Oxford), company reports
Total capital expenditure by the major producers has decreased by an average of 9% (ZAR1.9 billion) per year since 2008. Even so, these companies are currently sitting with negative or zero cash balances as head grades fall, productivity levels are at historically low levels, and safety-related interventions and expenditure drain cash. This has been
0
3
6
9
1993 1995 1997 1999 2001 2003 2005 2007 2009 2011 2013 2015F 2017F
Pt moz
-3.1% p.a.
Pre-financial crisis plans
?
0
500
1,000
1,500
2,000
2008 2009 2010 2011 2012 2013
$ million
South African production is now half that planned in the early 2000s
Capital expenditure has decreased by 9% p.a. since 2008
THE PLATINUM STANDARD SEPTEMBER 2014 13
exacerbated by the recent labour issues experienced at their flagship mines. As such, project momentum will be further lost as asset sales (on the agenda since 2010) and deferral of replacement production are now taking place in the aftermath.
Outside of South Africa, there have been five new mines commissioned in the past three years: Amplats’ Unki mine (Zimbabwe), First Quantum Minerals’ Kevitsa mine (Finland), Vale’s Totten (partial replacement capacity) and Wallbridge Mining’s Broken Hammer mines (both in Canada), and Lundin Mining’s Eagle mine (US). However, combined steady-state capacity for these operations totals <130 koz of platinum p.a., an average of just 26 koz p.a. for each mine.
Exploration trends
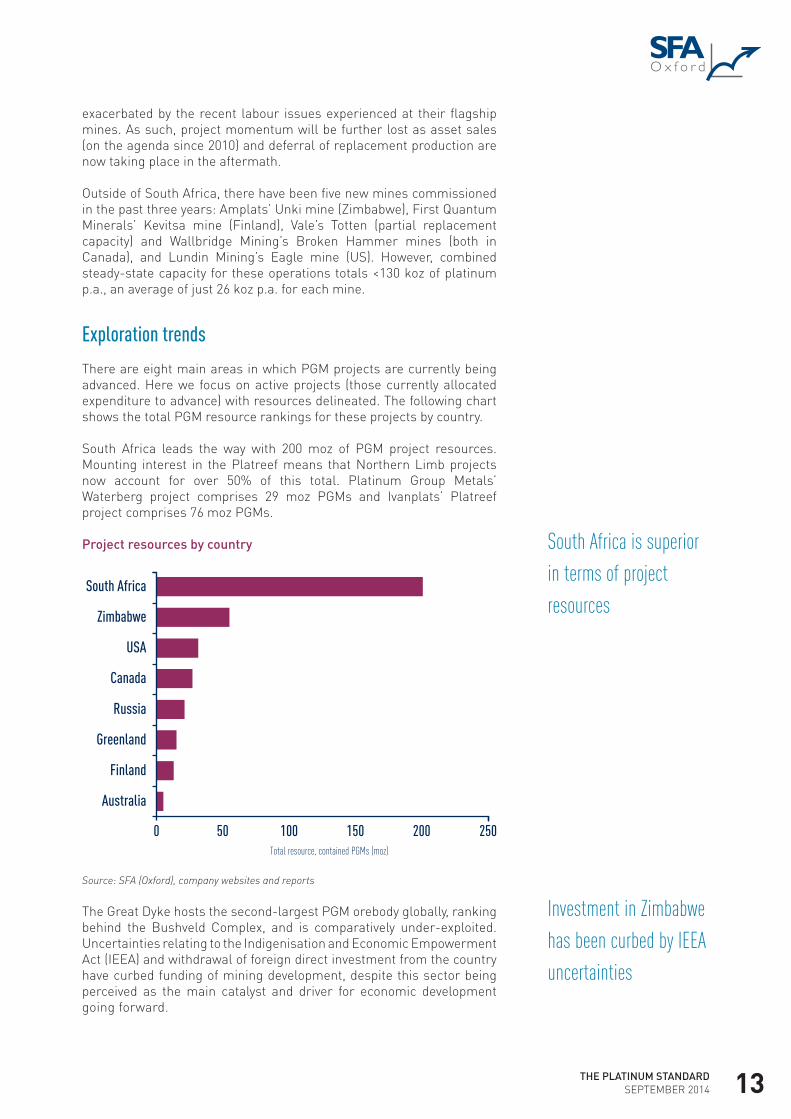
There are eight main areas in which PGM projects are currently being advanced. Here we focus on active projects (those currently allocated expenditure to advance) with resources delineated. The following chart shows the total PGM resource rankings for these projects by country.
South Africa leads the way with 200 moz of PGM project resources. Mounting interest in the Platreef means that Northern Limb projects now account for over 50% of this total. Platinum Group Metals’ Waterberg project comprises 29 moz PGMs and Ivanplats’ Platreef project comprises 76 moz PGMs.
Project resources by country
Source: SFA (Oxford), company websites and reports
The Great Dyke hosts the second-largest PGM orebody globally, ranking behind the Bushveld Complex, and is comparatively under-exploited. Uncertainties relating to the Indigenisation and Economic Empowerment Act (IEEA) and withdrawal of foreign direct investment from the country have curbed funding of mining development, despite this sector being perceived as the main catalyst and driver for economic development going forward.
0 50 100 150 200 250
Australia
Finland
Greenland
Russia
Canada
USA
Zimbabwe
South Africa
Total resource, contained PGMs (moz)
South Africa is superior in terms of project resources
Investment in Zimbabwe has been curbed by IEEA uncertainties

Current project resources in Zimbabwe are estimated at 55 moz PGMs. Recent exploration activities have been led by a Russian consortium which is planning to invest $1.6 billion in developing the Darwendale project, plans for which include a smelter. Darwendale is located in the Darwendale sub-chamber, north of Zimplats. The smaller-scale Bokai project, located in the Selukwe sub-chamber (adjacent to the southern portion of Unki), is currently owned by ENRC. Under private ownership, and given the context of Zimbabwe’s political challenges, production schedules are uncertain, although open-pit potential for Darwendale for the first two to three years of production could yield a swift start-up.
Projects on the Northern Limb and in Zimbabwe have piqued interest for their similar characteristics. Both orebodies are wide reef, ranging from 2 m to 24 m. The average stoping width elsewhere on the Bushveld Complex is c.1.2 m. A wide reef is usually amenable to mechanisation, which is an inherently safer mining method with a lower labour component of operating costs. Historically, operations in these regions have outperformed their Western and Eastern Bushveld counterparts for mine economics, as shown in the chart below.
Regional mine economics
Source: SFA (Oxford)
Broadly speaking, mechanised operations can achieve labour cost savings of around 20% compared with conventional operations, but will result in an increase in consumables and stay-in-business capital expenditure. However, labour efficiencies are historically more than three times higher for Zimbabwean mechanised operations than for South African underground operations and, combined with the shallow depth (average 230 mbs) and by-product components, the cost advantages are compounded. Projects on the Platreef are deeper than in Zimbabwe, with resources extending to 1,000-1,100 mbs, though they may be accessed from 100-700 mbs.
In the US, exploration is focused on Minnesota, with three projects giving a combined resource of 31 moz PGMs. Duluth Metals’ Twin
Western Limb
Eastern Limb
Zimbabwe
South Africa
700
800
900
1,000
1,100
1,200
1,300
0 100 200 300 400 500 600 700
Tota
l cas
h cos
ts ($
/4E o
z)
Net cash margin ($/4E oz)
Bubble size= 4E production, 2013
Northern Limb
Zimbabwean and Platreef operations outperform their peers

THE PLATINUM STANDARD SEPTEMBER 2014 15
Metals project and PolyMet Mining’s NorthMet project are located on the Duluth Complex in north-eastern Minnesota. These projects are at pre-feasibility and environmental permitting stages respectively. Talon Metals’ Tamarack North project lies to the south-west, on the Tamarack Igneous Complex. Current resource statements indicate the latter is higher grade for both PGMs and base metals, but with the maiden resource published in September 2014, meaningful conclusions on scale and production potential cannot yet be drawn.
The mine permitting process in the US is among the most stringent, so while relatively advanced in proceedings, time to production for PolyMet remains indeterminate. The deposit is open-pitable, and production plans are in the region of 100 koz/year PGMs over 20 years.
Canada has the highest number of PGM projects, located across three provinces. Project resources total 28 moz PGMs. Wellgreen Platinum’s namesake project, located in Yukon, is the largest at 19 moz PGMs, though the remaining projects are comparatively small. The preliminary economic assessment for Wellgreen is to be completed in September 2014. Stillwater Mining recently suspended permitting and scaled back funding for one of the more advanced projects, the Marathon joint venture (4 moz PGMs), as it proves uneconomic at today’s prices.
Environmental permitting for Noront Resources’ Eagle’s Nest project (Ontario) is scheduled for completion this year and potential for first production in the medium term exists. The deposit is deep, extending to 1,600 mbs (extraction to c.1,100 mbs), but is amenable to bulk mining techniques and benefits from a higher grade than is typical of most projects in Canada (average grades are shown in the chart below). Production could average 120 koz/year PGMs.
Grade of project resources
Source: SFA (Oxford), company websites and reports
Projects in Russia comprise the Chernogorskoye deposit (Russian Platinum), located on the southern part of the Norilsk-1 deposit, the
Finland
Canada
USA
Russia
Australia
Greenland
South Africa
Zimbabwe
0.0
1.0
2.0
3.0
4.0
5.0
0 0.1 0.2 0.3 0.4 0.5 0.6 0.7
PGM (g/t)
Ni+Cu (%)
Mine permitting in the US is an arduous process
Canadian projects are typically small scale

Kun-Manie project (Amur Minerals) in the far east of the country, and the West Kytlim alluvial platinum project (Eurasia Mining). Resources total 21 moz PGMs. Chernogorskoye is advanced, with production potential within five years (ramping up to capacity of c.600 koz/year PGMs), and West Kytlim is currently undergoing the permitting process.
Remaining projects in Finland, Greenland and Australia are less advanced and total between 5 and 15 moz of PGM resources per country. New production is unlikely to materialise in the short to medium term.
Filling the supply gap
Based on estimates for those projects that are most likely to come into production, the following charts highlight the long-term production split by region compared to today. Clearly there is scope for other projects to come to fruition (and mines to close/re-start) within this timeframe, but for scenario purposes this analysis is based on the current state of affairs.
Platinum production by region
Source: SFA (Oxford)
South African platinum production loses a small percentage of global production share by 2025. The large-scale Platreef projects and expansion at Mogalakwena offset the impact of depletion at Western Limb mines for the most part. The more advanced North American projects are small scale with good PGM grades or large-scale with low PGM grades, limiting production growth potential.
Zimbabwe has the resource base to support significant expansion in market share, though immediate options are constrained by legislative uncertainties and funding requirements for beneficiation infrastructure. Upside exists for Zimbabwe. Russia can maintain its share through the large-scale Chernogorskoye project and, beyond this, Norilsk’s Maslovskoe project.
20252013
Russia 13%
SA74%
Zim7%
N.A.6%
Russia 14%
SA72%
Zim9%
N.A. 5%
Projects in Russia are advanced
Upside exists for Zimbabwe

THE PLATINUM STANDARD SEPTEMBER 2014 17
Palladium production by region
Source: SFA (Oxford)
The metal ratios of the Platreef mean the South African share of global palladium production may grow. Resources outside of Africa are also typically palladium-rich (shown in the chart below), although there are exceptions to this rule (e.g. Broken Hammer mine). In this scenario, new supply from projects yields 870 koz p.a. of palladium versus 500 koz p.a. of platinum.
Pt:Pd ratio of project resources
Source: SFA (Oxford), company websites and reports
Non-African projects are also relatively devoid of rhodium, so the long-term production split remains South African-centric. The Platreef’s contribution to South African rhodium supply could grow to almost 30% by 2025.
In the context of PGM market balances, a significant drop in South African output resulting from recent industrial action follows five years of oversupply for platinum and rhodium. Stocks are likely to be drawn down in the next few years, and substantial deficits open up in the early 2020s as demand recovers (see the chart overleaf).
Russia 42%
SA37%
Zim5%
N.A.16%
Russia 41%
SA42%
Zim6%
N.A.11%
20252013
0% 20% 40% 60% 80% 100%
Greenland
Finland
USA
Australia
Russia
Canada
Zimbabwe
South Africa
Pt Pd
Projects outside of Africa are typically palladium-rich, rhodium-poor

Platinum market balance
Source: SFA (Oxford)
It is then that the impact of the lack of overall investment in PGM supply, particularly in South Africa, will fully materialise. Projected output from the current project pool is not sufficient to fill the PGM supply gap. The lead time to production for South African shafts is now averaging eight to ten years, but the industry is in a state of flux and decisions on large-scale investments are not high on the agenda of the larger PGM producers today.
Palladium (top) and rhodium (bottom) market balances
Source: SFA (Oxford)
2013 2014 2015 2016 2017 2018 2019 2020 2021 2022 2023 2024 2025
SA strikes
Stock drawdown
2013 2014 2015 2016 2017 2018 2019 2020 2021 2022 2023 2024 2025
2013 2014 2015 2016 2017 2018 2019 2020 2021 2022 2023 2024 2025
Current projects are unlikely to plug large deficits opening up in early 2020s

The realities of physical platinum investment


THE PLATINUM STANDARD SEPTEMBER 2014 21
The realities of physical platinum investmentDr Ralph Grimble, Senior Market Analyst, SFA (Oxford) Ltd
Platinum investment is a niche area
Investment in precious metals has historically been dominated by gold and silver, and that remains the case today. The silver market is much smaller than the gold market and silver is generally considered a more volatile, and hence riskier, prospect than gold. Investment in PGMs is a niche area within precious metal investing.
Historically, direct investment in gold and silver has been achieved by purchasing coins or bars. However, the introduction of ETFs added a new investment option.
ETFs were a boon to investors because they were convenient and cheap. They could be traded like equities but were backed by physical metal holdings and hence directly linked to the value of the underlying metal. This avoided the company and market specific risks of owning mining shares. ETFs also had much lower costs than those associated with trading and storing bars or coins.
The first-ever gold ETF was launched in Australia in 2004 and a UK version followed soon after. The SPDR Gold Trust was launched in the US later in 2004 and it became the largest gold ETF by value of holdings. Silver and other ETFs soon followed, with the first platinum and palladium ETFs appearing in the UK and Switzerland in 2007.
Value of ETF holdings
Source: SFA (Oxford), Bloomberg
Looking at the current value of precious metals held in ETFs it is clear that gold dominates this form of investment, with nearly six times more money in gold ETFs than in silver ETFs. The value of the metal held in platinum and palladium ETFs is a small fraction of that in gold ETFs.
Historically, precious metal investment has been via coins and bars – ETFs added a convenient new option
Gold dominates precious metals investment
69
12
4 20
10
20
30
40
50
60
70
80
Gold Silver Platinum Palladium
$bn
While this could be taken to mean that there is potential for much more investment in platinum ETFs, the amount of possible investment is limited because the platinum market is much smaller than the gold market.
Liquidity is an issue for platinum investment
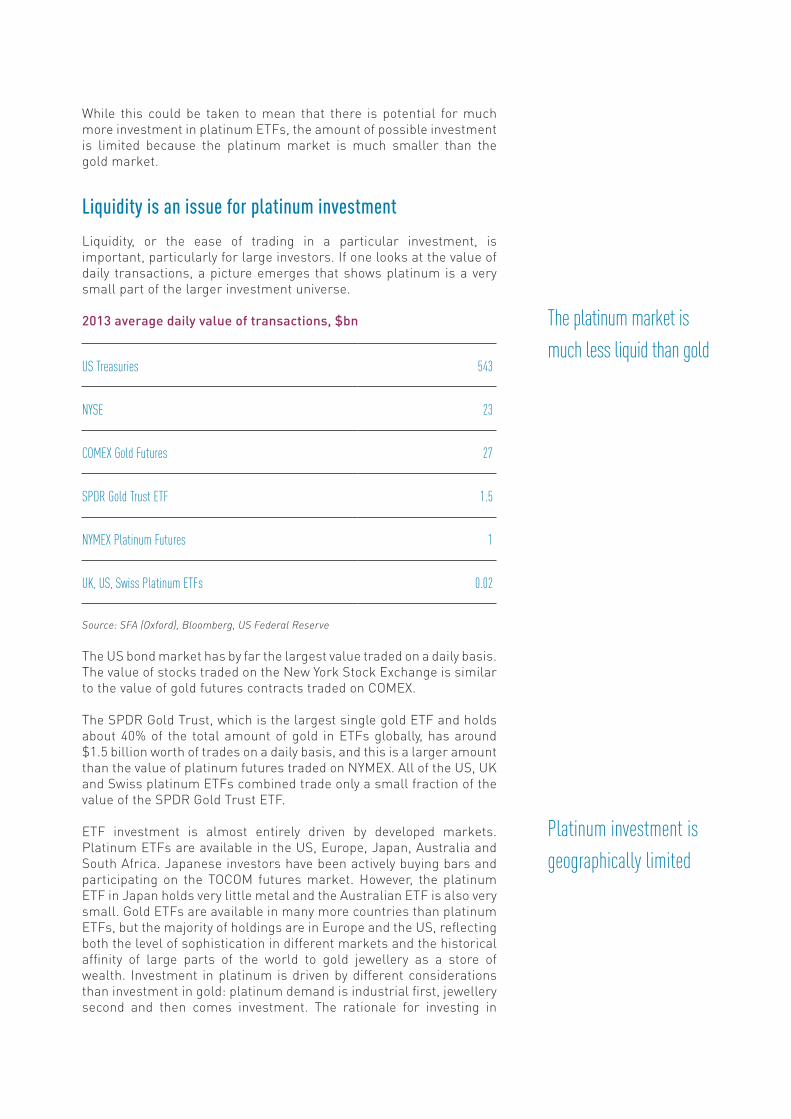
Liquidity, or the ease of trading in a particular investment, is important, particularly for large investors. If one looks at the value of daily transactions, a picture emerges that shows platinum is a very small part of the larger investment universe.
2013 average daily value of transactions, $bn
Source: SFA (Oxford), Bloomberg, US Federal Reserve
The US bond market has by far the largest value traded on a daily basis. The value of stocks traded on the New York Stock Exchange is similar to the value of gold futures contracts traded on COMEX.
The SPDR Gold Trust, which is the largest single gold ETF and holds about 40% of the total amount of gold in ETFs globally, has around $1.5 billion worth of trades on a daily basis, and this is a larger amount than the value of platinum futures traded on NYMEX. All of the US, UK and Swiss platinum ETFs combined trade only a small fraction of the value of the SPDR Gold Trust ETF.
ETF investment is almost entirely driven by developed markets. Platinum ETFs are available in the US, Europe, Japan, Australia and South Africa. Japanese investors have been actively buying bars and participating on the TOCOM futures market. However, the platinum ETF in Japan holds very little metal and the Australian ETF is also very small. Gold ETFs are available in many more countries than platinum ETFs, but the majority of holdings are in Europe and the US, reflecting both the level of sophistication in different markets and the historical affinity of large parts of the world to gold jewellery as a store of wealth. Investment in platinum is driven by different considerations than investment in gold: platinum demand is industrial first, jewellery second and then comes investment. The rationale for investing in
The platinum market is much less liquid than gold
Platinum investment is geographically limited
US Treasuries 543
NYSE 23
COMEX Gold Futures 27
SPDR Gold Trust ETF 1.5
NYMEX Platinum Futures 1
UK, US, Swiss Platinum ETFs 0.02

THE PLATINUM STANDARD SEPTEMBER 2014 23
platinum is tied to its industrial use and the outlook for the price based on forecast supply and demand.
While platinum investment could be encouraged in new markets, with China being an obvious candidate, it would require careful positioning and a concerted effort to inform investors of the benefits of holding platinum as an investment proposition.
South Africa has become the driver of ETF investment
The first platinum and palladium ETFs were launched by ETF Securities in April 2007 in the UK. These were followed by ZKB which introduced platinum and palladium ETFs in July of that year. The US platinum and palladium ETFs were launched in January 2010.
As shown in the chart below, the UK and ZKB ETFs grew to around 300 koz over the course of two years and have fluctuated between 300 koz and 500 koz ever since. The US ETF grew rapidly and surpassed the UK ETF in terms of holdings by reaching 400 koz in just under a year, and it continued to grow, passing 600 koz in June 2013. Its holdings have since fallen to 530 koz.
Global ETF holdings
Source: SFA (Oxford), Bloomberg, Absa, Standard Bank
More recently, in May 2013 Absa launched a platinum ETF (NewPlat) in South Africa. This ETF gained support from the South African fund management community and quickly expanded its holdings. It surpassed 500 moz after just over two months, became the largest platinum ETF within four months and reached 1 moz within a year. Standard Bank launched a platinum ETF in April 2014 but it has not gained much traction.
ETF holdings grow rapidly after launch but then flatten off
0.0
0.5
1.0
1.5
2.0
2.5
3.0
Apr 07 Apr 08 Apr 09 Apr 10 Apr 11 Apr 12 Apr 13 Apr 14
moz
UK Pt ETF holdings
ZKB
Other Pt ETFs
US
Julius Baer
Absa NewPlatSB Africa Platinum
South Africa
Little growth
Industrial recovery
Strikes 2012, 2014

The US and European ETFs have maintained roughly the same level of holdings since 2011 despite the mine strikes in 2012 and 2014. This suggests that most investors who want to hold a position in platinum have already invested and that there has not been a great deal of new investor interest.
UK ETF holdings
Source: SFA (Oxford), ETF Securities
US ETF holdings
Source: SFA (Oxford), ETF Securities
The mineworkers’ strikes in South Africa had only a temporary impact on the platinum price and ETF holdings in 2012 and no impact in 2014. This lack of impact has been attributed to the large level of stocks in the market, of which ETFs are the most visible part.
Strikes failed to encourage ETF investment
0.0
0.1
0.2
0.3
0.4
0.5
0.6
Volatile, but no growth Industrial
recovery
Initial uptake, followed by recession
Apr 07 Apr 08 Apr 09 Apr 10 Apr 11 Apr 12 Apr 13 Apr 14
SA strikes 2012, 2014
moz
0.0
0.1
0.2
0.3
0.4
0.5
0.6
0.7
Jan 10 Jan 11 Jan 12 Jan 13 Jan 14
Little growth, holdings reach maturity
Initial uptake
SA strikes 2012, 2014
moz

THE PLATINUM STANDARD SEPTEMBER 2014 25
South African platinum and palladium ETF holdings
Source: SFA (Oxford), Absa, Standard Bank
Standard Bank launched a palladium ETF in March 2014 and Absa launched its own palladium ETF the following month. Both of these have gained significant holdings in just a few months, with the Standard Bank ETF exceeding 500 koz and the Absa ETF clearing 400 koz. This does not appear to have been at the expense of platinum ETFs, but it has provided a closely related alternative to platinum ETFs in South Africa.
The NewPlat ETF holdings have been little changed over the last couple of months at just under 1.2 moz, perhaps a sign that the South African ETFs are reaching maturity as those of the UK and US have done.
Platinum ETFs as % of total platinum demand
Source: SFA (Oxford), Bloomberg, Absa
NewPlat ETF may be reaching maturity
So far, Pd ETFs have not been substituted for Pt
New ETFs dominate the demand profile
0%
2%
4%
6%
8%
10%
12%
2007 2008 2009 2010 2011 2012 2013
SA ETF launched
US ETF launched
Recession, demand collapses, price drops
UK & Swiss ETFs
launch
0.0
0.2
0.4
0.6
0.8
1.0
1.2
1.4
May 13 Jul 13 Sep 13 Nov 13 Jan 14 Mar 14 May 14 Jul 14
Absa NewPlat SB Africa Platinum
SB Africa Palladium Absa NewPalladiummoz

ETFs are still a relatively new investment medium and the amount of metal added in a calendar year has varied widely. In 2013, the huge demand for the NewPlat ETF saw investment exceed 10% of total platinum demand. There has been very little correlation between the metal price and the amount of ETF buying, which has so far mostly depended on whether a new ETF was launched in any given year.
South African funds have loaded up on platinum ETFs
Fund managers in South Africa saw the launch of Absa’s NewPlat ETF as an opportunity to gain direct exposure to the platinum price without having to hold the mining companies’ shares, thereby avoiding the risks associated with holding equities. As the ETF was denominated in rand, it also acted as a hedge against a weaker rand.
A survey of available information reveals that several South African mutual funds have large holdings in the NewPlat ETF. Within those fund managers’ portfolios, several funds may have exposure to the platinum ETFs, and in those funds the allocation to the NewPlat ETF represents several per cent of the funds’ total holdings.
Ownership of NewPlat shares
Source: SFA (Oxford), Bloomberg
Allan Gray and Coronation are the fund managers with the largest holdings of shares in the NewPlat ETF. Allan Gray’s Balanced Fund has the largest single exposure to the NewPlat ETF, holding over 6 million shares worth almost ZAR1 billion. The fund holds almost 5.5% of the outstanding NewPlat shares and this represents 1.8% of the fund’s asset value. For Coronation, the NewPlat ETF is the tenth-largest single holding within the Balanced Plus Fund.
ETF investment exceeded 10% of total platinum demand in 2013
SA funds have large holdings in NewPlat
9.5
6.8
3.9
3.52.4
2.4
2.1
1.8
1.6
1.5
64.6
Allan Gray Coronation Life Assurers Ltd Liberty Life Assurance
Investment Solutions
Eskom Pension & Prov
Global Balanced Portfolio Old Mutual Absa Capital Metlife Others
9.5
6.8
3.9
3.52.4
2.4
2.1
1.8
1.6
1.5
64.6
Allan Gray Coronation Life Assurers Ltd Liberty Life Assurance
Investment Solutions
Eskom Pension & Prov
Global Balanced Portfolio Old Mutual Absa Capital Metlife Others

THE PLATINUM STANDARD SEPTEMBER 2014 27
Source: SFA (Oxford), Bloomberg
Many funds have between 1% and 2% of their assets invested in the NewPlat ETF. In addition, many of these funds also have holdings of gold and palladium ETFs, which raises the funds’ overall allocation to commodities. The Allan Gray Balanced Fund also has 4.3% of its assets in the NewGold ETF, taking its overall exposure to precious metals to 6%. Some precious metal specific funds have as much as 8% of their assets in the NewPlat ETF.
The question is: how much more can ETF holdings grow in South Africa? Funds that can hold commodity investments have already invested a typical percentage of their assets in the NewPlat ETF. As was shown above, the UK and US funds added the majority of their holdings over the first two years, after which the level fluctuated but held relatively steady. From now on changes to holdings in South Africa are more likely to be shifts in the weighting within portfolios rather than position-building, as has been the case over the last year or so.
The platinum price does not always outperform the
miners’ equities
A benefit of investing in ETFs rather than the mining companies’ equities is that while still gaining exposure to the performance of the underlying metal price, it removes company-specific risks. Companies’ shares are generally considered a leveraged investment in a commodity, meaning that when the commodity price increases, the shares are expected to rise faster and vice versa.
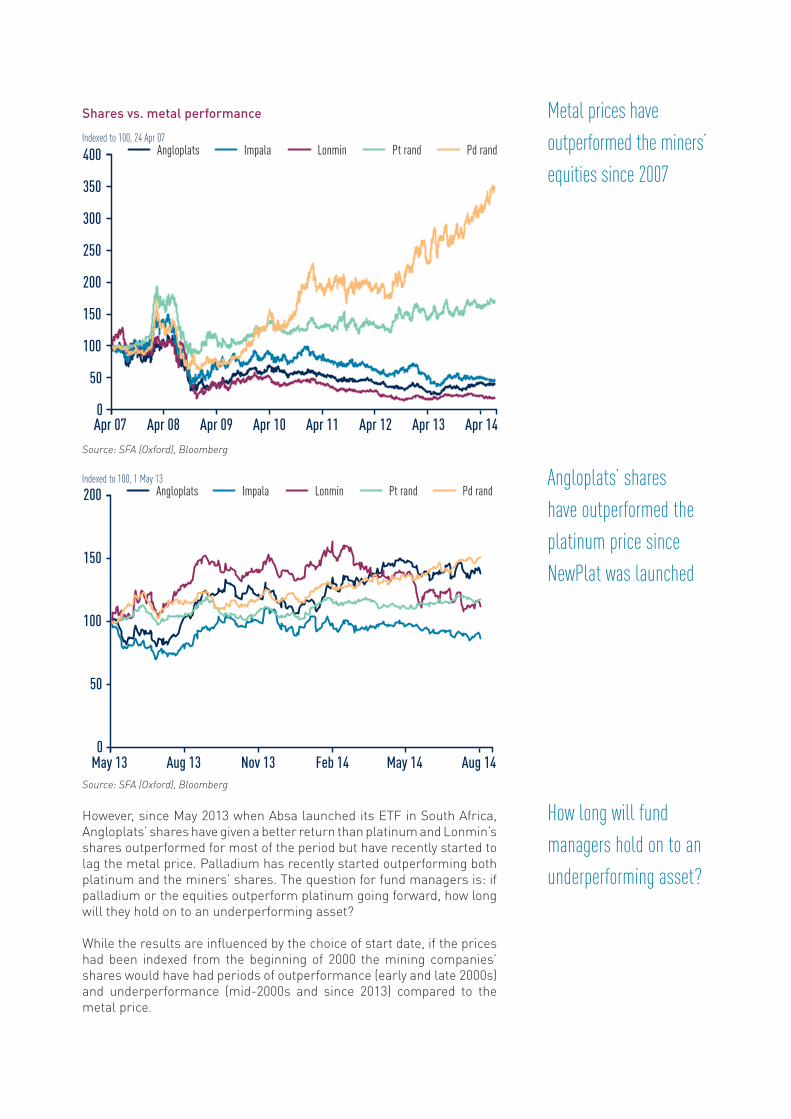
As shown in the chart overleaf, the price of platinum and palladium in rand has outperformed the rand value of the shares of the three major platinum mining companies from the launch of the first platinum ETF in the UK in April 2007. The metals’ outperformance is even more marked in US$ terms (not shown).
Allan Gray Balanced Fund
Coronation Balanced Plus Fund
Amount of NewPlat shares held 6,394,781 5,922,958
% of NewPlat shares held in fund 5.5 5.1
Pt ounces held 63,948 59,230
NewPlat % of fund 1.8 2.4
Value of NewPlat holding (ZAR M) 984 911
Total fund asset value (ZAR M) 53,885 39,112
SA funds’ large positions in NewPlat may limit further accumulation
Shares vs. metal performance
Source: SFA (Oxford), Bloomberg
Source: SFA (Oxford), Bloomberg
However, since May 2013 when Absa launched its ETF in South Africa, Angloplats’ shares have given a better return than platinum and Lonmin’s shares outperformed for most of the period but have recently started to lag the metal price. Palladium has recently started outperforming both platinum and the miners’ shares. The question for fund managers is: if palladium or the equities outperform platinum going forward, how long will they hold on to an underperforming asset?
While the results are influenced by the choice of start date, if the prices had been indexed from the beginning of 2000 the mining companies’ shares would have had periods of outperformance (early and late 2000s) and underperformance (mid-2000s and since 2013) compared to the metal price.
Metal prices have outperformed the miners’ equities since 2007
Angloplats’ shares have outperformed the platinum price since NewPlat was launched
How long will fund managers hold on to an underperforming asset?
0
50
100
150
200
May 13 Aug 13 Nov 13 Feb 14 May 14 Aug 14
Indexed to 100, 1 May 13Angloplats Impala Lonmin Pt rand Pd rand
Apr 07 Apr 08 Apr 09 Apr 10 Apr 11 Apr 12 Apr 13 Apr 140
50
100
150
200
250
300
350
400 Angloplats Impala Lonmin Pt rand Pd randIndexed to 100, 24 Apr 07
THE PLATINUM STANDARD SEPTEMBER 2014 29
ETF holdings can be pro-cyclical
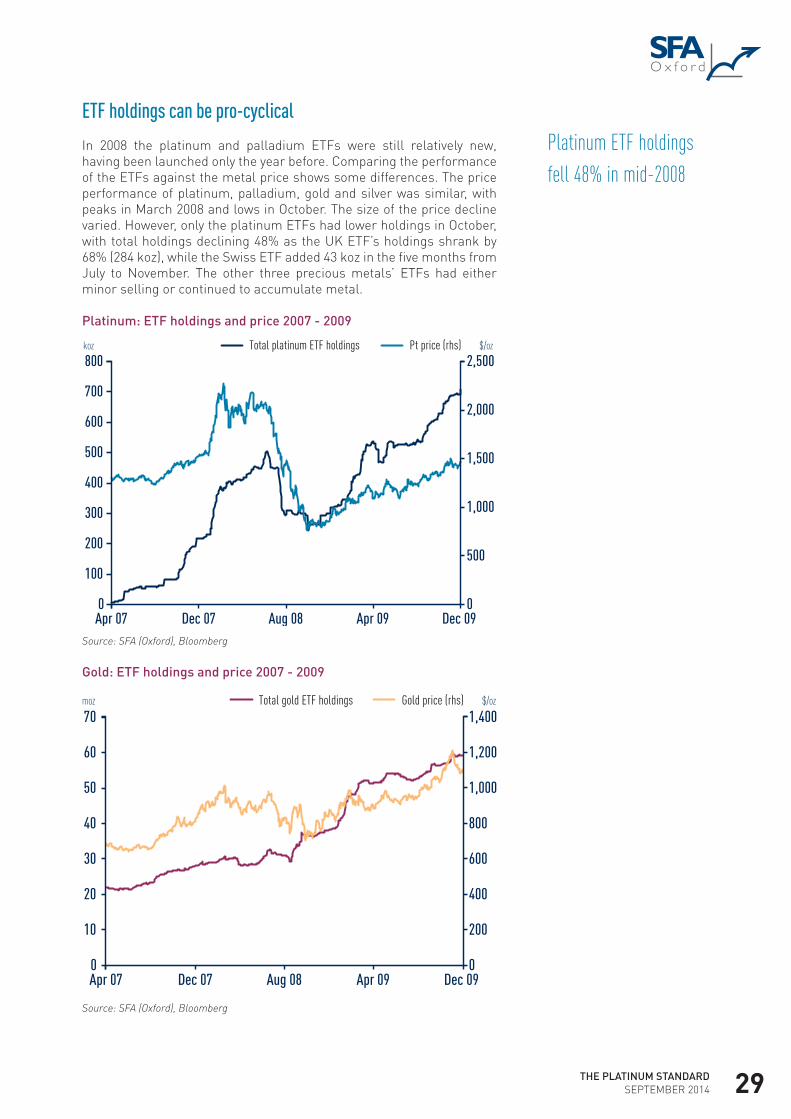
In 2008 the platinum and palladium ETFs were still relatively new, having been launched only the year before. Comparing the performance of the ETFs against the metal price shows some differences. The price performance of platinum, palladium, gold and silver was similar, with peaks in March 2008 and lows in October. The size of the price decline varied. However, only the platinum ETFs had lower holdings in October, with total holdings declining 48% as the UK ETF’s holdings shrank by 68% (284 koz), while the Swiss ETF added 43 koz in the five months from July to November. The other three precious metals’ ETFs had either minor selling or continued to accumulate metal.
Platinum: ETF holdings and price 2007 - 2009
Source: SFA (Oxford), Bloomberg
Gold: ETF holdings and price 2007 - 2009
Source: SFA (Oxford), Bloomberg
0
500
1,000
1,500
2,000
2,500
0
100
200
300
400
500
600
700
800
Apr 07 Dec 07 Aug 08 Apr 09 Dec 09
$/ozkoz Total platinum ETF holdings Pt price (rhs)
0
200
400
600
800
1,000
1,200
1,400
0
10
20
30
40
50
60
70Total gold ETF holdings Gold price (rhs)
Apr 07 Dec 07 Aug 08 Apr 09 Dec 09
$/ozmoz
Platinum ETF holdings fell 48% in mid-2008
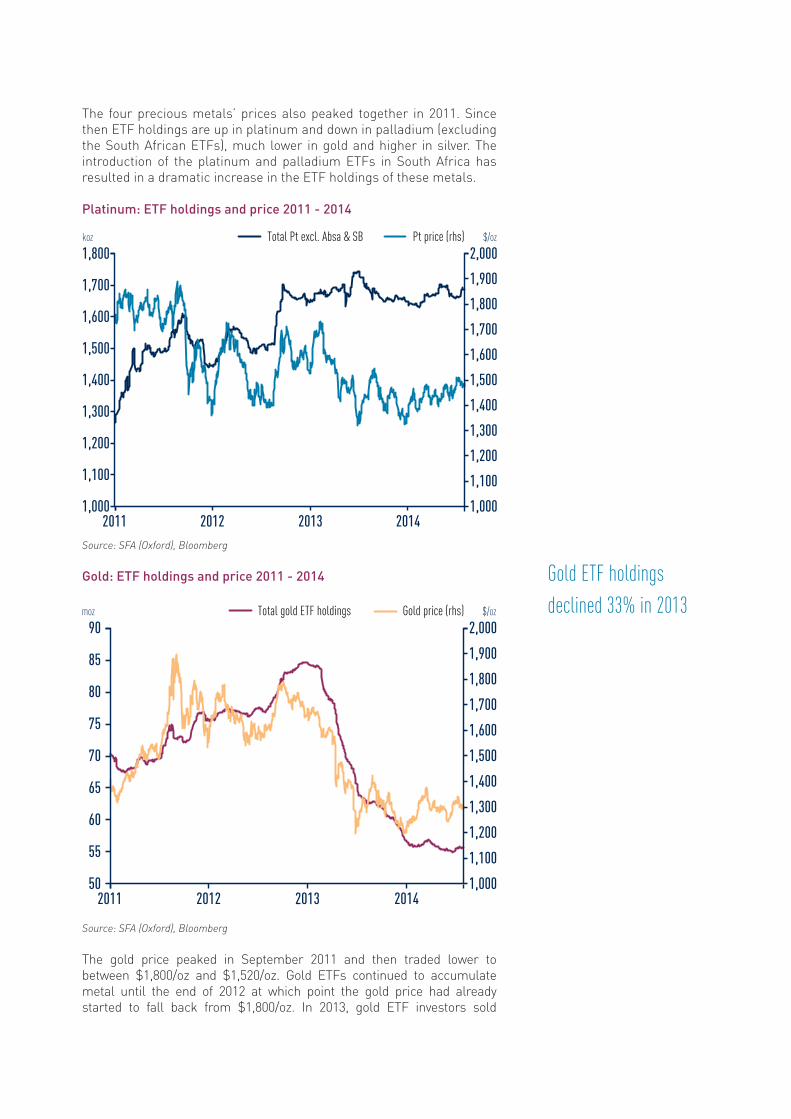
The four precious metals’ prices also peaked together in 2011. Since then ETF holdings are up in platinum and down in palladium (excluding the South African ETFs), much lower in gold and higher in silver. The introduction of the platinum and palladium ETFs in South Africa has resulted in a dramatic increase in the ETF holdings of these metals.
Platinum: ETF holdings and price 2011 - 2014
Source: SFA (Oxford), Bloomberg
Gold: ETF holdings and price 2011 - 2014
Source: SFA (Oxford), Bloomberg
The gold price peaked in September 2011 and then traded lower to between $1,800/oz and $1,520/oz. Gold ETFs continued to accumulate metal until the end of 2012 at which point the gold price had already started to fall back from $1,800/oz. In 2013, gold ETF investors sold
1,000
1,100
1,200
1,300
1,400
1,500
1,600
1,700
1,800
1,900
2,000
1,000
1,100
1,200
1,300
1,400
1,500
1,600
1,700
1,800
2011 2012 2013 2014
Total Pt excl. Absa & SB Pt price (rhs) $/ozkoz
50
55
60
65
70
75
80
85
90
2013
Total gold ETF holdings Gold price (rhs)
1,000
1,100
1,200
1,300
1,400
1,500
1,600
1,700
1,800
1,900
2,000
2011 2012 2014
$/ozmoz
Gold ETF holdings declined 33% in 2013

THE PLATINUM STANDARD SEPTEMBER 2014 31
28 moz or 33% of total global ETF holdings. If platinum ETF holders decided to sell just 20% of their current 2.9 moz, this would increase platinum supply by 580 koz.
Clearly, ETF demand can be pro-cyclical but as these investment vehicles are still very new, investors’ behaviour has not been tested under a wide range of market conditions and this makes forecasting future demand extremely difficult.
Summary: Platinum investment needs a new impetus
The outlook for platinum investment appears to be less favourable than it has been over the last few years as the easiest gains have been made. The introduction of ETFs made investment in platinum much more straightforward, but the relatively small size of the platinum market and the limited liquidity are constraints on how much investment can flow into platinum.
There are two options to increase investment in platinum: encourage more investment in existing regions or expand opportunities to new regions. Both of these options come with challenges.
Currently, the main regions with ETFs are the US, Europe and South Africa. Platinum ETFs see large additions when new ETFs are launched but then their holdings tend to vary around a particular level. The ETFs have reached maturity in the US and UK and may be reaching that point in South Africa. South African funds already hold several per cent of their assets in the NewPlat ETF, leaving the potential for further accumulation looking limited.
Since the launch of the UK and US platinum ETFs, the platinum price has outperformed the mining companies’ equities. However, since the launch of the NewPlat ETF, Angloplats’ shares have outperformed the metal. Palladium ETFs in South Africa have seen a very rapid increase in holdings but this does not appear to have been to the detriment of platinum ETFs. However, the palladium price has outperformed that of platinum and the mining companies’ equities. Fund managers will only hold on to underperforming assets for so long before they switch to a better prospect.
Platinum ETFs have expanded in the US, Europe and South Africa but have struggled in other areas. Despite platinum jewellery having a long history in Japan, investors there have shown little interest in their local platinum ETF, which is very small. While China is the largest market for platinum jewellery and an obvious candidate to have a platinum ETF, it could prove to be a tough sell.
ETF holdings are 100% liquid and can be sold instantly if the outlook or investors’ attitudes were to change. The pro-cyclical nature of ETF holdings was demonstrated in 2008 for platinum and in 2013 for gold when large percentages of the metal held in ETFs were sold.
So far, precious metal ETFs have existed under a falling and, since 2008, an abnormally low interest rate environment, with real interest rates often being negative. As such, the opportunity cost for holding an investment that has no yield is reduced. Rates will not stay low for ever and it is possible that in a rising interest rate environment these ETFs would be seen as a much poorer investment option.
ETF holdings are reaching maturity
Demand for ETFs can be pro-cyclical
ETF holdings are 100% liquid – the metal can also be sold


THE PLATINUM STANDARD SEPTEMBER 2014 33
Fuel cell vehicles: Coming to a car park near you. Eventually.


THE PLATINUM STANDARD SEPTEMBER 2014 35
Fuel cell vehicles: Coming to a car park near you. Eventually.by Dr Kerry-Ann Adamson, CEO and Founder, 4th Energy Wave
The long-awaited launch of fuel cell vehicles is finally on the horizon and interest in the potential impact of adoption on platinum demand is understandably high.
To date, most of the world’s major automotive manufacturers have a planned release date for fuel cell vehicles around the 2015 to 2017 timeframe. With the standardisation of components, cost reduction, construction of refuelling infrastructure and stack durability at an acceptable level, it is safe to say that this time round the releases will take place.
However, these releases will not be global but, at least initially, will be concentrated in a small number of geographical locations. These are likely to be California (US), Japan, South Korea and Germany, with a handful of vehicles in other areas such as the UK, Denmark, France, Canada, West Coast US and the nascent Chinese market. However, the Chinese market will be led by local marques and is unlikely to be selling imported fuel cell vehicles.
Automotive companies’ fuel cell vehicle plans
BMW, which has access to Toyota’s fuel cell stack technology, is potentially redeveloping a version of the battery ‘i3’ to be powered by a fuel cell. No date for release has been given, suggesting that this is a minimum of three to five years away.
Daimler is working with Ford and Renault-Nissan, via the Ballard (Canada) spin-out, AFCC, to co-develop a fuel cell vehicle system with common components. The aim of the agreement is that by using standardised components which are designed into a fuel cell system, overall costs will be lower from the start. Of the three companies, only Daimler has put any date on vehicle release; so far this is 2017. Currently, there are no predictions on volume from 2017.
General Motors is developing fuel cell vehicles with Honda (Japan), though it is clear that at present it is far more focused on developing its diesel car range.
Honda’s FCX is currently being retired from Californian streets as the company gears up for the launch of its next generation fuel cell vehicle in 2015. The first launches will be in Japan and California. Honda is one of the leading, if not the main, companies in terms of the development of automotive fuel cell stacks.
Hyundai-Kia is another company developing its own in-house fuel cell vehicles and stacks. By the end of 2015 Hyundai has said it plans to have shipped up to 1,000 fuel cell vehicles, with tens of thousands from 2016 onwards. This vehicle is already on the market in California, at a lease price of $499 and a down payment of $2,999. Since Hyundai-Kia is the leading developer of fuel cell vehicles in South Korea, it is likely that it will take a majority share of the South Korean fuel cell vehicle market.
The world’s major automotive manufacturers have a planned release date for fuel cell vehicles around the 2015 to 2017 timeframe
Toyota is the most bullish car company in terms of fuel cell vehicle development and deployment plans. From 2015 the company plans to release an increasing number of fuel cell vehicles up to 2020 with full mass commercialisation. At present, it is known that Toyota’s ‘Mirai’ fuel cell car will be deployed to California and across Japan. It is also likely that Germany will be added to this list.
Volkswagen is focusing on battery EVs, with very little current interest in fuel cell vehicles.
In terms of other companies developing fuel cell vehicles, Microcab and Riversimple, both of which are in the UK, are developing innovative city FCVs that use the fuel cell as a range extender to the battery. In China a number of local companies, such as Shanghai Shen-Li High Tech Co. Ltd and Sunrise Power, as well as SAIC Motor Corporation, are developing fuel cell vehicles for the home market but these are unlikely to be ready for export for some time to come.
Finally, three PEM stack companies in the UK, namely Intelligent Energy, ACAL Energy and ITM Power, are known to be working with automotive companies on future generations of fuel cell vehicles.
Of all the geographical areas being targeted for initial release, the first lead markets for fuel cell vehicles are clearly going to be Japan and California, as a result of both proactive government intervention and long-term clear intent.
Japan: Subsidy and an initial government offtaker
In July 2014, Prime Minister Shinzo Abe announced that the Japanese government would support the introduction of fuel cell vehicles with a ¥2 million ($20,000) subsidy. On top of the national subsidy, it is reported that Aichi Prefecture may provide a further ¥1 million ($10,000) for local purchases. As Toyota is based in Aichi Prefecture, this will be welcome news. With the ticket price of a Toyota fuel cell vehicle being published at ¥7 million ($70,000), the total subsidy of ¥3 million ($30,000) takes the price down to a much more affordable ¥4 million ($40,000).
The apparent level of surprise at this announcement has been confusing, as this is very clearly the Japanese modus operandi: pick a technology, develop a local industrial base and help to subsidise its initial deployment. Japan has already very heavily, and successfully, subsidised the market introduction of locally developed residential fuel cells, shown in the chart below, and it is highly likely that the fuel cell vehicle subsidy will also see a sliding scale approach.
The first lead markets for fuel cell vehicles are clearly going to be Japan and California, as a result of both proactive government intervention and long-term clear intent

THE PLATINUM STANDARD SEPTEMBER 2014 37
Japanese residential fuel cell deployment and subsidy level, 2005 - 2014
Source: 4th Energy Wave
A point of note from this chart is that in 2012 the subsidy flipped from going to the technology developer to the adopter.
Apart from the clear success of local deployment, cost reduction and refinement of the product, the impact of this long-term support has been to allow Japanese companies to break out of the home market and start to develop overseas markets. Two examples are Panasonic, with a development facility for residential fuel cells in Cardiff, UK, and Toshiba Fuel Cell Power Systems Corporation, which has a partnership with BDR Thermea for the exclusive co-development and marketing of fuel cell micro-CHP heating systems for European homes.
The automotive fuel cell financial subsidy complements the 2013 announcement, again by the Japanese government, that it would support the development and deployment of 100 hydrogen refuelling stations in four major urban areas by 2015. It is likely that these urban areas will be Tokyo, Nagoya, Kyoto and Hiroshima. The budget for these deployments is $460 million, which is anticipated to cover around 50% of the installation costs. Of the 100 stations, JX Energy is slated to deploy 40, with Toho Gas and Iwatani Corporation a further 20.
To round off the support for fuel cell vehicles provided by the Japanese government, was the statement on 25 July 2014 that all ministries and other offices across Japan are to introduce fuel cell cars as official vehicles. This move has created an initial stable offtaker market for fuel cell vehicles.
There will be a range of impacts arising from the Japanese support for fuel cell vehicles. SFA forecasts these will include:
The uptake of fuel cell vehicles in Japan will be higher than any other country in the world until the mid-2020s at the earliest.
The uptake of fuel cell vehicles in Japan will be higher than any other country in the world until the mid-2020s at the earliest
16,000
14,000
12,000
10,000
8,000
6,000
4,000
2,000
0
60,000
50,000
40,000
30,000
20,000
10,000
02005 2006 2007 2008 2009 2010 2011 2012 2013 2014
US$Numbers installed (annual) Subsidy level (US$)Annual numbers installed

By 2020 the price of fuel cell vehicles made in Japan will be lower than from other manufacturers, and will exhibit a steeper cost reduction rate than their competitors.
There is potential that the standards created in Japan for hydrogen will become the de facto standards around the world.
California: Leading the way in legislation
The California Fuel Cell Partnership is an organisation part-funded by, and working with, the automotive industry. As well as providing comprehensive education about fuel cell vehicles, it annually surveys its members on their vehicle release plans. The 2013 survey asked the vehicle companies to respond regarding the number of cars they planned to bring to California over the next few years. The collated responses from the survey show that by 2020, 18,454 vehicles are planned to be deployed across California. The survey was created to ensure that no one company can be identified but we can safely assume that the vehicles will come from a handful of companies such as Honda, Toyota and Daimler.
Survey responses for cumulative Californian fuel cell vehicle deployment, 2013 - 2020
Source: California Fuel Cell Partnership
In a somewhat similar manner to Japan, the deployment in California is being driven by government action. In this case it is the highly modified, altered, re-altered, re-written and re-modified Zero Emission Vehicle (ZEV) programme.
Under the ZEV mandate, BMW, Chrysler, Ford, General Motors, Honda, Hyundai, Kia, Mazda, Mercedes, Nissan, Toyota and Volkswagen are all required to sell a certain number of zero emission vehicles, which are either battery or fuel cell EVs, or transitional zero emission vehicles (TZEVs). The specific mix of vehicles released on the road provides the company with ‘credits’. By law, the companies much reach a certain credit level and this level ramps up by volume of vehicles sold in California and over time.
0
20,000
18,000
16,000
14,000
12,000
10,000
8,000
6,000
4,000
2,000
2013/2014 2017 2020
Car C
ompa
nies S
urve
y-Ba
sed C
alifor
nian F
CV C
ount
6,650
125
18,454
The collated responses from the survey show that by 2020, 18,454 vehicles are planned to be deployed across California
THE PLATINUM STANDARD SEPTEMBER 2014 39
Whilst the equations to calculate the credit available per vehicle type can be complex, the baseline is that a minimum of at least one-fifth of a company’s credits must be made up from sales of pure ZEVs. The remainder can be a mix of TZEVs and ZEVs. To date, the ZEV mandate has seen 330 fuel cell vehicles, 5,200 battery EVs and 28,800 neighbourhood EVs released onto California’s roads, all of which are classed as ZEVs.
California, though leading the way, is not the only state in the US with a ZEV mandate. New York, Massachusetts, Oregon, Vermont, Maryland, Connecticut and Rhode Island have joined with California to push for zero emission vehicles. Within the ‘8-State Coalition’, California is so far the only state to legislate on the quantity of vehicles, but there is discussion that some of the other states will legislate on this matter sooner rather than later. If and when they do, it is these states that will pick up the baton from California and start to see deployment of infrastructure and vehicles.
In terms of infrastructure, California plans to install 100 hydrogen fuelling stations by 2020. In July 2014 the California Energy Commission gave final approval to proposals for $46.6 million to build and deploy an initial 28 hydrogen refuelling stations state-wide.
As a result of actions in regions and countries such as Japan, California, Germany and South Korea, this time around the deployment of fuel cell vehicles into the global automotive parc will take place, and is already starting. By the time of the launch of the next generation fuel cell vehicle and automotive fuel cell stack in 2020, volumes on the road will be tens of thousands of vehicles, with ramp-up post-2020 being much steeper.
Fuel cell cars and platinum
Fuel cell cars employ a low temperature polymer electrolyte membrane (PEM) fuel cell stack, which itself employs a PGM catalyst. The fuel cell, the ‘engine’ of the vehicle, is usually around 80 kW (approximately 114 bhp).
The US Department of Energy (US DOE), the European Union and the Japanese government have funded well over $1 billion worth of research over the last decade into reducing platinum loadings in PEM stacks for vehicles. The results, shown in the chart overleaf, are the 2013 best-in-class, non-laboratory bench loadings for an 80 kW PEM automotive fuel cell stack. In 2013, an 80 kW automotive stack contained 0.172 g Pt/kW.
A few points to take into account about this figure are:
A general rule of thumb is that the best-in-class figures are thought to be one to two generations behind in-use stacks. For automotive stacks though, as stack generations tend to be much longer, this figure is probably much closer to on-road vehicles. From this we can impute that a vehicle on the road today contains approximately 13.6 g of platinum.
Going forward, developers are confident that the 0.125 g Pt/kW in 2017 is achievable in the given timeframe and that post-2020, when the next generation of automotive fuel cell stacks is released on the
California, though leading the way, is not the only state in the US with a ZEV mandate
California Energy Commission gave final approval to proposals for $46.6 million to build and deploy an initial 28 hydrogen refuelling stations state-wide

road, this will be much lower again, potentially bringing automotive fuel cell stack loadings only a factor or two higher than current autocatalyst loadings.
The PGM loadings on a stack are not equally divided between the cathode and the anode. The cathode typically has a much higher percentage of the loadings than the anode. Research, therefore, is more heavily focused on the cathode side of the stack.
No such detailed figures currently exist for palladium usage in fuel cells, though it is known to be increasing.
80 kW automotive fuel cell stack platinum loadings, 2005 - 2017
Source: Collated from US DOE reports
Primary platinum usage is only half of the developing picture. Although at present recycling of platinum from fuel cells is minimal, it is forecast to be one of the largest growth industries in the sector. We are already seeing dedicated recyclers spring up in the US, and this will likely be mirrored in China and potentially South Africa.
Targets for recycled platinum are 98%, which means that for any automotive fuel cell carrying 13.6 g, at the end of its life, e.g. in seven years, 13.3 g could be stripped out and reused.
Though at present the 98% target is not achieved, it is a key development target for a number of organisations. With the development of recycling of the actual MEA membrane, which is currently dominated by Nafion, a perfluorosulfonic membrane, it is likely that this 98% platinum recyclability will be achieved within the next decade – only a couple of years after the end-of-life of the first fuel cell vehicles.
The use of recycled platinum in fuel cells, which is already in some circles being dubbed “green platinum”, will be based more on politics and marketing than engineering. By 2025, therefore, primary platinum demand from automotive fuel cells will be as dependent on the
0
1.4
1.2
1.0
0.8
0.6
0.4
0.2
2005 2007 2009 2011 2013 2015 2017
gPt/kW
Target loadings

THE PLATINUM STANDARD SEPTEMBER 2014 41
marketing of this green platinum as the availability of the vehicles. Secondary to this, in California, the US, and probably initially in Europe, the vehicles are being leased, which means that recycling of used fuel cell systems should be a lot simpler than the tracking and collection of dead autocatalysts. This implies that recycling rates will be high from market inception onwards.
What does the platinum industry need to do?
The platinum industry is undoubtedly going to play a major role in the evolving fuel cell sector, and not just in the fuel cell vehicle industry. What is clear is that an understanding of the jewellery or autocatalyst markets is not tantamount to that of the fuel cell market; it is a different beast entirely. There are no grand challenges that, once removed, mean everything will fall into place and allow adoption to sprint up the S-curve. There are numerous smaller challenges, each one needing to be worked through, or addressed, and these will take time and potentially require support.
If the platinum industry wants to be involved in the growth of the fuel cell sector rather than merely take a supply chain role, it will need to be actively engaged in the sector for some time to come.


The PGM markets in 2014
PtPLATINUM
78
195.
08
PdPALLADIUM
46
106.
42
RhRHODIUM
45
102.
91


THE PLATINUM STANDARD SEPTEMBER 2014 45
The PGM markets in 2014The platinum market
Summary and stocks
In the last few years the market has become preoccupied with stocks and there is general confusion over what to include or exclude in reconciliations and the computation of the supply-demand balance. However, there has clearly been more than sufficient metal available to meet market requirements this year.
The market is forecast to be in fundamental deficit of 1.51 moz in 2014, which excludes sales of pipeline inventories by producers (+484 koz) and additional metal allocations by ETFs (+245 koz, January-August). Including the net impact of ETF changes and producer sales would yield a deficit of 1.27 moz. However fundamentals are compiled, there will be a major destocking of the market.
Yet the difference between monthly average platinum prices in January and August is just $27/oz. In fact, prices contracted by $37/oz throughout August to the low $1,400s of early this year, which is lower than the annual averages of the last four years despite the largest fundamental deficit that SFA has ever recorded.
One of the reasons is that stocks have built up since the financial crisis when automotive sales collapsed, palladium was increasingly substituted for platinum in diesel catalytic converters, and recycling rose to largely offset stagnant primary supply growth.
SFA’s estimate of all-in stocks is 10 moz by the end of this year. This includes metal allocated to investment (incl. ETFs) and working inventory in all end-uses, but excludes consumer stocks (jewellery) and catalysts in vehicles on the road. Much of this metal can be considered relatively sticky and unlikely to return to market in the near term, but could be considered a risk over the longer term. Take a shutdown of an oil refinery or redemptions of ETFs as an example where metal can return to market. SFA takes a holistic view on stocks to avoid surprises.
If we consider short-term market liquidity however, i.e. to exclude working inventory required for the closed-loop part of the market (oil, chemical and glass industries) and metal allocated to ETFs, there will still be in the region of 1.4 moz of excess stock by the end of the year.
Furthermore, it should be highlighted that the demand pull that sent platinum prices to over $2,000/oz in 2008 no longer exerts the same force today. Autocatalyst demand accounted for 50% of total demand in 2008 but only 38% today. Conversely, more price elastic jewellery demand accounted for 26% of demand in 2008, but has risen to 37% today. Industrial users have also shifted from an attitude of securing supply to trading in and out of the market and hedging.
Mine production
Mine output is forecast to contract by a net 1.31 moz year-on-year to 4.69 moz, with yield from South Africa at 2.9 moz, a drop of 1.33 moz, of which 1.1 moz was a result of the five-month AMCU strike. However, in sales
Fundamental deficit of 1.51 moz
But prices are flat
Stock overhang of 1.4 moz of excess liquidity estimated by year-end
Demand has become more price elastic
Supply down 1.31 moz; 1.1 moz due to the strike
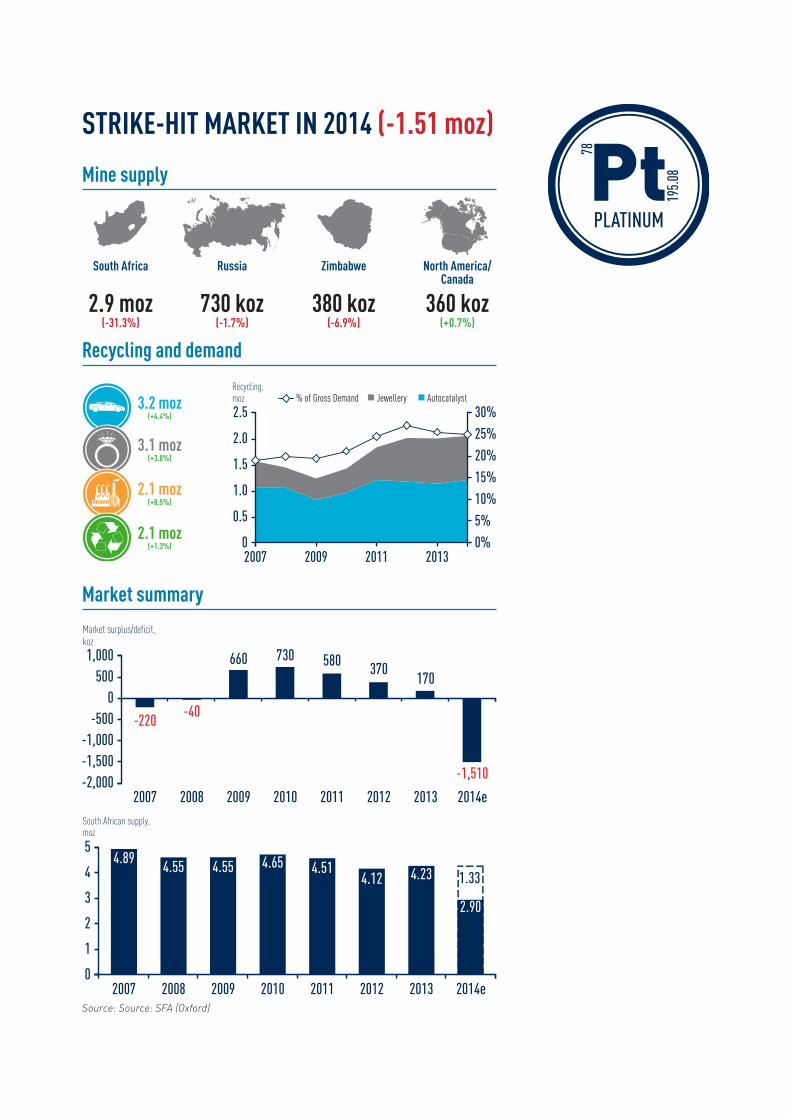
STRIKE-HIT MARKET IN 2014 (-1.51 moz)
Mine supply
Recycling and demand
Market summary
PtPLATINUM
78
195.
08
2.9 moz(-31.3%)
730 koz(-1.7%)
380 koz(-6.9%)
360 koz(+0.7%)
1,000500
0-500
-1,000-1,500-2,000
Market surplus/deficit,koz
2007 2008 2009 2010 2011 2012 2013 2014e
-220-40
660 730 580 370170
-1,510
5
4
3
2
1
0
South African supply,moz
2007 2008 2009 2010 2011 2012 2013 2014e
4.89 4.55 4.55 4.65 4.514.12 4.23
2.90
1.33
3.2 moz(+4.4%)
3.1 moz(+3.8%)
2.1 moz(+8.5%)
2.1 moz(+1.3%)
2.5
2.0
1.5
1.0
0.5
0
30%
25%
20%
15%
10%
5%
0%2007 2009 2011 2013
Recycling,moz Jewellery Autocatalyst% of Gross Demand
South Africa Russia Zimbabwe North America/Canada
Source: Source: SFA (Oxford)
THE PLATINUM STANDARD SEPTEMBER 2014 47
rather than production terms, South African supply will be an estimated 3.38 koz, accounting for producer pipeline destocking during the strike, though there will be pipeline restocking in H2’14 of potentially 100-150 koz.
There is great uncertainty as to how South African supply profiles will look going forward as producers evaluate the next six months of recovery and cash generation. Expect announcements on business plans, restructuring and strategy early next year and this will dictate the severity of market deficits going forward.
Outside South Africa, supply looks set to remain almost flat year-on-year at 1.79 moz, with some variations by country. Output from Russia is forecast to be down just 10 koz to 730 koz, while production in Zimbabwe is set to fall 30 koz to 380 koz owing to the underground collapse at Zimplats’ Bimha mine, which is now closed for safety reasons. This is the first drop in the country’s output since mining began in the mid-1990s. Increased supply from the ‘Other’ category, which includes tailings and other by-product output, is forecast to offset falls in Zimbabwe and Russia, rising 60 koz to 680 koz. This is mainly due to the ramp-up at Tharisa’s PGM-chrome operation, the addition of some Broken Hammer ounces from Canada and slight improvements elsewhere.
Demand
Demand is forecast to rise by 5.4% to 8.27 moz in 2014, the highest growth rate since 2011, and finally exceeds pre-financial crisis levels in 2007. Nonetheless, in net demand terms, after recycling which is estimated to be up 500 koz over the same period, consumption will still be 400 koz lower than in 2007.
Automotive demand
Automotive demand is set to be up 130 koz (4.3%), mainly from higher PGM loadings associated with Euro 6 emissions legislation, despite relatively flat production in the region, which adds 80 koz. Meanwhile, North America and India add 20 koz each and the Rest of the World the remainder on higher vehicle production.
Euro 6 legislation for diesel and gasoline light vehicles came into force for new vehicle approvals on 1 September 2014, and will apply to all new registrations from 1 September 2015. The main change is to cut the diesel NOx limit by more than half to 80 mg/km. Selective catalytic reduction (SCR) technology, which does not use PGMs, is being deployed on larger diesel cars to comply with Euro 6. Other NOx-reducing technologies, such as lean NOx traps (LNT), which contain platinum as the oxidation catalyst and rhodium as the reduction catalyst, are being deployed by vehicle manufacturers.
Euro 6 for diesel heavy-duty vehicles came into force on 1 January 2014 and tightened particulate emissions from 0.02 g/kWh to 0.01 g/kWh and NOx emissions from 2.0 g/kWh to 0.40 g/kWh compared to Euro 5, which has boosted the use of platinum in diesel particulate filters (DPFs).
Non-road heavy-duty diesel vehicles are also now increasingly legislated, and the introduction of Stage 4 in Europe and Tier 4 final in North America has supported platinum demand through the use of diesel oxidation catalysts (DOCs) and DPFs.
Too early to say how supply profiles will look next year
Supply flat outside South Africa
Demand 5.4% higher
Automotive demand up 4.3%
Emissions legislation tightening

The net result is that the platinum intensity of use for all on-road vehicles in Europe is estimated to rise by 4.4% in 2014 compared to 1.7% in 2013, owing to higher loadings of platinum per diesel catalyst to adhere to tighter legislation. This is the largest rise in the use of platinum since 2011 (5.1%), when the diesel share of passenger car registrations rose to peak at 56% from 52% the previous year (source: ACEA). However, it falls well short of the pre-crisis/pre-palladium substitution 2000s when platinum’s intensity of use rose by an average of 12.6% p.a. At the same time, diesel’s share of registrations grew from just 33% to 54% by 2007.
According to vehicle data from LMC Automotive, global vehicle sales growth for 2014 has been downgraded from 5.0% at the end of last year to 3.6% currently. Despite this, regional numbers have been supportive of platinum demand, with Western European sales up 5.9% to the end of July and forecast to rise 4.9% for the year.
Jewellery demand
Global jewellery consumption is expected to increase by 4.1% to 3.06 moz in 2014, which equates to 120 koz of extra demand versus 180 koz in 2013.
Demand in China is estimated to be up 2% (40 koz), breaching 2 moz for the first time. However, trade flows and trading of platinum in China are well down on exceptional levels in 2013 during periods of lower prices. An estimated 2.48 moz was exported to China and Hong Kong in 2013 versus annualised trade of 1.89 moz in 2014. Meanwhile, cumulative trade on the SGE, a traditional source of metal for the jewellery industry, is only 700 koz year to date to the end of August compared to 900 koz over the same period in 2013.
Jewellery demand in the Rest of the World is forecast to accelerate by 20% this year, albeit from a low base of 200 koz in 2013. This is mainly due to an estimated 25% rise in consumption in India to 175 koz. A successful marketing campaign by the PGI is bearing fruit and is leading not only to an increased sales volume of platinum jewellery, but also to greater average weights per item of jewellery.
Industrial demand
Total industrial usage is projected to grow 9% to 2.06 moz. More than half of the growth (+91 koz) is expected to come from the building of new glass capacity. The next major contributor is chemical demand (+24 koz). Both are cyclical in nature, so demand may not grow as strongly next year.
New flat panel display capacity for glass in China and South Korea is forecast to provide a one-off boost to industrial demand. Year-on-year growth in platinum for use in glass plants is estimated at 35% to 350 koz. This also includes growth in other glass capacity in South America, Thailand and China.
Chemical demand is being lifted by new plants for the production of propylene using the propane hydrogenation catalytic process requiring platinum. Fifteen new plants are scheduled over the next couple of years, mainly in China but also in the US.
There is now an abundant supply of propane feedstock from the US (from shale gas) and the Middle East.
Platinum loadings rise 4.4% in Western Europe
Jewellery demand up 4.1%, but slower growth in China
Industrial requirements to grow 9%

THE PLATINUM STANDARD SEPTEMBER 2014 49
Recycling
Total recycling is forecast to increase just 2.5% to 2.07 moz in 2014. Autocatalyst recycling is estimated to rise by 6.1% to 1.21 moz. On-going growth from the scrapping of diesel catalysts in Western Europe is expected to lift recycling by 91 koz.
Recycling would have been higher, but growth in Europe is partially offset by a decline in the US, where the availability of scrapped second-hand cars has fallen – a hangover from the financial crisis. Jewellery recycling is estimated to remain largely flat, losing just 20 koz on 2013 levels to 850 koz, 67% of which comes from China.
The palladium market
Summary and stocks
The palladium market is projected to destock by 1.75 moz this year, compared to a deficit of 960 koz in 2013. The majority of the greater drawdown is due to a 490 koz drop in supply to 8.26 moz, while demand grows 300 koz to 10.01 moz.
By the end of 2014, total stocks are estimated at over 15 moz. However, relatively liquid stocks (excluding ETF holdings of 2.79 moz at the end of August and illiquid stocks) would leave the market with close to 6 moz of near-term liquidity. Sponge-to-ingot premiums reached highs of up to $11/oz in April, but have settled back to normal levels of $4/oz or below. It appears that the squeeze on sponge supplies has arrested for now. This could be linked to the sharp rise in ETF holdings from new offerings from Standard Bank and Absa in South Africa, which launched at the end of March and early April respectively. Between the end of March and the end of August, ETFs in South Africa have accumulated 967 koz of palladium.
However, like sponge premiums, global ETF holdings have declined recently, peaking at 2.93 moz in early August but then dropping to 2.79 moz by the end of the month. The majority of the decline was recorded in the London ETF which lost 121 koz over the period.
Mine production
Supply from South Africa is estimated to fall by 23.8% to 1.76 moz in 2014, the lowest yield since the mid-1990s. Including producer sales, supplies are close to 2 moz (est.), which is well down on mine output of 2.31 moz in 2013.
Russian production is forecast to decline slightly to 2.54 moz. Meanwhile, in Zimbabwe consistent growth over the last six years has been curtailed by the Bimha mine closure, which keeps output flat at an estimated 310 koz for the year. Other supply is up just 30 koz to 1.37 moz.
Demand
Global demand is forecast to breach 10 moz for the first time in 2014. Automotive usage is estimated to grow by 460 koz (6.4%) to 7.63 moz in 2014 at the expense of other end-uses, which are expected to drop by 160 koz (6.3%) to 2.38 moz.
Recycling growth limited to 2.5%
A fundamental market deficit of 1.75 moz this year
Demand breaches 10 moz for the first time

LARGE DEFICIT IN 2014 (-1.75 moz)
Mine supply
Recycling and demand
Market summary
PdPALLADIUM
46
106.
42
1.8 moz(-23.7%)
2.5 moz(-1.6%)
310 koz(-1.2%)
990 koz(+1.4%)
500
0
-500
-1,000
-1,500
-2,000
Market surplus/deficit,koz
2007 2008 2009 2010 2011 2012 2013 2014e
-210
170
-430 -470
-1,040 -960
-1,750
-500
3
2
1
0
South African supply,moz
2007 2008 2009 2010 2011 2012 2013 2014e
2.54 2.35 2.42 2.56 2.52 2.32 2.31
1.76
0.55
7.6 moz(+6.3%)
1.7 moz(-3.5%)
440 koz (-9.6%)
2.3 moz(+3.6%)
2.5
2.0
1.5
1.0
0.5
0
25%
20%
15%
10%
5%
0%2007 2009 2011 2013
Recycling,moz Jewellery Autocatalyst
% of gross demandWEEE
South AfricaRussia ZimbabweNorth America/Canada
Source: Source: SFA (Oxford)

THE PLATINUM STANDARD SEPTEMBER 2014 51
The ‘perfect storm’ of supply shortages, new ETF products and strong automotive demand has served to lift prices by 25.6% from January to August. Consequently, electronics, chemical, dental and jewellery requirements are forecast to fall by 4.4%, 3.9%, 9.6% and 16.9% respectively. It could be argued, therefore, that palladium demand has entered the substitution zone.
According to LMC Automotive, light vehicle sales in China have risen by 9.2% in the year to July and are forecast to reach 10.3% for the year. This increase, combined with growth of 4.9% in US sales over the same period and a year-on-year forecast of 3.9%, means that demand pull for palladium remains strong. Requirements in China and North America are projected to rise by 170 koz and 140 koz respectively. China is promoting electric vehicles and curbing urban registrations, but the net impact will be limited. Expect strong sales growth to continue for years to come. In North America, however, significant sales incentives and very long credit terms of up to seven years pose a risk to future growth.
Recycling
Secondary supplies are forecast to be up just 3.2% this year to 2.28 moz compared to 12.8% growth in 2013. Much of the expansion in recycling in 2013 was due to the flow of scrapped catalysts from a sharp rise in the number of end-of-life vehicles in the second half of 2012. In 2013, however, the number of scrapped vehicles available to recycle fell and this has affected the pipeline of catalysts for recycling in 2014. Other recycling is forecast to remain largely flat year-on-year. Secondary jewellery supplies are likely to be down 30 koz, but this is a result of declining demand in China.
The rhodium market
Summary and stocks
The market is estimated to be in deficit by 200 koz in 2014 owing mainly to a 130 koz drop in output from South Africa. Supply from elsewhere remains essentially flat.
Automotive requirements, the metal’s main end-use (81% of demand), continue to recover steadily, up by 50 koz to 870 koz. However, this is still 130 koz down on 2007 levels. The lean NOx trap (LNT), containing rhodium, continues to offer a practical solution to NOx removal, which is critical to Euro 6 compliance for light vehicles.
Other industrial demand, namely glass, is expected to increase by 40 koz following numerous plant capacity builds, as highlighted in the platinum section earlier.
SFA’s global stock estimates are just under 1 moz at the end of the year. However, the short-term, relatively liquid fraction of stock, when excluding ETF holdings and non-automotive working inventory, is much lower. The future rate of stock exhaustion going forward depends on the speed at which producers ramp up production in the coming years to avert oversupplying the market. Likewise, rhodium arguably has the best catalytic properties of the PGMs, so there should be inherent growing requirements from automakers as emissions legislation continues to
Palladium has entered the substitution zone
Rhodium market destocking
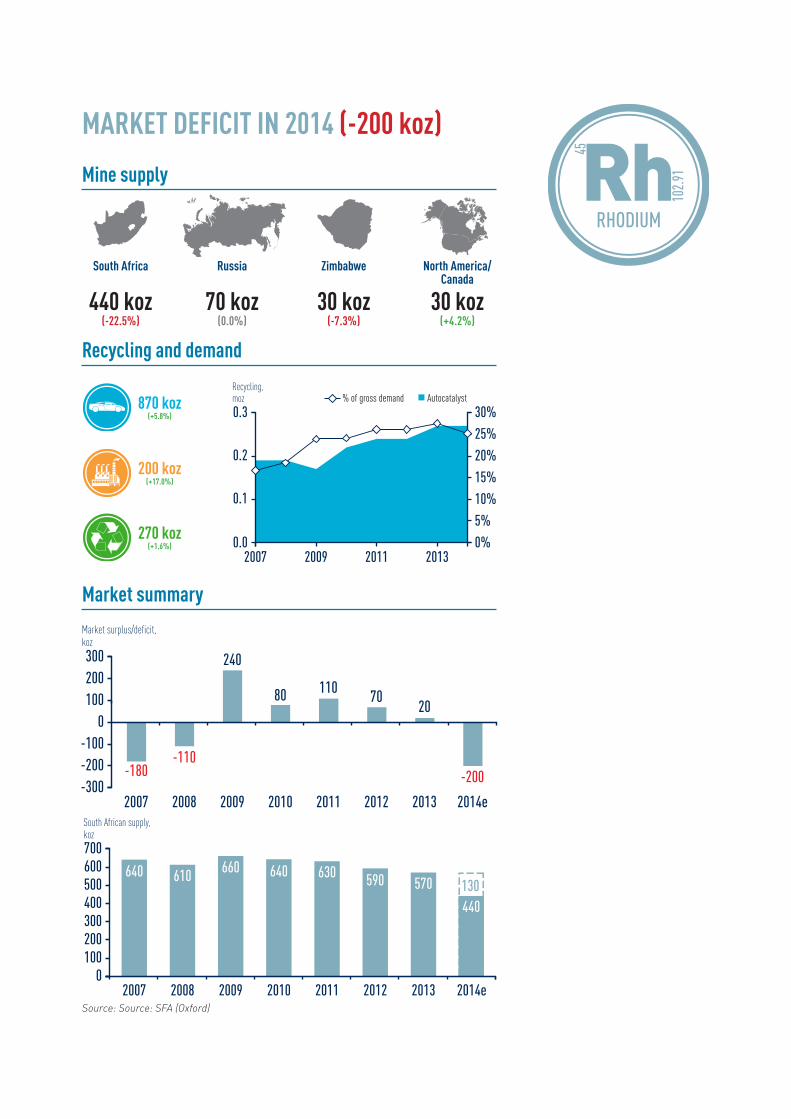
MARKET DEFICIT IN 2014 (-200 koz)
Mine supply
Recycling and demand
Market summary
RhRHODIUM
45
102.
91300200100
0-100-200-300
Market surplus/deficit,koz
2007 2008 2009 2010 2011 2012 2013 2014e
-180
240
80 110 7020
-200-110
700600500400300200100
0
South African supply,koz
2007 2008 2009 2010 2011 2012 2013 2014e
640 610 660 640 630 590 570
440130
870 koz(+5.8%)
200 koz(+17.0%)
270 koz(+1.6%)
440 koz(-22.5%)
70 koz(0.0%)
30 koz(-7.3%)
30 koz(+4.2%)
0.3
0.2
0.1
0.0
30%
25%
20%
15%
10%
5%
0%2007 2009 2011 2013
Recycling,moz Autocatalyst% of gross demand
South Africa Russia Zimbabwe North America/Canada
Source: Source: SFA (Oxford)

THE PLATINUM STANDARD SEPTEMBER 2014 53
tighten. Producers are working with end-users to encourage greater use of rhodium in future. As discussed in the first issue of The Platinum Standard, higher rhodium prices are required to secure increased quantities of palladium and platinum from South Africa.
The price outlook for the next six months
Platinum $1,440/oz
The market fundamentals appear to have weakened to pre-strike levels and output from South Africa is ramping back up, increasing the risk of a stock build. Nonetheless, a great deal of uncertainty remains as regards the mine production profile for 2015 and beyond. Only when post-strike operating cost and capital budgets have been reset will decisions be made on the shape of mining profiles ahead. In the near term, therefore, expect prices to languish around current levels and perhaps dip lower. In the first quarter of 2015, however, prices should start to recover as company restructuring and operational strategies become clear. Ultimately, it is likely that production will be lower rather than higher than historical guidance.
Palladium $850/oz
Record deficits and the consistent erosion of stocks ahead suggest the market can only tighten going forward unless a major intervention in fundamentals occurs. However, the perceived tightness of the market this year, which sent sponge premiums soaring, appears to have subsided. NYMEX futures contracts remain very close to record longs, while short positions, which were weighty at the beginning of August, have largely exited. ETF holdings fell by 136 koz in August to 2.79 moz with little reason to rally in the near term as South African holdings appear to have levelled out for now. A further price dip in the near term is possible therefore, but underlying fundamentals remain overwhelmingly positive and we expect palladium prices to continue to narrow the gap to platinum going forward.
Rhodium $1,200/oz
While the market is in deficit this year, there is still a stock overhang, and as producers in South Africa lift output, there is the risk of oversupply over the medium term. The strategy announcements for platinum in early 2015 will dictate how high rhodium prices will go in future. For now, SFA believes that there will be a number of false starts as prices rally and dip to get sustainably over $1,300/oz early next year.

Appendix
PtPLATINUM
78
195.
08
PdPALLADIUM
46
106.
42
RhRHODIUM
45
102.
91
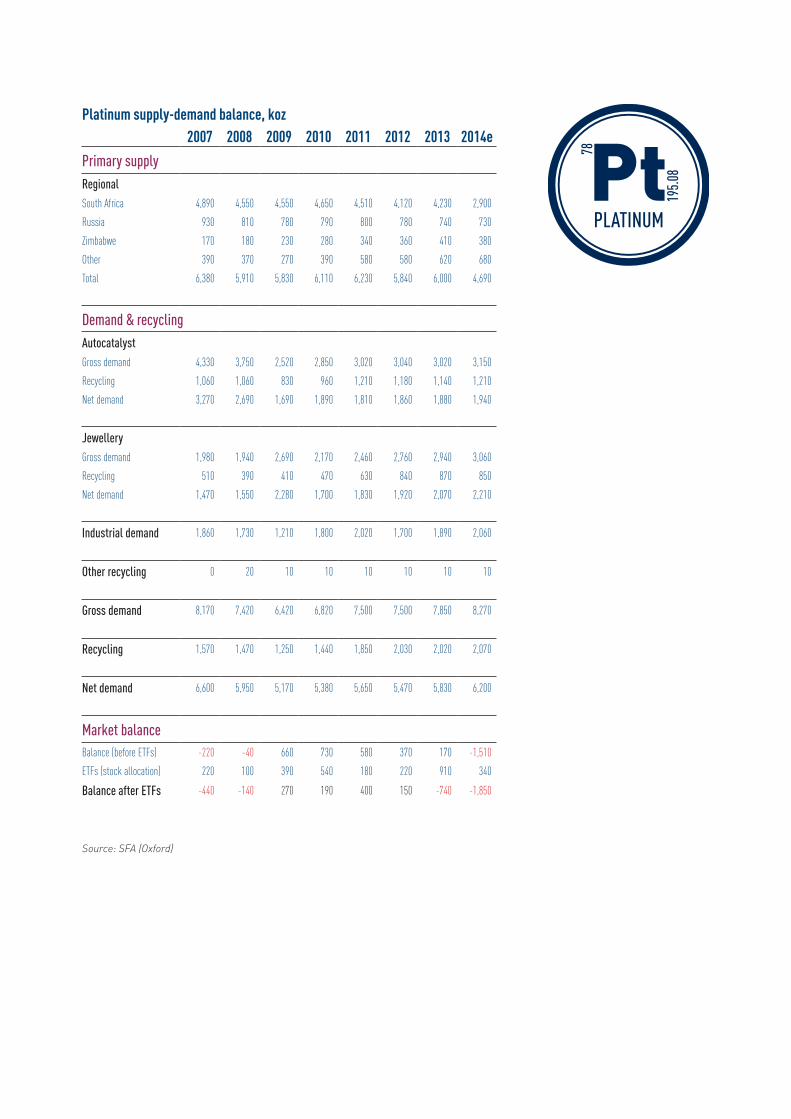
Platinum supply-demand balance, koz2007 2008 2009 2010 2011 2012 2013 2014e
Primary supplyRegionalSouth Africa 4,890 4,550 4,550 4,650 4,510 4,120 4,230 2,900
Russia 930 810 780 790 800 780 740 730
Zimbabwe 170 180 230 280 340 360 410 380
Other 390 370 270 390 580 580 620 680
Total 6,380 5,910 5,830 6,110 6,230 5,840 6,000 4,690
Demand & recyclingAutocatalystGross demand 4,330 3,750 2,520 2,850 3,020 3,040 3,020 3,150
Recycling 1,060 1,060 830 960 1,210 1,180 1,140 1,210
Net demand 3,270 2,690 1,690 1,890 1,810 1,860 1,880 1,940
JewelleryGross demand 1,980 1,940 2,690 2,170 2,460 2,760 2,940 3,060
Recycling 510 390 410 470 630 840 870 850
Net demand 1,470 1,550 2,280 1,700 1,830 1,920 2,070 2,210
Industrial demand 1,860 1,730 1,210 1,800 2,020 1,700 1,890 2,060
Other recycling 0 20 10 10 10 10 10 10
Gross demand 8,170 7,420 6,420 6,820 7,500 7,500 7,850 8,270
Recycling 1,570 1,470 1,250 1,440 1,850 2,030 2,020 2,070
Net demand 6,600 5,950 5,170 5,380 5,650 5,470 5,830 6,200
Market balanceBalance (before ETFs) -220 -40 660 730 580 370 170 -1,510
ETFs (stock allocation) 220 100 390 540 180 220 910 340
Balance after ETFs -440 -140 270 190 400 150 -740 -1,850
Source: SFA (Oxford)
PtPLATINUM
78
195.
08
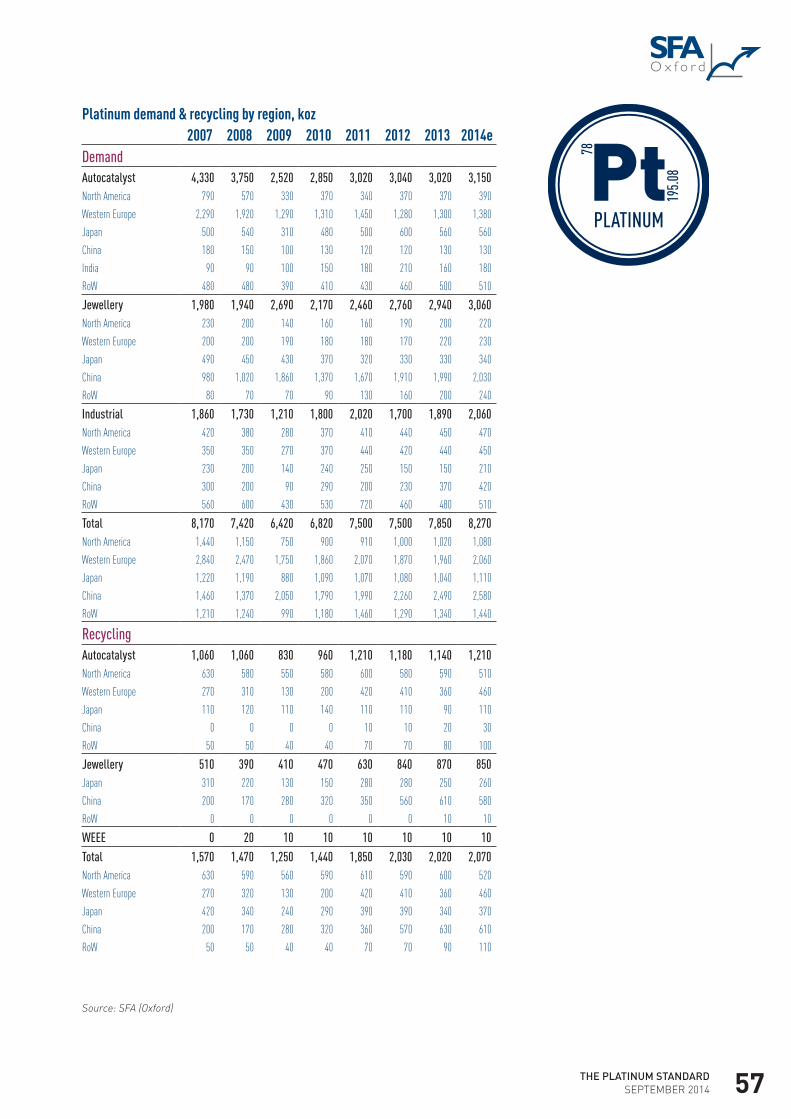
THE PLATINUM STANDARD SEPTEMBER 2014 57
Platinum demand & recycling by region, koz2007 2008 2009 2010 2011 2012 2013 2014e
DemandAutocatalyst 4,330 3,750 2,520 2,850 3,020 3,040 3,020 3,150North America 790 570 330 370 340 370 370 390
Western Europe 2,290 1,920 1,290 1,310 1,450 1,280 1,300 1,380
Japan 500 540 310 480 500 600 560 560
China 180 150 100 130 120 120 130 130
India 90 90 100 150 180 210 160 180
RoW 480 480 390 410 430 460 500 510
Jewellery 1,980 1,940 2,690 2,170 2,460 2,760 2,940 3,060North America 230 200 140 160 160 190 200 220
Western Europe 200 200 190 180 180 170 220 230
Japan 490 450 430 370 320 330 330 340
China 980 1,020 1,860 1,370 1,670 1,910 1,990 2,030
RoW 80 70 70 90 130 160 200 240
Industrial 1,860 1,730 1,210 1,800 2,020 1,700 1,890 2,060North America 420 380 280 370 410 440 450 470
Western Europe 350 350 270 370 440 420 440 450
Japan 230 200 140 240 250 150 150 210
China 300 200 90 290 200 230 370 420
RoW 560 600 430 530 720 460 480 510
Total 8,170 7,420 6,420 6,820 7,500 7,500 7,850 8,270North America 1,440 1,150 750 900 910 1,000 1,020 1,080
Western Europe 2,840 2,470 1,750 1,860 2,070 1,870 1,960 2,060
Japan 1,220 1,190 880 1,090 1,070 1,080 1,040 1,110
China 1,460 1,370 2,050 1,790 1,990 2,260 2,490 2,580
RoW 1,210 1,240 990 1,180 1,460 1,290 1,340 1,440
RecyclingAutocatalyst 1,060 1,060 830 960 1,210 1,180 1,140 1,210North America 630 580 550 580 600 580 590 510
Western Europe 270 310 130 200 420 410 360 460
Japan 110 120 110 140 110 110 90 110
China 0 0 0 0 10 10 20 30
RoW 50 50 40 40 70 70 80 100
Jewellery 510 390 410 470 630 840 870 850Japan 310 220 130 150 280 280 250 260
China 200 170 280 320 350 560 610 580
RoW 0 0 0 0 0 0 10 10
WEEE 0 20 10 10 10 10 10 10
Total 1,570 1,470 1,250 1,440 1,850 2,030 2,020 2,070North America 630 590 560 590 610 590 600 520
Western Europe 270 320 130 200 420 410 360 460
Japan 420 340 240 290 390 390 340 370
China 200 170 280 320 360 570 630 610
RoW 50 50 40 40 70 70 90 110
Source: SFA (Oxford)
PtPLATINUM
78
195.
08

Palladium supply-demand balance, koz2007 2008 2009 2010 2011 2012 2013 2014e
Primary supplyRegionalSouth Africa 2,540 2,350 2,420 2,560 2,520 2,320 2,310 1,760
Russia 3,050 2,700 2,680 2,720 2,700 2,630 2,580 2,540
Zimbabwe 140 140 180 220 260 280 310 310
Other 960 880 610 900 1,190 1,270 1,340 1,370
Total 6,690 6,070 5,890 6,400 6,670 6,500 6,540 5,980
Demand & recyclingAutocatalystGross demand 5,000 4,800 4,090 5,650 6,190 6,700 7,170 7,630
Recycling 1,160 1,220 1,150 1,400 1,520 1,490 1,700 1,800
Net demand 3,840 3,580 2,940 4,250 4,670 5,210 5,470 5,830
JewelleryGross demand 730 870 710 610 480 430 350 290
Recycling 0 0 0 100 140 130 150 120
Net demand 730 870 710 510 340 300 200 170
Industrial demand 2,650 2,430 2,410 2,470 2,470 2,370 2,190 2,090
Other recycling 320 310 340 400 340 340 360 360
Gross demand 8,380 8,100 7,210 8,730 9,140 9,500 9,710 10,010
Recycling 1,480 1,530 1,490 1,900 2,000 1,960 2,210 2,280
Net demand 6,900 6,570 5,720 6,830 7,140 7,540 7,500 7,730
Market balanceBalance (before ETFs) -210 -500 170 -430 -470 -1,040 -960 -1,750
ETFs (stock allocation) 280 380 510 1,080 -530 310 10 880
Balance after ETFs -490 -880 -340 -1,510 60 -1,350 -970 -2,630
Source: SFA (Oxford)
PdPALLADIUM
46
106.
42
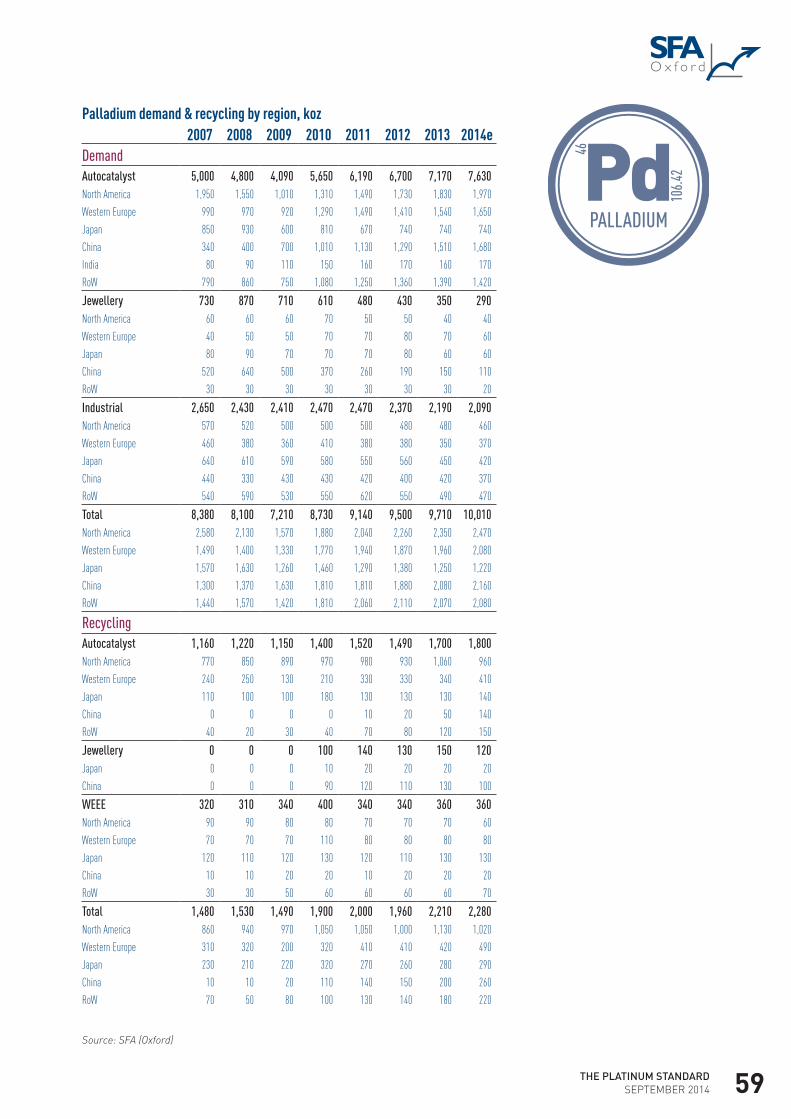
THE PLATINUM STANDARD SEPTEMBER 2014 59
Palladium demand & recycling by region, koz2007 2008 2009 2010 2011 2012 2013 2014e
DemandAutocatalyst 5,000 4,800 4,090 5,650 6,190 6,700 7,170 7,630North America 1,950 1,550 1,010 1,310 1,490 1,730 1,830 1,970
Western Europe 990 970 920 1,290 1,490 1,410 1,540 1,650
Japan 850 930 600 810 670 740 740 740
China 340 400 700 1,010 1,130 1,290 1,510 1,680
India 80 90 110 150 160 170 160 170
RoW 790 860 750 1,080 1,250 1,360 1,390 1,420
Jewellery 730 870 710 610 480 430 350 290North America 60 60 60 70 50 50 40 40
Western Europe 40 50 50 70 70 80 70 60
Japan 80 90 70 70 70 80 60 60
China 520 640 500 370 260 190 150 110
RoW 30 30 30 30 30 30 30 20
Industrial 2,650 2,430 2,410 2,470 2,470 2,370 2,190 2,090North America 570 520 500 500 500 480 480 460
Western Europe 460 380 360 410 380 380 350 370
Japan 640 610 590 580 550 560 450 420
China 440 330 430 430 420 400 420 370
RoW 540 590 530 550 620 550 490 470
Total 8,380 8,100 7,210 8,730 9,140 9,500 9,710 10,010North America 2,580 2,130 1,570 1,880 2,040 2,260 2,350 2,470
Western Europe 1,490 1,400 1,330 1,770 1,940 1,870 1,960 2,080
Japan 1,570 1,630 1,260 1,460 1,290 1,380 1,250 1,220
China 1,300 1,370 1,630 1,810 1,810 1,880 2,080 2,160
RoW 1,440 1,570 1,420 1,810 2,060 2,110 2,070 2,080
RecyclingAutocatalyst 1,160 1,220 1,150 1,400 1,520 1,490 1,700 1,800North America 770 850 890 970 980 930 1,060 960
Western Europe 240 250 130 210 330 330 340 410
Japan 110 100 100 180 130 130 130 140
China 0 0 0 0 10 20 50 140
RoW 40 20 30 40 70 80 120 150
Jewellery 0 0 0 100 140 130 150 120Japan 0 0 0 10 20 20 20 20
China 0 0 0 90 120 110 130 100
WEEE 320 310 340 400 340 340 360 360North America 90 90 80 80 70 70 70 60
Western Europe 70 70 70 110 80 80 80 80
Japan 120 110 120 130 120 110 130 130
China 10 10 20 20 10 20 20 20
RoW 30 30 50 60 60 60 60 70
Total 1,480 1,530 1,490 1,900 2,000 1,960 2,210 2,280North America 860 940 970 1,050 1,050 1,000 1,130 1,020
Western Europe 310 320 200 320 410 410 420 490
Japan 230 210 220 320 270 260 280 290
China 10 10 20 110 140 150 200 260
RoW 70 50 80 100 130 140 180 220
Source: SFA (Oxford)
PdPALLADIUM
46
106.
42

Rhodium supply-demand balance, koz2007 2008 2009 2010 2011 2012 2013 2014e
Primary supplyRegionalSouth Africa 640 610 660 640 630 590 570 440
Russia 90 80 80 80 80 80 70 70
Zimbabwe 10 10 20 20 30 30 40 30
Other 30 30 20 30 50 50 50 60
Total 770 730 780 770 790 750 730 600
Demand & recyclingAutocatalystGross demand 1,000 910 600 730 740 770 820 870
Recycling 190 190 170 220 240 240 270 270
Net demand 810 720 430 510 500 530 550 600
Industrial demand 140 120 110 180 180 150 160 200
Other recycling 0 3 2 1 1 1 1 2
Gross demand 1,140 1,030 710 910 920 920 980 1,070
Recycling 190 190 170 220 240 240 270 270
Net demand 950 840 540 690 680 680 710 800
Market balanceBalance (before ETFs) -180 -110 240 80 110 70 20 -200
ETFs (stock allocation) 20 40 50 20
Balance after ETFs 90 30 -30 -220
Source: SFA (Oxford)
RhRHODIUM
45
102.
91

THE PLATINUM STANDARD SEPTEMBER 2014 61
Rhodium demand & recycling by region, koz2007 2008 2009 2010 2011 2012 2013 2014e
DemandAutocatalyst 1,000 910 600 730 740 770 820 870North America 350 270 150 180 180 200 230 240
Western Europe 300 270 190 200 220 190 210 230
Japan 220 240 120 160 130 150 140 140
China 30 30 50 70 80 90 100 110
India 10 10 10 20 20 20 20 20
RoW 90 90 80 100 110 120 120 130
Industrial 140 120 110 180 180 150 160 200North America 30 10 10 20 20 20 20 20
Western Europe 20 10 20 20 20 20 20 20
Japan 40 40 30 50 50 40 30 60
China + RoW 50 60 50 90 90 70 90 100
Total 1,140 1,030 710 910 920 920 980 1,070North America 380 280 160 200 200 220 250 260
Western Europe 320 280 210 220 240 210 230 250
Japan 260 280 150 210 180 190 170 200
China + RoW 180 190 190 280 300 300 330 360
RecyclingAutocatalyst 190 190 170 220 240 240 270 270North America 120 110 130 160 140 140 180 160
Western Europe 40 50 20 30 60 60 50 70
Japan 20 20 20 30 30 30 30 30
China 0 0 0 0 0 0 0 0
RoW 10 10 0 0 10 10 10 10
Source: SFA (Oxford)
RhRHODIUM
45
102.
91


THE PLATINUM STANDARD SEPTEMBER 2014 63
Glossary of termsAnodeAn electrode through which positive electric charge flows into a polarised electrical device
Base metalsCopper and nickel
Basket priceCollective revenue of metals divided by 4E oz
By-productsCopper, nickel, iridium and ruthenium
CAPEXCapital expenditure
CathodeAn electrode from which a conventional current leaves a polarised electrical device
Emissions legislationTailpipe regulations affecting particulate matter, hydrocarbons and oxides of nitrogen
ETFExchange traded fund
Euro 5/6 emission standardsEuro 5 legislation introduced in 2009, Euro 6 in 2014, will be widely adopted later in other regions
Fuel cellA device that converts the chemical energy from a fuel into electricity through a chemical reaction with oxygen or another oxidising agent
Gross demandA measure of intensity of use
HDVHeavy-duty vehicle
Head gradeGrams of 4E PGMs per tonne of ore milled
kozThousand ounces
LCVLight commercial vehicle
Lean NOx trap (LNT)Platinum and rhodium-based, catalyses the chemical reduction of NOx in diesel engine exhaust to harmless nitrogen
Lease ratesFees payable for the rental of an asset
Low temperature polymer electrolyte membrane (PEM)A semi-permeable membrane generally made from ionomers and designed to conduct protons while being impermeable to gases such as oxygen or hydrogen
Merensky ReefA layer of igneous rock situated in South Africa that contains most of the world’s PGMs
Metal cocktailThe make-up of polymetallic orebodies
Mine lease areaArea defined by farm boundaries
mozMillion ounces
Net demandA measure of the theoretical requirement for new metal, i.e. net of recycling
Net supplyProxy supply of metal surplus to requirements
Net total cash costsTotal cash costs net of by-product credits (copper, nickel, iridium and ruthenium)
OPMsOther platinum-group metals
ozOunce
Particulate filter (DPF, GPF)Platinum-rich catalyst on ceramic filter, removes harmful fine particles from diesel and gasoline exhausts
PGMs
Platinum-group metals
Price elasticSusceptible to changes in price
Primary supplyMine production
Secondary supplyRecycling output
Selective catalytic reduction (SCR)PGM-free, converts harmful NOx in diesel exhaust to harmless nitrogen, via tank of urea solution; used in heavy-duty diesel vehicles, increasingly competes with LNT in light-duty diesel vehicles
Three-way catalystUsed in gasoline cars to remove hydrocarbons, carbon monoxide and NOx; largely palladium-based now, with some rhodium
Tonnes milledConcentrator throughput of ore
UG2 ReefAlso found in South Africa, this chromite-rich layer of rock contains fewer by-products than the Merensky Reef
4EPlatinum, palladium, rhodium and gold
Currency symbolsZAR South African rand$ US dollar£ UK pound

Methodology notesPrimary supply is calculated from actual mine production and excludes the sale of stock in order to provide pure production data. Stock sales are treated separately in SFA’s database as movement of stocks. Therefore, state stock sales from Russia are excluded in tabulations.
Gross demand is a measure of intensity of use.
Net demand is a measure of the theoretical requirement for new metal, i.e. net of recycling.
Automotive demand is based on vehicle production data not sales.

THE PLATINUM STANDARD SEPTEMBER 2014 65
AcknowledgementsSFA (Oxford) would like to thank all those whose hard work contributed to turning what began as an ambitious idea into the finished report you now see in front of you.
In particular, we would like to acknowledge our team:
Beresford Clarke
Dr. Jenny Watts
Dr. Ralph Grimble
Elaine Forrest
Harry Rowley
Jamie Underwood
Neil Christie
Oksan Atilan
Samantha Trickey
Stephen Forrest
Tom Chandler
Tracy Lindsay
Wenlin (Karen) He
We should also mention our Associate Consultants, in particular Andy Smith and Dr. Kerry-Ann Adamson, without many of whom this publication would not have been possible.
Also, Janice Hurst, who proofread this report.
Then there are our third-party data suppliers: LMC Automotive, Oxford Economics, Power Systems Research, and GTIS.
Finally, to our clients and all those who have supported us throughout our time in business, we would like to dedicate this report as a mark of our gratitude for your continuing support.
Typeset and printed by Holywell Press Ltd, Oxford.


THE PLATINUM STANDARD SEPTEMBER 2014 67


Disclaimer, copyright, and intellectual property
Steve Forrest Associates (‘SFA’), the trading name of SFA (Oxford) Limited, has made reasonable efforts to ensure that the sources of the information provided in this document are reliable and the data reproduced are accurate at the time of writing. The analysis and opinions set out in the document constitute a judgement as of the date of the document and are subject to change without notice. Therefore, SFA cannot warrant or guarantee the accuracy and completeness of the data and analysis contained in this document. SFA cannot be held responsible for any inadvertent and occasional error or lack of accuracy or correctness. SFA accepts no liability for any direct, special, indirect, or consequential losses or damages, or any other losses or damages of whatsoever kind, resulting from whatever cause through the use of or reliance on any information contained in the document or from any action or decision taken as a result of using any such information. The material contained in this document has not been prepared with regard to the specific investment objectives, financial situation, or particular need of any specific recipient or organisation and it is the recipient’s sole responsibility to satisfy itself prior to using this information that it is suitable for the recipient’s purposes. It is not to be construed as a solicitation or an offer to buy or sell any commodities, securities, or related financial instruments. The recipient acknowledges that SFA is not authorised by the Financial Conduct Authority to give investment advice. The report is not to be construed as advice to the recipient or any other person as to the merits of entering into any particular investment. In taking any decision as to whether or not to make investments, the recipient and/or any other person is strongly advised to refer to alternative independent sources of information available to him to substantiate the basis for any decision. This document is being supplied to the recipient on the basis that the recipient is reasonably believed to be such a person as is described in Article 19 (Investment professionals) or Article 49 (High net worth companies, unincorporated associations etc.) of the Financial Services and Markets Act 2000 (Financial Promotion) Order 2005.
© Copyright reserved. All copyright and other intellectual property rights in any and all reports produced from time to time remain the property of SFA and no person other than SFA shall be entitled to register any intellectual property rights in any report or claim any such right in the reports or the information or data on the basis of which such reports are produced. No part of any report may be reproduced or distributed in any manner without written permission of SFA. SFA specifically prohibits the redistribution of this document, via the Internet or otherwise, tonon-professional or private investors and accepts no liability whatsoever for the actions of third parties in reliance on this report.
Please note: Some tabulated data may not add up owing to rounding of individual numbers.
© Published in September 2014 by SFA (Oxford) Ltd.

SFA (Oxford) LtdThe Magdalen CentreRobert Robinson AvenueThe Oxford Science ParkOxford OX4 4GAUnited Kingdom
Tel: +44 1865 784366Fax: +44 1865 [email protected]