
The Physics of DAΦNE and KLOE - arXivThe Physics of DAΦNE and KLOE Paolo Franzini ... and a large...
39
arXiv:hep-ex/0606033v2 26 Sep 2006 The Physics of DAΦNE and KLOE Paolo Franzini Dipartimento di Fisica dell’Universit` a di Roma, La Sapienza e Sezione dell’Istituto Nazionale di Fisica Nucleare, Roma, Italy; email: [email protected] Matthew Moulson Laboratori Nazionali di Frascati dell’Istituto Nazionale di Fisica Nucleare, Frascati, Italy; email: [email protected] Key Words CP violation, CKM matrix, muon anomalous magnetic moment, exotic atoms, hypernuclei Abstract DAΦNE, the Frascati φ factory, has been in operation since 1999. At the center of the physics program is the KLOE experiment, a multipurpose detector with optimizations for tagged and interferometry-based measurements of the neutral kaon system. KLOE has been taking data since 2000 and has helped to explore a wide array of topics in kaon and hadronic physics, including a comprehensive set of measurements to determine the CKM matrix element |Vus|, and a measurement of the e + e − → π + π − cross section for the determination of the hadronic contribution to the muon anomaly. In addition, the DEAR experiment has measured the X-ray spectrum of kaonic hydrogen, and the FINUDA experiment has conducted its first studies in hypernuclear spectroscopy and a search for K-nuclear bound states. We review the design, construction, and operation of the DAΦNE facility, with an emphasis on the physics program of the KLOE experiment. Contents INTRODUCTION ......................................... 2 DAΦNE: THE FRASCATI φ FACTORY ............................ 3 THE KLOE EXPERIMENT ................................... 4 KAON PHYSICS .......................................... 7 Why a φ Factory? ............................................ 7 KL Decays ................................................ 10 KS Decays ................................................ 14 Charged Kaon Decays .......................................... 17 KLOE, Vus, and CKM Unitarity .................................... 20 HADRONIC PHYSICS ...................................... 21 Pseudoscalar Mesons: η and η ′ ..................................... 21 Scalar Mesons: f0(980) and a0(980) .................................. 23 The Hadronic Cross Section and aμ .................................. 26 THE DEAR AND SIDDHARTA EXPERIMENTS ....................... 29
Transcript of The Physics of DAΦNE and KLOE - arXivThe Physics of DAΦNE and KLOE Paolo Franzini ... and a large...

arX
iv:h
ep-e
x/06
0603
3v2
26
Sep
2006
The Physics of DAΦNE and KLOE
Paolo Franzini
Dipartimento di Fisica dell’Universita di Roma, La Sapienza e Sezione dell’Istituto
Nazionale di Fisica Nucleare, Roma, Italy; email: [email protected]
Matthew Moulson
Laboratori Nazionali di Frascati dell’Istituto Nazionale di Fisica Nucleare, Frascati,
Italy; email: [email protected]
Key Words CP violation, CKM matrix, muon anomalous magnetic moment, exoticatoms, hypernuclei
Abstract DAΦNE, the Frascati φ factory, has been in operation since 1999. At the center of thephysics program is the KLOE experiment, a multipurpose detector with optimizations for tagged andinterferometry-based measurements of the neutral kaon system. KLOE has been taking data since 2000and has helped to explore a wide array of topics in kaon and hadronic physics, including a comprehensiveset of measurements to determine the CKM matrix element |Vus|, and a measurement of the e+e− → π+π−
cross section for the determination of the hadronic contribution to the muon anomaly. In addition, theDEAR experiment has measured the X-ray spectrum of kaonic hydrogen, and the FINUDA experimenthas conducted its first studies in hypernuclear spectroscopy and a search for K-nuclear bound states. Wereview the design, construction, and operation of the DAΦNE facility, with an emphasis on the physicsprogram of the KLOE experiment.
Contents
INTRODUCTION . . . . . . . . . . . . . . . . . . . . . . . . . . . . . . . . . . . . . . . . . 2
DAΦNE: THE FRASCATI φ FACTORY . . . . . . . . . . . . . . . . . . . . . . . . . . . . 3
THE KLOE EXPERIMENT . . . . . . . . . . . . . . . . . . . . . . . . . . . . . . . . . . . 4
KAON PHYSICS . . . . . . . . . . . . . . . . . . . . . . . . . . . . . . . . . . . . . . . . . . 7Why a φ Factory? . . . . . . . . . . . . . . . . . . . . . . . . . . . . . . . . . . . . . . . . . . . . 7KL Decays . . . . . . . . . . . . . . . . . . . . . . . . . . . . . . . . . . . . . . . . . . . . . . . . 10KS Decays . . . . . . . . . . . . . . . . . . . . . . . . . . . . . . . . . . . . . . . . . . . . . . . . 14Charged Kaon Decays . . . . . . . . . . . . . . . . . . . . . . . . . . . . . . . . . . . . . . . . . . 17KLOE, Vus, and CKM Unitarity . . . . . . . . . . . . . . . . . . . . . . . . . . . . . . . . . . . . 20
HADRONIC PHYSICS . . . . . . . . . . . . . . . . . . . . . . . . . . . . . . . . . . . . . . 21Pseudoscalar Mesons: η and η′ . . . . . . . . . . . . . . . . . . . . . . . . . . . . . . . . . . . . . 21Scalar Mesons: f0(980) and a0(980) . . . . . . . . . . . . . . . . . . . . . . . . . . . . . . . . . . 23The Hadronic Cross Section and aµ . . . . . . . . . . . . . . . . . . . . . . . . . . . . . . . . . . 26
THE DEAR AND SIDDHARTA EXPERIMENTS . . . . . . . . . . . . . . . . . . . . . . . 29

Kaonic Atoms and the KN Interaction . . . . . . . . . . . . . . . . . . . . . . . . . . . . . . . . 29Measurement of the X-Ray Spectrum of Kaonic Hydrogen . . . . . . . . . . . . . . . . . . . . . . 30
FINUDA . . . . . . . . . . . . . . . . . . . . . . . . . . . . . . . . . . . . . . . . . . . . . . 32Hypernuclear Physics at a φ Factory . . . . . . . . . . . . . . . . . . . . . . . . . . . . . . . . . . 32First Results from the FINUDA Experiment . . . . . . . . . . . . . . . . . . . . . . . . . . . . . . 33
THE FUTURE OF DAΦNE . . . . . . . . . . . . . . . . . . . . . . . . . . . . . . . . . . . 35
1 INTRODUCTION
The experimental study of kaon decays has played a singular role in propelling the develop-ment of particle physics for nearly 60 years. Of particular importance, the 1963 observationat Brookhaven National Laboratory of the decay KL → π+π− (1) was the first experi-mental evidence of CP violation in any physical system. For more than 50 years, the
question remained of whether CP violation was confined to the |∆S| = 2 K0 ⇄ K0tran-
sition, resulting in a small CP impurity in the neutral kaon mass eigenstates, or whetherCP is also violated directly, i.e., in the |∆S| = 1 kaon decay amplitudes. The formerpossibility, often referred to as the superweak hypothesis (2), remained viable until quiterecently. From 1988–1992, the first hints of direct CP violation were observed (3). It soonbecame clear, however, that to definitively establish its existence would require increasedsensitivity.
The search for direct CP violation was the major impetus for the construction in Frascatiof an e+e− collider to operate at a center-of-mass energy equal to the mass of the φmeson. In 1990 the Istituto Nazionale di Fisica Nucleare approved the proposal (4) for thecollider, named DAΦNE (Double Annular Φ factory for Nice Experiments). The DAΦNEluminosity goal was 5× 1032 cm−2 s−1; that is, DAΦNE was to produce ∼1300 kaon pairsper second, or ∼4× 10¹⁰ pairs per year at 100% efficiency.
A first-round search for direct CP violation at DAΦNE would require an integratedluminosity of ∼10 fb−1. The physics program was to be complemented by other topics.The KLOE experiment (5), named after Chloe, the literary counterpart to Daphnis, wasproposed in 1992 to carry out an ambitious and wide-ranging program in neutral kaonphysics (using especially KSKL interferometry), charged kaon physics, and measurementsof the properties of scalar and pseudoscalar mesons. The precise determinations of φ andK meson properties—masses, leptonic widths, branching ratios (BRs), and lifetimes—werecentral to this program. In particular, the partial widths for leptonic and semileptonickaon decays are fundamental parameters for comparison with Standard Model predictions.Another important element of the program was the measurement of the hadronic cross sec-tion, especially for e+e− → π+π−, which is needed to calculate the hadronic contributionto the photon spectral function in computing the muon anomaly, (gµ − 2)/2.
Two additional experiments were subsequently proposed to capitalize on the availabilityof low-energy charged kaons at the second DAΦNE interaction point: FINUDA (FIsicaNUcleare a DAΦNE) (6) in 1993 for the study of hypernuclear spectroscopy, and DEAR(DAΦNE Exotic Atom Research) (7) in 1995 for the spectroscopy of K-mesic hydrogenatoms.
In 2005, the DAΦNE luminosity reached 1.3× 1032 cm−2 s−1. An integrated luminosityof ∼2.5 fb−1 was delivered to KLOE between 1999 and 2005. Although far smaller thannecessary for a competitive search for direct CP violation, this data set has permittedKLOE to explore the breadth of its original physics agenda. KLOE has performed mea-surements of the partial decay rates for kaons fundamental to the study of quark mixing,
2

Franzini & Moulson The Physics of DAΦNE and KLOE 3
has vastly improved experimental knowledge of scalar and pseudoscalar meson states, andhas completed a first round of measurements of σ(e+e− → hadrons). In addition, DEARhas measured the level shifts and widths of kaonic hydrogen, and FINUDA has obtainedfirst results on hypernuclear spectroscopy and conducted a search for new states fromnuclear K− absorption.
2 DAΦNE: THE FRASCATI φ FACTORY
DAΦNE, like PEP-II at the Stanford Linear Accelerator Center and KEKB at the KEKlaboratory in Japan, uses two separate rings to store large numbers of electron and positronbunches, thus avoiding beam-beam interaction effects. The DAΦNE design parameters—aluminosity goal of 5× 1032 cm−2 s−1 in 120-bunch operation in a machine with rings 98 min circumference—imply a stored current of approximately 5 A in each beam. The beamsintersect at an angle of (π − 0.025) rad in two interaction regions (IRs) on opposite sidesof the rings, where low-β insertions provide focusing to obtain high luminosity (8). At theIRs, the bunches are flat in cross section, with σx ≈ 2 mm and σy ≈ 10 µm. Figure 1shows a plan view of the DAΦNE complex.
LINAC
Storage rings
KLOE
Accumulator
10 m DEAR
FINUDA
Fig. 1. Schematic diagram of the DAΦNE facility.
A two-stage linac produces electrons and positrons of 510 MeV, with a repetition rate of50 Hz. These are stacked and cooled in the accumulator ring. Bunches are transferredfrom the accumulator to the DAΦNE rings on-energy at a rate of 1 Hz. Each DAΦNEring consists of four bending sections, each with a wiggler magnet, and a large number ofquadrupoles to provide the basic alternating-gradient focusing structure. The four wigglersin each ring help to reduce the damping times for synchrotron and betatron oscillations,which still remain ∼50,000 times larger than the cyclotron period.
DAΦNE operations got off to a rough start. The highest luminosity sustained duringthe year following KLOE roll-in in April 1999 was ∼2 × 1030 cm−2 s−1 with 40 bunches,or ∼2% of the day-one target value. Since then, the luminosity has been raised slowlyby abandoning attempts to provide simultaneous collisions at both IRs, adding octupole

Franzini & Moulson The Physics of DAΦNE and KLOE 4
magnets, correcting the poor wiggler field shape, improving injection efficiency, and in-stalling a redesigned low-β insertion at the KLOE IR. Even the KLOE field setting hasbeen adjusted to optimize the luminosity (9). The integrated luminosity is maximized byfrequently topping up the stored beams, without interrupting KLOE data taking. In 2000,an integrated luminosity of 24 pb−1 was delivered. This data set was used to obtain thefirst generation of KLOE results.
DAΦNE performance improved considerably year by year from 2001 to 2005. Figure 2illustrates the growth of the KLOE data set.
0
20
40
60
80
100
120
140
160
180
2002
2004
734 pb-1
2001
172 pb-1
2005
1256 pb-1
Months since Jan '01
320 pb-1
L(1
/pb/m
onth
)
1 3 5 7 9 11 13 15 17 19 21 37 39 41 43 45 47 49 51 53 55 57 59
Fig. 2. Luminosity integrated by KLOE from 2001 to 2005.
In 2002, 107 pb−1 were delivered to DEAR. The first physics run with FINUDA beganin November 2003 and ended in March 2004; a total of 250 pb−1 were delivered. FromMay 2004 to December 2005, DAΦNE operations were dedicated to KLOE data taking.In a single month near the end of this period (November 2005), KLOE collected 190 pb−1,with sustained luminosities regularly in excess of 1032 cm−2 s−1 and a one-day integrated-luminosity record of 8.8 pb−1. During the 2004–2005 run, KLOE collected 1.99 fb−1.
3 THE KLOE EXPERIMENT
At DAΦNE, φ mesons decay nearly at rest.1 Neutral and charged kaons from φ decayshave momenta of 110 and 127 MeV, respectively. As a result, the mean KL, KS , andK± decay path lengths are λL = 3.4 m, λS = 0.59 cm, and λ± = 95 cm. A detectorwith a radius of ∼2 m is required to define a fiducial volume for the detection of KL
decays with a geometrical efficiency of ∼30%. Because the radial distribution of the KL
decay points is essentially uniform within this volume, tracks must be well reconstructedindependently of their angles of emission, and photon vertices must be localized. Toobserve KS decays and KSKL interference patterns with minimal complications fromKL → KS regeneration, a decay volume about the interaction point with r & 10λS mustremain in vacuum. Material within the sensitive volume must be kept to a minimum toreduce the effects of regeneration, photon conversion, and multiple scattering and energyloss for low-momentum charged particles.
1Because of the beam-crossing angle, φs have a net momentum of 12–16 MeV in the horizontal planeand directed towards the center of the rings. This momentum is determined run by run from Bhabhascattering events with a precision of 0.01 MeV.

Franzini & Moulson The Physics of DAΦNE and KLOE 5
Figure 3 shows a diagram of the cross section of the KLOE detector. The detector con-sists principally of a large drift chamber (DC) surrounded by a hermetic electromagneticcalorimeter (EMC). A superconducting coil surrounding the calorimeter provides an axialmagnetic field of 0.52 T.
S.C. coilCryostat
Po
le p
iece
6 m
7 m
En
d c
ap
EM
C
Barrel EMC
Yoke
Drift chamberP
ole
pie
ce
QCal
Fig. 3. Cross-sectional view of the KLOE experiment, showing the interaction region,the drift chamber (DC), the electromagnetic calorimeter (EMC), the superconductingcoil, and the return yoke of the magnet.
The DC is 3.3 m long, with inner and outer radii of 25 and 200 cm, respectively. Itcontains 12,582 drift cells arranged in 58 stereo layers, for a total of 52,140 wires. Theabsolute value of the stereo angle increases from 60 to 150 mrad with the layer radius,and the sign of the stereo angle alternates from layer to layer. The difference between theradial distance from the chamber axis to the wires on a given layer as measured at theendplates and at the midpoint of the chamber is the same for all layers (1.5 cm). Thisdesign results in uniform filling of the sensitive volume, which increases the isotropy ofthe tracking efficiency. The cells are approximately square in shape; those in the first 12

Franzini & Moulson The Physics of DAΦNE and KLOE 6
layers measure 2×2 cm2 in cross section, whereas those in the remaining 46 layers measure3×3 cm2. The chamber uses a gas mixture of 90% helium and 10% isobutane. This reducesregeneration and multiple scattering within the chamber, while providing good spatialresolution (150 µm). Large-angle tracks from the origin (θ > 45◦) are reconstructed withσp/p < 0.4%, and vertices within the sensitive volume are reconstructed with a positionresolution of ∼3 mm. Groups of 12 consecutive wires on each layer are read out byanalog-to-digital-converter electronics; the measurement of the specific ionization allowsidentification of K± tracks by dE/dx alone. A full description of the design and operationof the chamber can be found in Reference 10.
The calorimeter is made of cladded, 1-mm scintillating fibers sandwiched between 0.5-mm-thick lead foils. The foils are imprinted with grooves wide enough to accommodatethe fibers and some epoxy, without compressing the fibers. This precaution prevents dam-age to the fiber-cladding interface. The epoxy around the fibers also provides structuralstrength and removes light traveling in the cladding. Many such layers are stacked, glued,and pressed, resulting in a bulk material with a radiation length X0 of 1.5 cm and an elec-tromagnetic sampling fraction of ∼13%. This material is fashioned into modules 23 cmthick (∼15X0), 24 of which are arranged in azimuth to form the calorimeter barrel, and anadditional 32 of which are wrapped around each of the pole pieces of the magnet yoke toform the endcaps. The unobstructed solid-angle coverage of the calorimeter as viewed fromthe origin is ∼94%. The fibers run parallel to the axis of the detector in the barrel, runvertical in the endcaps, and are read out at both ends with a granularity of 4.4×4.4 cm2 bya total of 4880 photomultiplier tubes. Cluster energies are measured with a resolution ofσE/E = 5.7%/
√
E (GeV), as determined with the help of the DC using radiative Bhabha
events. The absolute time resolution is σt = 54 ps/√
E (GeV) ⊕ 140 ps, as determinedfrom radiative φ decays. The constant term results largely from the uncertainty of theevent t0 arising from the length of the DAΦNE bunches. The constant contribution tothe relative time resolution as determined using 2γ events is ∼50 ps. Cluster positionsare measured with resolutions of 1.3 cm in the coordinate transverse to the fibers, and, bytiming, of 1.2 cm/
√
E (GeV) in the longitudinal coordinate. These characteristics enablethe 2γ vertex in KL → π+π−π0 decays to be localized with σ ≈ 2 cm along the KL
line of flight, as reconstructed from the tagging KS decay. The calorimeter is more fullydescribed in Reference 11.
Around the interaction point, the beam pipe is spherical in shape, with a radius of10 cm, so that all KS mesons decay in vacuum. The beam-pipe walls are made of a 60%-beryllium/40%-aluminum alloy 0.5 mm thick. The quadrupoles of the low-β insertion arecovered with a lead/scintillating-tile calorimeter (12) intended to detect photons that areotherwise absorbed on the quadrupoles.
The two-level KLOE trigger (13) uses information from both the calorimeter and theDC. The level-1 trigger provides a fast response to initiate conversion in the front-endelectronics modules. It is satisfied by two energy deposits above a threshold of 50 MeV onthe EMC barrel and above 150 MeV on the endcaps, or by ∼15 hits in the DC arrivingwithin a time window of 250 ns. All detector signals are digitized by KLOE-designedmodules that can operate on signals arriving before the level-1 trigger. The level-2 triggerinitiates event read out. In a typical configuration, the level-1 EMC signal satisfies level2, whereas for the DC, ∼120 hits must arrive within a 1.2-µs window. The trigger alsoimplements logic to identify cosmic-ray events, which are recognized by the presence oftwo energy deposits above 30 MeV in the outermost calorimeter plane.
At a luminosity of 1032 cm−2 s−1, events are recorded at ∼2200 Hz. Of this rate, ∼300 Hzare from φ decays. Raw data, reconstructed data, and Monte Carlo (MC) events occupy

Franzini & Moulson The Physics of DAΦNE and KLOE 7
∼800 TB and are stored in a tape library. Data summary tapes for both data and MCoccupy ∼80 TB and are cached on disk for analysis. For a detailed description of the dataacquisition, online, and offline systems, see References 14 and 15.
4 KAON PHYSICS
4.1 Why a φ Factory?
Interest in a φ factory (16,17,18) is due to the fact that φ mesons are produced abundantlyin e+e−collisions. The visible cross section for e+e− → φ peaks at ∼3 µb at
√s ≈
1019.4 MeV. For comparison, σ(e+e− → hadrons) ≈ 0.1 µb, and σ(e+e− → e+e−, θ >20◦) ≈ 7 µb. The φ meson decays dominantly to charged kaon pairs (49%), neutral kaonpairs (34%), ρπ (15%), and ηγ (1.3%). A φ factory is thus a copious source of tagged andmonochromatic kaons, both neutral and charged, and even a source of η mesons.
4.1.1 Tagged Kaon Beams Because the neutral kaon pair from φ → K0K0 ispurely JPC=1−−, the initial two-kaon state can be written as
|KK, t = 0 〉 = (|K0K0 〉 − |K0K0 〉)/√2 ≡ (|KSKL 〉 − |KLKS 〉)/
√2, (1)
where the identity holds even without assuming CPT invariance. Detection of a KS (KL)thus signals the presence of a KL (KS). This in effect creates pure KS and KL beams ofprecisely known momenta (event by event, from kinematic closure) and flux, which can beused to measure absolute KS and KL BRs, or, with even greater precision, ratios of suchBRs. Similar arguments hold for K+ and K− as well.
4.1.2 KSKL Interferometry Assuming CPT invariance, to lowest order in ǫ, thestates |KS 〉 and |KL 〉 are given by (16,18)
|KS 〉 = (1 + ǫ)|K0 〉+ (1− ǫ)|K0 〉√N
, |KL 〉 = (1 + ǫ)|K0 〉 − (1− ǫ)|K0 〉√N
, (2)
where N = 2(1 + |ǫ|2). If CPT invariance is not assumed, then (N changes):
|KS 〉 = (1 + ǫS)|K0 〉+ (1− ǫS)|K0 〉√N
, |KL 〉 = (1 + ǫL)|K0 〉 − (1− ǫL)|K0 〉√N
. (3)
It is normal to define the parameters ǫ and δ through the identities
ǫS ≡ ǫ+ δ; ǫL ≡ ǫ− δ. (4)
We evolve the initial state in Equation 1 in time, project to any two possible final statesf1 and f2, take the modulus squared, and integrate over all t1 and t2 for fixed ∆t = t1− t2to obtain (for ∆t > 0, with Γ ≡ ΓL + ΓS)
If1, f2(∆t) =1
2Γ|〈 f1 |KS 〉〈 f2 |KS 〉|2 ×
[
|η1|2e−ΓL∆t + |η2|2e−ΓS∆t
− 2|η1||η2|e−(ΓL+ΓS)∆t/2 cos(∆m∆t+ φ2 − φ1)]
.(5)
The last term is due to interference between the decays to states f1 and f2. Fits to the∆t distribution provide measurements of the magnitudes and phases of the parametersηi = 〈 fi |KL 〉/〈 fi |KS 〉, as well as of the KL-KS mass difference ∆m and the decay ratesΓL and ΓS . Many examples are discussed in References 16, 19, and 21.

Franzini & Moulson The Physics of DAΦNE and KLOE 8
Such fits also allow tests of fundamental properties of quantum mechanics. For example,the persistence of quantum-mechanical coherence can be tested by choosing f1 = f2. Inthis case, because of the antisymmetry of the initial state and the symmetry of the finalstate, there should be no events with ∆t = 0. Using the 2001–2002 data, KLOE hasconducted a preliminary analysis of the ∆t distribution for KSKL → π+π−π+π− eventsthat establishes the feasibility of such tests (23). The ∆t distribution is fit with a functionof the form of Equation 5, including the experimental resolution and a peak fromKL → KS
regeneration in the beam pipe. The results are shown in Figure 4.
100
200
300
400
Data
Fit result
5 10 15 20D /tt S
Beam-piperegeneration
I(D
t)
Fig. 4. ∆t distribution for φ → KSKL → π+π−π+π− events in 380 pb−1 of KLOEdata.
4.1.3 Direct CP Violation in Neutral Kaon Decays Equation 2 gives theexpressions for the mass eigenstates |KS 〉 and |KL 〉 assuming CPT invariance. If CPviolation in the KSKL system results exclusively from mixing, ηπ+π− ≡ η+− = ηπ0π0 ≡η00 = ǫ. If CP is violated in the |∆S| = 1 decay amplitudes, the amplitude ratios η areno longer equal and the magnitude of direct CP violation can be parameterized by ǫ′:
η+− = ǫ+ ǫ′; η00 = ǫ− 2ǫ′.
In the Standard Model, both ǫ and ǫ′ are calculable in terms of the Cabibbo-Kobayashi-Maskawa (CKM) matrix elements. In general, if ǫ is due to CP violation in the CKMmatrix, ǫ′ 6= 0, except for fortuitous cancellations. There are no reliable calculations of ǫ′.Experimentally, Re ǫ′/ǫ is obtained from the double ratio:
R ≡ Γ(KL → π0π0)/Γ(KS → π0π0)
Γ(KL → π+π−)/Γ(KS → π+π−)≡
∣
∣
∣
η00η+−
∣
∣
∣
2= 1− 6Re ǫ′/ǫ. (6)
Recent results for Re ǫ′/ǫ from NA48 at CERN (24) and KTeV at Fermilab (25) are(14.7±2.2)×10−4 and (20.7±2.8)×10−4, respectively. The two results are not in perfectagreement, but prove beyond any doubt the existence of direct CP violation; the observedvalue of Re ǫ′/ǫ is compatible with general expectations. The existence of direct CPviolation cannot be confirmed at DAΦNE because of lack of luminosity. With sufficientdata, Re ǫ′/ǫ would be measurable by Equation 6, and both Re ǫ′/ǫ and Im ǫ′/ǫ would bemeasurable by interferometry.
4.1.4 Kaon Decays and Determination of |Vus| In the Standard Model, thequark weak charged current is
J+α = (u c t)γα(1− γ5)V
dsb
,

Franzini & Moulson The Physics of DAΦNE and KLOE 9
whereV is a 3×3 unitary matrix introduced by Kobayashi and Maskawa (26) in expansionon an original suggestion by Cabibbo (27). The unitarity condition (V†V = 1) is requiredby the assumption of universality of the weak interactions of leptons and quarks andthe absence of flavor-changing neutral currents. The realization that a precise test ofCKM unitarity can be obtained from the first-row constraint |Vud|2 + |Vus|2 + |Vub|2 = 1(with |Vub|2 negligible) has sparked a new interest in good measurements of quantitiesrelated to |Vus|. As we discuss in the following sections, |Vus| can be determined usingsemileptonic kaon decays; the experimental inputs are the BRs, lifetimes, and form-factorslopes. Both neutral (KS or KL) and charged kaons may be used and provide independentmeasurements. Many players have joined the game, as seen from Table 1.
Table 1. Recent world data on Kℓ3 decays for calculation of |Vus|
Experiment Parameters measured References
E865 BR(K+ → π0De
+ν)/BR(K+ → π0DX
+) (28)
KTeV BR(KL e3), BR(KLµ3), λ+(KL e3), λ+,0(KLµ3) (29,30)
ISTRA+ λ+(K−e3), λ+,0(K
−µ3) (31,32)
NA48 BR(KL e3)/BR(2 tracks), BR(K±e3)/BR(ππ
0), λ+(KL e3) (33,35,36)
KLOE BR(KL e3), BR(KLµ3), BR(KS e3), BR(K±e3), BR(K
±µ3), See text
λ+(KL e3), τL, τ±
KLOE is unique in that it is the only experiment that can by itself measure the completeset of experimental inputs for the calculation of |Vus| using both charged and neutralkaons. This is because the φ factory is uniquely suited for measurements of the KL andK± lifetimes. In addition, KLOE is the only experiment that can measure KS BRs at thesub-percent level. We illustrate in Section 4.5 by calculating |Vus| from the comprehensiveKLOE data set on semileptonic kaon decays.
One problem that consistently plagues the interpretation of older BR measurements islack of clarity in the treatment of radiative contributions. All KLOE measurements ofkaon decays with charged particles in the final state are fully inclusive of radiation. Theinclusion of radiation is handled as an acceptance correction—the relevant MC generatorsincorporate radiation as described in Reference 37.
4.1.5 Semileptonic Kaon Decays The semileptonic kaon decay rates still providethe best means for the measurement of |Vus| because only the vector part of the weakcurrent contributes to the matrix element 〈π |Jα|K 〉. In general,
〈π |Jα|K 〉 = f+(t)(P + p)α + f−(t)(P − p)α,
where P and p are the kaon and pion four-momenta, respectively, and t = (P − p)2. Theform factors f+ and f− appear because pions and kaons are not point-like particles, andalso reflect both SU(2) and SU(3) breaking. For vector transitions, the Ademollo-Gattotheorem (38) ensures that SU(3) breaking appears only to second order in ms −mu,d. Inparticular, f+(0) differs from unity by only 2–4%. When the squared matrix element isevaluated, a factor of m2
ℓ/m2K multiplies all terms containing f−(t). This form factor can
be neglected for Ke3 decays. For the description of Kµ3 decays, it is customary to usef+(t) and the scalar form factor f0(t) ≡ f+(t) + [t/(m2
K −m2π)] f−(t).
The semileptonic decay rates, fully inclusive of radiation, are given by
Γi(Ke3, µ3) = |Vus|2C2i G2 M5
768π3SEW (1 + δi, em + δi, SU(2)) |fK0
+ (0)|2 Ie3, µ3. (7)

Franzini & Moulson The Physics of DAΦNE and KLOE 10
In the above expression, i indexes K0 → π± and K± → π0 transitions, for which C2i = 1
and 1/2, respectively. G is the Fermi constant, M is the appropriate kaon mass, and SEW
is the universal short-distance radiative correction factor (39). The δ terms are the long-distance radiative corrections, which depend on the meson charges and lepton masses,and the SU(2)-breaking corrections, which depend on the kaon charge (40). The formfactors are written as f+, 0(t) = f+(0)f+, 0(t), with f+, 0(0) = 1. f+(0) reflects SU(2)-and SU(3)-breaking corrections and is different for K0 and K±. Ie3, µ3 is the integral of
the Dalitz-plot density over the physical region and includes |f+, 0(t)|2. Ie3, µ3 does notaccount for photon emission; the effects of radiation are included in the electromagnetic(em) corrections. The numerical factor in the denominator of Equation 7, 768 = 3 × 28,is chosen in such a way that I = 1 when the masses of all final-state particles vanish. ForKe3, I ≈ 0.56 and for Kµ3, I ≈ 0.36. The vector form factor f+ is dominated by the
vector Kπ resonances, the closest being the K∗(892). Note that for t > 0, f+(t) > 1. Thepresence of the form factor increases the value of the phase-space integral and the decayrate. The natural form for f+(t) is
f+(t) =M2
V
M2V − t
. (8)
It is also customary to expand the form factor in powers of t as
f+(t) = 1 + λ′ t
m2π+
+λ′′
2
(
t
m2π+
)2
.
To compare the results obtained from each semileptonic decay mode for both neutral andcharged kaons without knowledge of f+(0), Equation 7 is usually used to compute the
quantity fK0
+ (0) |Vus|. This requires the SU(2) and electromagnetic corrections for allfour possible cases.
4.1.6 K → µν Decays High-precision lattice quantum chromodymanics (QCD) re-sults have recently become available and are rapidly improving (41). The availability ofprecise values for the pion- and kaon-decay constants fπ and fK allows use of a relation be-tween Γ(Kµ2)/Γ(πµ2) and |Vus|2/|Vud|2, with the advantage that lattice-scale uncertaintiesand radiative corrections largely cancel out in the ratio (42):
Γ(Kµ2(γ))
Γ(πµ2(γ))=
|Vus|2|Vud|2
f2K
f2π
mK
(
1−m2µ/m
2K
)2
mπ
(
1−m2µ/m
2π
)2 × (0.9930 ± 0.0035), (9)
where the precision of the numerical factor due to structure-dependent corrections (43) canbe improved. Thus, it could very well be that the abundant decays of pions and kaons toµν ultimately give the most accurate determination of the ratio of |Vus| to |Vud|. This ratiocan be combined with direct measurements of |Vud| to obtain |Vus| using unitarity (42,45).What is more interesting, however, is to combine all information from Ke2, Kµ2, Ke3,Kµ3, and superallowed 0+ → 0+ nuclear β-decays to experimentally test electron-muonand lepton-quark universality, in addition to the unitarity of the quark mixing matrix.
4.2 KL Decays
4.2.1 Measurements of KL properties Not all parameters describing the KSKL
system are measurable from the study of φ → KSKL decays without assuming eitherCPT invariance or the ∆S = ∆Q rule. The set can be made complete at DAΦNE by

Franzini & Moulson The Physics of DAΦNE and KLOE 11
including measurements of the ∆S 6= ∆Q amplitude using strangeness-tagged K0 and K0
mesons from charge exchange of tagged K± mesons. We are mostly interested here in thequantities relevant to the measurement of |Vus|. For KL mesons, the necessary quantitiesare the neutral kaon mass, the KL lifetime, the semileptonic BRs, and the slopes of thehadronic-current form factors. KLOE finds mKL
= 497.583 ± 0.021 MeV (46, 47). Thisvalue is accurately determined owing to the precise Novosibirsk measurement of the φmass(48) and the smallness of mφ − 2mK0 = 24.317 MeV. Knowledge of the mass is necessaryfor the phase-space integrals, for the BR measurements, for the correct evaluation of theM5 factor in Equation 7, and for the evaluation of the radiative corrections.
4.2.2 KL Lifetime The KL lifetime is particularly difficult to measure becausemonochromatic neutral kaons are generally not available, nor can they be stopped. In addi-tion, only a small fraction of the KL lifetime is covered in a typical experiment. If N eventsare observed in a time window of T lifetimes (with T ≪ 1), and the lifetime is determinedfrom a fit to the proper-time distribution, the fractional error is δτ/τ = 2
√3/(T
√N). A
good measurement is possible at DAΦNE, where a monochromatic beam of very slow KLsis available. KLOE can cover ∼37% of the KL lifetime, compared with a few percent inKTeV or NA48. KLOE has performed a fit to the proper-time distribution for KL → 3π0
decays, which can be isolated with high purity and high and uniform efficiency (49). Thefit to the distribution for ∼10 million KL → 3π0 decays (400 pb−1) in the proper-timeinterval from 6 to 25 ns gives τKL
= 50.92 ± 0.30 ns. The fractional statistical error is
∼10.5/√N ≈ 0.33%. The stated error on τKL
includes a systematic uncertainty of 0.5%.If, as at a φ factory, the total number of KLs created is known, the lifetime can also be
obtained from the number of decays ND in a time interval ∆ beginning at time t. Thefractional error is given by
δτ
τ=
δΓ
Γ≈ 1√
ND
∣
∣
∣
∣
1− e−Γ∆
(Γt+ Γ∆)e−Γ∆ − Γt
∣
∣
∣
∣
.
For KLOE, Γt ≈ 0.12 and Γ∆ ≈ 0.37, so δτ/τ ≈ 1.4/√ND. Using this method, KLOE
finds τKL= 50.72±0.36 ns (see Section 4.2.3). Because the two determinations are almost
entirely uncorrelated and the errors are dominated by different systematic uncertainties,the two values can be averaged. KLOE obtains τKL
= 50.84 ± 0.23, which is a factor of∼2 improvement over the 1972 measurement of Vosburgh et al. (50).
4.2.3 KL Branching Ratios The KLOE measurements of the semileptonic KL
BRs (51) are based on two points. The first, unique to DAΦNE and KLOE, is the useof tagging to obtain absolute BRs; the presence of a KL is tagged by observation of aKS → π+π− decay. The second point is that just four modes, π±e∓ν (Ke3), π±µ∓ν(Kµ3), π
+π−π0, and 3π0, account for more than 99.5% of all decays. For the first threemodes, two tracks are observed in the DC, whereas for the 3π0 mode, only photons appearin the final state. The analysis of two-track and all-neutral-particle events is quite different.The main experimental problem is ensuring that the tagging is bias free. Because both thetrigger and reconstruction efficiencies for KS → π+π− decays exhibit some dependence onthe KL decay mode to be identified, most of the analysis revolves around minimizing andcorrecting the tag bias.
To deal properly with this problem, two more possibilities for the behavior of the KL
must be included: The KL may reach the calorimeter and interact, or it may escape thedetector altogether. We define the tag bias Bi for KL channel i as one minus the ratio ofthe KS detection efficiency when KL → i to the KS detection efficiency averaged over allpossible KL “channels,” including the last two listed above. The tag bias is minimized byretaining only events in which it is possible to verify that the KS → π+π− decay satisfied

Franzini & Moulson The Physics of DAΦNE and KLOE 12
the calorimeter trigger by itself. MC simulations give Bi ≈ 0.03 for the two-track KL
decays, and Bi ≈ 0.00 for 3π0. A correction of +0.2% to the average tagging efficiency isobtained from data. An additional correction of approximately −0.5%, also obtained fromdata, accounts for decreased reconstruction efficiency for the tracks from KS → π+π−,owing to the presence of the KL decay products. This last correction depends on theDAΦNE operating conditions and is obtained separately for different sets of runs.
Two-track events are assigned to the three channels of interest by use of a single vari-able: the smaller absolute value of the two possible values of ∆µπ = |pmiss|−Emiss, wherepmiss and Emiss are the missing momentum and energy in the KL decay, respectively, andare evaluated assuming the decay particles are a pion and a muon. Figure 5 (left panel)shows an example of a ∆µπ distribution. A total of approximately 13 million tagged KL
decays (328 pb−1) are used for the measurement of the BRs. The numbers of Ke3, Kµ3,and π+π−π0 decays are obtained separately for each of 14 run periods by fitting the ∆µπ
distribution with the corresponding MC-predicted shapes. The signal extraction proce-dure is tested using particle-identification variables from the calorimeter. Figure 5 (rightpanel) shows the ∆eπ spectrum for events with identified electrons, together with the re-sults of a fit using MC shapes. The Ke3(γ) radiative tail is clearly evident. The inclusionof radiative processes in the simulation is necessary to obtain an acceptable fit, as well asto properly estimate the fully inclusive radiative rates.
2000
4000
6000
8000
-150 -100 -50 0 50 100
Data
p p p+ - 0
Km3
Ke3
p p+ -
Dmp (MeV)
2
10 3
10 4
10 5
10
10
-200 -150 -100 -50 0 50 100
Data
K Ee3+ MeVg, > 1
p p p+ - 0
Km3
Ke3
D ep (MeV)
Even
ts0.
5 M
eV/
Even
ts0.
5 M
eV/
g
Fig. 5. (Left panel) Distribution of ∆µπ for a run set. (Right panel) Distribution of∆eπ for events with an identified electron, for the entire data set.
The decay KL → 3π0 is easier to identify. Detection of ≥ 3 photons originating at thesame point is accomplished with very high efficiency (99%) and very little background(1.1%). Changing the required number of photons from three to five reduces the back-ground to 0.1%, with a detection efficiency of 88%. This variation in the selection criteriachanges the result by 1%. This entire change is taken as the magnitude of the systematicuncertainty on the corresponding BR.
To conveniently estimate the individual efficiencies, the BRs are obtained using the KL
lifetime measurement of Vosburgh et al. (50): τKL= 51.54 ± 0.44 ns. The errors on the
absolute BRs are dominated by the uncertainty on the value of τKL, which enters into
the calculation of the geometrical efficiency. This source of uncertainty can be all butremoved (at the cost of correlating the errors among the BR measurements) by applyingthe constraint that the KL BRs must sum to unity. The sum of the four BRs, plus the
Franzini & Moulson The Physics of DAΦNE and KLOE 13
sum of the Particle Data Group (PDG) values (52) for KL decays to π+π−, π0π0, andγγ (
∑
=0.0036), is 1.0104± 0.0018± 0.0074.2 Applying the constraint gives the results inTable 2.
Table 2. KLOE measurements of KL branching ratios
Mode BR δ stat δ syst-stat δ syst
π±e∓ν 0.4007 0.0005 0.0004 0.0014
π±µ∓ν 0.2698 0.0005 0.0004 0.0014
π0π0π0 0.1997 0.0003 0.0004 0.0019
π+π−π0 0.1263 0.0004 0.0003 0.0011
Constraining the BRs to sum to unity and solving for the geometrical efficiency is equiv-alent to determining τKL
by the second method described in Section 4.2.2. KLOE findsτKL
= 50.72 ± 0.17 ± 0.33 ns.For the ratio Γ(Kµ3)/Γ(Ke3), KLOE obtains Rµe = 0.6734±0.0059. A value for compari-
son can be computed from the slope of the f0 form factor. The average of the measurementsof λ0 from the KTeV experiment at Fermilab (30) and the ISTRA+ experiment at Protvino(32) gives Rµe = 0.6640 ± 0.0040. For the ratio Γ(KL → π0π0π0)/Γ(KL → π+π−π0),KLOE obtains R3π = 1.582 ± 0.027. A value for comparison, R3π = 1.579, has been ob-tained from the isospin amplitudes derived from BRs and Dalitz-plot slopes for K → 3πdecays (53).
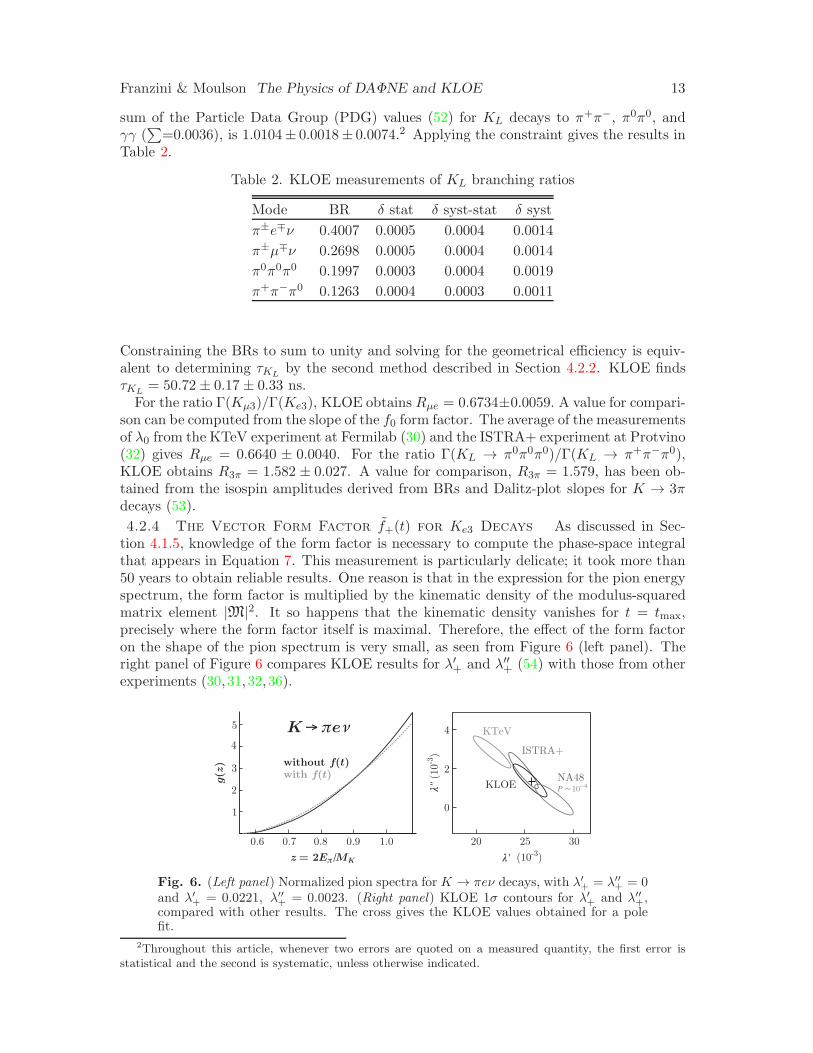
4.2.4 The Vector Form Factor f+(t) for Ke3 Decays As discussed in Sec-tion 4.1.5, knowledge of the form factor is necessary to compute the phase-space integralthat appears in Equation 7. This measurement is particularly delicate; it took more than50 years to obtain reliable results. One reason is that in the expression for the pion energyspectrum, the form factor is multiplied by the kinematic density of the modulus-squaredmatrix element |M|2. It so happens that the kinematic density vanishes for t = tmax,precisely where the form factor itself is maximal. Therefore, the effect of the form factoron the shape of the pion spectrum is very small, as seen from Figure 6 (left panel). Theright panel of Figure 6 compares KLOE results for λ′
+ and λ′′+ (54) with those from other
experiments (30,31,32,36).
K ep n®
without ( )f t
with ( )f t
gz()
1
2
3
4
5
z E Mp/ K= 2
0.6 0.7 0.8 0.9 1.0 20 25 30
4
2
0
KLOE
ISTRA+
KTeV
NA48P ~10-4
l¢ (10 )-3
l¢¢(
10)
-3
Fig. 6. (Left panel) Normalized pion spectra for K → πeν decays, with λ′+ = λ′′
+ = 0and λ′
+ = 0.0221, λ′′+ = 0.0023. (Right panel) KLOE 1σ contours for λ′
+ and λ′′+,
compared with other results. The cross gives the KLOE values obtained for a polefit.
2Throughout this article, whenever two errors are quoted on a measured quantity, the first error isstatistical and the second is systematic, unless otherwise indicated.

Franzini & Moulson The Physics of DAΦNE and KLOE 14
The KLOE results for the slope and curvature parameters are λ′+ = (25.5±1.5±1.0)×10−3
and λ′′+ = (1.4± 0.7± 0.4)× 10−3, respectively, with χ2/ndf = 325/362 (P (χ2) = 91.9%).
The data have also been fit using the one-pole parameterization (Equation 8). The resultis MV = 870± 6± 7 MeV; the fit gives χ2/ndf = 326/363 (P (χ2) = 92.4%).
4.3 KS Decays
The possibility of tagging a pure KS beam is unique to a φ factory. At KLOE, a par-ticularly clean tag for KS decays is obtained by observing the interaction of a KL in theEMC, referred to as a “KL crash.” The KL crash is recognized as an isolated, high-energy(typically, E > 100 MeV) cluster that arrives roughly 24 ns after the clusters from the KS
decay, as expected for a neutral particle with β ≈ 0.2. The tagging efficiency is approxi-mately 30% and is dominated by the probability for the KL to reach the calorimeter. Theposition of the KL crash, together with the kinematics of the φ → KSKL decay, deter-mines the trajectory of the KS with a momentum resolution of approximately 1 MeV andan angular resolution of better than 1◦. The simulation of the EMC response to the KL
crash in the KLOE MC has been adjusted carefully with reference to data (55). KLOE hasused the KL-crash tag to obtain KS BR measurements spanning six orders of magnitude.
4.3.1 KS → π+π−(γ), π0π0 The two channels π+π− and π0π0 comprise ∼99.9%of all KS decays. The rates for the KS → ππ decays, together with the much slowerrate for K± → π±π0, first suggested the empirical rule that ∆I = 1/2 transitions aremuch favored over ∆I = 3/2 transitions. This is true in all |∆S| = 1 transitions; thephenomenon remains poorly understood.
The ratio Rπ ≡ Γ(KS → π+π−(γ))/Γ(KS → π0π0) is a fundamental parameter ofthe KS meson. With almost no corrections, its measurement provides the BRs for thedominant KS decays to π0π0 and π+π−(γ). The latter decay is a convenient normalizationreference for all other KS decays to charged particles (see Section 4.3.2). Rπ is also usedin the extraction of values for phenomenological parameters of the kaon system, such asthe differences in magnitude and phase of the I = 0, 2 ππ scattering amplitudes (see, e.g.,Reference 56). Finally, Rπ enters in the double ratio of Equation 6, which measures directCP violation in K → ππ transitions.
A first KLOE measurement of Rπ based on 17 pb−1 of data from 2000, gave the resultRπ = 2.236±0.003±0.015 (57). This result increased the PDG average forRπ by 0.028, andcorrespondingly changed the PDG fit values for BR(KS → π+π−) and BR(KS → π0π0)by +0.5% and −1.1%, respectively (52). The 1.3σ difference between the KLOE valueand older values is believed to arise from the imprecise treatment of the contribution fromπ+π−γ in the older measurements. KLOE has nonzero acceptance over the entire rangeof photon energies for KS → π+π−γ decays, and the KLOE measurement of Rπ is fullyinclusive. The analysis has recently been repeated using 410 pb−1 of 2001–2002 data(58). The value obtained for Rπ is 2.2555 ± 0.0024 ± 0.0050. Because the uncertaintyon this result is dominated entirely by experimental systematics, the increase in statisticsprovided by the 2001–2002 data is used to obtain highly accurate corrections directlyfrom the data itself. This, together with various improvements to the analysis, leads tothe significant reduction in the systematic error. The new result is consistent with theprevious KLOE value; the overall error has been reduced to 0.25%. Combining the tworesults with attention to the common systematic errors gives Rπ = 2.2549 ± 0.0054.
4.3.2 KS → πeν(γ) Using the KL-crash tag, KLOE has isolated a very pure sampleof ∼13,000 semileptonic KS decays and accurately measured the BRs for KS → π+e−ν(γ)

Franzini & Moulson The Physics of DAΦNE and KLOE 15
and KS → π−e+ν(γ).Discrete symmetries can be tested by comparing the charge asymmetries AS and AL,
defined as the difference between the widths for KS or KL decays to final states of eachlepton charge, divided by their sum. AL is known to an absolute accuracy of O(10−4)(59), whereas AS has never previously been measured. If CPT invariance holds, the twocharge asymmetries are equal to 2Re ǫ ≈ 3 × 10⁻³. A difference between AS and AL
signals CPT violation either in the mass matrix or in the ∆S 6= ∆Q decay amplitudes:
AS −AL = 4 (Re δ +Re x−). (10)
The parameter δ is defined in Equations 2, 3, and 4. x− is the ratio of the CPT -odd,∆S 6= ∆Q decay amplitude to the CPT -even, ∆S = ∆Q decay amplitude. The mostprecise test of CPT invariance in K0K0 mixing comes from the CPLEAR experiment atCERN (60). They find Re δ and Re x− consistent with zero, with sensitivities of 3× 10⁻⁴
and 10−2. The sum of the asymmetries gives
AS +AL = 4 (Re ǫ− Re y), (11)
where y is the ratio of CPT -odd to CPT -even ∆S = ∆Q decay amplitudes. The value ofRe y from unitarity (61) is zero to within 3× 10⁻³.
From the knowledge of the semileptonic partial widths for both the KS and KL, it ispossible to test the validity of the ∆S = ∆Q rule under CPT invariance. With x+ as theratio of the CPT -conserving amplitudes for ∆S 6= ∆Q and ∆S = ∆Q transitions,
Re x+ =1
2
Γ(KS → πeν)− Γ(KL → πeν)
Γ(KS → πeν) + Γ(KL → πeν). (12)
In the Standard Model, a finite value of Re x+ on the order of GFm2π ∼ 10−7 arises from
second-order weak processes. Previously, the most precise test of the ∆S = ∆Q rulewas obtained from a study of strangeness-tagged semileptonic kaon decays by CPLEAR(62). CPLEAR finds Re x+ compatible with zero to within 6 × 10⁻³. The most preciseprevious measurement of BR(KS → πeν) was obtained by KLOE using the data from2000 (17 pb−1) and had a fractional uncertainty of 5.4% (63). The 2001–2002 KLOE dataset is ∼20 times larger, and the purity of the semileptonic decay sample has been vastlyimproved (64).
We outline briefly the basic steps in the analysis. KS decays are tagged by the KL
crash. A cut on the ππ invariant mass removes 95% of the KS → π+π− decays and re-duces the background-to-signal ratio to ∼80:1. Several geometrical cuts further improvethe purity of the sample and, in particular, remove contamination by events with earlyπ → µν decays. Finally, stringent requirements are imposed on the particle time of flight(TOF), which very effectively separates electrons from pions and muons and allows chargeassignment of the final state. Figure 7 shows the signal peak and the residual backgroundin the distribution of ∆Ep = Emiss − |pmiss| for the π−e+ν channel, where Emiss and pmiss
are respectively the missing energy and momentum at the vertex, evaluated in the signalhypothesis. For signal events, the missing particle is a neutrino and ∆Ep = 0.

Franzini & Moulson The Physics of DAΦNE and KLOE 16
Evts
/M
eVSignalBackground
0
200
400
600
800
-20 0 20 40 60DEp (MeV)
DATAFit
K ® p n- +e
Fig. 7. ∆Ep distribution for KS → π−e+ν candidates, showing signal and back-ground.
The numbers of πeν decays for each charge state are normalized to the number of π+π−
events observed, resulting in the ratios in the first column of Table 3. These ratios givethe first measurement of the semileptonic charge asymmetry for the KS :
AS = (1.5 ± 9.6± 2.9) × 10−3.
Using the result for Rπ of Section 4.3.1 (also in Table 3), the absolute BRs for KS → ππand KS → πeν in the second column of the table are obtained.
Table 3. KLOE measurements of KS branching ratios
Decay mode BR(mode)/BR(π+π−) BR(mode)
π+π− — (69.196 ± 0.024 ± 0.045)%
π0π0 1/(2.2549 ± 0.0054) (30.687 ± 0.024 ± 0.045)%
π−e+ν 5.099 ± 0.082 ± 0.039 × 10⁻⁴ 3.528 ± 0.057 ± 0.027 × 10⁻⁴
π+e−ν 5.083 ± 0.073 ± 0.042 × 10⁻⁴ 3.517 ± 0.050 ± 0.029 × 10⁻⁴
πeν 10.19 ± 0.11± 0.07 × 10⁻⁴ 7.046 ± 0.076 ± 0.051 × 10⁻⁴
With τKSfrom the PDG (52) and τKL
and BR(KL → πeν) from KLOE, Equation 12gives Re x+ = (−0.5 ± 3.1 ± 1.8) × 10−3, which is more precise than the CPLEAR value(62) by nearly a factor of two. Using Equation 10 to combine the KLOE result for AS
with the PDG value for AL and with the CPLEAR value for Re δ (60) gives Re x− =(−0.8±2.4±0.7)×10−3 ; the uncertainty on this quantity is reduced by a factor of 10. AS
and AL, together with the PDG value for Reǫ obtained without assuming CPT invariance(|ǫ| cos φǫ = (1.62±0.04)×10−3), give Rey = (0.4±2.4±0.7)×10−3 (Equation 11), whichis comparable in precision to the value obtained by CPLEAR using the unitarity relation(61).
4.3.3 KS → 3π0 The decay KS → 3π0 is purely CP violating. If CPT is conserved,the BR for this decay can be predicted from ΓS = ΓL|ǫ+ ǫ′000|2, giving BR ≈ 1.9 × 10⁻⁹.In KLOE, the signature is an event with a KL crash, six photon clusters, and no tracks

Franzini & Moulson The Physics of DAΦNE and KLOE 17
from the interaction point. Background is mainly from KS → π0π0 events with two spu-rious clusters from splittings or accidental activity. Signal-event candidates are countedusing the distribution in the plane of two χ2-like discriminating variables, ζ3 and ζ2. ζ3 isthe quadratic sum of the residuals between the nominal π0 mass, mπ0 , and the invariantmasses of three photon pairs formed from the six clusters present. ζ2 is based on energyand momentum conservation in the φ → KSKL, KS → π0π0 decay hypothesis, as wellas on the invariant masses of two photon pairs. ζ3 and ζ2 are evaluated with the mostfavorable cluster pairing in each case. Figure 8 shows the ζ2 versus ζ3 distributions ob-tained with 450 pb−1 of 2001–2002 data, as well as the predicted distribution from an MCsample with an effective statistics of 5.3 times that of the data. From the MC distribution,the number of predicted background counts is 3.1 ± 0.8 ± 0.4; two counts in the signalbox are observed in data. KLOE thus obtains the 90% C.L. limit BR ≤ 1.2 × 10⁻⁷ (65),which is approximately a factor of six more stringent than the recent limit from NA48(66). With the additional 2 fb−1 of data from 2004–2005 and improvements to the analysisunder development, the KLOE limit can potentially be reduced by an additional order ofmagnitude.
(a) (b)
Fig. 8. Distribution of ζ2 versus ζ3 for candidate KS → 3π0 events: (a) from MonteCarlo simulation and (b) from 450 pb−1 of KLOE data.
4.4 Charged Kaon Decays
The K± → µ±ν (Kµ2) decay represents approximately two-thirds of all K± decays. It isoften used as a reference for measuring other BRs, and, together with the K± lifetime,provides a measurement of the decay constant fK . The most recent measurement ofBR(Kµ2) is based on 62,000 events and dates back to 1972 (67). The stated error is∼0.7%, with a 0.4% statistical contribution. It is important to improve the accuracy withwhich this BR is known.
The measurements of the K± lifetime listed in the PDG compilation (52) exhibit poorconsistency. The PDG fit has a confidence level of 1.5 × 10⁻³, and the error on therecommended value is enlarged by a scale factor of 2.1. The dominant measurement, byOtt & Pritchard (68), τK± = 12.380 ± 0.016 ns, was obtained by combining the resultsfrom four runs. The systematic uncertainties for each of the individual runs are on theorder of 27 ps, yet the overall systematic error is 14.7 ps. This is poorly explained. Itis also curious that the stated fractional statistical error is 0.63/
√N , whereas from basic

Franzini & Moulson The Physics of DAΦNE and KLOE 18
statistical considerations, the fractional error must be at least 1/√N (and should in fact
be ∼1.05/√N for a coverage of 6τK±). Thus, it is reasonable to be suspicious of the PDG
value and its error. The measurement of the absolute K± BRs and the K± lifetime usingtagged beams is an important part of the KLOE program.
4.4.1 K+ → µ+ν(γ) The KLOE measurement of this BR (69) is based on the useof K− → µ−ν decays for event tagging. Identification of a K− → µ−ν decay requires thepresence of a two-track vertex in the DC. The nuclear interactions (NI) of the kaons affectthe BR measurement, but not the tagging procedure. Because the nuclear cross sectionσNI(K
+) ≈ 0.01σNI(K−), the use of a negative tag minimizes the corrections for NI. (The
corrections are in fact negligible.) The large number of Kµ2 decays allows for a statisticalprecision of ∼0.1%, while setting aside a generous sample for systematic studies.
As in the analysis of the KL BRs, to avoid any bias due to differences in the K−
detection efficiency for different K+ decay modes, the decay products of the K− mustindependently satisfy the trigger requirements. The tagging efficiency exhibits a smallresidual dependence on the K+ decay mode. This effect is corrected by MC simulationand checked using data.
K+ → µ+ν decays must have 225≤ p∗ ≤400 MeV, where p∗ is the momentum of thecharged decay particle computed in the kaon rest frame assuming the pion mass. Thetrue shape of the p∗ distribution for signal events is obtained from a sample of controldata. This distribution is used with the distributions for background sources to fit thep∗ spectrum (Figure 9, center panel). Figure 9 (right panel) shows the spectrum afterbackground subtraction.
104
103
102
105
200 220 240 260 280 220 260 300 340 380
mn
mng
pp
pln
160 180 200 220 240 260 280
Events
/M
eV
. data
mn(g)
pp, p nl
p* (MeV) p* (MeV)p* (MeV)
Fig. 9. (Left panel) Monte Carlo spectra of p∗ for K+ decays, showing contributionsfrom various channels. (Center panel) Distribution of p∗ for ∼60 pb−1 of 2001–2002KLOE data. (Right panel) Distribution of p∗ after background subtraction. Theshaded area is used to count K+ → µ+ν events.
In a sample of four million tagged events, KLOE finds ∼865,000 signal events with225 ≤ p∗ ≤ 400 MeV, giving BR(K+ → µ+ν(γ)) = 0.6366 ± 0.0009 ± 0.0015. Thismeasurement is fully inclusive of final-state radiation (FSR) and has a 0.27% uncertainty.
4.4.2 Charged Kaon Lifetime This work is very near completion. We only men-tion that KLOE can measure the decay time for individual kaons in two ways. The firstis to obtain the proper time from the kaon path length in the DC. The second is basedon the precise measurement of the arrival times of the photons from K± → π±π0 decaysand the determination of the decay point from the track vertex in the DC. Both methodsprovide results accurate to the level of 0.1%.

Franzini & Moulson The Physics of DAΦNE and KLOE 19
4.4.3 Semileptonic Decays of Charged Kaons Again the measurement is basedon counting decays to each channel for samples of kaons tagged by detection of the two-body decay of the other kaon. After transforming to the center of mass of the tagging kaon,µν and ππ0 decays are distinguished because p∗µ = 236 MeV and p∗π = 205 MeV. Bothtypes of decays are used as tags. The decay products of the tagging kaon must indepen-dently satisfy the trigger requirements. KLOE measures the semileptonic BRs separatelyfor K+ and K−. Therefore, BR(K± → π0e±ν(γ)) and BR(K± → π0µ±ν(γ)) are eachdetermined from four independent measurements (K+ and K− decays; µν and ππ0 tags).To identify signal events, two-body decays are first removed from the sample. The γsfrom the π0 are then reconstructed and provide a measurement of the K± decay time. Fi-nally, the m2
ℓ distribution for the charged secondary lepton is reconstructed by TOF. Aftersome further cleaning of the sample, them2
ℓ distribution looks like that shown in Figure 10.
10 k
20 k
-10,000 0 10,000 20,000 30,000
DataFit toMC shapes
M2 2(MeV )
Counts
/ 1
4M
eV2
K 3m
Ke3
Fig. 10. Distribution of m2ℓ , reconstructed using time-of-flight information, for
events selected as K±
ℓ3 decays. Also shown are the results of a fit to the Monte Carlodistributions for the two signal channels plus residual background.
The very good agreement of the four separate determinations of each BR is powerfulproof of the validity of the analysis and provides an estimate of the systematic uncer-tainties. The KLOE values for the BRs are BR(K±
e3) = (5.047 ± 0.046stat+tag ± σsyst)%and BR(K±
µ3) = (3.310 ± 0.040stat+tag ± σsyst)%. These values are averages over the fourdifferent samples for each channel and have been calculated with correlations carefullytaken into account. These results were presented at the Lisbon European Physical Societyconference (70) and are preliminary in the sense that a careful estimate of the systematicuncertainty on the signal selection efficiency is still in progress. We can however use therms spread of the four measurements of each BR to estimate the systematic uncertaintiesat ∼0.02% absolute for both Ke3 and Kµ3, thus enlarging the errors stated above to 0.05%for both values. These results give Rµe ≡ Γ(Kµ3)/Γ(Ke3) = 0.656 ± 0.008.

Franzini & Moulson The Physics of DAΦNE and KLOE 20
4.5 KLOE, Vus, and CKM Unitarity
As noted in Section 4.1.4, the KLOE data set onKℓ3 decays allows multiple determinationsof |Vus|, with very few external experimental inputs.
Following the derivation in Section 4.1.5, we compute the value of fK0
+ (0)|Vus| from thedecay rates for the five semileptonic decay processes measured by KLOE. For the moment,we use the values λ′
+ = 0.0221± 0.0011, λ′′+ = 0.0023± 0.0004, and λ0 = 0.0154± 0.0008,
obtained from a combined fit toKe3 andKµ3 results from KTeV (30) and ISTRA+ (31,32).We use the KS and K± lifetimes from the PDG (52). All BR measurements and the KL
lifetime value are from KLOE, as discussed in Sections 4.2 to 4.4. The input data and theresults are collected in Table 4.
Table 4. Evaluation of fK0
+ (0)|Vus| from KLOE data
Decay BRa τ b Γ fK0
+ (0) |Vus|c(ns) (µs−1)
KLe3 0.4007(15)d 50.84(23) 7.88(4) 0.2164(6)
KLµ3 0.2698(15) 50.84(23) 5.307(32) 0.2173(8)
KS e3 7.05(9) × 10−4 0.08958(6) 7.87(10) 0.2161(14)
K±e3 0.0505(5) 12.385(25) 4.08(4) 0.2178(13)
K±µ3 0.0331(5) 12.385(25) 2.67(4) 0.2157(16)
aAll branching ratios from KLOE.bKL lifetime from KLOE; KS and K± lifetimes from PDG (52).cIncludes channel-specific SU(2) and electromagnetic corrections.dParentheses indicate errors on corresponding digits
Obviously, there are correlations between the different values for fK0
+ (0)|Vus|, particularlyfor the case of KLe3 and KLµ3, owing to the non-negligible error on the KL lifetime(∼0.46%). With the correlations taken into account, we find
〈fK0
+ (0)× |Vus|〉 = 0.2167 ± 0.0005 (or ±0.23%),
with χ2/ndf = 2.34/4. The quality of the fit is illustrated in Figure 11.
0.214
0.216
0.218
Vf
us
´(0
)
0.227
0.225
0.223
Vus
((0) =
0.961)f
á ´ ñus f(0)V = 0.2167±0.0005
m3K±
KSe3
t( ) = 50.84KL ±0.23 ns
KLe3 eKLm3 3K±
Fig. 11. Fit to the five KLOE values for fK0
+ (0)|Vus|.
To extract the value of |Vus|, one needs an estimate of fK0
+ (0). Although the originalcalculation of Leutwyler & Roos (71) fell into disfavor a few years ago, it appears tohave been confirmed recently by vastly improved lattice QCD calculations (72). Using
fK0
+ (0) = 0.961 ± 0.008 (71), we finally obtain
|Vus| = 0.2255 ± 0.0019.

Franzini & Moulson The Physics of DAΦNE and KLOE 21
To test CKM unitarity, we use |Vud| = 0.97377 ± 0.00027 (73). The first-row unitarityrelation then gives
|Vud|2 + |Vus|2 + |Vub|2 = 0.97382 + 0.22552 +O(10−5) = 0.9991 ± 0.0010,
which is in good agreement with unitarity.Measurements of the kaon system are very promising, and we believe that accuracies
below the 0.1% level can be achieved. Experimental progress must be matched by bettercalculations, which lattice QCD seems close to attaining.
5 HADRONIC PHYSICS
A φ factory such as DAΦNE is an ideal place at which to conduct a number of measure-ments in hadronic physics. The versatility of the KLOE experiment is well suited for suchmeasurements.
The leptonic widths of the φ meson provide a precise test of lepton universality. In-terference between the continuum and φ-mediated amplitudes leads to a modulation ofthe forward-backward asymmetry for e+e− → e+e− events and of the cross section fore+e− → µ+µ− events, providing sensitivity to Γee and (ΓeeΓµµ)
1/2, respectively. From athree-point scan about the φ peak, conducted in 2002 (17.4 pb−1 in total), KLOE obtainsconsistent values for the two quantities, from which Γℓℓ = 1.320 ± 0.023 keV (46).
Radiative φ decays (φ → meson+γ) are unique probes of meson properties and structure.The transition rates are strongly dependent on the wave function of the final-state meson.They also depend on its flavor content, because the φ is a nearly pure ss state and becausethere is no photon-gluon coupling.
Finally, initial-state radiation (ISR) lowers the effective collision energy from√s to√
sπ = (s− 2Eγ√s)1/2, providing access to hadronic states of mass
√sπ from threshold to
mφ. KLOE has exploited ISR to measure the e+e− → π+π− cross section over this entireenergy range without changing the DAΦNE energy.
5.1 Pseudoscalar Mesons: η and η′
5.1.1 The η Meson The BR for the decay φ → ηγ is 1.3%. In 2.5 fb−1 of KLOEdata, there are 100 million η decays, identified clearly by their recoil against a photon ofE = 363 MeV.
Current results for mη (74, 75) disagree at the 8σ level. KLOE measures mη using akinematic fit to the φ → ηγ → 3γ topology. The absolute mass scale is determined by mφ.A preliminary analysis of the 2001–2002 data demonstrates that KLOE can measure mη
with competitive precision and can thereby clarify the current experimental situation.Measurements of the Dalitz distributions for η → 3π decays help in constraining calcu-
lations in chiral perturbation theory. These ∆I = 1 decays proceed primarily because ofstrong isospin breaking. As a result, once the phase-space integral in the amplitude for suchdecays is known, the widths give access to the ratio of quark masses (m2
s−m2)/(m2d−m2
u),with m = (mu + md)/2 (see References 77 and 78). In addition, the symmetries of theDalitz plot for η → π+π−π0 decays provide tests of charge-conjugation invariance. Withthe 2001–2002 data set, KLOE obtains a preliminary value for α, the Dalitz-plot slope inη → 3π0 decays, that is competitive in precision to that from the Crystal Ball experiment(79), as well as limits on the left-right, quadrant, and sextant asymmetries in the Dalitzplot for η → π+π−π0 decays significantly more stringent than the current PDG values(52).

Franzini & Moulson The Physics of DAΦNE and KLOE 22
The decay η → π0γγ is particularly interesting in chiral perturbation theory. As notedin Reference 80, there is no O(p2) contribution, and the O(p4) contribution is small.3
The experimental value of the decay rate offers a point of comparison for third-orderchiral perturbation theory calculations. The history of attempts to measure the rate forthis decay is confused owing to persistent problems with background, in particular fromη → 3π0. In both existing plausible BR measurements, η mesons were produced via thereaction π−p → ηn (81, 82). Only the result from the Crystal Ball (82) is in agreementwith chiral perturbation theory predictions. At KLOE, the decay can be reconstructedwith full kinematic closure and without complications from certain backgrounds presentin fixed-target experiments, such as π−p → π0π0n. Using the 2001–2002 data set, KLOEhas obtained the preliminary result BR(η → π0γγ) = (8.4± 2.7± 1.4)× 10−5. This resultis approximately a factor of four lower than that from the Crystal Ball. It is in agree-ment with the results of O(p6) tree-level chiral perturbation theory calculations reportedin References 80 and 83 and with the O(p6) Nambu–Jona-Lasinio model calculation ofReference 84.
The decay η → 3γ violates C, while the decay η → π+π− violates both P and CP .The Standard Model cannot accommodate either decay at any currently observable level.KLOE has conducted a search for the decay η → 3γ using 410 pb−1 of the 2001–2002 data(85). A clean sample of 4γ events is first isolated. Events with φ → ηγ and η → 3γ wouldbe distinguished by the characteristic energy of the radiated photon (Erad = 363 MeV),which in most cases would also be the most energetic photon in the event. No peak isobserved in the distribution of the maximum photon energy for 4γ events. KLOE obtainsthe limit BR(η → 3γ) ≤ 1.6 × 10⁻⁵ at 90% C.L., the most stringent obtained to date.KLOE has also searched for evidence of the decay η → π+π− in the tail of the Mππ
distribution for e+e− → π+π−γ events in which the photon is emitted at large polarangles (θ > 45◦). 350 pb−1 of 2001–2002 data were analyzed as described in Section 5.2.No peak is observed in the distribution of Mππ in the vicinity of mη. The correspondinglimit is BR(η → π+π−) ≤ 1.3 × 10⁻⁵ at 90% C.L. (86), which is more stringent than theprevious limit by a factor of 25.
5.1.2 The η′ Meson The magnitude of BR(φ → η′γ) is a probe of the ss contentof the η′ (87). The ratio Rη′ ≡ BR(φ → η′γ)/BR(φ → ηγ) can be related to the pseu-
doscalar mixing angle ϕP in the basis {|uu + dd 〉/√2, | ss 〉}, offering an important point
of comparison for the description of the η-η′ mixing in extended chiral perturbation theory(88). At KLOE, the φ → η′γ decay is identified in the channel in which η′ → ηπ+π− andη → γγ, whereas the φ → ηγ decay is identified in the channel in which η → π+π−π0.In either case, the final state contains a π+, a π−, and three photons. As a result, manysystematics cancel in the measurement of Rη′ .
A first KLOE measurement of this ratio was conducted using 16 pb−1 of data from theyear 2000 (89). The value obtained was Rη′ = (4.70± 0.47± 0.31)× 10−3. This allows ϕP
to be determined to better than 2◦ using relations in References 88 and 90. Together withadditional constraints from the rates for η′ decays into ργ and γγ, which give informationabout the nonstrange quark content of the η′, the KLOE result for ϕP can be used to place alimit on the gluonium content of the η′. With | η′ 〉 = Xη′ |uu+dd 〉/
√2+Yη′ | ss 〉+Zη′ | gg 〉,
where the last term represents the possible gluonium content of the η′ meson, the aboveconsiderations give Z2
η′ = 0.06+0.09−0.06, which is compatible with zero.
A recent extension of this analysis is based on the identification of the π+π−7γ final3We recall that in chiral perturbation theory, the effective Lagrangian is expanded in a series of terms
with increasing numbers of field derivatives and quark mass terms, and that the chiral orders in the mesonsector are always even.
Franzini & Moulson The Physics of DAΦNE and KLOE 23
state (i.e., η′ → ηπ+π− with η → 3π0, or η′ → ηπ0π0 with η → π+π−π0). A preliminaryresult based on the analysis of the full 2001–2002 data set gives Rη′ with a total error ofapproximately 4.5%. Uncertainties in the intermediate η′ BRs dominate this error. KLOEcan improve the knowledge of these BRs by using the recently acquired data.
5.2 Scalar Mesons: f0(980) and a0(980)
The compositions of the five scalar mesons with masses below 1 GeV are not well under-stood. Of these, the well-established states are the I = 0 f0(980) and the I = 1 a0(980).Together with the very broad I = 0 f0(400–1200) (σ) and possible I = 1/2 K∗
0 (800) (κ)states, these may be grouped into a nonet with an inverted mass structure. Both thelow masses of these mesons as a whole and this inverted mass structure are explainedby the hypothesis that these are not conventional qq mesons, but are in fact qqqq states(91). In this case, the mass degeneracy of the f0 and a0 is explained by the fact thatthey contain “hidden” ss pairs, whereas the σ, the state of lowest mass, is uddu. Thequarks and antiquarks may also be paired into two pseudoscalar mesons (92). In this case,the f0 and a0 are interpreted as KK “molecules.” The proximity of the f0 and a0 tothe KK thresholds, together with the fact that these states are strongly coupled to KK,suggests that the f0 and a0 must in any case be surrounded by a cloud of virtual KKpairs (93). Alternatively, there are unitarized quark models in which both the light andheavy scalars are understood as dynamically generated states “seeded” by bare qq states(see, e.g., Reference 94).
Decays such as φ → f0γ → ππγ and φ → a0γ → ηπ0γ are suppressed unless the f0 anda0 have significant ss content. The BRs for these decays are estimated to be on the orderof 10−4 if the f0 and a0 are qqqq states (in which case they contain an ss pair), or on theorder of 10−5 if the f0 and a0 are conventional qq states (95,96). If the f0 and a0 are KKmolecules, the BR estimates are sensitive to assumptions about the spatial extension ofthese states (97).
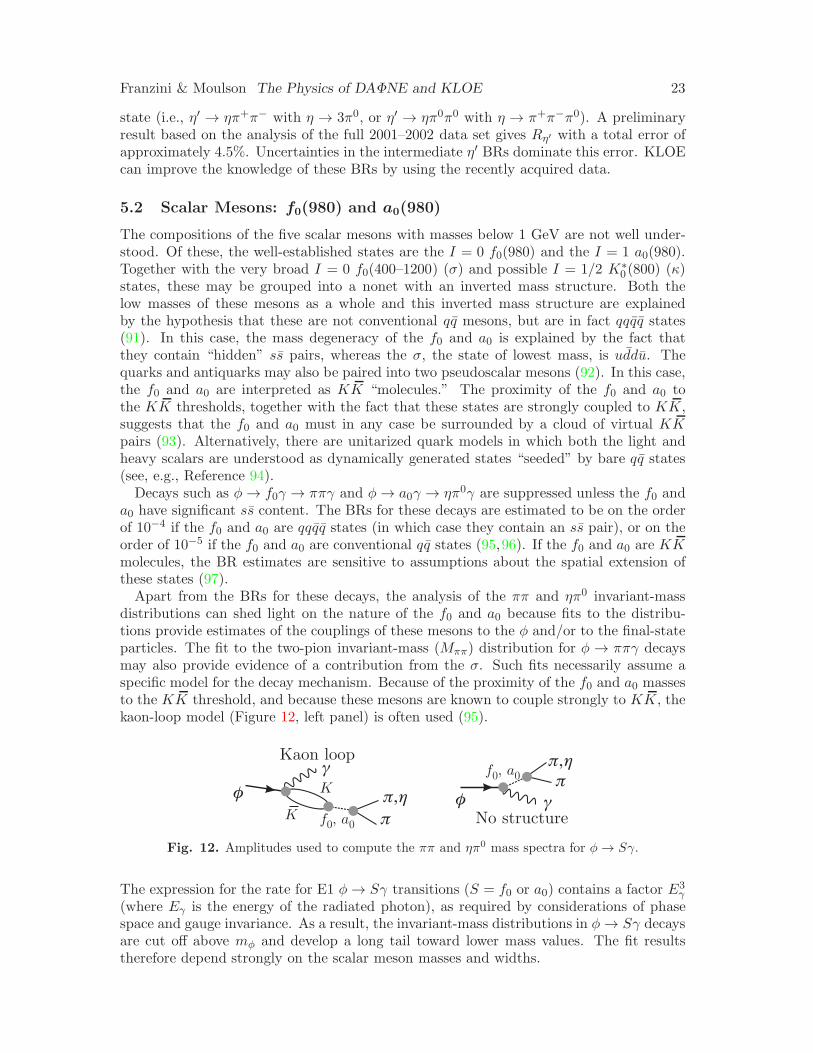
Apart from the BRs for these decays, the analysis of the ππ and ηπ0 invariant-massdistributions can shed light on the nature of the f0 and a0 because fits to the distribu-tions provide estimates of the couplings of these mesons to the φ and/or to the final-stateparticles. The fit to the two-pion invariant-mass (Mππ) distribution for φ → ππγ decaysmay also provide evidence of a contribution from the σ. Such fits necessarily assume aspecific model for the decay mechanism. Because of the proximity of the f0 and a0 massesto the KK threshold, and because these mesons are known to couple strongly to KK, thekaon-loop model (Figure 12, left panel) is often used (95).
g
fK
K
p
pp,h
f
f a0, 0
f a0, 0
Kaon loop
No structuregp,h
Fig. 12. Amplitudes used to compute the ππ and ηπ0 mass spectra for φ → Sγ.
The expression for the rate for E1 φ → Sγ transitions (S = f0 or a0) contains a factor E3γ
(where Eγ is the energy of the radiated photon), as required by considerations of phasespace and gauge invariance. As a result, the invariant-mass distributions in φ → Sγ decaysare cut off above mφ and develop a long tail toward lower mass values. The fit resultstherefore depend strongly on the scalar meson masses and widths.

Franzini & Moulson The Physics of DAΦNE and KLOE 24
5.2.1 φ → π0π0γ and φ → ηπ0γ The first KLOE studies of the decays φ → π0π0γ(98) and φ → ηπ0γ (99) were performed with the 17 pb−1 of data collected in 2000.
Amplitudes contributing to φ → π0π0γ include φ → Sγ (with S = f0 or σ) andφ → ρ0π0 (with ρ0 → π0γ). The Mππ distribution was fit with a function includingterms describing the contribution from φ → Sγ, that from φ → ρπ, and their interference.Two forms for the φ → Sγ term were used: one including only the process φ → f0γrepresented by the kaon-loop diagram of Figure 12 (95), and one including an additionalcontribution from φ → σγ, represented by a point-like coupling. The free parameters inthe fits describing the scalars were mf0 , the coupling constants gf0K+K− and gf0π+π− forthe kaon loop, and, in the fit including the σ, the coupling gφσγ . The fits gave negligiblysmall contributions from the ρπ and associated interference terms. The fit including theσ gave a significantly better value of χ2/ndf. The value obtained for BR(φ → π0π0γ) was(1.09±0.03±0.05)×10−4 , in good agreement with the results from the CMD-2 (100) andSND (101) experiments at the VEPP-2M collider in Novosibirsk, and significantly moreprecise.
The φ → ηπ0γ channel is simpler to treat in that there is no contribution from the σ.The amplitudes contributing are φ → a0γ and φ → ρ0π0, with ρ0 → ηγ. In the KLOEanalysis, final states corresponding to two different η decay channels were studied: η → γγ(5γ final state) and η → π+π−π0 (π+π−5γ final state). The Mηπ distributions for eachsample were fit simultaneously with a function analogous to that discussed above. The fitparameters describing the a0 were the coupling constants ga0K+K− and ga0ηπ0 ; the massof the a0 was fixed to the PDG value (52). The fit gave a contribution from the ρπ termconsistent with zero. The values obtained for BR(φ → ηπ0γ) using the 5γ and π+π−5γsamples were (8.51±0.51±0.57)×10−5 and (7.96±0.60±0.40)×10−5 , respectively. Thesetwo values are in agreement with each other and with the results from CMD-2 (100) andSND (102); again, the KLOE data substantially improve the knowledge of these BRs.
In either case, the good quality of the fit establishes that the kaon-loop model providesa valid description of the decay process. The BRs for φ → f0γ and φ → a0γ were obtainedby integrating the appropriate terms of the fit functions. Assuming dominance of the ππand ηπ0 channels in f0 and a0 decays and that BR(f0 → π+π−) = 2BR(f0 → π0π0), thevalues BR(φ → f0γ) = (4.47 ± 0.21) × 10−4 and BR(φ → a0γ) = (0.74 ± 0.07) × 10−4
are obtained. These BRs are large, as are the values obtained for the couplings of thescalars to KK, especially for the f0. These results have been interpreted to support thehypothesis that the f0 and a0 consist of a compact qqqq core surrounded by a virtual KKcloud (103). Various interpretations of the KLOE data exist, however, and the data havebeen reanalyzed by many authors (104,105,106). Although these authors obtain differentresults for BR(φ → f0γ) and the various couplings, in general they find support for theqqqq or KK hypotheses in the KLOE data. One reanalysis that arrives at a differentconclusion is that of Boglione & Pennington (107). They perform a T -matrix ππ-KKcoupled-channel analysis of the data on φ → π0π0γ from KLOE and SND, and obtainBR(φ → f0γ) = 3.4 × 10⁻⁵, which is smaller than the KLOE fit result by an order ofmagnitude. They argue that, notwithstanding the large φ → KK coupling, the low-massenhancement from gauge invariance increases the importance of the φ → ππγ couplingfollowed by ππ → ππ rescattering. Thus, approximately 90% of the observed φ → π0π0γwidth is from decay through the σ, rather than through the f0.
The analyses of the φ → π0π0γ and φ → ηπ0γ decays based on the 2001–2002 dataset benefit from an increase in statistics by a factor of ∼30 and are nearing completion.Fits using two models are under development: an implementation of the kaon-loop modelembodying some of the extensions of Reference 106, and the no-structure model (108)illustrated in Figure 12 (right panel). In this latter model, the scalar is described by a

Franzini & Moulson The Physics of DAΦNE and KLOE 25
Breit-Wigner amplitude with a mass-dependent width; the free parameters of the fit aremf0 and the couplings gφSγ , gf0ππ or ga0ηπ, and gSKK (109). The fit includes two additionalcomplex parameters to describe contributions to the amplitude from background processes.
5.2.2 φ → π+π−γ KLOE has recently published a study of the decay φ → f0γ →π+π−γ based on the 2001–2002 data set (110). Only a small fraction of the e+e− → π+π−γevents involve the f0; the principal contributions are from events in which the photon isfrom ISR or FSR. At large values of the photon polar angle θγ , the ISR contributionis strongly reduced; the analysis is performed on the Mππ distribution for events withθγ > 45◦. The Mππ distribution is fit with a function consisting of the terms
dσ
dMππ=
dσISRdMππ
+dσFSRdMππ
+dσρπdMππ
+dσSγdMππ
± dσintdMππ
.
Analytic expressions for the ISR, FSR, and ρπ (e+e− → ρ±π∓, ρ± → π±γ) terms are takenfrom References 96 and 111. The last two terms describe the decay φ → Sγ → ππγ and itsinterference with FSR; the interference may be constructive or destructive. The Mππ dis-tribution has been fit using expressions for the scalar-mediated amplitude obtained fromthe kaon-loop model, the no-structure model, and the T -matrix coupled-channel frame-work. Figure 13 (left panel) shows the Mππ distribution, with the result of the kaon-loopfit superimposed. The overall appearance of the distribution is dominated by the radiativereturn to the ρ; the f0 appears as the peak-like structure in the region 900–1000 MeV.Figure 13 (right panel) shows the data in this mass region, with the ISR, FSR, and ρπterms subtracted.
4 k
3 k
2 k
1 k
0.6 0.8 1.0
800
600
400
200
0
0.9 0.95 1.0m (GeV)m (GeV)
Co
un
ts
Co
un
ts
Fig. 13. (Left panel) Mππ distribution for large-photon-angle π+π−γ events from2001–2002 KLOE data. Fits with and without the f0 contribution are shown. (Rightpanel) Distribution in the region of the f0, with the initial-state radiation, final-stateradiation, and ρπ contributions subtracted.
Both the kaon-loop and no-structure fits strongly prefer destructive interference betweenthe Sγ and FSR amplitudes, which damps the low-mass tail of the f0. No improvementin the quality of the kaon-loop fit is observed when the σ is included. Both fits give valuesfor mf0 in agreement with the PDG estimate (52). Large discrepancies between the kaon-loop and no-structure values are obtained for the couplings gf0K+K− and gf0π+π− . Thekaon-loop fit gives coupling values in reasonable agreement with those obtained from thefit to the KLOE φ → π0π0γ data discussed above. Both fits give g2f0K+K−/g
2f0π+π− ≈ 3,
which indicates that the f0 couples more strongly to kaons than to pions. Integrating theappropriate terms of the fit functions gives values for BR(φ → f0γ) in the neighborhoodof 3× 10⁻⁴.

Franzini & Moulson The Physics of DAΦNE and KLOE 26
5.3 The Hadronic Cross Section and aµ
5.3.1 The Muon Anomaly aµ The observation of the anomalous magnetic momentof the electron helped drive the development of quantum electrodynamics (QED). Thevalue of the muon anomaly, aµ, is (mµ/me)
2 ≈ 40,000 times more sensitive than thatof the electron to high-mass states in the polarization of the vacuum. The Muon g − 2Collaboration (E821) at Brookhaven has used stored muons to measure aµ to 0.5 ppm(112):
aµ =gµ − 2
2= (116,592,080 ± 60)× 10−11.
The muon anomaly receives contributions from QED, weak, and hadronic loops in thephoton propagator, as well as from light-by-light scattering. The lowest-order hadroniccontribution is ahadµ = ∼7000× 10−11, with an uncertainty of ∼60× 10−11. To the extentthat this uncertainty can be reduced, the E821 measurement offers a potential probe ofnew physics at TeV energy scales.
The low-energy contribution to ahadµ cannot be obtained from perturbative QCD. It has
often been calculated from measurements of the cross section for e+e− annihilation intohadrons via the dispersion integral
ahadµ =1
4π3
∑
f
∫ ∞
sth(f)K(s)σ(e+e− → f) ds,
where K(s), the QED kernel, is a monotonic function that varies approximately as 1/s,with s the squared center-of-mass collision energy. This amplifies the importance of thecross-section measurements at low energy. Approximately two-thirds of the integral iscontributed by the process e+e− → π+π− for
√s < 1 GeV, i.e., in the vicinity of mρ.
Before the arrival of the KLOE results we discuss below, calculations of ahadµ from world
e+e− data (dominated at low energies by the CMD-2 measurement of Reference 113) ledto a value of aµ ∼2.4σ lower (114) than the final value reported by E821.
Assuming the validity of the conserved-vector-current hypothesis, the e+e− cross sectionfor the production of a neutral hadronic state f0 can also be obtained from the spectralfunction for the decay of the τ lepton to the hadronic state f−, where f0 and f− areconnected by an isospin rotation. (The spectral function for τ− → f−ντ decay is obtainedfrom dBR(τ− → f−ντ )/ds, with s as the squared mass of the state f−.) With f0 = π+π−
and f− = π−π0, one obtains the I = 1 contribution to σπ+π− . A recent evaluation (115)of ahadµ based on τ data rather than on e+e− data at low energies gives a value for aµ that
is only (76 ± 90) × 10−11 (0.8σ) lower than the final E821 value (114). Thus, even beforeKLOE results became available, there was some discrepancy between e+e−- and τ -basedevaluations of aµ. We return to this point in Section 5.3.3.
5.3.2 Measurement of σπ+π− at KLOE DAΦNE is highly optimized for runningat
√s = mφ;
√s cannot be varied over a broad range. However, ISR naturally provides
access, via the process e+e− → π+π−γ, to hadronic states of lower mass. The crosssection σπ+π− over the entire interval from threshold to mφ is reflected in the distributionof sπ = M2
ππ for π+π−γ events,
σπ+π−(sπ) =sπ
H(sπ|s)dσπ+π−γ
dsπ
∣
∣
∣
ISR, (13)
where H, the “radiator function,” describes the ISR spectrum. Note the subscript ISRon the differential π+π−γ cross section. This is very important because the contributionfrom FSR is of the same order as that from the ISR process.

Franzini & Moulson The Physics of DAΦNE and KLOE 27
To correctly calculate H and estimate the effects of FSR, an accurate simulation iscritical. The KLOE analysis is based on the PHOKHARA event generator (116), whichincludes next-to-leading-order ISR (two initial-state photons) and has a stated accuracy of0.5%. Leading-order FSR and ISR-FSR terms are also included. In particular, ISR-FSRevents are related to virtual π+π−γ states in the photon propagator and require specialtreatment to be fully counted in the evaluation of ahadµ .
At small photon polar angle θγ , ISR events are vastly more abundant than FSR events.Requiring angular separation between the pions and the photon further suppresses FSR(117). For these reasons, the first KLOE measurement (118) was performed using eventswith θγ < 15◦ and θπ > 50◦ for both pion tracks. In such events, the photon is lost downthe beam pipe; sπ is computed from the pion momenta. These fiducial cuts additionallyreduce background from φ → π+π−π0 and φ → f0γ → π+π−γ events (see Section 5.2.2).They also limit the accessible range in sπ, because in π+π−γ events with a hard photonemitted at small angle, one or both pions from the low-mass π+π− pair do not enter thetracking volume.
The KLOE results obtained with 141 pb−1 of 2001 data (118) are summarized in Figure14. The left panel shows the measurement of dσπ+π−γ/dsπ.
10
20
30
40
50
60
70
80
90
0.4 0.5 0.6 0.7 0.8 0.90
200
400
600
800
1000
1200
0.4 0.5 0.6 0.7 0.8 0.9
M 2pp (GeV )2
s(e
e+
-+
-®
pp
)(n
b)
ds
(ee
+-
+-
®p
pg)
/d
(nb/G
eV)
M2
2 pp
M 2pp (GeV )2
Fig. 14. (Left panel) KLOE measurement of dσπ+π−γ/dsπ. (Right panel) Thecross section σπ+π− , including final-state radiation and without correction for vacuumpolarization.
The statistical errors range from ∼2% at the lower limit in sπ to ∼0.5% at the ρ peak. Theexperimental systematic uncertainties are mostly flat in sπ and amount to 0.9%. The lu-minosity was estimated using large-angle Bhabha scattering and contributes an additional,dominantly theoretical uncertainty of 0.6%. The right panel of Figure 14 shows the crosssection σπ+π− evaluated via Equation 13. The contribution to the systematic uncertaintyon σπ+π− from FSR is 0.3%, whereas that from the accuracy of H is 0.5%. Finally, forthe evaluation of ahadµ , it is necessary to remove the effects of vacuum polarization in the
photon propagator for the process e+e− → π+π− itself by correcting for the running ofαem. This contributes 0.2% to the systematic uncertainty.
For the contribution to aππµ from the energy interval 0.35 < s < 0.95 GeV2, KLOEobtains
aππµ (0.35 < s < 0.95 GeV2) = (3887 ± 8stat ± 35syst ± 35th)× 10−11.
As a point of comparison, KLOE has evaluated the contribution to aππµ for the energy
interval covered by CMD-2 (0.37 < s < 0.93 GeV2). The results from the two experiments

Franzini & Moulson The Physics of DAΦNE and KLOE 28
differ by only 30×10−11 (0.5σ). Inclusion of the KLOE data together with the CMD-2 datain the evaluation of ahadµ increases the discrepancy between the calculated and measured
values of aµ to (252 ± 92) × 10−11 (∼2.7σ) (119).
5.3.3 Comparison of e+e− and τ Data As noted at the end of Section 5.3.1,e+e−- and τ -based evaluations of ahadµ give different results. The KLOE data increase thisdiscrepancy, whereas new data from SND (120) decrease it. Figure 15 compares evalua-tions of the pion form factor from τ and e+e− data by Davier et al. (121). The KLOEdata clearly exhibit a trend that is systematically different from that of the τ data. TheSND points conform more closely to the τ data, whereas the CMD-2 points lie somewherein between. As a gauge of the significance of these trends, Davier et al. have evaluatedBR(τ− → π−π0ντ ) from the cross-section data of each of the three experiments. TheBR values calculated from the KLOE and CMD-2 data are 3.8σ and 3.1σ lower than themeasured value, respectively, and are reasonably compatible with each other. The BRvalue from the SND data is compatible with (0.9σ lower than) the measured value.
-0.3
-0.2
-0.1
0
0.1
0.2
0.3
0.2 0.4 0.6 0.8 1 1.2
KLOESNDCMD-2CMDOLYA
τ Average
s (GeV2)
(|Fπ|2 [e
e] –
|Fπ|2 [τ
]) / |F
π|2 [τ]
Fig. 15. Relative difference between the pion form factor |Fπ(s)|2 as evaluated fromτ spectral functions (band shows error), and σπ+π− measurements from various e+e−
experiments (points). Reprinted figure with permission from M. Davier, A. Hocker,Z. Zhang, Rev. Mod. Phys., accepted for publication (121). In press by the AmericanPhysical Society.
Questions about possible biases in the results of any of the three experiments may beresolved by new data and by analysis improvements. CMD-2 has recently announcedpreliminary results from the analysis of their 1996–2000 data for the entire interval in
√s
from threshold to 1.4 GeV, including a nearly 10-fold increase in statistics in the regioncovered by their previous measurement (122). KLOE prospects are discussed below.
5.3.4 Forthcoming Improvements with KLOE KLOE is actively working onrepeating the small-photon-angle measurement described above using data from 2002–2005 and a series of improvements to the reconstruction and analysis.
The contribution to ahadµ from e+e− → π+π− in the interval in s between threshold and
0.35 GeV2 is approximately 1000× 10−11. As noted above, the fiducial cuts implementedin the KLOE measurement restrict the acceptance to higher values of Mππ. To explore the

Franzini & Moulson The Physics of DAΦNE and KLOE 29
low-mass part of the spectrum, KLOEmust accept events with θγ > 40◦. Background fromφ → π+π−π0 events can be rejected by kinematic closure if explicit detection of the photonfrom π+π−γ is required. FSR is a more complicated problem: For θγ > 40◦, ISR andFSR events contribute nearly equally to the π+π−γ spectrum in the tails of the ρ, and theaccuracy of the generator used to obtain FSR corrections is critical. As discussed by Binneret al. (117), the ISR-FSR interference results in a measurable charge asymmetry, whichis a useful gauge of the accuracy of the simulation. KLOE has performed comparisons ofthis type for the analysis of φ → π+π−γ discussed in Section 5.2.2 (110). Moreover, withthe full statistics of the complete data set, KLOE should be able to normalize the crosssection for e+e− → π+π−γ to that for e+e− → µ+µ−γ. This is equivalent to measuring Rin an energy scan and reduces the effects of theoretical systematics on the measurement.With 2 fb−1, a µ+µ−γ-normalized measurement for θγ > 40◦ would allow the contributionto aππµ from the interval 4m2
π < s < 0.9 GeV2 to be determined with a statistical error of
∼10× 10−11.In early 2006, KLOE also collected 200 pb−1 of data at
√s = 1000 MeV, at which
σ(e+e− → φ → π+π−π0) drops to 5% of its peak value. These data will provide a betterunderstanding of the background contributions, and, by themselves, should determine thecontribution to aππµ as above, with a statistical error of ∼35 × 10−11 and greatly reducedsystematic uncertainties.
6 THE DEAR AND SIDDHARTA EXPERIMENTS
6.1 Kaonic Atoms and the KN Interaction
In the language of chiral dynamics, the meson-nucleon “sigma terms,” which involve matrixelements of the form 〈N |mq qq|N 〉 (q ∈ u, d, s), provide a measure of the effect of the scalarquark condensate on the nucleon, that is, the extent to which the chiral symmetry of QCDis broken. The values of the kaon-nucleon sigma terms are also directly related to the sscontent of the nucleon. The kaon-nucleon sigma terms are not experimentally observable,but can be obtained indirectly from measurements of the K±N scattering amplitudes atthreshold (i.e., scattering lengths) (123). Recently, interest in the KN interaction hasbeen fueled by the hypothesis that the interaction may be attractive enough to allow theformation of deeply bound K-nuclear states (124), followed by claims of evidence for theexistence of such states (see Section 7.2.2). Extrapolation of the existing K−p scatteringdata to threshold and below is complicated by the presence of the Λ(1405), as well asof open channels below threshold such as KN → Y π (Y = Λ, Σ). Complementaryinformation is available from the study of kaonic atoms.
A kaonic atom is formed when a K− is captured in a high-n electronic orbit of a normalatom. The kaon undergoes a cascade of transitions down to some final state of lower n andis then absorbed by the nucleus. The strong K−N interaction causes the energy of thislevel to be shifted; the width of the spectral line is broadened by the absorption of the K−.For a light system such as hydrogen, X-ray transitions to the n = 1 level can be observed.The 1s level shifts (∆1s) and widths (Γ1s) of the kaonic-hydrogen atom determine theisospin-averaged K−p scattering length aK−p via the Deser relation (125).
For many years, kaonic-atom and scattering data seemed to give conflicting results.Various analyses of K−p scattering data gave values for ∆1s and Γ1s clustered around−360 eV and 510 eV, respectively, indicating a repulsive interaction. The few existingmeasurements of the X-ray spectrum of kaonic hydrogen gave positive values for ∆1s,although the consistency of the results was poor. In 1997, a kaonic-hydrogen measurementfrom the KpX experiment at KEK was reported (126). The KpX values for ∆1s and Γ1s

Franzini & Moulson The Physics of DAΦNE and KLOE 30
are consistent with those from scattering data, but significantly less precise. The goal ofthe kaonic-atom program at DAΦNE is to measure ∆1s and Γ1s at the level of a few eV.
6.2 Measurement of the X-Ray Spectrum of Kaonic Hydrogen
6.2.1 DEAR DEAR is literally a tabletop experiment. The apparatus shares thesecond DAΦNE interaction point with the FINUDA experiment—DEAR can be assembledwhen the FINUDA experiment is retracted.
Charged kaons from φ decays at DAΦNE have kinetic energies of 16 MeV. The DEARtarget cell is mounted approximately 10 cm above the beamline at the interaction point.Kaons traverse the thin-walled, aluminum/carbon-fiber beam pipe and kapton entrancewindow, are degraded to kinetic energies of a few MeV, and are stopped in the gaseoushydrogen (at temperature and pressure of 25 K and 2 bar, respectively) of the target cell.The target cell is 12.5 cm in diameter and 14 cm high and is constructed with low-Zmaterials to avoid background from X-ray fluorescence in the energy region of interest.The hydrogen of the target is viewed by 16 charge-coupled device (CCD) detector chipswith a total area of 116 cm2. The pixel size is 22.5 × 22.5 µm2. The energy resolutionof the CCD chips is 150 eV at 6 keV. In-beam energy calibration is obtained from thefluorescence lines from high-Z foils deliberately placed in the target cell. The apparatusis further described in References 127 and 128.
After test runs and detector optimization during 2000–2001, DEAR took physics data in2002. A first series of measurements with the target filled with nitrogen allowed machine-background studies, as well as an analysis of three transition lines in kaonic nitrogen (127).For the measurement with hydrogen (128), 58.4 pb−1 (∼90 million K−) were collected.In general, soft (1–10 keV) X-rays deposit energy in one or two CCD pixels, whereascharged particles, higher-energy photons, and neutrons deposit energy in several adjacentpixels. The X-ray spectrum was therefore formed from single- and double-pixel events.In addition to the transition lines to be observed, the spectrum contains a continuousbackground component and fluorescence lines from detector materials. The backgrounddistribution was obtained from the analysis of runs taken with the beams separated at theinteraction point, as well as of data from the nitrogen run. Parameters used in fits to thespectrum included the intensities of the hydrogen Kα (2p → 1s), Kβ (3p → 1s), and Kγ
(4p → 1s) lines, the energy of the Kα line, and one Lorentzian width for all K lines, asthe hadronic broadening affects the 1s level. The disentanglement of the Kα lines fromkaonic hydrogen and iron fluorescence, which partially overlap, required particular care.
Figure 16 shows a background-subtracted spectrum with the results of a fit super-imposed. The complete analysis of the spectrum gives ∆1s = −193 ± 37 ± 6 eV andΓ1s = 249 ± 111 ± 30 eV. These values are consistent with those from KpX, but withoverall uncertainties that are lower by a factor of two. The absolute values of ∆1s and Γ1s
from DEAR are ∼50% lower than those derived from K−p scattering data.

Franzini & Moulson The Physics of DAΦNE and KLOE 31
Fig. 16. Background-subtracted X-ray spectrum for kaonic hydrogen from DEAR,with fit to K-series spectral lines.
6.2.2 Interpretation The K−p interaction appears to be repulsive from kaonic-hydrogen and scattering data. If the Λ(1405) is interpreted as an I = 0 K−p bound statejust below threshold, scattering through this resonance gives rise to a repulsive contri-bution to the scattering length. A systematic study of heavy-kaonic-atom data suggeststhat the K−-nuclear optical potential is strongly attractive in the nuclear interior (129),which may be explained by the dissolution of the Λ(1405) (130). Detailed calculationsgive variable results for the optical potential (131). If the KN attraction in medium isstrong enough to close the decay channel to Σπ, K-nuclear states with binding energies of∼100 MeV and widths of a few tens of MeV may be formed (124), although this scenariois not universally accepted (132). Systematic analyses of the KN interaction in the near-threshold region may help to establish or disprove this scenario; the DEAR measurementof the K−p scattering length provides an important constraint in such analyses (see, e.g.,Reference 133). However, the origin of the inconsistency between the DEAR results andthe data from K−p scattering requires clarification.
6.2.3 Future Directions: SIDDHARTA The program of kaonic-atom measure-ments at DAΦNE will be continued using the SIDDHARTA (SIlicon Drift Detector forHadronic Atom Research by Timing Applications) apparatus (135). Improvements onthe precision of the DEAR measurement require a substantial reduction in machine-background levels. The machine background in DEAR is primarily from beam particleslost to intrabunch scattering or beam-gas interactions. Effective background suppressioncan be obtained from timing measurements, e.g., by requiring the coincidence between K+
and K− signals in a scintillator telescope together with the signal from the detector. TheDEAR CCDs are read out once every 90 s, so the use of timing information is not possible.In contrast, it is possible with an instrument based on an array of silicon drift detectors.Silicon drift detectors are low-noise devices; the expected energy resolution is comparableto or better than that of the DEAR CCDs. The SIDDHARTA detector will be ready totake data during the 2007 DAΦNE run. The planned experimental program includes (a)the collection of 500 pb−1 of hydrogen data for the measurement of ∆1s and Γ1s withelectron-volt precision, (b) 1000 pb−1 of deuterium data to allow separate determinationof the I = 0 and I = 1 KN scattering lengths, and (c) a shorter run with helium thatmay offer evidence in favor of deeply bound K− 3He states (136), if they exist.
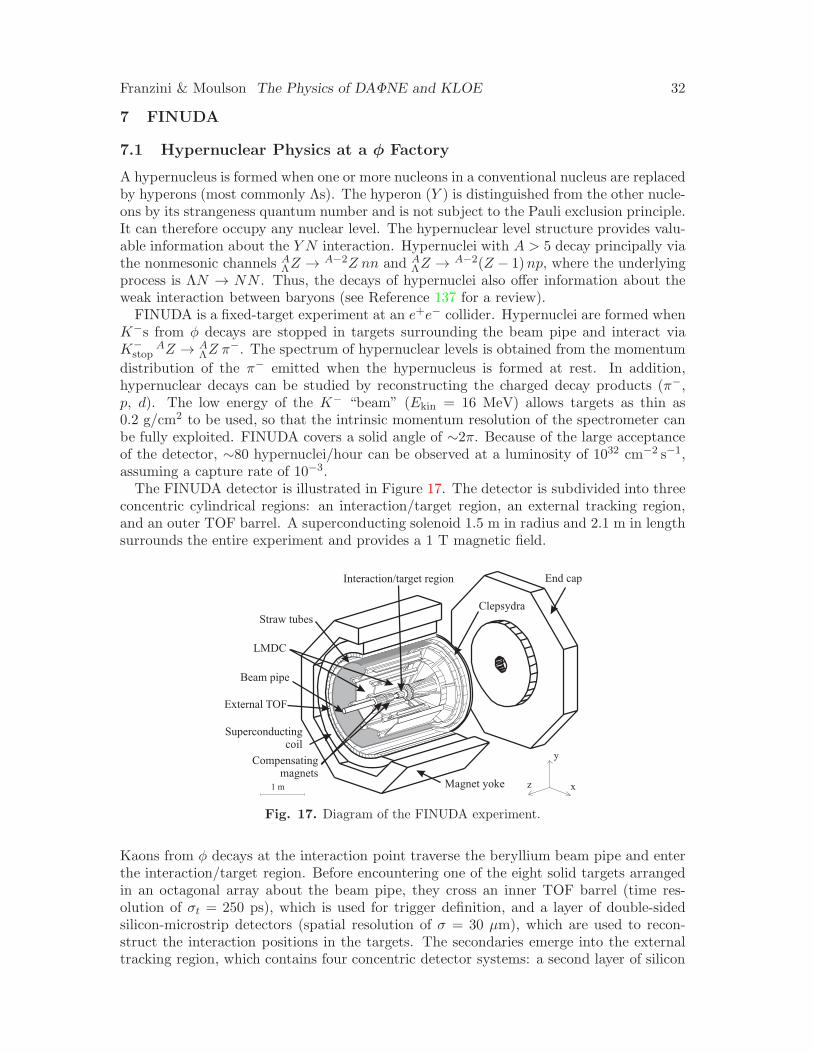
Franzini & Moulson The Physics of DAΦNE and KLOE 32
7 FINUDA
7.1 Hypernuclear Physics at a φ Factory
A hypernucleus is formed when one or more nucleons in a conventional nucleus are replacedby hyperons (most commonly Λs). The hyperon (Y ) is distinguished from the other nucle-ons by its strangeness quantum number and is not subject to the Pauli exclusion principle.It can therefore occupy any nuclear level. The hypernuclear level structure provides valu-able information about the Y N interaction. Hypernuclei with A > 5 decay principally viathe nonmesonic channels A
ΛZ → A−2Z nn and AΛZ → A−2(Z − 1)np, where the underlying
process is ΛN → NN . Thus, the decays of hypernuclei also offer information about theweak interaction between baryons (see Reference 137 for a review).
FINUDA is a fixed-target experiment at an e+e− collider. Hypernuclei are formed whenK−s from φ decays are stopped in targets surrounding the beam pipe and interact viaK−
stopAZ → A
ΛZ π−. The spectrum of hypernuclear levels is obtained from the momentum
distribution of the π− emitted when the hypernucleus is formed at rest. In addition,hypernuclear decays can be studied by reconstructing the charged decay products (π−,p, d). The low energy of the K− “beam” (Ekin = 16 MeV) allows targets as thin as0.2 g/cm2 to be used, so that the intrinsic momentum resolution of the spectrometer canbe fully exploited. FINUDA covers a solid angle of ∼2π. Because of the large acceptanceof the detector, ∼80 hypernuclei/hour can be observed at a luminosity of 1032 cm−2 s−1,assuming a capture rate of 10−3.
The FINUDA detector is illustrated in Figure 17. The detector is subdivided into threeconcentric cylindrical regions: an interaction/target region, an external tracking region,and an outer TOF barrel. A superconducting solenoid 1.5 m in radius and 2.1 m in lengthsurrounds the entire experiment and provides a 1 T magnetic field.
Clepsydra
Magnet yoke
Beam pipe
External TOF
Compensatingmagnets
LMDC
Straw tubes
Interaction/target region End cap
z
y
x1 m
Superconductingcoil
Fig. 17. Diagram of the FINUDA experiment.
Kaons from φ decays at the interaction point traverse the beryllium beam pipe and enterthe interaction/target region. Before encountering one of the eight solid targets arrangedin an octagonal array about the beam pipe, they cross an inner TOF barrel (time res-olution of σt = 250 ps), which is used for trigger definition, and a layer of double-sidedsilicon-microstrip detectors (spatial resolution of σ = 30 µm), which are used to recon-struct the interaction positions in the targets. The secondaries emerge into the externaltracking region, which contains four concentric detector systems: a second layer of silicon
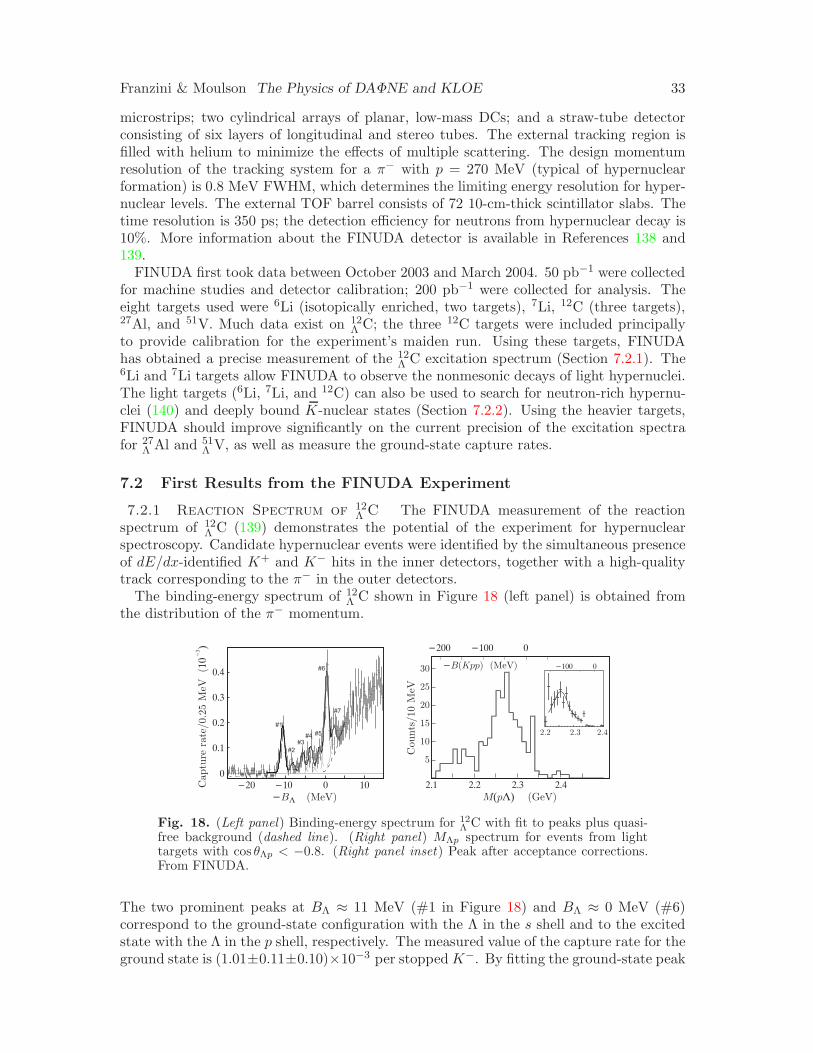
Franzini & Moulson The Physics of DAΦNE and KLOE 33
microstrips; two cylindrical arrays of planar, low-mass DCs; and a straw-tube detectorconsisting of six layers of longitudinal and stereo tubes. The external tracking region isfilled with helium to minimize the effects of multiple scattering. The design momentumresolution of the tracking system for a π− with p = 270 MeV (typical of hypernuclearformation) is 0.8 MeV FWHM, which determines the limiting energy resolution for hyper-nuclear levels. The external TOF barrel consists of 72 10-cm-thick scintillator slabs. Thetime resolution is 350 ps; the detection efficiency for neutrons from hypernuclear decay is10%. More information about the FINUDA detector is available in References 138 and139.
FINUDA first took data between October 2003 and March 2004. 50 pb−1 were collectedfor machine studies and detector calibration; 200 pb−1 were collected for analysis. Theeight targets used were 6Li (isotopically enriched, two targets), 7Li, 12C (three targets),27Al, and 51V. Much data exist on 12
Λ C; the three 12C targets were included principallyto provide calibration for the experiment’s maiden run. Using these targets, FINUDAhas obtained a precise measurement of the 12
Λ C excitation spectrum (Section 7.2.1). The6Li and 7Li targets allow FINUDA to observe the nonmesonic decays of light hypernuclei.The light targets (6Li, 7Li, and 12C) can also be used to search for neutron-rich hypernu-clei (140) and deeply bound K-nuclear states (Section 7.2.2). Using the heavier targets,FINUDA should improve significantly on the current precision of the excitation spectrafor 27
Λ Al and 51Λ V, as well as measure the ground-state capture rates.
7.2 First Results from the FINUDA Experiment
7.2.1 Reaction Spectrum of 12Λ C The FINUDA measurement of the reaction
spectrum of 12Λ C (139) demonstrates the potential of the experiment for hypernuclear
spectroscopy. Candidate hypernuclear events were identified by the simultaneous presenceof dE/dx-identified K+ and K− hits in the inner detectors, together with a high-qualitytrack corresponding to the π− in the outer detectors.
The binding-energy spectrum of 12Λ C shown in Figure 18 (left panel) is obtained from
the distribution of the π− momentum.
0
0.2
0.3
0.4 #6
#4
#3
#2
#1
#5
#7
Cap
ture
rat
e/0.
25 M
eV(1
0)
-3
Cou
nts
/10
MeV
30
25
20
15
10
5
-B Kpp( ) (MeV)
2.2 2.3 2.4
-100 0
2.1 2.2 2.3 2.4-20 -10 0 10-B (MeV)L
0.1
-200 -100 0
M p( L) (GeV)
Fig. 18. (Left panel) Binding-energy spectrum for 12Λ C with fit to peaks plus quasi-
free background (dashed line). (Right panel) MΛp spectrum for events from lighttargets with cos θΛp < −0.8. (Right panel inset) Peak after acceptance corrections.From FINUDA.
The two prominent peaks at BΛ ≈ 11 MeV (#1 in Figure 18) and BΛ ≈ 0 MeV (#6)correspond to the ground-state configuration with the Λ in the s shell and to the excitedstate with the Λ in the p shell, respectively. The measured value of the capture rate for theground state is (1.01±0.11±0.10)×10−3 per stoppedK−. By fitting the ground-state peak

Franzini & Moulson The Physics of DAΦNE and KLOE 34
with a Gaussian, the energy resolution was determined to be 1.29 MeV FWHM. Theseresults were obtained without the detector fully calibrated; the momentum resolution maybe improved in future analyses. FINUDA has also performed different fits to the entirespectrum. The fit shown in Figure 18 was to seven Gaussian peaks with free central valuesand weights; σ for all peaks was fixed to 0.55 MeV. The fit also included the quasi-freecomponent illustrated as the dashed line.
The 12Λ C reaction spectrum was previously measured by the E369 experiment at KEK
(141), in which hypernuclei were produced from a π+ beam by associated production(π+ AZ → A
ΛZ K+). The energy resolution was 1.45 MeV FWHM. FINUDA comparesthe positions and strengths of the peaks in Figure 18 (left panel) to those seen in theE369 data. The momentum transfer to the Λ in E369 is ∼350 MeV, as compared with∼250 MeV in FINUDA. As a result, the relative weights observed for the sΛ and pΛ peaksare expected to differ (142). Some differences are also noted in the structure around peaks#3, #4, and #5. Several excited states of the 11C core nucleus may contribute to thestructure in this energy region (143).
FINUDA uses the ground-state peak to normalize the capture rates for the other peaksand compares the resulting values to older data on 12
Λ C from stopped K− experimentsand to the results of various calculations. In general, the capture rates for the identifiedpeaks in the FINUDA spectrum are significantly larger than calculations predict, whereasthe FINUDA capture rates for the stronger peaks observed in older experiments are inreasonable agreement with the older results.
7.2.2 New States from Nuclear K− Absorption at Rest The E471 groupat KEK claims to have observed two S = −1 tribaryon states from K− capture at rest:K−
stop4He → XNr, where the recoil nucleon Nr is p or n (144). The states are seen as
peaks in the missing-mass distributions as reconstructed from the TOF-measured velocityof the recoil nucleon. A peak with a significance of 8.2σ in the distribution for eventswith a recoil proton is interpreted to be from the reaction K− (pnn) → S0 → ΣNN orΣ−d. The S0(3115) is an isospin triplet state with an excitation energy of ∼44 MeV anda width of < 22 MeV. For events with a recoil neutron, a 3.7σ peak is observed andattributed to K− (ppn) → S+ → Σ+nn or Σ−pp. The S+(3140) is an isospin singlet withan excitation energy of ∼69 MeV and a width of < 22 MeV. If interpreted as K−NNNbound states (see Section 6.2.2), the S0 and S+ have binding energies of 194 MeV and169 MeV. The nonrelativistic calculations of Reference 124 do not predict the existenceof the S0; they find a state similar to the S+, but of higher mass. Such calculations arequestionable. An alternative explanation of the data in which the peaks correspond tothe process K−NN → Y N (with the remaining two nucleons spectators) has also beenproposed (132).
While the E471 results are based only on TOF measurements, FINUDA can reconstructthe charged particles in the final state and compute invariant masses. FINUDA has studiedthe Λp invariant-mass distribution following K− capture in the light targets (6Li, 7Li, and12C) (145). For a normal two-nucleon absorption process, MΛp should peak sharply at∼30 MeV below mK−+2mp. Instead, the MΛp distribution for events with cos θΛp < −0.8
is broadly peaked, as shown in Figure 18 (right panel). A fit gives a mass of 2255+5−6
+4−3 MeV
and a width of 67+14−11
+2−3 MeV. FINUDA attributes this peak to the decay of a K−pp bound
state, in which case the binding energy is 115 MeV. The Λp excitation energy is 201 MeV,which is large and consistent with the large width. Especially in light nuclei, two-nucleonabsorption followed by rescattering effects could give rise to a peak like that observed (146).We are skeptical of the need to invoke deeply bound K-nuclear or multiquark states toexplain the peaks observed by E471 and FINUDA.

Franzini & Moulson The Physics of DAΦNE and KLOE 35
FINUDA will resume data taking during summer 2006 and expects to collect 1 fb−1.The planned target set includes light targets such as 6Li and 9Be, which are nearly αdand ααn clusters, and are ideal for use in the search for new states.
8 THE FUTURE OF DAΦNE
KLOE finished taking data at√s = mφ in December 2005 and collected a small amount
of off-peak data necessary to round out the data set in January–March 2006. During thelatter half of 2006, DAΦNE running will be dedicated to FINUDA; SIDDHARTA will runin 2007. Thus the original DAΦNE program will be completed, except for the search fordirect CP violation.
Discussion concerning what sort of facility may replace DAΦNE began formally at Al-ghero in September 2003 (147). Many options have been considered (148). One likelyalternative is a second-generation DAΦNE, with a luminosity increased by a factor of ∼5at
√s = mφ, possibly capable of running at energies up to the NN threshold. However,
a definite proposal will probably not emerge until late 2006.Meanwhile, the KLOE study of leptonic and semileptonic kaon decays has been ex-
tremely successful. Using ∼1/5 of the available data, KLOE has measured fK0
+ (0)|Vus| =0.2167± 0.0005, i.e., with an accuracy of ±0.23%, from which |Vus| = 0.2255± 0.0019 and|Vud|2 + |Vus|2 + |Vub|2 = 0.9991 ± 0.0010. The error is dominated by theoretical uncer-
tainties on fK0
+ (0) that will likely decrease in the near future. These results establish thatit is possible to reach accuracies below 0.1%.
The decay-rate measurements discussed provide access to a series of effective couplings,such as Ge, Gµ, Gq |Vud|, and Gq |Vus|. If there is new physics at the TeV scale, it will bereflected in the values of these effective couplings. Lepton universality is the statementthat Ge = Gµ · · · = Gℓ. Unitarity in the quark sector refers to the CKM matrix; inaddition, the full Standard Model requires Gℓ = Gq = GF. New physics may changethis simple picture at the level of 0.1%. In testing universality, if we limit ourselves toe, µ, u, d, and s, we have five parameters and need five measurements. Kaons providethree: Γ(Kℓ3), Γ(Kµ2), and Γ(Ke2). With the addition of the muon and pion lifetimes, wehave five. The half-lives for 0+ → 0+ nuclear β-transitions provide a welcome check. Weconsider these measurements central to the future of a φ factory.
Acknowledgements
We would like to thank our fellow KLOE collaborators for their heroic dedication andbrilliance in bringing about “questa bella e grande avventura.” We would also like towarmly congratulate the members of the DAΦNE staff and of the DEAR and FINUDACollaborations on their achievements. Finally, we thank Juliet Lee-Franzini for a criticalreading of this manuscript.
Literature Cited
1. Christenson JH, Cronin JW, Fitch VL, Turlay R. Phys. Rev. Lett. 13:138 (1964)2. Wolfenstein L. Phys. Rev. Lett. 13:562 (1964)3. Burkhardt H, et al. (NA31 Collab.) Phys. Lett. B 206:169 (1988); Patterson JR, et
al. Phys. Rev. Lett. 64:1491 (1990)4. Document number LNF-90/031(R). Lab. Naz. Frascati (1990).
http://www.lnf.infn.it/sis/preprint

Franzini & Moulson The Physics of DAΦNE and KLOE 36
5. Aloisio A, et al. (KLOE Collab.) Document number LNF-92/019(IR). Lab. Naz.Frascati (1992). http://www.lnf.infn.it/sis/preprint
6. Agnello M, et al. (FINUDA Collab.) Document number LNF-93/021(IR). Lab. Naz.Frascati (1993). http://www.lnf.infn.it/sis/preprint
7. Baldini R, et al. (DEAR Collab.) Document number LNF-95/055(IR). Lab. Naz.Frascati (1995). http://www.lnf.infn.it/sis/preprint
8. Bassetti M, et al. DAΦNE Intern. Tech. Note L-1. Lab. Naz. Frascati (1991).http://www.lnf.infn.it/acceleratori/dafne/technotes.html
9. Zobov M. (DAΦNE Collab.) Proc. Eur. Part. Accel. Conf., Vienna, 2000. Geneva:CERN (2000). http://accelconf.web.cern.ch
10. Adinolfi M, et al. Nucl. Instrum. Methods A 488:51 (2002)11. Adinolfi M, et al. Nucl. Instrum. Methods A 482:364 (2002)12. Adinolfi M, et al. Nucl. Instrum. Methods A 483:649 (2002)13. Adinolfi M, et al. Nucl. Instrum. Methods A 492:134 (2002)14. Aloisio A, et al. Nucl. Instrum. Methods A 516:288 (2004)15. Ambrosino F, et al. Nucl. Instrum. Methods A 534:403 (2004)16. Dunietz I, Hauser J, Rosner JL. Phys. Rev. D 35:2166 (1987)17. Pancheri G, ed. Proc. Workshop Phys. Detect. DAΦNE, Frascati, 1991. Frascati,
Italy: Lab. Naz. Frascati (1991)18. Franzini P. See Ref. 17, p. 733 (1991)19. Buchanan CD, et al. Phys. Rev. D 45:4088 (1992)20. Maiani L, Pancheri G, Paver N, eds. The Second DAΦNE Physics Handbook, Frascati,
Italy: Lab. Naz. Frascati (1995)21. D’Ambrosio G, Isidori G, Pugliese A. See Ref. 20, p. 63 (1995)22. Proc. Int. Europhys. Conf. High Energy Phys. (HEP2005), Lisbon, 2005, Trieste,
Italy: Sc. Int. Super. Stud. Avanzati (2006). http://pos.sissa.it23. Moulson M. (KLOE Collab.) See Ref. 22, PoS(HEP2005)264 (2006)24. Batley JR, et al. Phys. Lett. B 544:97 (2002)25. Alavi-Harati A, et al. (KTeV Collab.) Phys. Rev. D 67:012005 (2003)26. Kobayashi M, Maskawa T. Prog. Theor. Phys. 49:652 (1973)27. Cabibbo N. Phys. Rev. Lett. 10:531 (1963)28. Sher A, et al. Phys. Rev. Lett. 91:261802 (2003)29. Alexopoulos T, et al. (KTeV Collab.) Phys. Rev. Lett. 93:181802 (2004); Alexopoulos
T, et al. Phys. Rev. D 70:092006 (2004)30. Alexopoulos T, et al. (KTeV Collab.) Phys. Rev. D 70:092007 (2004)31. Yushchenko OP, et al. Phys. Lett. B 589:111 (2004)32. Yushchenko OP, et al. Phys. Lett. B 581:31 (2004)33. Lai A, et al. (NA48 Collab.) Phys. Lett. B 604:1 (2004)34. Chen H, Du D, Li W, Lu C, eds. Proc. Int. Conf. High Energy Phys. (ICHEP), 32nd,
Beijing, 2004, Singapore: World Sci. (2005)35. Litov L. (NA48 Collab.) See Ref. 34, p. 817 (2005)36. Lai A, et al. (NA48 Collab.) Phys. Lett. B 602:41 (2004)37. Gatti C. Eur. Phys. J. C 45:417 (2006)38. Ademollo M, Gatto R. Phys. Rev. Lett. 13:264 (1964)39. Sirlin A, Rev. Mod. Phys. 50:573 (1978); Nucl. Phys. B 196:83 (1982)40. Cirigliano V, et al. Eur. Phys. J. C 23:121 (2002); Cirigliano V, Neufeld H, Pichl H.
Eur. Phys. J. C 35:53 (2004)41. Davies CTH, et al. Phys. Rev. Lett. 92:022001 (2004)42. Marciano WJ, Phys. Rev. Lett. 93:231803 (2004)43. Finkemeier M. Phys. Lett. B 387:391 (1996); Finkemeier M. See Ref. 20, p. 389

Franzini & Moulson The Physics of DAΦNE and KLOE 37
(1995); Decker R, Finkemeier M. Phys. Lett. B 334:199 (1994)44. Proc. Int. Symp. Lattice Field Theory, 23rd, Dublin, 2005, Trieste, Italy: Sc. Int.
Super. Stud. Avanzati (2005). http://pos.sissa.it45. Bernard C, et al. See Ref. 44, PoS(LAT2005)025 (2005)46. Ambrosino F, et al. (KLOE Collab.) Phys. Lett. B 608:199 (2005);47. Antonelli M, Dreucci M. KLOE Note 181. Lab. Naz. Frascati (2002).
http//www.lnf.infn.it/kloe/kn181.ps
48. Akhmetshin RR, et al. Phys. Lett. B 466:385 (1999); Erratum. Phys. Lett. B 508:217(2001)
49. Ambrosino F, et al. (KLOE Collab.) Phys. Lett. B 626:15 (2005)50. Vosburgh KG, et al., Phys. Rev. D 6:1834 (1972)51. Ambrosino F, et al. (KLOE Collab.) Phys. Lett. B 632:43 (2006)52. Eidelman S, et al. (Part. Data Group) Phys. Lett. B 592:1 and web updates,
http://pdg.lbl.gov (2004)53. Bijnens J, Borg F. Eur. Phys. J. C 40:383 (2005)54. Ambrosino F, et al. (KLOE Collab.) Phys. Lett. B 636:166 (2006)55. Spadaro T. (KLOE Collab.) Proc. Int. Conf. Calorim. Part. Phys., 11th, Perugia,
2004, p. 337. Singapore: World Sci. (2005)56. Cirigliano V, Ecker G, Neufeld H, Pich A. Eur. Phys. J. C 33:369 (2004)57. Aloisio A, et al. (KLOE Collab.) Phys. Lett. B 538:21 (2002)58. Ambrosino F, et al. (KLOE Collab.) Eur. Phys. J. C hep-ex/0601025. In press59. Alavi-Harati A, et al. (KTeV Collab.) Phys. Rev. Lett. 88:181601 (2002)60. Angelopoulos A, et al. (CPLEAR Collab.) Phys. Lett. B 444:52 (1998)61. Apostolakis A, et al. (CPLEAR Collab.) Phys. Lett. B 456:297 (1999)62. Angelopoulos A, et al. (CPLEAR Collab.) Phys. Lett. B 444:38 (1998)63. Aloisio A, et al. (KLOE Collab.) Phys. Lett. B 535:37 (2002)64. Ambrosino F, et al. (KLOE Collab.) Phys. Lett. B 636:173 (2006)65. Ambrosino F, et al. (KLOE Collab.) Phys. Lett. B 619:61 (2005)66. Lai A, et al. (NA48 Collab.) Phys. Lett. B 610:165 (2005)67. Chiang IH, et al. Phys. Rev. D 6:1254 (1972)68. Ott RJ, Pritchard TW. Phys. Rev. D 3:52 (1971)69. Ambrosino F, et al. (KLOE Collab.) Phys. Lett. B 632:76 (2006)70. Sciascia B. (KLOE Collab.) See Ref. 22, PoS(HEP2005)287 (2006)71. Leutwyler H, Roos M. Z. Phys. C 25:91 (1984)72. Becirevic D, et al. Nucl. Phys. B 705:339 (2005); Dawson C, et al. (RBC Collab.)
See Ref. 44, PoS(LAT2005)337 (2005)73. Marciano WJ, Sirlin A. Phys. Rev. Lett. 96:032002 (2006)74. Lai A, et al. Phys. Lett. B 533:196 (2002)75. Abdel-Bary M, et al. (GEM Collab.) Phys. Lett. B 619:281 (2005)76. Bijnens J, Galt G, Nefkens BMK, eds. Eta Phys. Handb.: Proc. Workshop Eta Phys.,
Uppsala, 2001. Phys. Scripta T99 (2002)77. Holstein BR. See Ref. 76, p. 55 (2002)78. Bijnens J, Gasser J. See Ref. 76, p. 34 (2002)79. Tippens WB, et al. (Cryst. Ball Collab.) Phys. Rev. Lett. 87:192001 (2001)80. Ametller Ll, Bijnens J, Bramon A, Cornet F. Phys. Lett. B 276:185 (1992)81. Alde D, et al. Z. Phys. C 25:225 (1984)82. Prakhov S, et al. (Cryst. Ball Collab.) Phys. Rev. C 72:025201 (2005)83. Bijnens J, Fayyazuddin A, Prades J. Phys. Lett. B 379:209 (1996)84. Bel’kov AA, Lanyov AV, Scherer S. J. Phys. G 22:1383 (1996)85. Aloisio A, et al. (KLOE Collab.) Phys. Lett. B 591:49 (2004)

Franzini & Moulson The Physics of DAΦNE and KLOE 38
86. Ambrosino F, et al. (KLOE Collab.) Phys. Lett. B 606:276 (2005)87. Rosner JL. Phys. Rev. D 27:1101 (1983)88. Feldmann Th. Int. J. Mod. Phys. A 15:159 (2000)89. Aloisio A, et al. (KLOE Collab.) Phys. Lett. B 541:45 (2002)90. Bramon A, Escribano R, Scadron MD. Eur. Phys. J. C 7:271 (1999)91. Jaffe, RL. Phys. Rev. D 15:267 (1977); Alford M, Jaffe RL. Nucl. Phys. B 578:367
(2000)92. Weinstein J, Isgur N. Phys. Rev. Lett. 48:659 (1982)93. Tornqvist, NA. Z. Phys. C 68:647 (1995)94. Boglione M, Pennington MR. Phys. Rev. D 65:114010 (2002)95. Achasov NN, Ivanchenko VN. Nucl. Phys. B 315:465 (1989)96. Achasov NN, Gubin VV. Phys. Rev. D 56:4084 (1997)97. Kalashnikova YuS, et al. Eur. Phys. J. A 24:437 (2005)98. Aloisio A, et al. (KLOE Collab.) Phys. Lett. B 537:21 (2002)99. Aloisio A, et al. (KLOE Collab.) Phys. Lett. B 536:209 (2002)100. Akhmetshin RR, et al. Phys. Lett. B 462:380 (1999)101. Achasov MN, et al. Phys. Lett. B 485:349 (2000)102. Achasov MN, et al. Phys. Lett. B 479:53 (2000)103. Close FE, Tornqvist NA. J. Phys. G 28:R249 (2002)104. Achasov NN, Kiselev AV. Phys. Rev. D 68:014006 (2003)105. Oller JA. Nucl. Phys. A 714:161 (2003)106. Achasov NN, Kiselev AV. Phys. Rev. D 73:054029 (2006)107. Boglione M, Pennington MR. Eur. Phys. J. C 30:503 (2003)108. Isidori G, Maiani L, Nicolaci M, Pacetti S. JHEP 0605:049 (2006)109. Flatte SM. Phys. Lett. B 63:224 (1976)110. Ambrosino F, et al. (KLOE Collab.) Phys. Lett. B 634:148 (2006)111. Achasov NN, Gubin VV. Phys. Rev. D 57:1987 (1998)112. Bennett GW, et al. (Muon g − 2 Collab.) Phys. Rev. Lett. 92:161802 (2004)113. Akhmetshin RR, et al. Phys. Lett. B 578:285 (2004)114. Davier M, Marciano WJ. Annu. Rev. Nucl. Part. Sci. 54:115 (2004)115. Davier M, Eidelman S, Hocker A, Zhang Z. Eur. Phys. J. C 31:503 (2003)116. Czyz H, Grzelinska A, Kuhn JH, Rodrigo G. Eur. Phys. J. C 33:333 (2004)117. Binner S, Kuhn JH, Melnikov K. Phys. Lett. B 459:279 (1999)118. Aloisio A, et al. (KLOE Collab.) Phys. Lett. B 606:12 (2005)119. Hocker A. See Ref. 34, p. 710 (2005)120. Achasov MN, et al. J. Exp. Theor. Phys. 101:1053 (2005)121. Davier M, Hocker A, Zhang Z. Rev. Mod. Phys. hep-ex/0507078. In press122. Sibidanov AL. (CMD-2 Collab.) Proc. Int. Conf. Hadron Spectrosc. (HADRON),
11th, Rio de Janeiro, 2005, p. 478. Melville, NY: Am. Inst. Phys. (2006)123. Gasser J, Sainio ME. Proc. Int. Workshop Phys. Detect. DAΦNE, 3rd, Frascati, 1999,
p. 659. Frascati, Italy: Lab. Naz. Frascati (1999)124. Akaishi Y, Yamazaki T. Phys. Rev. C 65:044005 (2002)125. Deser S, Goldberger ML, Baumann K, Thirring W. Phys. Rev. 96:774 (1954)126. Iwasaki M, et al. Phys. Rev. Lett. 78:3067 (1997)127. Ishiwatari T, et al. Phys. Lett. B 593:48 (2004)128. Beer G, et al. (DEAR Collab.) Phys. Rev. Lett. 94:212302 (2005)129. Friedman E, Gal A, Batty CJ. Nucl. Phys. A 579:518 (1994)130. Koch V. Phys. Lett. B 337:7 (1994)131. Waas T, Kaiser N, Weise W. Phys. Lett. B 365:12 (1996); Ramos A, Oset E. Nucl.
Phys. A 671:481 (2000)

Franzini & Moulson The Physics of DAΦNE and KLOE 39
132. Oset E, Toki H. nucl-th/0509048133. Borasoy B, Nißler R, Weise W. Eur. Phys. J. A 25:79 (2005)134. Hirtl A, Marton J, Widmann E, Zmeskal J, eds. Proc. Int. Conf. Exot. At. Relat.
Top. (EXA05), Vienna, 2005, Vienna: Austrian Acad. Sci. (2005)135. Zmeskal J. (DEAR and SIDDHARTA Collab.) See Ref. 134, p. 139 (2005)136. Akaishi Y. See Ref. 134, p. 45 (2005)137. Alberico WM, Garbarino G. Phys. Rep. 369:1 (2002)138. Agnello M, et al. (FINUDA Collab.) Document number LNF-95/024(IR). Lab. Naz.
Frascati (1995). http://www.lnf.infn.it/sis/preprint139. Agnello M, et al. (FINUDA Collab.) Phys. Lett. B 622:35 (2005)140. Agnello M, et al. (FINUDA Collab.) . Proc. Int. Conf. DAΦNE 2004: Phys. Meson
Factories, Frascati, 2004, p. 201. Frascati, Italy: Lab. Naz. Frascati (2004)141. Hotchi H, et al. Phys. Rev. C 64:044302 (2001)142. Itonaga K, Motoba T, Bando H. Prog. Theor. Phys. 84:291 (1990)143. Motoba T. Proc. Int. Conf. Hypernucl. Strange Part. Phys., 6th (HYP97), Upton,
New York, 1997. Nucl. Phys. A 639:135c (1998)144. Suzuki T, et al. Proc. Int. Conf. Hypernucl. Strange Part. Phys., 8th (HYP2003),
Newport News, Virginia, 2003. Nucl. Phys. A 754:375c (2005)145. Agnello M, et al. (FINUDA Collab.) Phys. Rev. Lett. 94:212303 (2005)146. Magas VK, Oset E, Ramos A, Toki H. nucl-th/0601013 (2006)147. Biscari C, Bossi F, Isidori G, eds. Proc. Workshop e+e− 1–2 GeV
Range: Phys. Accel. Prospects, Alghero, 2003. eConf C0309101 (2003).http://www.lnf.infn.it/conference/d2
148. Benfatto M, et al., eds. Document number LNF-05/033(IR). Lab. Naz. Frascati(2005). http://www.lnf.infn.it/sis/preprint